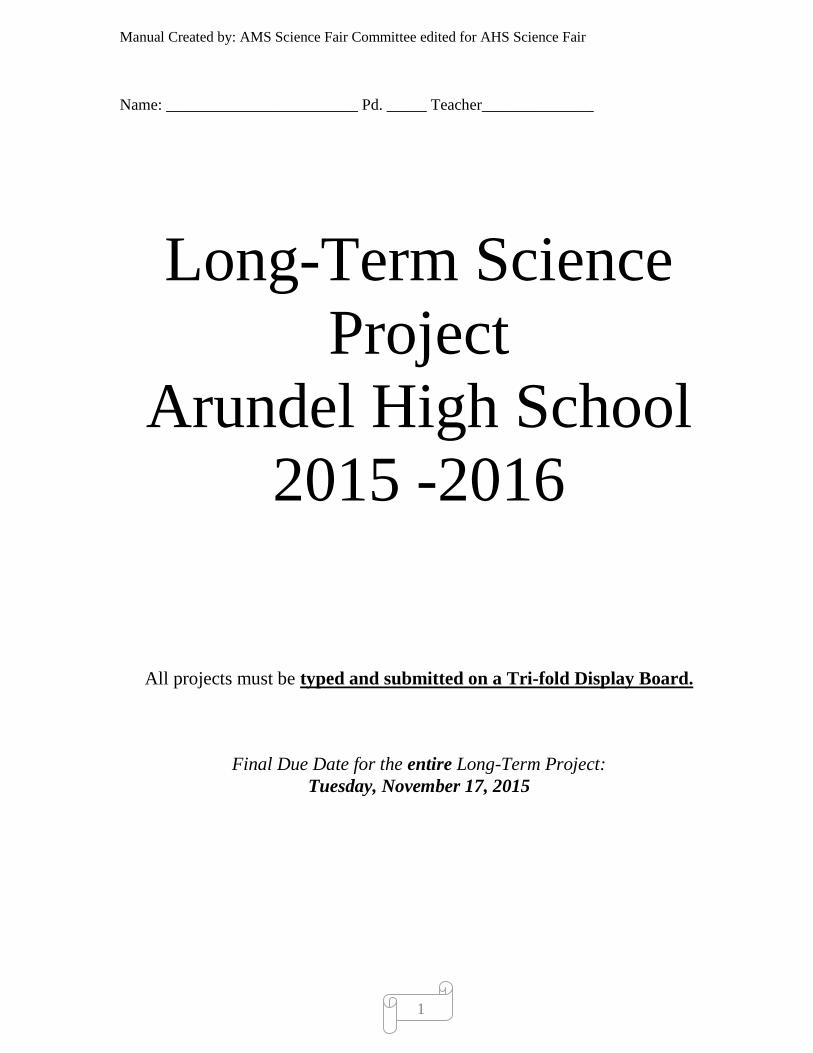
Manual Created by: AMS Science Fair Committee edited for AHS Science Fair 1 Name: ________________________ Pd. _____ Teacher______________ Long-Term Science Project Arundel High School 2015 -2016 All projects must be typed and submitted on a Tri-fold Display Board. Final Due Date for the entire Long-Term Project: Tuesday, November 17, 2015

Welcome message from author
This document is posted to help you gain knowledge. Please leave a comment to let me know what you think about it! Share it to your friends and learn new things together.
Transcript
Manual Created by: AMS Science Fair Committee edited for AHS Science Fair
1
Name: ________________________ Pd. _____ Teacher______________
Long-Term Science
Project
Arundel High School
2015 -2016
All projects must be typed and submitted on a Tri-fold Display Board.
Final Due Date for the entire Long-Term Project:
Tuesday, November 17, 2015
Manual Created by: AMS Science Fair Committee edited for AHS Science Fair
2
September 9, 2015
Dear Parents and Guardians,
Your child is embarking on a path to become a critical thinker in the fields of STEM
(Science, Technology, Engineering and Mathematics) by completing a long-term science
project; an exciting event that encourages students to think like aspiring scientists. During
the next few weeks, your child will be designing a science project that uses experimental
design to solve a problem to a question that intrigues his/her mind. We hope you agree that
the educational benefits are numerous, as students develop skills in writing, oral presentation,
creative thinking, and problem solving.
Instructions and guidelines for the components of the science fair project are included in the
Science Fair Handbook. Please be aware that students will complete most of the work at
home with their mentor. For suggestions on helping your child through this process — from
choosing a topic to the final report — see the Website "Surviving Science Fair" at :
http://discoveryschool.com/sciencefaircentral/elmers/ or www.sciencebuddies.com. Arundel
High School is committed to high quality science fair projects.
As a culminating portion of the project, students will be asked to present their project on a
tri-fold backboard. After completing this assignment, every student will have completed the
requirements to enter into the school Science Fair, if they choose to do so. The school
Science Fair will occur during the week of December 14th .
We ask that you encourage your child and monitor his/her progress along the way. Your
support is key to a successful project, but please do not allow your involvement to extend any
further in order to assure equity and promote student learning! It is important that your child
wrestle with problems and try to solve them. Guide your child where you can, but let the
final project reflect your child's individual effort and design.
The project is required by all students at Arundel Middle. The due date for the project is
Tuesday, November 20, 2015. This is a firm deadline for all students. Any student that
submits a project beyond this due date will incur a grade-level drop for each school day that
it is late. Because of the length of the project and the individual due dates for each
section, extended time will not be provided to students who are absent the dates
preceding or on the due date. The long-term science project is worth 10% of the
students’ 2nd quarter grade. If you have any questions, do not hesitate to contact your
science teacher or Ms. Gulden, the Science Department Chair. We look forward to watching
your child enjoy this unique opportunity for scientific discovery!
Sincerely,
Arundel High Science Department
Manual Created by: AMS Science Fair Committee edited for AHS Science Fair
3
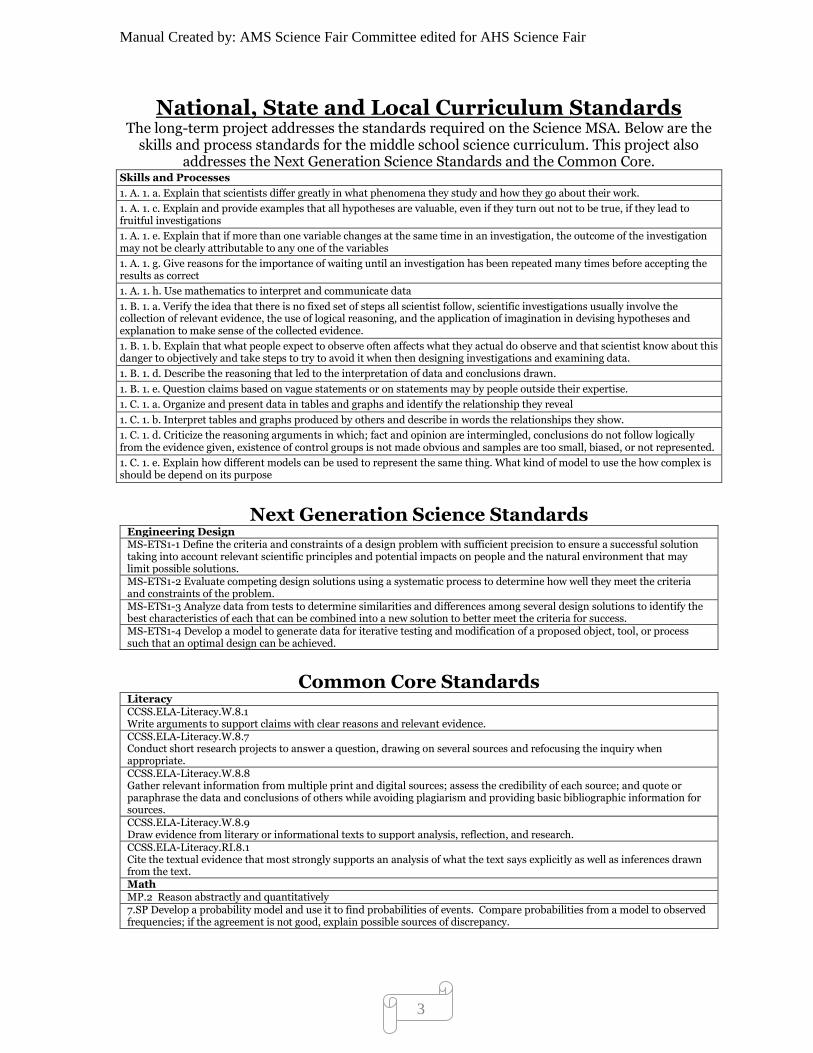
National, State and Local Curriculum Standards The long-term project addresses the standards required on the Science MSA. Below are the
skills and process standards for the middle school science curriculum. This project also addresses the Next Generation Science Standards and the Common Core.
Skills and Processes
1. A. 1. a. Explain that scientists differ greatly in what phenomena they study and how they go about their work.
1. A. 1. c. Explain and provide examples that all hypotheses are valuable, even if they turn out not to be true, if they lead to fruitful investigations
1. A. 1. e. Explain that if more than one variable changes at the same time in an investigation, the outcome of the investigation may not be clearly attributable to any one of the variables
1. A. 1. g. Give reasons for the importance of waiting until an investigation has been repeated many times before accepting the results as correct
1. A. 1. h. Use mathematics to interpret and communicate data
1. B. 1. a. Verify the idea that there is no fixed set of steps all scientist follow, scientific investigations usually involve the collection of relevant evidence, the use of logical reasoning, and the application of imagination in devising hypotheses and explanation to make sense of the collected evidence.
1. B. 1. b. Explain that what people expect to observe often affects what they actual do observe and that scientist know about this danger to objectively and take steps to try to avoid it when then designing investigations and examining data.
1. B. 1. d. Describe the reasoning that led to the interpretation of data and conclusions drawn.
1. B. 1. e. Question claims based on vague statements or on statements may by people outside their expertise.
1. C. 1. a. Organize and present data in tables and graphs and identify the relationship they reveal
1. C. 1. b. Interpret tables and graphs produced by others and describe in words the relationships they show.
1. C. 1. d. Criticize the reasoning arguments in which; fact and opinion are intermingled, conclusions do not follow logically from the evidence given, existence of control groups is not made obvious and samples are too small, biased, or not represented.
1. C. 1. e. Explain how different models can be used to represent the same thing. What kind of model to use the how complex is should be depend on its purpose
Next Generation Science Standards
Engineering Design MS-ETS1-1 Define the criteria and constraints of a design problem with sufficient precision to ensure a successful solution taking into account relevant scientific principles and potential impacts on people and the natural environment that may limit possible solutions. MS-ETS1-2 Evaluate competing design solutions using a systematic process to determine how well they meet the criteria and constraints of the problem. MS-ETS1-3 Analyze data from tests to determine similarities and differences among several design solutions to identify the best characteristics of each that can be combined into a new solution to better meet the criteria for success. MS-ETS1-4 Develop a model to generate data for iterative testing and modification of a proposed object, tool, or process such that an optimal design can be achieved.
Common Core Standards
Literacy CCSS.ELA-Literacy.W.8.1 Write arguments to support claims with clear reasons and relevant evidence. CCSS.ELA-Literacy.W.8.7 Conduct short research projects to answer a question, drawing on several sources and refocusing the inquiry when appropriate. CCSS.ELA-Literacy.W.8.8 Gather relevant information from multiple print and digital sources; assess the credibility of each source; and quote or paraphrase the data and conclusions of others while avoiding plagiarism and providing basic bibliographic information for sources. CCSS.ELA-Literacy.W.8.9 Draw evidence from literary or informational texts to support analysis, reflection, and research. CCSS.ELA-Literacy.RI.8.1 Cite the textual evidence that most strongly supports an analysis of what the text says explicitly as well as inferences drawn from the text. Math MP.2 Reason abstractly and quantitatively 7.SP Develop a probability model and use it to find probabilities of events. Compare probabilities from a model to observed frequencies; if the agreement is not good, explain possible sources of discrepancy.
Manual Created by: AMS Science Fair Committee edited for AHS Science Fair
4
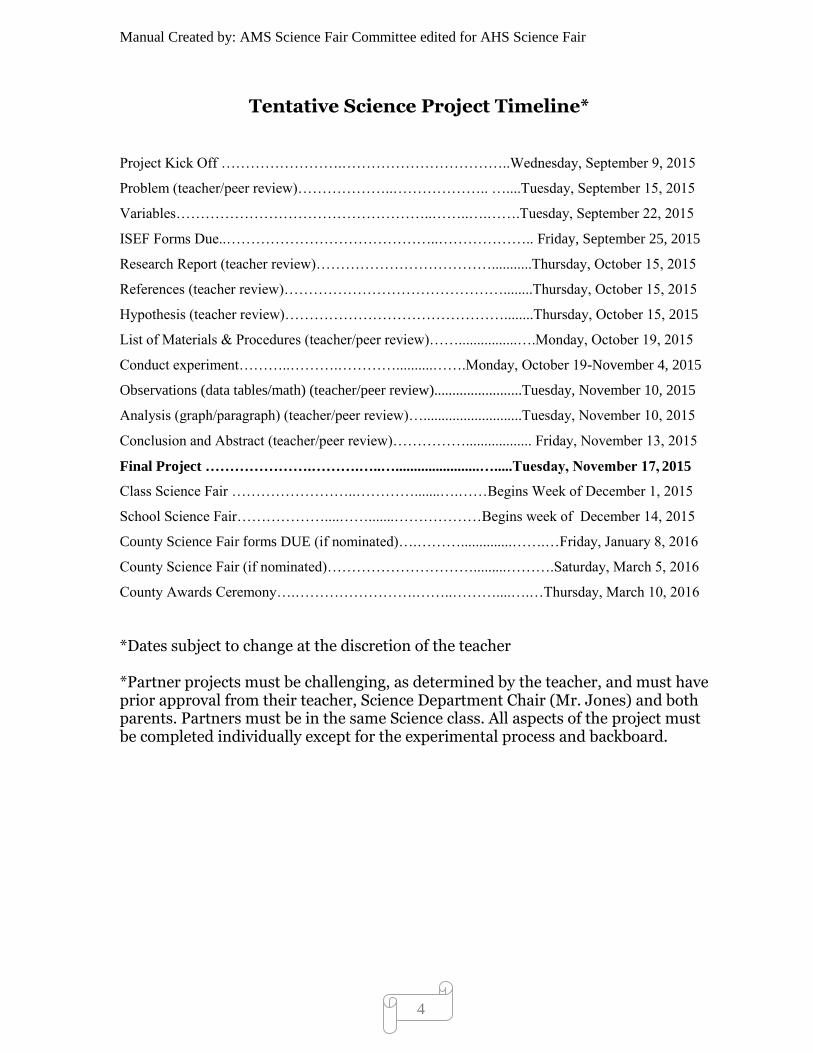
Tentative Science Project Timeline*
Project Kick Off …………………….……………………………..Wednesday, September 9, 2015
Problem (teacher/peer review)………………..……………….. …....Tuesday, September 15, 2015
Variables……………………………………………..……..….…….Tuesday, September 22, 2015
ISEF Forms Due..……………………………………..……………….. Friday, September 25, 2015
Research Report (teacher review)………………………………...........Thursday, October 15, 2015
References (teacher review)………………………………………........Thursday, October 15, 2015
Hypothesis (teacher review)………………………………………........Thursday, October 15, 2015
List of Materials & Procedures (teacher/peer review)……................….Monday, October 19, 2015
Conduct experiment………..……….…………..........…….Monday, October 19-November 4, 2015
Observations (data tables/math) (teacher/peer review)........................Tuesday, November 10, 2015
Analysis (graph/paragraph) (teacher/peer review)…...........................Tuesday, November 10, 2015
Conclusion and Abstract (teacher/peer review)…………….................. Friday, November 13, 2015
Final Project ………………….……….…..….......................….....Tuesday, November 17, 2015
Class Science Fair ……………………..………….......….……Begins Week of December 1, 2015
School Science Fair………………....…….......………………Begins week of December 14, 2015
County Science Fair forms DUE (if nominated)….………..............…….…Friday, January 8, 2016
County Science Fair (if nominated)………………………….........……….Saturday, March 5, 2016
County Awards Ceremony….…………………….……..………....….…Thursday, March 10, 2016 *Dates subject to change at the discretion of the teacher *Partner projects must be challenging, as determined by the teacher, and must have prior approval from their teacher, Science Department Chair (Mr. Jones) and both parents. Partners must be in the same Science class. All aspects of the project must be completed individually except for the experimental process and backboard.
Manual Created by: AMS Science Fair Committee edited for AHS Science Fair
5
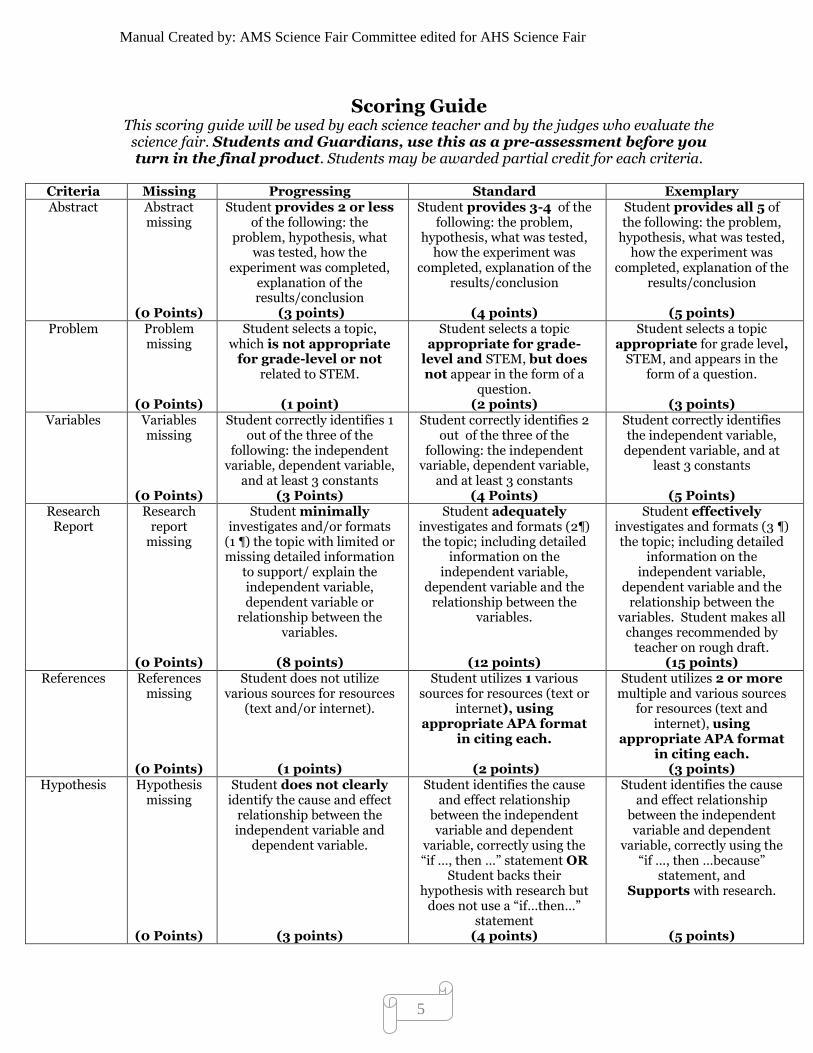
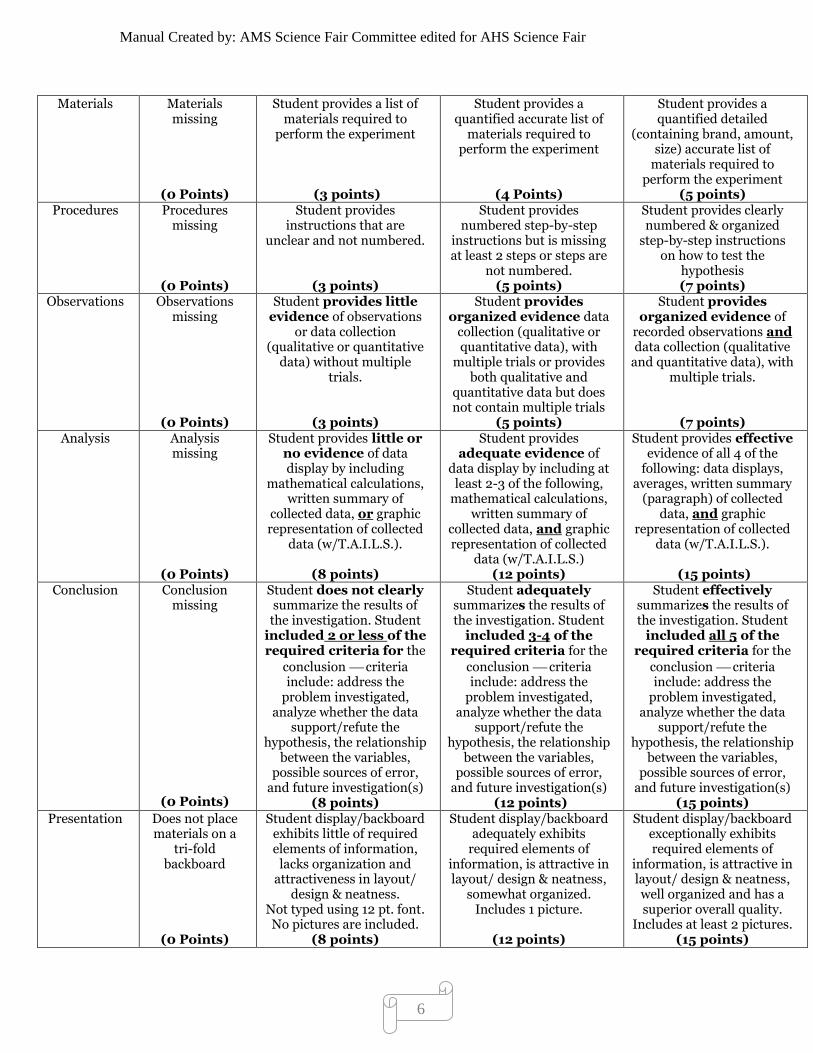
Scoring Guide This scoring guide will be used by each science teacher and by the judges who evaluate the
science fair. Students and Guardians, use this as a pre-assessment before you turn in the final product. Students may be awarded partial credit for each criteria.
Criteria Missing Progressing Standard Exemplary Abstract Abstract
missing
(0 Points)
Student provides 2 or less of the following: the
problem, hypothesis, what was tested, how the
experiment was completed, explanation of the results/conclusion
(3 points)
Student provides 3-4 of the following: the problem,
hypothesis, what was tested, how the experiment was
completed, explanation of the results/conclusion
(4 points)
Student provides all 5 of the following: the problem,
hypothesis, what was tested, how the experiment was
completed, explanation of the results/conclusion
(5 points)
Problem Problem missing
(0 Points)
Student selects a topic, which is not appropriate
for grade-level or not related to STEM.
(1 point)
Student selects a topic appropriate for grade-
level and STEM, but does not appear in the form of a
question. (2 points)
Student selects a topic appropriate for grade level,
STEM, and appears in the form of a question.
(3 points)
Variables Variables missing
(0 Points)
Student correctly identifies 1 out of the three of the
following: the independent variable, dependent variable,
and at least 3 constants (3 Points)
Student correctly identifies 2 out of the three of the
following: the independent variable, dependent variable,
and at least 3 constants (4 Points)
Student correctly identifies the independent variable, dependent variable, and at
least 3 constants
(5 Points) Research
Report Research
report missing
(0 Points)
Student minimally investigates and/or formats
(1 ¶) the topic with limited or missing detailed information
to support/ explain the independent variable, dependent variable or
relationship between the variables.
(8 points)
Student adequately investigates and formats (2¶) the topic; including detailed
information on the independent variable,
dependent variable and the relationship between the
variables.
(12 points)
Student effectively investigates and formats (3 ¶) the topic; including detailed
information on the independent variable,
dependent variable and the relationship between the
variables. Student makes all changes recommended by
teacher on rough draft. (15 points)
References References missing
(0 Points)
Student does not utilize various sources for resources
(text and/or internet).
(1 points)
Student utilizes 1 various sources for resources (text or
internet), using appropriate APA format
in citing each.
(2 points)
Student utilizes 2 or more multiple and various sources
for resources (text and internet), using
appropriate APA format in citing each.
(3 points) Hypothesis Hypothesis
missing
(0 Points)
Student does not clearly identify the cause and effect
relationship between the independent variable and
dependent variable.
(3 points)
Student identifies the cause and effect relationship
between the independent variable and dependent
variable, correctly using the “if …, then …” statement OR
Student backs their hypothesis with research but
does not use a “if…then…” statement
(4 points)
Student identifies the cause and effect relationship
between the independent variable and dependent
variable, correctly using the “if …, then …because”
statement, and Supports with research.
(5 points)
Manual Created by: AMS Science Fair Committee edited for AHS Science Fair
6
Materials Materials missing
(0 Points)
Student provides a list of materials required to
perform the experiment
(3 points)
Student provides a quantified accurate list of
materials required to perform the experiment
(4 Points)
Student provides a quantified detailed
(containing brand, amount, size) accurate list of
materials required to perform the experiment
(5 points) Procedures Procedures
missing
(0 Points)
Student provides instructions that are
unclear and not numbered.
(3 points)
Student provides numbered step-by-step
instructions but is missing at least 2 steps or steps are
not numbered. (5 points)
Student provides clearly numbered & organized
step-by-step instructions on how to test the
hypothesis (7 points)
Observations Observations missing
(0 Points)
Student provides little evidence of observations
or data collection (qualitative or quantitative
data) without multiple trials.
(3 points)
Student provides organized evidence data
collection (qualitative or quantitative data), with
multiple trials or provides both qualitative and
quantitative data but does not contain multiple trials
(5 points)
Student provides organized evidence of
recorded observations and data collection (qualitative
and quantitative data), with multiple trials.
(7 points) Analysis Analysis
missing
(0 Points)
Student provides little or no evidence of data display by including
mathematical calculations, written summary of
collected data, or graphic representation of collected
data (w/T.A.I.L.S.).
(8 points)
Student provides adequate evidence of
data display by including at least 2-3 of the following,
mathematical calculations, written summary of
collected data, and graphic representation of collected
data (w/T.A.I.L.S.) (12 points)
Student provides effective evidence of all 4 of the
following: data displays, averages, written summary
(paragraph) of collected data, and graphic
representation of collected data (w/T.A.I.L.S.).
(15 points)
Conclusion Conclusion missing
(0 Points)
Student does not clearly summarize the results of the investigation. Student
included 2 or less of the required criteria for the
conclusion criteria include: address the
problem investigated, analyze whether the data
support/refute the hypothesis, the relationship
between the variables, possible sources of error,
and future investigation(s) (8 points)
Student adequately summarizes the results of the investigation. Student
included 3-4 of the required criteria for the
conclusion criteria include: address the
problem investigated, analyze whether the data
support/refute the hypothesis, the relationship
between the variables, possible sources of error,
and future investigation(s) (12 points)
Student effectively summarizes the results of the investigation. Student
included all 5 of the required criteria for the
conclusion criteria include: address the
problem investigated, analyze whether the data
support/refute the hypothesis, the relationship
between the variables, possible sources of error,
and future investigation(s) (15 points)
Presentation Does not place materials on a
tri-fold backboard
(0 Points)
Student display/backboard exhibits little of required elements of information,
lacks organization and attractiveness in layout/
design & neatness. Not typed using 12 pt. font. No pictures are included.
(8 points)
Student display/backboard adequately exhibits
required elements of information, is attractive in layout/ design & neatness,
somewhat organized. Includes 1 picture.
(12 points)
Student display/backboard exceptionally exhibits required elements of
information, is attractive in layout/ design & neatness, well organized and has a superior overall quality.
Includes at least 2 pictures. (15 points)
Manual Created by: AMS Science Fair Committee edited for AHS Science Fair
7
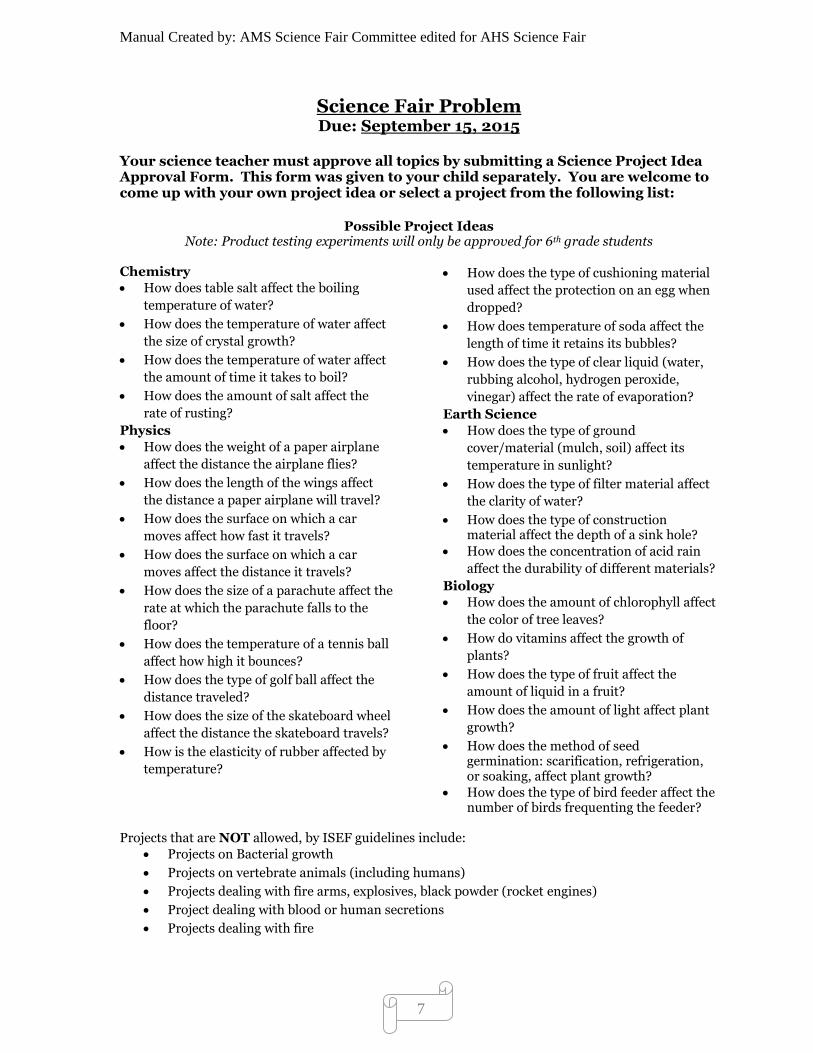
Science Fair Problem Due: September 15, 2015
Your science teacher must approve all topics by submitting a Science Project Idea Approval Form. This form was given to your child separately. You are welcome to come up with your own project idea or select a project from the following list:
Possible Project Ideas
Note: Product testing experiments will only be approved for 6th grade students
Chemistry
How does table salt affect the boiling
temperature of water?
How does the temperature of water affect
the size of crystal growth?
How does the temperature of water affect
the amount of time it takes to boil?
How does the amount of salt affect the
rate of rusting?
Physics
How does the weight of a paper airplane
affect the distance the airplane flies?
How does the length of the wings affect
the distance a paper airplane will travel?
How does the surface on which a car
moves affect how fast it travels?
How does the surface on which a car
moves affect the distance it travels?
How does the size of a parachute affect the
rate at which the parachute falls to the
floor?
How does the temperature of a tennis ball
affect how high it bounces?
How does the type of golf ball affect the
distance traveled?
How does the size of the skateboard wheel
affect the distance the skateboard travels?
How is the elasticity of rubber affected by
temperature?
How does the type of cushioning material
used affect the protection on an egg when
dropped?
How does temperature of soda affect the
length of time it retains its bubbles?
How does the type of clear liquid (water,
rubbing alcohol, hydrogen peroxide,
vinegar) affect the rate of evaporation?
Earth Science
How does the type of ground
cover/material (mulch, soil) affect its
temperature in sunlight?
How does the type of filter material affect
the clarity of water?
How does the type of construction material affect the depth of a sink hole?
How does the concentration of acid rain
affect the durability of different materials?
Biology
How does the amount of chlorophyll affect
the color of tree leaves?
How do vitamins affect the growth of
plants?
How does the type of fruit affect the
amount of liquid in a fruit?
How does the amount of light affect plant
growth?
How does the method of seed germination: scarification, refrigeration, or soaking, affect plant growth?
How does the type of bird feeder affect the number of birds frequenting the feeder?
Projects that are NOT allowed, by ISEF guidelines include:
Projects on Bacterial growth
Projects on vertebrate animals (including humans)
Projects dealing with fire arms, explosives, black powder (rocket engines)
Project dealing with blood or human secretions
Projects dealing with fire
Manual Created by: AMS Science Fair Committee edited for AHS Science Fair
8
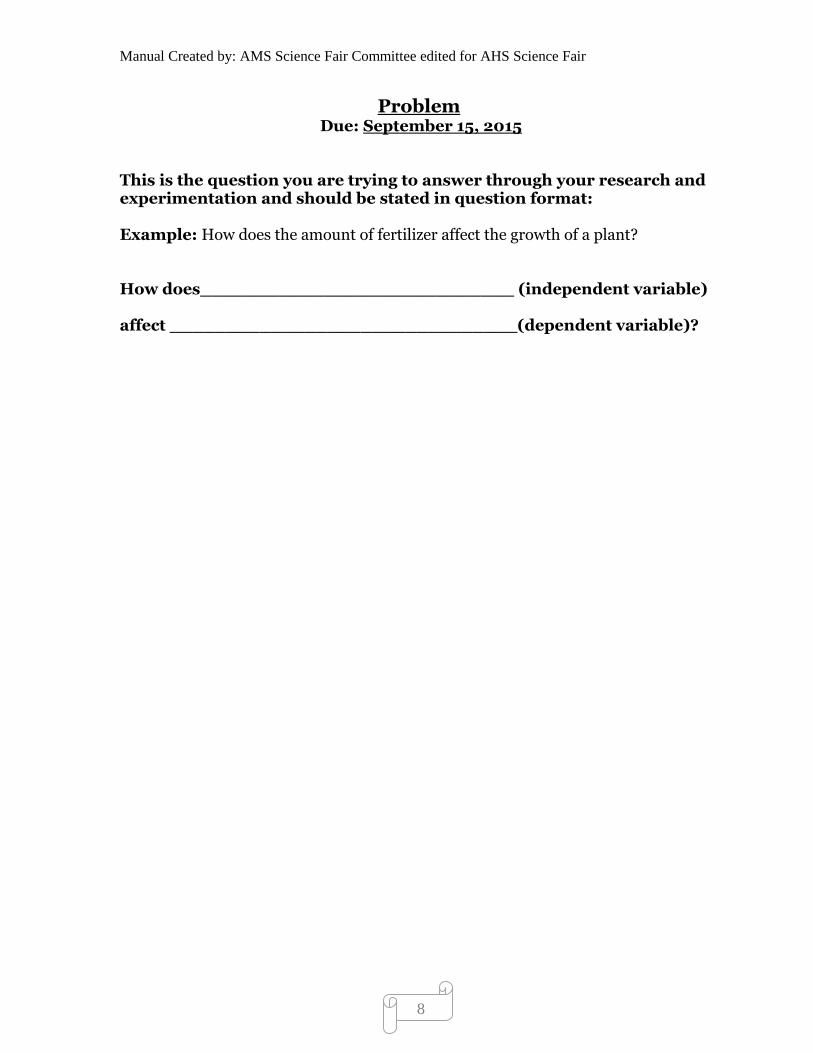
Problem Due: September 15, 2015
This is the question you are trying to answer through your research and experimentation and should be stated in question format: Example: How does the amount of fertilizer affect the growth of a plant? How does____________________________ (independent variable) affect _______________________________(dependent variable)?
Manual Created by: AMS Science Fair Committee edited for AHS Science Fair
9
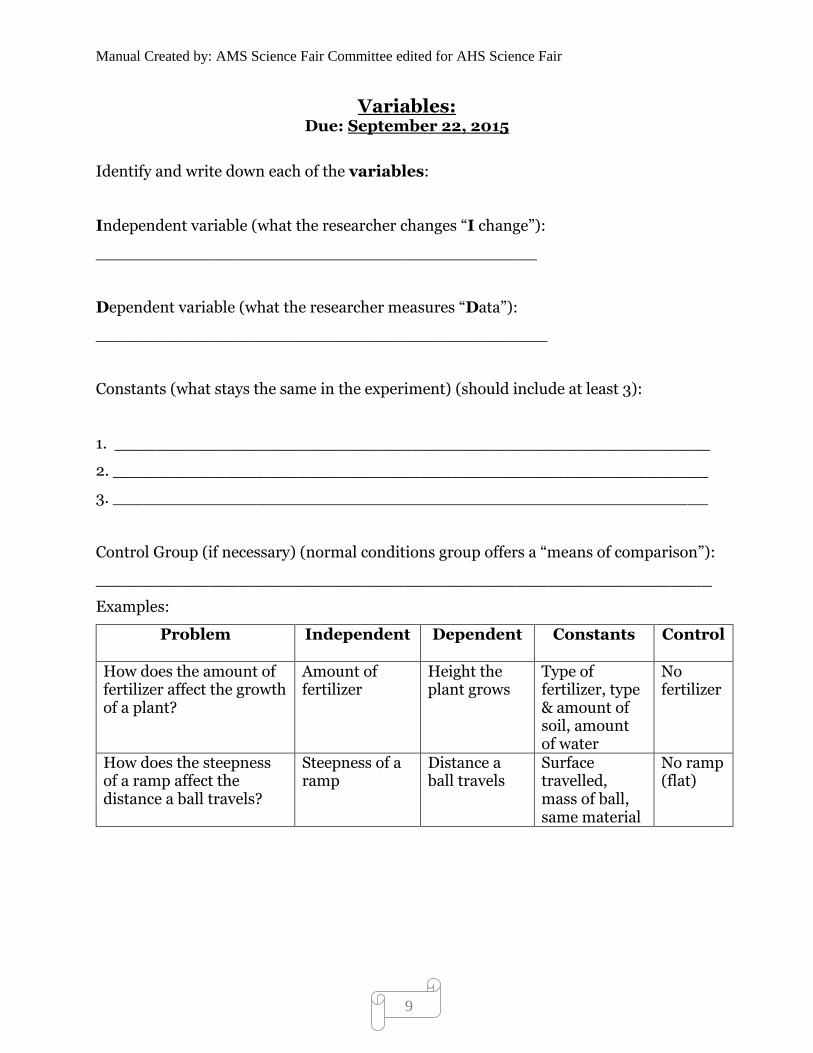
Variables: Due: September 22, 2015
Identify and write down each of the variables:
Independent variable (what the researcher changes “I change”):
___________________________________________
Dependent variable (what the researcher measures “Data”):
____________________________________________
Constants (what stays the same in the experiment) (should include at least 3):
1. __________________________________________________________
2. __________________________________________________________
3. __________________________________________________________
Control Group (if necessary) (normal conditions group offers a “means of comparison”):
____________________________________________________________
Examples:
Problem Independent
Dependent Constants Control
How does the amount of fertilizer affect the growth of a plant?
Amount of fertilizer
Height the plant grows
Type of fertilizer, type & amount of soil, amount of water
No fertilizer
How does the steepness of a ramp affect the distance a ball travels?
Steepness of a ramp
Distance a ball travels
Surface travelled, mass of ball, same material
No ramp (flat)
Manual Created by: AMS Science Fair Committee edited for AHS Science Fair
10
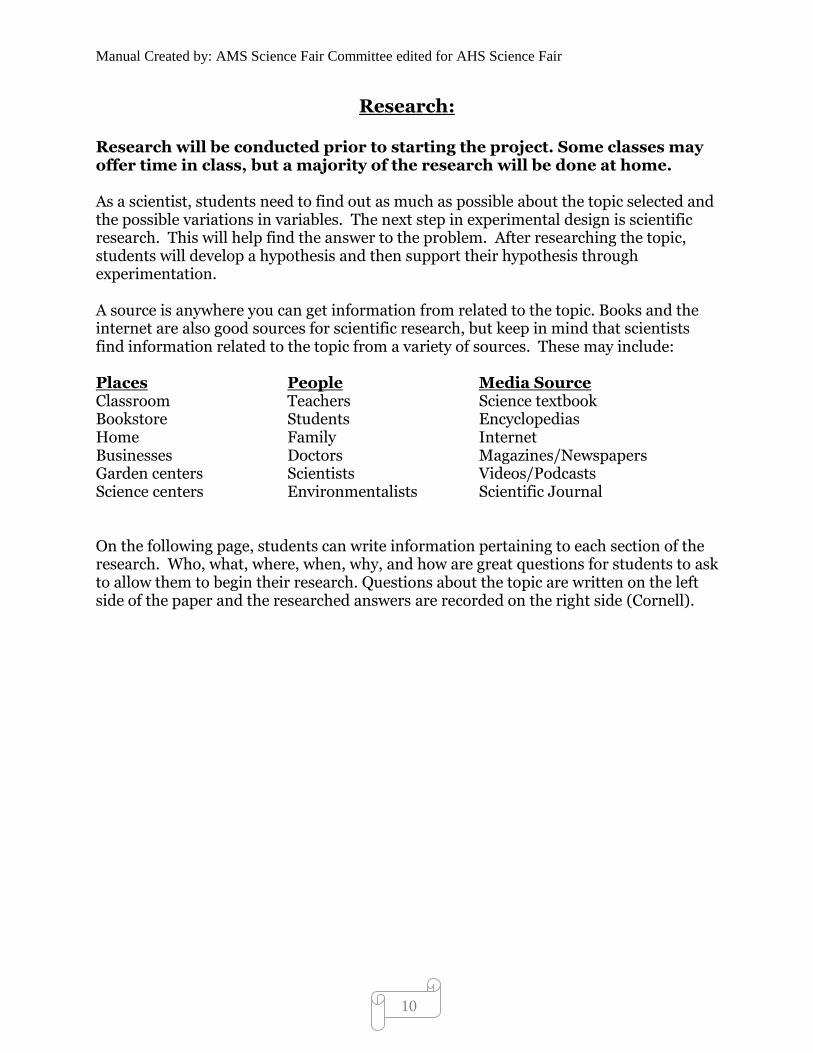
Research:
Research will be conducted prior to starting the project. Some classes may offer time in class, but a majority of the research will be done at home. As a scientist, students need to find out as much as possible about the topic selected and the possible variations in variables. The next step in experimental design is scientific research. This will help find the answer to the problem. After researching the topic, students will develop a hypothesis and then support their hypothesis through experimentation. A source is anywhere you can get information from related to the topic. Books and the internet are also good sources for scientific research, but keep in mind that scientists find information related to the topic from a variety of sources. These may include: Places People Media Source Classroom Teachers Science textbook Bookstore Students Encyclopedias Home Family Internet Businesses Doctors Magazines/Newspapers Garden centers Scientists Videos/Podcasts Science centers Environmentalists Scientific Journal On the following page, students can write information pertaining to each section of the research. Who, what, where, when, why, and how are great questions for students to ask to allow them to begin their research. Questions about the topic are written on the left side of the paper and the researched answers are recorded on the right side (Cornell).
Manual Created by: AMS Science Fair Committee edited for AHS Science Fair
11
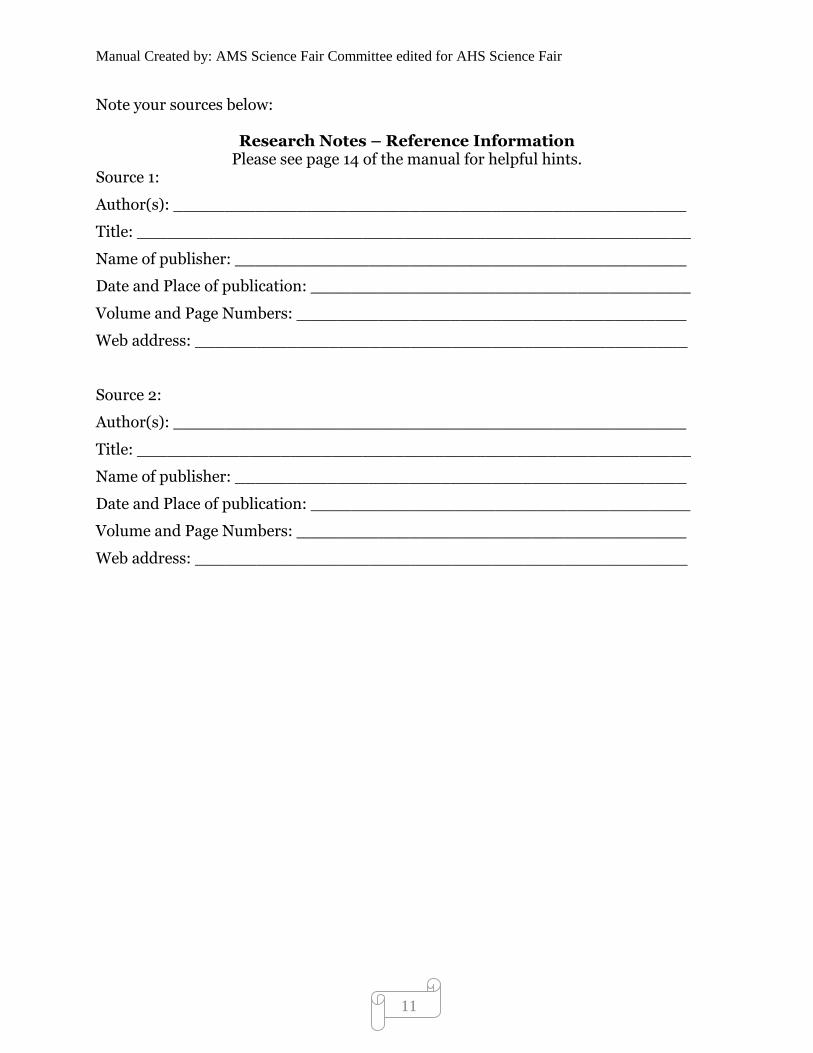
Note your sources below:
Research Notes – Reference Information Please see page 14 of the manual for helpful hints.
Source 1:
Author(s): __________________________________________________
Title: ______________________________________________________
Name of publisher: ____________________________________________
Date and Place of publication: _____________________________________
Volume and Page Numbers: ______________________________________
Web address: ________________________________________________
Source 2:
Author(s): __________________________________________________
Title: ______________________________________________________
Name of publisher: ____________________________________________
Date and Place of publication: _____________________________________
Volume and Page Numbers: ______________________________________
Web address: ________________________________________________
Manual Created by: AMS Science Fair Committee edited for AHS Science Fair
12
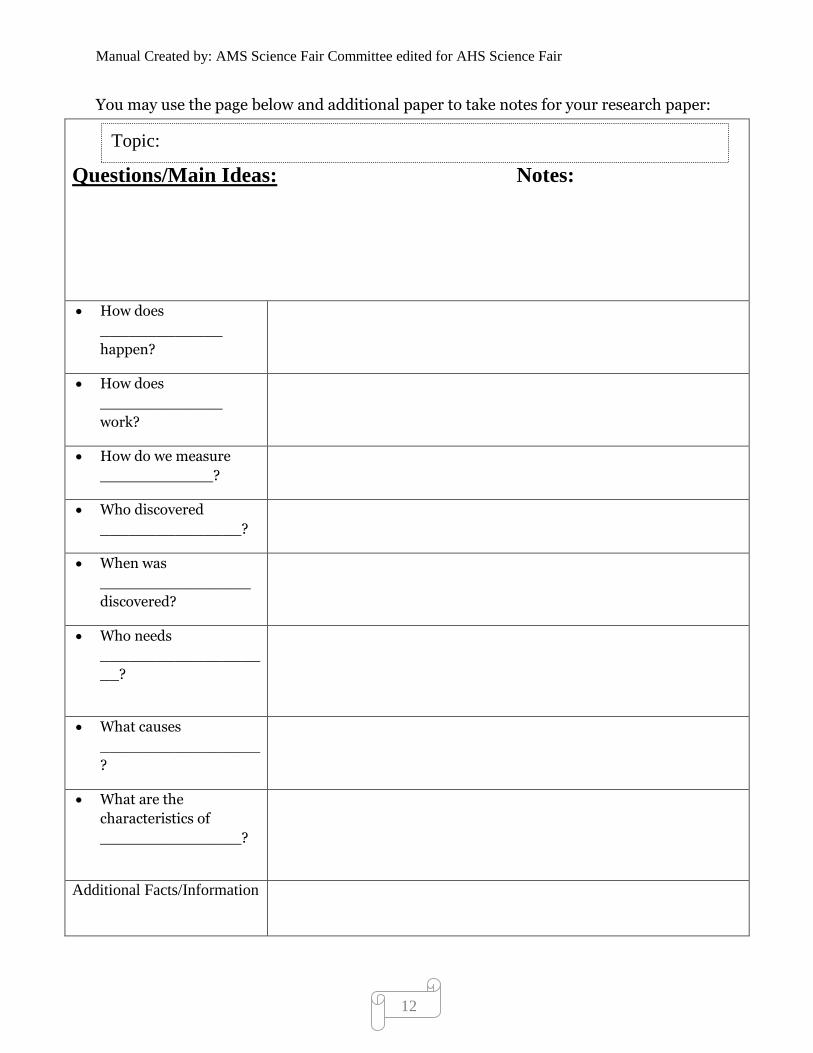
You may use the page below and additional paper to take notes for your research paper:
Questions/Main Ideas: Notes:
How does
_____________
happen?
How does
_____________
work?
How do we measure
____________?
Who discovered
_______________?
When was
________________
discovered?
Who needs
_________________
__?
What causes
_________________
?
What are the
characteristics of
_______________?
Additional Facts/Information
Topic:
Manual Created by: AMS Science Fair Committee edited for AHS Science Fair
13
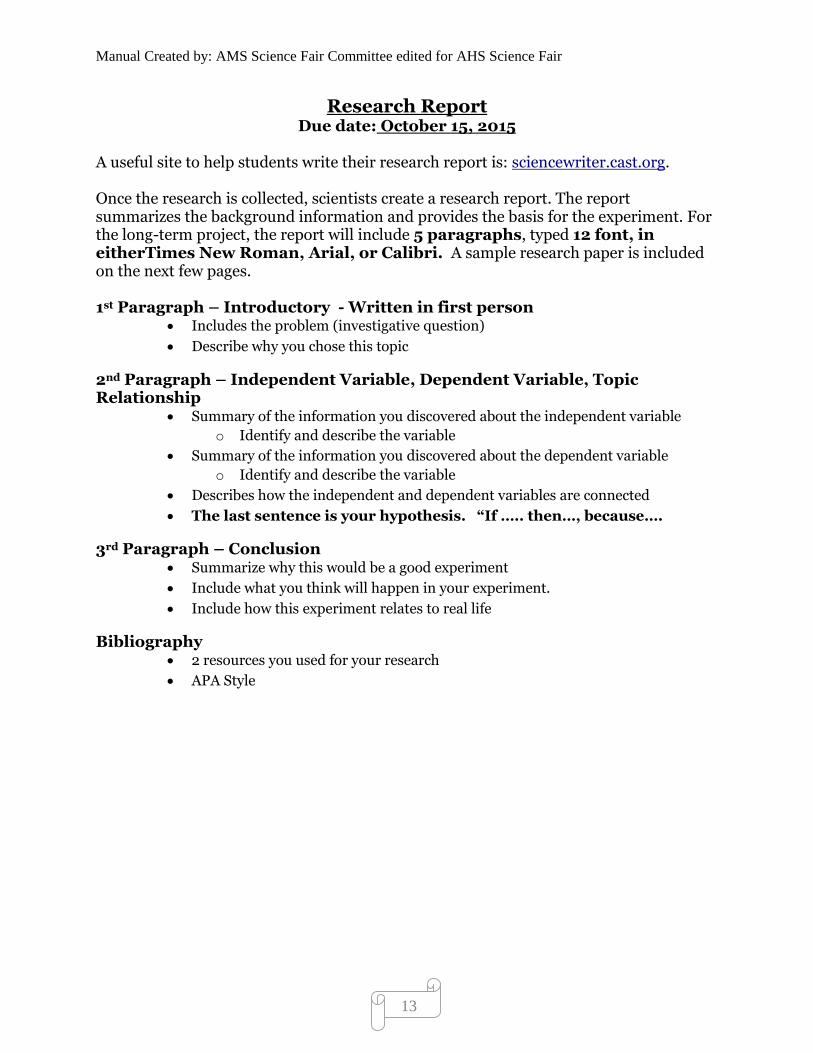
Research Report Due date: October 15, 2015
A useful site to help students write their research report is: sciencewriter.cast.org. Once the research is collected, scientists create a research report. The report summarizes the background information and provides the basis for the experiment. For the long-term project, the report will include 5 paragraphs, typed 12 font, in eitherTimes New Roman, Arial, or Calibri. A sample research paper is included on the next few pages. 1st Paragraph – Introductory - Written in first person
Includes the problem (investigative question)
Describe why you chose this topic
2nd Paragraph – Independent Variable, Dependent Variable, Topic Relationship
Summary of the information you discovered about the independent variable
o Identify and describe the variable
Summary of the information you discovered about the dependent variable
o Identify and describe the variable
Describes how the independent and dependent variables are connected
The last sentence is your hypothesis. “If ….. then…, because….
3rd Paragraph – Conclusion Summarize why this would be a good experiment
Include what you think will happen in your experiment.
Include how this experiment relates to real life
Bibliography 2 resources you used for your research
APA Style
Manual Created by: AMS Science Fair Committee edited for AHS Science Fair
14
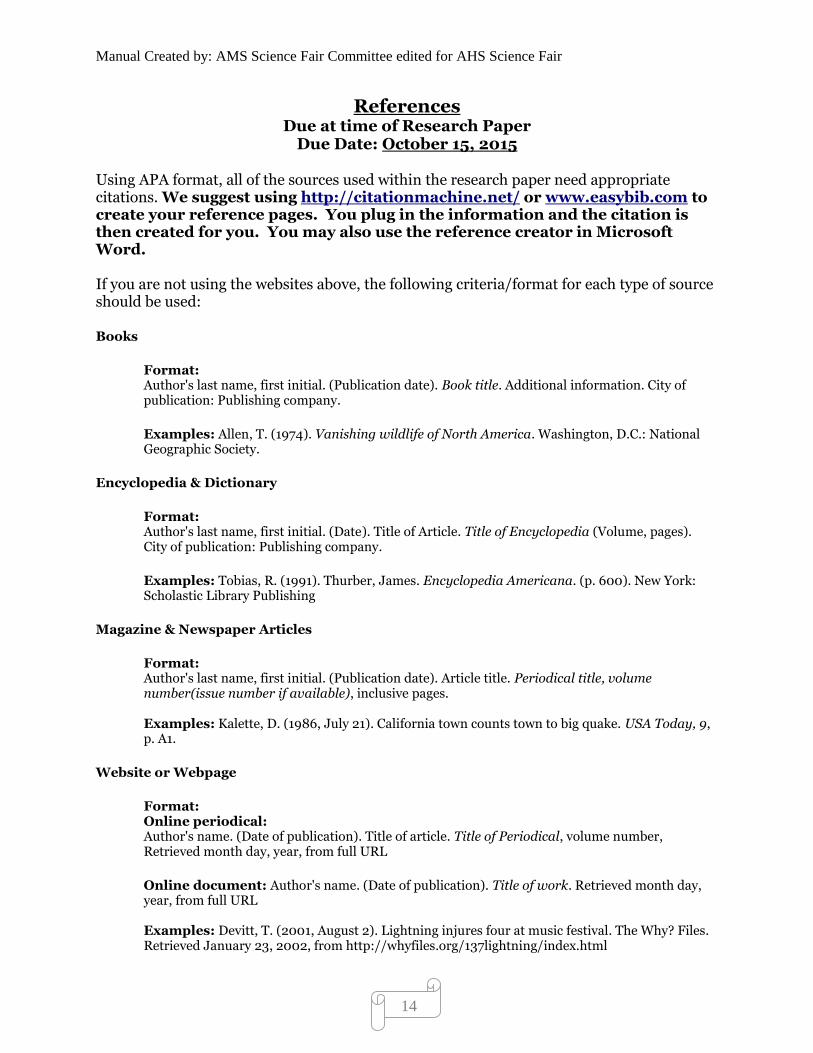
References Due at time of Research Paper
Due Date: October 15, 2015
Using APA format, all of the sources used within the research paper need appropriate citations. We suggest using http://citationmachine.net/ or www.easybib.com to create your reference pages. You plug in the information and the citation is then created for you. You may also use the reference creator in Microsoft Word. If you are not using the websites above, the following criteria/format for each type of source should be used:
Books
Format: Author's last name, first initial. (Publication date). Book title. Additional information. City of publication: Publishing company.
Examples: Allen, T. (1974). Vanishing wildlife of North America. Washington, D.C.: National Geographic Society.
Encyclopedia & Dictionary
Format: Author's last name, first initial. (Date). Title of Article. Title of Encyclopedia (Volume, pages). City of publication: Publishing company.
Examples: Tobias, R. (1991). Thurber, James. Encyclopedia Americana. (p. 600). New York: Scholastic Library Publishing
Magazine & Newspaper Articles
Format: Author's last name, first initial. (Publication date). Article title. Periodical title, volume number(issue number if available), inclusive pages. Examples: Kalette, D. (1986, July 21). California town counts town to big quake. USA Today, 9, p. A1.
Website or Webpage
Format: Online periodical: Author's name. (Date of publication). Title of article. Title of Periodical, volume number, Retrieved month day, year, from full URL
Online document: Author's name. (Date of publication). Title of work. Retrieved month day, year, from full URL Examples: Devitt, T. (2001, August 2). Lightning injures four at music festival. The Why? Files. Retrieved January 23, 2002, from http://whyfiles.org/137lightning/index.html
Manual Created by: AMS Science Fair Committee edited for AHS Science Fair
15
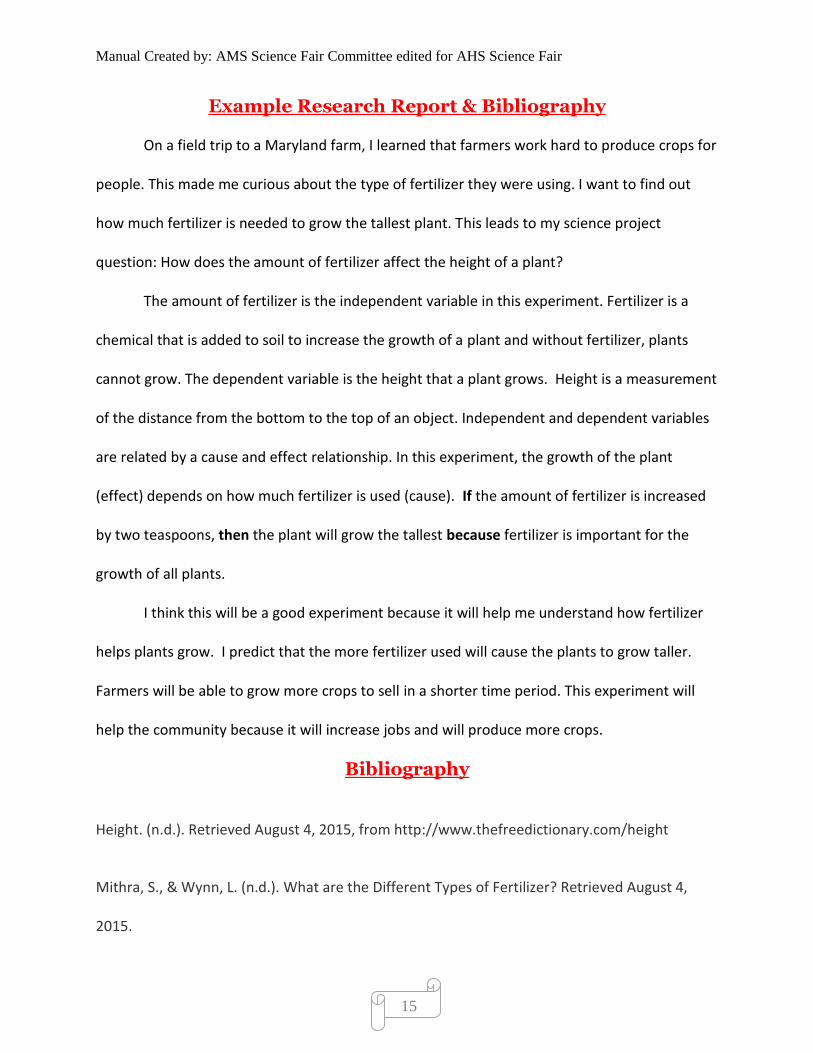
Example Research Report & Bibliography
On a field trip to a Maryland farm, I learned that farmers work hard to produce crops for
people. This made me curious about the type of fertilizer they were using. I want to find out
how much fertilizer is needed to grow the tallest plant. This leads to my science project
question: How does the amount of fertilizer affect the height of a plant?
The amount of fertilizer is the independent variable in this experiment. Fertilizer is a
chemical that is added to soil to increase the growth of a plant and without fertilizer, plants
cannot grow. The dependent variable is the height that a plant grows. Height is a measurement
of the distance from the bottom to the top of an object. Independent and dependent variables
are related by a cause and effect relationship. In this experiment, the growth of the plant
(effect) depends on how much fertilizer is used (cause). If the amount of fertilizer is increased
by two teaspoons, then the plant will grow the tallest because fertilizer is important for the
growth of all plants.
I think this will be a good experiment because it will help me understand how fertilizer
helps plants grow. I predict that the more fertilizer used will cause the plants to grow taller.
Farmers will be able to grow more crops to sell in a shorter time period. This experiment will
help the community because it will increase jobs and will produce more crops.
Bibliography
Height. (n.d.). Retrieved August 4, 2015, from http://www.thefreedictionary.com/height
Mithra, S., & Wynn, L. (n.d.). What are the Different Types of Fertilizer? Retrieved August 4,
2015.

Manual Created by: AMS Science Fair Committee edited for AHS Science Fair
16
Hypothesis Due at time of research report
Due: October 15, 2015
A hypothesis should answer the problem in an “If….(independent variable) then….(dependent variable), because…(based on research)” statement.
Example with guidelines: If the amount of fertilizer is increased to two teaspoons (independent variable), then the plant will grow the tallest (dependent variable), because fertilizer is important for the growth of all plants (from research).
Example on final project: If the amount of fertilizer is increased to two teaspoons, then the plant will grow the tallest because fertilizer is important for the growth of all plants.
Hypothesis Development:
If ________________________________________________________
___________________________________________________, then
__________________________________________________________
__________________________________________________________
because ___________________________________________________
__________________________________________________________
_________________________________________________________.
* Your hypothesis needs to be included in the 2nd paragraph of your research report. See your research report guidelines.
Manual Created by: AMS Science Fair Committee edited for AHS Science Fair
17
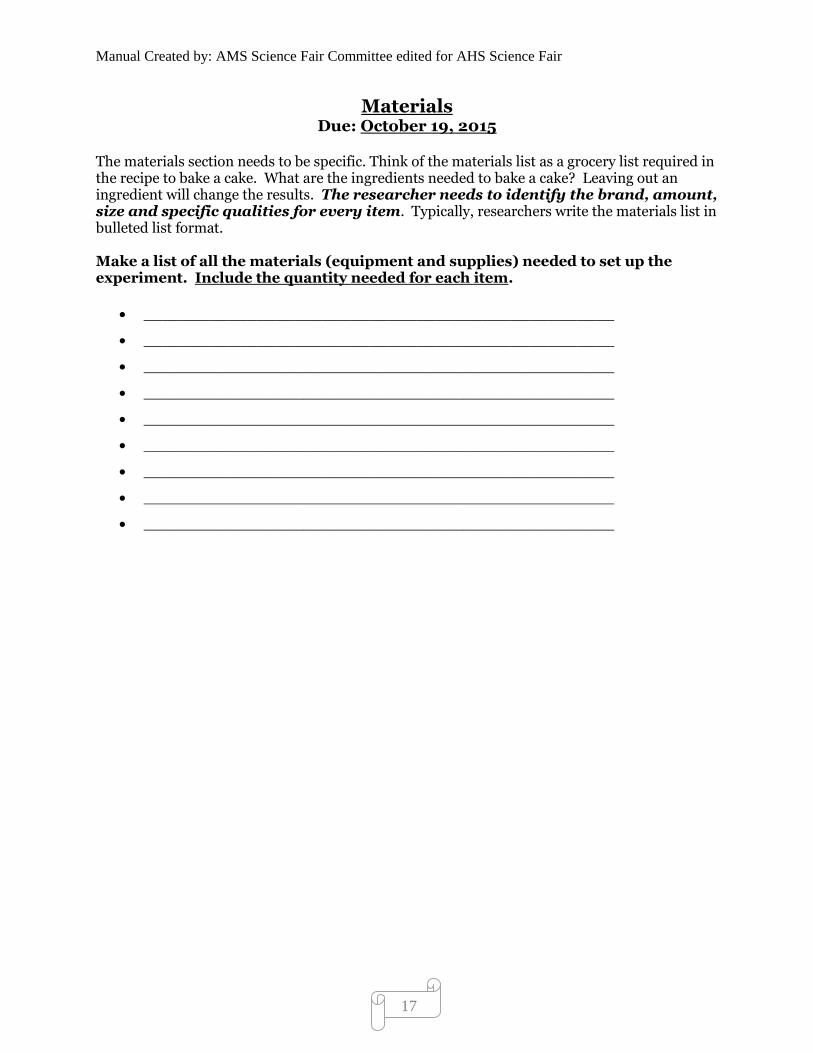
Materials Due: October 19, 2015
The materials section needs to be specific. Think of the materials list as a grocery list required in the recipe to bake a cake. What are the ingredients needed to bake a cake? Leaving out an ingredient will change the results. The researcher needs to identify the brand, amount, size and specific qualities for every item. Typically, researchers write the materials list in bulleted list format.
Make a list of all the materials (equipment and supplies) needed to set up the experiment. Include the quantity needed for each item.
__________________________________________________
__________________________________________________
__________________________________________________
__________________________________________________
__________________________________________________
__________________________________________________
__________________________________________________
__________________________________________________
__________________________________________________
Manual Created by: AMS Science Fair Committee edited for AHS Science Fair
18
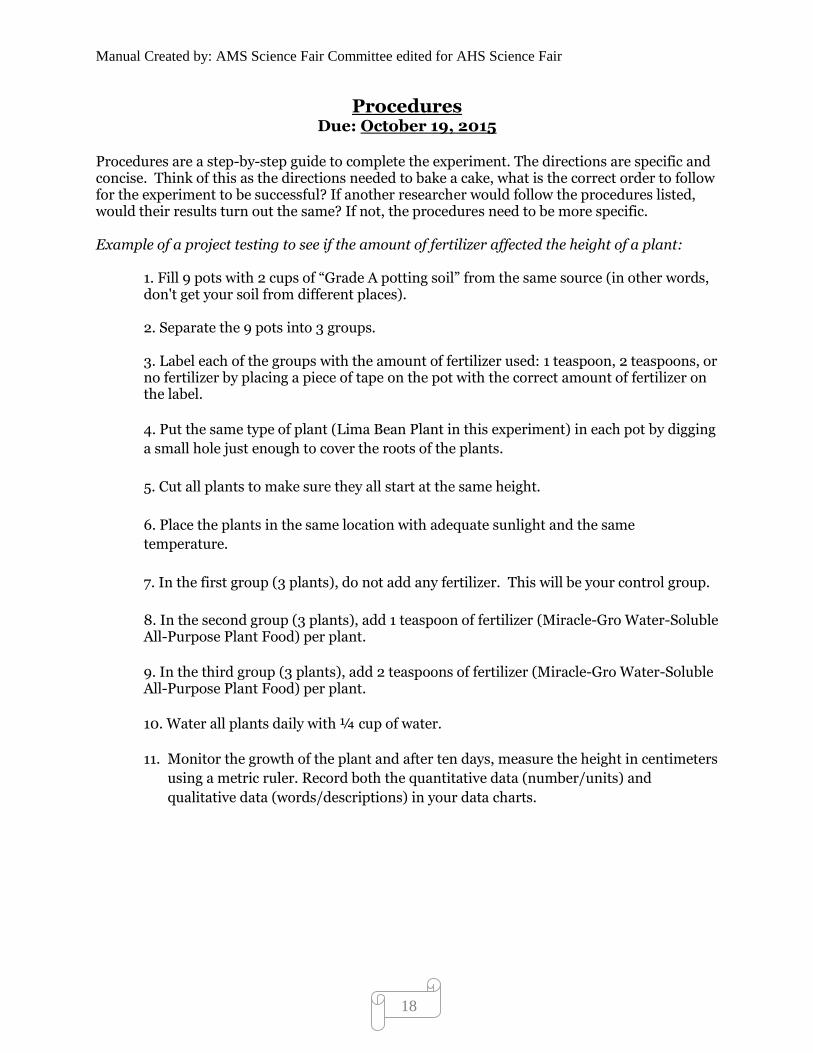
Procedures Due: October 19, 2015
Procedures are a step-by-step guide to complete the experiment. The directions are specific and concise. Think of this as the directions needed to bake a cake, what is the correct order to follow for the experiment to be successful? If another researcher would follow the procedures listed, would their results turn out the same? If not, the procedures need to be more specific. Example of a project testing to see if the amount of fertilizer affected the height of a plant:
1. Fill 9 pots with 2 cups of “Grade A potting soil” from the same source (in other words, don't get your soil from different places). 2. Separate the 9 pots into 3 groups. 3. Label each of the groups with the amount of fertilizer used: 1 teaspoon, 2 teaspoons, or no fertilizer by placing a piece of tape on the pot with the correct amount of fertilizer on the label.
4. Put the same type of plant (Lima Bean Plant in this experiment) in each pot by digging
a small hole just enough to cover the roots of the plants.
5. Cut all plants to make sure they all start at the same height.
6. Place the plants in the same location with adequate sunlight and the same
temperature.
7. In the first group (3 plants), do not add any fertilizer. This will be your control group.
8. In the second group (3 plants), add 1 teaspoon of fertilizer (Miracle-Gro Water-Soluble All-Purpose Plant Food) per plant.
9. In the third group (3 plants), add 2 teaspoons of fertilizer (Miracle-Gro Water-Soluble All-Purpose Plant Food) per plant.
10. Water all plants daily with ¼ cup of water.
11. Monitor the growth of the plant and after ten days, measure the height in centimeters
using a metric ruler. Record both the quantitative data (number/units) and
qualitative data (words/descriptions) in your data charts.

Manual Created by: AMS Science Fair Committee edited for AHS Science Fair
19
Procedures (continued)
Write a list of all the steps needed to complete this experiment. What is the first step needed to be done? (second step, third step, etc.) Write as many steps as necessary. Remember to be SPECIFIC! (add more pages as needed) Procedures:
1.___________________________________________________________
____________________________________________________________
____________________________________________________________
2.___________________________________________________________
____________________________________________________________
____________________________________________________________
3.___________________________________________________________
____________________________________________________________
____________________________________________________________
4.___________________________________________________________
____________________________________________________________
____________________________________________________________
5.___________________________________________________________
____________________________________________________________
____________________________________________________________
6.___________________________________________________________
____________________________________________________________
____________________________________________________________
7.___________________________________________________________
____________________________________________________________
____________________________________________________________
8.___________________________________________________________
____________________________________________________________
____________________________________________________________
Manual Created by: AMS Science Fair Committee edited for AHS Science Fair
20
Observations Due: November 10, 2015
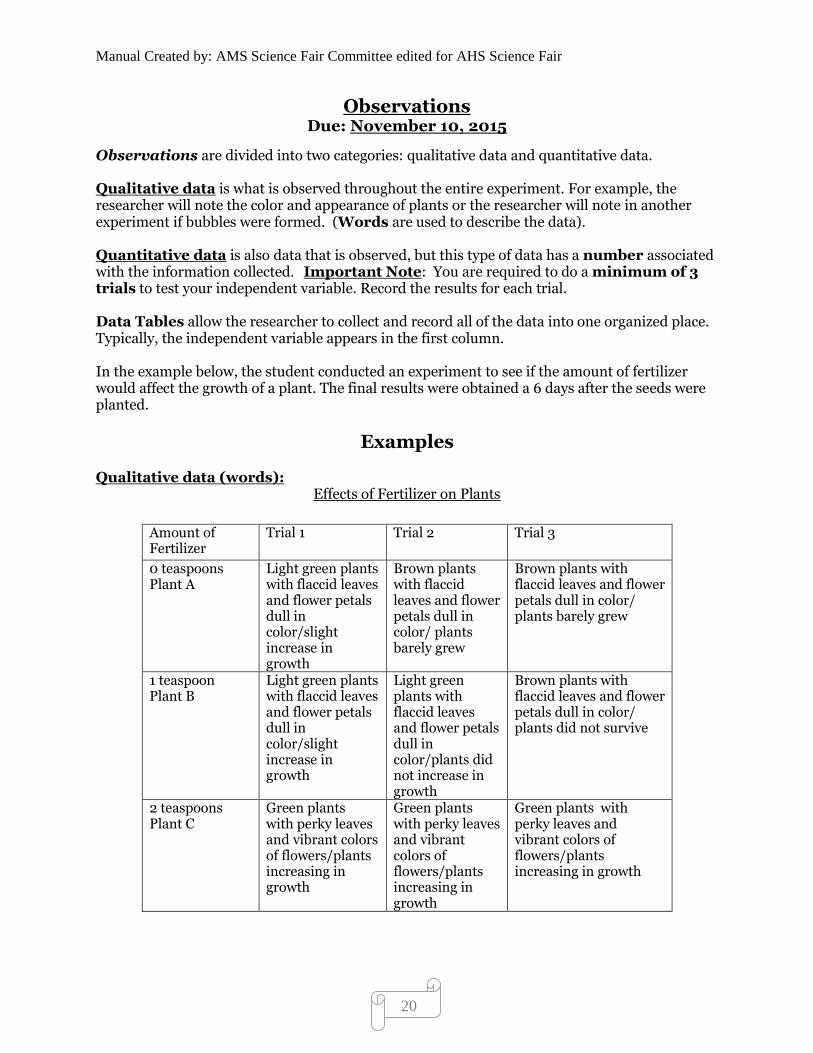
Observations are divided into two categories: qualitative data and quantitative data. Qualitative data is what is observed throughout the entire experiment. For example, the researcher will note the color and appearance of plants or the researcher will note in another experiment if bubbles were formed. (Words are used to describe the data). Quantitative data is also data that is observed, but this type of data has a number associated with the information collected. Important Note: You are required to do a minimum of 3 trials to test your independent variable. Record the results for each trial. Data Tables allow the researcher to collect and record all of the data into one organized place. Typically, the independent variable appears in the first column. In the example below, the student conducted an experiment to see if the amount of fertilizer would affect the growth of a plant. The final results were obtained a 6 days after the seeds were planted.
Examples Qualitative data (words):
Effects of Fertilizer on Plants
Amount of Fertilizer
Trial 1
Trial 2
Trial 3
0 teaspoons Plant A
Light green plants with flaccid leaves and flower petals dull in color/slight increase in growth
Brown plants with flaccid leaves and flower petals dull in color/ plants barely grew
Brown plants with flaccid leaves and flower petals dull in color/ plants barely grew
1 teaspoon Plant B
Light green plants with flaccid leaves and flower petals dull in color/slight increase in growth
Light green plants with flaccid leaves and flower petals dull in color/plants did not increase in growth
Brown plants with flaccid leaves and flower petals dull in color/ plants did not survive
2 teaspoons Plant C
Green plants with perky leaves and vibrant colors of flowers/plants increasing in growth
Green plants with perky leaves and vibrant colors of flowers/plants increasing in growth
Green plants with perky leaves and vibrant colors of flowers/plants increasing in growth
Manual Created by: AMS Science Fair Committee edited for AHS Science Fair
21
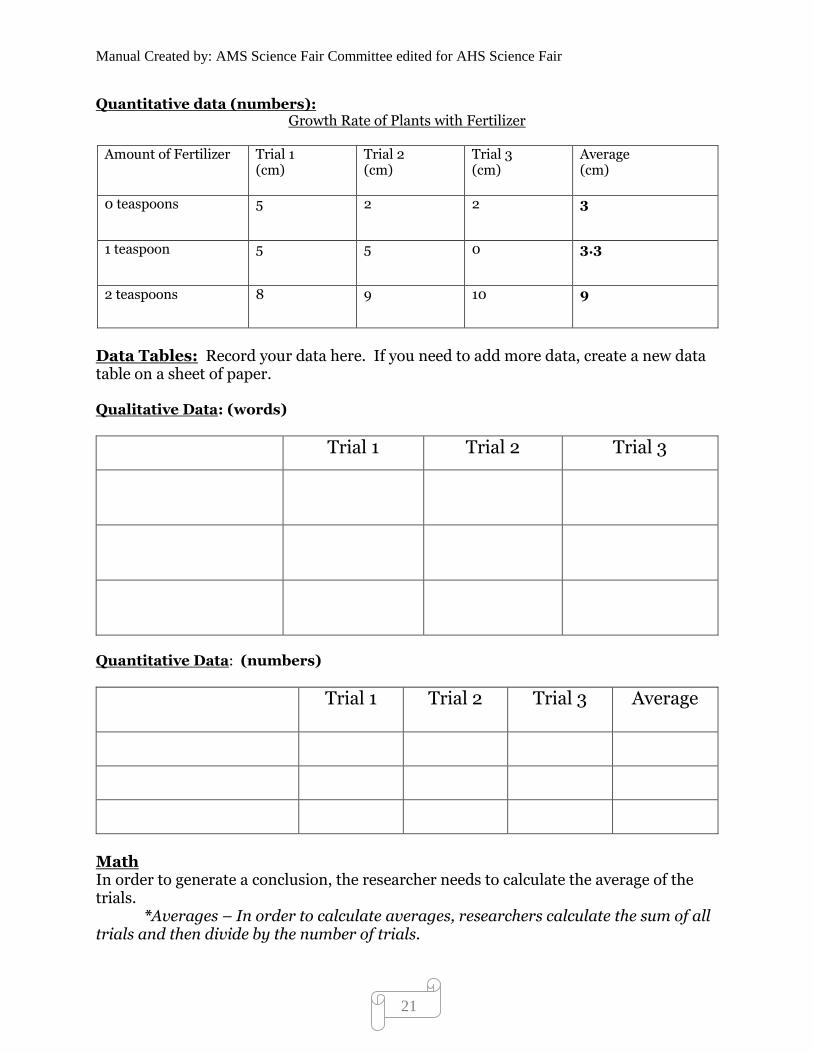
Quantitative data (numbers): Growth Rate of Plants with Fertilizer
Amount of Fertilizer Trial 1
(cm) Trial 2 (cm)
Trial 3 (cm)
Average (cm)
0 teaspoons 5 2 2 3
1 teaspoon 5 5 0 3.3
2 teaspoons 8 9 10 9
Data Tables: Record your data here. If you need to add more data, create a new data table on a sheet of paper. Qualitative Data: (words)
Trial 1 Trial 2 Trial 3
Quantitative Data: (numbers)
Trial 1 Trial 2 Trial 3 Average
Math In order to generate a conclusion, the researcher needs to calculate the average of the trials.
*Averages – In order to calculate averages, researchers calculate the sum of all trials and then divide by the number of trials.
Manual Created by: AMS Science Fair Committee edited for AHS Science Fair
22
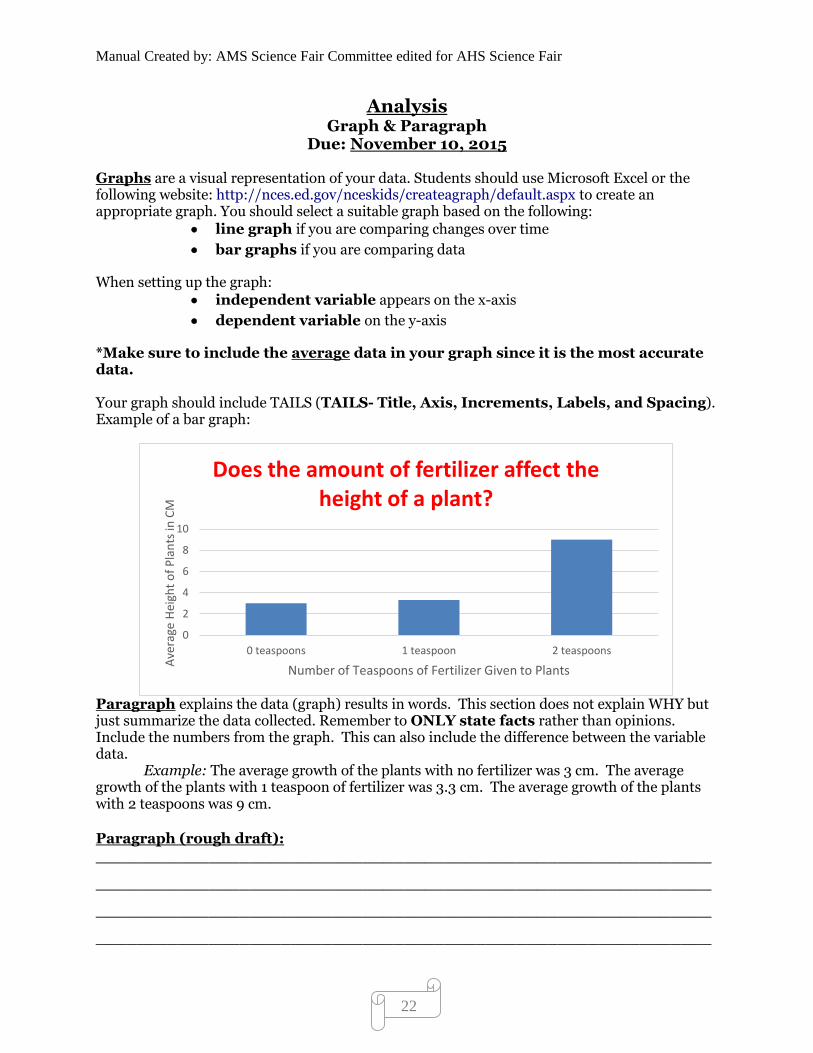
Analysis Graph & Paragraph
Due: November 10, 2015
Graphs are a visual representation of your data. Students should use Microsoft Excel or the following website: http://nces.ed.gov/nceskids/createagraph/default.aspx to create an appropriate graph. You should select a suitable graph based on the following:
line graph if you are comparing changes over time
bar graphs if you are comparing data
When setting up the graph: independent variable appears on the x-axis
dependent variable on the y-axis
*Make sure to include the average data in your graph since it is the most accurate data. Your graph should include TAILS (TAILS- Title, Axis, Increments, Labels, and Spacing). Example of a bar graph:
Paragraph explains the data (graph) results in words. This section does not explain WHY but just summarize the data collected. Remember to ONLY state facts rather than opinions. Include the numbers from the graph. This can also include the difference between the variable data. Example: The average growth of the plants with no fertilizer was 3 cm. The average growth of the plants with 1 teaspoon of fertilizer was 3.3 cm. The average growth of the plants with 2 teaspoons was 9 cm.
Paragraph (rough draft):
____________________________________________________________
____________________________________________________________
____________________________________________________________
____________________________________________________________
0
2
4
6
8
10
0 teaspoons 1 teaspoon 2 teaspoons
Ave
rage
Hei
ght
of
Pla
nts
in C
M
Number of Teaspoons of Fertilizer Given to Plants
Does the amount of fertilizer affect the height of a plant?
Manual Created by: AMS Science Fair Committee edited for AHS Science Fair
23
Conclusion Due: November 13, 2015
The conclusion summarizes how the experiment supports or contradicts (refutes) the originally stated hypothesis. The conclusion summarizes how the experiment supports or contradicts (refutes) the originally stated hypothesis.
1. Restate the problem the researcher was testing.
__________________________________________________________
__________________________________________________________
2. Restate y0ur hypothesis: rewrite the entire hypothesis in the conclusion.
__________________________________________________________
__________________________________________________________
__________________________________________________________
3. Explain why or why not your hypothesis was accepted or rejected by using the
collected data with evidence from the experiment. This includes the quantitative
data and the qualitative data. Include the averages and the differences between the
variables.
__________________________________________________________
__________________________________________________________
__________________________________________________________
4. Explain the relationship discovered between the independent and dependent
variables.
__________________________________________________________
__________________________________________________________
__________________________________________________________
5. Explain possible sources of error (what could have gone wrong with your
experiment?) or perhaps things the researcher would conduct differently next time
and explain. Explain what you could do to extend this experiment (future
experiments).
__________________________________________________________
__________________________________________________________
__________________________________________________________
__________________________________________________________

Manual Created by: AMS Science Fair Committee edited for AHS Science Fair
24
Sample Conclusion
Example: Below is an excerpt from a conclusion paragraph:
1. The problem I researched was “How does the amount of fertilizer affect plant growth?” 2. My
hypothesis was that: “If the amount of fertilizer is increased to 2 teaspoons, then the plant will
grow the tallest because fertilizer is important for the growth of all plants.” 3. According to my
experiment, my data supports my hypothesis. The plants that had 2 teaspoons of fertilizer
(independent variable) on average grew to be 9 centimeters (dependent variable). The plants
that were given 1 teaspoon of fertilizer grew on average of 3.3 centimeters. The plants that were
not given fertilizer grew an average of 3 centimeters. The group of plants with 2 teaspoons of
fertilizer on average grew a difference of 5.7 centimeters taller compared to the plants with only
1 teaspoon. The difference between 2 teaspoons and no fertilizer was 6 centimeters. In
addition, my qualitative data showed that the plants that were given 2 teaspoons of fertilizer
were greener, perkier, and taller compared to the plants with only 1 teaspoon of fertilizer, which
were browner and more flaccid. 4. The relationship from my experiment showed that when
giving fertilizer to plants (independent variable), 2 teaspoons are better than 1 and no fertilizer
for the height and health of a plant (dependent variable) based on this experiment. In my
experiment, I believe my test ran smoothly, and I had very few problems. 5. One source of error
may have possibly been an incorrect measurement of fertilizer due to human error. Another
source of error that may have affected my results is the type of plants that I chose. By choosing
this particular type of plant in my experiment, I may have accidently chosen one that survives
best with fertilizer, but the results may be different for other types of plants. An interesting
future study might involve testing different types of plants with 2 teaspoons of fertilizer to
simulate whether or not these plants would grow at the same rate as my current experiment.
Manual Created by: AMS Science Fair Committee edited for AHS Science Fair
25
Abstract Due: November 13, 2015
The abstract is the overall summary of your entire experiment. This section will be completed once your project is completed and will only include 175 – 250 words. The abstract is written in paragraph format and glued to the back of the board. The abstract includes:
The problem (question you were investigating).
Includes your hypothesis.
Explains what you tested (independent variable and how you measured the dependent
variable).
Explains how the experiment was setup and completed.
Explains the results/conclusion you found out by completing the experiment.
Example of an Abstract:
My problem was: “How does the amount of fertilizer affect the growth of plants?” My hypothesis was that: “If the amount of fertilizer is increased to 2 teaspoons, then the plant will grow the tallest (dependent variable) because fertilizer is important for the growth of all plants.” The experiment was set up using three different groups of three pots each with different amounts of fertilizer (0 teaspoons, 1 teaspoons, 2 teaspoons) dissolved in water. The first group did not receive fertilizer and was the control group. The other two groups received different amounts of fertilizer. The plants were measured and observed for ten days. My experiment supported my hypothesis in that the plant that had no fertilizer did not grow as quickly as the other two plants and the leaves became faded in color. The plants with two teaspoons grew the tallest with an average of 9 cm. The plants with 1 teaspoon grew the second tallest with an average of 3.3 cm. The plants with no fertilizer grew the least tall with an average growth of 3 cm. Based on my experiment, using the two teaspoons of fertilizer allows the lima bean plants to grow the tallest.

Manual Created by: AMS Science Fair Committee edited for AHS Science Fair
26
Abstract Pre- Writing:
Write in the information and then type it in paragraph format.
1. What was the problem you were testing?
_____________________________________________________________
_____________________________________________________________
_____________________________________________________________
2. Explain what you tested: ___________________________________________
_____________________________________________________________
_____________________________________________________________
_____________________________________________________________
3. Explain your hypothesis:____________________________________________
_____________________________________________________________
_____________________________________________________________
_____________________________________________________________
4. Explain how you tested your hypothesis: ________________________________
_____________________________________________________________
_____________________________________________________________
_____________________________________________________________
_____________________________________________________________
5. Explain your results: ______________________________________________
_____________________________________________________________
_____________________________________________________________
____________________________________________________________.
Manual Created by: AMS Science Fair Committee edited for AHS Science Fair
27
Presentation Due: November 17, 2015
Students will create a visual representation of their project using a Tri- Board. These boards are available at Office Depot, Staples, Michaels, AC Moore, or from Arundel Middle. Prices range from $5 to $10 depending on color and thickness. Arundel Middle is selling boards for $5, which can be purchased through your science teacher. Project display boards should appear neat, organized, and attractive. Additionally, spectators should be able to understand your project without student interventions. The following information must appear on the board:
Manual Created by: AMS Science Fair Committee edited for AHS Science Fair
28
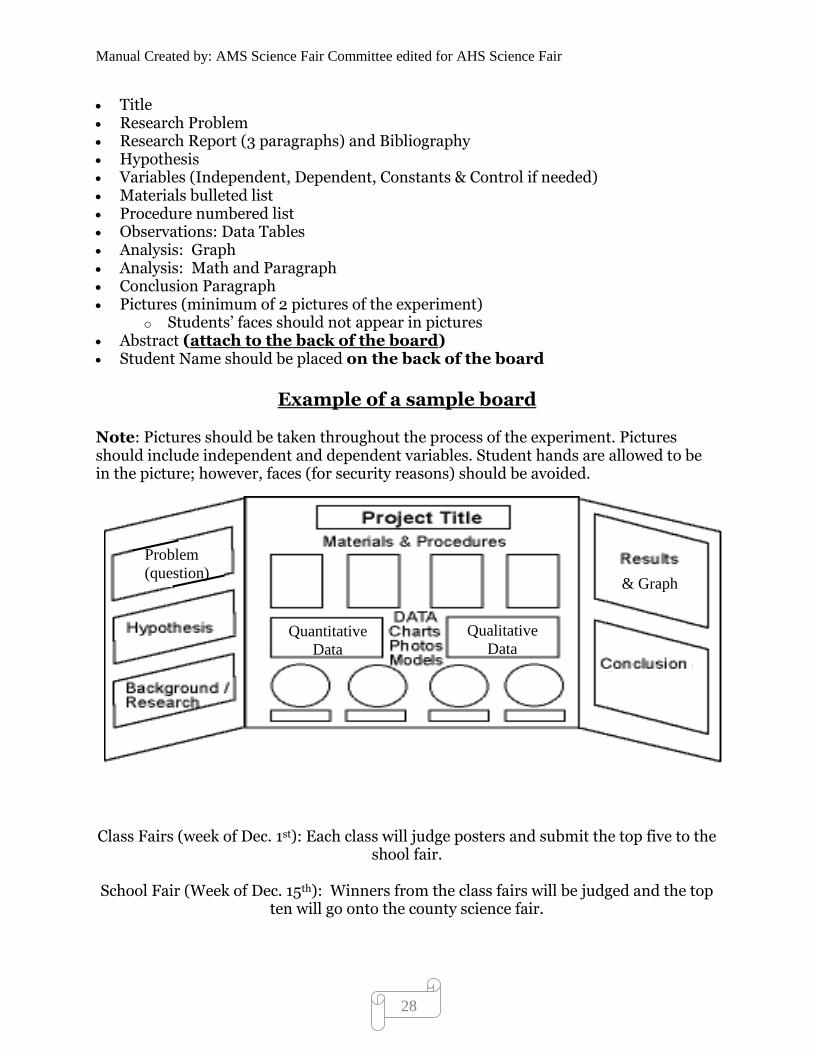
Title Research Problem Research Report (3 paragraphs) and Bibliography Hypothesis Variables (Independent, Dependent, Constants & Control if needed) Materials bulleted list Procedure numbered list Observations: Data Tables Analysis: Graph Analysis: Math and Paragraph Conclusion Paragraph Pictures (minimum of 2 pictures of the experiment)
o Students’ faces should not appear in pictures Abstract (attach to the back of the board) Student Name should be placed on the back of the board
Example of a sample board
Note: Pictures should be taken throughout the process of the experiment. Pictures should include independent and dependent variables. Student hands are allowed to be in the picture; however, faces (for security reasons) should be avoided.
Class Fairs (week of Dec. 1st): Each class will judge posters and submit the top five to the shool fair.
School Fair (Week of Dec. 15th): Winners from the class fairs will be judged and the top
ten will go onto the county science fair.
Problem
(question) & Graph
Quantitative
Data
Qualitative
Data
Manual Created by: AMS Science Fair Committee edited for AHS Science Fair
29
Science Project Idea Approval Form Student(s) Name: ______________________________________________
Teacher Name: ______________________________________________
Project Category: _____________________________________________
What question do you want to answer? ______________________________________________
______________________________________________________________________________
Explain how you think you would test your question: __________________________________
______________________________________________________________________________
______________________________________________________________________________
List several items you will need to consider to complete your experiment: __________________
______________________________________________________________________________
Parent/Guardian/Supervisor of Student during Experimentation:
______________________________________________________________________________
My child and I have read and understand that he or she will be completing a long-term science
project. Additionally, we understand that the final portion of the project is due Tuesday,
November 17, 2015. Any student that submits projects beyond this due date will incur a grade-
level drop for each school date late. Because of the length of the project and the projects
individual due dates for each section, extended time will not be provided to students that are
absent the dates preceding or on the due date. I understand that the science project is worth
10% of my scholar’s 2nd quarter grade.
*Partner projects must be challenging, as determined by the teacher, and must have prior
approval from their teacher, Science Department Chair (Mr. Jones) and both parents. Partners
must be in the same Science class. All aspects of the project must be completed individually
except for the experimental process and backboard.
Parent Signature Approval (For partner projects, both parent signatures are required):
__________________________ ________________________
Parent Signature Partner’s Parent Signature
(Do not write below line)
Teacher Approval: ______________________ Date Approved: _____________________
DC Approval (for partner projects): _____________________
Special Safety Concerns: ________________________________________________________
Related Documents