Accepted Manuscript 1 Long-term interest rate predictability: Exploring the usefulness of survey forecasts of growth and inflation Hamid Baghestani Accepted Manuscript Version This is the unedited version of the article as it appeared upon acceptance by the journal. A final edited version of the article in the journal format will be made available soon. As a service to authors and researchers we publish this version of the accepted manuscript (AM) as soon as possible after acceptance. Copyediting, typesetting, and review of the resulting proof will be undertaken on this manuscript before final publication of the Version of Record (VoR). Please note that during production and pre-press, errors may be discovered which could affect the content. © 2019 The Author(s). This open access article is distributed under a Creative Commons Attribution (CC-BY) 4.0 license. Publisher: Cogent OA Journal: Cogent Economics & Finance DOI: http://dx.doi.org/10.1080/23322039.2019.1582317

Welcome message from author
This document is posted to help you gain knowledge. Please leave a comment to let me know what you think about it! Share it to your friends and learn new things together.
Transcript
Accep
ted M
anus
cript
1
Long-term interest rate predictability:
Exploring the usefulness of survey forecasts of growth and inflation
Hamid Baghestani
Accepted Manuscript Version
This is the unedited version of the article as it appeared upon acceptance by the journal. A final edited version of the article in the journal format will be made available soon.
As a service to authors and researchers we publish this version of the accepted manuscript (AM) as soon as possible after acceptance. Copyediting, typesetting, and review of the resulting proof will be undertaken on this manuscript before final publication of the Version of Record (VoR). Please note that during production and pre-press, errors may be discovered which could affect the content.
© 2019 The Author(s). This open access article is distributed under a Creative Commons Attribution (CC-BY) 4.0 license.
Publisher: Cogent OA
Journal: Cogent Economics & Finance
DOI: http://dx.doi.org/10.1080/23322039.2019.1582317
Accep
ted M
anus
cript
2
Long-term interest rate predictability:
Exploring the usefulness of survey forecasts of growth and inflation
By: Hamid Baghestani
Department of Economics
School of Business Administration
American University of Sharjah
P.O. Box 26666,
Sharjah, UAE
971-6-515-2529 (office phone)
971-6-515-2500 (fax)
E-mail: [email protected]
Disclosure Statement
This is to acknowledge that NO financial interest or benefit has arisen from the direct
applications of this research.

Accep
ted M
anus
cript
3
Acknowledgement: The author would like to thank two anonymous referees for helpful
comments and suggestions.

Accep
ted M
anus
cript
4
Abstract. This study focuses on the consensus forecasts from the Survey of Professional
Forecasters (SPF) for 1993-2017. These include the SPF forecasts of US 10-year Treasury rate
(TBR), Moody’s Aaa corporate bond rate (Aaa), CPI inflation, and real GDP growth. We show
that both SPF and random walk forecasts of TBR and Aaa generally fail to be orthogonal to
changes in SPF inflation (but not growth) forecasts. Such findings point to the potential
usefulness of SPF inflation forecasts in improving the accuracy of SPF and random walk
forecasts of TBR and Aaa. Further results indicate that changes in SPF inflation forecasts
accurately predict directional change in both TBR and Aaa at longer forecast horizons for 2008-
2017 (but not for 1993-2007). These latter results raise the question of whether long-term interest
rates have become easier to predict, which deserves subsequent research.
Keywords: Long-term interest rates; Fisher effect; Inflationary expectations; Orthogonality;
Directional accuracy; Survey of Professional Forecasters
JEL classification codes: E43, E44, E47, G12
1. Introduction
It is inherently difficult to accurately predict long-term interest rates due to their approximate
random walk behavior (Pesando 1979, 1980; Reichenstein 2006). Studies investigating the accuracy
of survey forecasts of long-term interest rates have shown that such forecasts fail to beat the random
walk benchmark (Brooks and Gray 2004; Mitchell and Pearce 2007; Baghestani 2009b, 2018; Stark
2010). As such, the literature warns market participants and policymakers against using the publicly
available survey forecasts of long-term interest rates for making economic, financial, and policy
decisions. One source of inaccuracy commonly cited is the failure of survey participants in
incorporating useful and relevant information available at the time of the forecast, implying that
there is room for improving the survey forecasts of interest rates (Friedman 1980; Froot 1989;

Accep
ted M
anus
cript
5
MacDonald and MacMillan 1994; Baghestani 2006a; Jongen and Verschoor 2008; Chun 2012;
Miah et al. 2016).
There are a good number of studies in the literature which have investigated the predictive
information content of various economic and financial indicators for interest rates. Baghestani
(2005), for instance, makes use of the predictive information contained in the survey forecasts of
inflation and real output growth to improve the accuracy of survey forecasts of the 3-month
Treasury bill rate. The inflation forecasts are relevant due to the Fisher (1930) equation, which
maintains that the expected nominal interest rate is the sum of the expected real interest rate and
the expected inflation rate. The output growth forecasts are also relevant since changes in growth
expectations can signal future changes in demand and supply of loanable funds and, thus, alter
expectations about real interest rates.
This study adds to the literature by focusing on the forecasts from the Survey of Professional
Forecasters (SPF). Among other indicators, the survey asks participants to provide their forecasts of
the 10-year Treasury rate (TBR), Moody’s Aaa corporate bond rate (Aaa), CPI inflation, and real
GDP growth. Utilizing the consensus (median) forecasts, we set out to examine whether the SPF
and random walk forecast errors of TBR and Aaa are orthogonal to changes in SPF growth and
inflation forecasts, and whether changes in SPF inflation forecasts accurately predict directional
change in both TBR and Aaa. Our findings for 1993-2017 indicate that the SPF and random walk
forecast errors of TBR and Aaa fail to be orthogonal to changes in SPF inflation (but not growth)
forecasts. In addition, changes in SPF inflation forecasts do not accurately predict directional
change in either TBR or Aaa for 1993-2007. In contrast, for 2008-2017 when monetary policy kept
the federal funds rate unusually low, changes in SPF inflation forecasts accurately predict
directional change in both TBR and Aaa at longer forecast horizons. Put together, our findings point
Accep
ted M
anus
cript
6
to the potential usefulness of SPF inflation forecasts for improving the accuracy of both SPF and
random walk forecasts of TBR and Aaa. We proceed by briefly reviewing the related literature.
Section 3 describes the SPF and random walk forecasts. Section 4 presents the forecast evaluation
test results. Section 5 concludes.
2. Literature review
The study by Pesando (1979) demonstrates the notion that, under the pure expectations
model with time-invariant term premium, long-term interest rates approximately follow a
random walk. To keep it simple, we focus on the relationship between the long-term interest rate
on an m-period bond at time t (Rmt) and a one-period short-term interest rate at time t (rt), derived
by Reichenstein (2006, p. 117),
Et[R
mt+1] – Rm
t = (1/m).[rt+m – rt]
where Et[R
mt+1] is the long-term interest rate in t+1 expected at time t, and rt+m is the short-term
interest rate in t+m expected at time t. With m = 40 quarters for the 10-year Treasury rate, the
right-hand side term is close to zero, which means that the future 10-year Treasury rate is
expected to be approximately today’s rate. It follows that, under the efficient market hypothesis,
today’s long-term rate rapidly and fully reflects all relevant information so that future rate
changes deviate from zero only in response to unexpected shocks. As for short-term interest
rates, Pesando (1979) notes that market efficiency does not necessarily imply that such rates
follow a random walk behavior. Brooks and Gray (2004), Mitchell and Pearce (2007),
Baghestani (2009b, 2018), Stark (2010), among others, have found that the survey forecasts of
long-term interest rates are inferior to the random walk forecasts. Consistent with the theory,
empirical findings are mixed for the survey forecasts of short-term interest rates. For instance,
Accep
ted M
anus
cript
7
Baghestani et al. (2015) examine the accuracy of the Blue Chip survey forecasts of 3-month Euro
currency rates and 10-year government bond rates for the Eurozone, Australia, Canada, Japan,
Switzerland, the UK, and the US for 1999-2008. They find that nearly half of the short-term
interest rate forecasts are superior to the random walk. However, consistent with the efficient
market hypothesis, the forecasts of long-term interest rates all fail to beat the random walk
benchmark.
Despite the implications of the efficient market hypothesis, the literature contains studies
that have proposed ways for producing accurate forecasts of interest rates. Baghestani (2008b,
2010a, 2017) shows that the predictive information content of both survey-based and model-
based measures of expected inflation can help produce more accurate forecasts of the 10-year
Treasury and the 30-year mortgage rate than the random walk benchmark. Guidolin and
Timmermann (2009) propose a flexible forecast combination approach to generate accurate
forecasts of the US short-term interest rates. They note, “it is important both to combine
information embedded in different forecasts and to allow for nonlinear (regime) dynamics in spot
and forward rates (p. 298). Ghysels and Wright (2009) propose a method to predict the upcoming
SPF quarterly forecasts of output growth, inflation and short-term interest rates. Utilizing daily
observed changes in interest rates, they estimate what the SPF participants would predict if they
were asked to make a forecast each day. Closely related to our goal, however, is the study by
Baghestani (2005) which makes use of the predictive information contained in the survey
forecasts of inflation and real output growth to improve the accuracy of survey forecasts of short-
term interest rates. We add to the literature by investigating the potential usefulness of the
predictive information embedded in the SPF forecasts of real output growth and inflation for
improving the SPF and random walk forecasts of long-term interest rates. This is important

Accep
ted M
anus
cript
8
because the theory suggests that long-term interest rates approximately follow a random walk
(Pesando 1979, 1980; Reichenstein 2006).
Before proceeding further, we briefly discuss the literature findings on the accuracy of survey
forecasts of inflation and real output growth. Ang et al. (2007) compare the accuracy of US inflation
forecasts from four alternative models. These include the univariate ARIMA, Philips curve type,
term structure, and survey-based models (including the Livingston, Michigan, and SPF). They show
that the consensus inflation forecasts from both the Livingston and SPF surveys whose participants
are professional forecasters are superior to the forecasts from the other three non-survey models.
Ang et al. (2007, p. 1165) further note that “even participants in the Michigan survey who are
consumers, not professionals, produce accurate out-of-sample forecasts, which are only slightly
worse than those of the professionals in the Livingston and SPF surveys.”1 Clements (2006)
proposes a number of tools for evaluating probability event forecasts. Using these tools, he shows
that the SPF forecasts of inflation are conditionally efficient against the no-change forecasts. There
are many other studies (including Keane and Runkle 1990, Thomas 1999, Romer and Romer 2000,
and Sims 2002), which directly or indirectly examine the accuracy of SPF inflation forecasts. For
instance, Romer and Romer (2000) show that the Federal Reserve forecasts of inflation are more
informative than the (private) Blue Chip and SPF forecasts. However, for the 1979-1983 period
when the inflation rate was very volatile, Baghestani and Soliman (2009) show that the Michigan
survey forecasts of inflation are more informative than the Federal Reserve forecasts. As for real
GDP (output) growth, Romer and Romer (2000) find weak evidence in support of the notion that
the Federal Reserve forecasts are more informative than the Blue Chip and SPF growth forecasts.
Consistent with these results, Baghestani (2014b) finds that the SPF forecasts closely replicate the 1 The inflation forecasts from the Michigan survey of consumers have been shown to contain
useful predictive information for energy prices (See, among others, Baghestani 2014a, 2015).
Accep
ted M
anus
cript
9
Federal Reserve growth forecasts. Aretz and Peel (2010) show that the SPF growth forecasts
efficiently embody the information in the term structure spread, when allowing for the forecasters’
loss functions to become more negatively skewed with the forecast horizon. Focusing on the 1969-
2003 period, Campbell (2007, p. 199) maintains, “The SPF forecasts reveal that the period of the
great moderation represents a moderation in volatility, uncertainty and, more importantly,
predictability. Before 1984, professional forecasters were considerably more adept than a simple
autoregressive model at forecasting future growth. After 1984, the two sets of forecasts are roughly
comparable.” There are also studies that investigate the accuracy of the SPF forecasts of the
components of real GDP. See, among others, Baghestani (1994, 2006b, 2011, 2012) which focus on
real net exports and growth in real business and residential investment forecasts.
3. SPF and random walk forecasts
In 1968, the American Statistical Association and the National Bureau of Economic
Research (ASA-NBER) initiated the Survey of Professional Forecasters (SPF) to collect
quarterly forecasts of several US macroeconomic and financial indicators. The survey, currently
conducted by the research department of the Federal Reserve Bank of Philadelphia, added TBR
to the list of indicators starting with the first quarter of 1992. As such, in this study, we utilize the
SPF forecasts made in 1992 onward.
Around the middle of every quarter, the survey asks leading forecasting firms for their
forecasts for the current (survey) quarter, and for the upcoming four quarters. Utilizing the
individual responses, the survey then calculates the consensus (both mean and median) forecasts
and releases them sometime before the end of the second month of the survey quarter. In line
with other studies, we utilize the SPF consensus forecasts calculated as the median response of
the individual forecasts. See Croushore (1993) for detailed information on the SPF.
Accep
ted M
anus
cript
10
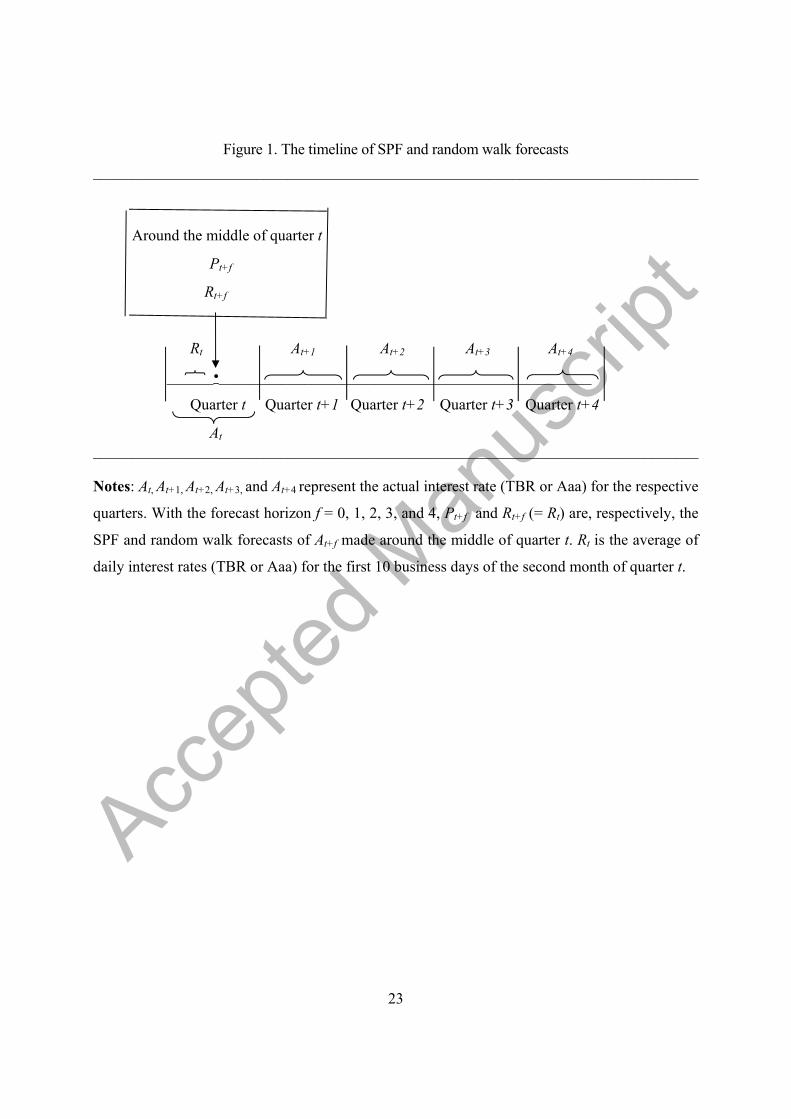
Figure 1 presents the timeline of the forecasts. As noted, At, At+1, At+2, At+3, and At+4 are the
actual interest rates (TBR or Aaa) for the respective quarters. With the forecast horizon f = 0, 1,
2, 3, and 4, Pt+f is the SPF forecast of At+f made around the middle of quarter t. In addition, we
let Rt denote the most recent actual rate known at the time of the forecast, calculated as the
average of the rates belonging to the first 10 days of the second month of the survey quarter.
Then, Rt+f (= Rt) represents the comparable random walk forecast of At+f made around the
middle of quarter t. Furthermore, we calculate the SPF (random walk) forecast of default spread
as the SPF (random walk) forecast of Aaa minus the SPF (random walk) forecast of TBR.2
We focus on the SPF and random walk forecasts of TBR and Aaa that are made in the first
quarter of 1992 through the fourth quarter of 2017 (1992Q1-2017Q4). As such, the sample periods
for the current-quarter, one-, two-, three-, and four-quarter-ahead forecasts are, respectively,
1992Q1-2017Q4, 1992Q2-2018Q1, 1992Q3-2018Q2, 1992Q4-2018Q3, and 1993Q1-2018Q4. For
simplicity, however, we use a single period (1993Q1-2017Q4) for evaluating the forecasts of TBR,
Aaa, and default spread at all horizons.
4. Forecast evaluation test results
In this section, we focus on answering the following five questions:
1. Are SPF forecasts of TBR, Aaa, and default spread free of systematic bias?
2. Do SPF forecasts of TBR, Aaa, and default spread beat the random walk benchmark?
3. Are SPF forecasts of TBR, Aaa, and default spread directionally accurate?
2 The actual quarterly data on both TBR and Aaa are averages of daily rates from the Federal
Reserve Bank of St. Louis database (https://fred.stlouisfed.org). The SPF forecasts of TBR, Aaa, CPI
inflation, and output (real GDP) growth come from the Federal Reserve Bank of Philadelphia
database (https://www.philadelphiafed.org).

Accep
ted M
anus
cript
11
4. Are TBR and Aaa forecast errors orthogonal to SPF growth and inflation forecasts?
5. Do SPF inflation forecasts have directional predictive power for TBR and Aaa?
We answer the first four questions for the 1993Q1-2017Q4 period and the last question for the
two sub-periods of 1993Q1-2007Q4 and 2008Q1-2017Q4. During the latter period (which
includes the 2008 global financial crisis), monetary policy kept the federal funds rate unusually
low. Both Swanson and Williams (2014) and Gilchrist et al. (2015) explore the changing
behavior of long-term interest rates when the target federal funds rate hits the zero lower bound.
Jarrow and Li (2014) further show that the Federal Reserve’s quantitative easing reduced both
the short- and long-term (< 12 years) forward rates.
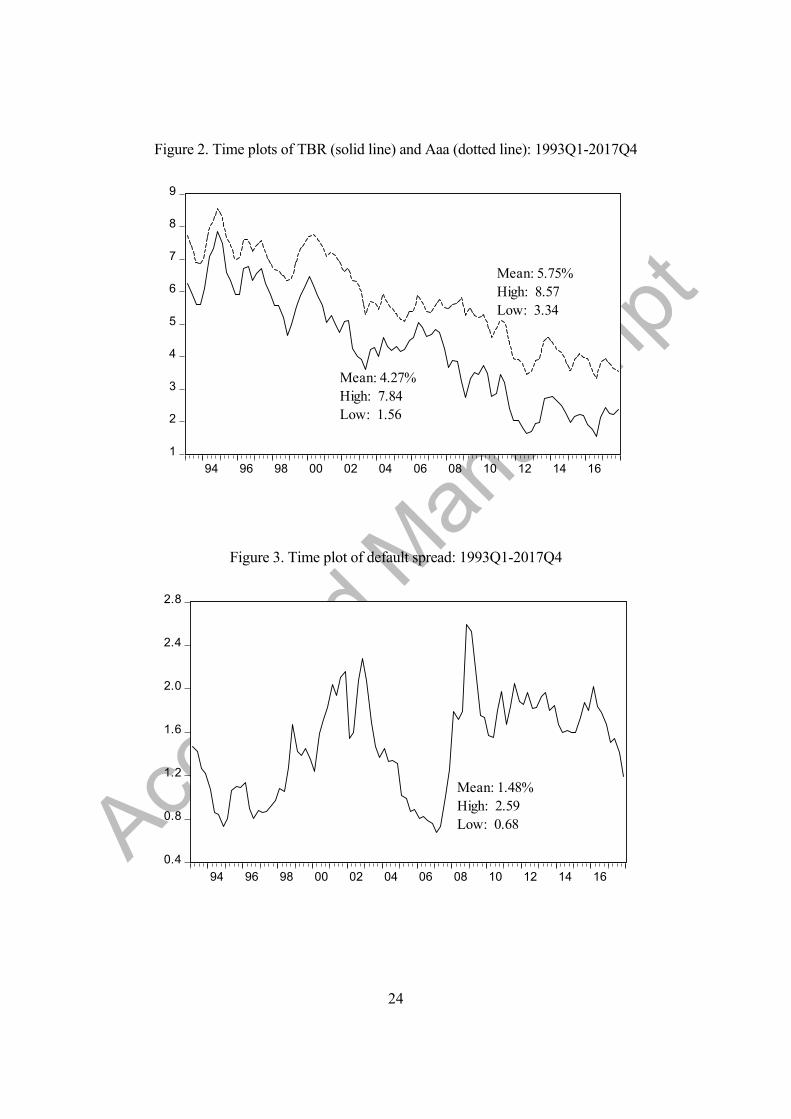
Figure 2 plots the actual TBR and Aaa for 1993Q1-2017Q4. As indicated, TBR has a mean
rate of 4.27% with a high (low) rate of 7.84 (1.56), and Aaa has a mean rate of 5.75% with a high
(low) rate of 8.57 (3.34). Additionally, Figure 3 plots the actual default spread (Aaa – TBR) for
1993Q1-2017Q4. As indicated, the spread has a mean rate of 1.48% with a high (low) rate of 2.59
(0.68).
4.1. Are SPF forecasts of TBR, Aaa, and default spread free of systematic bias?
In answering, we estimate the following test equation,
(At+f – Pt+f) = α + ut+f (1)
where (At+f – Pt+f) is the SPF forecast error, and α is the population mean forecast error (ME).
The forecast (Pt+f) is free of systematic bias if we cannot reject the null hypothesis that α = 0.
Since the forecasts are made in the middle of quarter t, the error term (ut+f) may follow an f th-
Accep
ted M
anus
cript
12
order moving average process under the null hypothesis of rationality.3 In addition, the forecast
errors are generally heteroscedastic due to unforeseen shocks. Accordingly, we estimate
Equation (1) for f = 0 using the White (1980) procedure, which accounts for the
heteroscedasticity in the error term and, thus, yields the correct standard error. In estimating
Equation (1) for f = 1, 2, 3, and 4, however, we obtain the correct standard errors by using the
Newey-West (1987) procedure, which accounts for both the heteroscedasticity and the inherent f
th-order serial correlation in the error term.
Column 1 (rows 1-10) of Table 1 reports the OLS estimates of Equation (1) along with the
absolute t-values (calculated using the correct standard errors) for TBR and Aaa. As shown by
superscript a, we reject the null hypothesis that the population mean forecast error (α = ME)
equals zero, meaning that the SPF forecasts of TBR and Aaa fail to be free of systematic bias.
Consistent with these results, the absolute ME for each forecast, ranging from 0.054 to 0.617, is
large compared to the mean absolute forecast error (MAE) in column 2, which ranges from 0.129
to 0.867. Column 1 (rows 11-15) further reports the OLS estimates of Equation (1) along with
the correct absolute t-values for the SPF forecasts of the default spread (Aaa – TBR). The SPF
spread forecasts for f = 0, 1, and 2 are free of systematic bias, but, as shown by superscript a, the
ones for f = 3 and 4 tend to significantly under-predict the actual spread.
4.2. Do SPF forecasts of TBR, Aaa, and default spread beat the random walk benchmark?
In answering, we calculate Theil’s U coefficient defined as the mean squared error (MSE) of
the SPF forecast divided by the MSE of the random walk forecast. Column 3 (rows 1-10) of
3 When making the four-quarter-ahead forecast, for instance, ut+3, ut+2, ut+1, and ut are not
yet known at the time of the forecast and, as such, we cannot rule out the possibility that ut+4 is
correlated with ut+3, ut+2, ut+1, and ut under the null hypothesis of rationality.
Accep
ted M
anus
cript
13
Table 1 reports the U coefficient estimates for both TBR and Aaa. As can be seen, these
estimates, ranging from 1.44 to 2.12, are all above one. We use the Diebold-Mariano (1995) test
to examine the null hypothesis that the MSE of SPF forecast equals the MSE of the random walk
forecast. As shown by superscript b, we reject the null hypothesis of equal forecast accuracy,
meaning that the SPF forecasts of TBR and Aaa are all significantly less accurate than the
random walk forecasts. With the U coefficient estimate of 1.63 in row 11, the same is true for the
current-quarter forecast of the spread. However, for the one- through four-quarter-ahead SPF
forecasts of the spread in rows 12-15, the U coefficient estimates range from 1.08 to 1.12, and
we cannot reject the null hypothesis of equal forecast accuracy. Put together, we conclude that
the SPF forecasts of TBR, Aaa, and default spread all fail to beat the random walk benchmark in
terms of the MSE.
4.3. Are SPF forecasts of TBR, Aaa, and default spread directionally accurate?
In answering this question, we define the actual change as (At+f – Rt) and the SPF predicted
change as (Pt+f – Rt). Column 4 of Table 1 reports the accuracy rate (π), which is calculated as the
number of quarters in which (At+f – Rt) and (Pt+f – Rt) have the same sign divided by the sample
size. In line with Greer (1999), we use the proportion test to see whether the accuracy rate of SPF
forecasts is significantly greater than the 50% benchmark that one expects from tossing a fair
coin to predict directional change. As can be seen, π is above 0.50 only for the forecasts in rows
1, 6, and 11-15. Among these forecasts, as shown by superscript c, we reject the null hypothesis
of π = 0.50 in favor of the alternative that π > 0.50 only for the current-quarter forecast of the
spread in row 11. The remaining forecasts fail to accurately predict directional change.
4.4. Are TBR and Aaa forecast errors orthogonal to SPF growth and inflation forecasts?

Accep
ted M
anus
cript
14
Orthogonality means that the forecast error is uncorrelated with the relevant information
available at the time of the forecast. This occurs when the forecasters efficiently utilize all
available relevant information. In answering, we thus estimate the following test equation,
(At+f – Pt+f) = α + β (Yt+f – t-1Yt+f) + γ (It+f – t-1It+f) + ut+f (2)
where (At+f – Pt+f) represents the SPF forecast error of TBR and Aaa, Yt+f (t-1Yt+f) is the SPF
forecast of output growth made in the middle of quarter t (quarter t-1), and It+f (t-1It+f) is the SPF
inflation forecast made in the middle of quarter t (quarter t-1). Failure to reject the null
hypothesis that β = 0 (γ = 0) means that the SPF forecast error (At+f – Pt+f) is not orthogonal to
the change in SPF output growth (inflation) forecasts known at the time of the forecast.
Rows 1-10 of Table 2 report the OLS estimates of Equation (2) along with the correct
absolute t-values for both TBR and Aaa for 1993Q1-2017Q4. As can be seen for all forecasts in
rows 1-10, we reject the null hypothesis that γ = 0, but we cannot reject the null hypothesis that β
= 0. This means that the SPF forecast errors of TBR and Aaa are all orthogonal to the change in
SPF output growth forecasts, but fail to be orthogonal to the change in SPF inflation forecasts.
Such evidence suggests that the change in SPF inflation forecasts contains useful information for
improving the accuracy of the SPF forecasts of TBR and Aaa.
To augment these results, we further investigate whether the random walk forecast errors of
TBR and Aaa are orthogonal to changes in SPF growth and inflation forecasts by estimating the
following test equation,
(At+f – Rt+f) = α + β (Yt+f – t-1Yt+f)+ γ (It+f – t-1It+f) + ut+f (3)
where (At+f – Rt+f) represents the random walk forecast error of TBR and Aaa. Rows 11-20 of
Table 2 report the OLS estimates of Equation (3) along with the correct absolute t-values for

Accep
ted M
anus
cript
15
both TBR and Aaa for 1993Q1-2017Q4. As can be seen for these forecasts, we cannot reject the
null hypothesis that β = 0. This means that the random walk forecast errors of TBR and Aaa are
all orthogonal to the change in SPF output growth forecasts. However, for the forecasts in rows
12-14 and 17-20, we reject the null hypothesis that γ = 0. Such findings point to the potential
usefulness of SPF inflation forecasts in improving the accuracy of both the one- through three-
quarter-ahead random walk forecasts of TBR and the one- through four-quarter-ahead random
walk forecasts of Aaa.
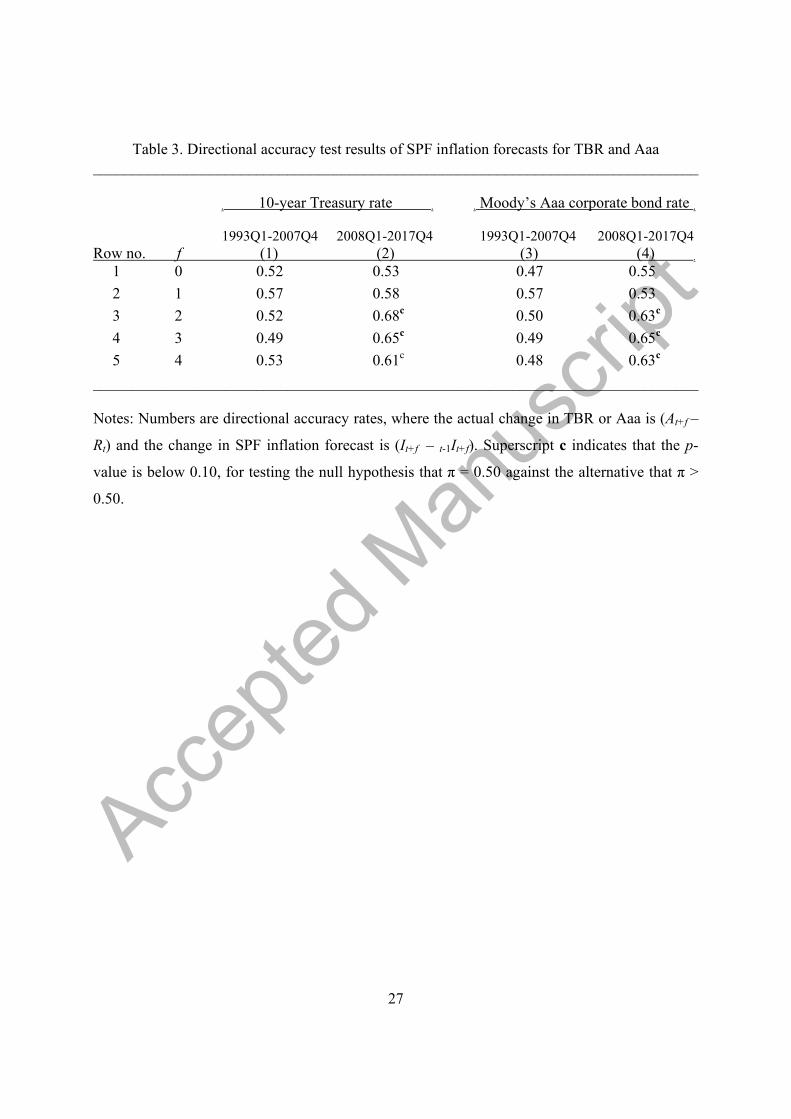
4.5. Do SPF inflation forecasts have directional predictive power for TBR and Aaa?
Following the orthogonality test results in rows 11-20 of Table 2, we now want to see
whether the change in SPF inflation forecasts accurately predicts the direction of change in TBR
and Aaa. We define the actual change in TBR and Aaa as (At+f – Rt) and the change in SPF
inflation forecast as (It+f – t-1It+f). We calculate the directional accuracy rate as the number of
quarters in which (At+f – Rt) and (It+f – t-1It+f) have the same sign divided by the sample size.
Table 3 reports the results for TBR (Aaa) in column 1 (column 3) for 1993Q1-2007Q4, and in
column 2 (column 4) for 2008Q1-2017Q4. Again, we use the proportion test to see whether the
accuracy rate is significantly greater than the 50% benchmark that one expects from tossing a
fair coin to predict the direction of change (Greer, 1999). As can be seen in columns 1 and 3 for
1993Q1-2007Q4, π (ranging from 0.47 to 0.57) is not significantly differently from 0.50. As
shown in columns 2 and 4, the same is true for the current-quarter and one-quarter-ahead
forecasts of TBR and Aaa for 2008Q1-2017Q4. For the two-, three-, and four-quarter-ahead
forecasts of TBR and Aaa in rows 3-5 (columns 2 and 4), however, π ranges from 0.61 to 0.68.
For these forecasts, as shown by superscript c, we reject the null hypothesis of π = 0.50 in favor
of the alternative that π > 0.50. As such, we conclude that changes in SPF inflation forecasts

Accep
ted M
anus
cript
16
accurately predict directional change in both TBR and Aaa at longer forecast horizons only for
2008-2017.
5. Conclusions
Diebold and Lopez (1996) point out that, for many economic and financial indicators, a
random walk forecast is not necessarily a naïve forecast. This is especially true for long-term
interest rates and exchange rates (Rossi 2013).4 With this in mind, our findings for 1993-2017
indicate that the SPF forecasts of the 10-year Treasury rate (TBR) and Moody’s Aaa corporate
bond rate (Aaa) are biased and fail to beat the random walk benchmark. These forecasts are also
directionally inaccurate and, thus, are not of value to a user (Stekler 1994; Leitch and Tanner
1991). Such evidence is consistent with Kolb and Stekler (1996), Greer (1999, 2003), and Cho
(1996) who find little or no evidence indicating that survey forecasts of long-term interest rates
are directionally accurate. Further examination indicates that the SPF default spread (Aaa - TBR)
forecasts fail to beat the random walk benchmark and are directionally inaccurate. Such findings
are consistent with Baghestani (2009b) who examines the Blue Chip forecasts of the default
spread.5
4 For instance, in line with Reichenstein (2006), Baghestani (2008a) shows that the random
walk forecasts of the US 30-year mortgage rate for 1987-2006 are rational. Baghestani (2009a)
reaches a similar conclusion for the random walk forecasts of the dollar/euro for 1999-2007 and
the dollar/pound for 1971-2007.
5 The literature generally reports favorable results for the survey forecasts of term spreads
(defined as the difference between long-term and short-term interest rates), interbank loan
spreads (defined as the 3-month London interbank offered rate and the federal funds rate), and
mortgage spreads (defined as the difference between the 30-year mortgage and 10-year Treasury
rates). See, among others, Baghestani (2009c, 2010b, and 2018).

Accep
ted M
anus
cript
17
One source of inaccuracy commonly cited in the literature is the failure of survey participants
to incorporate useful and relevant information available at the time of the forecast. This implies that
there is room for improving the survey forecasts of interest rates. Baghestani (2005) shows that the
predictive information contained in the survey forecasts of inflation and output growth can help
improve the accuracy of survey forecasts of the 3-month Treasury rates. Motivated by such
evidence, we examine whether the TBR and Aaa forecast errors are orthogonal to changes in SPF
inflation and output growth forecasts. Our findings for 1993-2017 indicate that the SPF forecast
errors of TBR and Aaa fail to be orthogonal to changes in SPF inflation (but not growth) forecasts.
Further examination also indicates that the random walk forecast errors of TBR and Aaa generally
fail to be orthogonal to changes in SPF inflation (but not growth) forecasts.
Given the latter orthogonality test results, we further examine whether changes in SPF inflation
forecasts accurately predict the direction of change in TBR and Aaa for the two sub-periods of
1993-2007 and 2008-2017. Our findings for 1993-2007 indicate that changes in SPF inflation
forecasts do not accurately predict directional change in either TBR or Aaa. However, for 2008-
2017 when monetary policy kept the federal funds rate unusually low, changes in SPF inflation
forecasts accurately predicted directional change in both TBR and Aaa at longer forecast horizons.
Put together, our findings point to the potential usefulness of SPF inflation forecasts for improving
the accuracy of both SPF and random walk forecasts of TBR and Aaa. Equally important, our
results indicate that changes in SPF inflation forecasts accurately predict directional change in both
TBR and Aaa at longer forecast horizons for 2008-2017 (but not for 1993-2007). These latter
findings raise the question of whether long-term interest rates have become easier to predict, which
deserves subsequent research.

Accep
ted M
anus
cript
18
References
Ang, A., G. Bekaert, and M. Wei (2007) Do macro variables, asset markets, or surveys forecast
inflation better? Journal of Monetary Economics, 54, 1163-1212.
Aretz, K. and D.A. Peel (2010) Spreads versus professional forecasters as predictors of future
output change. Journal of Forecasting 29, 517-522.
Baghestani, H. (1994) Evaluating multiperiod survey forecasts of real net exports. Economics
Letters 44, 267-272.
Baghestani, H. (2005) Improving the accuracy of recent survey forecasts of the T-bill rate.
Business Economics 40, 36-40.
Baghestani, H. (2006a) An evaluation of the professional forecasts of US long-term interest
rates. Review of Financial Economics 15, 177-191.
Baghestani, H. (2006b) Federal Reserve vs. private forecasts of real net exports. Economics Letters
91, 349-353.
Baghestani, H. (2008a) A random walk approach to predicting U.S. 30-year home mortgage rates.
Journal of Housing Economics 17, 225-233.
Baghestani, H. (2008b) Consensus vs. time-series forecasts of U.S. 30-year mortgage rates.
Journal of Property Research 25, 45-60.
Baghestani, H. (2009a) Evaluating random walk forecasts of exchange rates. Studies in Economics
and Finance 26, 171-181.
Baghestani, H. (2009b) Forecasting in efficient bond markets: Do experts know better?
International Review of Economics and Finance 18, 624-630.
Baghestani, H. (2009c) Survey evidence on forecast accuracy of term spreads. Review of
Financial Economics 18, 156-162.
Baghestani, H. (2010a) Forecasting the ten-year U.S. Treasury rate. Journal of Forecasting 29,
673-688.
Accep
ted M
anus
cript
19
Baghestani, H. (2010b) How well do experts predict interbank loan rates and spreads? Economics
Letters 109, 4-6.
Baghestani, H. (2011) Federal Reserve and private forecasts of growth in investment. Journal of
Economics and Business 63, 290-305.
Baghestani, H. (2012) Are professional forecasts of growth in U.S. business investment rational?
Economics Letters 114, 132-135.
Baghestani, H. (2014a) Inflation expectations and energy price forecasting. OPEC Energy
Review 38, 21-35.
Baghestani, H. (2014b) On the loss structure of Federal Reserve forecasts of output growth.
Journal of Economics and Finance 38, 518-527.
Baghestani, H. (2015) Predicting gasoline prices using Michigan survey data. Energy Economics
50, 27-32.
Baghestani, H. (2017) Do US consumer survey data help beat the random walk in forecasting
mortgage rates? Cogent Economics & Finance 5, 1343017.
Baghestani, H. (2018) On accuracy of survey forecasts of US mortgage spread. Cogent Economics
& Finance 6, 1-10.
Baghestani, H., M. Arzaghi, and I. Kaya (2015) On the accuracy of Blue Chip forecasts of
interest rates and country risk premiums. Applied Economics 46, 113-122.
Baghestani, H. and M. Soliman (2009) Federal Reserve vs. consumer forecasts of inflation:
1979-1983. Applied Economics Letters 16, 1565-1568.
Brooks, R. and J.B. Gray (2004) History of the forecasters: Naïve forecasts are better than the
consensus WSJ forecasts. Journal of Portfolio Management 30, 113-117.
Campbell, S.D. (2007) Macroeconomic volatility, predictability, and uncertainty in the great
moderation: Evidence from the Survey of Professional Forecasters. Journal of Business &
Economic Statistics 25, 191-200.

Accep
ted M
anus
cript
20
Cho, D.W. (1996) Forecast accuracy: Are some business economists consistently better than
others? Business Economics 31, 45-49.
Chun, A.L. (2012) Forecasting interest rates and inflation: Blue Chip clairvoyants or
econometrics? Available at: http://papers.ssrn.com/sol3/papers.cfm?abstract_id=946667
(accessed July 20, 2018).
Clements, M. P. (2006). Evaluating the Survey of Professional Forecasters probability
distributions of expected inflation based on derived event probability forecasts. Empirical
Economics 31, 49-64.
Croushore, D.D. (1993) Introducing: The survey of professional forecasters. Business Review-
Federal Reserve Bank of Philadelphia 6, 3-15.
Diebold, F.X. and R.S. Mariano (1995) Comparing predictive accuracy. Journal of Business &
Economic Statistics 13, 253-263.
Diebold, F. X. and J.A. Lopez (1996) Forecast evaluation and combination, in Statistical
Methods in Finance, Maddala, G.S. and Roa, C.R. (Eds), Vol. 14, North-Holland,
Amsterdam, pp. 241-68.
Fisher, I. (1930) The Theory of Interest (Macmillan Press, New York).
Friedman, B.M. (1980) Survey evidence on the “rationality” of interest rate expectations.
Journal of Monetary Economics 6, 453-465.
Froot, K.A. (1989) New hope for the expectations hypothesis of the term structure of interest
rates. The Journal of Finance 44, 283-305.
Ghysels, E., and J.H. Wright (2009) Forecasting professional forecasters. Journal of Business &
Economic Statistics 27, 504-516.
Gilchrist, S., D. López-Salido, and E. Zakrajšek (2015) Monetary policy and real borrowing
costs at the zero lower bound. American Economic Journal: Macroeconomics 7, 77-109.
Greer, M.R. (1999) Assessing the soothsayers: An examination of the track record of
macroeconomic forecasting. Journal of Economic Issues 33, 77-94.
Accep
ted M
anus
cript
21
Greer, M. (2003) Directional accuracy tests of long-term interest rate forecasts. International
Journal of Forecasting 19, 291-298.
Guidolin, M. and A. Timmermann (2009) Forecasts of US short-term interest rates: A flexible
forecast combination approach. Journal of Econometrics 150(2), 297-311.
Jarrow, R. and H. Li (2014) The impact of quantitative easing on the US term structure of
interest rates. Review of Derivatives Research 17, 287-321.
Jongen, R. and W.F. Verschoor (2008) Further evidence on the rationality of interest rate
expectations. Journal of International Financial Markets, Institutions and Money, 18, 438-
448.
Keane, M.P. and D.E. Runkle (1990) Testing the rationality of price forecasts: New evidence
from panel data. The American Economic Review 80, 714-735.
Kolb, R.A. and H.O. Stekler (1996) How well do analysts forecast interest rates? Journal of
Forecasting 15, 385-394.
Leitch, G., and J.E. Tanner (1991) Economic forecast evaluation: Profits versus the conventional
error measures. The American Economic Review, 580-590.
MacDonald, R. and P. Macmillan (1994) On the expectations view of the term structure, term
premia and survey-based expectations. The Economic Journal 104, 1070-1086.
Miah, F., A.A. Khalifa, and S. Hammoudeh (2016) Further evidence on the rationality of interest
rate expectations: A comprehensive study of developed and emerging economies. Economic
Modelling 54, 574-590.
Mitchell, K. and D. Pearce (2007) Professional forecasts of interest rates and exchange rates:
Evidence from the Wall Street Journal’s panel of economists. Journal of Macroeconomics
29(4), 840-854.
Newey, W.K. and K.D. West (1987) A simple, positive definite, heteroscedasticity and
autocorrelation consistent covariance matrix. Econometrica, 55, 703-708.
Accep
ted M
anus
cript
22
Pesando, J.E. (1979) On the random walk characteristics of short- and long-term interest rates in an
efficient market. Journal of Money, Credit, and Banking 11, 457-466.
Pesando, J.E. (1980) On forecasting long-term interest rates: Is the success of the no-change
prediction surprising? Journal of Finance 35, 1045-1047.
Reichenstein, W. (2006) Rationality of naïve forecasts of long-term rates. Journal of Portfolio
Management 32, 116-119.
Romer, C.D. and D.H. Romer (2000) Federal Reserve information and the behavior of interest
rates. American Economic Review 90, 429-457.
Rossi, B. (2013) Exchange rate predictability. Journal of Economic Literature 51, 1063-1119.
Stark, T. (2010) Realistic evaluation of real-time forecasts in the Survey of Professional Forecasters.
Federal Reserve Bank of Philadelphia Research Rap, Special Report, 1.
Stekler, H.O. (1994) Are economic forecasts valuable? Journal of Forecasting 13, 495-505.
Swanson, E.T. and J.C. Williams (2014) Measuring the effect of the zero lower bound on medium-
and longer-term interest rates. American Economic Review 104, 3154-85.
Thomas, L.B. (1999) Survey measures of expected US inflation. Journal of Economic Perspectives
13, 125-144.
White, H. (1980) A heteroskedasticity-consistent covariance matrix estimator and a direct test for
heteroskedasticity. Econometrica 48, 817-838.
Accep
ted M
anus
cript
23
Figure 1. The timeline of SPF and random walk forecasts
______________________________________________________________________________
Around the middle of quarter t
Pt+f
Rt+f
Rt At+1 At+2 At+3 At+4
______•________________________________________________
Quarter t Quarter t+1 Quarter t+2 Quarter t+3 Quarter t+4
At ______________________________________________________________________________ Notes: At, At+1, At+2, At+3, and At+4 represent the actual interest rate (TBR or Aaa) for the respective
quarters. With the forecast horizon f = 0, 1, 2, 3, and 4, Pt+f and Rt+f (= Rt) are, respectively, the
SPF and random walk forecasts of At+f made around the middle of quarter t. Rt is the average of
daily interest rates (TBR or Aaa) for the first 10 business days of the second month of quarter t.
Accep
ted M
anus
cript
24
Figure 2. Time plots of TBR (solid line) and Aaa (dotted line): 1993Q1-2017Q4
1
2
3
4
5
6
7
8
9
94 96 98 00 02 04 06 08 10 12 14 16
Mean: 4.27%High: 7.84Low: 1.56
Mean: 5.75%High: 8.57Low: 3.34
Figure 3. Time plot of default spread: 1993Q1-2017Q4
0.4
0.8
1.2
1.6
2.0
2.4
2.8
94 96 98 00 02 04 06 08 10 12 14 16
Mean: 1.48%High: 2.59Low: 0.68

Accep
ted M
anus
cript
25
. Table 1. SPF forecast accuracy test results: 1993Q1-2017Q4 . (At+f – Pt+f) = α + ut+f
α (= ME) MAE U π Row no. f (1) (2) (3) (4) . 10-year Treasury rate 1 0 -0.061a (3.64) 0.140 1.58b 0.52
2 1 -0.202a (4.03) 0.445 1.47b 0.33
3 2 -0.338a (4.06) 0.613 1.44b 0.42
4 3 -0.478a (4.32) 0.749 1.49b 0.44
5 4 -0.617a (4.75) 0.867 1.49b 0.44
Moody’s Aaa corporate bond rate 6 0 -0.054a (3.50) 0.129 2.12b 0.55
7 1 -0.172a (4.30) 0.362 1.58b 0.36
8 2 -0.284a (4.13) 0.512 1.53b 0.43
9 3 -0.384a (4.15) 0.611 1.53b 0.44
10 4 -0.491a (4.45) 0.705 1.56b 0.43 Default spread 11 0 0.007 (0.70) 0.070 1.63b 0.60c
12 1 0.030 (1.18) 0.188 1.12 0.55
13 2 0.054 (1.28) 0.259 1.06 0.55
14 3 0.094a (1.65) 0.308 1.07 0.51
15 4 0.126a (1.82) 0.332 1.08 0.54
______________________________________________________________________________
Notes: At+f is the actual rate in quarter t+f and Pt+f is the SPF forecast of At+f. Numbers in
parentheses are the absolute t-values (calculated using the correct standard errors). Superscript a
indicates significance at the 10% or lower level. ME is the mean forecast error, and MAE is the
mean absolute forecast error. Theil’s U coefficient is calculated as the MSE of the SPF forecast
divided by the MSE of the random walk forecast. Superscript b indicates that the p-value of the
Diebold-Mariano (1995) test, which examines the null hypothesis that the MSE of SPF forecast
equals the MSE of random walk forecast, is below 0.10. π is the directional accuracy rate, where
the actual change in interest rates is (At+f – Rt) and the SPF predicted change is (Pt+f – Rt).
Superscript c indicates that the p-value is below 0.10, for testing the null hypothesis that π = 0.50
against the alternative that π > 0.50.

Accep
ted M
anus
cript
26
Table 2. Orthogonality test results: 1993Q1-2017Q4 ______________________________________________________________________________ Row no. f α β γ R2 . Panel A: SPF forecasts errors: (At+f – Pt+f) = α + β (Yt+f – t-1Yt+f)+ γ (It+f – t-1It+f) + ut+f 10-year Treasury rate 1 0 -0.062a (3.99) -0.007 (0.63) 0.036a (3.65) 0.14
2 1 -0.206a (4.17) -0.009 (0.27) 0.080a (4.12) 0.09
3 2 -0.348a (4.13) -0.001 (0.03) 0.102a (3.16) 0.09
4 3 -0.494a (4.32) -0.003 (0.06) 0.100a (2.48) 0.06
5 4 -0.625a (4.68) -0.022 (0.46) 0.081a (1.88) 0.03
Moody’s Aaa corporate bond rate 6 0 -0.056a (3.79) -0.016 (1.58) 0.028a (3.73) 0.11
7 1 -0.171a (4.36) -0.037 (1.54) 0.059a (3.89) 0.08
8 2 -0.282a (4.08) -0.042 (1.17) 0.078a (2.78) 0.08
9 3 -0.386a (4.03) -0.036 (0.83) 0.081a (2.32) 0.06
10 4 -0.487a (4.25) -0.048 (1.14) 0.073a (1.94) 0.05
Panel B: Random walk forecasts errors: (At+f – Rt+f) = α + β (Yt+f – t-1Yt+f)+ γ (It+f – t-1It+f) + ut+f
10-year Treasury rate 11 0 -0.027a (2.02) -0.008 (0.85) 0.019 (1.25) 0.06
12 1 -0.077a (1.75) 0.007 (0.25) 0.062a (3.33) 0.08
13 2 -0.130a (1.79) 0.059 (1.47) 0.067a (2.21) 0.10
14 3 -0.189a (1.90) 0.066 (1.41) 0.065a (1.65) 0.07
15 4 -0.234a (1.94) 0.068 (1.39) 0.044 (1.16) 0.05
Moody’s Aaa corporate bond rate 16 0 -0.011 (1.00) -0.003 (0.42) 0.018 (1.44) 0.08
17 1 -0.057a (1.68) -0.019 (0.86) 0.050a (2.85) 0.08
18 2 -0.104a (1.74) -0.013 (0.41) 0.060a (2.29) 0.05
19 3 -0.152a (1.86) -0.016 (0.43) 0.064a (1.99) 0.04
20 4 -0.195a (1.99) -0.026 (0.67) 0.058a (1.95) 0.03
______________________________________________________________________________ Notes: See the notes in Table 1. (At+f – Pt+f) is the SPF forecast error and (At+f – Rt+f) is the
random walk forecast error. (Yt+f – t-1Yt+f) is the change in SPF forecast of output (real GDP)
growth and (It+f – t-1It+f) is the change in SPF forecast of CPI inflation.
Accep
ted M
anus
cript
27
Table 3. Directional accuracy test results of SPF inflation forecasts for TBR and Aaa ______________________________________________________________________________
. 10-year Treasury rate . . Moody’s Aaa corporate bond rate .
1993Q1-2007Q4 2008Q1-2017Q4 1993Q1-2007Q4 2008Q1-2017Q4 Row no. f (1) (2) (3) (4) . 1 0 0.52 0.53 0.47 0.55
2 1 0.57 0.58 0.57 0.53
3 2 0.52 0.68c 0.50 0.63c
4 3 0.49 0.65c 0.49 0.65c
5 4 0.53 0.61c 0.48 0.63c
______________________________________________________________________________ Notes: Numbers are directional accuracy rates, where the actual change in TBR or Aaa is (At+f –
Rt) and the change in SPF inflation forecast is (It+f – t-1It+f). Superscript c indicates that the p-
value is below 0.10, for testing the null hypothesis that π = 0.50 against the alternative that π >
0.50.
Accep
ted M
anus
cript
28
Public Interest Statement
Long-term interest rates are among financial indicators that are inherently difficult to
accurately predict. Theory and empirical evidence both suggest that the best forecast of
the future rate is today’s rate, and researchers warn market participants and policymakers
against using the publicly available survey forecasts of long-term interest rates for
decision-making. To improve the accuracy of survey forecasts of long-term interest rates,
we propose the idea that one should explore the usefulness of the predictive information
contained in the survey forecasts of other theoretically relevant variables such as inflation
and output growth. Focusing on the consensus forecasts from a panel of professional
forecasters, our investigation points to the potential usefulness of survey forecasts of
inflation (but not output growth) for improving the accuracy of both survey and naïve
forecasts of long-term interest rates for 2008-2017. Equally important, our findings
further indicate that changes in the survey forecasts of inflation accurately predict
directional change in long-term interest rates at longer forecast horizons.
About The Author
Hamid Baghestani has a 1982 Ph.D. in Economics from the University of Colorado, Boulder. He is
currently Professor of Economics at the American University of Sharjah, UAE. His research interests
include time-series analysis, macro-econometric modeling and forecasting, energy economics, monetary

Accep
ted M
anus
cript
29
economics, and financial markets. He has published widely on these topics in internationally respected
peer-reviewed journals such as Applied Economics, Energy Economics, Energy Policy, Journal of Business,
Journal of Forecasting, Journal of Industrial Economics, Journal of Macroeconomics, and Oxford Bulletin
of Economics and Statistics.
Related Documents