1 Long Term Incentive Plan (LTIP): Understanding FCF & TSR as key indicators and how we all contribute We choose it all Razón social 00.00.2015 TEF Finance 18 th July 2018

Welcome message from author
This document is posted to help you gain knowledge. Please leave a comment to let me know what you think about it! Share it to your friends and learn new things together.
Transcript
1
Long Term Incentive Plan (LTIP):Understanding FCF & TSR as key indicators
and how we all contribute
We choose it allRazón social
00.00.2015
TEF Finance
18th July 2018
22 2
Index
1. THE BASICS – P&L, FCF, BALANCE SHEET and NET DEBT
2. KEY PERFORMANCE INDICATORS – FCF & TSR
3. UNDERSTANDING TSR and MAIN VALUE DRIVERS
4. ANNEX – PIP/TFSP 2015 PLAN
33
1.#1: The basics: understanding P&L, FCF,
Balance sheet and Net Debt
44 4
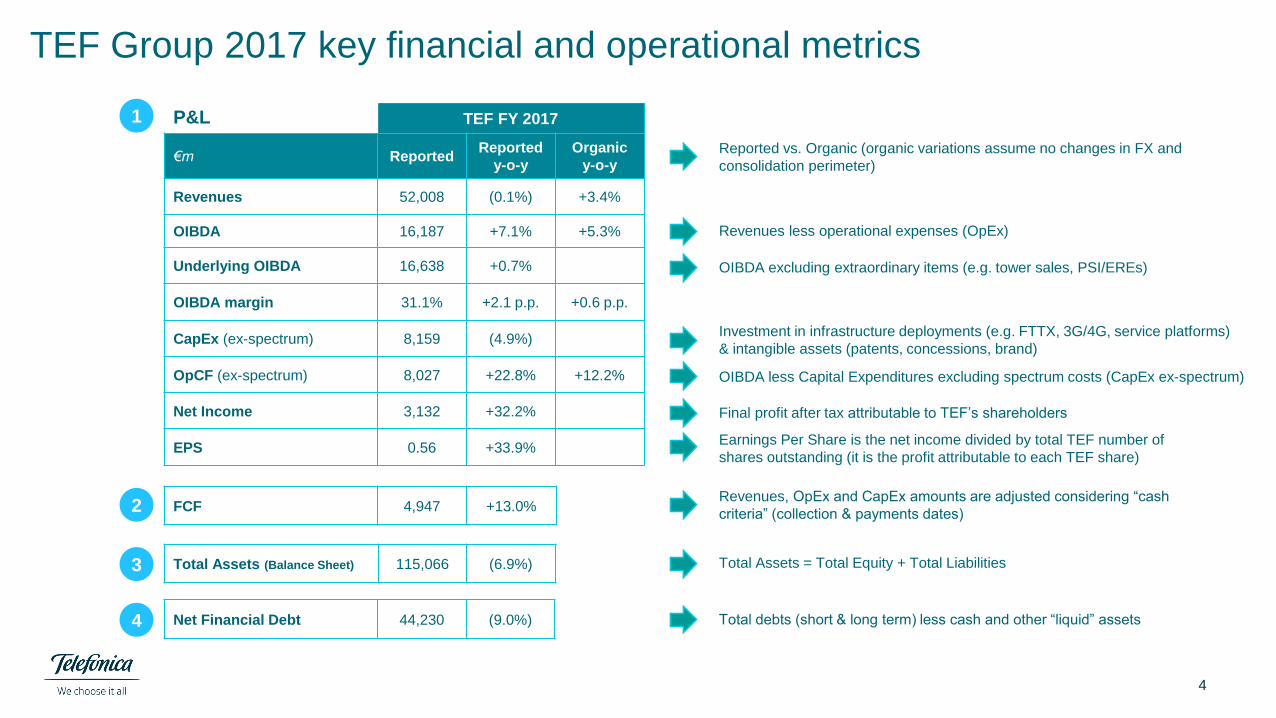
TEF Group 2017 key financial and operational metrics
TEF FY 2017
€m ReportedReported
y-o-y
Organic
y-o-y
Revenues 52,008 (0.1%) +3.4%
OIBDA 16,187 +7.1% +5.3%
Underlying OIBDA 16,638 +0.7%
OIBDA margin 31.1% +2.1 p.p. +0.6 p.p.
CapEx (ex-spectrum) 8,159 (4.9%)
OpCF (ex-spectrum) 8,027 +22.8% +12.2%
Net Income 3,132 +32.2%
EPS 0.56 +33.9%
FCF 4,947 +13.0%
Total Assets (Balance Sheet) 115,066 (6.9%)
OIBDA excluding extraordinary items (e.g. tower sales, PSI/EREs)
Investment in infrastructure deployments (e.g. FTTX, 3G/4G, service platforms)
& intangible assets (patents, concessions, brand)
Revenues less operational expenses (OpEx)
Reported vs. Organic (organic variations assume no changes in FX and
consolidation perimeter)
OIBDA less Capital Expenditures excluding spectrum costs (CapEx ex-spectrum)
Earnings Per Share is the net income divided by total TEF number of
shares outstanding (it is the profit attributable to each TEF share)
Final profit after tax attributable to TEF’s shareholders
1
2
3
Net Financial Debt 44,230 (9.0%)4
P&L
Revenues, OpEx and CapEx amounts are adjusted considering “cash
criteria” (collection & payments dates)
Total Assets = Total Equity + Total Liabilities
Total debts (short & long term) less cash and other “liquid” assets
55
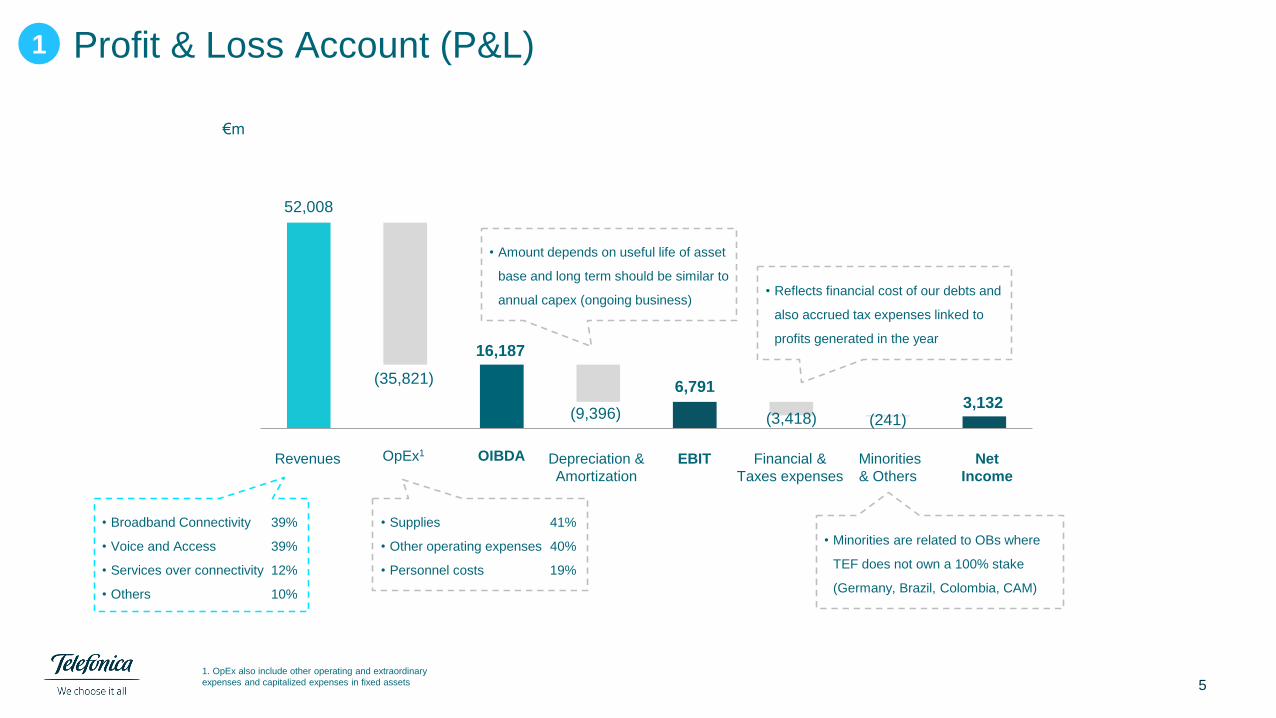
Profit & Loss Account (P&L)1
52,008
16,187
6,7913,132
(35,821)
(9,396) (3,418) (241)
OpEx1Financial &
Taxes expenses
Net
Income
OIBDA Minorities
& Others
Depreciation &
Amortization
EBITRevenues
• Broadband Connectivity
• Voice and Access
• Services over connectivity
• Others
39%
39%
12%
10%
• Supplies
• Other operating expenses
• Personnel costs
41%
40%
19%
1. OpEx also include other operating and extraordinary
expenses and capitalized expenses in fixed assets
• Minorities are related to OBs where
TEF does not own a 100% stake
(Germany, Brazil, Colombia, CAM)
€m
• Amount depends on useful life of asset
base and long term should be similar to
annual capex (ongoing business)• Reflects financial cost of our debts and
also accrued tax expenses linked to
profits generated in the year
66
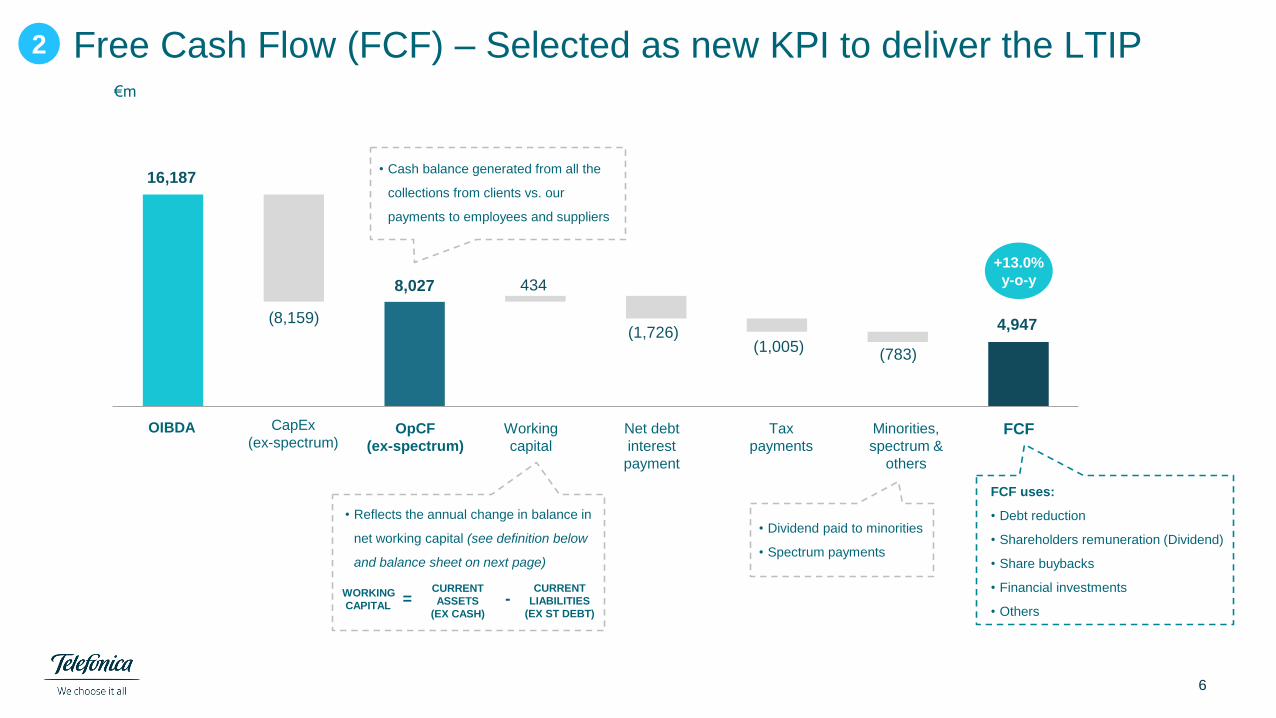
Free Cash Flow (FCF) – Selected as new KPI to deliver the LTIP
(8,159)(1,726)
(1,005)(783)
16,187
8,027
4,947
Net debt
interest
payment
Tax
payments
Working
capital
OpCF
(ex-spectrum) FCFMinorities,
spectrum &
others
+13.0%
y-o-y
2
• Reflects the annual change in balance in
net working capital (see definition below
and balance sheet on next page)
• Dividend paid to minorities
• Spectrum payments
CURRENT
ASSETS
(EX CASH)
WORKING
CAPITAL
CURRENT
LIABILITIES
(EX ST DEBT)
= -
FCF uses:
• Debt reduction
• Shareholders remuneration (Dividend)
• Share buybacks
• Financial investments
• Others
€m
OIBDA CapEx
(ex-spectrum)
434
• Cash balance generated from all the
collections from clients vs. our
payments to employees and suppliers
7
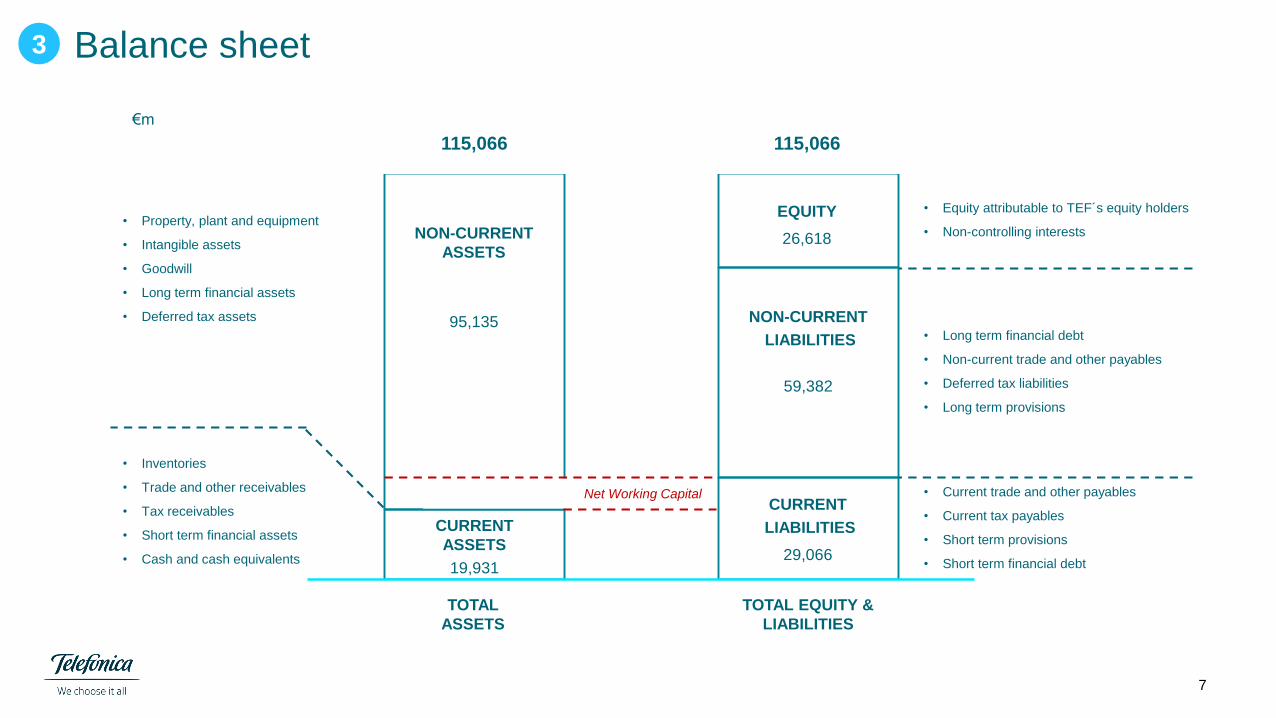
Balance sheet3
TOTAL
ASSETS
TOTAL EQUITY &
LIABILITIES
115,066115,066
EQUITY
26,618
NON-CURRENT
LIABILITIES
59,382
NON-CURRENT
ASSETS
95,135
CURRENT
LIABILITIES
29,066
CURRENT
ASSETS
19,931
Net Working Capital
• Equity attributable to TEF´s equity holders
• Non-controlling interests• Property, plant and equipment
• Intangible assets
• Goodwill
• Long term financial assets
• Deferred tax assets
• Inventories
• Trade and other receivables
• Tax receivables
• Short term financial assets
• Cash and cash equivalents
• Long term financial debt
• Non-current trade and other payables
• Deferred tax liabilities
• Long term provisions
• Current trade and other payables
• Current tax payables
• Short term provisions
• Short term financial debt
€m
8
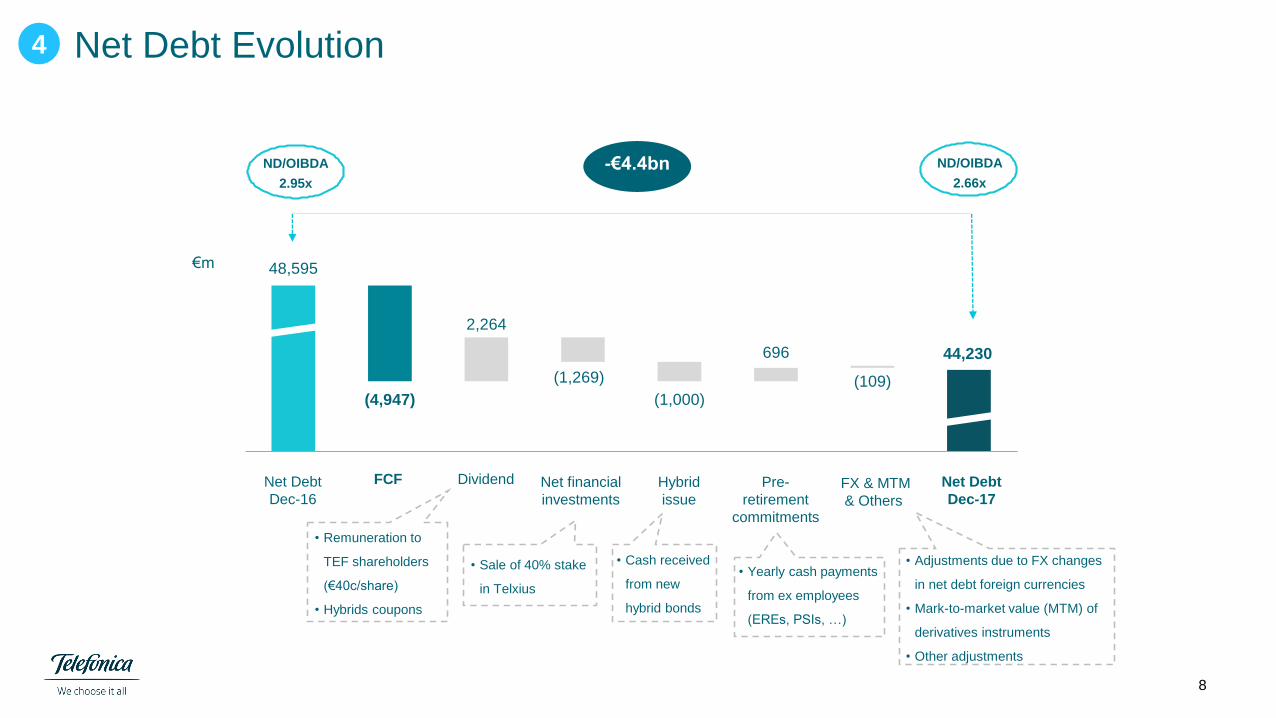
Net Debt Evolution
48,595
44,230
(4,947)
2,264
(1,269)
(1,000)
696
(109)
FCF Pre-
retirement
commitments
Net Debt
Dec-17
ND/OIBDA
2.95x
Dividend FX & MTM
& Others
-€4.4bn ND/OIBDA
2.66x
Net financial
investments
Hybrid
issue
4
Net Debt
Dec-16
€m
• Remuneration to
TEF shareholders
(€40c/share)
• Hybrids coupons
• Adjustments due to FX changes
in net debt foreign currencies
• Mark-to-market value (MTM) of
derivatives instruments
• Other adjustments
• Cash received
from new
hybrid bonds
• Sale of 40% stake
in Telxius
• Yearly cash payments
from ex employees
(EREs, PSIs, …)
9
1.#2: Key performance indicators – Free Cash Flow (FCF) & Total Shareholder Return (TSR)
10 10
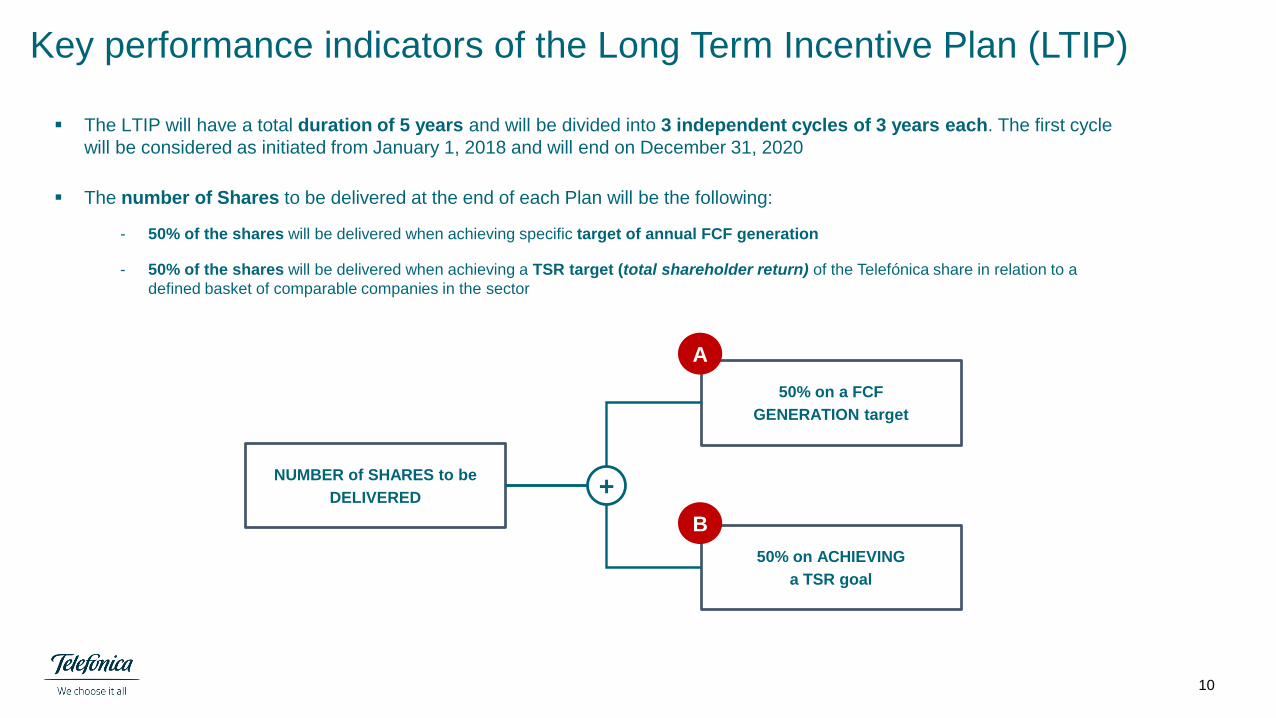
Key performance indicators of the Long Term Incentive Plan (LTIP)
The LTIP will have a total duration of 5 years and will be divided into 3 independent cycles of 3 years each. The first cycle
will be considered as initiated from January 1, 2018 and will end on December 31, 2020
The number of Shares to be delivered at the end of each Plan will be the following:
- 50% of the shares will be delivered when achieving specific target of annual FCF generation
- 50% of the shares will be delivered when achieving a TSR target (total shareholder return) of the Telefónica share in relation to a
defined basket of comparable companies in the sector
50% on a FCF
GENERATION target
50% on ACHIEVING
a TSR goal
A
B
NUMBER of SHARES to be
DELIVERED +
11 11
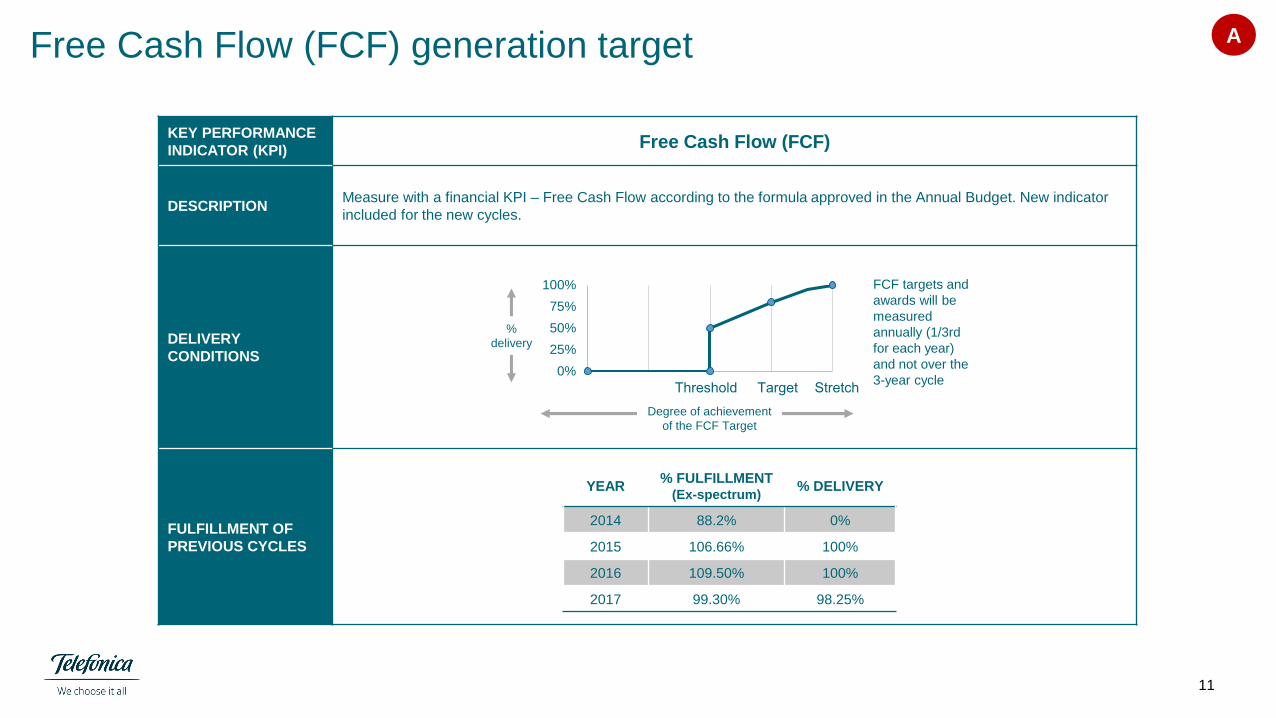
Free Cash Flow (FCF) generation target A
KEY PERFORMANCE
INDICATOR (KPI)Free Cash Flow (FCF)
DESCRIPTIONMeasure with a financial KPI – Free Cash Flow according to the formula approved in the Annual Budget. New indicator
included for the new cycles.
DELIVERY
CONDITIONS
FULFILLMENT OF
PREVIOUS CYCLES
Degree of achievement
of the FCF Target
YEAR% FULFILLMENT
(Ex-spectrum)% DELIVERY
2014 88.2% 0%
2015 106.66% 100%
2016 109.50% 100%
2017 99.30% 98.25%
0%
25%
50%
75%
100%
Threshold Target Stretch
FCF targets and
awards will be
measured
annually (1/3rd
for each year)
and not over the
3-year cycle
%
delivery
12 12
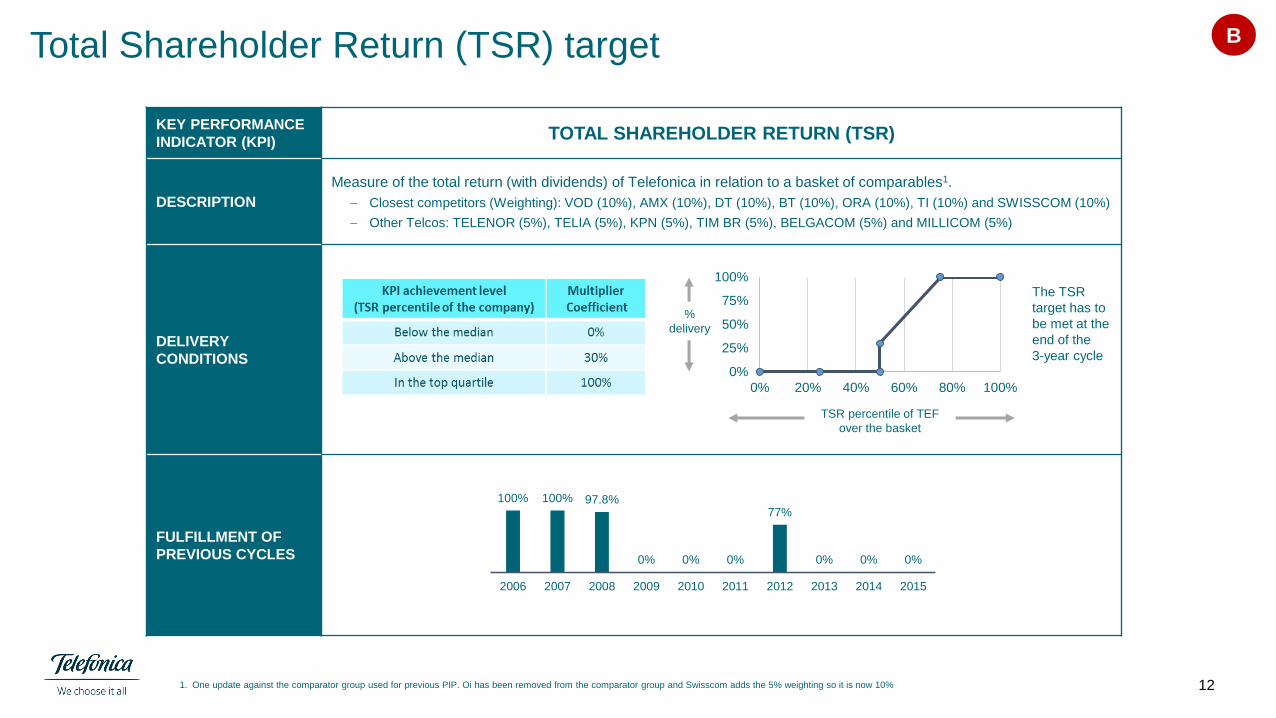
Total Shareholder Return (TSR) target B
KEY PERFORMANCE
INDICATOR (KPI)TOTAL SHAREHOLDER RETURN (TSR)
DESCRIPTION
Measure of the total return (with dividends) of Telefonica in relation to a basket of comparables1.
Closest competitors (Weighting): VOD (10%), AMX (10%), DT (10%), BT (10%), ORA (10%), TI (10%) and SWISSCOM (10%)
Other Telcos: TELENOR (5%), TELIA (5%), KPN (5%), TIM BR (5%), BELGACOM (5%) and MILLICOM (5%)
DELIVERY
CONDITIONS
FULFILLMENT OF
PREVIOUS CYCLES
100% 100% 97.8%
0% 0% 0%
77%
0% 0% 0%
2006 2007 2008 2009 2010 2011 2012 2013 2014 2015
0%
25%
50%
75%
100%
0% 20% 40% 60% 80% 100%
%
delivery
The TSR
target has to
be met at the
end of the
3-year cycle
TSR percentile of TEF
over the basket
1. One update against the comparator group used for previous PIP. Oi has been removed from the comparator group and Swisscom adds the 5% weighting so it is now 10%
1313 13
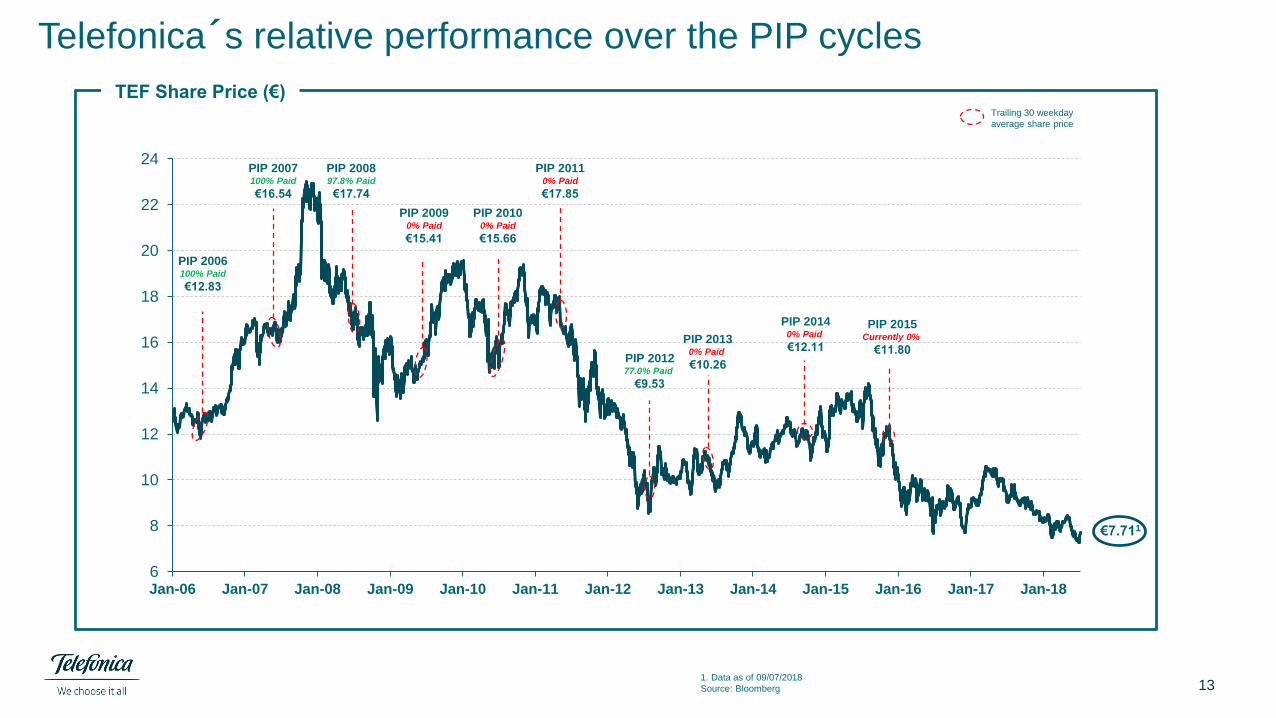
Telefonica´s relative performance over the PIP cycles
TEF Share Price (€)Trailing 30 weekday
average share price
1. Data as of 09/07/2018
Source: Bloomberg
6
8
10
12
14
16
18
20
22
24
Jan-06 Jan-07 Jan-08 Jan-09 Jan-10 Jan-11 Jan-12 Jan-13 Jan-14 Jan-15 Jan-16 Jan-17 Jan-18
PIP 201277.0% Paid
€9.53
€7.711
PIP 20130% Paid
€10.26
PIP 20140% Paid
€12.11
PIP 20110% Paid
€17.85
PIP 20100% Paid
€15.66
PIP 20090% Paid
€15.41
PIP 2006100% Paid
€12.83
PIP 200897.8% Paid
€17.74
PIP 2007100% Paid
€16.54
PIP 2015Currently 0%
€11.80
1414
1.#3: TSR and main value drivers –
Fundamentals and sustainability matter most
1515 15
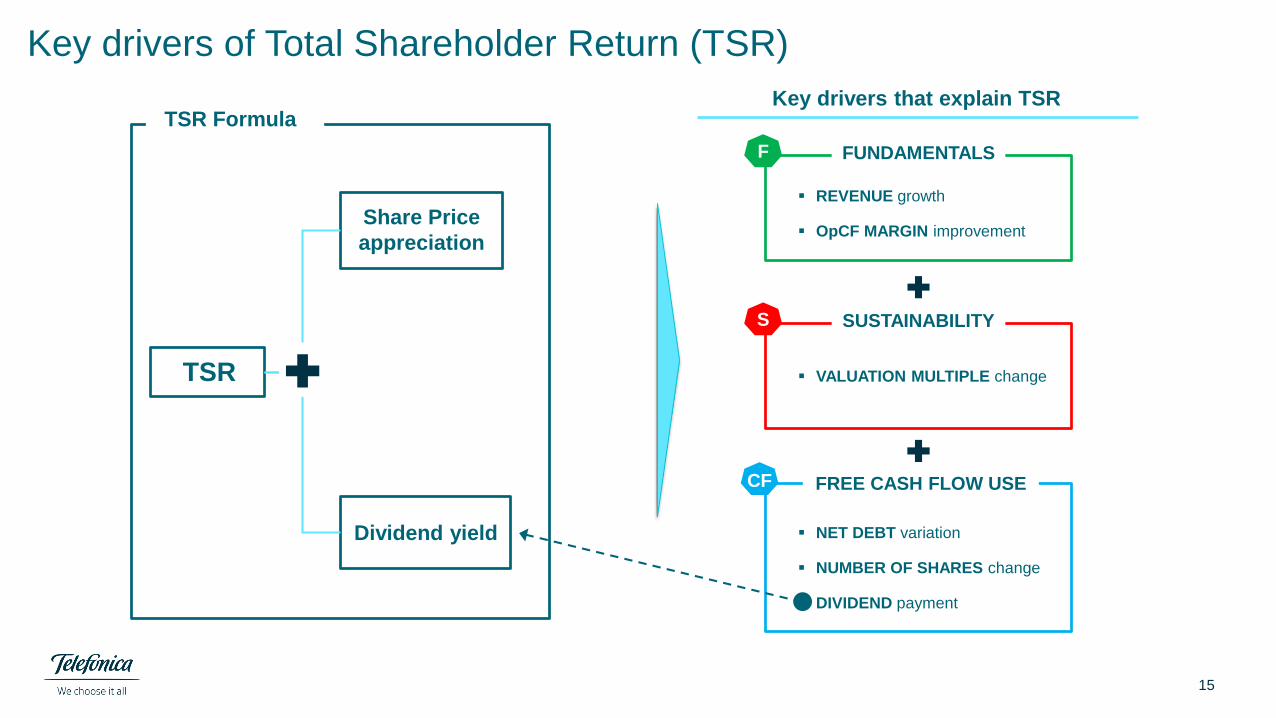
Key drivers of Total Shareholder Return (TSR)
FREE CASH FLOW USE
NET DEBT variation
NUMBER OF SHARES change
DIVIDEND payment
TSR
Share Price
appreciation
Dividend yield
Key drivers that explain TSR
CF
F
S
REVENUE growth
OpCF MARGIN improvement
FUNDAMENTALS
SUSTAINABILITY
VALUATION MULTIPLE change
TSR Formula
1616 16
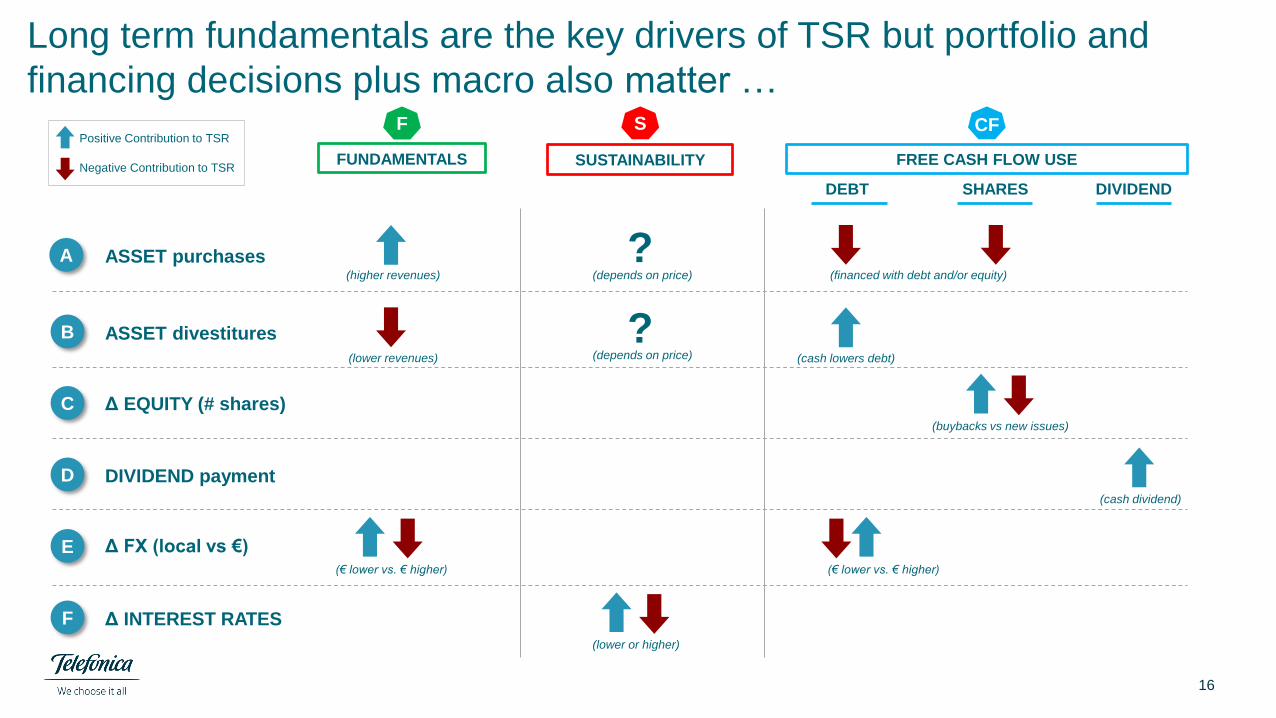
Long term fundamentals are the key drivers of TSR but portfolio and
financing decisions plus macro also matter …
FUNDAMENTALS SUSTAINABILITY FREE CASH FLOW USE
DEBT SHARES DIVIDEND
ASSET divestituresB
Δ FX (local vs €)E
ASSET purchasesA ?(depends on price)
?(depends on price)
Δ INTEREST RATESF
DIVIDEND payment D
C Δ EQUITY (# shares)
Positive Contribution to TSR
Negative Contribution to TSR
F S CF
(higher revenues) (financed with debt and/or equity)
(lower revenues) (cash lowers debt)
(buybacks vs new issues)
(€ lower vs. € higher)
(lower or higher)
(€ lower vs. € higher)
(cash dividend)
1717 17
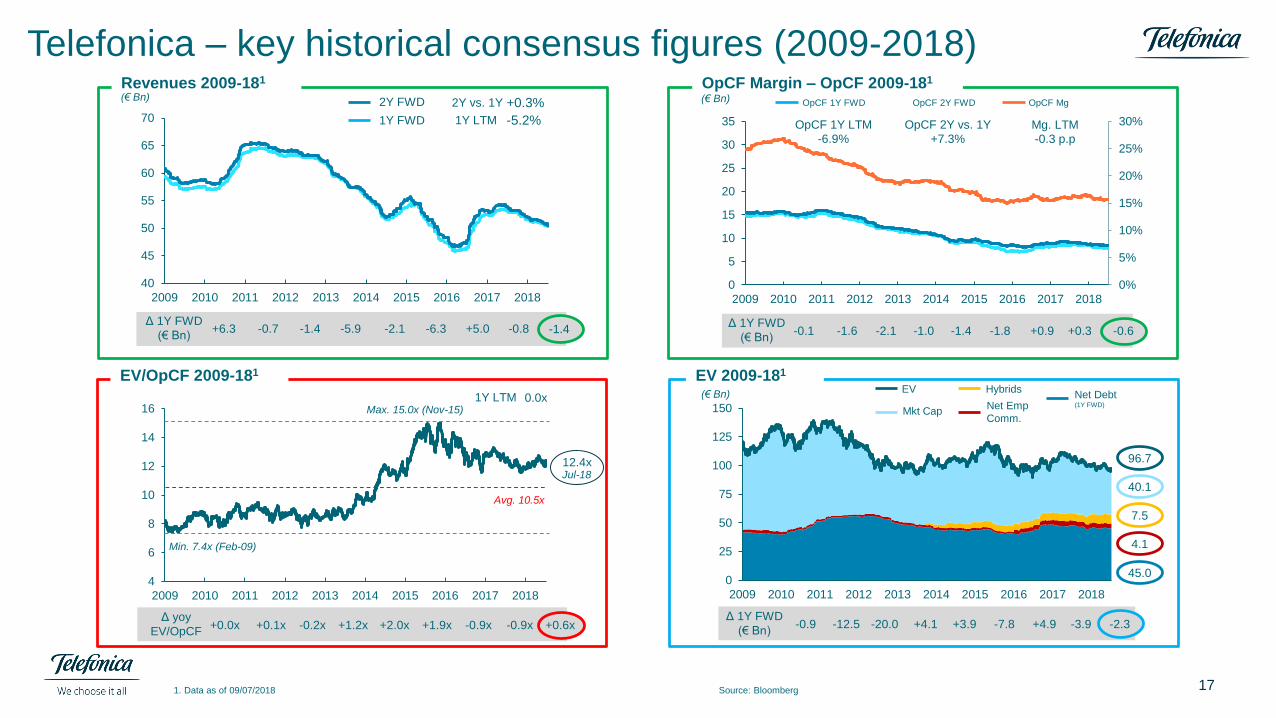
Telefonica – key historical consensus figures (2009-2018) OpCF Margin – OpCF 2009-181Revenues 2009-181
EV 2009-181
Δ 1Y FWD
(€ Bn)+6.3 -0.7 -1.4 -5.9 -2.1 -6.3 -0.8
40
45
50
55
60
65
70
2009 2010 2011 2012 2013 2014 2015 2016 2017 2018
+5.0 -1.4
1Y FWD
2Y FWD 2Y vs. 1Y +0.3%
1Y LTM -5.2%
Δ 1Y FWD
(€ Bn)-0.1 -1.6 -2.1 -1.0 -1.4 -1.8 +0.3
0%
5%
10%
15%
20%
25%
30%
0
5
10
15
20
25
30
35
2009 2010 2011 2012 2013 2014 2015 2016 2017 2018
+0.9 -0.6
OpCF 1Y LTM
-6.9%
OpCF 2Y vs. 1Y
+7.3%
Mg. LTM
-0.3 p.p
OpCF MgOpCF 1Y FWD OpCF 2Y FWD(€ Bn)(€ Bn)
Δ 1Y FWD
(€ Bn)-0.9 -12.5 -20.0 +4.1 +3.9 -7.8 +4.9
0
25
50
75
100
125
150
2009 2010 2011 2012 2013 2014 2015 2016 2017 2018
-3.9 -2.3
45.0
96.7
40.1
7.5
4.1
(€ Bn)
Mkt CapNet Emp
Comm.
Net Debt(1Y FWD)
EV Hybrids
Source: Bloomberg1. Data as of 09/07/2018
Δ yoy
EV/OpCF+0.0x +0.1x -0.2x +1.2x +2.0x +1.9x -0.9x-0.9x
4
6
8
10
12
14
16
2009 2010 2011 2012 2013 2014 2015 2016 2017 2018
+0.6x
Min. 7.4x (Feb-09)
Max. 15.0x (Nov-15)1Y LTM
Avg. 10.5x
0.0x
12.4xJul-18
EV/OpCF 2009-181
1818 18
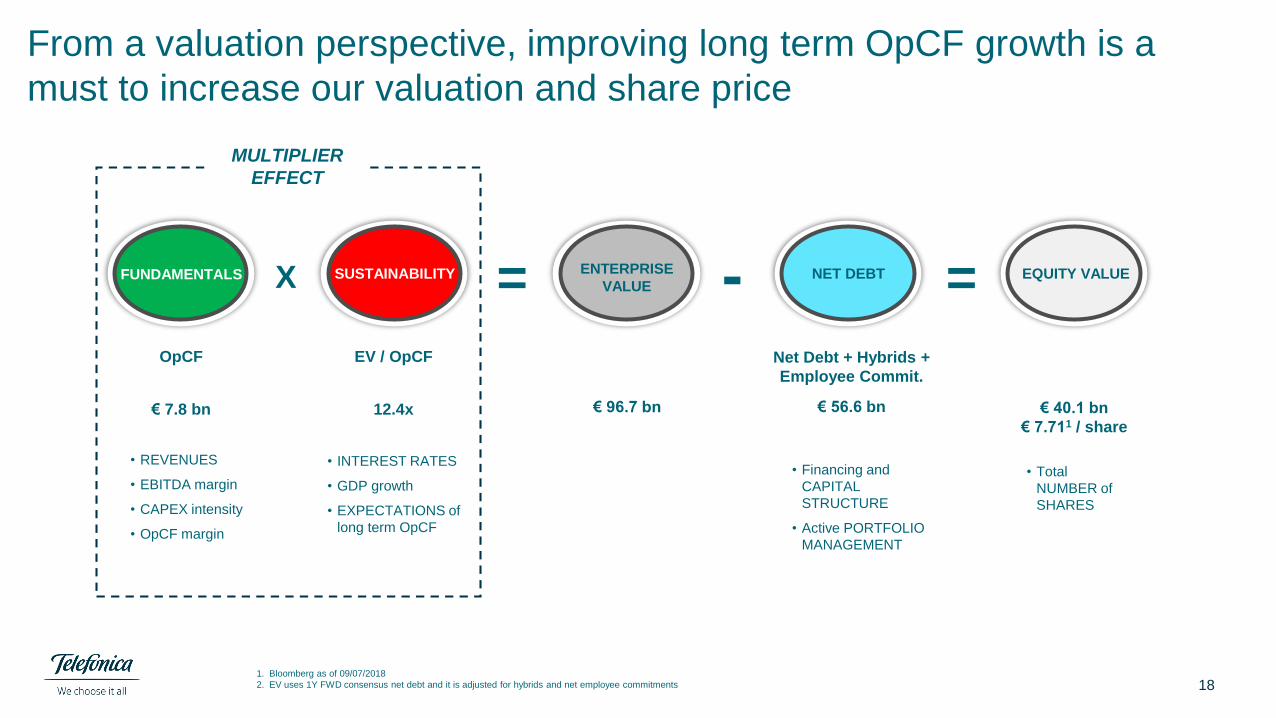
From a valuation perspective, improving long term OpCF growth is a
must to increase our valuation and share price
ENTERPRISE
VALUE= NET DEBT-
• Financing and
CAPITAL
STRUCTURE
• Active PORTFOLIO
MANAGEMENT
EQUITY VALUE=
• Total
NUMBER of
SHARES
FUNDAMENTALS
• REVENUES
• EBITDA margin
• CAPEX intensity
• OpCF margin
SUSTAINABILITYX
• INTEREST RATES
• GDP growth
• EXPECTATIONS of
long term OpCF
MULTIPLIER
EFFECT
€ 96.7 bn
Net Debt + Hybrids +
Employee Commit.
€ 56.6 bn € 40.1 bn
€ 7.711 / share
OpCF
€ 7.8 bn
EV / OpCF
12.4x
1. Bloomberg as of 09/07/2018
2. EV uses 1Y FWD consensus net debt and it is adjusted for hybrids and net employee commitments
1919 19
Summary of key takeaways
Financial statements are crucial for company management and investors
Strong fundamentals (measured as OpCF long term sustainability) are the critical
driver of Total Shareholder Return (TSR)
Delivering or exceeding our FCF generation target has not only a positive impact
on TSR but also increases investors’ confidence on TEF’s share performance
From a valuation perspective, short term growth and margin improvement matter
less than long term OpCF sustainability
2020
1.#4: Annex:
2.PIP/TFSP 2015 plan
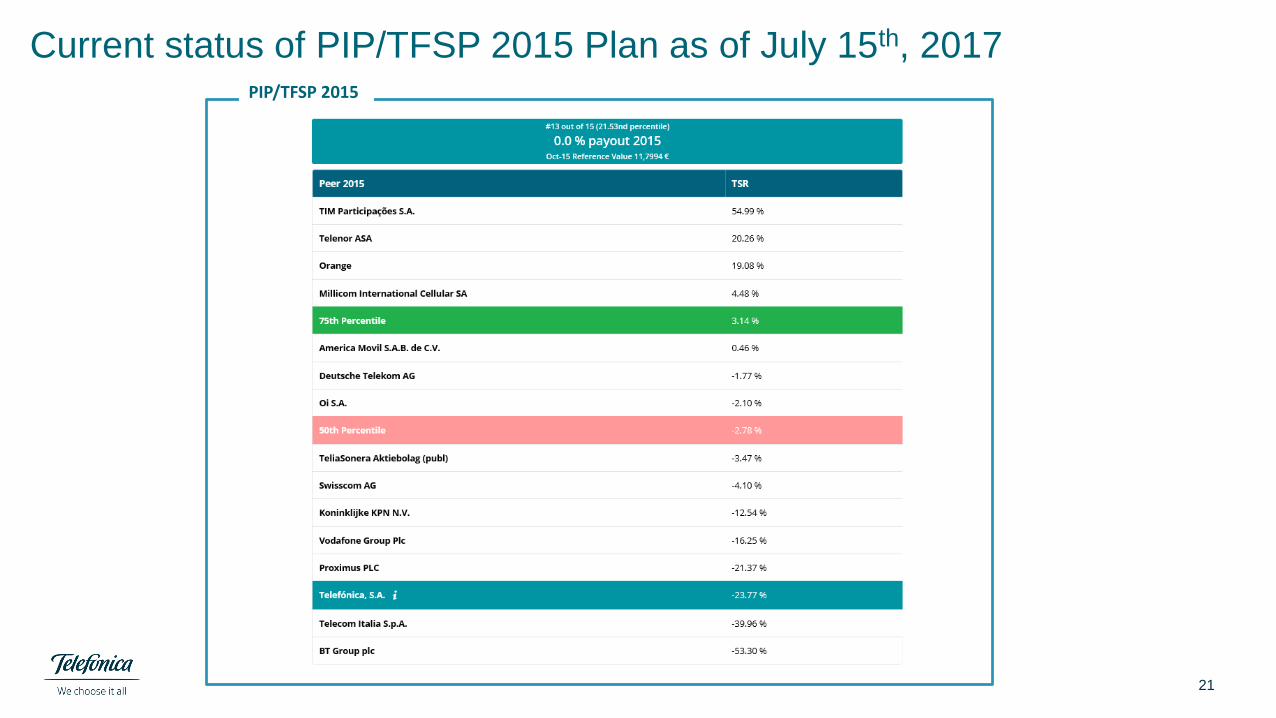
2121 21
Current status of PIP/TFSP 2015 Plan as of July 15th, 2017PIP/TFSP 2015
Related Documents


