Long-term hydroacoustic monitoring in the Atlantic and Indian oceans J-Y Royer, R Château, J-F D’Eu, C Guennou, G Jamet, J Perrot, A Sukhovich, E Tsang-Hin-Sun, (1) C Guinet, F Samaran, (2) C Brachet (1) CNRS Centre d’Etudes Biologiques de Chizé CNRS & Université de Brest (2) DT-INSU

Welcome message from author
This document is posted to help you gain knowledge. Please leave a comment to let me know what you think about it! Share it to your friends and learn new things together.
Transcript

Long-term hydroacoustic monitoring in the Atlantic and Indian oceans
J-Y Royer, R Château, J-F D’Eu, C Guennou, G Jamet, J Perrot, A Sukhovich, E Tsang-Hin-Sun,
(1) C Guinet, F Samaran, (2) C Brachet
(1) CNRS Centre d’Etudes Biologiques de Chizé CNRS & Université de Brest (2) DT-INSU

Global seismicity 2000-2010 From land-based seismological networks
All magnitudes

Global seismicity 2000-2010
Magnitudes < 3.7
From land-based seismological networks

Global seismicity 2000-2010 Objectives: capture the low-level seismic background
associated with seafloor spreading ridges
Using arrays of autonomous hydrophones: • large geographic coverage • sensitive to magnitudes > 2.5
Magnitudes < 3.7
Sirena Marche HydroMomar
Colmeia
Deflo Ohasisbio

Conversion)zone)
Principle of an hydroacoustic observatory
))
P)&)S)seismic)waves)
Hydroacous6c)T8waves)
Hydrophone)moored)In)the)SOFAR)channel)axis)
1300)<)z)<)500)m)
Sea surface
Sea bottom
> 1000 km Mb > 2.5 Vsound
z
Hypocentre
Long8term)deployment)of)autonomous)hydrophones)) )in)the)«)Sound)Fixing)And)Ranging)»)channel))
SOFAR channel 500-1300m
3000-5000m

Conversion)zone)
Principle of an hydroacoustic observatory
))
Vsound
z
Long8term)deployment)of)autonomous)hydrophones)) )in)the)«)Sound)Fixing)And)Ranging)»)channel))
SOFAR channel 500-1300m
3000-5000m
• Earthquakes • Volcanic eruptions • Icequakes • Large baleen whales • Microseismic noise
Ondes T
P waves

Hydroacoustic mooring
Low sound-velocity layer

Autonomous hydrophone
• Instrument configuration – Continuous recording – 240Hz sampling rate – 24 bits encoding – SSD storage (~24 Gb/yr) – High precision clock (10-8) – 18 to 24 month autonomy
• Costs – 40 000 € HT/mooring
• 1/3 instrument • 2/3 mooring
– Deployment: ~2500 € / instrument • Lithium batt., anchor, chandlery
+ ship-time !!!

Past and current experiments
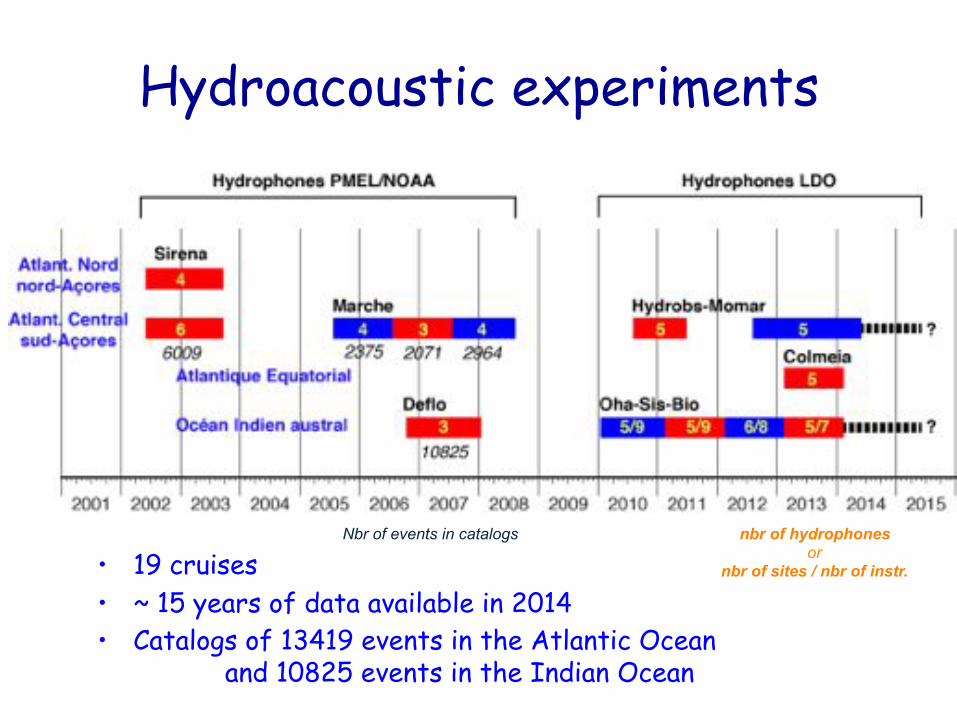
Hydroacoustic experiments
• 19 cruises • ~ 15 years of data available in 2014 • Catalogs of 13419 events in the Atlantic Ocean
and 10825 events in the Indian Ocean
nbr of hydrophones or
nbr of sites / nbr of instr.
Nbr of events in catalogs

Records from the Indian Ocean
2 déc. 2011 à 00h22
NCRO2-2011
1000
s =
16’4
0’’
612’’
WKER1-2011
954’’
Mw=5.6
P
S
T T

Teleseismic P-waves
• A way to fill ocean gaps in Earth tomography data base
Feb. 27, 2010 06h34 event off Chile Mw=8.8 D=87˚=9700 km
WKER-1 2010
Garnero 2012

Sérénade 2012
Hydrophone WKER-1 2010 46˚S Southern Indian Ocean
• Bla bla bla
0-12
0 H
z 0-
40 H
z
5 106
5 107
100-110 Hz Fin Whale
30-40 Hz Pygmy Blue Whale (Madagascar type)
18-28 Hz Antarctic Blue Whale
J F M A M J J A S O N D J month
Earth related sounds
Biological sounds

Grenoble 3-4 avril 2012
Sérénade 2012
• VLF recording of the sea-state
0-8
Hz
0-2.
5 H
z
5 107
Ardhuin et al. (JASA, 2013)
A S O
Hydrophone WKER-1 2010 46˚S Southern Indian Ocean

Deflo array (oct. 2006 - jan. 2008) : > 10000 detected events
Level of completeness : - hydrophones SL=220 - hydrophones mb≈3.2 - ISC mb=4.0
[db re 1 mPa @ 1m]"

Deflo array (oct. 2006 - jan. 2008) : > 10000 detected events
Icequakes Ice tremors

Seismicity vs thermicity of the MAR
• Number of earthquakes increases away from the Azores Plateau: – Link with mantle temperature (« MBA ») – Lesser seismic activity in hot and thick
oceanic crust up to 43˚N – More tectonic events in thin and cold
oceanic crust, north of 43˚N
Goslin et al. (G3,2012)

2005-2008 seismicity in the MOMAR area
Marche 1: July 2005-April 2006 4 hydrophones 2350 events Marche 2: April 2006-August 2007 3 hydrophones 2610 events Marche 3: August 2007-August 2008 4 hydrophones 2024 events
M6
M2
M8
M7

2008 swarms in the MoMAR area Tectonic swarm after a M=5 event: time & space distribution consistent with a slip along an eastward dipping fault
Magmatic swarm lacking temporal decay distribution
10 km
10 km

HYDROMOMAR experiments
• HYDROMOMAR : 5 instr. 2010-2011 & 2012-20?

Hydrobs-MoMAR 2010/2011
• Spectrograms of 5 hydrophones from Hydrobs-MoMAR 2010 LS is located at the North-Famous and Famous segment.
• Seismic crisis on August 13-??, 2010 in the MoMAR area : Plus 500 events detected in 5 days !
LS M6 M2 M8 M7

Distribution of cryogenic events
~4500 events oct. 2006-dec. 2007

T-wave modeling
hydrophone
Jamet et al. (JASA, 2013)
10 Hz Gaussian source
Modeling of the seismic/acoustic conversion and T-wave propagation using a spectral element method
Mw=5.2 Feb. 3, 2008 earthquake defined by its moment tensor

Automatic signal classification Method :
– Run STA/LTA algorithm to detect P and T waves and Ice quake signals – Manually identify a certain percentage of the detected signals to create
“training set” – Use the training set to construct a statistical model (using GBDT) – Classify all the remaining signals using the statistical model
Test: using the data set of two hydrophones With a training set of 10% manually identified signal 99% T waves detected 77% and 89% for the P waves 95% Ice quake signals ! A. Sukhovich et al., JGR, under review

• Complete the land-based seismological networks : – Over large and remote oceanic areas – With improved completeness (down to mb=2.5-3.2)
• Provides a wealth of information on the : – Seismic and volcanic activity of spreading ridges – Presence and migration pattern of large baleen whales – Climatic activity (sea-state, iceberg calving, …)
• Requires steady efforts : – In the analysis of large data sets (event localization and
cataloging, detection of whale calls, …) – In the logistics (long and repeated cruises)
In summary : Long-term hydroacoustic monitoring

Perspectives • Improve the acquisition systems :
– For longer deployments (2-3 years) – With data-logging on messengers
• Automate the data processing • Improve forward modeling (source, 3D, longer range) • Broaden the community to share the sea-going and funding
efforts


Acquisition system
GPS chips + antenna For clock synchronization
24 bits A/D converter HD drive 2.5’’ 160G
High precision clock 10-7 s/s
Persistor CF2 processor & flash card 512M
HTI Piezzometer sensor
Connector to PC
Related Documents