Malaysian Journal of Civil Engineering 27(1):1-24(2015) All rights reserved. No part of contents of this paper may be reproduced or transmitted in any form or by any means without the written permission of Faculty of Civil Engineering, Universiti Teknologi Malaysia LONG TERM ASSESSMENT OF STRENGTH AND HEAVY METAL CONCENTRATION IN CEMENT-FLY ASH STABILIZED ELECTROPLATING WASTE SLUDGE Malik Shoeb Ahmad* Z.H. College of Engineering and Technology Department of Civil Engineering, Aligarh Muslim University, Aligarh-India. *Corresponding Author: [email protected] Abstract: The main objective of this study is to utilize the locally available industrial wastes materials like fly ash (FA) and electroplating wastes (S) in bulk for the Civil Engineering works and replacement of weak sub grade soil by stabilizing the fly ash using electroplating waste and other additives like cement (C). The compressive strength tests of the mix containing varying percentages (by weight of fly ash) of electroplating waste sludge (5–60% with an increment of 5% ) and of fly ash-waste sludge-cement have been determined for different curing periods. It has been observed that the significant gain in compressive strength exhibited for waste range 30% to 45%. The percentage increase in 28 days compressive strength for mix containing waste sludge 30─40%, 62─52% fly ash and 8% cement is 36% while for 30% and 45% waste sludge, 70% and 55% fly ash and 8% cement is 13%. The Toxicity Characteristics Leaching Procedure (TCLP) tests were also conducted to determine the heavy metal concentration in the optimized mix. The results of TCLP test show that the heavy metal concentration in the mix 52%FA+40%S+8%S at 28 days of curing reduced substantially from 97 to 100% when compared with the concentration of heavy metals in the waste sludge collected from source. It has also been observed that the pH of the leachate of this mix is between 6.9-10.9, which ensures the proper stabilization of the heavy metals present in the mix. Keywords: Fly ash, electroplating waste, cement, compressive strength, leaching, 1.0 Introduction Safe and economic disposal of industrial waste including coal ash from thermal power plants continues to remain a cause of concern to the industrial societies. Alternative use of these waste products in civil engineering applications extensively researched and widely adopted in Continental, Europe and America. Now, it is steadily being realized in developing countries including India. The thermal power stations in India at present generate nearly 200 million tons of coal ash every year, out of which only about 15% is presently utilized in cement, concrete, bricks and geotechnical and highway engineering applications. The high ash content of Indian coal (30–50%) is contributing to these large

Welcome message from author
This document is posted to help you gain knowledge. Please leave a comment to let me know what you think about it! Share it to your friends and learn new things together.
Transcript

Malaysian Journal of Civil Engineering 27(1):1-24(2015)
All rights reserved. No part of contents of this paper may be reproduced or transmitted in any form or by any means
without the written permission of Faculty of Civil Engineering, Universiti Teknologi Malaysia
LONG TERM ASSESSMENT OF STRENGTH AND HEAVY METAL
CONCENTRATION IN CEMENT-FLY ASH STABILIZED
ELECTROPLATING WASTE SLUDGE
Malik Shoeb Ahmad*
Z.H. College of Engineering and Technology
Department of Civil Engineering, Aligarh Muslim University, Aligarh-India.
*Corresponding Author: [email protected]
Abstract: The main objective of this study is to utilize the locally available industrial wastes
materials like fly ash (FA) and electroplating wastes (S) in bulk for the Civil Engineering works
and replacement of weak sub grade soil by stabilizing the fly ash using electroplating waste and
other additives like cement (C). The compressive strength tests of the mix containing varying
percentages (by weight of fly ash) of electroplating waste sludge (5–60% with an increment of
5% ) and of fly ash-waste sludge-cement have been determined for different curing periods. It
has been observed that the significant gain in compressive strength exhibited for waste range
30% to 45%. The percentage increase in 28 days compressive strength for mix containing waste
sludge 30─40%, 62─52% fly ash and 8% cement is 36% while for 30% and 45% waste sludge,
70% and 55% fly ash and 8% cement is 13%. The Toxicity Characteristics Leaching Procedure
(TCLP) tests were also conducted to determine the heavy metal concentration in the optimized
mix. The results of TCLP test show that the heavy metal concentration in the mix
52%FA+40%S+8%S at 28 days of curing reduced substantially from 97 to 100% when compared
with the concentration of heavy metals in the waste sludge collected from source. It has also been
observed that the pH of the leachate of this mix is between 6.9-10.9, which ensures the proper
stabilization of the heavy metals present in the mix.
Keywords: Fly ash, electroplating waste, cement, compressive strength, leaching,
1.0 Introduction
Safe and economic disposal of industrial waste including coal ash from thermal power
plants continues to remain a cause of concern to the industrial societies. Alternative use
of these waste products in civil engineering applications extensively researched and
widely adopted in Continental, Europe and America. Now, it is steadily being realized in
developing countries including India. The thermal power stations in India at present
generate nearly 200 million tons of coal ash every year, out of which only about 15% is
presently utilized in cement, concrete, bricks and geotechnical and highway engineering
applications. The high ash content of Indian coal (30–50%) is contributing to these large
2 Malaysian Journal of Civil Engineering 27(1):1-24(2015)
volumes of fly ash. As a general practice in India, fly ash are mixed with water and
transported to ash ponds. The fly ash collected in these ponds cause severe respiratory
and other ailments, visual and aesthetic problems in almost all the major industrial cities
in India. On the other hand one of the major hazardous waste generating industries is the
electroplating industry due to the presence of high concentration of heavy metals such as
Nickel (Ni), Chromium (Cr), Lead (Pb), Copper (Cu), Cadmium (Cd) and Zinc (Zn) etc.,
(Chang et al., 1999 ).
As the restrictions on land filling become stronger and wastes were banned from land
disposal. Solidification/stabilization (S/S) could potentially play an important role in
making wastes acceptable for land disposal. This has attracted the attention of many
researchers to stabilize the waste sludge containing heavy metals using fly ash and
cement. The solidification/stabilization (S/S) process can be used to encapsulate the
wastes by adsorption, hydration or precipitation reactions with cement and water (Gitari
et al., 2010 and Wu et al., 2012). The results of these interactions are the stabled forms
of waste which are non-hazardous or less hazardous than raw material (Zheng et al.,
2010, Maschio et al., 2011 and Colangelo et al., 2012). These studies showed that the
waste sludge containing heavy metals, when stabilized with fly ash and cement, the mix
exhibits acceptable compressive strength and good leaching resistance. Before the
landfill, which is the most popular constituent of waste storage, the environmental
characterization i.e., leaching test is required on crushed mortar samples. The leaching
tests were used in many applications, ranging from the classification of industrial wastes
for disposal in landfills to assess the stability of solid wastes for their beneficial use.
Failure to pass a leaching test requires the waste to be treated where the contaminants in
the waste were immobilized by stabilization/solidification procedures prior to its
disposal.
Fly ash and cement stabilization is one of the examples of such treatment. The leaching
of heavy metals from cementitious waste has been investigated in many studies (Poon et
al., 2001 and Halim et al., 2003). The main findings of these studies were that the
cementitious wastes have a high acid neutralizing capacity (ANC) which tends to
quickly neutralize the acidity of the toxicity characteristics leaching procedure (TCLP)
leaching fluid (acetic acid). It is suggested that the pH is the most important factor to be
observed during the leaching process as it influences the speciation and solubility of
metals in the system (Aubert et al., 2007 and Cetin et al., 2012). Therefore, keeping in
view the long term environmental acceptability of the mix containing fly ash, waste
sludge and cement, the present investigation is carried out. This study serves two
purposes such as it immobilizes the toxic heavy metals and at the same time utilizes the
two industrial wastes such as fly ash and electroplating waste sludge for mass scale
utilization.
Malaysian Journal of Civil Engineering 27(1):1-24(2015) 3
2.0 Materials and Methods
2.1 Materials
In this study, the materials used are fly ash, electroplating waste sludge, lime and
cement.
2.1.1 Fly Ash
Fly ash was procured from Harduaganj thermal power plant located at 16 km from
Aligarh City, Uttar Pradesh, India. This power plant consist of 440 MW pulvarised coal
units, producing 25 trucks of fly ash and bottom ash per day which is about 1500 tonnes
fly ash and 500 tonnes of bottom ash (Fly ash Status Summary, 2005). For the present
investigation, dry fly ash from hoppers is collected in polythene bags.
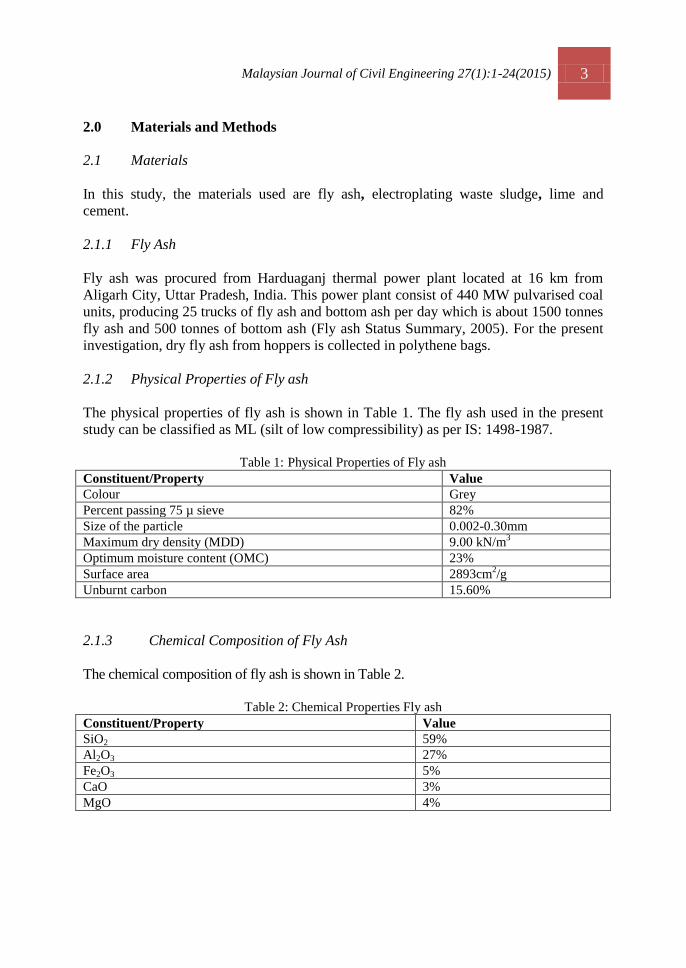
2.1.2 Physical Properties of Fly ash
The physical properties of fly ash is shown in Table 1. The fly ash used in the present
study can be classified as ML (silt of low compressibility) as per IS: 1498-1987.
Table 1: Physical Properties of Fly ash
Constituent/Property Value
Colour Grey
Percent passing 75 µ sieve 82%
Size of the particle 0.002-0.30mm
Maximum dry density (MDD) 9.00 kN/m3
Optimum moisture content (OMC) 23%
Surface area 2893cm2/g
Unburnt carbon 15.60%
2.1.3 Chemical Composition of Fly Ash
The chemical composition of fly ash is shown in Table 2.
Table 2: Chemical Properties Fly ash
Constituent/Property Value
SiO2 59%
Al2O3 27%
Fe2O3 5%
CaO 3%
MgO 4%

4 Malaysian Journal of Civil Engineering 27(1):1-24(2015)
2.2 Electroplating Waste Sludge
The electroplating waste sludge was collected in the form of filter cake, comprises of 70%
solid waste and 30% waste water. The solid waste includes chemicals, heavy metals and
metallic dust. Heavy metal analysis was carried out using GBC-902 atomic absorption
spectrophotometer (AAS). The AAS observation shows that the quantity of heavy
metals in the electroplating waste sludge was extremely high as shown in Table 5.
2.2.1 Physical Properties
The physical characteristics of electroplating waste sludge are shown in the Table 3.
Table 3 : Physical Properties of Electroplating Waste Sludge
Constituent/Property Value
Total Solids 105340mg/l
Total dissolved solids 7315mg/l
Total suspended solids 132738mg/l
Specific gravity 1.090
pH 1.5<2 (hazardous )
2.2.2 Chemical Properties
The chemical composition and heavy metal concentration are shown in Tables 4 & 5.
Table 4: Chemical Compositions of Electroplating Waste Sludge
Chemical Concentration(mg/l)
Nickel Sulfate (NiSO4.6H2O) 225-375
Nickel Chloride (NiCl2.6H2O) 30-60
Boric acid (H3BO3) 30-40
Sodium Hydroxide (NaOH) 80-120
Sodium Cyanide (NaCN) 15-25
Potassium Chloride(KCl) 120-150
Sodium Sulfide (Na2S) 200
Chromic Acid (H2CrO4) 250-300
Sulfate (SO4) 2.5- 5.0
Table 5 : Heavy Metal Concentrations in Electroplating Waste Sludge
Metals Concentration
(mg/l or ppm)
Desirable limits for drinking water
(mg/l or ppm) Nickel (Ni) 98 3.0
Chromium (Cr) 27 0.1
Zinc (Zn) 30 5.0
Cadmium (Cd) 12 2.0
Copper (Cu) 07 3.0
Lead (Pb) 4.5 0.1
Malaysian Journal of Civil Engineering 27(1):1-24(2015) 5
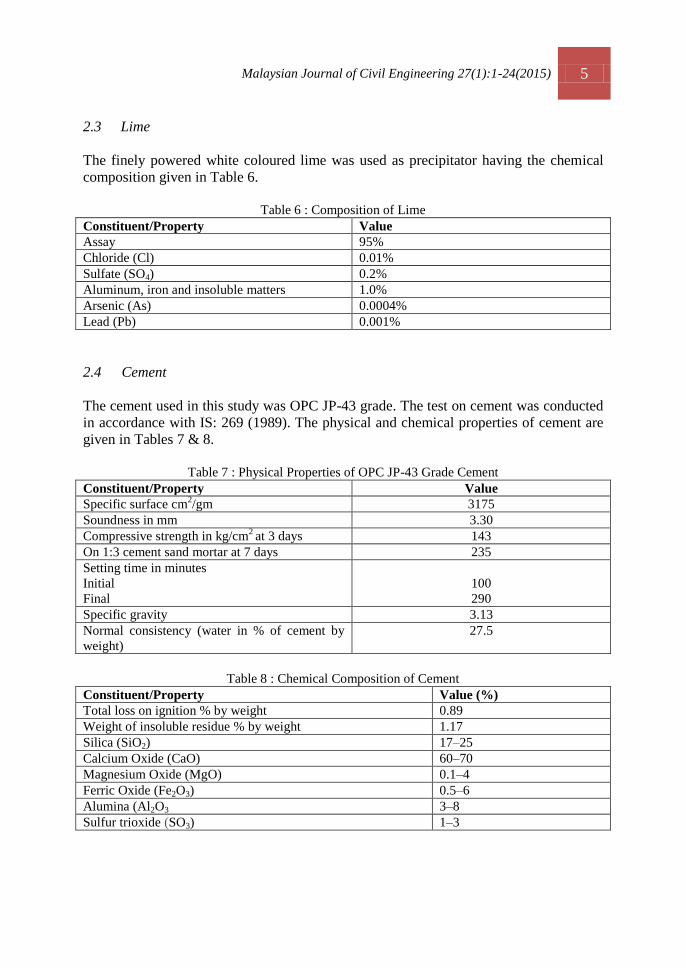
2.3 Lime
The finely powered white coloured lime was used as precipitator having the chemical
composition given in Table 6.
Table 6 : Composition of Lime
Constituent/Property Value
Assay 95%
Chloride (Cl) 0.01%
Sulfate (SO4) 0.2%
Aluminum, iron and insoluble matters 1.0%
Arsenic (As) 0.0004%
Lead (Pb) 0.001%
2.4 Cement
The cement used in this study was OPC JP-43 grade. The test on cement was conducted
in accordance with IS: 269 (1989). The physical and chemical properties of cement are
given in Tables 7 & 8.
Table 7 : Physical Properties of OPC JP-43 Grade Cement
Constituent/Property Value
Specific surface cm2/gm 3175
Soundness in mm 3.30
Compressive strength in kg/cm2 at 3 days 143
On 1:3 cement sand mortar at 7 days 235
Setting time in minutes
Initial
Final
100
290
Specific gravity 3.13
Normal consistency (water in % of cement by
weight)
27.5
Table 8 : Chemical Composition of Cement
Constituent/Property Value (%)
Total loss on ignition % by weight 0.89
Weight of insoluble residue % by weight 1.17
Silica (SiO2) 17–25
Calcium Oxide (CaO) 60–70
Magnesium Oxide (MgO) 0.1–4
Ferric Oxide (Fe2O3) 0.5–6
Alumina (Al2O3 3–8
Sulfur trioxide (SO3) 1–3

6 Malaysian Journal of Civil Engineering 27(1):1-24(2015)
3.0 Preparation and Testing of Specimens
The preparation and testing of specimens for compressive strength tests have been
carried out in accordance with the IS: 4031 (Part 6).
Fly ash and lime precipitated electroplating waste sludge was dried in oven for 24 hours
and sieved through 0.425 mm IS sieve. The standard Proctor compaction test was
carried out using the equipment and procedure as specified in IS: 2720 (Part 7)-1987 to
obtain maximum dry density (MDD) and optimum moisture content (OMC) of the mix.
The average value of OMC of the mix (fly ash-waste sludge-cement) was obtained as
22% which is further used for preparing the cube specimens. The desired amount of fly
ash-waste sludge-cement was taken and mixed them thoroughly in dry condition. The
water equal to 22% was added to the dry mix and mixed it to obtain a mix of uniform
colour. The mould was filled with desired quantity of mix using a suitable hopper
attached to the top of the mould and vibrated it for 2 minutes at a specified speed of
12000±400 per minute to achieve full compaction. The mould was removed from the
machine and kept it in a place with temp of 27±20C and relative humidity of 90% for 24
hours. At the end of 24 hours the cubes were de-molded and immediately submerged in
fresh clean water. All the cubes were prepared with the different combinations shown in
Table 9 by repeating the same procedure.
Place the test cube on the platform of a compressive testing machine without any
packing between the cube and the plates of the testing machine. Apply the load steadily
and uniformly, starting from zero at a rate of 35 N/mm2/minute.
Toxicity Characteristics Leaching Procedure (TCLP) is the US Environmental
Protection Agency (US EPA) procedure for assessing the potential for hazardous wastes
to leach in the ground water from a landfill (US EPA, 1992). As described in the TCLP
procedure, the molded cubes of different curing periods (Table 9) were crushed to
particles less than 1 mm in diameter and then blended with a weak acetic acid extraction
liquid, in liquid to solid weight ratio of 20:1 and was agitated in a rotary extractor for a
period of 18 hours of agitation. The extract was filtered through a certified TCLP 0.7µ
borosilicate glass fibre filter, and the filterate was analyzed for Ni, Cr, Zn, Cd, Cu and
Pb by using GBC-902 Atomic Absorption Spectrophotometer (AAS).
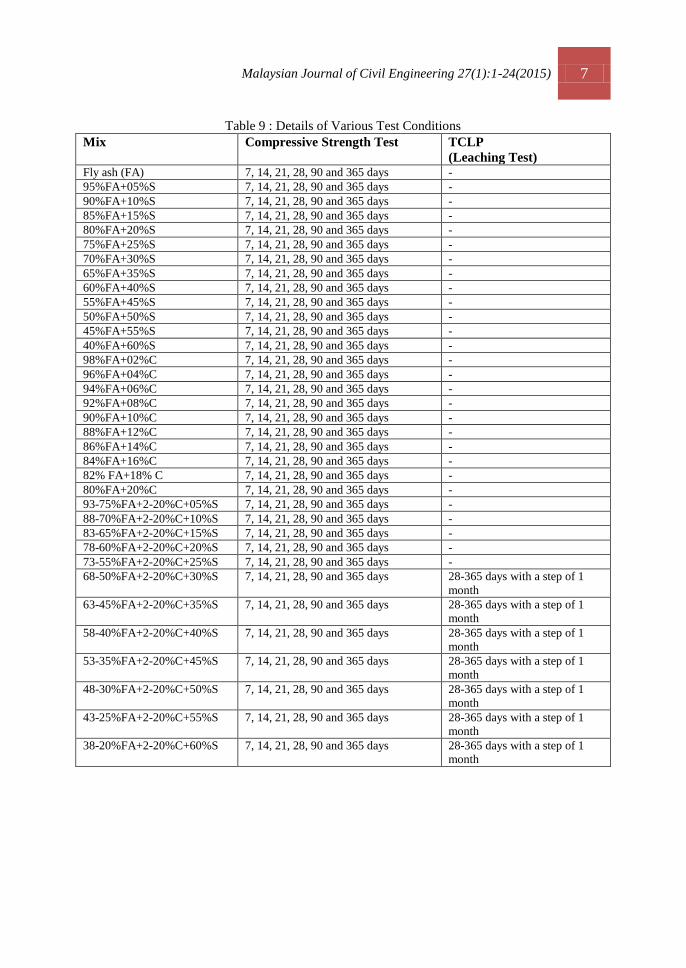
Malaysian Journal of Civil Engineering 27(1):1-24(2015) 7
Table 9 : Details of Various Test Conditions
Mix Compressive Strength Test TCLP
(Leaching Test) Fly ash (FA) 7, 14, 21, 28, 90 and 365 days -
95%FA+05%S 7, 14, 21, 28, 90 and 365 days -
90%FA+10%S 7, 14, 21, 28, 90 and 365 days -
85%FA+15%S 7, 14, 21, 28, 90 and 365 days -
80%FA+20%S 7, 14, 21, 28, 90 and 365 days -
75%FA+25%S 7, 14, 21, 28, 90 and 365 days -
70%FA+30%S 7, 14, 21, 28, 90 and 365 days -
65%FA+35%S 7, 14, 21, 28, 90 and 365 days -
60%FA+40%S 7, 14, 21, 28, 90 and 365 days -
55%FA+45%S 7, 14, 21, 28, 90 and 365 days -
50%FA+50%S 7, 14, 21, 28, 90 and 365 days -
45%FA+55%S 7, 14, 21, 28, 90 and 365 days -
40%FA+60%S 7, 14, 21, 28, 90 and 365 days -
98%FA+02%C 7, 14, 21, 28, 90 and 365 days -
96%FA+04%C 7, 14, 21, 28, 90 and 365 days -
94%FA+06%C 7, 14, 21, 28, 90 and 365 days -
92%FA+08%C 7, 14, 21, 28, 90 and 365 days -
90%FA+10%C 7, 14, 21, 28, 90 and 365 days -
88%FA+12%C 7, 14, 21, 28, 90 and 365 days -
86%FA+14%C 7, 14, 21, 28, 90 and 365 days -
84%FA+16%C 7, 14, 21, 28, 90 and 365 days -
82% FA+18% C 7, 14, 21, 28, 90 and 365 days -
80%FA+20%C 7, 14, 21, 28, 90 and 365 days -
93-75%FA+2-20%C+05%S 7, 14, 21, 28, 90 and 365 days -
88-70%FA+2-20%C+10%S 7, 14, 21, 28, 90 and 365 days -
83-65%FA+2-20%C+15%S 7, 14, 21, 28, 90 and 365 days -
78-60%FA+2-20%C+20%S 7, 14, 21, 28, 90 and 365 days -
73-55%FA+2-20%C+25%S 7, 14, 21, 28, 90 and 365 days -
68-50%FA+2-20%C+30%S 7, 14, 21, 28, 90 and 365 days 28-365 days with a step of 1
month
63-45%FA+2-20%C+35%S 7, 14, 21, 28, 90 and 365 days 28-365 days with a step of 1
month
58-40%FA+2-20%C+40%S 7, 14, 21, 28, 90 and 365 days 28-365 days with a step of 1
month
53-35%FA+2-20%C+45%S 7, 14, 21, 28, 90 and 365 days 28-365 days with a step of 1
month
48-30%FA+2-20%C+50%S 7, 14, 21, 28, 90 and 365 days 28-365 days with a step of 1
month
43-25%FA+2-20%C+55%S 7, 14, 21, 28, 90 and 365 days 28-365 days with a step of 1
month
38-20%FA+2-20%C+60%S 7, 14, 21, 28, 90 and 365 days 28-365 days with a step of 1
month
8 Malaysian Journal of Civil Engineering 27(1):1-24(2015)
4.0 Results and Discussion
4.1 Compressive Strength of Fly Ash Mixed with Electroplating Waste
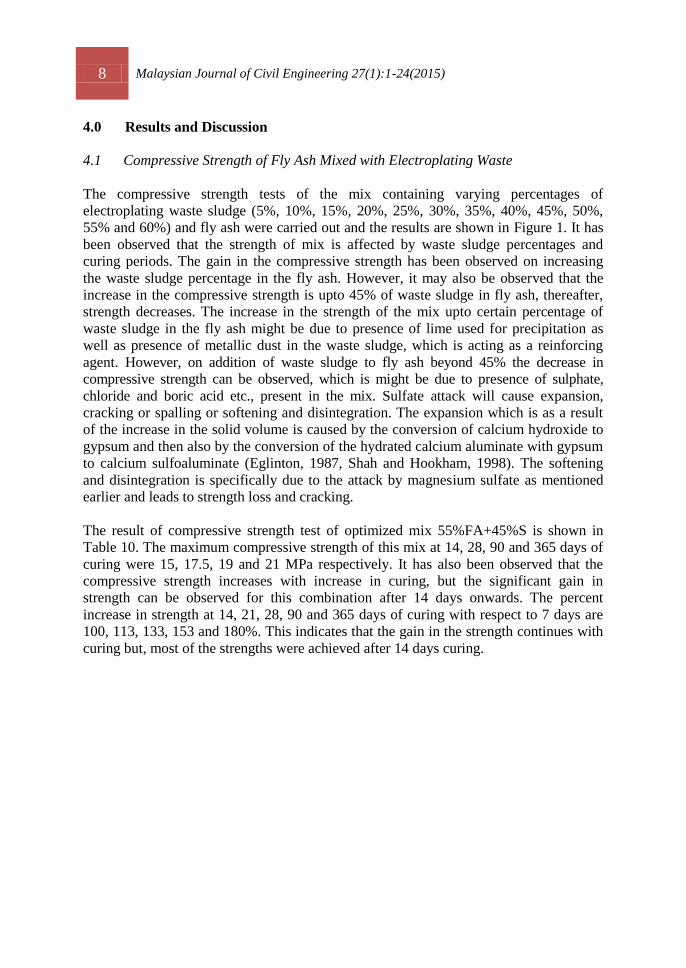
The compressive strength tests of the mix containing varying percentages of
electroplating waste sludge (5%, 10%, 15%, 20%, 25%, 30%, 35%, 40%, 45%, 50%,
55% and 60%) and fly ash were carried out and the results are shown in Figure 1. It has
been observed that the strength of mix is affected by waste sludge percentages and
curing periods. The gain in the compressive strength has been observed on increasing
the waste sludge percentage in the fly ash. However, it may also be observed that the
increase in the compressive strength is upto 45% of waste sludge in fly ash, thereafter,
strength decreases. The increase in the strength of the mix upto certain percentage of
waste sludge in the fly ash might be due to presence of lime used for precipitation as
well as presence of metallic dust in the waste sludge, which is acting as a reinforcing
agent. However, on addition of waste sludge to fly ash beyond 45% the decrease in
compressive strength can be observed, which is might be due to presence of sulphate,
chloride and boric acid etc., present in the mix. Sulfate attack will cause expansion,
cracking or spalling or softening and disintegration. The expansion which is as a result
of the increase in the solid volume is caused by the conversion of calcium hydroxide to
gypsum and then also by the conversion of the hydrated calcium aluminate with gypsum
to calcium sulfoaluminate (Eglinton, 1987, Shah and Hookham, 1998). The softening
and disintegration is specifically due to the attack by magnesium sulfate as mentioned
earlier and leads to strength loss and cracking.
The result of compressive strength test of optimized mix 55%FA+45%S is shown in
Table 10. The maximum compressive strength of this mix at 14, 28, 90 and 365 days of
curing were 15, 17.5, 19 and 21 MPa respectively. It has also been observed that the
compressive strength increases with increase in curing, but the significant gain in
strength can be observed for this combination after 14 days onwards. The percent
increase in strength at 14, 21, 28, 90 and 365 days of curing with respect to 7 days are
100, 113, 133, 153 and 180%. This indicates that the gain in the strength continues with
curing but, most of the strengths were achieved after 14 days curing.
Malaysian Journal of Civil Engineering 27(1):1-24(2015) 9
Figure 1 : Plain Fly ash (FA) with Waste Sludge (S)
Table 10 : Variation of Optimized Mix with Curing Period
Waste
(%)
Curing (days)
7 14 21 28 90 365
Compressive Strength of 55%FA+45%S mix
(MPa)
7.5 15.0 16.0 17.5 19.0 21.0
Increase in Strength of mix
55%FA+45%S with 7 days of curing
- 100 113 133 153 180
4.2 Compressive Strength of Fly Ash Mixed with Cement
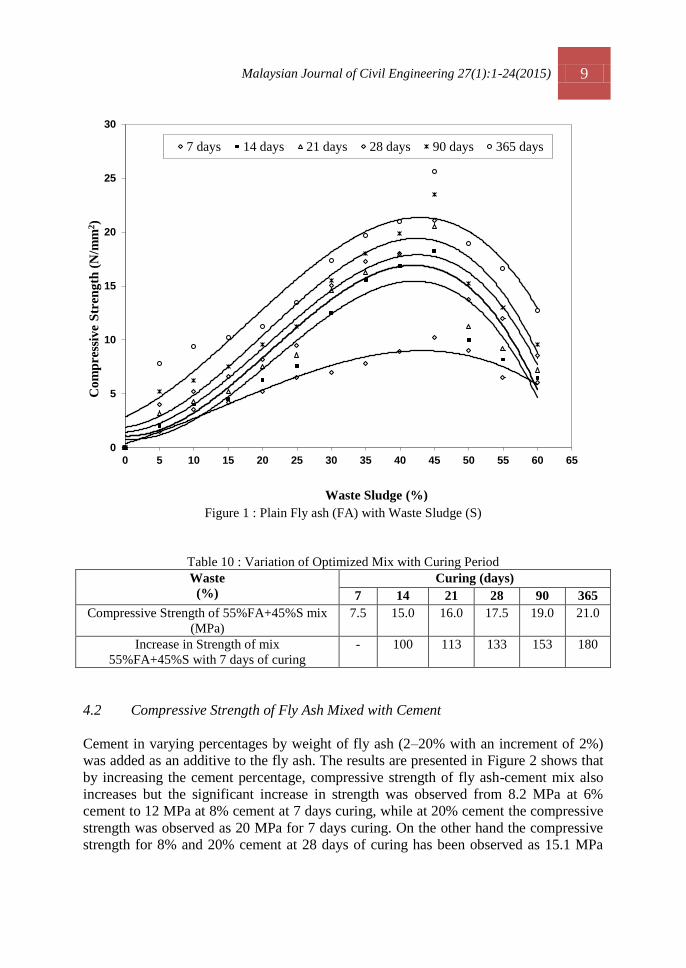
Cement in varying percentages by weight of fly ash (2–20% with an increment of 2%)
was added as an additive to the fly ash. The results are presented in Figure 2 shows that
by increasing the cement percentage, compressive strength of fly ash-cement mix also
increases but the significant increase in strength was observed from 8.2 MPa at 6%
cement to 12 MPa at 8% cement at 7 days curing, while at 20% cement the compressive
strength was observed as 20 MPa for 7 days curing. On the other hand the compressive
strength for 8% and 20% cement at 28 days of curing has been observed as 15.1 MPa
0
5
10
15
20
25
30
0 5 10 15 20 25 30 35 40 45 50 55 60 65
Co
mp
ress
ive
Str
eng
th (
N/m
m2)
Waste Sludge (%)
7 days 14 days 21 days 28 days 90 days 365 days
10 Malaysian Journal of Civil Engineering 27(1):1-24(2015)
and 27 MPa respectively. Therefore, for economical considerations the optimum
percentages of cement may be considered as 8% for further studies.
Figure 2 : Plain Fly ash with Cement
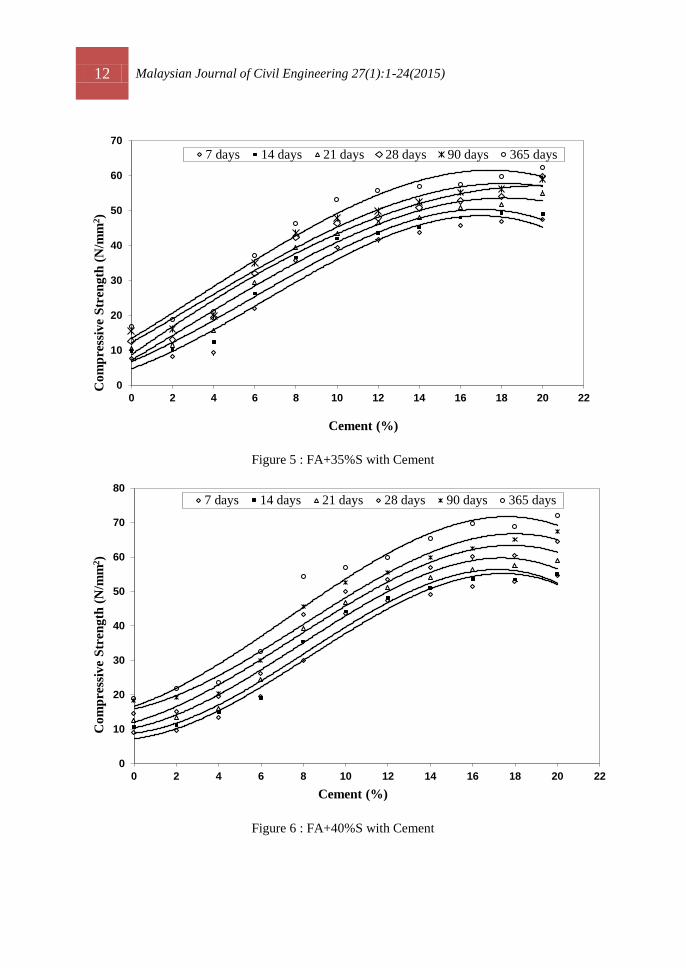
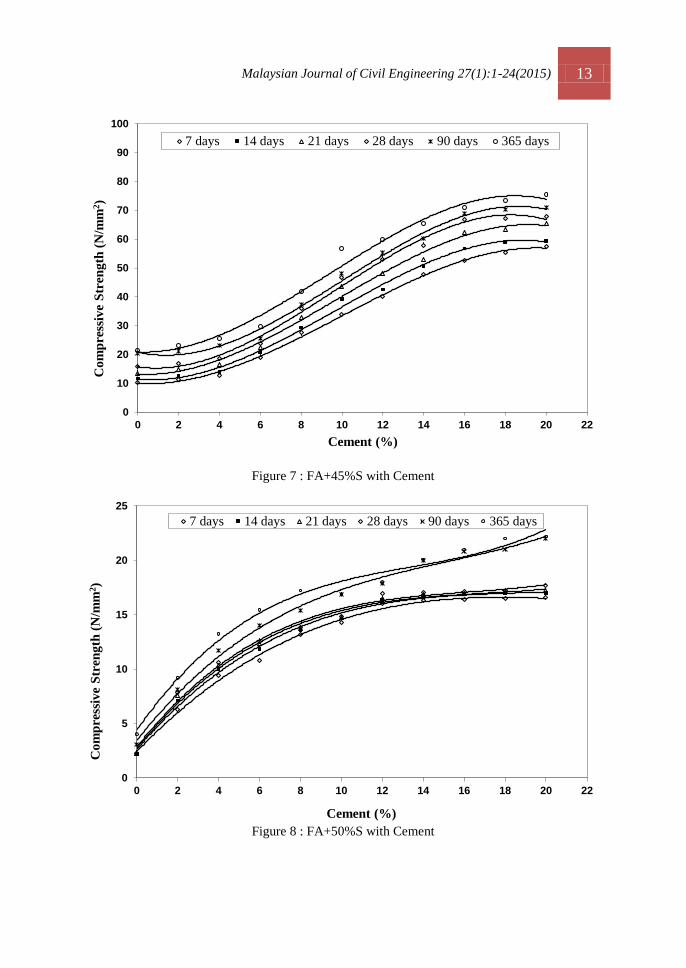
4.3 Compressive Strength of Fly Ash Mixed with Electroplating Waste and Cement
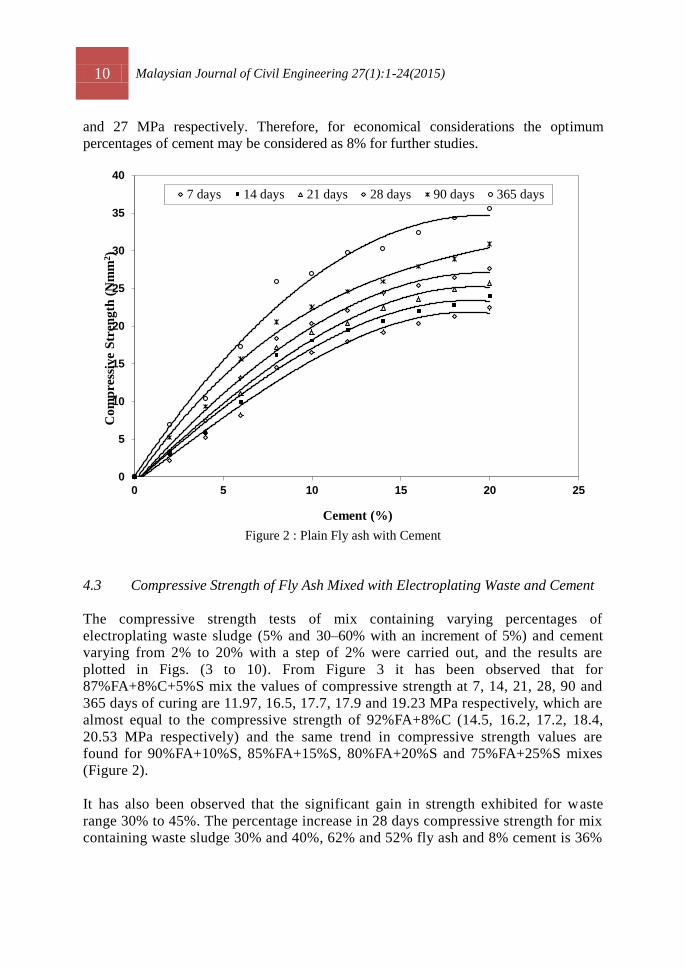
The compressive strength tests of mix containing varying percentages of
electroplating waste sludge (5% and 30–60% with an increment of 5%) and cement
varying from 2% to 20% with a step of 2% were carried out, and the results are
plotted in Figs. (3 to 10). From Figure 3 it has been observed that for
87%FA+8%C+5%S mix the values of compressive strength at 7, 14, 21, 28, 90 and
365 days of curing are 11.97, 16.5, 17.7, 17.9 and 19.23 MPa respectively, which are
almost equal to the compressive strength of 92%FA+8%C (14.5, 16.2, 17.2, 18.4,
20.53 MPa respectively) and the same trend in compressive strength values are
found for 90%FA+10%S, 85%FA+15%S, 80%FA+20%S and 75%FA+25%S mixes
(Figure 2).
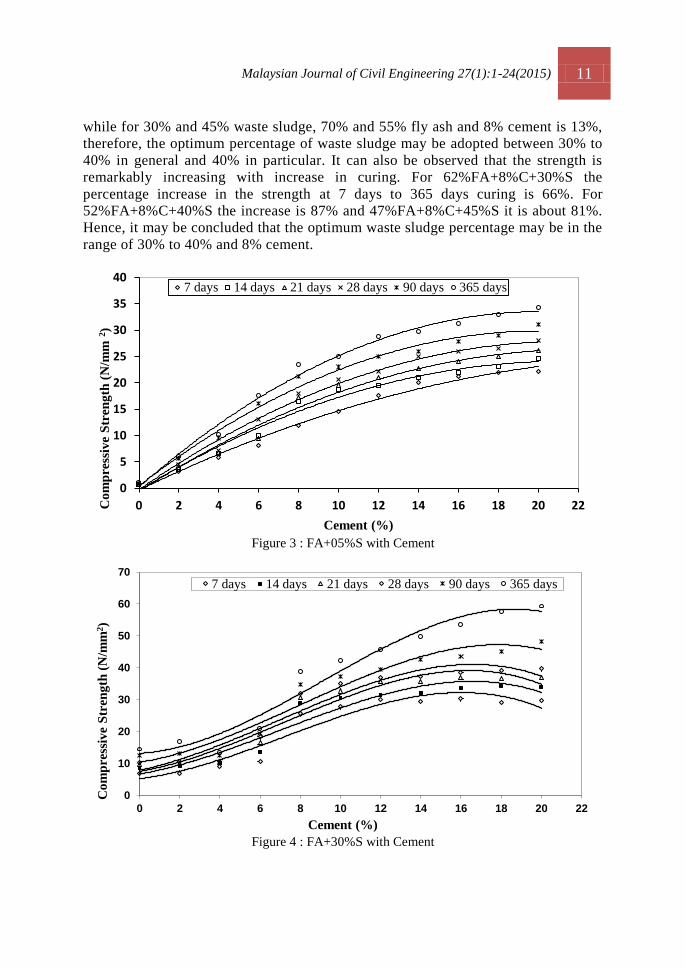
It has also been observed that the significant gain in strength exhibited for waste
range 30% to 45%. The percentage increase in 28 days compressive strength for mix
containing waste sludge 30% and 40%, 62% and 52% fly ash and 8% cement is 36%
0
5
10
15
20
25
30
35
40
0 5 10 15 20 25
Co
mp
ress
ive
Str
eng
th (
Nm
m2)
Cement (%)
7 days 14 days 21 days 28 days 90 days 365 days
Malaysian Journal of Civil Engineering 27(1):1-24(2015) 11
while for 30% and 45% waste sludge, 70% and 55% fly ash and 8% cement is 13%,
therefore, the optimum percentage of waste sludge may be adopted between 30% to
40% in general and 40% in particular. It can also be observed that the strength is
remarkably increasing with increase in curing. For 62%FA+8%C+30%S the
percentage increase in the strength at 7 days to 365 days curing is 66%. For
52%FA+8%C+40%S the increase is 87% and 47%FA+8%C+45%S it is about 81%.
Hence, it may be concluded that the optimum waste sludge percentage may be in the
range of 30% to 40% and 8% cement.
Figure 3 : FA+05%S with Cement
Figure 4 : FA+30%S with Cement
0
5
10
15
20
25
30
35
40
0 2 4 6 8 10 12 14 16 18 20 22Co
mp
ress
ive
Str
eng
th (
N/m
m 2
)
Cement (%)
7 days 14 days 21 days 28 days 90 days 365 days
0
10
20
30
40
50
60
70
0 2 4 6 8 10 12 14 16 18 20 22
Co
mp
ress
ive
Str
eng
th (
N/m
m2)
Cement (%)
7 days 14 days 21 days 28 days 90 days 365 days
12 Malaysian Journal of Civil Engineering 27(1):1-24(2015)
Figure 5 : FA+35%S with Cement
Figure 6 : FA+40%S with Cement
0
10
20
30
40
50
60
70
0 2 4 6 8 10 12 14 16 18 20 22
Co
mp
ress
ive
Str
eng
th (
N/m
m2)
Cement (%)
7 days 14 days 21 days 28 days 90 days 365 days
0
10
20
30
40
50
60
70
80
0 2 4 6 8 10 12 14 16 18 20 22
Co
mp
ress
ive S
tren
gth
(N
/mm
2)
Cement (%)
7 days 14 days 21 days 28 days 90 days 365 days
Malaysian Journal of Civil Engineering 27(1):1-24(2015) 13
Figure 7 : FA+45%S with Cement
Figure 8 : FA+50%S with Cement
0
5
10
15
20
25
0 2 4 6 8 10 12 14 16 18 20 22
Co
mp
ress
ive
Str
eng
th (
N/m
m2)
Cement (%)
7 days 14 days 21 days 28 days 90 days 365 days
0
10
20
30
40
50
60
70
80
90
100
0 2 4 6 8 10 12 14 16 18 20 22
Co
mp
ress
ive
Str
eng
th (
N/m
m2)
Cement (%)
7 days 14 days 21 days 28 days 90 days 365 days

14 Malaysian Journal of Civil Engineering 27(1):1-24(2015)
Figure 9 : FA+55%S with Cement
Figure 10 : FA+60%S with Cement
0
2
4
6
8
10
12
14
16
18
20
0 2 4 6 8 10 12 14 16 18 20 22
Co
mp
ress
ive
Str
eng
th (
N/m
m2)
Cement (%)
7 days 14 days 21 days 28 days 90 days 365 days
0
2
4
6
8
10
12
14
16
0 2 4 6 8 10 12 14 16 18 20 22
Co
mp
ress
ive
Str
eng
th (
N/m
m2)
Cement (%)
7 days 14 days 21 days 28 days 90 days 365 days

Malaysian Journal of Civil Engineering 27(1):1-24(2015) 15
The comparison of the 28 days compressive strength of present and previous studies
(Weng and Huang, 1994 and Sophia & Swaminathan, 2005) of fly ash-cement
stabilized metal waste sludge are presented in Table 11. The comparison clearly
shows that the strength of the cement stabilized metal-laden fly ash matrix is
superior to that of cement stabilized metal waste sludge. To produce more strength
of waste sludge-cement binder, additional treatment of the waste sludge may be
necessary, as it is observed from the present study. When waste sludge was
precipitated with 10% lime, the strength ratios were found substantially higher than
the reference specimen (92%FA+08%C). The mix (52%FA+8%C+40%S) gives
strength ratio as (2.13) which is much higher than the reference specimen (1.0).
Table 11 further showed that the strength of the mix was decreasing with an increase
in the plating waste sludge percentage which is in contrast with the present study.
However, the findings of the present study are similar to the study carried out by
Cioffi et al., 2002. The author has suggested that when waste sludge was treated with
lime its strength increases up to certain extent.
4.4 Scanning Electron Microscope for Microstructural Analysis of Stabilized Mix
4.4.1 Scanning Electron Micrograph (SEM) of Fly Ash
Figure 11 (a) shows the Scanning Electron Micrograph (SEM) for fly ash. The micrographic
observation for fly ash indicates presence of spherical particles in abundance, sub rounded
porous grains, irregular agglomerates, opaque spheres and irregular porous grains of
unburned carbon.
4.4.2 Scanning Electron Micrograph (SEM) of Lime Precipitated Waste Sludge
Figure 11 (b) illustrates the SEM-micrograph of lime precipitated electroplating waste
sludge. The micrograph shows an occurrence of detrital grains of silica dust and iron
rust fractions and lime as a matrix between the detrital grains. The specimen has been
characterized by open fabric system and occurrence of relatively large voids distributed
in the specimen.
4.4.3 Scanning Electron Micrograph (SEM) of 60%FA+40%S Mix at 28 days of Curing
Figure 12 shows a micrograph of 60%FA+40%S mix cured for 28 days. The micrograph
illustrates the formation of more new cementitous compounds after long-term curing
(spiny crystals) as a result of the pozzolanic reaction coating the aggregates and the fly
ash particles and filling the pore spaces (voids) between the flocs. These spiny crystals
led to the development of network of reinforcement and to an increase in the strength in
the long-term curing. The new cementitous compounds, in the long-term curing, were
grown within the pore spaces resulting in a reduction of the radius of the pore spaces.
16 Malaysian Journal of Civil Engineering 27(1):1-24(2015)
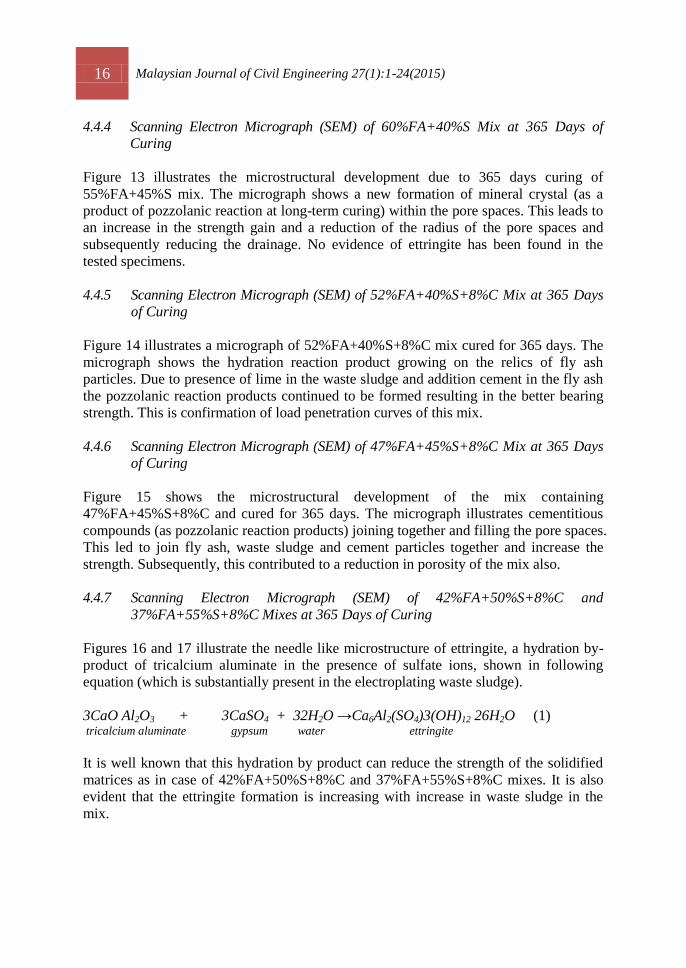
4.4.4 Scanning Electron Micrograph (SEM) of 60%FA+40%S Mix at 365 Days of
Curing
Figure 13 illustrates the microstructural development due to 365 days curing of
55%FA+45%S mix. The micrograph shows a new formation of mineral crystal (as a
product of pozzolanic reaction at long-term curing) within the pore spaces. This leads to
an increase in the strength gain and a reduction of the radius of the pore spaces and
subsequently reducing the drainage. No evidence of ettringite has been found in the
tested specimens.
4.4.5 Scanning Electron Micrograph (SEM) of 52%FA+40%S+8%C Mix at 365 Days
of Curing
Figure 14 illustrates a micrograph of 52%FA+40%S+8%C mix cured for 365 days. The
micrograph shows the hydration reaction product growing on the relics of fly ash
particles. Due to presence of lime in the waste sludge and addition cement in the fly ash
the pozzolanic reaction products continued to be formed resulting in the better bearing
strength. This is confirmation of load penetration curves of this mix.
4.4.6 Scanning Electron Micrograph (SEM) of 47%FA+45%S+8%C Mix at 365 Days
of Curing
Figure 15 shows the microstructural development of the mix containing
47%FA+45%S+8%C and cured for 365 days. The micrograph illustrates cementitious
compounds (as pozzolanic reaction products) joining together and filling the pore spaces.
This led to join fly ash, waste sludge and cement particles together and increase the
strength. Subsequently, this contributed to a reduction in porosity of the mix also.
4.4.7 Scanning Electron Micrograph (SEM) of 42%FA+50%S+8%C and
37%FA+55%S+8%C Mixes at 365 Days of Curing
Figures 16 and 17 illustrate the needle like microstructure of ettringite, a hydration by-
product of tricalcium aluminate in the presence of sulfate ions, shown in following
equation (which is substantially present in the electroplating waste sludge).
3CaO Al2O3 + 3CaSO4 + 32H2O →Ca6Al2(SO4)3(OH)12 26H2O (1) tricalcium aluminate gypsum water ettringite
It is well known that this hydration by product can reduce the strength of the solidified
matrices as in case of 42%FA+50%S+8%C and 37%FA+55%S+8%C mixes. It is also
evident that the ettringite formation is increasing with increase in waste sludge in the
mix.

Malaysian Journal of Civil Engineering 27(1):1-24(2015) 17
Table 11 : Comparison of 28 days Compressive Strength of Various Metal Waste Sludges
Stabilized by Fly ash and Cement
Matrix _W__
(C+F)a
Strength
(N/mm2)
Strength
Ratiob
Source
Cement (reference specimen) 0.50 35.5 1.00 Claudio and Sobrinho (1990)c
Cement+metal+waste sludge 0.50 1.4 0.04 Claudio and Sobrinho (1990)c
Cement (reference specimen) 0.50 41.1 1.00 Tay (1987)
Cement+10% waste sludge 0.50 41.0 1.00 Tay (1987)
Cement (reference specimen) 0.45 24.4 1.00 Weng and Huang (1994)
Cement+10% Cd laden fly ash 0.45 21.3 0.87 Weng and Huang (1994)
Cement+10% Zn laden fly ash 0.45 21.3 0.87 Weng and Huang (1994)
Cement+10% fly ash 0.45 22.5 0.92 Weng and Huang (1994)
Cement (reference specimen) 0.38 25.0 1.00 Sophia and Swaminathan (2005)
60%S+30%C+10%FA 0.38 06.0 0.24 Sophia and Swaminathan (2005)
60%S+10%C+30%FA 0.38 05.0 0.20 Sophia and Swaminathan (2005)
70%S+20%C+10%FA 0.38 04.0 0.16 Sophia and Swaminathan (2005)
70%S+10%C+20%FA 0.38 03.0 0.12 Sophia and Swaminathan (2005)
80%S+10%C+10%FA 0.38 02.0 0.08 Sophia and Swaminathan (2005)
90%S+05%C+05%FA 0.38 01.0 0.04 Sophia and Swaminathan (2005)
92%FA+8%C(reference
specimen)
0.65 18.40 1.00 Present study
70%FA+30%S 0.30 15.00 0.82 Present study
65%FA+35%S 0.35 17.00 0.92 Present study
60%FA+40%S 0.40 18.00 0.98 Present study
55%FA+45%S 0.45 18.50 1.01 Present study
50%FA+50%S 0.50 16.70 0.91 Present study
45%FA+55%S 0.55 16.00 0.87 Present study
40%FA+60%S 0.60 08.50 0.47 Present study
87%FA+8%C+05%S 0.05 17.90 0.99 Present study
62%FA+8%C+30%S 0.42 26.90 1.46 Present study
57%FA+8%C+35%S 0.53 36.60 1.99 Present study
52%FA+8%C+40%S 0.66 39.20 2.13 Present study
47%FA+8%C+45%S 0.81 36.00 2.00 Present study
42%FA+8%C+50%S 1.00 13.80 0.76 Present study
37%FA+8%C+55%S 1.22 10.87 0.60 Present study
32%FA+8%C+60%S 1.50 08.20 0.45 Present study aWater-to-binder ratio bWith respect to that of reference specimen cBrazil portland cement and cylinder molds 3.3 cm in diameter and 1 cm long were used waste sludges were
obtained from electroplating treatment plant

18 Malaysian Journal of Civil Engineering 27(1):1-24(2015)
(a) (b)
Figure 11 : Scanning Electron Micrograph (SEM) of (a) Fly ash
(b) Lime Precipitated Electroplating Waste Sludge
Figure 12: SEM of 60%FA+40%S Figure 13: SEM of 55%FA+45%S
Spherical
Particle
Flocs
Formation
Non-porous Formation
Detrital grains

Malaysian Journal of Civil Engineering 27(1):1-24(2015) 19
Figure 14 : SEM of 52%FA+40%S+8%C Figure 15 : SEM of 47%FA+45%S+8%C
Figure 16 : SEM of 42%FA+50%S+8%C Figure 17 : SEM of 37%FA+ 55%S+8% C
4.5 Leaching Test
The data of TCLP test for different mixes are presented in Tables 12 and 13. Table 12
shows TCLP results including pH values of the mixes after 28 days of curing. It is
observed that the pH of the leachate is between 6.9-10.9. Which is in the conformity to
the values suggested by (US EPA, 1992, EEC, 1991 and DIN, 1984) for stabilization of
heavy metals, higher pH conditions were preferred as most of the metal hydroxides
have minimum solubility in pH range between 4-13. The reduction in leachability was
related to combined effect of micro encapsulation and chemical fixation.
It has also been observed from Tables 12 that the limits of the heavy metals (Ni=1.65, Cr=
0.038, Zn=1.02, Cd=0.009, Cu=1.05 and Pb=0.095) present in the leachate of the mix
Ettringite
Formation
Non-porous Formation
Non-porous Formation
Ettringite
Formation
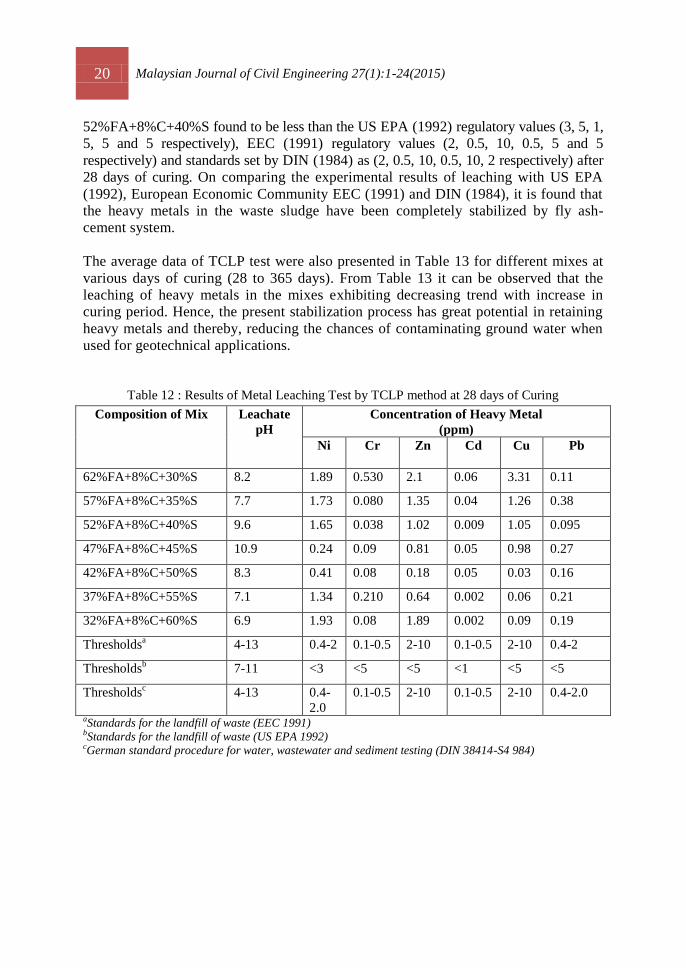
20 Malaysian Journal of Civil Engineering 27(1):1-24(2015)
52%FA+8%C+40%S found to be less than the US EPA (1992) regulatory values (3, 5, 1,
5, 5 and 5 respectively), EEC (1991) regulatory values (2, 0.5, 10, 0.5, 5 and 5
respectively) and standards set by DIN (1984) as (2, 0.5, 10, 0.5, 10, 2 respectively) after
28 days of curing. On comparing the experimental results of leaching with US EPA
(1992), European Economic Community EEC (1991) and DIN (1984), it is found that
the heavy metals in the waste sludge have been completely stabilized by fly ash-
cement system.
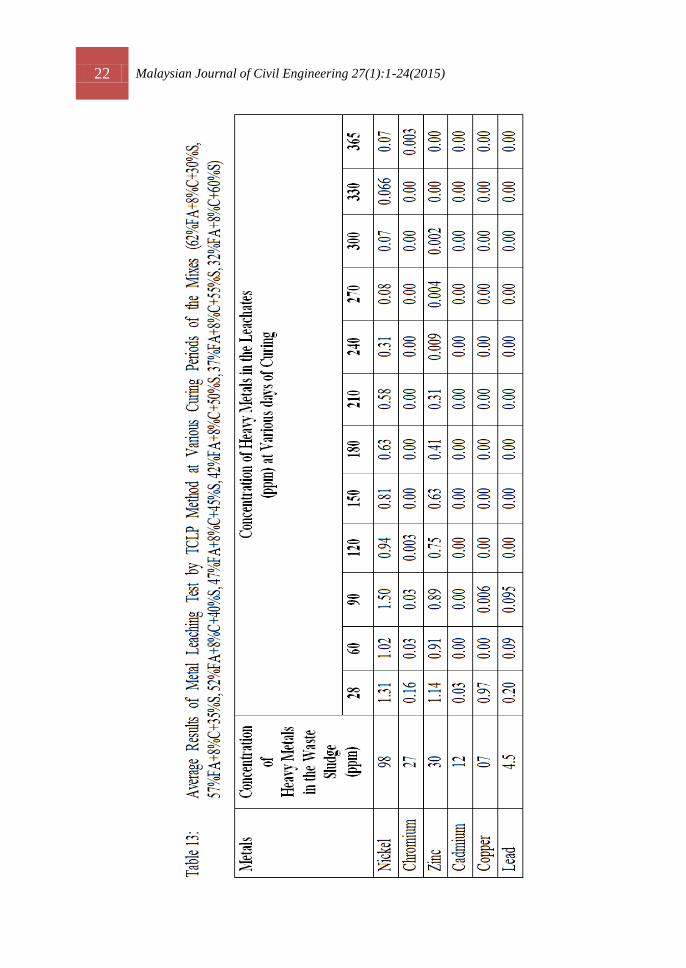
The average data of TCLP test were also presented in Table 13 for different mixes at
various days of curing (28 to 365 days). From Table 13 it can be observed that the
leaching of heavy metals in the mixes exhibiting decreasing trend with increase in
curing period. Hence, the present stabilization process has great potential in retaining
heavy metals and thereby, reducing the chances of contaminating ground water when
used for geotechnical applications.
Table 12 : Results of Metal Leaching Test by TCLP method at 28 days of Curing
aStandards for the landfill of waste (EEC 1991) bStandards for the landfill of waste (US EPA 1992) cGerman standard procedure for water, wastewater and sediment testing (DIN 38414-S4 984)
Composition of Mix Leachate
pH
Concentration of Heavy Metal
(ppm)
Ni Cr Zn Cd Cu Pb
62%FA+8%C+30%S 8.2 1.89 0.530 2.1 0.06 3.31 0.11
57%FA+8%C+35%S 7.7 1.73 0.080 1.35 0.04 1.26 0.38
52%FA+8%C+40%S 9.6 1.65 0.038 1.02 0.009 1.05 0.095
47%FA+8%C+45%S 10.9 0.24 0.09 0.81 0.05 0.98 0.27
42%FA+8%C+50%S 8.3 0.41 0.08 0.18 0.05 0.03 0.16
37%FA+8%C+55%S 7.1 1.34 0.210 0.64 0.002 0.06 0.21
32%FA+8%C+60%S 6.9 1.93 0.08 1.89 0.002 0.09 0.19
Thresholdsa 4-13 0.4-2 0.1-0.5 2-10 0.1-0.5 2-10 0.4-2
Thresholdsb 7-11 <3 <5 <5 <1 <5 <5
Thresholdsc 4-13 0.4-
2.0
0.1-0.5 2-10 0.1-0.5 2-10 0.4-2.0

Malaysian Journal of Civil Engineering 27(1):1-24(2015) 21
5.0 Conclusions
On the basis of the present study, the following conclusions were drawn:
The compressive strength of mix 52%FA+8%C+40%S has been observed
as 37, 39 and 45 MPa at 28, 90 and 365 days of curing respectively.
The maximum compressive strength of mix 55%FA+45%S at 28, 90 and
365 days of curing were 18.5, 20 and 23 MPa respectively.
As curing time increases, the compressive strength also increases, which
shows that the mix is strong and durable. The significant increase in
compressive strength is observed between 14 to 28 days of curing periods.
However, on increasing the curing time up to 90 days, the mix not only
maintains its strength but also the enhancement in strength continues.
The pH values of the mixes were also found in the range of 6.9-10.9 at
which the solubility of heavy metals is minimum.
On analyzing the mix by atomic absorption spectrophotometer (AAS), it
has been observed that the concentration of heavy metals in the leachate is
drastically reduced. This process is so effective that it immobilizes 97 to
100% heavy metals in the leachate.
It is also observed that the quantity of waste sludge could be added
maximum up to 45% in the fly ash. The addition of waste sludge beyond 45%
decreased the strength of the mix due to development of shrinkage cracks.
22 Malaysian Journal of Civil Engineering 27(1):1-24(2015)
Malaysian Journal of Civil Engineering 27(1):1-24(2015) 23
References
Aubert, J. E., Husson, B., Sarramone, N. (2007). Utilization of municipal solid waste incineration
(MSWI) fly ash in blended cement. Part 2. Mechanical strength of mortars and environmental
impact.J Hazard Mat 146(1–2): 12–19.
Cetin, B., Aydilek, A. H., Li, L. (2012). Experimental and numerical analysis of metal leaching
from fly ash-amended highway bases. Waste Management,
doi:10.1016/j.wasman.2011.12.012.
Chang, J. E., Lin, T. T., Ko, M. S., and Liaw, D. S. (1999). Stabilization/Solidification of sludges
containing heavy metals by using cement and waste pozzolans. Journal of Environmental
Science Health, 34(5): 1143–1160.
Cioffi, R., Lavorgna, M., and Santoro, L. (2002). Environmental and technological effectiveness
of a process for the stabilization of a galvanic sludge. Journal of Hazardous Materials, B 89:
165–175.
Colangelo, F., Cioffi, R., Montagnaro, F., Santoro, L. (2012). Soluble salt removal from MSWI
fly ash and its stabilization for safer disposal and recovery as road basement material. Waste
Management, 32 (6): 1179-1185.
DIN 38414 S4(1984). German standard procedure for water, wastewater and sludge analysis,
sludge and sediments group S., determination of water leachability. Benthe-Vertrieb, Berlin
and Ko¨ln, Germany.
EEC: Proposal for a council directorate on the landfill of wastes. Draft on 30 May 1991, COM
(91), 102 final-SYN 335, European Economic Community, Brussels (1991).
Eglinton, M. (1998). Resistance of concrete to destructive agencies. Lea’s chemistry of cement
and concrete. Fourth Edition. Arnold, 299–342.
Fly ash status summary report in India (2005). International Centre for Sustainable Development
of Cement and Concrete (ICON), CANMET, Natural Resources Canada, and the
Confederation of Indian Industry (CII).
Gitari, W.M., Petrik, L. F., Key, D. L., Okujeni, C. (2010). Partitioning of major and trace
inorganic contaminants in fly ash acid mine drainage derived solid residues. Int. J. Environ.
Sci. Tech. 7(3): 519–534.
Halim, C. E., Amal, R., Beydoun, D., Scott, J. A., and Low, G. (2003). Evaluating the
applicability of a modified toxicity characteristic leaching procedure (TCLP) for the
classification of cementitious wastes containing lead and cadmium. Journal of Hazardous
Materials, B 103: 125–140.
Hillier, S. R., Sangha, C. M., Plunkett, B. A., and Walden, P. J. (1999). Long-term leaching of
toxic trace metals from Portland cement concrete. Cement Concrete Research, 29: 515–521.
IS: 10500(1991). Desirable limits for drinking water. BIS, New Delhi.
IS: 1498 (1987). Classification and identification of soils for general engineering purposes. BIS,
New Delhi.
IS: 269 (1989). Ordinary Portland cement, 33 grade-specifications. BIS, New Delhi.
IS: 2720 Part 7 (1987). Methods of test for soils: part 7 determination of water content dry
density relation using light compaction. BIS, New Delhi.
IS: 4031-Part 6 (1988). Compressive strength of hydraulic cement. BIS, New Delhi.
Maschio, S., Tonello, G., Piani, L., Furlani, E. (2011). Fly and bottom ashes from biomass
combustion as cement replacing components in mortars production: rheological behaviour of
the pastes and materials compression strength. Chemosphere, 85(4): 666–671.
24 Malaysian Journal of Civil Engineering 27(1):1-24(2015)
Poon, C. S., Qiao, X. C., Lin, Z. S. (2003). Pozzolanic properties of reject fly ash in blended
cement pastes. Cement Concrete Research, 33(11):1857–1865.
Poon, Chi S., Chen, Zu Q., and Wai, Onyx W. H. (2001). The effect of flow through leaching on
the diffusivity of heavy metals in stabilized/solidified wastes. Journal of Hazardous Materials,
B81: 179–192.
Shah, V. N., and Hookham, C. J. (1998). Long-term ageing of light water reactor concrete
containments. Nuclear Engineering and Design, 185: 51–81.
Sophia, C. A., and Swaminathan, K. (2005). Assessment of the mechanical stability and chemical
leachability of immobilized electroplating waste. Chemosphere, 58: 75–82.
US EPA (1992). Test methods for evaluating solid waste. 1C, Method 1311, Washington, DC.
Weng, C. H., and Huang, C. P. (1994). Treatment of metal industrial waste water by fly ash and
cement fixation. Journal of Environmental Engineering, 120 (6): 1470–1487.
Wu, K., Shi, H., De. Schutter, G., Guo, X. Ye., G. (2012). Preparation of alinite cement from
municipal solid waste incineration fly ash. Cement Concrete Research, 34(3): 322–327.
Zheng, L., Wang, W., Shi, Y. (2010). The effects of alkaline dose and Si/Al ratio on the
immobilization of heavy metals in municipal solid waste incineration fly ash-based
geopolymer. Chemosphere, 79(6): 665–671.
Related Documents


