Long Run Growth Chapter 26

Long Run Growth Chapter 26. Wide Variation in Income per Capita, 2000.
Dec 22, 2015
Welcome message from author
This document is posted to help you gain knowledge. Please leave a comment to let me know what you think about it! Share it to your friends and learn new things together.
Transcript

Long Run Growth
Chapter 26
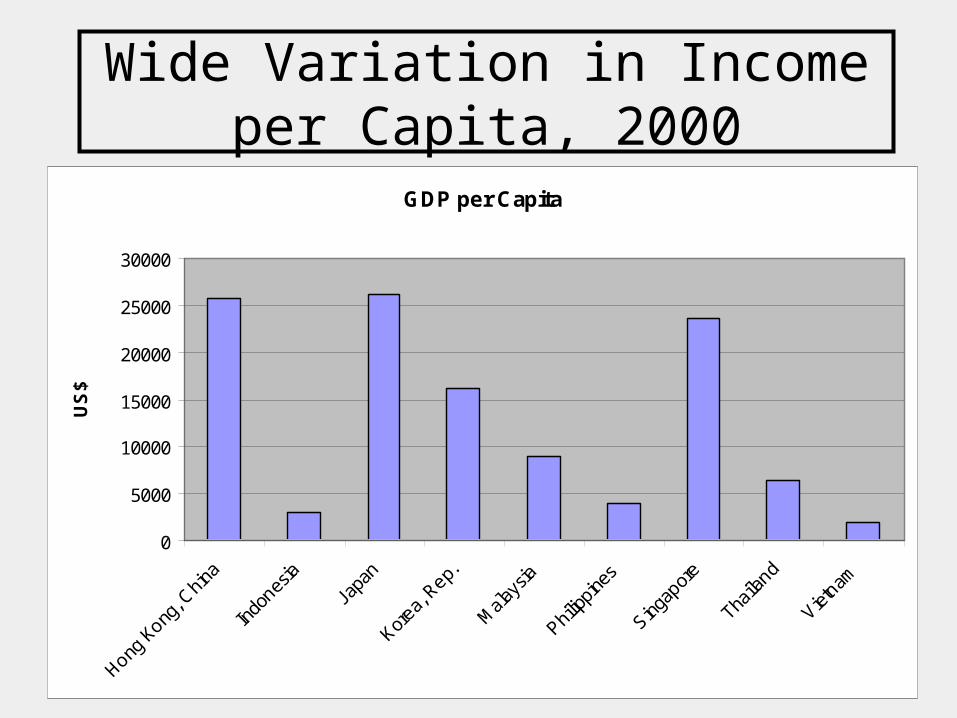
Wide Variation in Income per Capita, 2000
GDP per Capita
0
5000
10000
15000
20000
25000
30000
Hong K
ong, C
hina
Indo
nesia
Japa
n
Korea,
Rep.
Mala
ysia
Philipp
ines
Singap
ore
Thaila
nd
Vietnam
US
$
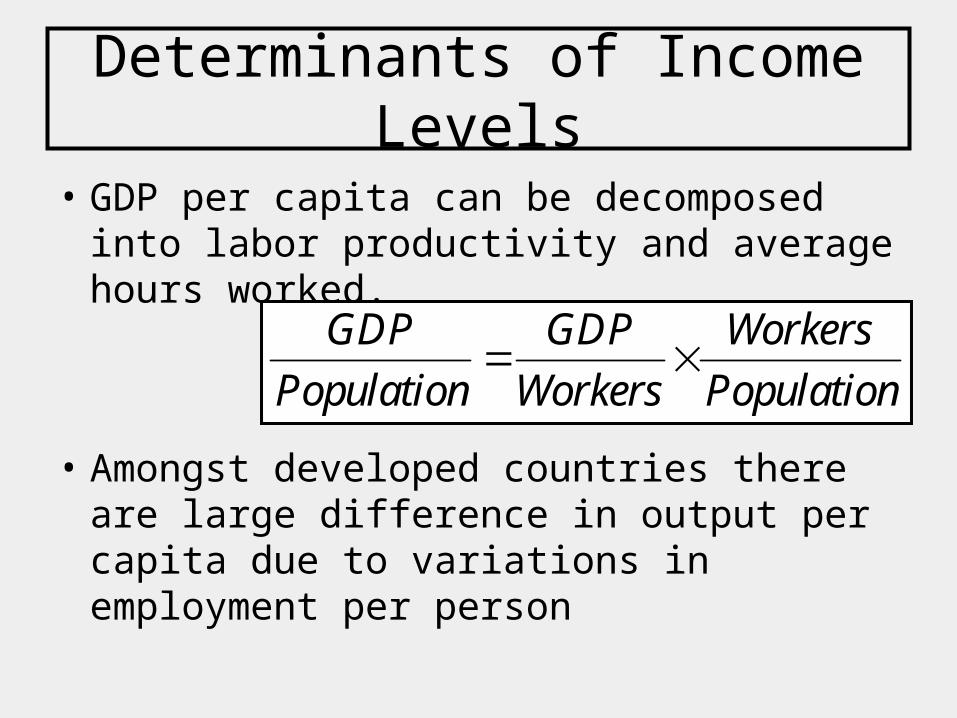
Determinants of Income Levels
• GDP per capita can be decomposed into labor productivity and average hours worked.
• Amongst developed countries there are large difference in output per capita due to variations in employment per person
GDP GDP Workers
Population Workers Population
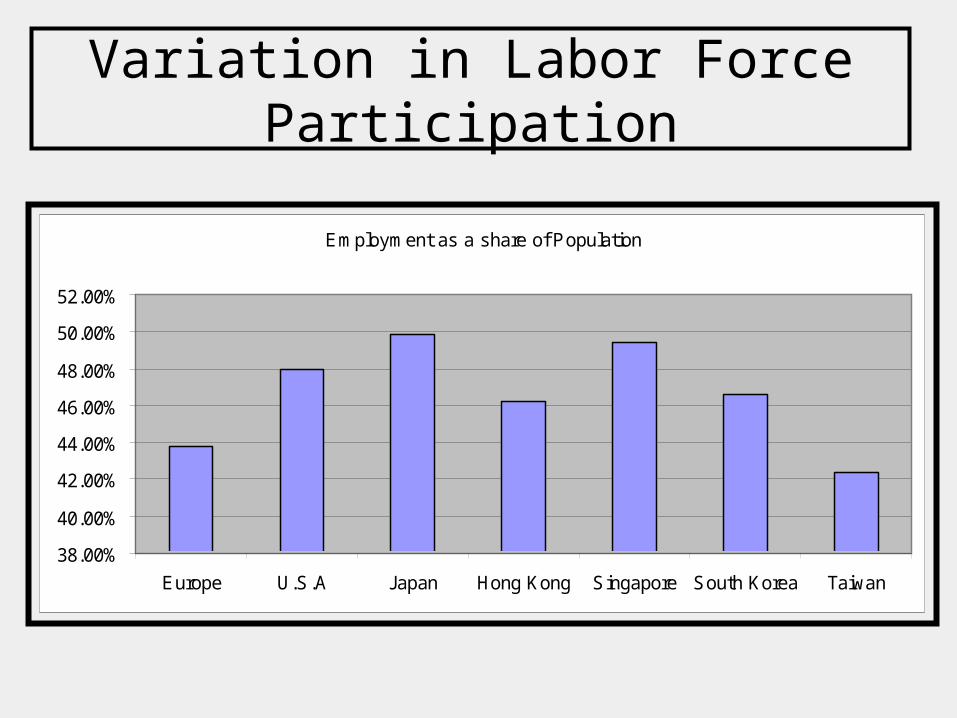
Variation in Labor Force Participation
Employment as a share of Population
38.00%
40.00%
42.00%
44.00%
46.00%
48.00%
50.00%
52.00%
Europe U.S.A Japan Hong Kong Singapore South Korea Taiwan
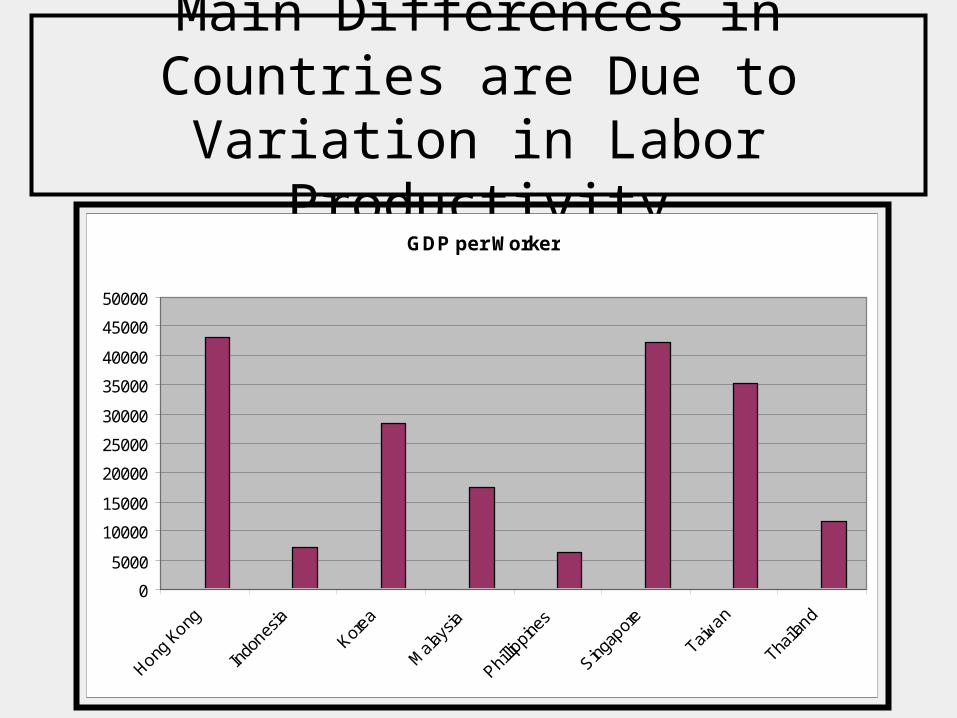
Main Differences in Countries are Due to Variation in Labor
ProductivityGDP per Worker
0
5000
10000
15000
20000
25000
30000
35000
40000
45000
50000
Hong K
ong
Indo
nesia
Korea
Mala
ysia
Phillip
pines
Singap
ore
Taiwan
Thaila
nd

Post war International Growth Facts
• After WWII, the developed countries untouched by the war had a big lead in terms of output per capita over war-damaged countries and colonial possessions.
• During the remaining years, some regions of the World have closed the gap (notably W. Europe and East Asia).
• Others have fallen behind.
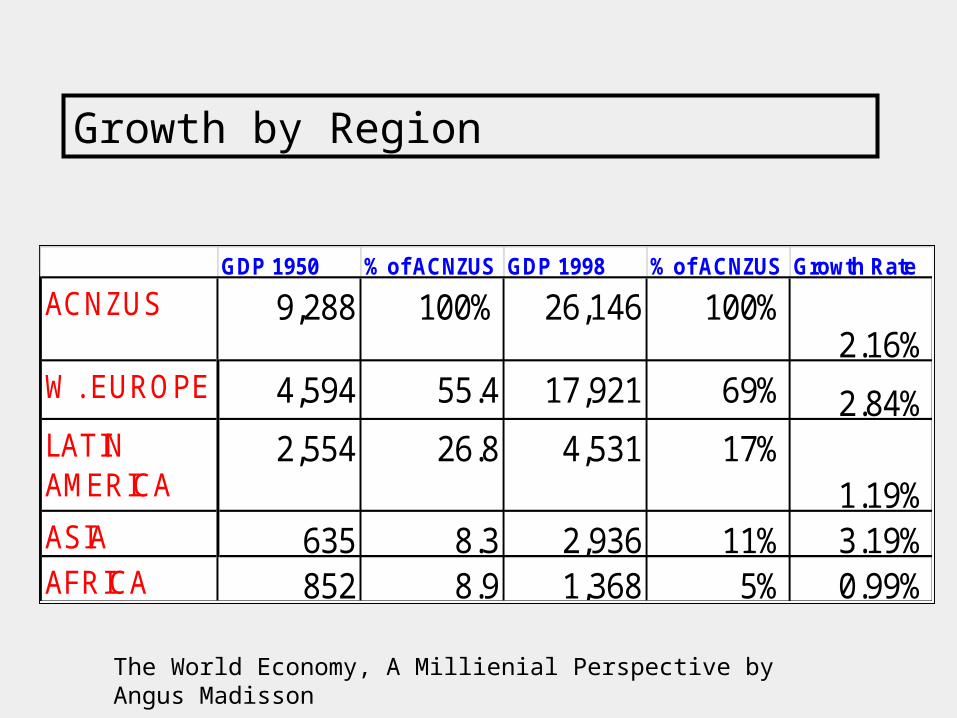
GDP 1950 % of ACNZUS GDP 1998 % of ACNZUS Growth Rate
ACNZUS 9,288 100% 26,146 100%2.16%
W. EUROPE 4,594 55.4 17,921 69% 2.84%LATIN AMERICA
2,554 26.8 4,531 17%1.19%
ASIA 635 8.3 2,936 11% 3.19%AFRICA 852 8.9 1,368 5% 0.99%
Growth by Region
The World Economy, A Millienial Perspective by Angus Madisson
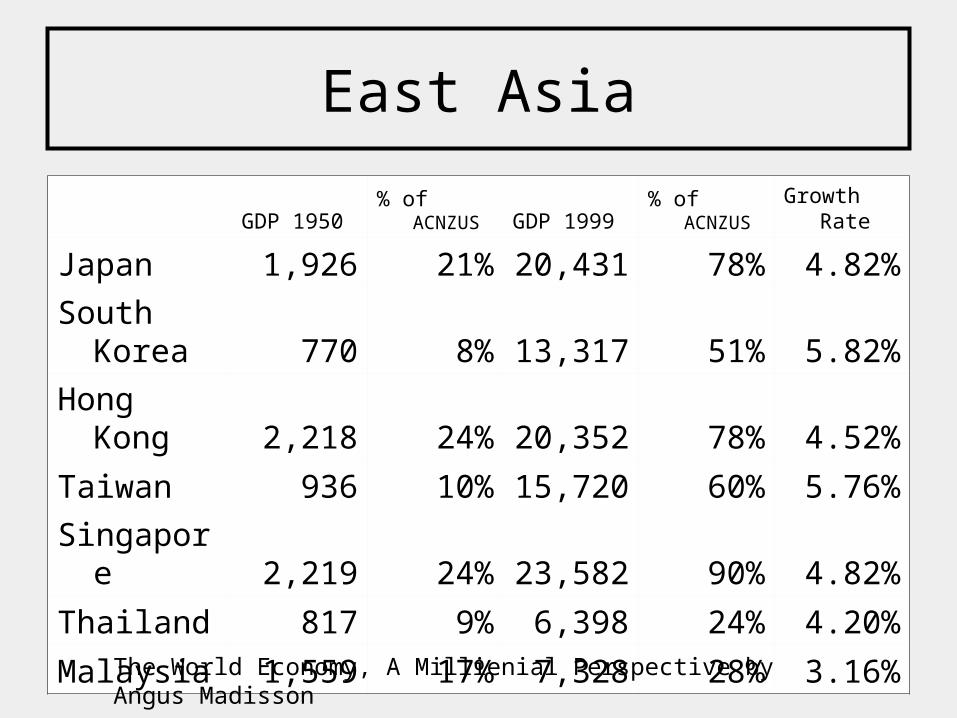
East Asia
GDP 1950% of
ACNZUS GDP 1999% of
ACNZUS
Growth Rate
Japan 1,926 21% 20,431 78% 4.82%
South Korea 770 8% 13,317 51% 5.82%
Hong Kong 2,218 24% 20,352 78% 4.52%
Taiwan 936 10% 15,720 60% 5.76%
Singapore 2,219 24% 23,582 90% 4.82%
Thailand 817 9% 6,398 24% 4.20%
Malaysia 1,559 17% 7,328 28% 3.16%
The World Economy, A Millienial Perspective by Angus Madisson

Growth Rates• What are the implications of the productivity
growth upsurge in the US?
• Rule of 70. If a country grows at g%, every year it will double in size every years.
• In 1996, US labor productivity was about 5% higher than France.
70g

Determinants of Labor Productivity
• Capital per Worker, K/L, is the value of machines, structures and equipment used to produce goods.
• Human Capital per Worker, H/L is the average education and experience of the workforce
• Technology, T, is the available Techniques and Ideas for producing goods and efficiency with which they are used.
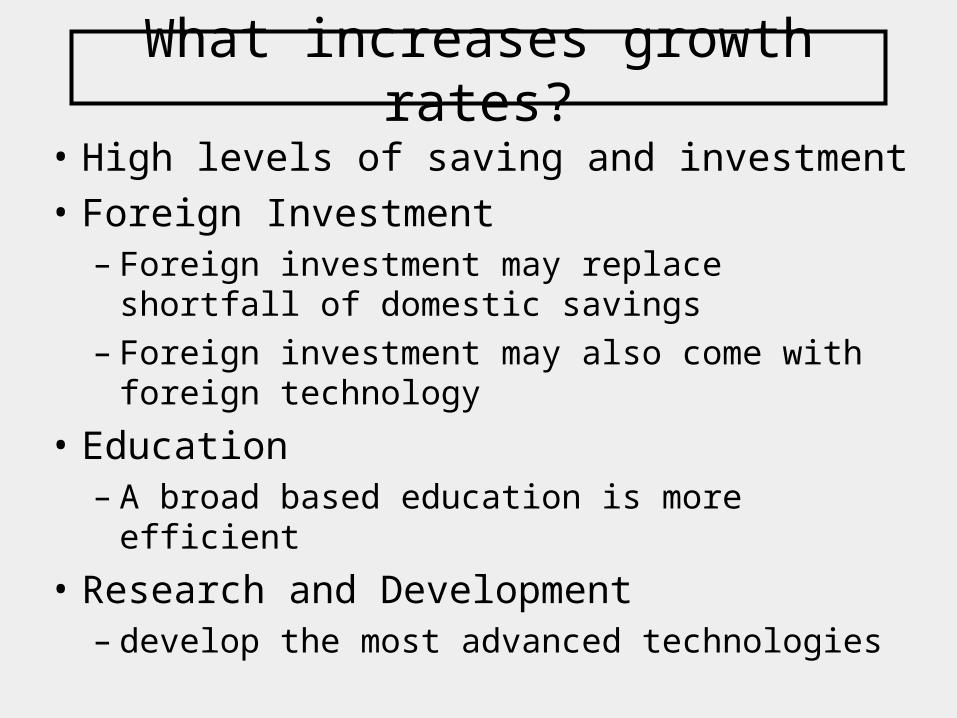
What increases growth rates?
• High levels of saving and investment
• Foreign Investment– Foreign investment may replace shortfall of
domestic savings– Foreign investment may also come with foreign
technology
• Education– A broad based education is more efficient
• Research and Development– develop the most advanced technologies
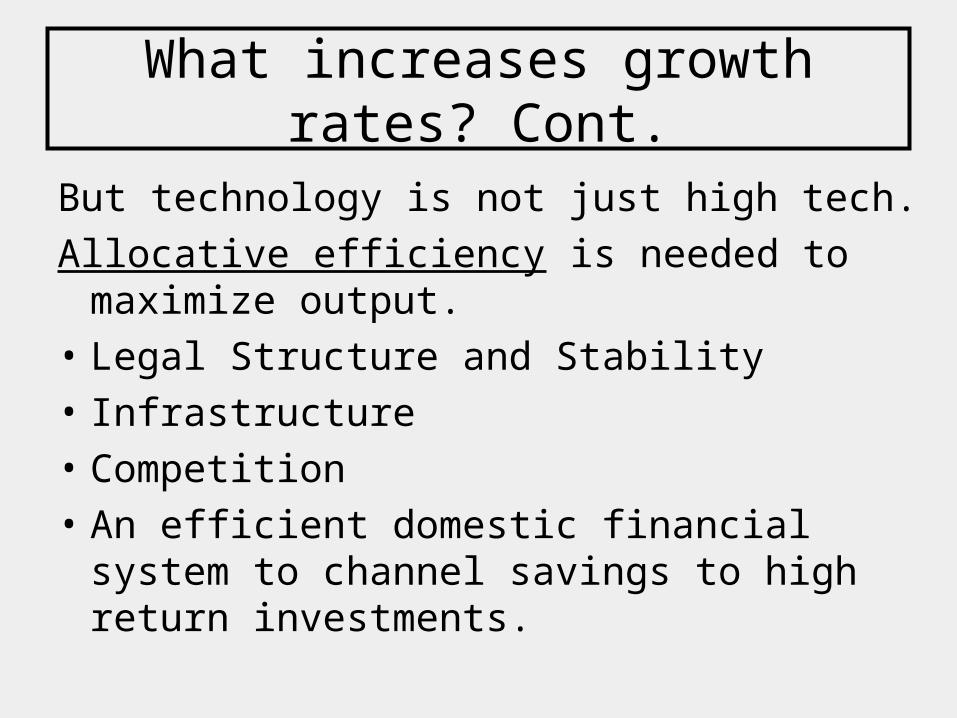
What increases growth rates? Cont.
But technology is not just high tech.
Allocative efficiency is needed to maximize output.
• Legal Structure and Stability
• Infrastructure
• Competition
• An efficient domestic financial system to channel savings to high return investments.
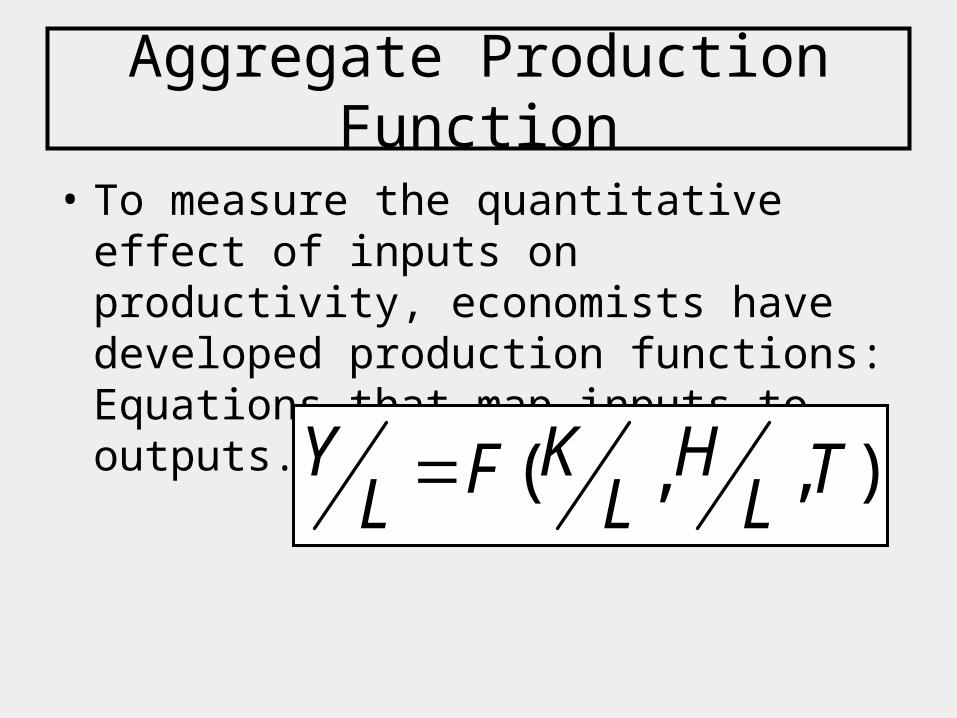
Aggregate Production Function
• To measure the quantitative effect of inputs on productivity, economists have developed production functions: Equations that map inputs to outputs.
( , , )Y K HF TL L L
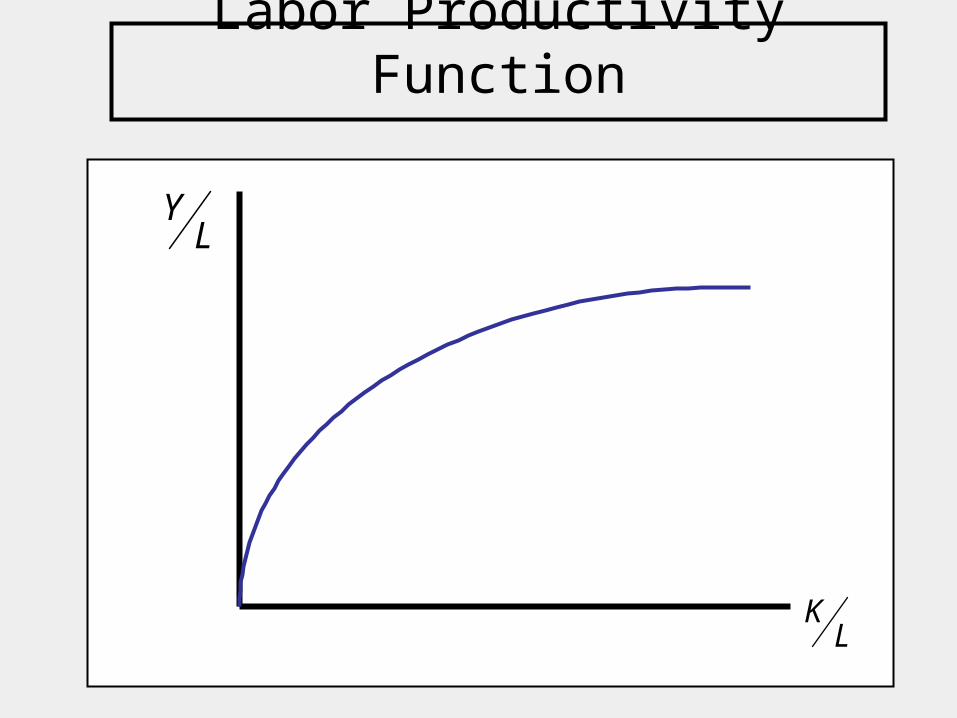
Labor Productivity Function
KL
YL
Marginal Product of Capital/ Real Returns to Capital
• The marginal product of capital is the extra real output generated by investing in new capital equipment.– Capital investment has diminishing returns.
Adding extra capital has a smaller and smaller impact in terms of extra output as more capital is added.
• MPK determines the revenues from investing in capital equipment. – Returns to investment are high when capital per
worker is small and shrink as capital per worker grows.
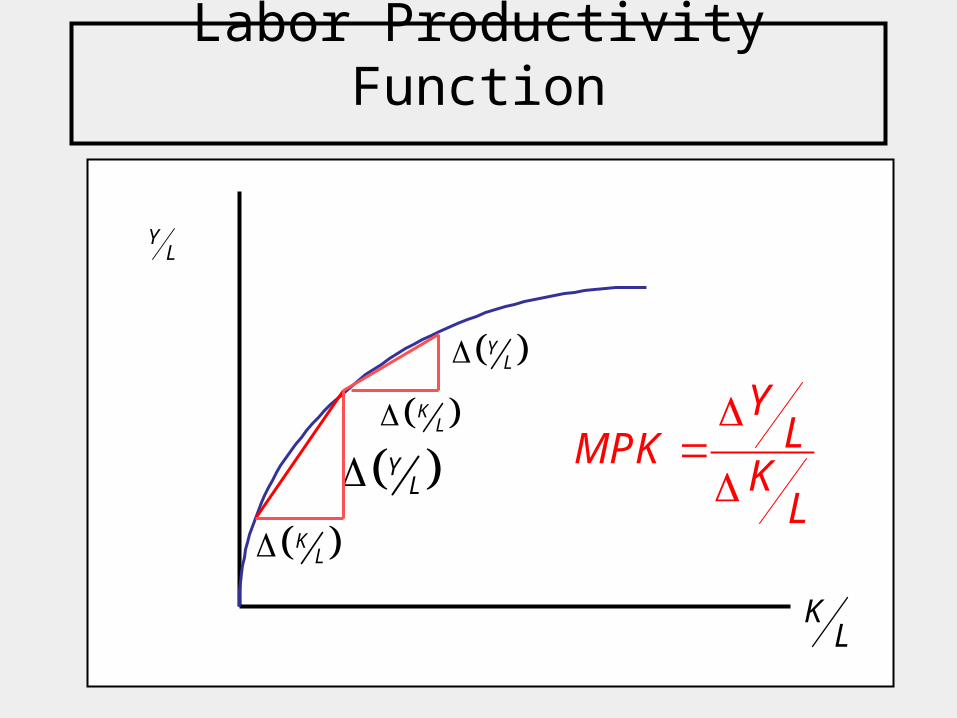
Labor Productivity Function
KL
YL
KL
YL
YL
KL Y
LMPKKL
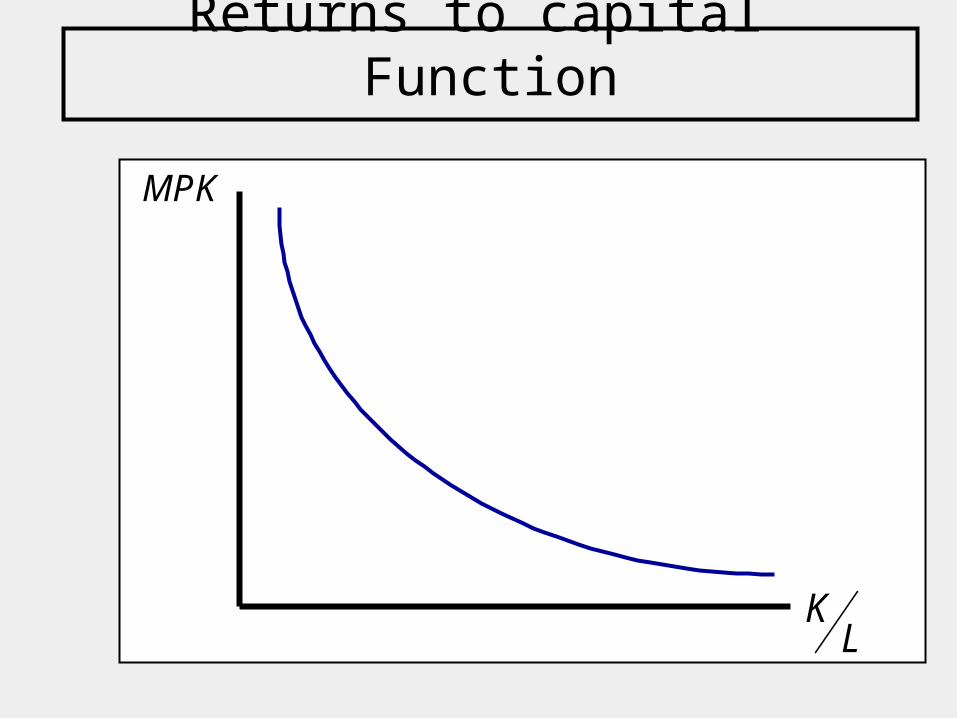
Returns to capital Function
MPK
KL
Long-term Engine of Growth
• Capital investment can lead to rapid growth for a time, but it cannot drive growth forever because it has diminishing returns. Eventually, the cost of new capital is not as great as its benefit.
• Long-term growth is driven by advances in new technology: The continuous development of new inventions and techniques for producing goods generates persistent advancement in output.
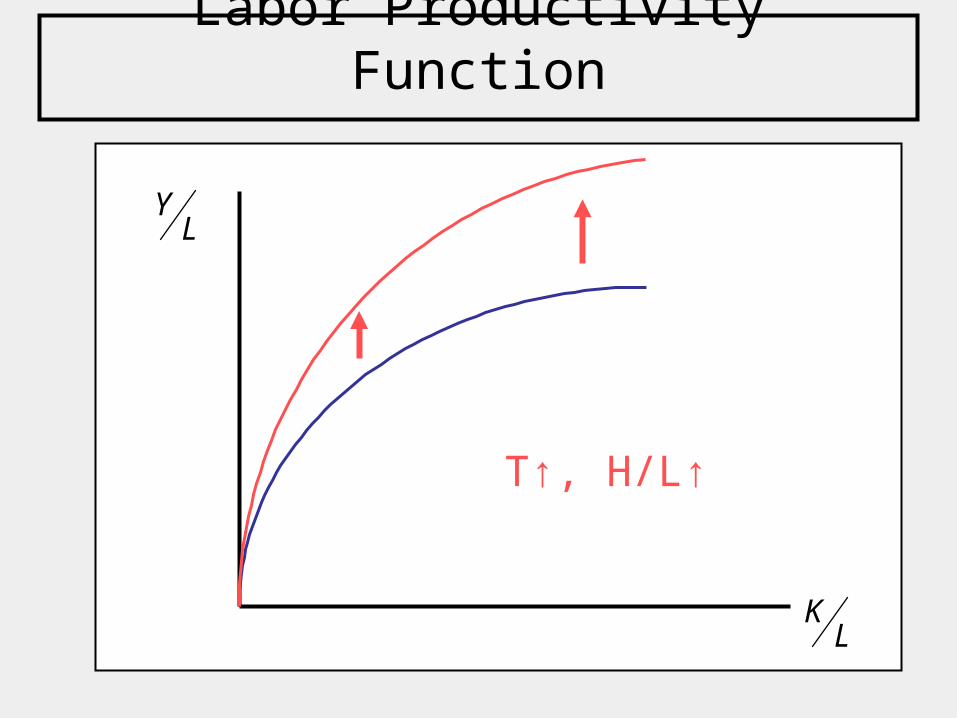
Labor Productivity Function
KL
YL
T↑, H/L↑
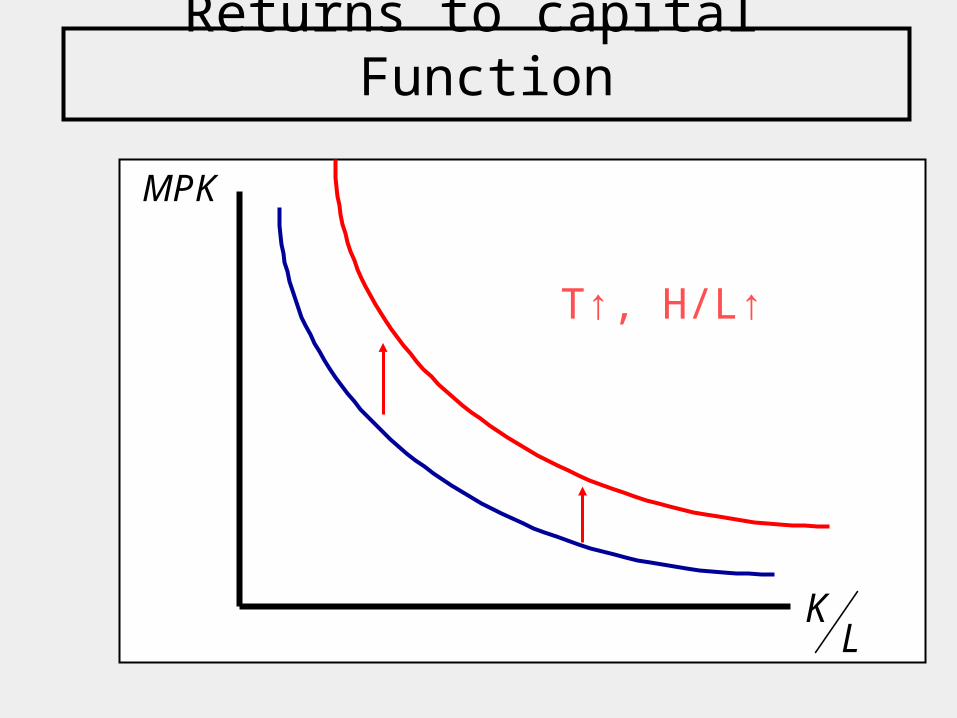
Returns to capital Function
MPK
KL
T↑, H/L↑
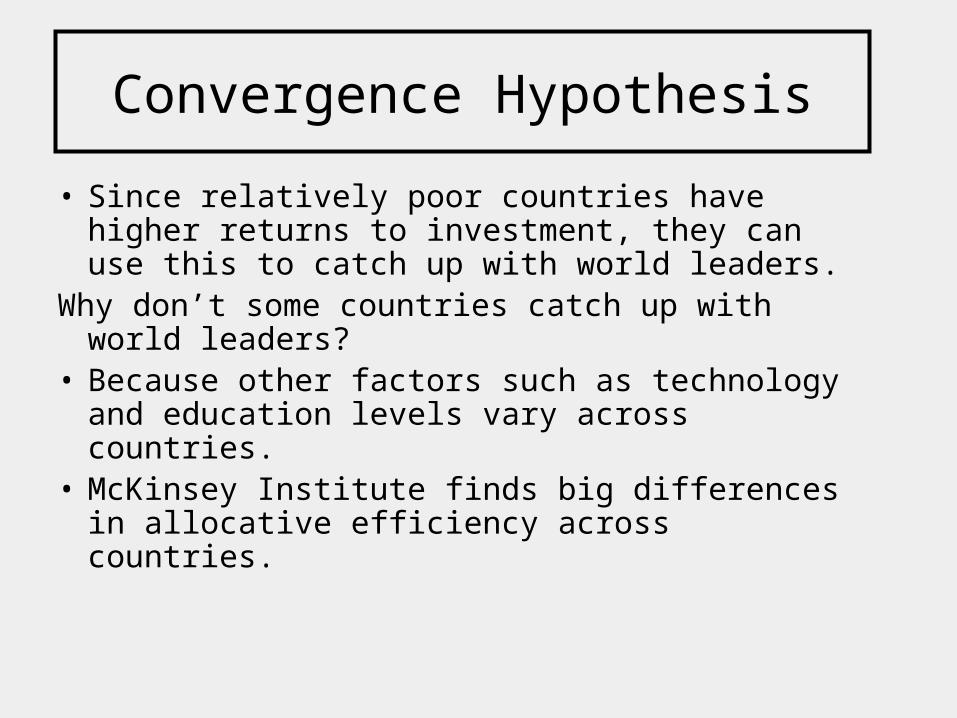
Convergence Hypothesis
• Since relatively poor countries have higher returns to investment, they can use this to catch up with world leaders.
Why don’t some countries catch up with world leaders?
• Because other factors such as technology and education levels vary across countries.
• McKinsey Institute finds big differences in allocative efficiency across countries.
Learning Outcomes
Students should be able to:• Convert national GDP into different currencies
using the PPP method and the Exchange Rate method.
• Use the Rule of 70, to calculate how long it should take for output to double.
• Distinguish between the different sources of long-run growth
• Suggest policies to improve long-run growth
Related Documents