Long-chain Acyl-CoA is not primarily increased in myotubes established from type 2 diabetic subjects Malene Just a , Nils J. Færgeman b , Jens Knudsen b , Henning Beck-Nielsen a , Michael Gaster a, ⁎ a KMEB, Department of Endocrinology, Odense University Hospital, DK-5000 Odense, Denmark b Institute of Biochemistry, University of Southern Denmark, Odense, Denmark Received 29 January 2006; received in revised form 1 May 2006; accepted 17 May 2006 Available online 23 May 2006 Abstract Accumulation of intramuscular long-chain acyl-CoA esters (LCACoA) has previously in animal and human models been suggested to play an important role in lipid induced insulin resistance. The aim of this study was to examine whether myotubes established from type 2 diabetic (T2D) subjects and lean controls express differences in long-chain acyl-CoA esters (LCACoA) precultured under physiological conditions and during chronic exposure to palmitate (PA) and oleic acids (OA) with/without acute insulin stimulation. No significant differences were found between diabetic and control myotubes, neither in the total amount nor among individual LCA–CoA species during basal and acute insulin stimulation. LCA–CoA accumulated during exposure to palmitic acid but not during exposure to oleic acid. During PA and OA exposure, only palmitoyl-CoA, oleoyl-CoA and total LCA–CoA change. PA exposure increased the palmitoyl-CoA, whereas oleoyl-CoA was reduced and vice versa during OA exposure. No differences were found in the LCA–CoA level between T2D and control subjects, neither in the total amount nor in the individual specific LCA–CoA species during fatty acid exposure. Chronic (24 h), high PA, but not OA exposure induced insulin resistance at the level of glycogen synthesis in control subjects. These results indicate that (1) no primary defects are responsible for LCA–CoA accumulation in diabetic subjects; (2) LCA–CoA changes in vivo are partly adaptive to changes in the PA level and possibly other saturated fatty acids; and (3) PA induced insulin resistance may be mediated through an increased level of palmitoyl-CoA. © 2006 Elsevier B.V. All rights reserved. Keywords: Acyl-CoA; Insulin resistance; Free fatty acid; Myotube; Type 2 diabetes; Oleic acid; Palmitic acid 1. Introduction Type 2 diabetes (T2D) is characterized by hyperglycemia, hyperinsulinemia, reduced ability to oxidize fat, and triacylgly- cerol (TAG) accumulation in skeletal muscle fibres. Impaired glucose transport and glycogen synthesis are well documented in insulin resistant subjects [1–3], but lipid metabolism is less clearly understood. A majority of in vivo studies investigating the importance of free fatty acids (FFA) and TAG suggest that increased plasma FFA and TAG concentrations are associated with insulin resistance [4–12]. Increased plasma FFA availability has been associated with insulin resistance in several experiments, showing that insulin resistance can be induced within hours by lipid infusion [11–14], or within weeks by feeding rats a high-fat diet [15–17]. The responsible mechanism for the induction of insulin resistance remains at present unclear. Focus has increasingly turned to the long chain acyl-CoA esters (LCACoA) as a part of the development of insulin resist- ance. Hulver et al. have demonstrated an increased muscular LCA–CoA content in obese and extremely obese subjects com- pared with normal weight subjects [18]. Rodents fed with a high-fat diet showed an increased intramuscular LCA–CoA content associated with insulin resistance [19]. LCA–CoA are a substrate for the synthesis of triglycerides, phospholipids and second messengers as diacylglycerol (DAG) and cera- mides [20,21]. The latter have been associated with the pathogenesis of insulin resistance [22–24]. These observations have led to the hypothesis that LCA–CoA concentration is an Biochimica et Biophysica Acta 1762 (2006) 666 – 672 www.elsevier.com/locate/bbadis Abbreviations: T2D; type 2 diabetes; LCACoA; long-chain acyl-CoA esters; TAG; triacylglycerol; DAG; diacylglycerol; OA; oleic acid; PA; palmitic acid; HI; high insulin concentration; BSA; bovine serum albumin; FCS; fetal calf serum; GIR; glucose infusion rates; FFA; free fatty acid; HPLC; high pressure liquid chromatography ⁎ Corresponding author. Tel.: +45 65411769; fax: +45 65919653. E-mail address: [email protected] (M. Gaster). 0925-4439/$ - see front matter © 2006 Elsevier B.V. All rights reserved. doi:10.1016/j.bbadis.2006.05.005

Welcome message from author
This document is posted to help you gain knowledge. Please leave a comment to let me know what you think about it! Share it to your friends and learn new things together.
Transcript
1762 (2006) 666–672www.elsevier.com/locate/bbadis
Biochimica et Biophysica Acta
Long-chain Acyl-CoA is not primarily increased in myotubes establishedfrom type 2 diabetic subjects
Malene Just a, Nils J. Færgeman b, Jens Knudsen b, Henning Beck-Nielsen a, Michael Gaster a,⁎
a KMEB, Department of Endocrinology, Odense University Hospital, DK-5000 Odense, Denmarkb Institute of Biochemistry, University of Southern Denmark, Odense, Denmark
Received 29 January 2006; received in revised form 1 May 2006; accepted 17 May 2006Available online 23 May 2006
Abstract
Accumulation of intramuscular long-chain acyl-CoA esters (LCACoA) has previously in animal and human models been suggested to play animportant role in lipid induced insulin resistance. The aim of this study was to examine whether myotubes established from type 2 diabetic (T2D)subjects and lean controls express differences in long-chain acyl-CoA esters (LCACoA) precultured under physiological conditions and duringchronic exposure to palmitate (PA) and oleic acids (OA) with/without acute insulin stimulation. No significant differences were found betweendiabetic and control myotubes, neither in the total amount nor among individual LCA–CoA species during basal and acute insulin stimulation.LCA–CoA accumulated during exposure to palmitic acid but not during exposure to oleic acid. During PA and OA exposure, only palmitoyl-CoA,oleoyl-CoA and total LCA–CoA change. PA exposure increased the palmitoyl-CoA, whereas oleoyl-CoAwas reduced and vice versa during OAexposure. No differences were found in the LCA–CoA level between T2D and control subjects, neither in the total amount nor in the individualspecific LCA–CoA species during fatty acid exposure. Chronic (24 h), high PA, but not OA exposure induced insulin resistance at the level ofglycogen synthesis in control subjects. These results indicate that (1) no primary defects are responsible for LCA–CoA accumulation in diabeticsubjects; (2) LCA–CoA changes in vivo are partly adaptive to changes in the PA level and possibly other saturated fatty acids; and (3) PA inducedinsulin resistance may be mediated through an increased level of palmitoyl-CoA.© 2006 Elsevier B.V. All rights reserved.
Keywords: Acyl-CoA; Insulin resistance; Free fatty acid; Myotube; Type 2 diabetes; Oleic acid; Palmitic acid
1. Introduction
Type 2 diabetes (T2D) is characterized by hyperglycemia,hyperinsulinemia, reduced ability to oxidize fat, and triacylgly-cerol (TAG) accumulation in skeletal muscle fibres. Impairedglucose transport and glycogen synthesis are well documentedin insulin resistant subjects [1–3], but lipid metabolism is lessclearly understood. A majority of in vivo studies investigatingthe importance of free fatty acids (FFA) and TAG suggestthat increased plasma FFA and TAG concentrations areassociated with insulin resistance [4–12]. Increased plasma
Abbreviations: T2D; type 2 diabetes; LCACoA; long-chain acyl-CoA esters;TAG; triacylglycerol; DAG; diacylglycerol; OA; oleic acid; PA; palmitic acid;HI; high insulin concentration; BSA; bovine serum albumin; FCS; fetal calfserum; GIR; glucose infusion rates; FFA; free fatty acid; HPLC; high pressureliquid chromatography⁎ Corresponding author. Tel.: +45 65411769; fax: +45 65919653.E-mail address: [email protected] (M. Gaster).
0925-4439/$ - see front matter © 2006 Elsevier B.V. All rights reserved.doi:10.1016/j.bbadis.2006.05.005
FFA availability has been associated with insulin resistance inseveral experiments, showing that insulin resistance can beinduced within hours by lipid infusion [11–14], or within weeksby feeding rats a high-fat diet [15–17]. The responsiblemechanism for the induction of insulin resistance remains atpresent unclear.
Focus has increasingly turned to the long chain acyl-CoAesters (LCACoA) as a part of the development of insulin resist-ance. Hulver et al. have demonstrated an increased muscularLCA–CoA content in obese and extremely obese subjects com-pared with normal weight subjects [18]. Rodents fed with ahigh-fat diet showed an increased intramuscular LCA–CoAcontent associated with insulin resistance [19]. LCA–CoA area substrate for the synthesis of triglycerides, phospholipidsand second messengers as diacylglycerol (DAG) and cera-mides [20,21]. The latter have been associated with thepathogenesis of insulin resistance [22–24]. These observationshave led to the hypothesis that LCA–CoA concentration is an
667M. Just et al. / Biochimica et Biophysica Acta 1762 (2006) 666–672
important factor in the pathogenesis of insulin resistance.Several studies have documented differences in the metabolismof different fatty acids [19,21–24]. However, the impact ofvarious fatty acids on LCA–CoA has not been elucidated. Thus,it is not yet clarified whether there are any differences betweencontrol and diabetic subjects in the LCA–CoA level undernormophysiological conditions (genetic origin) or whetherthese changes occur during exposure to various exogenouslipids (adaptive). The intermediate metabolism of skeletalmuscle is highly influenced by physical activity, ageing,substrate exposure, and fibre type composition rendering itdifficult to determine the contribution of genetic and environ-mental factors to the LCA–CoA level in human skeletal muscle.Cultured myotubes offer a unique model for separating thegenetic influence on insulin resistance and T2D fromenvironmental factors [24–29].
In order to determine to which extent abnormalities in LCA–CoA levels are intrinsic or acquired in T2D, we determined thetotal LCA–CoA content and the specific LCA–CoA fractionsby fluorescence dependent reverse phase high pressure liquidchromatography (HPLC) before and after acute exposure tohigh insulin concentration and/or PA or OA in myotubesestablished from control subjects and T2D patients.
2. Methods
2.1. Human study subjects
Ten lean control subjects matched to ten obese T2D patients participated inthe study (Table 1). Muscle biopsies were obtained from the vastus lateralismuscle by needle biopsy under local anaesthesia. Diabetic patients were treatedwith either diet alone or in combination with sulfonylurea, metformin or insulinwithdrawn 1 week before the study. The patients suffered from no diabeticcomplications except from simplex retinopathy. The control subjects had normalglucose tolerance and no family history of diabetes. All subjects gave writteninformed consent and the study was approved by the local ethics committee ofFunen and Vejle County.
2.2. Materials
Dulbecco's modified Eagle's medium, fetal calf serum (FCS), Ultroser G,penicillin-streptomycin-amphotericin B and trypsin-EDTA were obtained fromLife Technology (Scotland, UK). Protein assay kit was purchased from BioRad
Table 1Clinical characteristics
Control T2D
N 10 10Age (years) 51±1 50±1*Weight (kg) 71.6±3.0 102.2±4.1BMI (kg/m2) 24.2±0.5 33.5±1.1*Fasting plasma glucose (mM) 5.7±0.1 10.0±0.7*Fasting serum insulin (pM) 24.3±5.7 94.6±10.1*Glucose infusion rate (mg/min) 383.3±20.4 117.8±18.6*HbA1c (%) 5.5±0.1 7.7±0.5*Fasting total cholesterol (mM) 5.29±0.22 5.42±0.37Fasting LDL cholesterol (mM) 2.94±0.22 3.20±0.27Fasting HDL cholesterol (mM) 1.85±0.15 1.36±0.03*Fasting plasma triglyceride (mM) 1.12±0.16 1.93±0.40
Data are means±SE. *Significant different from controls (P<0.05).
(Copenhagen, DK). PA, bovine serum albumin (BSA) (essentially fatty acidfree), L-carnitine and ECM-gel were purchased from Sigma Chemical Co. (St.Louis, USA). Insulin Actrapid was from Novo Nordisk (Bagsvaerd, DK).
2.3. Cell culture
Cell cultures were established as previously described [30,31]. In brief,muscle tissue was minced, washed and dissociated for 60 min by threetreatments with 0.05% trypsin-EDTA. The cells harvested were pooled and FCSwas added to stop trypsination. The cells obtained were seeded for up-scaling onECM-gel coated dishes after 30 min of preplating. Cell cultures were establishedin DMEM medium supplemented with 10% FCS, 50 U/ml penicillin, 50 μg/mlstreptomycin and 1.25 μg/ml amphotericin B. After 24 h cell debris and non-adherent cells were removed by changing the growth medium to DMEMsupplemented with 2% FCS, 2% Ultroser G, 50 U/ml penicillin, 50 μg/mlstreptomycin and 1.25 μg/ml amphotericin B. Cells were subcultured twicebefore final seeding. At 75% confluence the growth medium was replaced bybasal medium (DMEM supplemented with 2% FCS, 50 U/ml penicillin, 50 μg/ml streptomycin, 1.25 μg/ml amphotericin B and 25 pmol/l insulin) in order toinduce differentiation. The cells were cultured in humidified 5% CO2
atmosphere at 37 °C and medium was changed every 2–3 days.
2.4. Experimental design
Human myotubes established from controls and T2D subjects were allowedto differentiate for 8 days under physiological conditions, i.e., 0.24 mmol/l fattyacid free BSA, 0.5 mmol/l L-carnitine, 20 mmol/l HEPES, 25 pmol/l insulin, and5.5 mmol/l glucose. All myotube cultures were used for analysis day 8 afteronset of differentiation. The last 24 h, myotubes were exposed to the followingprotocol: Sister cultures were exposed to either (1) baseline medium, (DMEMmedium supplemented with 0.24 mmol/l fat-free albumin, 50 U/ml penicillin,50 μg/ml streptomycin, 1.25 μg/ml amphotericin B, and 25 pmol/l insulin); (2)baseline medium supplemented with 1.0 μM insulin the last 4 h (acute insulinstimulation); (3) baseline medium supplemented with 0.6 mM PA; (4) baselinemedium supplemented with 0.6 mM PA and subsequently supplemented with1.0 μM insulin the last 4 h; (5) baseline medium supplemented with 0.6 mMOA;or (6) baseline medium supplemented with 0.6 mM OA and subsequentlysupplemented with 1.0 μM insulin the last 4 h. Myotubes were rinsed twice andLCA–CoA were extracted and determined as described in Analysis. Under thesame conditions were the corresponding glycogen synthesis at basal and duringacute insulin stimulation determined. Furthermore, the glycogen synthesis weremeasured in control myotubes exposed for a mixture of 0.3 mmol/l PA and0.3 mmol/l OA (final conc. 0.6 mmol/l fatty acid) in order to clarify whetheroleate could neutralize the insulin resistance inducing effect of palmitate.
2.5. Analysis
Myotubes were established in a 100 mm Petri dish and incubated as earlierindicated. Subsequently, cells were washed with PBS and scraped off with arubber policeman in 0.6 M perchloric acid. Cells were harvested bycentrifugation and washed twice with 10 mM perchloric acid and stored at−80 °C until LCA–CoA extraction. Heptadecanoyl-CoA (33 pmol) and H2Owere added to a final volume of 800 μl prior to addition of 3 ml chloroform/methanol (2:1). Cells were then homogenized with an Ultraturrax homogenizer.Chloroform (1 ml) and H2O (1 ml) were added and vortexed vigorously. Aftercentrifugation (3000 rpm/10 min/4 °C), the interphase was recovered and driedunder a stream of N2. The LCA–CoAwere further extracted and derivatised tofluorescent acyl etheno CoA esters using 0.5 M chloroacetoaldehyde, 0.5%SDS, 0.15 M citrate, pH 4 (200 μl) essentially as described by Larson andGraham [32].
Acyl-CoA derivatives were separated and analyzed by reverse phase HPLC(Dionex) equipped with a 5 μm LUNA C18 column (250×2 mm) and a C18guard column (4×2 mm) (both from Phenomenex) maintained at 40 °C. TheLCA–CoA were eluted with a constant flow of 0.4 ml/min. using solvent A(80% acetonitrile, 20% 20 mM ammoniumacetate) and solvent B (95% 20 mMammoniumacetate, 5% acetonitrile) and the following gradient: 0–10 min., 20%A 80% B to 25% A 75% B; 10–24 min., 25% A 75% B to 71% A 29% B; 24–
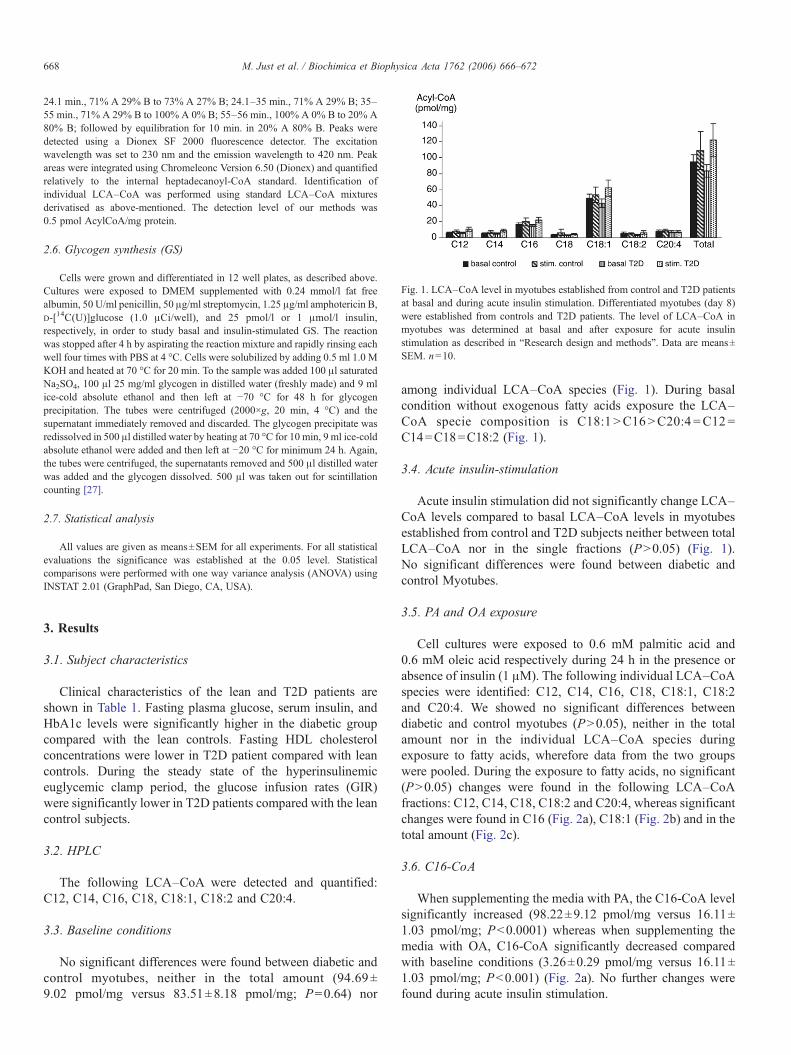
Fig. 1. LCA–CoA level in myotubes established from control and T2D patientsat basal and during acute insulin stimulation. Differentiated myotubes (day 8)were established from controls and T2D patients. The level of LCA–CoA inmyotubes was determined at basal and after exposure for acute insulinstimulation as described in “Research design and methods”. Data are means±SEM. n=10.
668 M. Just et al. / Biochimica et Biophysica Acta 1762 (2006) 666–672
24.1 min., 71% A 29% B to 73% A 27% B; 24.1–35 min., 71% A 29% B; 35–55 min., 71% A 29% B to 100% A 0% B; 55–56 min., 100% A 0% B to 20% A80% B; followed by equilibration for 10 min. in 20% A 80% B. Peaks weredetected using a Dionex SF 2000 fluorescence detector. The excitationwavelength was set to 230 nm and the emission wavelength to 420 nm. Peakareas were integrated using Chromeleonc Version 6.50 (Dionex) and quantifiedrelatively to the internal heptadecanoyl-CoA standard. Identification ofindividual LCA–CoA was performed using standard LCA–CoA mixturesderivatised as above-mentioned. The detection level of our methods was0.5 pmol AcylCoA/mg protein.
2.6. Glycogen synthesis (GS)
Cells were grown and differentiated in 12 well plates, as described above.Cultures were exposed to DMEM supplemented with 0.24 mmol/l fat freealbumin, 50 U/ml penicillin, 50 μg/ml streptomycin, 1.25 μg/ml amphotericin B,D-[14C(U)]glucose (1.0 μCi/well), and 25 pmol/l or 1 μmol/l insulin,respectively, in order to study basal and insulin-stimulated GS. The reactionwas stopped after 4 h by aspirating the reaction mixture and rapidly rinsing eachwell four times with PBS at 4 °C. Cells were solubilized by adding 0.5 ml 1.0 MKOH and heated at 70 °C for 20 min. To the sample was added 100 μl saturatedNa2SO4, 100 μl 25 mg/ml glycogen in distilled water (freshly made) and 9 mlice-cold absolute ethanol and then left at −70 °C for 48 h for glycogenprecipitation. The tubes were centrifuged (2000×g, 20 min, 4 °C) and thesupernatant immediately removed and discarded. The glycogen precipitate wasredissolved in 500 μl distilled water by heating at 70 °C for 10 min, 9 ml ice-coldabsolute ethanol were added and then left at −20 °C for minimum 24 h. Again,the tubes were centrifuged, the supernatants removed and 500 μl distilled waterwas added and the glycogen dissolved. 500 μl was taken out for scintillationcounting [27].
2.7. Statistical analysis
All values are given as means±SEM for all experiments. For all statisticalevaluations the significance was established at the 0.05 level. Statisticalcomparisons were performed with one way variance analysis (ANOVA) usingINSTAT 2.01 (GraphPad, San Diego, CA, USA).
3. Results
3.1. Subject characteristics
Clinical characteristics of the lean and T2D patients areshown in Table 1. Fasting plasma glucose, serum insulin, andHbA1c levels were significantly higher in the diabetic groupcompared with the lean controls. Fasting HDL cholesterolconcentrations were lower in T2D patient compared with leancontrols. During the steady state of the hyperinsulinemiceuglycemic clamp period, the glucose infusion rates (GIR)were significantly lower in T2D patients compared with the leancontrol subjects.
3.2. HPLC
The following LCA–CoA were detected and quantified:C12, C14, C16, C18, C18:1, C18:2 and C20:4.
3.3. Baseline conditions
No significant differences were found between diabetic andcontrol myotubes, neither in the total amount (94.69±9.02 pmol/mg versus 83.51±8.18 pmol/mg; P=0.64) nor
among individual LCA–CoA species (Fig. 1). During basalcondition without exogenous fatty acids exposure the LCA–CoA specie composition is C18:1 >C16>C20:4=C12=C14=C18=C18:2 (Fig. 1).
3.4. Acute insulin-stimulation
Acute insulin stimulation did not significantly change LCA–CoA levels compared to basal LCA–CoA levels in myotubesestablished from control and T2D subjects neither between totalLCA–CoA nor in the single fractions (P>0.05) (Fig. 1).No significant differences were found between diabetic andcontrol Myotubes.
3.5. PA and OA exposure
Cell cultures were exposed to 0.6 mM palmitic acid and0.6 mM oleic acid respectively during 24 h in the presence orabsence of insulin (1 μM). The following individual LCA–CoAspecies were identified: C12, C14, C16, C18, C18:1, C18:2and C20:4. We showed no significant differences betweendiabetic and control myotubes (P>0.05), neither in the totalamount nor in the individual LCA–CoA species duringexposure to fatty acids, wherefore data from the two groupswere pooled. During the exposure to fatty acids, no significant(P>0.05) changes were found in the following LCA–CoAfractions: C12, C14, C18, C18:2 and C20:4, whereas significantchanges were found in C16 (Fig. 2a), C18:1 (Fig. 2b) and in thetotal amount (Fig. 2c).
3.6. C16-CoA
When supplementing the media with PA, the C16-CoA levelsignificantly increased (98.22±9.12 pmol/mg versus 16.11±1.03 pmol/mg; P<0.0001) whereas when supplementing themedia with OA, C16-CoA significantly decreased comparedwith baseline conditions (3.26±0.29 pmol/mg versus 16.11±1.03 pmol/mg; P<0.001) (Fig. 2a). No further changes werefound during acute insulin stimulation.
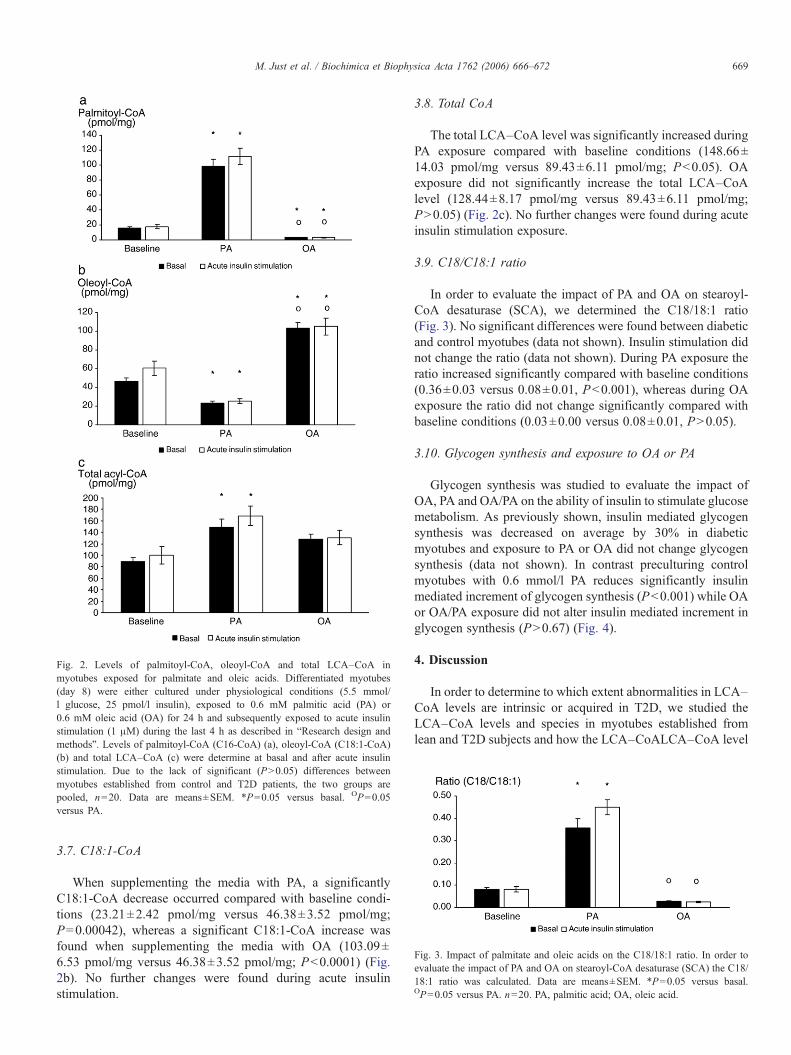
Fig. 2. Levels of palmitoyl-CoA, oleoyl-CoA and total LCA–CoA inmyotubes exposed for palmitate and oleic acids. Differentiated myotubes(day 8) were either cultured under physiological conditions (5.5 mmol/l glucose, 25 pmol/l insulin), exposed to 0.6 mM palmitic acid (PA) or0.6 mM oleic acid (OA) for 24 h and subsequently exposed to acute insulinstimulation (1 μM) during the last 4 h as described in “Research design andmethods”. Levels of palmitoyl-CoA (C16-CoA) (a), oleoyl-CoA (C18:1-CoA)(b) and total LCA–CoA (c) were determine at basal and after acute insulinstimulation. Due to the lack of significant (P>0.05) differences betweenmyotubes established from control and T2D patients, the two groups arepooled, n=20. Data are means±SEM. *P=0.05 versus basal. OP=0.05versus PA.
Fig. 3. Impact of palmitate and oleic acids on the C18/18:1 ratio. In order toevaluate the impact of PA and OA on stearoyl-CoA desaturase (SCA) the C18/18:1 ratio was calculated. Data are means±SEM. *P=0.05 versus basal.OP=0.05 versus PA. n=20. PA, palmitic acid; OA, oleic acid.
669M. Just et al. / Biochimica et Biophysica Acta 1762 (2006) 666–672
3.7. C18:1-CoA
When supplementing the media with PA, a significantlyC18:1-CoA decrease occurred compared with baseline condi-tions (23.21±2.42 pmol/mg versus 46.38±3.52 pmol/mg;P=0.00042), whereas a significant C18:1-CoA increase wasfound when supplementing the media with OA (103.09±6.53 pmol/mg versus 46.38±3.52 pmol/mg; P<0.0001) (Fig.2b). No further changes were found during acute insulinstimulation.
3.8. Total CoA
The total LCA–CoA level was significantly increased duringPA exposure compared with baseline conditions (148.66±14.03 pmol/mg versus 89.43±6.11 pmol/mg; P<0.05). OAexposure did not significantly increase the total LCA–CoAlevel (128.44±8.17 pmol/mg versus 89.43±6.11 pmol/mg;P>0.05) (Fig. 2c). No further changes were found during acuteinsulin stimulation exposure.
3.9. C18/C18:1 ratio
In order to evaluate the impact of PA and OA on stearoyl-CoA desaturase (SCA), we determined the C18/18:1 ratio(Fig. 3). No significant differences were found between diabeticand control myotubes (data not shown). Insulin stimulation didnot change the ratio (data not shown). During PA exposure theratio increased significantly compared with baseline conditions(0.36±0.03 versus 0.08±0.01, P<0.001), whereas during OAexposure the ratio did not change significantly compared withbaseline conditions (0.03±0.00 versus 0.08±0.01, P>0.05).
3.10. Glycogen synthesis and exposure to OA or PA
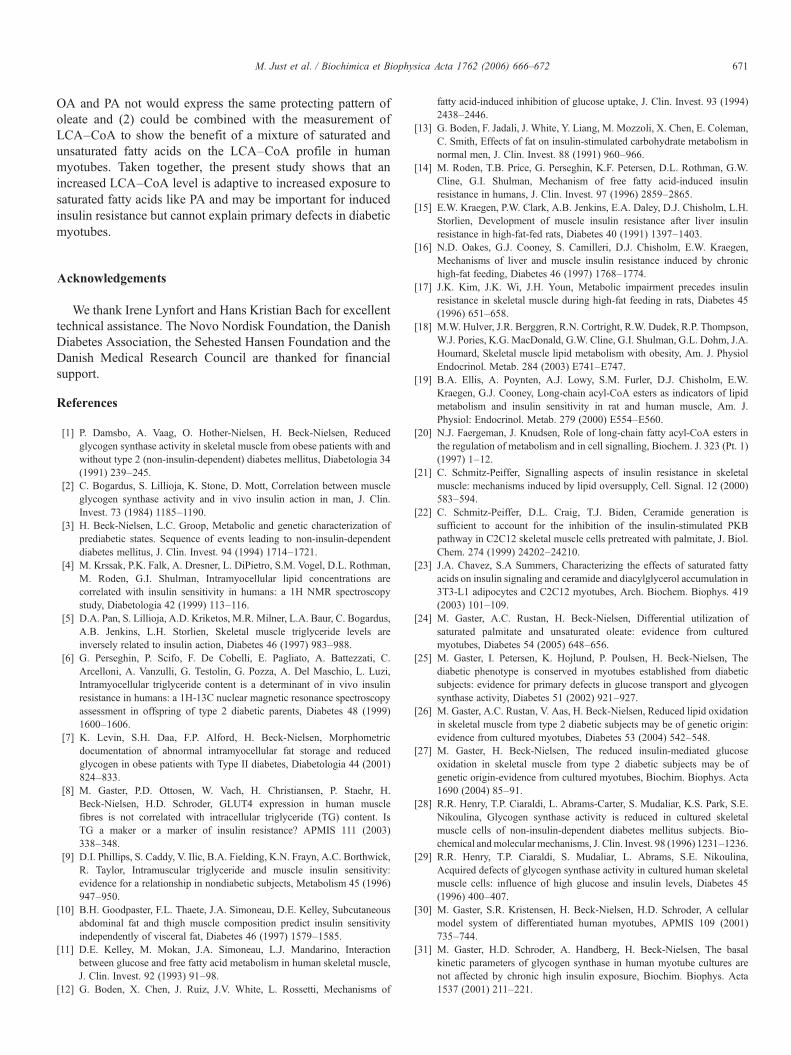
Glycogen synthesis was studied to evaluate the impact ofOA, PA and OA/PA on the ability of insulin to stimulate glucosemetabolism. As previously shown, insulin mediated glycogensynthesis was decreased on average by 30% in diabeticmyotubes and exposure to PA or OA did not change glycogensynthesis (data not shown). In contrast preculturing controlmyotubes with 0.6 mmol/l PA reduces significantly insulinmediated increment of glycogen synthesis (P<0.001) while OAor OA/PA exposure did not alter insulin mediated increment inglycogen synthesis (P>0.67) (Fig. 4).
4. Discussion
In order to determine to which extent abnormalities in LCA–CoA levels are intrinsic or acquired in T2D, we studied theLCA–CoA levels and species in myotubes established fromlean and T2D subjects and how the LCA–CoALCA–CoA level
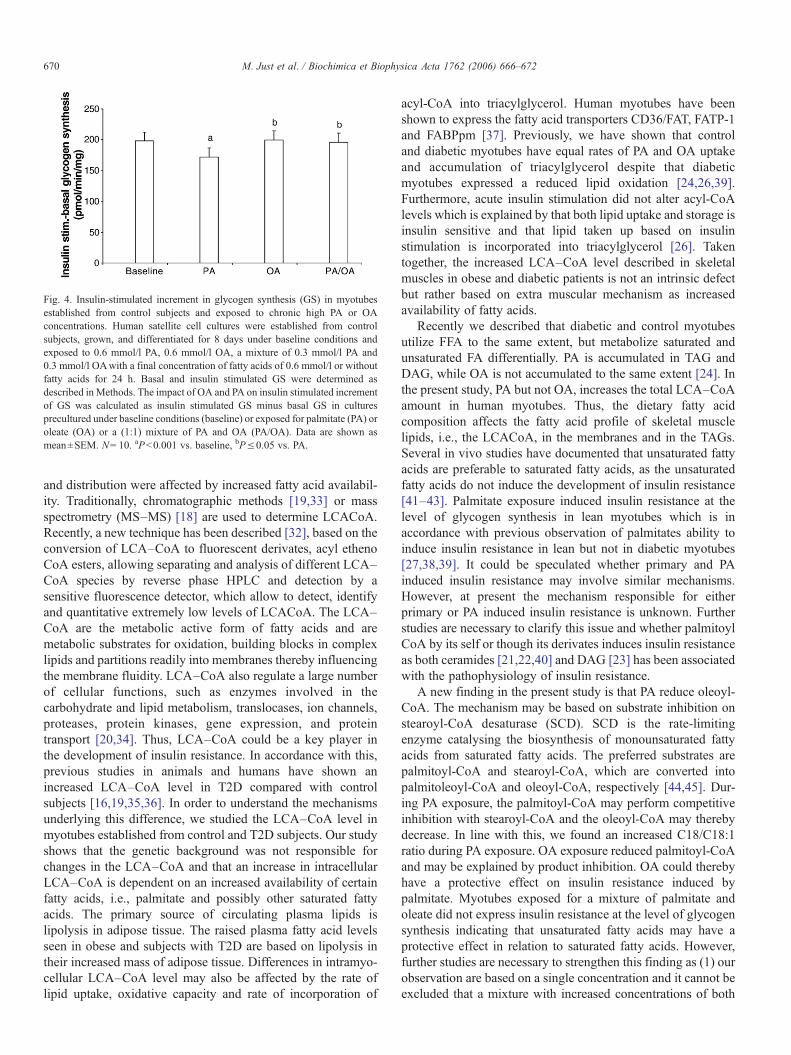
Fig. 4. Insulin-stimulated increment in glycogen synthesis (GS) in myotubesestablished from control subjects and exposed to chronic high PA or OAconcentrations. Human satellite cell cultures were established from controlsubjects, grown, and differentiated for 8 days under baseline conditions andexposed to 0.6 mmol/l PA, 0.6 mmol/l OA, a mixture of 0.3 mmol/l PA and0.3 mmol/l OAwith a final concentration of fatty acids of 0.6 mmol/l or withoutfatty acids for 24 h. Basal and insulin stimulated GS were determined asdescribed inMethods. The impact of OA and PA on insulin stimulated incrementof GS was calculated as insulin stimulated GS minus basal GS in culturesprecultured under baseline conditions (baseline) or exposed for palmitate (PA) oroleate (OA) or a (1:1) mixture of PA and OA (PA/OA). Data are shown asmean±SEM. N= 10. aP<0.001 vs. baseline, bP≤0.05 vs. PA.
670 M. Just et al. / Biochimica et Biophysica Acta 1762 (2006) 666–672
and distribution were affected by increased fatty acid availabil-ity. Traditionally, chromatographic methods [19,33] or massspectrometry (MS–MS) [18] are used to determine LCACoA.Recently, a new technique has been described [32], based on theconversion of LCA–CoA to fluorescent derivates, acyl ethenoCoA esters, allowing separating and analysis of different LCA–CoA species by reverse phase HPLC and detection by asensitive fluorescence detector, which allow to detect, identifyand quantitative extremely low levels of LCACoA. The LCA–CoA are the metabolic active form of fatty acids and aremetabolic substrates for oxidation, building blocks in complexlipids and partitions readily into membranes thereby influencingthe membrane fluidity. LCA–CoA also regulate a large numberof cellular functions, such as enzymes involved in thecarbohydrate and lipid metabolism, translocases, ion channels,proteases, protein kinases, gene expression, and proteintransport [20,34]. Thus, LCA–CoA could be a key player inthe development of insulin resistance. In accordance with this,previous studies in animals and humans have shown anincreased LCA–CoA level in T2D compared with controlsubjects [16,19,35,36]. In order to understand the mechanismsunderlying this difference, we studied the LCA–CoA level inmyotubes established from control and T2D subjects. Our studyshows that the genetic background was not responsible forchanges in the LCA–CoA and that an increase in intracellularLCA–CoA is dependent on an increased availability of certainfatty acids, i.e., palmitate and possibly other saturated fattyacids. The primary source of circulating plasma lipids islipolysis in adipose tissue. The raised plasma fatty acid levelsseen in obese and subjects with T2D are based on lipolysis intheir increased mass of adipose tissue. Differences in intramyo-cellular LCA–CoA level may also be affected by the rate oflipid uptake, oxidative capacity and rate of incorporation of
acyl-CoA into triacylglycerol. Human myotubes have beenshown to express the fatty acid transporters CD36/FAT, FATP-1and FABPpm [37]. Previously, we have shown that controland diabetic myotubes have equal rates of PA and OA uptakeand accumulation of triacylglycerol despite that diabeticmyotubes expressed a reduced lipid oxidation [24,26,39].Furthermore, acute insulin stimulation did not alter acyl-CoAlevels which is explained by that both lipid uptake and storage isinsulin sensitive and that lipid taken up based on insulinstimulation is incorporated into triacylglycerol [26]. Takentogether, the increased LCA–CoA level described in skeletalmuscles in obese and diabetic patients is not an intrinsic defectbut rather based on extra muscular mechanism as increasedavailability of fatty acids.
Recently we described that diabetic and control myotubesutilize FFA to the same extent, but metabolize saturated andunsaturated FA differentially. PA is accumulated in TAG andDAG, while OA is not accumulated to the same extent [24]. Inthe present study, PA but not OA, increases the total LCA–CoAamount in human myotubes. Thus, the dietary fatty acidcomposition affects the fatty acid profile of skeletal musclelipids, i.e., the LCACoA, in the membranes and in the TAGs.Several in vivo studies have documented that unsaturated fattyacids are preferable to saturated fatty acids, as the unsaturatedfatty acids do not induce the development of insulin resistance[41–43]. Palmitate exposure induced insulin resistance at thelevel of glycogen synthesis in lean myotubes which is inaccordance with previous observation of palmitates ability toinduce insulin resistance in lean but not in diabetic myotubes[27,38,39]. It could be speculated whether primary and PAinduced insulin resistance may involve similar mechanisms.However, at present the mechanism responsible for eitherprimary or PA induced insulin resistance is unknown. Furtherstudies are necessary to clarify this issue and whether palmitoylCoA by its self or though its derivates induces insulin resistanceas both ceramides [21,22,40] and DAG [23] has been associatedwith the pathophysiology of insulin resistance.
A new finding in the present study is that PA reduce oleoyl-CoA. The mechanism may be based on substrate inhibition onstearoyl-CoA desaturase (SCD). SCD is the rate-limitingenzyme catalysing the biosynthesis of monounsaturated fattyacids from saturated fatty acids. The preferred substrates arepalmitoyl-CoA and stearoyl-CoA, which are converted intopalmitoleoyl-CoA and oleoyl-CoA, respectively [44,45]. Dur-ing PA exposure, the palmitoyl-CoA may perform competitiveinhibition with stearoyl-CoA and the oleoyl-CoA may therebydecrease. In line with this, we found an increased C18/C18:1ratio during PA exposure. OA exposure reduced palmitoyl-CoAand may be explained by product inhibition. OA could therebyhave a protective effect on insulin resistance induced bypalmitate. Myotubes exposed for a mixture of palmitate andoleate did not express insulin resistance at the level of glycogensynthesis indicating that unsaturated fatty acids may have aprotective effect in relation to saturated fatty acids. However,further studies are necessary to strengthen this finding as (1) ourobservation are based on a single concentration and it cannot beexcluded that a mixture with increased concentrations of both
671M. Just et al. / Biochimica et Biophysica Acta 1762 (2006) 666–672
OA and PA not would express the same protecting pattern ofoleate and (2) could be combined with the measurement ofLCA–CoA to show the benefit of a mixture of saturated andunsaturated fatty acids on the LCA–CoA profile in humanmyotubes. Taken together, the present study shows that anincreased LCA–CoA level is adaptive to increased exposure tosaturated fatty acids like PA and may be important for inducedinsulin resistance but cannot explain primary defects in diabeticmyotubes.
Acknowledgements
We thank Irene Lynfort and Hans Kristian Bach for excellenttechnical assistance. The Novo Nordisk Foundation, the DanishDiabetes Association, the Sehested Hansen Foundation and theDanish Medical Research Council are thanked for financialsupport.
References
[1] P. Damsbo, A. Vaag, O. Hother-Nielsen, H. Beck-Nielsen, Reducedglycogen synthase activity in skeletal muscle from obese patients with andwithout type 2 (non-insulin-dependent) diabetes mellitus, Diabetologia 34(1991) 239–245.
[2] C. Bogardus, S. Lillioja, K. Stone, D. Mott, Correlation between muscleglycogen synthase activity and in vivo insulin action in man, J. Clin.Invest. 73 (1984) 1185–1190.
[3] H. Beck-Nielsen, L.C. Groop, Metabolic and genetic characterization ofprediabetic states. Sequence of events leading to non-insulin-dependentdiabetes mellitus, J. Clin. Invest. 94 (1994) 1714–1721.
[4] M. Krssak, P.K. Falk, A. Dresner, L. DiPietro, S.M. Vogel, D.L. Rothman,M. Roden, G.I. Shulman, Intramyocellular lipid concentrations arecorrelated with insulin sensitivity in humans: a 1H NMR spectroscopystudy, Diabetologia 42 (1999) 113–116.
[5] D.A. Pan, S. Lillioja, A.D. Kriketos, M.R. Milner, L.A. Baur, C. Bogardus,A.B. Jenkins, L.H. Storlien, Skeletal muscle triglyceride levels areinversely related to insulin action, Diabetes 46 (1997) 983–988.
[6] G. Perseghin, P. Scifo, F. De Cobelli, E. Pagliato, A. Battezzati, C.Arcelloni, A. Vanzulli, G. Testolin, G. Pozza, A. Del Maschio, L. Luzi,Intramyocellular triglyceride content is a determinant of in vivo insulinresistance in humans: a 1H-13C nuclear magnetic resonance spectroscopyassessment in offspring of type 2 diabetic parents, Diabetes 48 (1999)1600–1606.
[7] K. Levin, S.H. Daa, F.P. Alford, H. Beck-Nielsen, Morphometricdocumentation of abnormal intramyocellular fat storage and reducedglycogen in obese patients with Type II diabetes, Diabetologia 44 (2001)824–833.
[8] M. Gaster, P.D. Ottosen, W. Vach, H. Christiansen, P. Staehr, H.Beck-Nielsen, H.D. Schroder, GLUT4 expression in human musclefibres is not correlated with intracellular triglyceride (TG) content. IsTG a maker or a marker of insulin resistance? APMIS 111 (2003)338–348.
[9] D.I. Phillips, S. Caddy, V. Ilic, B.A. Fielding, K.N. Frayn, A.C. Borthwick,R. Taylor, Intramuscular triglyceride and muscle insulin sensitivity:evidence for a relationship in nondiabetic subjects, Metabolism 45 (1996)947–950.
[10] B.H. Goodpaster, F.L. Thaete, J.A. Simoneau, D.E. Kelley, Subcutaneousabdominal fat and thigh muscle composition predict insulin sensitivityindependently of visceral fat, Diabetes 46 (1997) 1579–1585.
[11] D.E. Kelley, M. Mokan, J.A. Simoneau, L.J. Mandarino, Interactionbetween glucose and free fatty acid metabolism in human skeletal muscle,J. Clin. Invest. 92 (1993) 91–98.
[12] G. Boden, X. Chen, J. Ruiz, J.V. White, L. Rossetti, Mechanisms of
fatty acid-induced inhibition of glucose uptake, J. Clin. Invest. 93 (1994)2438–2446.
[13] G. Boden, F. Jadali, J. White, Y. Liang, M. Mozzoli, X. Chen, E. Coleman,C. Smith, Effects of fat on insulin-stimulated carbohydrate metabolism innormal men, J. Clin. Invest. 88 (1991) 960–966.
[14] M. Roden, T.B. Price, G. Perseghin, K.F. Petersen, D.L. Rothman, G.W.Cline, G.I. Shulman, Mechanism of free fatty acid-induced insulinresistance in humans, J. Clin. Invest. 97 (1996) 2859–2865.
[15] E.W. Kraegen, P.W. Clark, A.B. Jenkins, E.A. Daley, D.J. Chisholm, L.H.Storlien, Development of muscle insulin resistance after liver insulinresistance in high-fat-fed rats, Diabetes 40 (1991) 1397–1403.
[16] N.D. Oakes, G.J. Cooney, S. Camilleri, D.J. Chisholm, E.W. Kraegen,Mechanisms of liver and muscle insulin resistance induced by chronichigh-fat feeding, Diabetes 46 (1997) 1768–1774.
[17] J.K. Kim, J.K. Wi, J.H. Youn, Metabolic impairment precedes insulinresistance in skeletal muscle during high-fat feeding in rats, Diabetes 45(1996) 651–658.
[18] M.W. Hulver, J.R. Berggren, R.N. Cortright, R.W. Dudek, R.P. Thompson,W.J. Pories, K.G. MacDonald, G.W. Cline, G.I. Shulman, G.L. Dohm, J.A.Houmard, Skeletal muscle lipid metabolism with obesity, Am. J. PhysiolEndocrinol. Metab. 284 (2003) E741–E747.
[19] B.A. Ellis, A. Poynten, A.J. Lowy, S.M. Furler, D.J. Chisholm, E.W.Kraegen, G.J. Cooney, Long-chain acyl-CoA esters as indicators of lipidmetabolism and insulin sensitivity in rat and human muscle, Am. J.Physiol: Endocrinol. Metab. 279 (2000) E554–E560.
[20] N.J. Faergeman, J. Knudsen, Role of long-chain fatty acyl-CoA esters inthe regulation of metabolism and in cell signalling, Biochem. J. 323 (Pt. 1)(1997) 1–12.
[21] C. Schmitz-Peiffer, Signalling aspects of insulin resistance in skeletalmuscle: mechanisms induced by lipid oversupply, Cell. Signal. 12 (2000)583–594.
[22] C. Schmitz-Peiffer, D.L. Craig, T.J. Biden, Ceramide generation issufficient to account for the inhibition of the insulin-stimulated PKBpathway in C2C12 skeletal muscle cells pretreated with palmitate, J. Biol.Chem. 274 (1999) 24202–24210.
[23] J.A. Chavez, S.A Summers, Characterizing the effects of saturated fattyacids on insulin signaling and ceramide and diacylglycerol accumulation in3T3-L1 adipocytes and C2C12 myotubes, Arch. Biochem. Biophys. 419(2003) 101–109.
[24] M. Gaster, A.C. Rustan, H. Beck-Nielsen, Differential utilization ofsaturated palmitate and unsaturated oleate: evidence from culturedmyotubes, Diabetes 54 (2005) 648–656.
[25] M. Gaster, I. Petersen, K. Hojlund, P. Poulsen, H. Beck-Nielsen, Thediabetic phenotype is conserved in myotubes established from diabeticsubjects: evidence for primary defects in glucose transport and glycogensynthase activity, Diabetes 51 (2002) 921–927.
[26] M. Gaster, A.C. Rustan, V. Aas, H. Beck-Nielsen, Reduced lipid oxidationin skeletal muscle from type 2 diabetic subjects may be of genetic origin:evidence from cultured myotubes, Diabetes 53 (2004) 542–548.
[27] M. Gaster, H. Beck-Nielsen, The reduced insulin-mediated glucoseoxidation in skeletal muscle from type 2 diabetic subjects may be ofgenetic origin-evidence from cultured myotubes, Biochim. Biophys. Acta1690 (2004) 85–91.
[28] R.R. Henry, T.P. Ciaraldi, L. Abrams-Carter, S. Mudaliar, K.S. Park, S.E.Nikoulina, Glycogen synthase activity is reduced in cultured skeletalmuscle cells of non-insulin-dependent diabetes mellitus subjects. Bio-chemical andmolecular mechanisms, J. Clin. Invest. 98 (1996) 1231–1236.
[29] R.R. Henry, T.P. Ciaraldi, S. Mudaliar, L. Abrams, S.E. Nikoulina,Acquired defects of glycogen synthase activity in cultured human skeletalmuscle cells: influence of high glucose and insulin levels, Diabetes 45(1996) 400–407.
[30] M. Gaster, S.R. Kristensen, H. Beck-Nielsen, H.D. Schroder, A cellularmodel system of differentiated human myotubes, APMIS 109 (2001)735–744.
[31] M. Gaster, H.D. Schroder, A. Handberg, H. Beck-Nielsen, The basalkinetic parameters of glycogen synthase in human myotube cultures arenot affected by chronic high insulin exposure, Biochim. Biophys. Acta1537 (2001) 211–221.
672 M. Just et al. / Biochimica et Biophysica Acta 1762 (2006) 666–672
[32] T.R. Larson, I.A. Graham, Technical advance: a novel technique for thesensitive quantification of acyl CoA esters from plant tissues, Plant J. 25(2001) 115–125.
[33] J.A. Houmard, C.J. Tanner, C. Yu, P.G. Cunningham, W.J. Pories, K.G.MacDonald, G.I. Shulman, Effect of weight loss on insulin sensitivity andintramuscular long-chain fatty acyl-CoAs in morbidly obese subjects,Diabetes 51 (2002) 2959–2963.
[34] J. Knudsen, T.B. Neergaard, B. Gaigg, M.V. Jensen, J.K. Hansen, Role ofacyl-CoA binding protein in acyl-CoA metabolism and acyl-CoA-mediated cell signaling, J. Nutr. 130 (2000) 294S–298S.
[35] M.T. Chen, L.N. Kaufman, T. Spennetta, E Shrago, Effects of high fat-feeding to rats on the interrelationship of body weight, plasma insulin, andfatty acyl-coenzyme A esters in liver and skeletal muscle, Metabolism 41(1992) 564–569.
[36] S.M. Chalkley, M. Hettiarachchi, D.J. Chisholm, E.W. Kraegen, Five-hourfatty acid elevation increases muscle lipids and impairs glycogen synthesisin the rat, Metabolism 47 (1998) 1121–1126.
[37] H.M. Wilmsen, T.P. Ciaraldi, L. Carter, N. Reehman, S.R. Mudaliar, R.R.Henry, Thiazolidinediones upregulate impaired fatty acid uptake in skeletalmuscle of type 2 diabetic subjects, Am. J. Physiol: Endocrinol. Metab. 285(2) (2003) E354–E362.
[38] N. Ortenblad, M. Mogensen, I. Petersen, K. Hojlund, K. Levin, K. Sahlin,H. Beck-Nielsen, M. Gaster, Reduced insulin-mediated citrate synthaseactivity in cultured skeletal muscle cells from patients with type 2 diabetes:
evidence for an intrinsic oxidative enzyme defect, Biochim. Biophys. Acta1741 (2005) 206–214.
[39] M. Gaster, H. Beck-Nielsen, Triacylglycerol accumulation is not primarilyaffected in myotubes established from Type 2 diabetic subjects, BBA 1761(2006) 100–110.
[40] J.A. Chavez, T.A. Knotts, L.P. Wang, G. Li, R.T. Dobrowsky, G.L. Florant,S.A. Summers, A role for ceramide, but not diacylglycerol, in theantagonism of insulin signal transduction by saturated fatty acids, J.Biol.Chem. 278 (2003) 10297–10303.
[41] L.H. Storlien, E.W. Kraegen, D.J. Chisholm, G.L. Ford, D.G. Bruce, W.S.Pascoe, Fish oil prevents insulin resistance induced by high-fat feeding inrats, Science 237 (1987) 885–888.
[42] L.H. Storlien, A.B. Jenkins, D.J. Chisholm, W.S. Pascoe, S. Khouri, E.W.Kraegen, Influence of dietary fat composition on development of insulinresistance in rats, relationship to muscle triglyceride and omega-3 fattyacids in muscle phospholipid, Diabetes 40 (1991) 280–289.
[43] B.S. Fuehrlein, M.S. Rutenberg, J.N. Silver, M.W. Warren, D.W.Theriaque, G.E. Duncan, P.W. Stacpoole, M.L. Brantly, Differentialmetabolic effects of saturated versus polyunsaturated fats in ketogenicdiets, J. Clin. Endocrinol. Metab. 89 (2004) 1641–1645.
[44] M.Miyazaki, J.M. Ntambi, Role of stearoyl-coenzymeA desaturase in lipidmetabolism, Prostaglandins Leukot. Essent. Fat. Acids 68 (2003) 113–121.
[45] J.M. Ntambi, M. Miyazaki, Regulation of stearoyl-CoA desaturases androle in metabolism, Prog. Lipid Res. 43 (2004) 91–104.
Related Documents