0092-6566/$ - see front matter © 2006 Elsevier Inc. All rights reserved. doi:10.1016/j.jrp.2005.11.007 Journal of Research in Personality 40 (2006) 1054–1085 www.elsevier.com/locate/jrp Loneliness within a nomological net: An evolutionary perspective John T. Cacioppo a,¤ , Louise C. Hawkley a , John M. Ernst b , Mary Burleson c , Gary G. Berntson d , Bita Nouriani e , David Spiegel e a Department of Psychology, Center for Cognitive and Social Neuroscience, University of Chicago, USA b Illinois Wesleyan University, USA c Department of Psychology, Arizona State University West, USA d Department of Psychology, Interdisciplinary Program in Neuroscience, Ohio State University, USA e Department of Psychiatry and Behavioral Sciences, Stanford University, USA Available online 20 February 2006 Abstract Loneliness is characterized by feelings of social pain and isolation and has both heritable and unshared environmental underpinnings. An evolutionary theory of loneliness is outlined, and four studies replicate and extend prior research on the characteristics of lonely individuals. Studies 1 and 2 indicate that loneliness and depressed aVect are related but separable constructs. Study 3 conWrms that lonely, relative to nonlonely, young adults are higher in anxiety, anger, negative mood, and fear of negative evaluation, and lower in optimism, social skills, social support, positive mood, surgency, emotional stability, conscientiousness, agreeableness, shyness, and sociability. The set of six personal- ity factors associated with loneliness (surgency, emotional stability, agreeableness, conscientiousness, shyness, and sociability) do not explain the associations between loneliness and negative mood, anxi- ety, anger, optimism (pessimism), self-esteem, and social support, as each association remained statis- tically signiWcant even after statistically controlling for these personality factors. Study 4 used hypnosis to experimentally manipulate loneliness to determine whether there were associated Funding was provided by the John D. and Catherine T. MacArthur Foundation and the National Institute of Aging Grant No. PO1 AG18911. The author’s gratefully acknowledge the suggestions of Bill Patrick and the con- tributions to this project by Ray Kowalewski, Alisa Paulsen, and the staV of the Ohio State University General Clinical Research Center. Jacqueline Frede, Kathryn Palmer, and Emily Maxwell provided additional assistance. We also thank Steve Kremer and the Ohio State University OYce of Residence Life. * Corresponding author. Fax: +1 773 702 4580. E-mail address: [email protected] (J.T. Cacioppo).

Welcome message from author
This document is posted to help you gain knowledge. Please leave a comment to let me know what you think about it! Share it to your friends and learn new things together.
Transcript

Journal of Research in Personality 40 (2006) 1054–1085
www.elsevier.com/locate/jrp
Loneliness within a nomological net: An evolutionary perspective �
John T. Cacioppo a,¤, Louise C. Hawkley a, John M. Ernst b, Mary Burleson c, Gary G. Berntson d, Bita Nouriani e,
David Spiegel e
a Department of Psychology, Center for Cognitive and Social Neuroscience, University of Chicago, USAb Illinois Wesleyan University, USA
c Department of Psychology, Arizona State University West, USAd Department of Psychology, Interdisciplinary Program in Neuroscience, Ohio State University, USA
e Department of Psychiatry and Behavioral Sciences, Stanford University, USA
Available online 20 February 2006
Abstract
Loneliness is characterized by feelings of social pain and isolation and has both heritable andunshared environmental underpinnings. An evolutionary theory of loneliness is outlined, and fourstudies replicate and extend prior research on the characteristics of lonely individuals. Studies 1 and 2indicate that loneliness and depressed aVect are related but separable constructs. Study 3 conWrmsthat lonely, relative to nonlonely, young adults are higher in anxiety, anger, negative mood, and fearof negative evaluation, and lower in optimism, social skills, social support, positive mood, surgency,emotional stability, conscientiousness, agreeableness, shyness, and sociability. The set of six personal-ity factors associated with loneliness (surgency, emotional stability, agreeableness, conscientiousness,shyness, and sociability) do not explain the associations between loneliness and negative mood, anxi-ety, anger, optimism (pessimism), self-esteem, and social support, as each association remained statis-tically signiWcant even after statistically controlling for these personality factors. Study 4 usedhypnosis to experimentally manipulate loneliness to determine whether there were associated
� Funding was provided by the John D. and Catherine T. MacArthur Foundation and the National Institute ofAging Grant No. PO1 AG18911. The author’s gratefully acknowledge the suggestions of Bill Patrick and the con-tributions to this project by Ray Kowalewski, Alisa Paulsen, and the staV of the Ohio State University GeneralClinical Research Center. Jacqueline Frede, Kathryn Palmer, and Emily Maxwell provided additional assistance.We also thank Steve Kremer and the Ohio State University OYce of Residence Life.
* Corresponding author. Fax: +1 773 702 4580.E-mail address: [email protected] (J.T. Cacioppo).
0092-6566/$ - see front matter © 2006 Elsevier Inc. All rights reserved.doi:10.1016/j.jrp.2005.11.007
J.T. Cacioppo et al. / Journal of Research in Personality 40 (2006) 1054–1085 1055
changes in the participants’ personality and socioemotional characteristics. Results conWrmed thatloneliness can inXuence the participants’ personality ratings and socioemotional states.© 2006 Elsevier Inc. All rights reserved.
Keywords: Loneliness; Depression; Personality; Self-esteem; Social support; Hypnosis
1. Introduction
ƒby the 1970’s, it was dawning on many evolutionary biologists, especially thoseinterested in behaviour, that evolution by natural selection was not much about com-petition between species, not even mostly about competition between individuals, butwas about competition between genes using individuals and occasionally societies astheir temporary vehicles. (Ridley, 2000, p. 127).
Loneliness has been described as a complex set of feelings that occurs when intimateand social needs are not adequately met and that “drives” individuals to seek the fulWll-ment of these needs (Russell, Peplau, & Cutrona, 1980; Weiss, 1973, p. 15). Estimates byPeplau and Perlman (1982) suggest that at any one time approximately 20% of the popula-tion complains of feelings of loneliness. Why are people plagued by this plight? In the pres-ent paper, we outline an evolutionary model to address this question in which lonelinessreXects the operation of selWsh genes using individuals to insure their perpetuation.
Darwin’s (1959) insight was that organisms compete for resources, and those that hadsome advantage in a habitat would be more likely to transmit this advantage to future gener-ations via their oVspring. Building on Darwin’s seminal insight, Dawkins (1990) describeshow genes evolve and function to perpetuate themselves. According to Dawkins (1990), theworld of the selWsh gene is generally one of savage competition, ruthless exploitation, anddeceit. Even apparently collective actions that foster survival, such as Wsh swimming inschools, can be explained in terms of individual self-interest. When sardines are predated,they form a dynamic Wsh ball as a last means of defense. The emergence and unfolding of thiscollective action can be explained by a single, selWsh rule: Swim to the middle.
The genetic constitution of species characterized by brief periods of dependency isreducible to the reproductive success of individual members of the species. Simply stated, ifan organism survives to reproduce, the genes of the organism are more likely to beincluded in the gene pool of the species. The genetic constitution of Homo sapiens, how-ever, derives not simply from an individual’s reproductive success but more critically fromthe success of one’s oVspring to reproduce (Cacioppo & Hawkley, 2003). Humans are notparticularly strong, fast, or stealthy relative to other species. They lost their canine teeththousands of years ago and they never had the safety oVered by natural armor or Xight. Itis the ability to think and use tools, to employ and detect deceit, and to communicate, worktogether, and form alliances that makes Homo sapiens such a formidable species.
The importance of these capacities produced a selective pressure for larger brains withgreater associative, reasoning, integrative, and communicative power (Calvin, 2004).Larger brains were achieved in part by greater folding of the cortices to squash more brainmatter into a limited cranial space. Larger brains were also achieved by modiWcations ofthe pelvic skeletal structure in women, which although less optimal for walking, increasedthe likelihood that the mother and infant would survive childbirth. The cranial skull itself
1056 J.T. Cacioppo et al. / Journal of Research in Personality 40 (2006) 1054–1085
evolved to be incomplete at birth. Even though the hole at the top of the skull places anewborn at greater risk for injury or death from a blow, it improves the chances of success-ful transport through the birth canal. And the human infant is born to a prolonged periodof abject dependency. It appears part of the solution in the negotiation between a largerbrain and successful transport through the birth canal is that much of development andexpansion of the human brain occurs after birth.
The fact that humans are born in modal litter sizes of one and to a long period of abjectdependency changes the eVects of the operation of the “selWsh gene.” If infants do not elicitnurturance and protection from caregivers, or if caregivers are not motivated to providesuch care over an extended period of time, the infants perish along with the genetic legacyof the parents. The selWsh gene therefore had to add to its repertoire the evolution of socialconnection and care. Ancestors who were inclined to form social connections, communi-cate and work together, share food and defense, and retaliate in the face of violations ofreciprocity norms had a selective advantage to survive. In conditions of hardship, hunter-gatherers who had a genetic disposition to experience social pain from social separation(i.e., loneliness) may have been more likely to return to share their food, shelter, or defensewith their family and allies to diminish the pain of loneliness. Individuals with no such feel-ings of loneliness when separated from others may have roamed the earth better nourishedthan those who felt distressed by social separation, but the abandoned oVspring—and thegenetic predisposition of the parents—would have been less likely to survive.
The present model has features in common with Bowlby’s (1969/1982) emphasis on infantattachment but the need to form attachments represents only a part of the story. Social painin response to disconnections, the reward felt when those connections are reinstated, andindividual diVerences in sensitivity to social pain and reward are also fundamental to the evo-lutionary model. Physical pain evolved as a reXex to protect the organism from tissue dam-age. Physical pain is inXuenced by situational factors but there are also stable individualdiVerences in pain sensitivity. According to our evolutionary model (Cacioppo & Hawkley,2003) loneliness is thought to operate in part through social pain, which co-opts the physicalpain system (Eisenberger, Lieberman, & Williams, 2003), and social reward, which co-optsthe appetitive system (Rilling et al., 2002), to protect the gene if not the individual. SpeciW-cally, the social pain of loneliness and the social reward of connecting with others motivatethe person to repair and maintain social connections even when his or her immediate self-interests are not served by the sharing of resources or defense. In this way, loneliness, likepunitive altruism (Boyd, Gintis, Bowles, & Richerson, 2003; Fehr & Gächter, 2002), pro-motes adaptive collective behavior to preserve the selWsh molecules known as genes (Daw-kins, 1990). Moreover, loneliness like physical pain and reward is posited to be inXuenced bysituational factors but there are also stable individual diVerences in sensitivity.
Recent work by Eisenberger et al. (2003) on social pain and by Rilling et al. (2002) onsocial pain and by Rilling et al. (2002) on social reward is in accord with the notion that lone-liness may have evolved to use the physical pain and reward systems to extend its protectivefunction to include others. In a recent functional magnetic resonance imaging (fMRI) studyin which participants were excluded from or included in a social situation (i.e., a ball tossinggame), for instance, Eisenberger et al. (2003) found neural activation localized in a dorsalportion of the anterior cingulate cortex (ACC) that is implicated in the aVective componentof the pain response. The authors argue that the similarity in activation of the dorsal ACC tophysical pain (e.g., Rainville, Duncan, Price, Carrier, & Bushnell, 1997) and to social painsuggests that the experiences of physical and social pain may share a common
J.T. Cacioppo et al. / Journal of Research in Personality 40 (2006) 1054–1085 1057
neuroanatomical basis. Furthermore, Eisenberger and her colleagues suggest that “Becauseof the adaptive value of mammalian social bonds, the social attachment systemƒ may havepiggybacked onto the physical pain system to promote survival” (p. 291).
According to our evolutionary model, a person made to feel lonely also feels unsafe andactivates an anachronistic survival mechanism that heightens sensitivity to threats from allsides. Lonely individuals are not simply unhappy, they have heightened sensitivity tothreats and attacks. Defensive behaviors such as preventative rejection of others may helpfend oV treachery, rejections or attacks. It is this ingrained, self-protective focus on threatsthat drives their anxiety and caustic interactions and allows them to minimize the shortterm damage of negative interactions but at the cost of potentially self-defeating hostility,fault Wnding, and blaming (Cacioppo & Hawkley, 2005; Rotenberg, 1994). Consistent withthis model, prior research has shown loneliness to be related to a constellation of socio-emotional states and traits that include poor mood, anxiety, anger, optimism, low socialsupport, dysphoria, and lower self esteem (e.g., see reviews by Berscheid & Reis, 1998;Duck, Pond, & Leatham, 1994; Ernst & Cacioppo, 1999; Rook, 1984; Shaver & Brennan,1991).
If the motivation to form and maintain social bonds has evolutionary origins, one mightexpect signiWcant genetic contributions to loneliness. The Wrst investigation of the herita-bility of loneliness was published by McGuire and CliVord (2000). In their Wrst study, 69biologically related sibling pairs and 64 unrelated pairs in adoptive families in the Colo-rado Adoption Project completed an 8-item loneliness scale when they were 9, 10, 11, and12 years of age. In a second study, 22 monozygotic (MZ) twins, 40 dizygotic (DZ) twins,and 80 full-siblings 8–14 years of age completed a 16-item scale to assess loneliness in rela-tion to their schoolmates. Results revealed signiWcant genetic (h2D 55 and 48%, respec-tively, in Studies 1 and 2) and unshared environmental contributions to individualdiVerences in loneliness.
The adoption studies of McGuire and CliVord (2000), however, can be explained interms of an alternative model that attributes the resemblance in loneliness between rela-tives to shared environment. Heritability estimates of complex traits such as loneliness mayalso change across the lifespan, as the frequency, duration, and range of exposure to envi-ronmental inXuences accrues. We, therefore, extended the work of McGuire and CliVord(2000) using data from the Netherlands Twin Register Study (Boomsma, Willemse, Dolan,Hawkley, & Cacioppo, 2005). Data on loneliness from 7665 young adult and adult Dutchtwins (average age 24 years) were analyzed with genetic structural equation models, whichprovide estimates of the shared environmental and unique environmental contributions aswell as the genetic contributions. The estimate of genetic contributions to variation in lone-liness in adults was 47%, with the remaining variance explained by unique environmentalfactors. Thus, the heritability estimates in adults were similar to that found previously inchildren. No evidence was found for sex or age diVerences in genetic architecture or fornonadditive genetic eVects.
In sum, loneliness is posited to be heritable for several reasons. First, the separationfrom those with whom an individual has formed connections produces social pain (loneli-ness) that, like physical pain, motivates the person to repair the social disconnections evenwhen his or her immediate self-interests are not served by the sharing of resources ordefense. Furthermore, social acceptance and aYrmation is posited to be rewarding. That is,social pain leads to negativity, lowered feelings of control, depressed aVect, and lower self-esteem, whereas social cooperation and acceptance leads to increased feelings of control,

1058 J.T. Cacioppo et al. / Journal of Research in Personality 40 (2006) 1054–1085
positive aVect, and higher self esteem. Thus, loneliness and depressed aVect should beclosely related. In addition, though, those who feel socially isolated also feel unsafe, whichin turn activates a constellation of socioemotional processes including threat vigilance,stress, mood, anxiety, anger, and low social support. Depressed aVect does not trigger thesame constellation (e.g., Kremen, 1996). Thus, loneliness and depressed aVect are conceivedas related but separable constructs. In Studies 1 and 2, we attempted to evaluate whetherthe two constructs could be statistically disentangled. A common factor analysis of theitems in a depressed aVect inventory and a loneliness measure was conducted using datacollected from two samples—a study of 2525 young adults (Study 1), and a population-based sample of 229 English-speaking Blacks/African Americans (37 males, 44 females),non-black Hispanics (33 males, 33 females), and non-Hispanic Caucasians (39 males, 43females) between the ages of 50 and 68 years (MD57.5, SDD 4.5) from the ChicagoHealth, Aging, and Social Relations Study (CHASRS).
An assumption built into studies that compare lonely versus nonlonely groups or thatlimit analyses to linear correlation/regression is that individuals average in loneliness are assimilar to individuals low in loneliness as they are to those high in loneliness. However,prior research suggests that loneliness scores are positively skewed with most individualsreporting low loneliness (e.g., Russell et al., 1980; see Shaver & Brennan, 1991). Given thisdistribution, it is possible that individuals average in loneliness, whose loneliness ratingsare more similar to those of others in the high frequency portion of the distribution (i.e.,those low in loneliness), may be more similar to individuals low than high in loneliness onrelated socioemotional scales and interpersonal behaviors, as well. Such a result is entirelyconsistent with the emphasis in prior research on individuals high in loneliness as a psycho-logical problem. If there is a threshold for feelings of loneliness, then the associationbetween loneliness and states such as anxiety and depressed aVect may be characterized byquadratic as well as linear components. Such a step-function might be expected if loneli-ness reXects an inhibited temperament (Cole, Kemeny, & Taylor, 1997; Kagan, Snidman,Arcus, & Reznick, 1994). Therefore, we tested for quadratic as well as linear eVects in Study3. Another aim of Study 3 was to investigate whether the association between lonelinessand the socioemotional states of mood, anxiety, anger, optimism, fear of negative evalua-tion, social skills, social support, dysphoria, and self esteem was secondary to one or morepersonality dimensions such as surgency (extraversion), emotional stability (neuroticism),or shyness.
Finally, the evolutionary model casts loneliness as capable of inXuencing a constellationof socioemotional states. If those who feel socially isolated not only feel unhappy but alsounsafe, then changes in loneliness should activate a constellation of socioemotional pro-cesses. To investigate this question, we used hypnosis to manipulate feelings of loneliness ina within-participants design, and we measured the eVects of this manipulation on statesand traits investigated in Study 3. By doing so, we were able to investigate the possiblecausal role of loneliness in social and emotional processes.
2. Study 1
Loneliness and depressed aVect are correlated (Segrin, 1998), and the strength of theirassociation often raises questions about their conceptual or functional separation. Indeed,the conXation of loneliness with depressed aVect is such that measures of depressed aVect(e.g., the Center for Epidemiologic Studies Depression Scale, RadloV, 1977) include items

J.T. Cacioppo et al. / Journal of Research in Personality 40 (2006) 1054–1085 1059
about feeling lonely. A formal structural examination of the relationship between loneli-ness and depressed aVect was performed to address this question. If factor analyses ofitems purported to measure loneliness and depressed aVect show these constructs load ontwo separate factors, this would lend support to their being treated as conceptually relatedbut separable constructs.
2.1. Method
2.1.1. Participants and procedureTwo thousand six hundred and twenty-eight undergraduate students at Ohio State Uni-
versity were recruited broadly from residence halls, fraternities and sororities, and intro-ductory psychology classes to participate in the prescreening for this study. Theycompleted a survey packet of demographic and psychological assessment forms, includingthe R-UCLA and the MMPI Lie Scale (Hathaway & McKinley, 1983). In the residencehalls, Resident Assistants were instructed how to administer the surveys and asked to dis-tribute surveys to their residents. Residents who returned completed surveys were enteredinto a lottery with prizes of $200, $75, and $25. Resident Assistants who assisted in surveydistribution and collection were entered into a lottery with prizes of $75 and $25. Frater-nity and sorority houses that agreed to participate in the study were paid $1 for each com-pleted survey returned. Students in introductory psychology courses volunteered tocomplete the survey forms for credit toward research experience hours as a course require-ment. After eliminating individuals for whom part or all of the R-UCLA form had notbeen completed or who had MMPI Lie Scale scores greater than 8 on a 12-point Lie Scale,2531 students remained.
Participation consisted of completing between Wve and nine questionnaires thatincluded demographic and psychological assessment forms. All participants completed theR-UCLA Loneliness Scale and the Beck Depression Inventory. Other questionnairesincluded a demographic information form and a Wller questionnaire inquiring about sleeppatterns. Half the survey packets presented the R-UCLA Loneliness Scale Wrst, the otherhalf presented the Beck Depression Inventory Wrst. Packet order was equally represented inthe returned completed surveys. Reliable and complete data for both the R-UCLA Loneli-ness Scale and the Beck Depression Inventory were available from 2525 students (1197males, 1314 females, and 14 undeclared).
2.1.2. Measures2.1.2.1. R-UCLA Loneliness Scale. Loneliness was indexed using the Revised UCLALoneliness Scale (R-UCLA), a 20-item questionnaire measuring general feelings of socialisolation, loneliness, and dissatisfaction with one’s social interactions (Russell et al., 1980).The questionnaire consists of a list of statements such as “People are around me but notwith me,” and “There are people I can turn to.” Participants were asked to rate how oftenthey felt the way described by the items on a scale ranging from 1 (never) to 4 (often). Oncecertain items were reverse-scored, all of the items were summed to tabulate lonelinessscores for each participant, with higher scores indicating greater loneliness. The R-UCLALoneliness Scale has been found to have high internal consistency, with a coeYcient � of.94 found in two studies and .93 in the current study. The R-UCLA loneliness scale hasbeen shown to possess adequate concurrent and discriminant validity (Russell et al., 1980):people who score high on loneliness also experience emotions theoretically related to

1060 J.T. Cacioppo et al. / Journal of Research in Personality 40 (2006) 1054–1085
loneliness and do not experience emotions not linked to loneliness; loneliness scores corre-late more highly with a self-labeling loneliness index than with measures of mood and per-sonality variables such as social risk-taking and negative aVect.
2.1.2.2. Beck Depression Inventory. The 13-item Beck Depression Inventory (Beck & Beck,1972) has been validated as a measure of depressed aVect and dysphoria. Each of the itemshas four response options that are rated on a scale of 0–3, corresponding to increasingdegrees of symptoms and dysphoria “felt over the past week and today.” Participants maychoose one or more responses to each item. Cronbach’s � for the 13 items was .86. Usingthe highest scoring response to each item, responses are summed to produce a total depres-sion score. Possible scores range from 0 to 39, with higher scores indicating greaterdepressed aVect.
2.2. Results
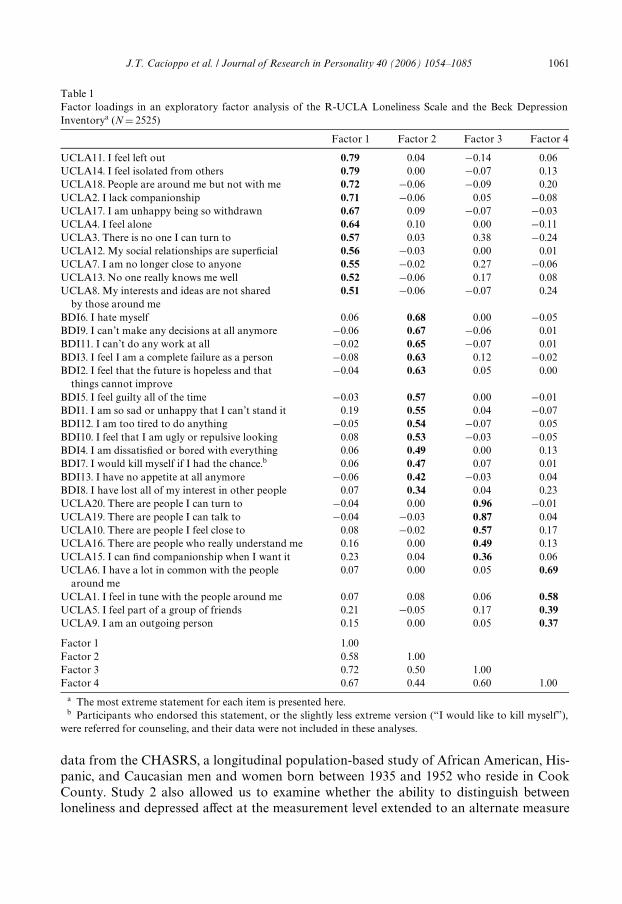
The factor structure of the loneliness and depressed aVect items was assessed by con-ducting exploratory factor analyses using SPSS (version 12.0). Data were subjected to aprincipal axis factor analysis with oblique rotation (Promax with Kaiser normalization) toallow for the possibility of correlated factors. Five factors had eigenvalues greater thanone, but no items loaded on the Wfth factor, indicating overfactoring. An exploratory fac-tor analysis that constrained the number of factors to four revealed that these four factorswere decidedly distinguishable on the basis of their scale source. The Wrst, third, and fourthfactors consisted entirely of items from the R-UCLA Loneliness Scale, and the second fac-tor consisted of the 13 items from the BDI. Factor loadings are displayed in Table 1. Nota-bly, the loadings of loneliness items on the depressed aVect factor were very low (i.e.,<0.10), as were the loadings of depressed aVect items on the loneliness factors (i.e., <0.19).
Moreover, the patterning of factors previously identiWed in the R-UCLA LonelinessScale (Hawkley, Browne, & Cacioppo, 2005) was not disrupted by including the BDI itemsin the factor analysis. Namely, the Wrst loneliness factor corresponded to the Isolation fac-tor, the third to the Relational Connectedness factor, and the fourth to the CollectiveConnectedness factor. In the current analysis, each of these factors exhibited moderatelysized correlations with the depressed aVect factor, rfactor 1–factor 2D .58, rfactor 3–factor 2D .50,and rfactor 4–factor 2D .44, comparable to the correlation exhibited between total lonelinessand depressed aVect scores, rD .56.
An additional factor analysis in which the number of factors was constrained to twoalso showed a clear separation of the factors as indicated by scale-speciWc items on eachfactor, with only one BDI item (item 8) showing low (i.e., <0.33) but dual loadings on bothfactors. The two factors were correlated at rD .59, highly similar to the correlation betweenthe two scale scores, rD .56. These results support the notion that loneliness and depressedaVect are separable though correlated constructs.
3. Study 2
The results of Study 1 replicated prior research arguing for the separability of lonelinessand depressed aVect. The external validity of these results may be limited, however, by theuse of college undergraduates as participants. We, therefore, replicated our analyses using
J.T. Cacioppo et al. / Journal of Research in Personality 40 (2006) 1054–1085 1061
data from the CHASRS, a longitudinal population-based study of African American, His-panic, and Caucasian men and women born between 1935 and 1952 who reside in CookCounty. Study 2 also allowed us to examine whether the ability to distinguish betweenloneliness and depressed aVect at the measurement level extended to an alternate measure
Table 1Factor loadings in an exploratory factor analysis of the R-UCLA Loneliness Scale and the Beck DepressionInventorya (ND 2525)
a The most extreme statement for each item is presented here.b Participants who endorsed this statement, or the slightly less extreme version (“I would like to kill myself”),
were referred for counseling, and their data were not included in these analyses.
Factor 1 Factor 2 Factor 3 Factor 4
UCLA11. I feel left out 0.79 0.04 ¡0.14 0.06UCLA14. I feel isolated from others 0.79 0.00 ¡0.07 0.13UCLA18. People are around me but not with me 0.72 ¡0.06 ¡0.09 0.20UCLA2. I lack companionship 0.71 ¡0.06 0.05 ¡0.08UCLA17. I am unhappy being so withdrawn 0.67 0.09 ¡0.07 ¡0.03UCLA4. I feel alone 0.64 0.10 0.00 ¡0.11UCLA3. There is no one I can turn to 0.57 0.03 0.38 ¡0.24UCLA12. My social relationships are superWcial 0.56 ¡0.03 0.00 0.01UCLA7. I am no longer close to anyone 0.55 ¡0.02 0.27 ¡0.06UCLA13. No one really knows me well 0.52 ¡0.06 0.17 0.08UCLA8. My interests and ideas are not shared
by those around me0.51 ¡0.06 ¡0.07 0.24
BDI6. I hate myself 0.06 0.68 0.00 ¡0.05BDI9. I can’t make any decisions at all anymore ¡0.06 0.67 ¡0.06 0.01BDI11. I can’t do any work at all ¡0.02 0.65 ¡0.07 0.01BDI3. I feel I am a complete failure as a person ¡0.08 0.63 0.12 ¡0.02BDI2. I feel that the future is hopeless and that
things cannot improve¡0.04 0.63 0.05 0.00
BDI5. I feel guilty all of the time ¡0.03 0.57 0.00 ¡0.01BDI1. I am so sad or unhappy that I can’t stand it 0.19 0.55 0.04 ¡0.07BDI12. I am too tired to do anything ¡0.05 0.54 ¡0.07 0.05BDI10. I feel that I am ugly or repulsive looking 0.08 0.53 ¡0.03 ¡0.05BDI4. I am dissatisWed or bored with everything 0.06 0.49 0.00 0.13BDI7. I would kill myself if I had the chance.b 0.06 0.47 0.07 0.01BDI13. I have no appetite at all anymore ¡0.06 0.42 ¡0.03 0.04BDI8. I have lost all of my interest in other people 0.07 0.34 0.04 0.23UCLA20. There are people I can turn to ¡0.04 0.00 0.96 ¡0.01UCLA19. There are people I can talk to ¡0.04 ¡0.03 0.87 0.04UCLA10. There are people I feel close to 0.08 ¡0.02 0.57 0.17UCLA16. There are people who really understand me 0.16 0.00 0.49 0.13UCLA15. I can Wnd companionship when I want it 0.23 0.04 0.36 0.06UCLA6. I have a lot in common with the people
around me0.07 0.00 0.05 0.69
UCLA1. I feel in tune with the people around me 0.07 0.08 0.06 0.58UCLA5. I feel part of a group of friends 0.21 ¡0.05 0.17 0.39UCLA9. I am an outgoing person 0.15 0.00 0.05 0.37
Factor 1 1.00Factor 2 0.58 1.00Factor 3 0.72 0.50 1.00Factor 4 0.67 0.44 0.60 1.00
1062 J.T. Cacioppo et al. / Journal of Research in Personality 40 (2006) 1054–1085
of depressed aVect, namely the 20-item CES-D (Center for Epidemiologic Studies Depres-sion Scale, RadloV, 1977).
3.1. Methods
3.1.1. Participants and proceduresA population-based sample of 229 English-speaking Blacks/African Americans (37
males, 44 females), non-black Hispanics (33 males, 33 females), and non-Hispanic Cauca-sians (39 males, 43 females) between the ages of 50 and 68 years (MD57.5, SDD 4.5) fromCook County, Illinois, served as participants. Although 229 participants enrolled in thestudy, these analyses were based on data from a sample of 181 older males and females ofCaucasian (37 males, 36 females), African American (31 males, 29 females), and Hispanic(22 males, 26 females) ethnicity (MageD 57) for whom complete data were available.
A multi-stage probability sampling design was used to select the respondents. The Wrststage involved drawing a sample of households, using a sampling frame owned and main-tained by GENESYS Sampling Systems. This frame consists of all households with listedphone numbers, augmented by additional households identiWed through available sourcessuch as voter registration records, school registration records, and magazine subscriptionlists. Once this subset of households was identiWed, a stratiWed equal probability of selection(EPSEM) sample was drawn from it. The following three strata were used: (1) householdsfrom census tracts in which at least 80% of the residents were African American, (2) house-holds for which the associated surname (as listed in GENESYS’s records) was among theroughly 13,000 surnames identiWed by the US Census Department as “Hispanic,” and (3) allremaining households. For the full frame, Stratum (1) contains approximately 80% of allAfrican American households in Cook County. Stratum (2) is less eVective at targeting His-panics, as only about 60% of persons with Hispanic surnames identify themselves as Hispanicand a similar fraction (60%) of Hispanics have Hispanic surnames. The sample was drawn inreplicates, with the proportion from each stratum varied to achieve an approximately equaldistribution among the three racial/ethnic groups in the Wnal sample.
The second stage involved within-household selection. Each sampled household wasscreened by telephone for the presence of at least one age-eligible individual. This screeningwas performed by the University of Chicago Survey Lab. If a household contained morethan one age-eligible individual, the person with the most recent birthday was selected. Theselected individual was then screened further to exclude those who identiWed themselves asbelonging to a racial/ethnic group other than the three identiWed above and those not suY-ciently ambulatory to come to the University and participate in the study. All remainingindividuals were asked to participate in the study. Participants were paid $126 for partici-pating in the Wrst year. To maximize our ability to distinguish between groups and to per-form subset analyses, we used a quota sampling strategy at both the household andindividual levels to achieve an approximately equal distribution of participants across thesix gender by racial/ethnic group combinations. As we expected, eligible Hispanic partici-pants were the most diYcult to identify and to recruit (e.g., many age-eligible Hispanics didnot speak and read English well enough to participate), and this meant that the Wnal repli-cates consisted entirely of households from the Hispanic surname stratum. In addition,once the desired number of whites and blacks were recruited (one-third each of the targetsample size), newly sampled households without age-eligible Hispanics were discarded, andthe within-household selection was made from among eligible Hispanic participants only.

J.T. Cacioppo et al. / Journal of Research in Personality 40 (2006) 1054–1085 1063
Participants arrived at the laboratory at approximately 8:30 a.m. for approximately 8 hof testing for Year 1 of a 5-year longitudinal study of social isolation and health. This dayat the laboratory included informed consent, questionnaires, interviews, lunch, and a car-diovascular protocol, which is not directly related to this study. As part of the testing, par-ticipants completed the Revised UCLA Loneliness Scale (R-UCLA) and the Center forEpidemiologic Studies Depression Scale (CES-D).
3.1.2. Measures3.1.2.1. R-UCLA Loneliness Scale. The Revised UCLA Loneliness Scale (Russell et al.,1980) is described above in Study 1. In the present study, the coeYcient � was .92.
3.1.2.2. Center for epidemiologic studies depression scale. Depressive feelings and behaviorwere assessed using the Center for Epidemiologic Studies Depression (CES-D) Scale,which is a 20-item measure (RadloV, 1977). This scale, which has been used extensively togauge depression in epidemiological studies, consists of a list of items such as “I feltdepressed,” and “I enjoyed life.” Participants were asked to rate how often they felt theway described by the items during the past week on a scale ranging from 0 (rarely or noneof the time) to 3 (most or all of the time). After speciWc items were reverse scored, all of theitems were summed to calculate depressed aVect scores for each participant, with higherscores indicating higher levels of depressive symptoms. The CES-D depression scale hasdemonstrated high internal consistency, with coeYcient �s of .85 in a general populationsample and .90 in a sample of psychiatric patients. In the present study, the coeYcient �was .89. Discriminant validity of the CES-D has been supported by low correlationsbetween CES-D scores and scores on scales designed to measure diVerent phenomena, suchas positive aVect and aggression, and high correlations between CES-D scores and scoreson other scales used to measure symptoms of depressed aVect.
3.2. Results
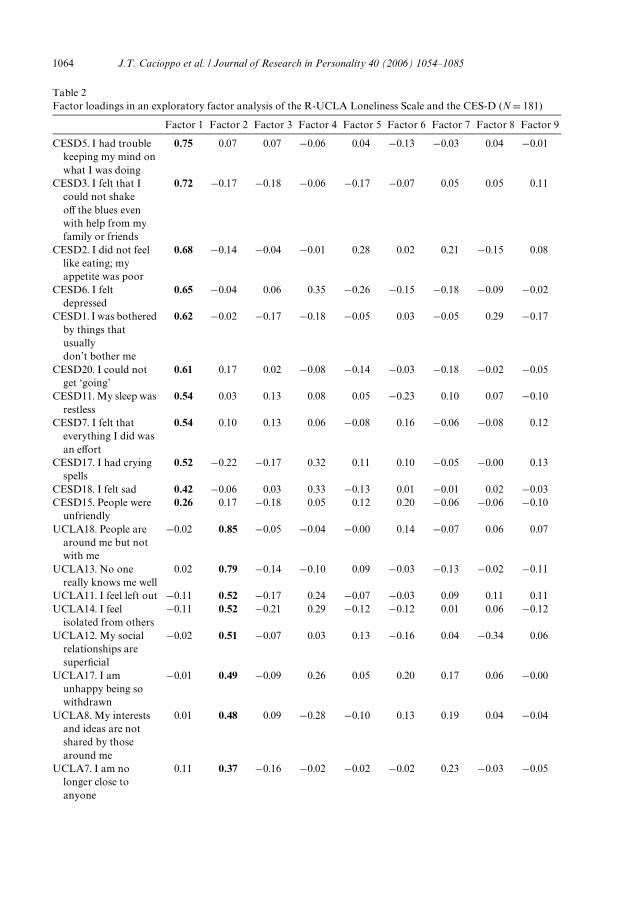
We conducted an exploratory principal axis factor analysis (SPSS, v. 12.0) of the itemsfrom the R-UCLA Loneliness and the CES-D, and employed oblique rotation (Promaxwith Kaiser normalization) to allow for the possibility of correlated factors. Nine factorswere extracted, and again, each factor was largely scale-speciWc. As can be seen in Table 2,Wve of the factors consisted of loneliness items, and four others consisted of CES-D items.An additional factor analysis in which the number of factors was constrained to two alsoshowed a clear separation of the two factors as indicated by scale-speciWc items on eachfactor, with four CES-D items (i.e., items 4, 12, 15, and 16) and one R-UCLA item (i.e., item15) showing low (i.e., <0.36) but dual loadings on both factors. The two factors were corre-lated at rD .54, a level comparable to the scale score intercorrelation, rD .59.
3.3. Discussion
As in prior research, we found loneliness and depressed aVect to be correlated inStudies 1 and 2. The results of Studies 1 and 2 further provided evidence that lonelinessand depressed aVect can be thought of as distinct constructs on theoretical and statisticalgrounds. For instance, the items from the R-UCLA Loneliness Scale and the Beck Depres-sion Inventory loaded uniquely on separate factors, with three factors representing
1064 J.T. Cacioppo et al. / Journal of Research in Personality 40 (2006) 1054–1085
Table 2Factor loadings in an exploratory factor analysis of the R-UCLA Loneliness Scale and the CES-D (ND 181)
Factor 1 Factor 2 Factor 3 Factor 4 Factor 5 Factor 6 Factor 7 Factor 8 Factor 9
CESD5. I had trouble keeping my mind on what I was doing
0.75 0.07 0.07 ¡0.06 0.04 ¡0.13 ¡0.03 0.04 ¡0.01
CESD3. I felt that I could not shake oV the blues even with help from my family or friends
0.72 ¡0.17 ¡0.18 ¡0.06 ¡0.17 ¡0.07 0.05 0.05 0.11
CESD2. I did not feel like eating; my appetite was poor
0.68 ¡0.14 ¡0.04 ¡0.01 0.28 0.02 0.21 ¡0.15 0.08
CESD6. I felt depressed
0.65 ¡0.04 0.06 0.35 ¡0.26 ¡0.15 ¡0.18 ¡0.09 ¡0.02
CESD1. I was bothered by things that usually don’t bother me
0.62 ¡0.02 ¡0.17 ¡0.18 ¡0.05 0.03 ¡0.05 0.29 ¡0.17
CESD20. I could not get ‘going’
0.61 0.17 0.02 ¡0.08 ¡0.14 ¡0.03 ¡0.18 ¡0.02 ¡0.05
CESD11. My sleep was restless
0.54 0.03 0.13 0.08 0.05 ¡0.23 0.10 0.07 ¡0.10
CESD7. I felt that everything I did was an eVort
0.54 0.10 0.13 0.06 ¡0.08 0.16 ¡0.06 ¡0.08 0.12
CESD17. I had crying spells
0.52 ¡0.22 ¡0.17 0.32 0.11 0.10 ¡0.05 ¡0.00 0.13
CESD18. I felt sad 0.42 ¡0.06 0.03 0.33 ¡0.13 0.01 ¡0.01 0.02 ¡0.03CESD15. People were
unfriendly0.26 0.17 ¡0.18 0.05 0.12 0.20 ¡0.06 ¡0.06 ¡0.10
UCLA18. People are around me but not with me
¡0.02 0.85 ¡0.05 ¡0.04 ¡0.00 0.14 ¡0.07 0.06 0.07
UCLA13. No one really knows me well
0.02 0.79 ¡0.14 ¡0.10 0.09 ¡0.03 ¡0.13 ¡0.02 ¡0.11
UCLA11. I feel left out ¡0.11 0.52 ¡0.17 0.24 ¡0.07 ¡0.03 0.09 0.11 0.11UCLA14. I feel
isolated from others¡0.11 0.52 ¡0.21 0.29 ¡0.12 ¡0.12 0.01 0.06 ¡0.12
UCLA12. My social relationships are superWcial
¡0.02 0.51 ¡0.07 0.03 0.13 ¡0.16 0.04 ¡0.34 0.06
UCLA17. I am unhappy being so withdrawn
¡0.01 0.49 ¡0.09 0.26 0.05 0.20 0.17 0.06 ¡0.00
UCLA8. My interests and ideas are not shared by those around me
0.01 0.48 0.09 ¡0.28 ¡0.10 0.13 0.19 0.04 ¡0.04
UCLA7. I am no longer close to anyone
0.11 0.37 ¡0.16 ¡0.02 ¡0.02 ¡0.02 0.23 ¡0.03 ¡0.05

J.T. Cacioppo et al. / Journal of Research in Personality 40 (2006) 1054–1085 1065
Table 2 (continued)
Factor 1 Factor 2 Factor 3 Factor 4 Factor 5 Factor 6 Factor 7 Factor 8 Factor 9
UCLA20. There are people I can turn to
¡0.05 ¡0.15 0.85 0.03 ¡0.16 ¡0.04 0.04 ¡0.04 ¡0.02
UCLA19. There are people I can talk to
¡0.08 ¡0.12 0.79 0.06 ¡0.06 ¡0.11 0.13 0.09 0.02
UCLA10. There are people I feel close to
0.19 ¡0.16 0.61 0.06 0.05 ¡0.01 ¡0.01 0.05 0.05
UCLA16. There are people who really understand me
¡0.08 ¡0.21 0.53 0.12 0.08 ¡0.04 0.08 0.09 ¡0.03
CESD10. I felt fearful 0.09 ¡0.07 0.10 0.80 0.12 0.15 ¡0.08 ¡0.09 ¡0.20CESD14. I felt lonely 0.11 0.17 0.14 0.53 ¡0.06 0.07 0.20 0.05 ¡0.07UCLA15. I can Wnd
companionship when I want it
¡0.02 0.25 0.30 ¡0.32 ¡0.07 ¡0.13 ¡0.18 0.03 0.31
CESD12. I was happy ¡0.2 ¡0.06 ¡0.01 0.17 0.74 ¡0.09 0.00 0.06 ¡0.04CESD16. I enjoyed life 0.03 ¡0.01 ¡0.11 ¡0.14 0.74 ¡0.22 0.02 0.12 0.04CESD8. I felt hopeful
about the future0.08 0.27 0.18 0.20 0.39 ¡0.24 ¡0.32 ¡0.04 0.10
CESD4. I felt that I was just as good as other people
0.19 0.01 0.12 ¡0.10 0.24 ¡0.65 ¡0.03 ¡0.01 ¡0.10
CESD9. I thought life had been a failure
0.25 0.03 ¡0.02 0.33 ¡0.01 0.44 ¡0.03 ¡0.02 0.03
CESD19. I felt that people disliked me
0.32 0.21 0.00 0.09 ¡0.06 0.43 0.02 ¡0.01 0.17
UCLA2. I lack companionship
¡0.1 0.20 0.14 ¡0.00 0.01 0.06 0.74 ¡0.13 0.09
UCLA4. I feel alone 0.06 0.33 ¡0.02 0.17 0.01 ¡0.14 0.57 0.06 0.16UCLA3. There is no
one I can turn to0.19 0.32 ¡0.08 ¡0.07 0.01 ¡0.11 0.37 ¡0.06 ¡0.00
UCLA1. I feel in tune with the people around me
0.05 0.06 0.16 ¡0.09 0.11 ¡0.06 ¡0.08 0.65 ¡0.09
UCLA5. I feel part of a group of friends
¡0.09 ¡0.06 0.20 0.09 0.17 0.09 ¡0.19 0.42 0.08
UCLA6. I have a lot in common with the people around me
0.12 ¡0.18 0.24 ¡0.00 0.09 0.04 ¡0.03 0.40 0.20
UCLA9. I am an outgoing person
0.05 0.00 0.11 ¡0.23 0.02 0.16 0.15 ¡0.03 0.74
CESD13. I talked less than usual
0.23 0.27 0.33 0.12 0.02 0.08 0.14 0.08 ¡0.35
Factor 1 1.00Factor 2 0.38 1.00Factor 3 ¡0.33 ¡0.51 1.00Factor 4 0.45 0.36 ¡0.34 1.00Factor 5 ¡0.41 ¡0.45 0.53 ¡0.48 1.00Factor 6 0.39 0.09 ¡0.18 0.00 ¡0.11 1.00Factor 7 0.39 0.49 ¡0.54 0.41 ¡0.48 0.13 1.00Factor 8 ¡0.17 ¡0.35 0.40 0.03 0.16 ¡0.29 ¡0.20 1.00Factor 9 ¡0.32 ¡0.27 0.31 0.08 0.18 ¡0.48 ¡0.39 0.39 1.00
1066 J.T. Cacioppo et al. / Journal of Research in Personality 40 (2006) 1054–1085
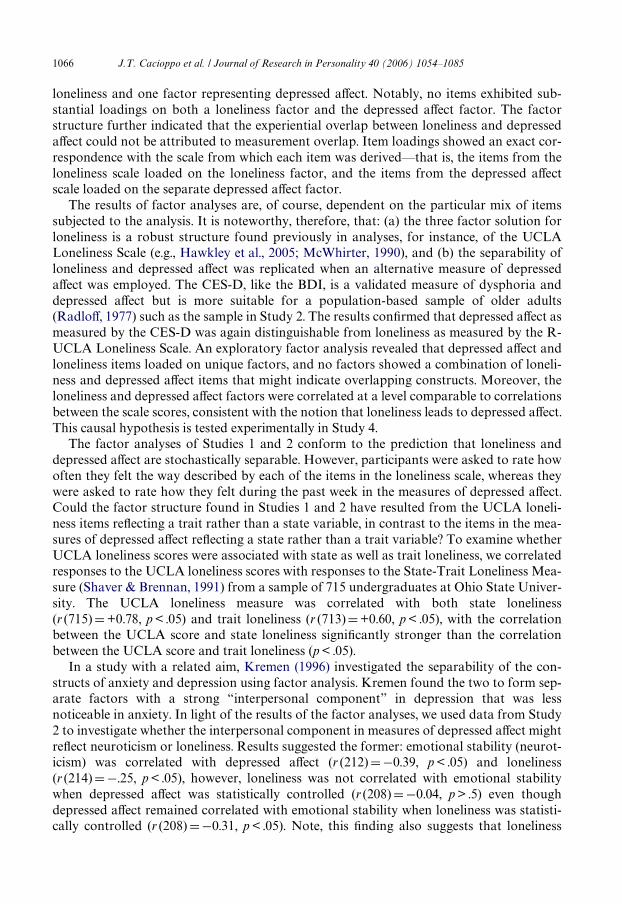
loneliness and one factor representing depressed aVect. Notably, no items exhibited sub-stantial loadings on both a loneliness factor and the depressed aVect factor. The factorstructure further indicated that the experiential overlap between loneliness and depressedaVect could not be attributed to measurement overlap. Item loadings showed an exact cor-respondence with the scale from which each item was derived—that is, the items from theloneliness scale loaded on the loneliness factor, and the items from the depressed aVectscale loaded on the separate depressed aVect factor.
The results of factor analyses are, of course, dependent on the particular mix of itemssubjected to the analysis. It is noteworthy, therefore, that: (a) the three factor solution forloneliness is a robust structure found previously in analyses, for instance, of the UCLALoneliness Scale (e.g., Hawkley et al., 2005; McWhirter, 1990), and (b) the separability ofloneliness and depressed aVect was replicated when an alternative measure of depressedaVect was employed. The CES-D, like the BDI, is a validated measure of dysphoria anddepressed aVect but is more suitable for a population-based sample of older adults(RadloV, 1977) such as the sample in Study 2. The results conWrmed that depressed aVect asmeasured by the CES-D was again distinguishable from loneliness as measured by the R-UCLA Loneliness Scale. An exploratory factor analysis revealed that depressed aVect andloneliness items loaded on unique factors, and no factors showed a combination of loneli-ness and depressed aVect items that might indicate overlapping constructs. Moreover, theloneliness and depressed aVect factors were correlated at a level comparable to correlationsbetween the scale scores, consistent with the notion that loneliness leads to depressed aVect.This causal hypothesis is tested experimentally in Study 4.
The factor analyses of Studies 1 and 2 conform to the prediction that loneliness anddepressed aVect are stochastically separable. However, participants were asked to rate howoften they felt the way described by each of the items in the loneliness scale, whereas theywere asked to rate how they felt during the past week in the measures of depressed aVect.Could the factor structure found in Studies 1 and 2 have resulted from the UCLA loneli-ness items reXecting a trait rather than a state variable, in contrast to the items in the mea-sures of depressed aVect reXecting a state rather than a trait variable? To examine whetherUCLA loneliness scores were associated with state as well as trait loneliness, we correlatedresponses to the UCLA loneliness scores with responses to the State-Trait Loneliness Mea-sure (Shaver & Brennan, 1991) from a sample of 715 undergraduates at Ohio State Univer-sity. The UCLA loneliness measure was correlated with both state loneliness(r (715)D+0.78, p < .05) and trait loneliness (r (713)D+0.60, p < .05), with the correlationbetween the UCLA score and state loneliness signiWcantly stronger than the correlationbetween the UCLA score and trait loneliness (p < .05).
In a study with a related aim, Kremen (1996) investigated the separability of the con-structs of anxiety and depression using factor analysis. Kremen found the two to form sep-arate factors with a strong “interpersonal component” in depression that was lessnoticeable in anxiety. In light of the results of the factor analyses, we used data from Study2 to investigate whether the interpersonal component in measures of depressed aVect mightreXect neuroticism or loneliness. Results suggested the former: emotional stability (neurot-icism) was correlated with depressed aVect (r (212)D¡0.39, p < .05) and loneliness(r (214)D¡.25, p < .05), however, loneliness was not correlated with emotional stabilitywhen depressed aVect was statistically controlled (r (208)D¡0.04, p > .5) even thoughdepressed aVect remained correlated with emotional stability when loneliness was statisti-cally controlled (r (208)D¡0.31, p < .05). Note, this Wnding also suggests that loneliness

J.T. Cacioppo et al. / Journal of Research in Personality 40 (2006) 1054–1085 1067
and depressed aVect are not simply associated manifestations of neuroticism. In Study 3,we examined the extent to which the eVects attributed to loneliness were explicable by abroader personality factor such as neuroticism.
Finally, if loneliness and depressed aVect were reXecting the same overarching construct,then the peripheral physiological correlates should overlap. Hawkley, Browne, and Caci-oppo (2004) examined the combined and unique association of loneliness, depressed aVect,perceived stress, hostility, and low social support with autonomic and neuroendocrineactivity in the CHASRS sample. Extending prior research, loneliness predicted signiW-cantly elevated systolic blood pressure (SBP) net of demographic variables, health behav-ior variables, and the remaining psychosocial factors (including depressed aVect); net eVectsize was 0.85 mm Hg per standard deviation of loneliness for each addition year of age.Loneliness did not have independent eVects on overnight urinary cortisol levels but insteadperceived stress was directly related to cortisol levels while depressed aVect was inverselyrelated to it. These results complement the results of Studies 1 and 2 on the stochastic sepa-rability of loneliness and depressed aVect and indicate there are separable functional eVectsof loneliness and depressed aVect, as well.
4. Study 3
According to our evolutionary model of loneliness, a person made to feel lonely notonly feels unhappy but also feels unsafe, feelings that activate an anachronistic survivalmechanism that heightens sensitivity to threats from all sides. This implies that lonelinessshould inXuence not only depressed aVect but also mood, anxiety, anger, optimism, fear ofnegative evaluation, social skills, social support, and dysphoria. In addition, Leary’s soci-ometer theory (Leary & Baumeister, 2000; Leary, Tambor, Terdal, & Downs, 1995) sug-gests that self-esteem, an internal, psychological system that gauges the degree to which anindividual feels included versus excluded by other people, should also be inXuenced byloneliness. The prior literature is consistent with these predicted associations (e.g., seereview by Berscheid & Reis, 1998; Duck et al., 1994; Ernst & Cacioppo, 1999; Rook, 1984;Shaver & Brennan, 1991), but we sought to examine these associations in Study 3 and totest the hypothesis that experimental manipulations of loneliness inXuence the levels ofthese variables in Study 4.
Lonely individuals report higher levels of stress in their everyday life and exhibit poorercontrol over their attentional focus as indicated by their performance on a dichotic listen-ing task (Cacioppo et al., 2000). We therefore included measures of intrusive and avoidantthoughts regarding traumatic experiences to examine whether lonely individuals are alsocharacterized by more intrusive thoughts about traumatic events. In a study of bereavedmothers, Lepore, Silver, Wortman, and Wayment (1996) reported that the frequency ofintrusive thoughts about the traumatic event was positively correlated with social con-straint, a term the authors used to describe mothers’ strained social support and inhibitedability to talk about their loss. They further found that intrusive thinking predicted depres-sive symptoms in high social constraint mothers but not in low constraint mothers. Loneli-ness was not examined by Lepore et al. (1996), however, and the associations betweenloneliness and intrusive and avoidant thinking are not known.
Second, given the heritability of loneliness we sought to examine the relationshipbetween loneliness and personality. The Big Five taxonomy—which parses personality intoWve major factors: surgency, agreeableness, conscientiousness, emotional stability, and

1068 J.T. Cacioppo et al. / Journal of Research in Personality 40 (2006) 1054–1085
openness—has become an integrative tool in research on personality and on aVective andsocial vulnerabilities (John & Srivastava, 1999). Components of the Big 5 have been associ-ated with loneliness in prior research (e.g., Russell et al., 1980; Stephan, Fath, & Lamm,1988; cf. Cheek & Busch, 1981), but the extent to which these components can explain theassociations between loneliness and mood, anxiety, anger, optimism, fear of negative evalu-ation, shyness, social skills, social support, dysphoria, sociability, and self esteem has notbeen investigated. Relatedly, to the extent loneliness is functionally independent ofdepressed aVect, loneliness may exhibit unique patterns of association with personality(e.g., surgency, shyness) and socioemotional variables (e.g., mood, self-esteem), indepen-dent of levels of depressed aVect.
Finally, an assumption of correlational techniques or analyses of variance contrastingextreme groups (i.e., high versus low loneliness) is that the association between loneliness andrelated variables is only linear—that is, individuals average in loneliness are as similar to indi-viduals low in loneliness as they are to individuals high in loneliness. To test this assumption,we gauged the loneliness of 2531 participants in pretesting. For Study 3, one-third of the par-ticipants were recruited from people whose loneliness score on the pretest fell into the bottomquintile, one-third of the participants came from people whose loneliness score on the pretestfell into the middle quintile, and one-third of the participants came from people whose loneli-ness score on the pretest fell into the top quintile. This insured that the loneliness scores of thepeople in Study 3 would vary along a wide range of loneliness scores. Loneliness was thentreated as a continuous variable in Study 3, and we examined both linear and quadratic asso-ciations between loneliness and the study variables.
4.1. Method
4.1.1. ParticipantsThe 2531 participants tested in Study 1 (Time 1) served as potential participants for
Study 3. Only a small percentage of the eligible participants were randomly selected forStudy 3 (see Hawkley et al., 2004). The primary determinant of eligibility was that scoreson the R-UCLA Loneliness Scale at Time 1 were in the upper quintile (high lonely group:total score 7 44; MD51.4), middle quintile (average lonely group: 33 6 total score6 39;MD 35.3), or lower quintile (low lonely group: total score < 28; MD24.5). The Wnal sampleconsisted of an equal number of male and female participants in each quintile who metadditional inclusionary criteria: (a) a score no higher than 13 on the 13-item version of theBeck Depression Inventory (Beck & Beck, 1972) (included to avoid including participantswith a high likelihood of clinical depression); (b) a body mass index no greater than 27(included to avoid confounding obesity with physiological measures included in the largerstudy); (c) enrollment in at least 6 credit hours and class standing of neither a Wrst-quarterfreshmen nor a last-quarter senior; (d) neither married nor living with a signiWcant other;(e) US citizen (c–e were included to ensure that all participants had similar access to socialcontacts at the time their loneliness levels were measured); and (f) neither speech nor nee-dle phobic (included to avoid confounds with other aspects of the larger study such as afear of needles and having their blood drawn). This group of 135 students (44 high lonely,46 average lonely, and 45 low lonely) completed a second R-UCLA Loneliness Scale 2weeks to 2 months later (Time 2), upon entry into Study 3. Loneliness scores exhibited con-siderable stability from Time 1 to Time 2, Spearman’s rD .74, and signiWcant group diVer-ences in loneliness scores were maintained across this time period (see below).

J.T. Cacioppo et al. / Journal of Research in Personality 40 (2006) 1054–1085 1069
The 135 participants in Study 3 (67 females; mean ageD19.23, SDD1.1, range 18–24)described their ethnic origins as 83% white or European (non-Hispanic), 7% black or Afri-can-American, 7% Asian, Asian-American, or PaciWc Islander, 1% Hispanic or LatinAmerican and 2% other. Participants were part of a larger study assessing the emotions,social lives, and physiology of individuals diVering in loneliness and were paid $200 fortheir participation in the study from which these data were drawn.
4.1.2. Measures4.1.2.1. Loneliness. Loneliness was assessed using the Revised-UCLA Loneliness Scale(R-UCLA; Russell et al., 1980) as described in Study 1. Cronbach’s � in this subsampleof Study 1 was .94.
4.1.2.2. Beck Depression Inventory. Depressed aVect was assessed using the 13-item BeckDepression Inventory (Beck & Beck, 1972) as described in Study 1. Cronbach’s � in thissubsample of Study 1 was .84.
4.1.2.3. Shyness and sociability. The Shyness and Sociability Scale consists of 14 items thatask participants to rate how each item describes them using a 5-point Likert scale thatranges from 0 (extremely uncharacteristic) to 4 (extremely characteristic). The 14 itemswere broken down into two separate subscales, shyness and sociability. The shyness sub-scale consisted of 9 items with a Cronbach’s � of .86; summing the responses across theitems yielded possible shyness scores ranging from 0 (low shyness) to 36 (high shyness).The sociability subscale consisted of 5 items with a Cronbach’s � of .82; summing theresponses across the items yielded possible sociability scores ranging from 0 (low sociabil-ity) to 20 (high sociability). See Cheek and Buss (1981) for scale design and psychometricproperties.
4.1.2.4. The Big 5 measure of personality. The “Big 5” (see Goldberg, 1992, for scale con-struction, validity, and reliability) is a self-report questionnaire in which participants areasked to rate how accurately each of 100 trait words describes themselves at the presenttime using a 9-point Likert scale that ranges from 1 (extremely inaccurate) to 9 (extremelyaccurate). The 100 items constitute Wve personality factors consisting of 10 positive and 10negative items each. These subscales, and their reliabilities in our sample, are surgency(�D .92), agreeableness (�D .92), conscientiousness (�D .90), emotional stability (�D .84),and openness (�D .89). Scores for each subscale were computed by reverse scoring the neg-ative items in each factor and then calculating the mean item response for all 20 items. Thisyielded subscale scores with potential ranges of 1–9; the higher the score, the more the par-ticipant considered the personality characteristic of herself/himself.
4.1.2.5. Positive and negative aVect schedule. The PANAS is a 20-item questionnaire thatasks participants to rate the extent to which they have felt the way described by the itemsduring the past week on a 5-point Likert scale that ranges from 1 (“very little or not at all”)to 5 (“extremely”). The 20-item PANAS scale is broken down into two 10-item subscales: apositive aVect subscale (�D .89) and a negative aVect subscale (�D .87). Subscale scoreswere computed by summing the responses to all items in the subscale and yielded possiblesubscale score ranges of 10 (low in given aVect) to 50 (high in given aVect). See Watson,Clark, and Tellegen (1988) for scale design and validation.

1070 J.T. Cacioppo et al. / Journal of Research in Personality 40 (2006) 1054–1085
4.1.2.6. Spielberger trait anger and anxiety. The Spielberger Trait Anger and Anxiety Scaleis a 20-item instrument that has two 10-item subscales, anger and anxiety. For all 20 items,participants were asked to rate each item with the term that best described how they gener-ally felt on a 4-point Likert scale that ranges from 1 (“almost never”) to 4 (“almostalways”). Subscale scores for all participants were computed by summing the responses toall items in the subscale. The subscale scores have a range of 10 (low trait anxiety or anger)to 40 (high trait anxiety or anger). The anxiety and anger subscales had Cronbach’s �s of.89 and .84, respectively. For scale design and psychometric properties, see Spielberger,Jacobs, Crane, and Russell (1983).
4.1.2.7. Revised Life Orientation Test. The Revised Life Orientation Test for optimism isa 10-item questionnaire that asks participants to rate their agreement with the items on a5-point Likert scale ranging from 0 (“strongly disagree”) to 4 (“strongly agree”). Fouritems served as Wller items, and scale scores were calculated by summing the responses tothe remaining six items. Cronbach’s � in our sample was 0.78. The range for the scalescores is 0 (low optimism) to 24 (high optimism). See Scheier, Carver, and Bridges (1994)for scale design and psychometric properties.
4.1.2.8. Social skills. Social skills were assessed using the 9 items from a social compe-tence scale (Levenson & Gottman, 1978), and four additional items that repeated earlieritems but phrased them in terms of someone of the same sex (as opposed to someone ofthe opposite sex). The 13 items describe speciWc behaviors asking participants to ratetheir likelihood of behaving in that way on a 4-point Likert scale ranging from 1 (I neverdo this) to 4 (I do this almost always). A scale score for each participant was computedby summing the responses to all items and yielded a potential scale score range of 13(low social skills) to 52 (high social skills). Cronbach’s � for this scale was .82. Exampleitems are “I stand up for my rights” and “Maintain a long conversation with a memberof the opposite sex.”
4.1.2.9. Rosenberg Self-Esteem Inventory. Self esteem has been conceptualized as a generalgauge of a person’s interpersonal relationships (Leary et al., 1995). The Rosenberg Self-Esteem Inventory (Rosenberg, 1965) is a 10-item questionnaire that asks participants toindicate their agreement with each self-descriptor item using a 4-point Likert scale rangingfrom 1 (strongly disagree) to 4 (strongly agree). Scale scores for each participant were com-puted by summing the responses to all items and yielded a possible scale range of 10 (lowself-esteem) to 40 (high self-esteem). Cronbach’s � for this scale in our sample was .90. Forfurther discussion of the psychometric properties of the scale, see Crandall (1973) andDobson et al. (1979).
4.1.2.10. Brief fear of negative evaluation. The Brief Fear of Negative Evaluation Scale is a12-item instrument developed by Leary (1983) based on the full version of the Fear of Neg-ative Evaluation scale by Watson and Friend (1969). Participants are asked to rate howcharacteristic the 12 items are of them on a 5-point Likert scale ranging from 1 (“not at allcharacteristic of me”) to 5 (“extremely characteristic of me”). A total score was calculatedfor each participant by summing the responses for each item, yielding a possible scale scorerange of 12 (low fear of negative evaluation) to 60 (high fear of negative evaluation). Cron-bach’s � was .94.

J.T. Cacioppo et al. / Journal of Research in Personality 40 (2006) 1054–1085 1071
4.1.2.11. Interpersonal Support Evaluation List. We used 6 items assessing appraisal sup-port from the Interpersonal Support Evaluation List (Cohen & Hoberman, 1983). Thisself-report questionnaire asks participants to rate how truly each item reXects their ownfeelings on a 4-point Likert scale that ranged from 1 (“deWnitely true”) to 4 (“deWnitelyfalse”). Scale scores were computed by summing the responses to all items, and yielded apossible scale score range of 6 (low perceived social support) to 24 (high perceived socialsupport). Cronbach’s � was .84.
4.1.2.12. Impact of Event Scale. The Impact of Event Scale is a 15-item self-report ques-tionnaire that asks the participant to Wrst identify a recent serious life event and to reportthe approximate date and nature of the event on the form (Horowitz, Wilner, & Alvarez,1979). All items are then asked in relation to that event. For each item, the participant wasasked to rate, on a weighted 4-point Likert scale, how often the comments were true ofthem over the past 7 days: 0 (not at all), 1 (rarely), 3 (sometimes), and 5 (often). A 7-itemintrusion (�D .88) and an 8-item avoidance subscale (�D .82) were computed by totalingthe sum of all items in each subscale. The intrusion subscale measures the extent to whichthe participant thinks about the event, and total scores can range from 0 to 35. The avoid-ance subscale measures the extent to which the participant denies, blunts, or ideationallyreconstructs the event, and total scores can range from 0 to 40.
4.1.3. ProcedureStudents began their participation in this study in the early evening at the General Clin-
ical Research Center (GCRC) of the Ohio State University Hospital. Participants com-pleted questionnaires during three time periods that evening, interspersed withcardiovascular testing and a meal. The Wnal set of questionnaires was completed the fol-lowing morning after spending the night at the hospital. Physiological measures were alsoobtained, the results of which are reported elsewhere (Cacioppo, Hawkley, Berntson, et al.,2002; Cacioppo, Hawkley, Crawford, et al., 2002).
The questionnaires were created using Teleform for Windows (version 5.0, CardiV Soft-ware). Completed forms were scanned and veriWed for accuracy and the data saved in adesktop PC database. For most scales, if fewer than 10% of items were missing values, thevalues of the missing items were imputed with the mean of the intact values. For scalesbetween 5 and 10 items in length, scores were not calculated if more than one item wasmissing. If scales shorter than 5 items long were missing any values, scores were notcomputed.
4.1.4. Statistical analysisData were imported into SPSS (version 12.0, SPSS) for reduction and analysis. The
General Linear Model (GLM) multivariate procedure (MANCOVA) was employed toevaluate the eVect of loneliness on multiple dependent variables. Separate models weretested to examine loneliness diVerences among (1) personality and (2) socioemotional vari-ables. In this MANCOVA procedure, which is the multivariate equivalent of a univariateregression approach, loneliness (linear term) and loneliness squared (quadratic term) aretreated as continuous covariates in the analysis, and no categorical independent variablesare speciWed. Loneliness and all outcome variables were standardized prior to analysis.CoeYcients are therefore interpretable as beta weights (SD change in outcome associatedwith 1 SD change in loneliness). The Wilks-lambda criterion was used to evaluate

1072 J.T. Cacioppo et al. / Journal of Research in Personality 40 (2006) 1054–1085
signiWcance for the MANCOVA omnibus tests. SigniWcant omnibus tests were followed upwith GLM univariate analyses of covariance (ANCOVAs). Cell sizes in the analyses wereadjusted for incomplete data from participants. Statistical signiWcance was set at p < .05unless otherwise noted.
4.2. Results
Because the loneliness groups were assigned based on prescreening assessmentsperformed 2 weeks to 2 months earlier, we examined current loneliness scores usingthe R-UCLA scale. A one-way ANOVA (loneliness group: high, average, lonely) with theR-UCLA score as a dependent variable revealed a signiWcant eVect for loneliness,F (2, 132)D 62.90, p < .05, and conWrmed that the groups diVered as expected:Mhigh lonelinessD 44.01, SDD 9.28, Maverage lonelinessD35.66, SDD7.20, Mlow lonelinessD26.76,SDD 4.55. Post hoc analyses using the Tukey-B procedure revealed that each groupdiVered signiWcantly from the other groups; eVect sizes (d’s) contrasting the high lonelywith the average and low lonely groups were 1.01 and 2.36, respectively, and contrastingthe average and low lonely groups was 1.48. For the purposes of the following analyses, weemploy the continuous loneliness scores from Time 1, obtained at the time of assignmentinto loneliness groups, because we sought to examine the correlates, and the possibleeVects, of loneliness.
A multivariate GLM procedure treating all variables as continuous was performed withthe socioemotional variables serving as the outcome variables (i.e., negative mood, positivemood, anxiety, anger, optimism, self-esteem, fear of negative evaluation, social skills, socialsupport, intrusive thoughts, and avoidant thoughts). The omnibus eVect for loneliness wassigniWcant, F (11, 121)D11.793, partial eta-squaredD 0.52. Follow-up univariate GLM pro-cedure indicated a signiWcant linear relationship between loneliness and each of the socio-emotional variables, with the exception of intrusive thinking, p > .5. � weights (SD changein outcome associated with 1 SD change in loneliness) conWrmed that higher lonelinessscores predicted greater negative mood, bD0.42 (SED .08), anxiety, bD 0.63 (SED .07),anger, bD0.25 (SED .09), fear of negative evaluation, bD 0.24 (SED .09), and avoidantthinking, bD 0.17 (SED .09), and predicted lower positive mood, bD¡0.40 (SED .08), opti-mism, bD¡0.40 (SED .08), self-esteem, bD¡0.47 (SED .08), social skills, bD¡0.40(SED .08), and social support, bD¡0.62 (SED .07).
We next examined the linear relationship between loneliness and personality variables.The multivariate GLM analysis produced a signiWcant omnibus eVect for loneliness,F (7, 121)D 8.559, partial eta-squaredD0.33, and was followed by univariate GLM proce-dure indicating a signiWcant linear relationship between loneliness and each of the person-ality measures except intellect (openness), p > .2. Replicating and extending prior research,� weights indicated that higher levels of loneliness were associated with lower surgency(extraversion), bD¡0.42 (SED .08), emotional stability (neuroticism), bD¡0.30(SED .09), agreeableness, bD¡0.36 (SED .08), conscientiousness, bD¡0.38 (SED .08),sociability, bD¡0.29 (SED .09), and shyness, bD0.44 (SED .08).
A second set of multivariate GLM procedures were conducted to test whether lonelinessexhibited a quadratic relationship with personality and socioemotional variables. For theseanalyses, the raw loneliness score and a squared loneliness score (representing the qua-dratic term) were entered as simultaneous predictors. The omnibus test of the quadraticterm was not signiWcant for the personality variables, F (7, 120)D1.343, p > .2, or the

J.T. Cacioppo et al. / Journal of Research in Personality 40 (2006) 1054–1085 1073
socioemotional variables, F (11, 120)D1.400, p > .1. Only the linear associations were statis-tically signiWcant.
As indicated by the � weights above, loneliness was signiWcantly associated with the per-sonality factors of surgency, agreeableness, emotional stability, conscientiousness, shyness,and sociability. To examine whether the associations between loneliness and the socioemo-tional variables we examined were attributable to an overarching personality factor, thelinear GLM analyses above were repeated simultaneously holding constant the eVects ofsurgency, agreeableness, emotional stability, conscientiousness, shyness, and sociability.This did not alter the relationships between loneliness and negative mood, anxiety, anger,optimism, self-esteem, and social support. Intrusive thinking remained nonsigniWcant, andavoidant thinking, positive aVect, fear of negative evaluation, and social skills were ren-dered nonsigniWcant when the six personality variables that were correlated with lonelinessserved as covariates.
4.3. Discussion
The Wrst aim of Study 3 was to replicate the Wnding in prior studies that loneliness wasassociated with mood, anxiety, anger, optimism, self-esteem, fear of negative evaluation,social skills, and social support. The results of Study 3 not only replicated these associa-tions but demonstrated that loneliness was also related to avoidant (but not intrusive)thinking and determined that the form of these associations was linear. A second aim wasto examine the association between loneliness and broader personality constructs, andresults conWrmed that loneliness covaried in a strictly linear fashion with emotional stabil-ity, surgency, agreeableness, conscientiousness, shyness, and sociability.
Importantly, the measurement of these variables in the same study made it possible todetermine to what extent the associations between loneliness and socioemotional statescould be explained in terms of the inXuence of one or more broad personality factors. Theset of six personality factors associated with loneliness (surgency, emotional stability,agreeableness, conscientiousness, shyness, and sociability) could plausibly explain the asso-ciations between loneliness and avoidant thinking, positive aVect, fear of negative evalua-tion, and social skills, but the associations between loneliness and negative mood, anxiety,anger, optimism (pessimism), self-esteem, and social support remained statistically signiW-cant. Except perhaps for the Wnding for fear of negative evaluation, these results are inaccord with the notion that feeling lonely does more than make one feel unhappy, it alsoheightens feelings of insecurity and the sensitivity to threats and rejection.
As an ancillary aim, we sought to examine whether intrusive thinking about traumaticevents might be responsible for the Wnding in the literature that lonely individuals feel lesscontrol and more depressed aVect, anxiety, anger, and pessimism than nonlonely individuals.The results of Study 3 showed there was no relationship between loneliness and intrusivethinking, ruling out that account. Avoidant thinking was found to covary with loneliness butthis association became nonsigniWcant when personality variables were entered Wrst into theregression analyses. In the Lepore et al. (1996) study, bereaved mothers reported that the fre-quency of intrusive thoughts about the traumatic event was positively correlated with themothers’ strained social support and inhibited ability to talk about their loss (termed socialconstraint). In ancillary analyses, we found surgency to be suYcient to eliminate the associa-tion between loneliness and avoidant thinking, suggesting that the individual diVerences insocial constraint in Lepore et al. (1996) may reXect variations in extraversion.

1074 J.T. Cacioppo et al. / Journal of Research in Personality 40 (2006) 1054–1085
According to our evolutionary model, loneliness is not simply a correlate of mood,anger, anxiety, optimism, self-esteem, and related states, it can play an instrumental role inthese states. Surprisingly little is known about what occurs when feelings of lonelinesschange, however. As noted by Russell et al. (1980), “(e)mpirical research (on loneliness) hasbeen hampered by a variety of problemsƒ A major hindrance is that loneliness, unlikeaggression, competition, and crowding, cannot be readily manipulated by researchers”(p. 472). To address this obstacle, Russell et al. (1980) developed a measure of loneliness toinvestigate diVerences among those who contrasted in terms of their feelings of loneliness.This approach has dominated the Weld with good eVect, but it does not adequately addressthe possible causal role of loneliness. The aim in Study 4 was to examine whether lonelinesscould be manipulated experimentally using hypnosis and, if so, to investigate whether vari-ables observed to diVerentiate lonely and nonlonely groups in Study 3 vary with the exper-imental manipulation of loneliness in Study 4.
5. Study 4
Hypnosis has been successfully employed in the past to manipulate a psychological stateto measure the eVect on dependent variables (Klein & Spiegel, 1989; Kosslyn, Thompson,Costantini-Ferrando, Alpert, & Spiegel, 2000; Nordby, Hugdahl, Jasiukaitis, & Spiegel,1999; Spiegel & Barabasz, 1988; Williamson et al., 2001), and to intensify aVective experi-ence (Bower, 1981; Spiegel, 1992), although the value of hypnosis in this regard may be lim-ited to high hypnotizable participants (Kosslyn et al., 2000). To manipulate lonelinesswithin the same person, we used a procedure similar to that used by Kosslyn et al. (2000),who recruited highly hypnotizable participants for a study of picture processing. Followinghypnotic induction, participants were exposed to color and gray scale pictures and patternsunder the hypnotic suggestion that the stimulus would be presented in color or gray scale.Results revealed that the participants reported seeing a color pattern when they had beentold one was being presented whether the pattern that was actually presented was a coloror a gray scale pattern. Similarly, the participants reported seeing a gray scale pattern whenthey had been told a gray scale pattern was being presented whether the pattern that wasactually presented was a color or a gray scale pattern.
Results in which hypnotized individuals have reported what the hypnotist instructedthem to feel have been criticized in the past as not producing changes in psychological con-tent or experience but only in producing compliance in terms of what the participants saidthey saw (i.e., role playing behavior; see Kirsch & Lynn, 1995). However, in the Kosslynet al. (2000) study, the authors also performed positron emission tomography scanning bymeans of [15O]CO2 during the presentation of the pictures. Results of the PET data indi-cated that the classic color area in the fusiform or lingual region of the brain was activatedwhen highly hypnotizable participants were asked to perceive color, whether the partici-pant had actually been shown the color or the gray-scale stimulus, and these brain regionsshowed decreased activation when the high hypnotizable participants were told they wouldsee gray scale, whether they were actually shown the color or gray-scale stimuli. In lowhypnotizable participants, on the other hand, changes in brain activation in these regionswas greater when color than gray-scale pictures were presented. Thus, observed changes insubjective experience achieved during hypnosis were reXected by changes in brain functionsimilar to those that occur in perception, supporting the claim that hypnosis can produceactual changes in psychological experience in high but not low hypnotizable participants.

J.T. Cacioppo et al. / Journal of Research in Personality 40 (2006) 1054–1085 1075
To manipulate loneliness within-participants, we recruited a sample of highly hypnotiz-able participants, used the same hypnotic induction procedure, and performed the hyp-notic induction with the same experimenter/hypnotist as used by Kosslyn et al. (2000). Wedeveloped scripts that induced individuals to recall and re-experience a time when they feltlonely (e.g., a high sense of isolation, absence of intimacy or companionship, and feelings ofnot belonging), or nonlonely (e.g., a high sense of intimacy, companionship, friendships,and belonging). Following hypnotic induction, these scripts were used to induce feelings ofhigh or low loneliness, and participants completed the measures used in Study 3 except forthe Big 5 inventory.
We hypothesized that a person made to feel lonely will feel depressed aVect (social pain)that, like physical pain, motivates them to repair the social disconnections even when theirimmediate self-interests are not served by the sharing of resources or defense. Furthermore, aperson made to feel lonely also feels unsafe and activates an anachronistic survival mechanismthat heightens sensitivity to threats, betrayals, and criticisms. Thus, we hypothesized that anexperimental manipulation of loneliness would also aVect mood, anxiety, anger, fear of nega-tive evaluation, social support, self esteem, and optimism (pessimism). To determine whetherparticipants were simply role-playing, we also included scales that could plausibly have variedas a function of loneliness but were not found to correlate with loneliness in Study 3 (i.e., intru-sive thinking). If the hypnotic induction leads to diVerences in intrusive thinking, as well, thenrole-playing would provide a plausible alternative interpretation for any results.
5.1. Method
5.1.1. ParticipantsThirty-four undergraduate students who were enrolled in general psychology or major-
ing in drama at Stanford University were initially assessed for hypnotizability using the10-item version of Form A of the Harvard Group Scale of Hypnotic Susceptibility (Shor &Orne, 1963). General psychology students were assessed in a group setting during a classperiod, and drama students were assessed individually in a small oYce. After receiving ahypnotic induction and several suggestions, participants recorded their responses to thesuggestions using an answer booklet. Participants’ responses were scored on a scale of 0–10with 10 indicating high hypnotic responsiveness.
Thirty-two participants receiving scores of 7 or higher were invited for a second assess-ment of hypnotizability. Participants were assessed individually using the 10-point scale ofthe Hypnotic Induction ProWle (HIP; Spiegel & Spiegel, 1978) in a small oYce. The HIP isused to evaluate three phases of a single hypnotic experience—entering the hypnotic trancestate, experiencing it, and exiting. Five items are used to rate cognitive and behavioralaspects of the participant’s hypnotic experience. Participants could receive a score of 0–10with 10 indicating high hypnotic responsiveness. Twenty-two of these participants scored 8or above on the HIP and were eligible for participation in Study 4. One participantdeclined, leaving a study sample of 13 males and 8 females. Participants were paid $10 perhour for their involvement in the experiment.
5.1.2. Psychological measuresThe same emotional, social, and personality measures described in Study 3 were used in
Study 4 with the exception of the Big 5 personality inventory. (Time limitations preventedus from employing this 100-item instrument.)

1076 J.T. Cacioppo et al. / Journal of Research in Personality 40 (2006) 1054–1085
5.1.3. ProcedureAfter arriving at the laboratory, participants provided informed consent and completed
the R-UCLA Loneliness Scale. The lights in the room were dimmed and participants wereasked to close their eyes and complete a Wller task (serial subtraction) for 4 min. A brief restperiod then followed before the hypnotic induction was performed.
5.1.3.1. Hypnotic induction. Exploratory (ND1255) and conWrmatory (ND 1276) factoranalyses of the responses to the UCLA Loneliness Scale from participants in the prescreen-ing of Study 1 revealed three correlated but separable dimensions of the experience of lone-liness: (a) a sense of isolation (e.g., “I feel isolated from others”), (b) a sense of connection(e.g., “There are people who really understand me”), and (c) a sense of belonging (e.g.,“I feel part of a group of friends”) (Hawkley et al., 2005). The scripts for manipulatingloneliness also included suggestions of the kind of aVect and imagery that we found todiVerentiate lonely and nonlonely individuals. Hypnotic inductions were then developedbased on the unique features of high and low feelings of loneliness, and in a within-partici-pants experimental design, participants were hypnotized and were induced to feel high orlow loneliness. The order of inductions was counterbalanced across participants.
Two experimenters tested participants individually. One experimenter, an experiencedinvestigator of hypnosis (BN), performed the hypnotic induction, the boosters, and termi-nation of the hypnotic state (see Spiegel & Spiegel, 1978).1 The scripts were read withoutdeviation. The second served as the experimenter for all other components of the study.Each participant was placed in a hypnotic state twice, once for the induction of feelings ofhigh loneliness and once for feelings of low loneliness (e.g., socially embeddedness). A5-min rest period separated the completion of the Wrst hypnotic state and the induction ofthe second. The order of the induction of high or low feelings of loneliness was counterbal-anced across participants.
Hypnotic induction began with the Wrst experimenter guiding participants from relaxa-tion to hypnosis (Spiegel & Spiegel, 1978). At this point, the participant was asked to closehis or her eyes, and the Wrst experimenter introduced the manipulation of loneliness. Forthe high lonely suggestion, participants were asked to think of a time during which they feltlonely and to re-experience those feelings. For example, participants were asked to “Thinkof a time in which you felt isolated. You felt lonely. Perhaps you felt like you just didn’tbelong—that you had no friends.” For the low lonely suggestion, participants were asked tothink of a time during which they felt a sense of belongingness and to re-experience thosefeelings. For example, participants were asked to “Think of a time in which you felt a senseof belonging. Perhaps you were a member of a group. Perhaps you had a best friend withwhom you felt you could share anything.” Each suggestion provided participants withexamples of events that might make them feel high or low in loneliness. Participants wereasked to provide speciWc information about their memories. The Wrst experimenter thenincorporated this information into boosters (see below).
All but one of the participants were successfully induced to feel high or low levels ofloneliness, as measured by the UCLA Loneliness Scale. The data from the individual forwhom hypnotic manipulation of loneliness did not work were not included in analyses,leaving a Wnal sample size of 20.
1 The scripts for the hypnotic induction, loneliness suggestions, and boosters are available from the Wrst authorfor interested readers.

J.T. Cacioppo et al. / Journal of Research in Personality 40 (2006) 1054–1085 1077
5.1.3.2. Questionnaire administration with loneliness-related boosters. Following the manip-ulation of feelings of loneliness, participants completed a Wller task (serial subtraction) beforebeing reminded of features of the circumstance the participant had described (e.g., Thanks-giving with loved ones). Participants were then given a set of surveys and were instructed thatthere were no correct answers and that they should answer the questions as completely andhonestly as possible. The Wrst block of surveys consisted of the R-UCLA as a manipulationcheck, and the anxiety, anger, and optimism scales. After completing these surveys, the exper-imenter again reminded them of the circumstance they had reported and asked them to com-plete a second set of surveys, which measured intrusive and avoidant thinking, social skills,and perceived social support. The experimenter again reminded them of the circumstancethey reported when high or low feelings of loneliness were induced, and participants com-pleted the measures of self-esteem, shyness and sociability, fear of negative evaluation, andpositive and negative aVect. Next, participants were instructed to close their eyes and to let goof their current feeling state and return to the feeling state they had before beginning theexperiment. The experimenter then guided participants out of the hypnotic state.
5.1.3.3. Post-experiment treatment. At the end of the second hypnotic state, the lights werebrightened to normal room lighting, and the participants were asked to complete theR-UCLA for the last time. Participants were then debriefed and thanked for their partici-pation. Meanwhile, the second experimenter scored the R-UCLA scales that were given atthe beginning and the end of the experiment. If the participant’s loneliness score was morethan three points higher post-experiment relative to pre-experiment, the experimenters dis-cussed this with the participant and asked if they wanted to be re-hypnotized and given asuggestion for returning to their original feeling states. Only one participant was more thanthree points higher post-relative to pre-experiment. This participant declined to be re-hyp-notized, saying that his or her feelings were Wne. All participants were given the name andcontact information of the experimenters and were asked to telephone or e-mail the exper-imenters if they felt any negative after-eVects. During debrieWng, most participantsreported that the study was very interesting, and all reported that, if given the opportunity,they would willingly participate in the study a second time. No negative after-eVects werereported or discerned.
5.1.4. Data analysisThe primary aim of Study 4 was to determine whether, and if so which, individual diVer-
ence variables associated with loneliness would be modulated by an experimental manipu-lation of loneliness. Because of the small sample size (i.e., limited degrees of freedom), weused a series of within-participant (high loneliness suggestion, low loneliness suggestion)ANOVAs to examine the inXuence of the hypnotic suggestion on each of the personalityand socioemotional variables. Given time constraints, the personality assessments werelimited to shyness and sociability.
5.2. Results
The Wrst aim of Study 4 was to examine whether loneliness could be manipulated in highhypnotizable participants using hypnosis. To test this hypothesis, we analyzed responses tothe R-UCLA Loneliness Scale. Consistent with this hypothesis, the mean levels ofloneliness after the hypnotic inductions were signiWcantly diVerent, F (1, 19)D109.56,

1078 J.T. Cacioppo et al. / Journal of Research in Personality 40 (2006) 1054–1085
p < .05. In addition, t tests indicated that the mean baseline (pre-hypnosis) level ofloneliness (MD36.10, SDD 6.87) diVered from the high loneliness induction level,t (19)D9.40, and from the low loneliness induction level, t (19)D6.38, p’s < .001. Moreover,the baseline level observed in Study 4 was similar to the mean for the average groupobserved in Study 3 (MD 35.66), the mean for low loneliness in Study 4 (MD29.55,SDD 6.09) approached the levels observed in the lowest quintile in Study 3 (MD 26.76),whereas the mean for high loneliness in Study 4 (MD 58.39, SDD 11.84) exceeded substan-tially the level observed in the highest quintile in Study 3 (MD40.01). Together, theseresults suggest that hypnosis can be an eVective means of experimentally manipulating feel-ings of loneliness, at least for highly hypnotizable participants.
The experimental manipulation of loneliness was found to inXuence all of the variableswith which it correlated in Study 3 except avoidant thinking (p’s < .05). Importantly, nodiVerences were found on the measures of intrusive thinking. The summary statistics areprovided in Table 3.
5.3. Discussion
The results of Study 3 showed that the association between loneliness and negativemood, anxiety, anger, optimism (pessimism), self-esteem, and social support remained sta-tistically signiWcant even after controlling for the personality dimensions of surgency, emo-tional stability, agreeableness, conscientiousness, shyness, and sociability. Study 4 wasdesigned to extend this work by examining whether changes in loneliness inXuenced relatedsocioemotional states. As hypothesized, individuals reported signiWcantly greater negativemood, anxiety, and anger and signiWcantly less optimism, self-esteem, and social supportwhen induced to feel high compared to low loneliness.
The results of Study 3 also suggested that the set of six personality factors couldplausibly explain the associations between loneliness and positive aVect, fear of negative
Table 3Means (standard deviations), signiWcance tests, and eVect sizes for psychosocial variables as a function of loneli-ness suggestion condition
a p < .05.
Variable Low lonely High lonely F (1, 19) Cohen’s d
Personality variablesShyness 12.05 (5.47) 21.05 (6.31) 37.35a 2.80Sociability 16.20 (2.95) 12.40 (4.68) 15.62a 1.81
Socioemotional variablesNegative Mood 21.05 (6.91) 30.42 (9.29) 20.67a (df D 1, 18) 2.14Positive Mood 36.32 (7.42) 29.16 (9.28) 11.54a 1.56Anxiety 16.35 (3.72) 25.30 (5.84) 42.69a 3.00Anger 16.84 (5.25) 21.30 (6.74) 16.50a 1.86Optimism 18.70 (3.23) 12.80 (5.04) 23.38a 2.22Self-Esteem 35.80 (3.74) 27.05 (6.26) 39.87a 2.90Fear of Negative Evaluation 35.61 (10.73) 44.10 (9.40) 21.38a 2.12Social Skills 41.40 (6.96) 34.90 (8.26) 41.70a 2.96Social Support 21.25 (2.17) 16.07 (4.19) 28.84a 2.46Intrusive Thoughts 16.35 (8.92) 19.05 (9.56) 3.33 0.84Avoidant Thoughts 15.80 (9.76) 19.85 (8.60) 3.04 0.80
J.T. Cacioppo et al. / Journal of Research in Personality 40 (2006) 1054–1085 1079
evaluation, social skills, and avoidant thinking. The fact that one or more of thesepersonality factors might parallel the association between loneliness and these variablesdoes not mean that loneliness might not also play a causal role. The results of Study 4suggest that the participants reported greater fear of negative evaluation, lower positivemood, and lower social skills when induced to feel high compared to low loneliness.Avoidant thinking was not altered signiWcantly by the experimental manipulation ofloneliness.
In Study 4, we included two personality measures found in Study 3 to correlate withloneliness: shyness and sociability. The results of Study 4 indicated that the participantsrated themselves as shyer and less sociable when induced to feel high compared to lowloneliness. Although this result was unexpected, two explanations warrant comment.First, feelings of social isolation, we have posited, lead people to not only feel unhappybut to feel insecure about their environment and about the intentions of other people.Although conjecture at this point, it is possible that such feelings directly aVect people’sself-descriptions of their sociability and shyness. Alternatively, it may be that the hyp-notic induction triggered role playing, and that our participants were responding to thedependent variables in ways they believed to be consistent with the roles of lonely andnonlonely individuals. Although the account cannot be ruled out, several observationslessen the plausibility of this account. First, manipulation checks following each loneli-ness manipulation not only conWrmed that loneliness as measured by the R-UCLA washigher than basal levels in the high loneliness condition and lower than basal levels in thelow loneliness condition, but the absolute values on the UCLA scale were similar tothose found in the between-participants design in Study 3. Second, the null eVects forintrusive thinking suggest that the loneliness manipulation did not simply evoke role-playing or demand characteristics. Convergent evidence using other means of manipu-lating loneliness is clearly needed.
Finally, concerns about external validity arise when using a specialized population suchas highly hypnotizable individuals. Less than 15% of the population is highly hypnotizable,and brain imaging studies indicate that high, but not low, hypnotizable individuals bothreport and show activation in brain regions correspondent to the induced experience ratherthan the physical reality (Kosslyn et al., 2000). Decades of hypnosis research have shownlittle or no correlation between hypnotizability and the Big 5 or other major personalityconstructs (Hilgard, 1965). Rather, modest correlations have been found with moreclosely-related attributes, such as a history of imaginative involvements and punishment(Hilgard, 1970) and a tendency to spontaneous absorption of self-altering experiences(Tellegen, 1981; Tellegen & Atkinson, 1974). It is not apparent why such individualdiVerences would limit the generalizability of the current Wndings.
6. General discussion
Loneliness is a word that makes all of us feel uneasy. We hesitate to admit the deepfear we have of facing life alone, strengthened only by our individual self-conWdenceand personal faith in what we are about. The young search for warmth and securityin the strong hand of a father and the warm embrace of a mother. Adolescents movecautiously out of the family into a world of their own—a place of challenges anduncertainties where group acceptance means so much and being left out Wlls one withemptiness that is too painful for tears. Adults who have been fortunate enough to

1080 J.T. Cacioppo et al. / Journal of Research in Personality 40 (2006) 1054–1085
establish warm relationships of love and concern in their lives realize the constantrisks that threaten them on every side—separations that ultimately force us all to facethe reality of death itself (Burke, 1970, Preface).
Social isolation is a risk factor for broad based morbidity and mortality across the adultlifespan (Berkman & Syme, 1979) comparable in strength to smoking, high blood pressure,obesity, and low physical activity even after statistically controlling for known biologicalrisk factors, socioeconomic status, and baseline measures of health (e.g., see review byHouse, Landis, & Umberson, 1988). Given the deleterious eVects associated with lonelinesson health and well-being (Seeman, 2000; Cacioppo, Hughes, Waite, Hawkley, & Thisted,in press), what function might it serve? We have posited that loneliness evolved to fosterthe reproductive success of human oVspring who must survive a lengthy period of abjectdependency. In conditions of hardship, hunter-gatherers who had a genetic predispositionto suVer distress from social disconnections and social reward from connections may havebeen more likely to return to share their food, shelter, or defense with their family andallies than those without such a predisposition. Although the latter individuals may wellhave roamed the earth better nourished than those who were distressed by social isolation,the abandoned oVspring—and the genetic predisposition to thrive in social isolation—would have been less likely to survive.
Even as adults, the rather limited size, speed, strength, and perceptual ability of humanscompared to other species in the animal kingdom placed a premium on genetic features ofindividuals who were inclined to think, cooperate with others, hunt in packs, and formdefensive alliances for protection. Perhaps it should not be so surprising, therefore, thatfeelings of social isolation and rejection are punishing and have an inXuence on our brainand physiological functioning as well as on our long-term health (Cacioppo, Hawkley,Berntson, et al., 2002, 2002; Eisenberger et al., 2003). Social separation, rejection, or lossnot only highlights an individual’s lack of personal control but it places the individual atrisk. We, therefore, posited that lonely individuals are not only unhappy, they have aheightened sensitivity to threats and attacks. Defensive behaviors such as preventativerejection of others may help fend oV treachery, rejections or attacks. Thus, although thisself-protective focus may be paradoxically self-defeating in the long-term, it can serve tolessen the short-term damage of the negative social interactions lonely individuals are morelikely to expect (Cacioppo et al., 2000) and to perceive in ambiguous interactions (e.g.,Rotenberg, 1994). Indeed, Cacioppo et al. (2000) found that lonely individuals showedsmaller heart rate increases to a series of evaluative social stressors (e.g., speech stressors)than nonlonely individuals.
The results of the current series of studies provided additional evidence bearing onthis model of loneliness. Our Wrst aim was to determine whether loneliness anddysphoria could be statistically disentangled. The results of Studies 1 and 2 replicatedprior research showing that loneliness and depressed aVect were correlated, but theresults further provided evidence that loneliness and depressed aVect were distinctconstructs. For instance, the items measuring depressed aVect and loneliness loadeduniquely on separate factors in both studies, and no factors showed a combination ofloneliness and depressed aVect items that might indicate overlapping constructs.Ancillary analyses argued against the factor structure in Studies 1 and 2 being due todiVerences in temporal perspective in ratings of loneliness and depressed aVect or tooverarching diVerences in neuroticism.

J.T. Cacioppo et al. / Journal of Research in Personality 40 (2006) 1054–1085 1081
Study 3 further examined the extent to which the eVects attributed to loneliness mightbe explicable to a broader personality factor. We replicated and extended prior studiesshowing that loneliness was associated with mood, anxiety, anger, optimism, self-esteem,fear of negative evaluation, social skills, low social support, and avoidant (but notintrusive) thinking. Furthermore, the results revealed a simple linear association ratherthan a categorical step-function such as that found in studies of temperament and socialinhibition (Cole et al., 1997; Kagan et al., 1994). These results argue against the notion thatlonely individuals are somehow diVerent than most other people, or that loneliness simplyreXects an inhibited temperament. Study 3 further showed that loneliness was associatedwith the personality factors of emotional stability, surgency, agreeableness, conscientious-ness, shyness, and sociability. Even when all six personality factors were entered Wrst inregression analyses, however, loneliness remained uniquely and signiWcantly associatedwith negative mood, anxiety, anger, optimism (pessimism), self-esteem, and low social sup-port. These results are consistent with the notion that feeling lonely does more than makeone feel unhappy, it also heightens feelings of insecurity and the sensitivity to threats andrejection. Finally, no evidence was found in Study 3 for the possibility that intrusive think-ing about traumatic events might be responsible for the Wnding in the literature that lonelyindividuals feel less control and more depressed aVect, anxiety, anger, and pessimism thannonlonely individuals.
One possible limitation is that the participants in Study 3 were high functioning youngadults who were enrolled in college. Perhaps the results do not generalize to a more repre-sentative sample. To investigate this, we repeated many of the analyses of Study 3 usingdata from our population-based urban sample of adults 50–67 years of age from ourChicago Health, Aging, and Social Relations Study (CHASRS). Elsewhere, we have dem-onstrated that this sample is representative of a national sample of urban adults bornbetween 1935 and 1952 (Hughes, Waite, Hawkley, & Cacioppo, 2004). In these analyses,too, we found linear associations between loneliness and both personality and socioemo-tional variables and very little in the way of higher order trends.
Another possible concern about the results of Study 3 given that individuals whoscored high on the BDI were not selected for participation is that the group labeled as“lonely” may not be as lonely as individuals in the population at large. Our use in Study3 of a BDI cutoV was done to study loneliness without co-morbid clinical depressedaVect. Less than 5% of the 2531 potential participants were excluded based on the BDIcutoV. Furthermore, the range of scores that deWned the lonely (top quintile) group inStudy 3 was not changed by this exclusion criterion. Finally, the BDI was not used toscreen participants in CHASRS, yet the cutoV for the top (high lonely) group in thispopulation-based study proved to be exactly the same as that used in Study 3 (UCLAtotal scores 7 44). It is unlikely, therefore, that the lonely group in Study 3 was biasedto be more average than lonely based on the BDI cutoV that was used. Moreover, ouranalyses of the data from CHASRS further support the suggestion that the results ofStudy 3 generalize to lonely individuals in the population who are not also clinicallydepressed.
According to our evolutionary model, loneliness is not simply a correlate of mood,anger, anxiety, optimism, self-esteem, and related socioemotional states, it can play aninstrumental role in activating these states. The major aim of Study 4 was to examinewhether loneliness could be manipulated experimentally using hypnosis and, if so, toinvestigate whether variables observed to diVerentiate lonely and nonlonely groups in
1082 J.T. Cacioppo et al. / Journal of Research in Personality 40 (2006) 1054–1085
Study 3 vary with the experimental manipulation of loneliness in Study 4. Resultsshowed that loneliness could be manipulated experimentally, at least within limits.Using a within-participants design, we found that individuals induced to feel lonelytook on many of the characteristics and attributes that we found to characterizeindividuals high in loneliness in Study 3, whereas the same individuals induced to feellow in loneliness took on many of the characteristics and attributes that we found tocharacterize the individuals low in loneliness in Study 3. These results suggest that lone-liness can serve as a central individual diVerence characteristic, and that changes inloneliness can aVect a wide range of related attributes ranging from shyness and socialskills to self-regulation, optimism, and self-esteem.
The results of Study 4 are also entirely compatible with recent research suggestingthat loneliness is approximately 50% heritable because both McGuire and CliVord(2000) and Boomsma, Willemsen, Hawkley, Cacioppo, & Posthuma (2004) found theenvironmental inXuences on loneliness to be approximately as strong. That is, 50% her-itable does not mean invariant. Indeed, Weiss (1973) found that a spouse following hisor her partner through a series of job transfers may be low in loneliness and welladjusted in one town but lonely and poorly adjusted in another. As demonstratedexperimentally in Study 4, the same person who seems unpleasant when feeling high inloneliness may appear pleasant and optimistic when feeling low in loneliness. In thiscontext, the results of the experimental manipulation of loneliness in Study 4 areencouraging for those in the throes of loneliness, as personality measures such as shy-ness and sociability, aVective states and orientations such as anger and optimism, andsocial dispositions such as self-esteem and fear of negative evaluation were aVected inStudy 4 in much the same way as observed between-participants in Study 3. Althoughhigh lonely individuals may be at risk for developing a pattern of social cognition andbehavior that provides short term protection at a long-term cost, the present studiessuggest loneliness is not a predestined fate.
References
Beck, A. T., & Beck, R. W. (1972). Screening depressed patients in a family practice: A rapid technic. PostgraduateMedicine, 52, 81–85.
Berkman, L. F., & Syme, S. L. (1979). Social networks, host resistance, and mortality: A nine-year follow-up studyof Alameda County residents. American Journal of Epidemiology, 109, 186–204.
Berscheid, E., & Reis, H. T. (1998). Attraction and close relationships. In D. T. Gilbert & S. T. Fiske (Eds.), Thehandbook of social psychology (Vol. 2, 4th ed., pp. 193–281). New York, NY, US: McGraw-Hill.
Boomsma, D. I., Willemse, G., Dolan, C. V., Hawkley, L. C., & Cacioppo, J. T. (2005). Genetic and environmentalcontributions to loneliness in adults: The Netherlands Twin Register Study. Behavior Genetics, 35, 745–752.
Boomsma, D . I., Willemsen, G., Hawkley, L. C., Cacioppo, J. T., & Posthuma, D. (2004). Genetics of loneliness:The Netherlands twin register study. Paper to be presented at European Conference, June, 2004.
Bower, G. H. (1981). Mood and memory. American Psychologist, 36, 129–148.Bowlby, J. (1969/1982). Attachment and loss: Vol. 1. Attachment. New York: Basic Books.Boyd, R., Gintis, H., Bowles, S., & Richerson, P. J. (2003). The evolution of altruistic punishment. Proceedings of
the National Academy of Sciences of the United States of America, 100, 3531–3535.Burke, C. (1970). Loneliness. Winona, MN: St. Mary’s College Press.Cacioppo, J. T., Ernst, J. M., Burleson, M. H., McClintock, M. K., Malarkey, W. B., Hawkley, L. C., et al. (2000).
Lonely traits and concomitant physiological processes: The MacArthur social neuroscience studies. Interna-tional Journal of Psychophysiology, 35, 143–154.
Cacioppo, J. T., & Hawkley, L. C. (2003). Social isolation and health, with an emphasis on underlying mecha-nisms. Perspectives in Biology and Medicine, 46, S39–S52.
J.T. Cacioppo et al. / Journal of Research in Personality 40 (2006) 1054–1085 1083
Cacioppo, J. T., & Hawkley, L. C. (2005). People thinking about people: The vicious cycle of being a social outcastin one’s own mind. In K. P. Williams, J. P. Forgas, & W. von Hippel (Eds.), The Social Outcast: Ostracism,Social Exclusion, Rejection, and Bullying (pp. 91–108). New York: Psychology press.
Cacioppo, J. T., Hawkley, L. C., Berntson, G. G., Ernst, J. M., Gibbs, A. C., Stickgold, R., et al. (2002). Lonely daysinvade the nights: Social modulation of sleep eYciency. Psychological Science, 13, 385–388.
Cacioppo, J. T., Hawkley, L. C., Crawford, L. E., Ernst, J. M., Burleson, M. H., Kowalewski, R. B., et al. (2002).Loneliness and health: Potential mechanisms. Psychosomatic Medicine, 64, 407–417.
Cacioppo, J. T., Hughes, M. E., Waite, L. J., Hawkley, L. C., & Thisted, R. A. (in press). Loneliness as a speciWcrisk factor for depressive symptoms: Cross sectional and longitudinal analyses. Psychology and Aging.
Calvin, W. H. (2004). A brief history of the mind. New York: Oxford University Press.Cheek, J. M., & Busch, C. M. (1981). The inXuence of shyness on loneliness in a new situation. Personality and
Social Psychology Bulletin, 7, 572–577.Cheek, J. M., & Buss, A. H. (1981). Shyness and sociability. Journal of Personality and Social Psychology, 41(2), 330–339.Cohen, S., & Hoberman, H. M. (1983). Positive events and social supports as buVers of life change stress. Journal
of Applied Social Psychology, 13, 99–125.Cole, S. W., Kemeny, M. E., & Taylor, S. E. (1997). Social identity and physical health: Accelerated HIV progres-
sion in rejection-sensitive gay men. Journal of Personality and Social Psychology, 72, 320–335.Crandall, J. W. (1973). Diagnostic uses of early spouse memories in marriage counseling. Journal of Family Coun-
seling, 1, 17–27.Darwin, C. (1959). The origin of the species by means of natural selection: Or, the preservation of favored races in
the struggle for life. London, England: John Murray.Dawkins, R. (1990). The selWsh gene. New York: Oxford University Press.Dobson, C., Goudy, W. J., Keith, P. M., & Powers, E. A. (1979). Further analysis of Rosenberg’s self-esteem scale.
Psychological Reports, 44, 639–641.Duck, S., Pond, K., & Leatham, G. (1994). Loneliness and the evaluation of relational events. Journal of Social and
Personal Relationships, 11, 253–276.Eisenberger, N. I., Lieberman, M., & Williams, K. D. (2003). Does rejection hurt? An fMRI study of social exclu-
sion. Science, 302, 290–292.Ernst, J. M., & Cacioppo, J. T. (1999). Lonely hearts: Psychological perspectives on loneliness. Applied and Preven-
tive Psychology, 8, 1–22.Fehr, E., & Gächter, S. (2002). Altruistic punishment in humans. Nature, 415, 137–140.Goldberg, L. R. (1992). The development of markers for the Big-Five factor structure. Psychological Assessment,
4, 26–42.Hathaway, S. R., & McKinley, J. C. (1983). The Minnesota Multiphasic personality Inventory manual. New York:
Psychological Corporation.Hawkley, L. C., Browne, M. W., & Cacioppo, J. T. (2005). How can I connect with thee? Let me count the ways.
Psychological Science, 16, 798–804.Hilgard, E. (1965). Hypnotic susceptibility. Brace & World, New York: Harcourt.Hilgard, E. (1970). Personality and hypnosis: A study of imaginative involvement. Chicago: University of Chicago Press.Horowitz, M. J., Wilner, N., & Alvarez, W. (1979). Impact of Event Scale: A measure of subjective stress. Psycho-
somatic Medicine, 41, 209–218.House, J. S., Landis, K. R., & Umberson, D. (1988). Social relationships and health. Science, 241, 540–545.Hughes, M. E., Waite, L. J., Hawkley, L. C., & Cacioppo, J. T. (2004). A short scale for measuring loneliness in
large surveys: Results from two population-based studies. Research on Aging, 26, 655–672.John, O. P., & Srivastava, S. (1999). The Big Five trait taxonomy: History, measurement, and theoretical perspec-
tives. In L. A. Pervin & O. P. John (Eds.), Handbook of personality: Theory and research (2nd ed., pp. 102–138).New York, NY: The Guilford Press.
Kagan, J., Snidman, N., Arcus, D., & Reznick, J. S. (1994). Galen’s prophecy: Temperament in human nature. NewYork: Basic Books.
Kirsch, I., & Lynn, S. J. (1995). The altered state of hypnosis: Changes in the theoretical landscape. American Psy-chologist, 50, 846–858.
Klein, K. B., & Spiegel, D. (1989). Modulation of gastric acid secretion by hypnosis. Gastroenterology, 96, 1383–1387.Kosslyn, S. M., Thompson, W. L., Costantini-Ferrando, M. F., Alpert, N. M., & Spiegel, D. (2000). Hypnotic
visual illusion alters color processing in the brain. American Journal of Psychiatry, 157, 1279–1284.Kremen, A. M. (1996). Depressive tendencies and susceptibility to anxiety: DiVerential personality correlates.
Journal of Personality, 64, 209–242.

1084 J.T. Cacioppo et al. / Journal of Research in Personality 40 (2006) 1054–1085
Leary, M. R., & Baumeister, R. F. (2000). The nature and function of self-esteem: Sociometer theory. In M. P. Zanna(Ed.), Advances in experimental social psychology (Vol. 32, pp. 1–62). San Diego: Academic Press.
Leary, M. R., Tambor, E. S., Terdal, S. K., & Downs, D. L. (1995). Self-esteem as an interpersonal monitor. Jour-nal of Personality and Social Psychology, 68, 518–530.
Leary, M. R. (1983). A brief version of the fear of negative evaluation scale. Personality and Social PsychologyBulletin, 9, 371–375.
Lepore, S. J., Silver, R. C., Wortman, C. B., & Wayment, H. A. (1996). Social constraints, intrusive thoughts,and depressive symptoms among bereaved mothers. Journal of Personality and Social Psychology, 70,271–282.
Levenson, R. W., & Gottman, J. M. (1978). Toward the assessment of social competence. Journal of Consultingand Clinical Psychology, 46, 453–462.
McGuire, S., & CliVord, J. (2000). Genetic and environmental contributions to loneliness in children. Psychologi-cal Science, 11, 487–491.
McWhirter, B. T. (1990). Factor analysis of the revised UCLA loneliness scale. Current Psychology: Research andReviews, 9, 56–68.
Nordby, H., Hugdahl, K., Jasiukaitis, P., & Spiegel, D. (1999). EVects of hypnotizability on performance of aStroop task and event-related potentials. Perceptual and Motor Skills, 88(3 Pt. 1), 819–830.
Peplau, L. A., & Perlman, D. (Eds.). (1982). Loneliness: A sourcebook of current theory, research, and therapy. NewYork: Wiley.
RadloV, L. S. (1977). The CES-D Scale: A self-report depression scale for research in the general population.Applied Psychological Measurement, 1, 385–401.
Rainville, P., Duncan, G. H., Price, D. D., Carrier, B., & Bushnell, M. C. (1997). Pain aVect encoded in humananterior cingulate but not somatosensory cortex. Science, 277, 968.
Ridley, M. (2000). Genome. New York: Perennial.Rilling, J. K., Gutman, D. A., Zeh, T. R., Pagnoni, G., Berns, G. S., & Kilts, C. D. (2002). A neural basis for social
cooperation. Neuron, 35, 395–405.Rook, K. S. (1984). Promoting social bonding: Strategies for helping the lonely and socially isolated. American
Psychologist, 39, 1389–1407.Rotenberg, K. (1994). Loneliness and interpersonal trust. Journal of Social and Clinical Psychology, 13, 152–173.Rosenberg, M. (1965). Society and the adolescent self-image. Princeton, NJ: Princeton University Press.Russell, D., Peplau, L. A., & Cutrona, C. E. (1980). The revised UCLA Loneliness Scale: Concurrent and discrim-
inant validity evidence. Journal of Personality and Social Psychology, 39, 472–480.Scheier, M. F., Carver, C. S., & Bridges, M. W. (1994). Distinguishing optimism from neuroticism (and trait anxi-
ety, self-mastery, and self-esteem): A reevaluation of the Life Orientation Test. Journal of Personality andSocial Psychology, 67, 1063–1078.
Seeman, T. (2000). Health promoting eVects of friends and family on health outcomes in older adults. AmericanJournal of Health Promotion, 14, 362–370.
Shaver, P. R., & Brennan, K. A. (1991). Measures of depression and loneliness. In J. P. Robinson & P. R. Shaver(Eds.), Measures of social psychological attitudes (Vol. 1, pp. 195–289). San Diego, CA: Academic Press.
Shor, R. E., & Orne, E. C. (1963). Norms of the Harvard Group Scale of Hypnotic Susceptibility, form A. Interna-tional Journal of Clinical and Experimental Hypnosis, 11, 39–47.
Segrin, C. (1998). Interpersonal communication problems associated with depression and loneliness. In P. A.Andersen & L. K. Guerrero (Eds.), Handbook of communication and emotion: Research, theory, applications,and contexts (pp. 215–242). San Diego, CA: Academic Press.
Spiegel, D. (1992). The use of hypnosis in the treatment of PTSD. Psychiatric Medicine, 10, 21–30.Spiegel, D., & Barabasz, A. (1988). EVects of hypnotic instructions on P300 evoked potential amplitudes: Research
and clinical implications. American Journal of Clinical Hypnosis, 31, 11–17.Spiegel, H., & Spiegel, D. (1978). Trance and treatment: Clinical uses of hypnosis. New York: Basic Books.Spielberger, C. D., Jacobs, G. A., Crane, R. S., & Russell, S. F. (1983). On the relation between family smoking
habits and the smoking behavior of college students. International Review of Applied Psychology, 32, 53–69.Stephan, E., Fath, M., & Lamm, H. (1988). Loneliness as related to various personality and environmental mea-
sures: Research with the German adaptation of the UCLA loneliness scale. Social Behavior and Personality,16, 169–174.
Tellegen, A. (1981). Practicing the two disciplines for relaxation and enlightenment: Comment on “Role of thefeedback signal in electromyography biofeedback: The relevance of attention” by Qualls and Sheehan. Jour-nal of Experimental Psychology General, 110, 217–231.

J.T. Cacioppo et al. / Journal of Research in Personality 40 (2006) 1054–1085 1085
Tellegen, A., & Atkinson, G. (1974). Openness to absorbing and self-altering experiences (“absorption”), a traitrelated to hypnotic susceptibility. Journal of Abnormal Psychology, 83, 268–277.
Watson, D., Clark, L. A., & Tellegen, A. (1988). Development and validation of brief measures of positive andnegative aVect: The PANAS scales. Journal of Personality and Social Psychology, 54, 1063–1070.
Watson, D., & Friend, R. (1969). Measurement of social-evaluative anxiety. Journal of Consulting and ClinicalPsychology, 33, 448–457.
Weiss, R. S. (1973). Loneliness: The experience of emotional and social isolation. Cambridge, MA: MIT Press.Williamson, J. W., McColl, R., Matthews, D., Mitchell, J. H., Raven, P. B., & Morgan, W. P. (2001). Hypnotic
manipulation of eVort sense during dynamic exercise: Cardiovascular responses and brain activation. Journalof Applied Physiology, 90, 1392–1399.
Related Documents