Loneliness among Older Adults: A National Survey of Adults 45+ Conducted for AARP The Magazine September 2010

Welcome message from author
This document is posted to help you gain knowledge. Please leave a comment to let me know what you think about it! Share it to your friends and learn new things together.
Transcript
Loneliness among Older Adults: A National Survey of Adults 45+
Conducted for AARP The Magazine
September 2010

Loneliness among Older Adults: A National Survey of Adults 45+
Report prepared by: Knowledge Networks and Insight Policy Research
Survey Conducted by: Knowledge Networks
For More Information, Contact: Gretchen Anderson, Research Analyst Member Research and Insights, AARP
©Copyright AARP Reprinting with permission only
601 E St. NW Washington, D.C. 20049
www.aarp.org
September 2010

The views expressed herein are for information, debate and discussion, and do not necessarily represent official policies of AARP. AARP is a nonprofit, nonpartisan organization that helps people 50+ have independence, choice and control in ways that are beneficial and affordable to them and society as a whole. AARP does not endorse candidates for public office or make contributions to either political campaigns or candidates. We produce AARP The Magazine, the definitive voice for 50+ Americans and the world's largest-circulation magazine with over 35.1 million readers; AARP Bulletin, the go-to news source for AARP's millions of members and Americans 50+; AARP VIVA su Segunda Juventud, the only bilingual U.S. publication dedicated exclusively to the 50+ Hispanic community; and our website, AARP.org. AARP Foundation is an affiliated charity that provides security, protection, and empowerment to older persons in need with support from thousands of volunteers, donors, and sponsors. We have staffed offices in all 50 states, the District of Columbia, Puerto Rico, and the U.S. Virgin Islands. Wilson, C., & Moulton, B. (2010). Loneliness among Older Adults: A National Survey of Adults 45+. Prepared by Knowledge Networks and Insight Policy Research. Washington, DC: AARP.

TABLE OF CONTENTS
CHAPTER PAGE Executive Summary ....................................................................................................... i I: Background and Study Methodology ................................................................1 II: Survey Findings .................................................................................................2 A. Descriptive Profile of Lonely Older Americans.............. ............................2 a. Incidence, cause and duration of loneliness among older adults ......2 b. Demographics of those who are lonely (versus those who are not) .....................................................................................2 c. Life experiences and loneliness ........................................................4 d. Social network and loneliness ...........................................................6
B. Loneliness and Health ................................................................................11 a. Medical conditions ..........................................................................11 b. Mental health ..................................................................................13 c. Health behaviors..............................................................................13 d. Effect of loneliness on health ..........................................................13 C. Loneliness and Use of Technology ............................................................13
a. Use of communications technology ................................................13 b. Perceived impact of using communications technology .................16 D. Strategies for Coping With Loneliness ......................................................17 E. Predictors of Loneliness .............................................................................17 III: Appendices ......................................................................................................20 A. Annotated Questionnaire ............................................................................35
Loneliness among Older Adults: A National Survey of Adults 45+
i
EXECUTIVE SUMMARY
The purpose of this study was to provide a better understanding of loneliness among adults age 45 and older. In addition to examining prevalence rates across and within groups of older Americans, the study provides a descriptive profile of lonely older adults and examines the relationships between loneliness and health, health behaviors, involvement in a social network and use of technology for social communications and networking.
Overall, a little over one-third (35%) of the survey respondents were lonely, as measured by a score of 44 or higher on the UCLA loneliness scale. Among the demographic variables considered, age, income and marital status were significantly related to loneliness. Older adults and those with higher incomes reported lower rates of loneliness than those who were younger or earned less income. Among the six marital status categories, married respondents were least likely to be lonely (29%) and never-married respondents were most likely to be lonely (51%). Gender, education and race/ethnicity were not related to loneliness.
Perceived lack of social support and a shrinking network of friends were associated with
loneliness. Lonely respondents were also less likely to be involved in activities that can help build a social network, such as attending religious services, volunteering, participating in a community organization or spending time on a hobby. They tend not to engage with others when they are feeling lonely, for example, by going out with friends or family, and they are more likely than non-lonely people to sleep, eat, watch television, surf the Internet and go out alone when feeling lonely.
The study also looked at the relationship between communication technology use
and loneliness. Although lonely respondents were more likely than non-lonely respondents to feel that the Internet makes it easier to share personal information (17% of lonely respondents felt this way, compared to 10% of non-lonely respondents), a higher percentage of lonely respondents felt that the Internet might also contribute to loneliness. For example, 13% of lonely respondents felt they have fewer deep connections now that they keep in touch with people using the Internet, compared to 6% of non-lonely respondents.
Loneliness was a significant predictor of poor health, as measured by self-report and total
number of diagnosed medical conditions. Drug use was also positively associated with loneliness.
Results of a multivariate model used to predict loneliness pointed to several factors that
increase the risk of being lonely. Significant predictors of loneliness included younger age, poor health, less frequent sexual intercourse, being unmarried, and getting little sleep. Lonely individuals also tended to have an impoverished social network; they had less frequent in-person contact with friends, fewer supportive people in their life and fewer people with whom they could discuss important matters. With respect to friends, lonely respondents tended to meet more friends and acquaintances online than those who were not lonely. This may indicate that lonely people turn to the Internet in search of the companionship and social support that seems to be lacking in their lives.

Loneliness among Older Adults: A National Survey of Adults 45+
ii
Knowledge Networks provided all the respondents with Internet access in order to participate in the online panel; some respondents reported that they did not otherwise have Internet access. Those who did not have regular Internet access were more likely to be lonely than those who did have access.

Loneliness among Older Adults: A National Survey of Adults 45+
1
I. BACKGROUND AND STUDY METHODOLOGY
The purpose of this study was to provide a better understanding of loneliness among adults age 45 and older. In addition to examining prevalence rates across and within groups of older Americans, the study provides a descriptive profile of lonely older adults, and examines the relationships between loneliness and health, health behaviors, involvement in a social network and use of technology for social communications and networking.
Data for this study were collected by Knowledge Networks, using an online research panel that is representative of the entire U.S. population. Knowledge Networks’ panel members are randomly recruited by probability-based sampling, and households are provided with access to the Internet and hardware if needed.
The survey included questions about health and health behaviors, current relationships, size of social network, frequency and methods of communication with people in that network, participation in religious services, hobbies and community organizations, feelings of loneliness and coping strategies, and use of social communication technology.
The survey was fielded between May 26, 2010 and June 2, 2010. Surveys were completed in both English and Spanish, according to panelist language preference. The sample for the study consisted of 4,610 U.S. residents who were age 45 and older. Of those sampled, 3,012 completed the survey, resulting in a 65.3 percent completion rate. The confidence interval width for estimates of loneliness items is approximately plus or minus 2 percent or less (at the 95 percent confidence level).

Loneliness among Older Adults: A National Survey of Adults 45+
2
II. SURVEY FINDINGS A. Descriptive Profile of Lonely Older Americans
The survey included two direct measures of loneliness: the UCLA loneliness scale, which includes 20 items designed to assess subjective feelings of loneliness or social isolation, and a single item measure, which asked, “Overall, how often do you feel lonely or isolated from those around you?” Unless otherwise indicated, the results in this report are based on the UCLA loneliness scale. Respondents who scored 44 or higher on this 80-point scale were defined as “lonely” while those with a score of 43 or less were defined as “not lonely.” a. Incidence, cause and duration of loneliness among older adults
Overall, 35 percent of the survey respondents were lonely. Of those respondents, over four in ten (45 percent) indicated that their loneliness has persisted for 6 years or more, close to one-third (32 percent) reported that they have felt lonely for 1 to 5 years, and 24 percent said they have felt lonely for up to a year.
In response to the question, “Overall, how often do you feel lonely or isolated from those around you?” those who reported ever feeling lonely (i.e., always, sometimes or rarely) were asked if there was a specific cause for their feelings of loneliness and whether, compared to 5 years ago, they felt more lonely, less lonely or about the same. Over two-thirds (69 percent) of the respondents reported that there is no specific cause for their loneliness. With respect to duration, close to half (48 percent) indicated that they felt about the same as they did 5 years ago. The other half of the respondents were almost equally divided between those who felt more lonely than they did 5 years ago (25 percent) and those who felt less lonely than they did 5 years ago (26 percent). b. Demographics of those who are lonely1
Thirty-seven percent of men and 34 percent of women were lonely, as measured by a score of 44 or higher on the UCLA loneliness scale. The average scores on the UCLA Index were 40.4 for males and 39.2 for females.
Loneliness decreased significantly with age. Among the four age categories, (45-49, 50-59, 60-69 and 70+), 25 percent of respondents in the oldest age category (age 70 or older) were lonely, compared to 43 percent of the respondents in the youngest age category (age 45-49). By comparison, 32 percent of respondents in the 60-69 age category and 41 percent of those in the 50-59 age category were lonely.
1 Cross-tabulations of loneliness by social demographic variables are shown in Appendix A.

Loneliness among Older Adults: A National Survey of Adults 45+
3
43% 41%32%
25%
0%10%20%30%40%50%60%70%80%90%
100%
45-49 50-59 60-69 70+
% Lonely
PERCENT OF LONELY OLDER ADULTSBY AGE
AGE
Respondents in the highest income category were less likely to be lonely than respondents with lower incomes. Forty-five percent of respondents in the lowest income category (less than $25,000 per year) reported that they were lonely, compared to 29 percent of respondents in the highest income category ($75,000 per year or more).
45%34% 33% 29%
0%10%20%30%40%50%60%70%80%90%
100%
<$25K $25K-$45K $50K-$74K $75K+
% Lonely
PERCENT OF LONELY OLDER ADULTSBY INCOME
INCOME
Variations in loneliness across education levels were not statistically significant. Thirty-five percent of those with less than a high school education reported being lonely, while 36 percent of those with a Bachelor’s degree or higher reported being lonely.
Comparing respondents across marital status, separated and never-married respondents were most likely to be lonely (49 percent and 51 percent, respectively). Married respondents were least likely to be lonely (29 percent).

Loneliness among Older Adults: A National Survey of Adults 45+
4
29% 31%
45% 49% 51%
33%
0%10%20%30%40%50%60%70%80%90%
100%
Married Widowed Divorced Separated Nevermarried
Living withpartner
% Lonely
PERCENT OF LONELY OLDER ADULTS BY MARITAL STATUS
MARITAL STATUS
Percentages for race/ethnicity indicated some variability in rates of loneliness, but the differences were not statistically significant.2
35% 35%44%
31%
0%10%20%30%40%50%60%70%80%90%
100%
White, non-Hispanic
Black, non-Hispanic
Other, non-Hispanic
Hispanic
% Lonely
PERCENT OF LONELY OLDER ADULTSBY RACE
RACE
c. Life experiences and loneliness3
One question of interest was whether life changes in older adults’ lives are related to
2 Results for the category “2 races, non-Hispanic” are not reported because the number of respondents in this category was too small. 3 Cross-tabulations of loneliness by life experience variables are shown in Appendix A-2.

Loneliness among Older Adults: A National Survey of Adults 45+
5
loneliness. To address this question, respondents were asked about recent experiences of loss, retirement and changes in residency.
Experiences of loss. Respondents were asked whether a spouse, good friend or close relative had died in the last 5 years. They were also asked whether a good friend or close relative had moved away in the last 5 years. Forty-two percent of the respondents who lost a spouse or partner, 34 percent of those who lost a close relative, and 32 percent of those who lost a good friend reported being lonely. Among those who did not experience the loss of a good friend, close relative or spouse/partner in the past 5 years, 38 percent reported being lonely.
32% 34%42% 38%
0%10%20%30%40%50%60%70%80%90%
100%
Death of goodfriend
Death of closerelative
Death ofspouse/Partner
No loss
% Lonely
PERCENT OF LONELY ADULTS BY DEATH OFFRIEND, RELATIVE, OR SPOUSE/PARTNER
There were no significant differences in rates of loneliness across respondents who experienced a close relative move away in the past 5 years (35 percent), a good friend move away (34 percent), or who had neither a good friend nor a close relative move away (36 percent).
Retirement. Retired respondents were less likely to be lonely than respondents who were not retired (30 percent versus 37 percent). Among those who were retired, no clear pattern emerged between length of retirement and loneliness. Loneliness was, however, less likely among respondents who maintained contact with former co-workers following retirement. Only 16 percent of those who reported regular contact with former co-workers reported feeling lonely, compared to 42 percent of those who did not maintain contact with former co-workers following their retirement.4
Relocation versus stability at the same residence. Respondents who had recently relocated were more likely to report feeling lonely than those who had been in their current residence for more than 20 years. Almost half (45 percent) of those who had lived in their
4 Cross-tabulations for loneliness by contact with former co-workers are shown in Appendix A-3.

Loneliness among Older Adults: A National Survey of Adults 45+
6
current residence for less than 1 year reported feeling lonely. By comparison, 31 percent of those respondents who had lived at their current residence for more than 20 years were lonely.
45% 42%35% 35% 31%
0%10%20%30%40%50%60%70%80%90%
100%
Less than 1year
Between 1-5 years
Between 5-10 years
Between10-20 years
More than20 years
% Lonely
PERCENT OF LONELY OLDER ADULTSBY LENGTH OF TIME AT CURRENT RESIDENCE
LENGTH OF TIME AT RESIDENCE
d. Social network and loneliness5
One purpose of this study was to provide some understanding of how loneliness among older adults might be related to aspects of their social network and their level of engagement with different people and activities. Questions about length of marriage or divorce, perceived availability of social support, engagement in religious services, volunteer work, community organizations and hobbies, and frequency of contact with friends and family provided several measures of how connected respondents were with one or more networks. This section summarizes how these measures relate to loneliness among the survey respondents.
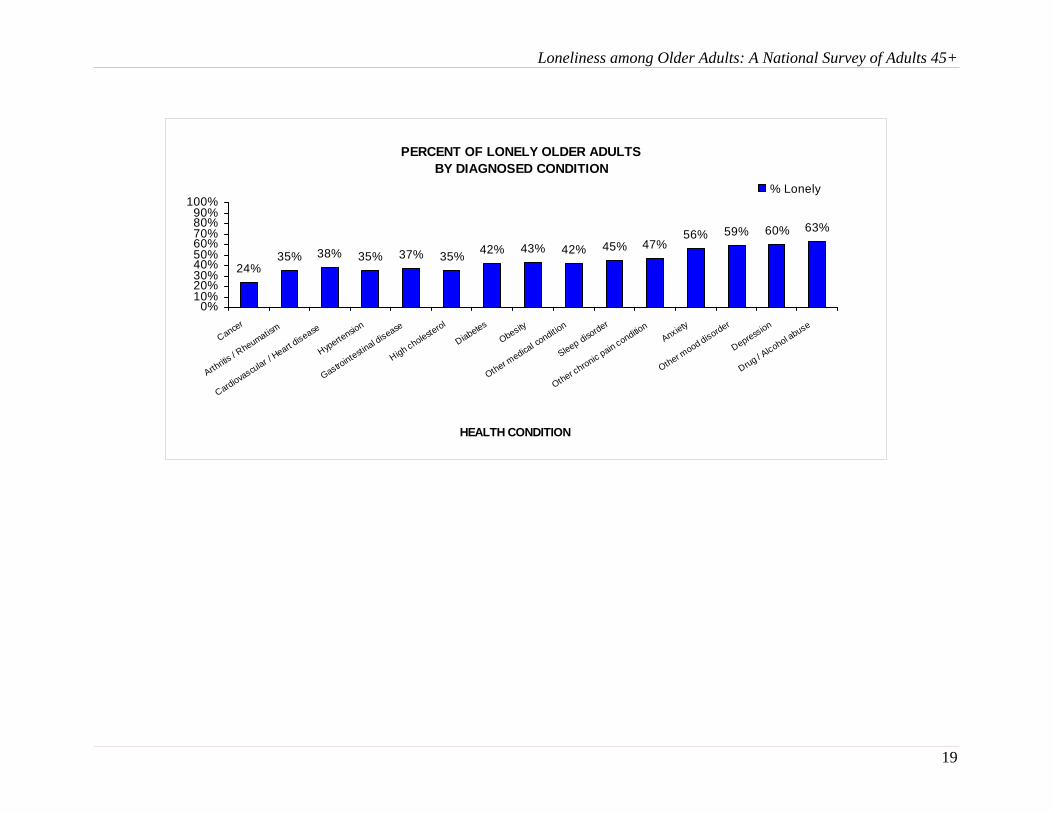
Length of marriage. Among the currently married, there was no clear relationship between length of marriage and loneliness. Twenty-eight percent of respondents who were married to their current spouse for less than 1 year reported feeling lonely. An identical percentage (28 percent) of respondents who had been married to their current spouse for more than 20 years reported feeling lonely.
5 Cross-tabulations for loneliness by social network variables are shown in Appendix A-3.

Loneliness among Older Adults: A National Survey of Adults 45+
7
28%35% 30% 28%
0%10%20%30%40%50%60%70%80%90%
100%
Married lessthan 1 year
Married 1-9years
Married 10-19years
Married 20+years
% Lonely
PERCENT OF LONELY OLDER ADULTS BY LENGTH OF CURRENT MARRIAGE/RELATIONSHIP
LENGTH OF RELATIONSHIP
Duration of time since divorce. Almost half (49 percent) of the respondents who had been divorced 1 to 9 years or 10 to 19 years were lonely, compared to 40 percent of respondents who were divorced for 20 years or more.
49% 49%40%
0%10%20%30%40%50%60%70%80%90%
100%
Divorced 1-9 years Divorced 10-19years
Divorced 20+ years
% Lonely
PERCENT OF OLDER LONELY ADULTSBY LENGTH OF DIVORCE
LENGTH OF DIVORCE
There were too few recently widowed respondents to report the percent who were lonely, but the loneliness rates among those who were widowed for 1-9 years, 10-19 years, and 20 years or more were all close to one third (29 percent, 34 percent and 31 percent, respectively).
Social support. To assess perceived social support, respondents were asked, “How many people in your life have been very supportive of you in the past year?” More than three-quarters (76 percent) of those who reported having no supportive people in their life felt lonely, compared to approximately one-third (34 percent) of those who had one or more supportive people in their
Loneliness among Older Adults: A National Survey of Adults 45+
8
life. Respondents were also asked, “How many people do you have in your life with whom you most often discuss matters of personal importance?” Almost two-thirds (63 percent) of those who answered “none” and close to one-half (48 percent) of those who had one or two such people in their life were lonely. By comparison, respondents who had three or more such people in their life were less likely to be lonely. Specifically, 32 percent of respondents who had 3 or 4 people with whom they discussed matters of personal importance were lonely and just 21 percent of those who had 5 or more such people in their life were lonely.
A shrinking network of friends was associated with loneliness. More than half (56 percent) of the respondents who reported having fewer friends than they had 5 years ago felt lonely, compared to 19 percent of those who reported having more friends than they had 5 years ago and 33 percent of those who had about the same number of friends as they had 5 years ago.
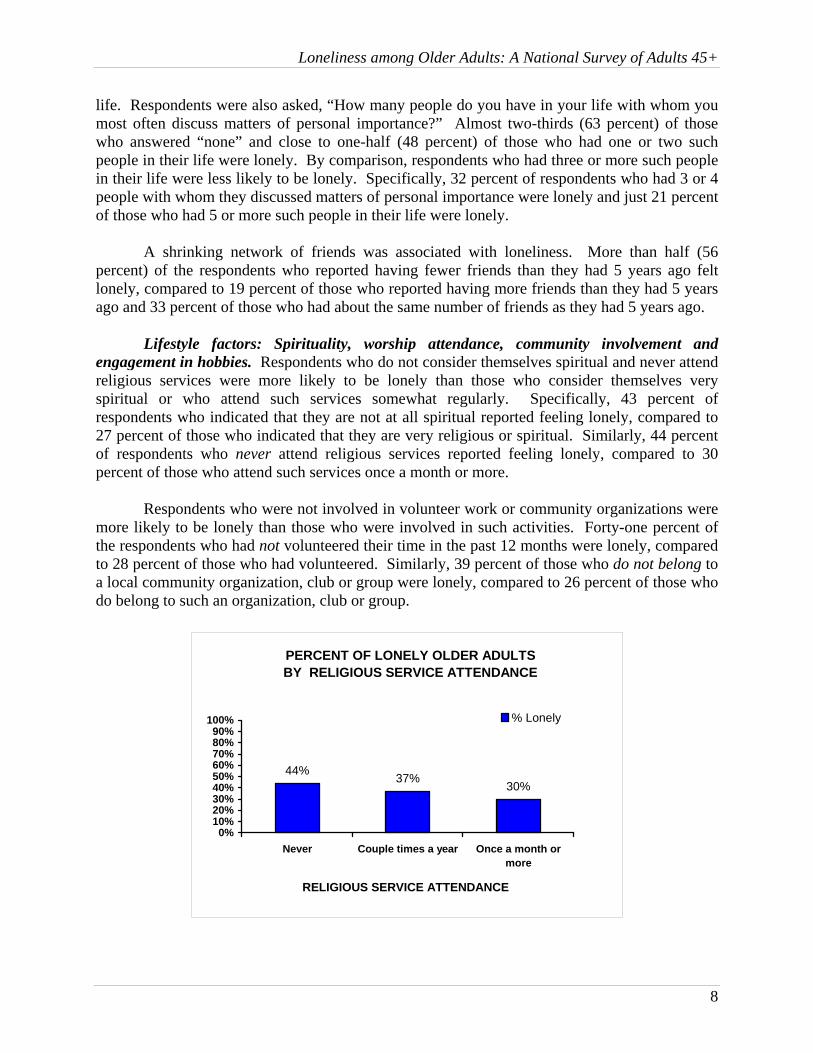
Lifestyle factors: Spirituality, worship attendance, community involvement and engagement in hobbies. Respondents who do not consider themselves spiritual and never attend religious services were more likely to be lonely than those who consider themselves very spiritual or who attend such services somewhat regularly. Specifically, 43 percent of respondents who indicated that they are not at all spiritual reported feeling lonely, compared to 27 percent of those who indicated that they are very religious or spiritual. Similarly, 44 percent of respondents who never attend religious services reported feeling lonely, compared to 30 percent of those who attend such services once a month or more.
Respondents who were not involved in volunteer work or community organizations were
more likely to be lonely than those who were involved in such activities. Forty-one percent of the respondents who had not volunteered their time in the past 12 months were lonely, compared to 28 percent of those who had volunteered. Similarly, 39 percent of those who do not belong to a local community organization, club or group were lonely, compared to 26 percent of those who do belong to such an organization, club or group.
44%37%
30%
0%10%20%30%40%50%60%70%80%90%
100%
Never Couple times a year Once a month ormore
% Lonely
PERCENT OF LONELY OLDER ADULTSBY RELIGIOUS SERVICE ATTENDANCE
RELIGIOUS SERVICE ATTENDANCE

Loneliness among Older Adults: A National Survey of Adults 45+
9
28%41%
26%39%
0%10%20%30%40%50%60%70%80%90%
100%
Yes No Yes No
% Lonely
PERCENT OF LONELY OLDER ADULTSBY VOLUNTEERING AND PARTICIPATION IN
COMMUNITY ORGANIZATIONS
DO VOLUNTEER WORK
PARTICIPATE IN COMMMUNITY ORGANIZATIONS
Lonely respondents were also less likely to spend time on hobbies; 51 percent of those who reported spending no time on a hobby reported feeling lonely, compared to 35 percent of those who spend between 1 and 10 hours per week on a hobby and 30 percent of those who spend more than 11 hours per week on a hobby.
51%
35% 30%
0%10%20%30%40%50%60%70%80%90%
100%
None 1-10 hours 11+ hours
% Lonely
PERCENT OF LONELY OLDER ADULTSBY TIME SPENT ON HOBBIES
TIME SPENT ON HOBBIES
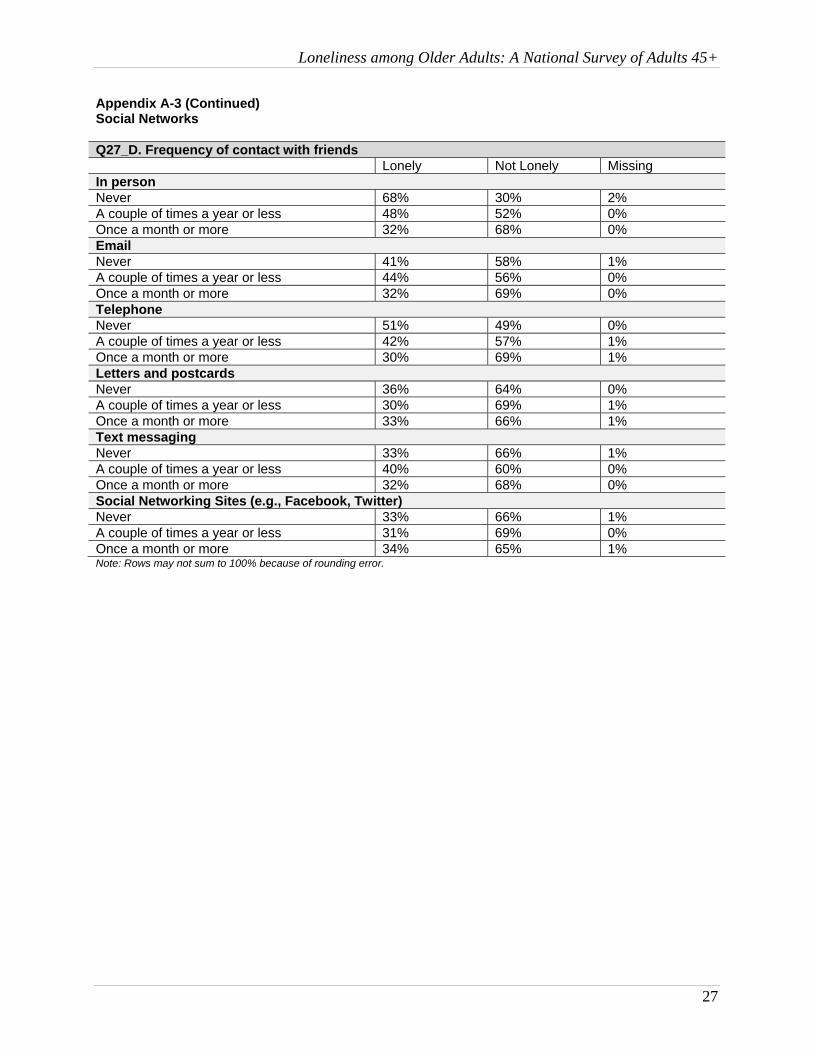
Frequency of contact with friends.6 Respondents were asked about frequency of contact with friends via email, phone, letters, text messaging, social networking sites and in person. Respondents who never talked to friends by phone or never saw friends in person were more likely to be lonely than those who had regular phone or in-person contact with friends. Almost 6 Results for frequency of contact with parents, siblings and children are also shown in Appendix A-3.

Loneliness among Older Adults: A National Survey of Adults 45+
10
two-thirds of the respondents (63 percent) who never talk with friends by phone reported feeling lonely, compared to 48 percent of those who talk with a friend by phone somewhat regularly (at least once a month).7 More than two-thirds (68 percent) of respondents who never communicate with friends in person reported feeling lonely, compared to 32 percent of those who see a friend somewhat regularly.8
Respondents who reported infrequent email contact with friends and those who reported never using email to communicate with friends were more likely to be lonely than those who reported regular email contact with friends. Specifically, 44 percent of those who communicated with friends via email a couple of times a year or less, and 41 percent of those who never use email to communicate with friends were lonely, compared to 32 percent of respondents who communicated with friends via email at least once a month.9 Respondents who infrequently communicated with friends via text messaging (i.e., a couple of times a year or less) were more likely to be lonely than those who used text messaging at least once a month (47% versus 34%).10
68%
32%
63%
31%41%
32%
0%10%20%30%40%50%60%70%80%90%
100%
Never At least oncea month
Never At least oncea month
Never At least oncea month
Never At least once a month
PERCENT OF LONELY OLDER ADULTS BY FREQUENCY OF CONTACT WITH FRIENDS
TYPE OF CONTACT
% L
ON
EL
Y
In person Telephone Email
Respondents who never communicated with friends via letters and postcards were more likely to report feeling lonely (39 percent) than those who communicated via letters or postcards a couple of times a year or less (32 percent).11
7 These differences are statistically significant at the .05.level. 8 These differences are statistically significant at the .05 level. 9 The difference between those who never communicate with friends via email and those who infrequently communicate with friends via email was not statistically significant. 10 This difference is statistically significant at the .05 level.

Loneliness among Older Adults: A National Survey of Adults 45+
11
Rates of loneliness varied somewhat by frequency of contact via social networking sites
like Facebook and Twitter, but the differences were not statistically significant. Thirty-six percent of respondents who never communicated with friends through social networking sites reported feeling lonely, as did 40 percent of those who were infrequent users (i.e., those who used these sites a couple of times a year or less) and 33 percent of those who were regular users (i.e., those who used it once a month or more).
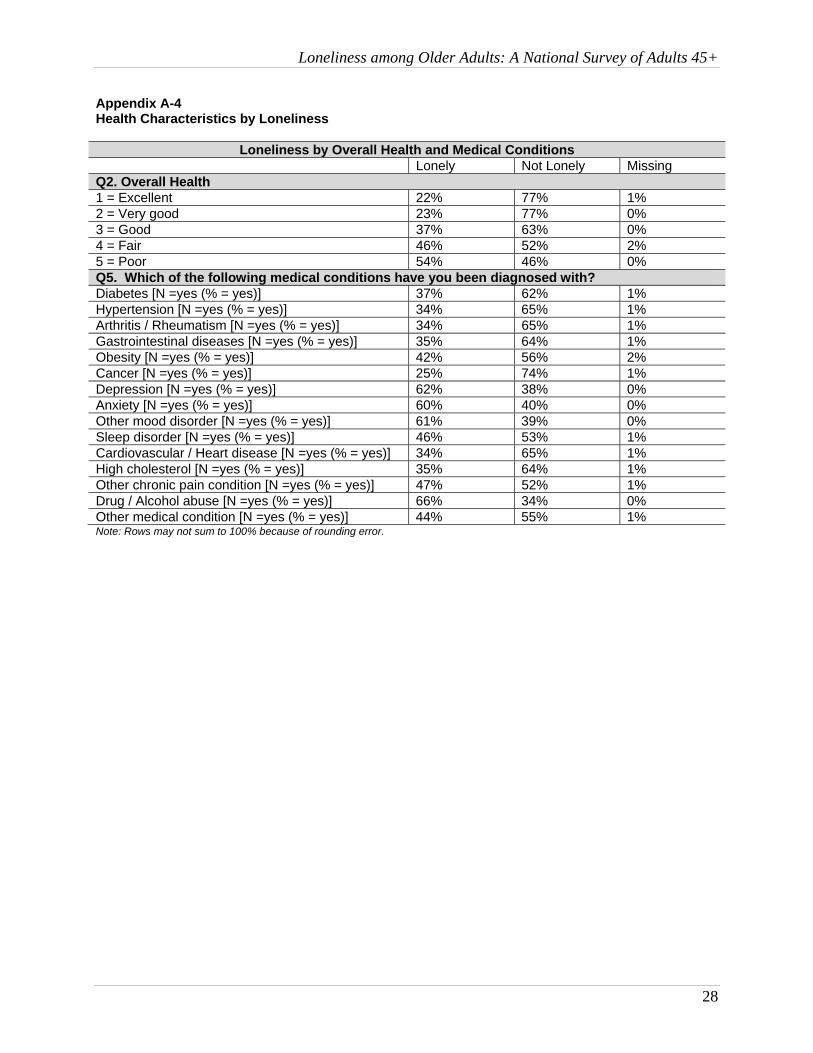
B. Loneliness and Health12
To explore the relationship between loneliness and health, respondents were asked about their overall health, as well as whether they had been diagnosed with a number of medical conditions (see Table 1).
Respondents were asked to rate their overall health using the following categories: excellent, very good, good, fair or poor. Over half (55 percent) of the respondents who reported being in poor health were lonely, compared to one-quarter (25 percent) of respondents who reported being in excellent health and 24 percent of those who reported being in very good health.
25% 24%
38%
51% 55%
0%
10%
20%
30%
40%
50%
60%
70%
80%
90%
100%
Excellent Very good Good Fair Poor
% Lonely
PERCENT OF LONELY OLDER ADULTSBY OVERALL HEALTH
OVERALL HEALTH
a. Medical conditions
Across all medical conditions, respondents who had been diagnosed with cancer had the lowest rate of loneliness; only 24 percent reported feeling lonely. The percentage of individuals
11 This difference is statistically significant at the .05 level. However, levels of loneliness between infrequent and frequent were not significantly different. 12 Cross-tabulations for health and loneliness and health behaviors and loneliness are shown in Appendix A-4.

Loneliness among Older Adults: A National Survey of Adults 45+
12
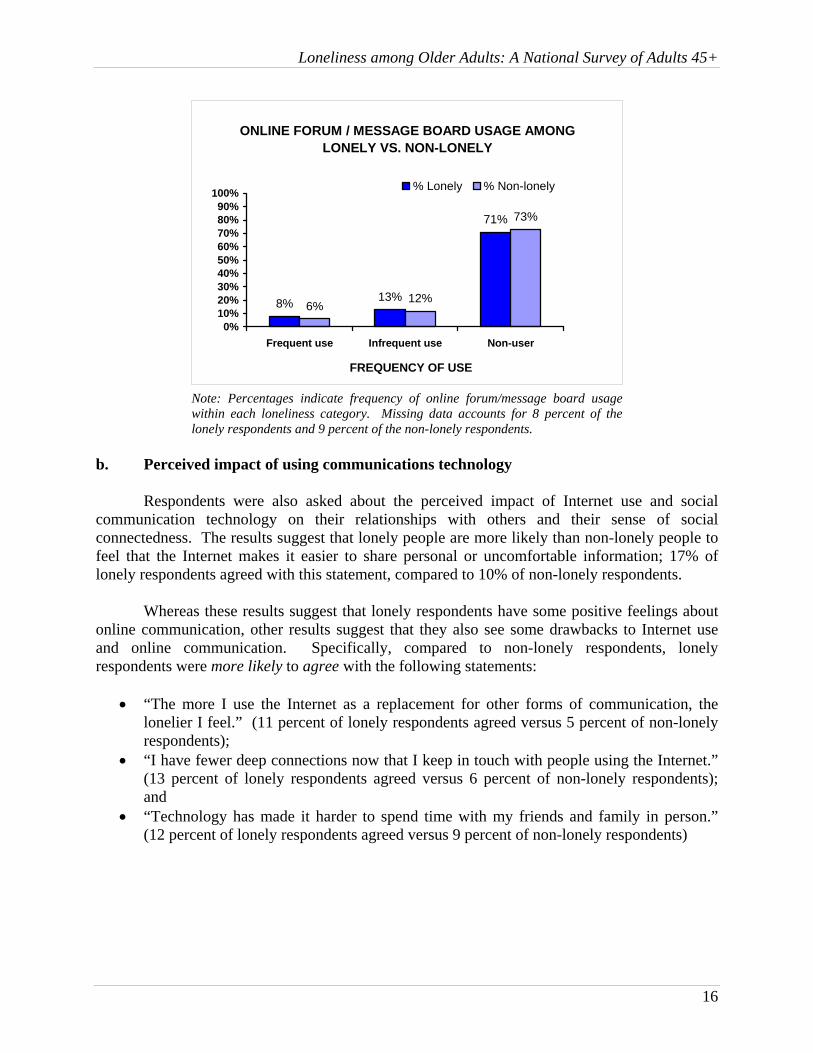
diagnosed with either hypertension, arthritis, gastrointestinal diseases, cardiovascular/heart disease or high cholesterol who reported feeling lonely was slightly more than one-third, which is comparable to the prevalence of loneliness for the overall sample. Forty-two percent of respondents with diabetes reported feeling lonely. Not including those diagnosed with a mood disorder or drug/alcohol abuse, the respondents with the highest rates of loneliness were those who had a chronic pain condition (47 percent) or were obese (43 percent). Table 1 below shows the distribution of lonely and not-lonely respondents who had been diagnosed with each of 15 medical conditions.13 The bar chart on page 19 also shows the loneliness rates by medical condition.
Table 1. Medical Condition by Loneliness
Diagnosed with: Lonely Not Lonely Cancer 24% 76% Arthritis / Rheumatism 35% 65% Cardiovascular / Heart disease 38% 62% Hypertension 35% 65% Gastrointestinal diseases 37% 63% High cholesterol 35% 65% Diabetes 42% 58% Obesity 43% 57% Other medical condition 42% 57% Sleep disorder 45% 54% Other chronic pain condition 47% 53% Anxiety 56% 44% Other mood disorder 59% 41% Depression 60% 40% Drug / Alcohol abuse 63% 37%
Note: Rows may not sum to 100 percent due to rounding error.
b. Mental health
Over one-half of the respondents diagnosed with anxiety, depression or another mood disorder reported feeling lonely (56 percent, 60 percent and 59 percent, respectively). Close to two-thirds of those who had been diagnosed with drug/alcohol abuse (63 percent) were lonely. c. Health behaviors
Loneliness was positively associated with smoking and drug use but negatively associated with drinking.
Forty-five percent of respondents who had been diagnosed with a sleep disorder were lonely, and respondents who got little sleep (3-5 hours a night) were more likely to be lonely than those who got more sleep. Over half (51 percent) of the respondents who slept an average
13 No tests were performed to determine whether differences in loneliness across various medical conditions were statistically significant.
Loneliness among Older Adults: A National Survey of Adults 45+
13
of 3-5 hours a night reported feeling lonely, compared to 33 percent of those who got between 6 and 7 hours of sleep a night and 32 percent of those who got 8 to 10 hours of sleep a night.14
Across different frequencies of sexual activity, those who reported having sex once a week were less likely to be lonely than respondents who had sex once a month or less often. Twenty-four percent of respondents who reported having weekly sex were lonely, compared to 36 percent of those who had sex once a month, 42 percent of those who had sex a few times a year and 37 percent of those who never had sex.
d. Effect of loneliness on health15
A multivariate regression was used to test whether loneliness was a significant predictor of health. The outcome variable was the total number of diagnosed medical conditions reported by the respondent. Loneliness emerged as a strong predictor of poor health (as measured by number of medical conditions), even after controlling for other variables that are closely related to health, such as age. C. Loneliness and Use of Technology16 a. Use of communications technology
Ninety-three percent of all respondents indicated that they use the Internet or email.17 Compared to Internet users, a slightly lower higher percentage of non-users were lonely, but the difference was not statistically significant (36% Internet users versus 34% non-users).
Respondents were asked how frequently their spouse or partner uses the Internet and how frequently their children use the Internet. Respondents whose spouses never use the Internet were more likely to be lonely than respondents whose spouses use the Internet on a daily basis (35% versus 27%). The difference in rates of loneliness between respondents whose spouses use the Internet on a weekly basis (30 percent) or monthly basis (33 percent) was not statistically significant.
Among respondents who reported their children’s frequency of Internet use, close to half
of those whose children used the Internet on a monthly basis were lonely (48%). By comparison, only 31% of those whose children used the Internet on a daily basis reported feeling lonely.
14 Too few respondents reported getting less than 3 or more than 10 hours of sleep a night to report percentages for these categories. 15 Results of this model are shown in Appendix A-5. 16 Cross-tabulations for loneliness and use of technology are shown in Appendix A-6. 17 It should be noted, however, that all respondents were part of the Knowledge Networks panel, and as panelists, they are provided with household Internet access if they do not already have it, so that they can participate in the panel web surveys. The reported percentage of Internet users, therefore, may not be representative of the population of older adults.

Loneliness among Older Adults: A National Survey of Adults 45+
14
Those whose children never used the Internet were no more likely to feel lonely than those whose children used the Internet on a monthly basis.
Respondents were also asked how frequently they use email, instant messaging, social
networking sites like Facebook, Twitter and MySpace, and how often they participate in online forums or message boards. There were five response categories: 1) at least daily, 2) at least weekly, 3) at least monthly, 4) less than monthly, or 5) never. For purposes of analysis, the five categories were collapsed into three: frequent users (at least daily and at least weekly), infrequent users (at least monthly and less than monthly) and non-users (never).
Lonely and non-lonely people did not differ significantly from each other in terms of their frequency of email use.
Both lonely and non-lonely respondents tended not to use online forums or message
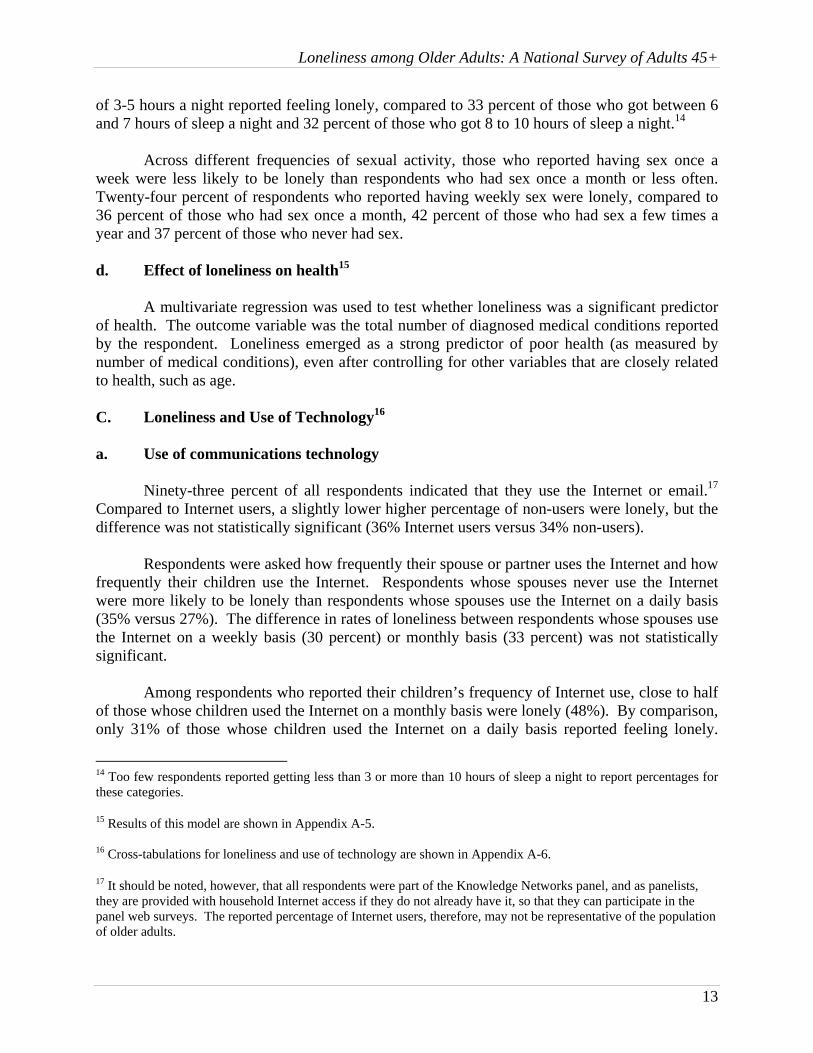
boards, instant messaging and social networking sites like Facebook, Twitter or MySpace. Seventy-one percent of lonely respondents and 73% of non-lonely respondents indicated they never participate in online forums or message boards. Fifty-seven percent of both lonely and non-lonely respondents indicated they never use social networking sites and 63% of both groups never use instant messaging.
73%
14%5%
76%
10% 6%
0%10%20%30%40%50%60%70%80%90%
100%
Frequent email use Infrequent emailuse
Non-user
% Lonely % Non-lonely
EMAIL USAGE AMONG LONELY VS. NON-LONELY
FREQUENCY OF USE
Note: Percentages indicate frequency of email usage within each loneliness category (i.e., lonely or not lonely). Missing data accounts for 8 percent of the lonely respondents and 9 percent of the non-lonely respondents.

Loneliness among Older Adults: A National Survey of Adults 45+
15
16% 13%
63%
14% 14%
63%
0%10%20%30%40%50%60%70%80%90%
100%
Frequent IM use Infrequent IM use Non-user
% Lonely % Non-lonely
INSTANT MESSAGING USAGE AMONG LONELY VS. NON-LONELY
FREQUENCY OF USE
Note: Percentages indicate frequency of instant messaging usage within each loneliness category. Missing data accounts for 9 percent of both the lonely respondents and the non-lonely respondents.
22%13%
57%
23%12%
57%
0%10%20%30%40%50%60%70%80%90%
100%
Frequent use Infrequent use Non-user
% Lonely % Non-lonely
SOCIAL NETWORKING USAGE AMONGLONELY VS. NONLONELY
FREQUENCY OF USE
Note: Percentages indicate frequency of social networking usage within each loneliness category. Missing data accounts for 8 percent of the lonely respondents and 9 percent of the non-lonely respondents.
Loneliness among Older Adults: A National Survey of Adults 45+
16
8%13%
71%
6%12%
73%
0%10%20%30%40%50%60%70%80%90%
100%
Frequent use Infrequent use Non-user
% Lonely % Non-lonely
ONLINE FORUM / MESSAGE BOARD USAGE AMONGLONELY VS. NON-LONELY
FREQUENCY OF USE
Note: Percentages indicate frequency of online forum/message board usage within each loneliness category. Missing data accounts for 8 percent of the lonely respondents and 9 percent of the non-lonely respondents.
b. Perceived impact of using communications technology
Respondents were also asked about the perceived impact of Internet use and social
communication technology on their relationships with others and their sense of social connectedness. The results suggest that lonely people are more likely than non-lonely people to feel that the Internet makes it easier to share personal or uncomfortable information; 17% of lonely respondents agreed with this statement, compared to 10% of non-lonely respondents.
Whereas these results suggest that lonely respondents have some positive feelings about
online communication, other results suggest that they also see some drawbacks to Internet use and online communication. Specifically, compared to non-lonely respondents, lonely respondents were more likely to agree with the following statements:
“The more I use the Internet as a replacement for other forms of communication, the
lonelier I feel.” (11 percent of lonely respondents agreed versus 5 percent of non-lonely respondents);
“I have fewer deep connections now that I keep in touch with people using the Internet.” (13 percent of lonely respondents agreed versus 6 percent of non-lonely respondents); and
“Technology has made it harder to spend time with my friends and family in person.” (12 percent of lonely respondents agreed versus 9 percent of non-lonely respondents)

Loneliness among Older Adults: A National Survey of Adults 45+
17
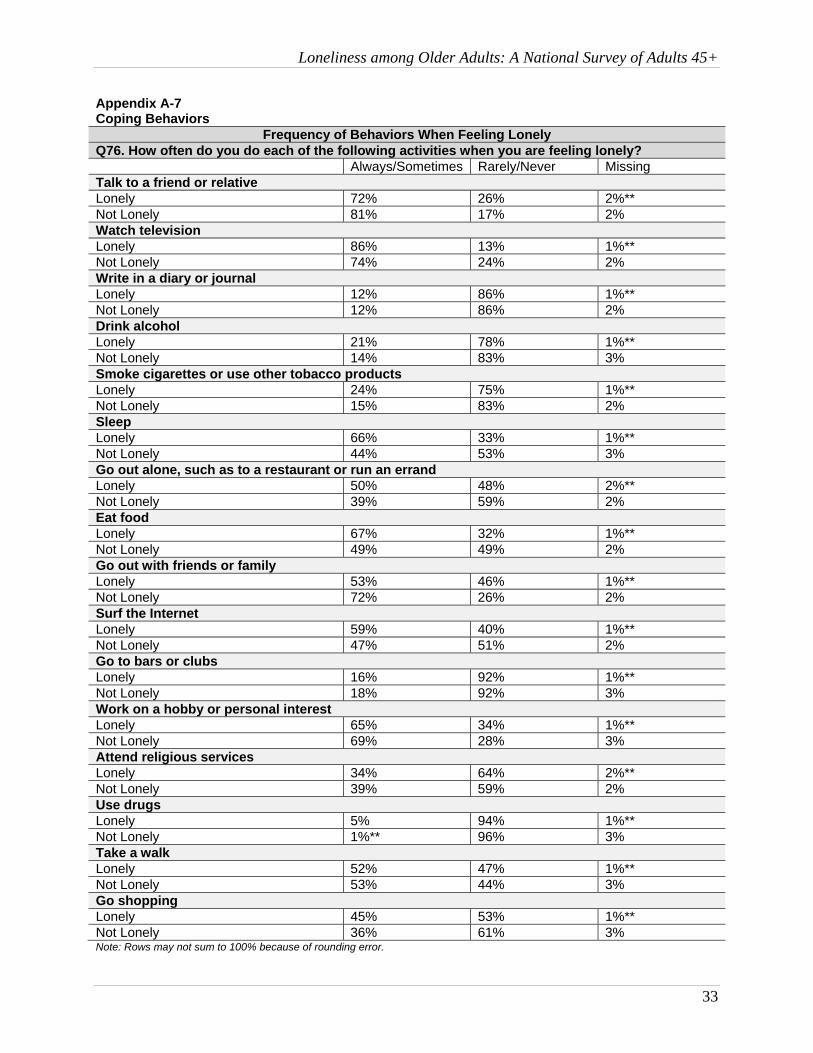
D. Strategies for Coping With Loneliness18 To better understand what older adults tend to do when feeling lonely, respondents were
asked how often (always, sometimes, rarely or never) they engage in various activities, such as talking to a friend or relative, attending religious services, watching television, drinking alcohol or using drugs. For purposes of analysis, responses were collapsed into two categories, with “always” and “sometimes” comprising one category and “rarely” and “never” comprising the other category.
Respondents who indicated that they always, sometimes or rarely felt lonely were asked
how often they engage in a variety of behaviors to cope with feelings of loneliness or isolation. Lonely respondents (here defined as those who indicated that they sometimes or always felt lonely) were more likely than rarely lonely respondents to sleep, eat food, watch television, surf the Internet and go out alone when feeling lonely. They were also more likely to report that they smoke or use tobacco, go shopping, or drink when feeling lonely.
Lonely respondents were less likely than respondents who were rarely lonely to report
that they go out with friends or family or talk to a friend or relative when feeling lonely. They were also less likely to report that they attend religious services or work on a hobby when feeling lonely.
The majority of both lonely and non-lonely people reported never using drugs when
feeling lonely (94% and 96%, respectively).
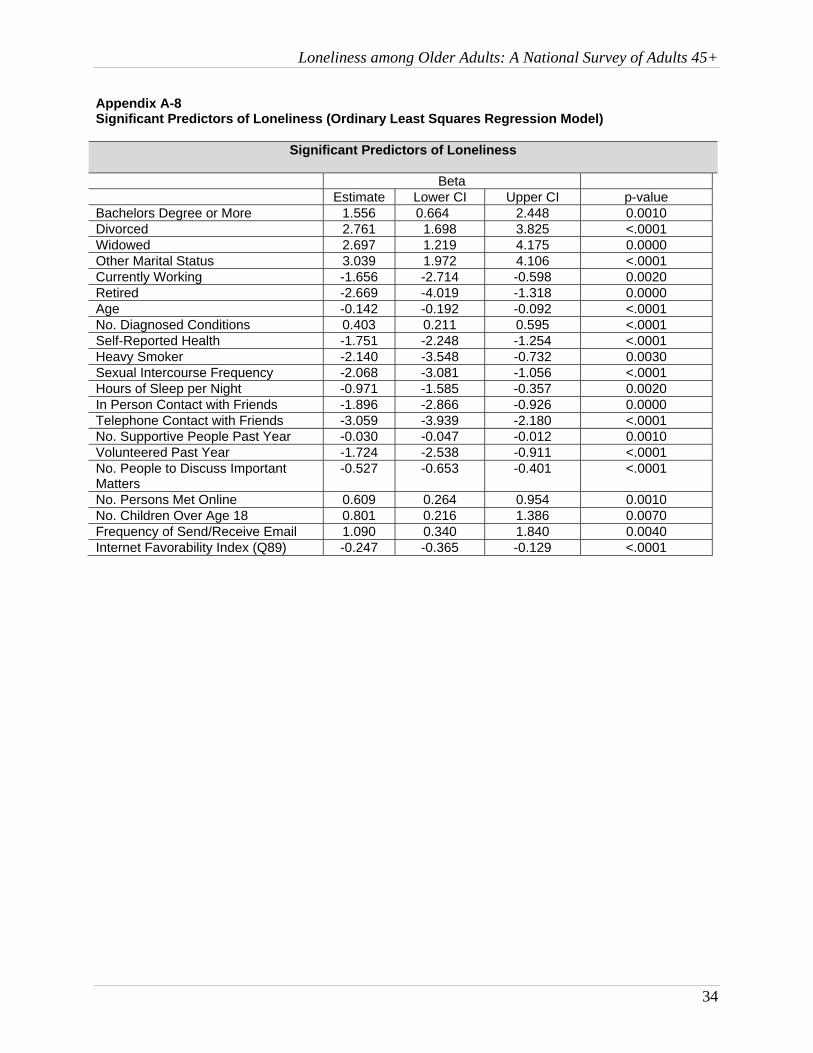
E. Predictors of Loneliness A series of multivariate regression models were created to identify the variables that
characterize lonely older adults.19 Three groups of variables were included in the model. The first group of variables included several socio-demographic measures. The second set of variables included measures of health and health behaviors. The third set of variables included measures related to social support and a social network.
Lonely respondents tended to be younger. They also tended to be in poor health, as
indicated both by a self-report measure and a sum total of diagnosed medical conditions. Less-frequent sexual intercourse and less sleep also increased the likelihood of being lonely. Heavy smokers, however, tended to be less lonely. Lonely individuals also tended to have an impoverished social network; they had less frequent contact with friends via telephone and in person. Lonely respondents also reported fewer supportive people in their life, fewer people with whom they could discuss important matters, and fewer volunteering experiences than non-lonely respondents. Loneliness was also associated with having children over the age of 18, and meeting friends online. Respondents who held a generally favorable view of the Internet were less likely to be lonely.
18 Cross-tabulations for loneliness and strategies for coping with loneliness are shown in Appendix A-7. 19 Results of these models are shown in Appendix A-8.

Loneliness among Older Adults: A National Survey of Adults 45+
18
Although Knowledge Networks provided all the respondents with Internet access in order
to participate in the online panel, some respondents reported that they did not otherwise have Internet access. Those who did not have regular Internet access were more likely to be lonely than those who did have access.
Loneliness among Older Adults: A National Survey of Adults 45+
19
24%35% 38% 35% 37% 35%
42% 43% 42% 45% 47%56% 59% 60% 63%
0%10%20%30%40%50%60%70%80%90%
100%
Cancer
Arthritis
/ Rheumatism
Cardiovascular / Heart d
isease
Hypertensio
n
Gastrointestin
al disease
High cholesterol
Diabetes
Obesity
Other medica
l conditio
n
Sleep disorder
Other chronic p
ain condition
Anxiety
Other mood disorder
Depression
Drug / Alcohol abuse
% Lonely
PERCENT OF LONELY OLDER ADULTS BY DIAGNOSED CONDITION
HEALTH CONDITION

Loneliness among Older Adults: A National Survey of Adults 45+
20
APPENDICES --Percentages within a variable should be compared by row rather than by column (e.g., 34% of females are lonely versus 37% of males). --Rows may not sum to 100% because of rounding error. Appendix A-1 Social Demographics
Loneliness by Socio-Demographic Characteristics
Lonely Not Lonely Missing Gender Male 37% 62% 1% Female 34% 66% 0% Age 45-49 43% 56% 1% 50-59 41% 59% 1% 60-69 32% 68% 0% 70+ 25% 75% 0% Income <25K 45% 55% 0% 25-49 34% 65% 1% 50-74 33% 67% 0% 75+ 29% 71% 0% Education Less than high school 35% 63% 2% High School 35% 65% 0% Some college/AA 36% 64% 0% College graduate or higher 36% 64% 0% Marital Status Married 29% 70% 1% Widowed 31% 69% 0% Divorced 45% 54% 0% Separated 49% 49% 3% Never married 51% 49% 0% Living with partner 33% 66% 1% Race White, non-Hispanic 35% 65% 0% Black, non-Hispanic 35% 63% 2% Other, non-Hispanic 44% 55% 1% Hispanic 31% 67% 2% 2+ races, non-Hispanic 41% 58% 1%

Loneliness among Older Adults: A National Survey of Adults 45+
21
Appendix A-2 Recent Life Experiences
Loneliness by Life Experiences
Lonely Not Lonely Missing Q34. Have any good friends, close relatives or a spouse or partner passed away in the past 5 years? 1 = Yes, a good friend 32% 68% 0% 2 = Yes, a close relative 34% 66% 0% 3 = Yes, a spouse or partner 42% 58% 0% 4 = No 38% 62% 0% 5 = Refused 16% 64% 21% Q35. Have any good friends or close relatives moved away from you in the past 5 years? 1 = Yes, a good friend 34% 65% 1% 2 = Yes, a close relative 35% 65% 0% 4 = No 36% 63% 0% 5 = Refused 24% 57% 18% Q 54. Are you retired from a previous career? 1 = Yes 30% 69% 1% 2 = No 37% 62% 0% Q61. How long have you been retired from your previous career? 1 = Less than 1 year 31% 69% 0% 2 = Between 1 and 5 years 20% 80% 0% 3 = Between 5 and 10 years 27% 72% 1% 4 = More than 10 years 25% 75% 0% Q64. How long have you lived at your current residence? 1 = Less than 1 year 45% 54% 1% 2 = Between 1 and 5 years 42% 58% 0% 3 = Between 5 and 10 years 35% 65% 0% 4 = Between 10 and 20 years 35% 65% 1% 5 = More than 20 years 31% 69% 0% Note: Rows may not sum to 100% because of rounding error.
Loneliness among Older Adults: A National Survey of Adults 45+
22
Appendix A-3 Social Networks
Loneliness by Duration of Marital Status
Lonely Not Lonely Missing Q21. How long have you been married or in a relationship with your current partner? Less than 1 year 28% 64% 7% 1-9 years 35% 65% 0% 10-19 years 30% 68% 2% 20+ years 28% 72% 0% Q23. How long have you been divorced? Less than 1 year 100% 0% 0% 1-9 years 49% 51% 0% 10-19 years 49% 51% 0% 20+ years 40% 60% 1% Q24. How long have you been widowed? Less than 1 year 0% 100% 0% 1-9 years 29% 71% 0% 10-19 years 34% 66% 0% 20+ years 31% 69% 0% Note: Rows may not sum to 100% because of rounding error.

Loneliness among Older Adults: A National Survey of Adults 45+
23
Appendix A-3 (Continued) Social Networks
Loneliness by Engagement in Social Networks and Hobbies Lonely Not Lonely Missing Q28. How many people do you have in your life with whom you most often discuss matters of personal importance? None 63% 37% 0% 1 or 2 48% 51% 1% 3 or 4 32% 68% 0% 5 or more 21% 79% 0% Q30. How many people do you have in your life who have been very supportive of you during the past year? None 76% 22% 2% One or more 34% 66% 0% Q38. Would you say that you have more friends, fewer friends or about the same number of friends as you did 5 years ago? More 19% 81% 0% Fewer 56% 44% 0% About the same 33% 67% 0% Q45. Would you describe yourself as very religious or spiritual, somewhat religious or spiritual, or not religious or spiritual at all? Very religious/spiritual 27% 73% 0% Somewhat religious/spiritual 38% 61% 1% Not at all religious/spiritual 43% 56% 1% Q46. How often do you attend religious services or other events at a place of worship? Never 44% 56% 0% A couple of times a year or less 37% 63% 0% Once a month or more 30% 70% 0% Q48. In the past 12 months, have you volunteered, that is, given your time or skills, for a non-profit organization, a charity, school, hospital, religious organization, neighborhood association, civic or any other group? Yes 28% 72% 0% No 41% 58% 1% Q50. Do you belong to any local community organizations, clubs, or groups such as Kiwanis, book clubs, gardening groups or other social groups? Yes (1 or more) 26% 74% 1% No 39% 61% 0% Q53. How many hours per week do you spend on hobbies? This could include activities such as sports, gardening… None 51% 47% 1% 1-10 35% 65% 0% 11+ 30% 70% 0% Q63. Have you stayed in contact with any of your former co-workers after your retirement? Yes, regularly 16% 84% 0% Yes, occasionally 19% 80% 1% Yes, once in a while 22% 78% 0% No 42% 57% 1% Note: Rows may not sum to 100% because of rounding error.

Loneliness among Older Adults: A National Survey of Adults 45+
24
Appendix A-3 (Continued) Social Networks Q27_A. Frequency of contact with parents Lonely Not Lonely Missing In person Never 48%* 48%* 4% A couple of times a year or less 41% 59% 0% Once a month or more 38% 61% 1% Email Never 38% 61% 1% A couple of times a year or less 48% 52% 0% Once a month or more 41% 59% 1% Telephone Never 40%* 60% 0% A couple of times a year or less 64% 36% 0% Once a month or more 37% 62% 1% Letters and postcards Never 41% 59% 1% A couple of times a year or less 38% 62% 0% Once a month or more 41%* 57% 3% Text messaging Never 40% 60% 0% A couple of times a year or less 45%* 55%* 0% Once a month or more 44% 53% 3% Social Networking Sites (e.g., Facebook, Twitter) Never 39% 61% 0% A couple of times a year or less 54%* 46%* 0% Once a month or more 44% 53% 3% Note: Rows may not sum to 100% because of rounding error.

Loneliness among Older Adults: A National Survey of Adults 45+
25
Appendix A-3 (Continued) Social Networks Q27_B. Frequency of contact with children Lonely Not Lonely Missing In person Never 55% 45%* 0% A couple of times a year or less 32% 68% 0% Once a month or more 33% 67% 0% Email Never 39% 61% 0% A couple of times a year or less 31% 69% 0% Once a month or more 31% 69% 0% Telephone Never 41% 59% 0% A couple of times a year or less 52% 48% 0% Once a month or more 32% 68% 0% Letters and postcards Never 38% 62% 0% A couple of times a year or less 28% 72% 0% Once a month or more 32% 67% 1% Text messaging Never 32% 68% 0% A couple of times a year or less 38% 62% 0% Once a month or more 36% 63% 1% Social Networking Sites (e.g., Facebook, Twitter) Never 34% 66% 0% A couple of times a year or less 39% 61% 0% Once a month or more 31% 69% 1% Note: Rows may not sum to 100% because of rounding error.

Loneliness among Older Adults: A National Survey of Adults 45+
26
Appendix A-3 (Continued) Social Networks Q27_C. Frequency of contact with siblings Lonely Not Lonely Missing In person Never 45% 54% 1% A couple of times a year or less 37% 63% 0% Once a month or more 33% 67% 0% Email Never 38% 62% 0% A couple of times a year or less 40% 60% 0% Once a month or more 32% 68% 0% Telephone Never 52% 47% 1% A couple of times a year or less 39% 61% 0% Once a month or more 33% 67% 0% Letters and postcards Never 41% 59% 0% A couple of times a year or less 30% 70% 0% Once a month or more 35% 65% 0% Text messaging Never 35% 65% 0% A couple of times a year or less 42% 58% 0% Once a month or more 37% 63% 0% Social Networking Sites (e.g., Facebook, Twitter) Never 36% 64% 0% A couple of times a year or less 39% 61% 0% Once a month or more 34% 66% 1% Note: Rows may not sum to 100% because of rounding error.
Loneliness among Older Adults: A National Survey of Adults 45+
27
Appendix A-3 (Continued) Social Networks Q27_D. Frequency of contact with friends Lonely Not Lonely Missing In person Never 68% 30% 2% A couple of times a year or less 48% 52% 0% Once a month or more 32% 68% 0% Email Never 41% 58% 1% A couple of times a year or less 44% 56% 0% Once a month or more 32% 69% 0% Telephone Never 51% 49% 0% A couple of times a year or less 42% 57% 1% Once a month or more 30% 69% 1% Letters and postcards Never 36% 64% 0% A couple of times a year or less 30% 69% 1% Once a month or more 33% 66% 1% Text messaging Never 33% 66% 1% A couple of times a year or less 40% 60% 0% Once a month or more 32% 68% 0% Social Networking Sites (e.g., Facebook, Twitter) Never 33% 66% 1% A couple of times a year or less 31% 69% 0% Once a month or more 34% 65% 1% Note: Rows may not sum to 100% because of rounding error.
Loneliness among Older Adults: A National Survey of Adults 45+
28
Appendix A-4 Health Characteristics by Loneliness
Loneliness by Overall Health and Medical Conditions Lonely Not Lonely Missing Q2. Overall Health 1 = Excellent 22% 77% 1% 2 = Very good 23% 77% 0% 3 = Good 37% 63% 0% 4 = Fair 46% 52% 2% 5 = Poor 54% 46% 0% Q5. Which of the following medical conditions have you been diagnosed with? Diabetes [N =yes (% = yes)] 37% 62% 1% Hypertension [N =yes (% = yes)] 34% 65% 1% Arthritis / Rheumatism [N =yes (% = yes)] 34% 65% 1% Gastrointestinal diseases [N =yes (% = yes)] 35% 64% 1% Obesity [N =yes (% = yes)] 42% 56% 2% Cancer [N =yes (% = yes)] 25% 74% 1% Depression [N =yes (% = yes)] 62% 38% 0% Anxiety [N =yes (% = yes)] 60% 40% 0% Other mood disorder [N =yes (% = yes)] 61% 39% 0% Sleep disorder [N =yes (% = yes)] 46% 53% 1% Cardiovascular / Heart disease [N =yes (% = yes)] 34% 65% 1% High cholesterol [N =yes (% = yes)] 35% 64% 1% Other chronic pain condition [N =yes (% = yes)] 47% 52% 1% Drug / Alcohol abuse [N =yes (% = yes)] 66% 34% 0% Other medical condition [N =yes (% = yes)] 44% 55% 1% Note: Rows may not sum to 100% because of rounding error.

Loneliness among Older Adults: A National Survey of Adults 45+
29
Appendix A-4 (Continued) Health Characteristics by Loneliness
Health Behavior Characteristics by Loneliness Lonely % Not Lonely% Missing% Q12. Do you smoke cigarettes, cigarillos, a pipe, or cigars, or chew tobacco, and if so, how often per day? Yes 32% 67% 1% No 37% 62% 1% Q14. Do you drink alcoholic beverages, and if so, how many drinks do you have per week? Yes 32% 68% 0% No 35% 64% 1% Q16. Do you use recreational drugs, and if so, how often do you use drugs? Yes 42% 55% 2% No 33% 66% 1% Q18. On average, how many hours of sleep do you get per night? 1 = 2 hours or less 57% 43% 0% 2 = 3-5 hours 51% 49% 0% 3 = 6-7 hours 31% 68% 1% 4 = 8-10 hours 29% 71% 0% 5 = 11 hours or more 40% 53% 7% Q20. On average, how frequently have you had sexual relations with a partner in the past year? Daily or near daily 30% 69% 1% Once a week 24% 75% 1% A few times a month 25% 74% 1% Once a month 36% 63% 1% A few times in the past year 42% 58% 0% Never 37% 62% 1% Note: Rows may not sum to 100% because of rounding error.

Loneliness among Older Adults: A National Survey of Adults 45+
30
Appendix A-5 Predictors of Total Number of Diagnosed Ailments – Loneliness and Socio-Demographic Measures
Loneliness and Socio-Demographic Measures Beta
Estimate Lower CI Upper CI p-value Loneliness (UCLA Index) 0.017 0.009 0.025 <.0001 Currently Working -0.411 -0.590 -0.232 <.0001 Age 0.027 0.019 .0035 <.0001 Self-Reported Health -0.848 -0.943 -0.754 <.0001 Disability (Q8) 1.551 1.337 1.765 <.0001 Contact with Friends via Social Networking Sites 0.152 0.060 0.244 0.0010 No. Children over Age 18 -0.198 -0.313 -0.082 0.0010 No. Persons to Discuss Personal Matters With 0.075 0.051 0.098 <.0001 Close Relative Moved, Past Five Years 0.422 0.194 0.650 0.0000 Spiritual 0.216 0.097 0.334 0.0000

Loneliness among Older Adults: A National Survey of Adults 45+
31
Appendix A-6 Use of Technology
Loneliness and Technology Use of Spouses and Children Lonely Not Lonely Missing Q 82a. How often does your spouse or partner go online (i.e., use the Internet or email)? Daily 26% 74% 0% Weekly 28% 71% 1% Monthly or less 31% 69% 0% Do not go online 33% 66% 1% Q 82b. How often does your child or children go online (i.e., use the Internet or email)? Daily 28% 71% 1% Weekly 33% 66% 1% Monthly or less 45% 55% 0% Do not go online 36% 63% 1%
Loneliness and Use of Social Communication Technology Frequently Infrequently Never Missing Q 83_1. How frequently do you send or receive email? Lonely 74% 13% 5% 8% Not Lonely 75% 10% 6% 9% Q 83_2. How frequently do you use instant messaging (e.g., AIM, MSN or Yahoo! Messenger)? Frequently Infrequently Never Missing Lonely 17% 12% 63% 8% Not Lonely 14% 14% 63% 9% Q 83_3. How frequently do you participate in social networking sites such as Facebook, Twitter or MySpace? Frequently Infrequently Never Missing Lonely 24% 12% 57% 7% Not Lonely 21% 13% 57% 9% Q 83_4. How frequently do you participate in online forums or message boards? Frequently Infrequently Never Missing Lonely 9% 12% 72% 7% Not Lonely 6% 13% 73% 9% Note: Rows may not sum to 100% because of rounding error.

Loneliness among Older Adults: A National Survey of Adults 45+
32
Appendix A-6 (Continued) Use of Technology
Attitudes About Technology Agree Neither Agree
nor Disagree Disagree Missing
Q89_A. The Internet has brought me closer together with my friends and family Lonely 24% 31% 36% 9% Not Lonely 29% 30% 32% 10% Q89_B. The Internet makes it easier for me to share personal or uncomfortable information. Lonely 17% 34% 40% 9% Not Lonely 10% 30% 49% 11% Q89_C. Communicating online is less satisfying than communicating on the phone or with letters. Lonely 42% 28% 21% 9% Not Lonely 48% 23% 19% 10% Q89_D. Social networking sites such as Facebook and Twitter make me feel connected with my friends and family. Lonely 19% 24% 47% 11% Not Lonely 17% 27% 46% 10% Q89_E. The more I use the Internet as a replacement for other forms of communication, the lonelier I feel. Lonely 11% 39% 42% 9% Not Lonely 5% 27% 58% 11% Q89_F. Social networking has helped keep me in touch with friends and family I would have otherwise drifted away from. Lonely 28% 26% 38% 9% Not Lonely 29% 23% 38% 10% Q89_G. I have fewer “deep” friendship connections now that I keep in touch with people using the Internet. Lonely 13% 37% 41% 9% Not Lonely 6% 27% 55% 11% Q89_H. I would recommend using the Internet to others in order to help with loneliness. Lonely 29% 34% 29% 9% Not Lonely 23% 36% 30% 10% Q89_I. Technology has made it harder to spend time with my friends and family in person. Lonely 12% 34% 45% 9% Not Lonely 9% 24% 57% 11% Q89_J. I find it easy to balance my time on the Internet with in-person activities and obligations. Lonely 39% 34% 19% 9% Not Lonely 43% 27% 19% 10% Note: Rows may not sum to 100% because of rounding error.
Loneliness among Older Adults: A National Survey of Adults 45+
33
Appendix A-7 Coping Behaviors
Frequency of Behaviors When Feeling Lonely Q76. How often do you do each of the following activities when you are feeling lonely? Always/Sometimes Rarely/Never Missing Talk to a friend or relative Lonely 72% 26% 2%** Not Lonely 81% 17% 2% Watch television Lonely 86% 13% 1%** Not Lonely 74% 24% 2% Write in a diary or journal Lonely 12% 86% 1%** Not Lonely 12% 86% 2% Drink alcohol Lonely 21% 78% 1%** Not Lonely 14% 83% 3% Smoke cigarettes or use other tobacco products Lonely 24% 75% 1%** Not Lonely 15% 83% 2% Sleep Lonely 66% 33% 1%** Not Lonely 44% 53% 3% Go out alone, such as to a restaurant or run an errand Lonely 50% 48% 2%** Not Lonely 39% 59% 2% Eat food Lonely 67% 32% 1%** Not Lonely 49% 49% 2% Go out with friends or family Lonely 53% 46% 1%** Not Lonely 72% 26% 2% Surf the Internet Lonely 59% 40% 1%** Not Lonely 47% 51% 2% Go to bars or clubs Lonely 16% 92% 1%** Not Lonely 18% 92% 3% Work on a hobby or personal interest Lonely 65% 34% 1%** Not Lonely 69% 28% 3% Attend religious services Lonely 34% 64% 2%** Not Lonely 39% 59% 2% Use drugs Lonely 5% 94% 1%** Not Lonely 1%** 96% 3% Take a walk Lonely 52% 47% 1%** Not Lonely 53% 44% 3% Go shopping Lonely 45% 53% 1%** Not Lonely 36% 61% 3% Note: Rows may not sum to 100% because of rounding error.
Loneliness among Older Adults: A National Survey of Adults 45+
34
Appendix A-8 Significant Predictors of Loneliness (Ordinary Least Squares Regression Model)
Significant Predictors of Loneliness
Beta Estimate Lower CI Upper CI p-value Bachelors Degree or More 1.556 0.664 2.448 0.0010 Divorced 2.761 1.698 3.825 <.0001 Widowed 2.697 1.219 4.175 0.0000 Other Marital Status 3.039 1.972 4.106 <.0001 Currently Working -1.656 -2.714 -0.598 0.0020 Retired -2.669 -4.019 -1.318 0.0000 Age -0.142 -0.192 -0.092 <.0001 No. Diagnosed Conditions 0.403 0.211 0.595 <.0001 Self-Reported Health -1.751 -2.248 -1.254 <.0001 Heavy Smoker -2.140 -3.548 -0.732 0.0030 Sexual Intercourse Frequency -2.068 -3.081 -1.056 <.0001 Hours of Sleep per Night -0.971 -1.585 -0.357 0.0020 In Person Contact with Friends -1.896 -2.866 -0.926 0.0000 Telephone Contact with Friends -3.059 -3.939 -2.180 <.0001 No. Supportive People Past Year -0.030 -0.047 -0.012 0.0010 Volunteered Past Year -1.724 -2.538 -0.911 <.0001 No. People to Discuss Important Matters
-0.527 -0.653 -0.401 <.0001
No. Persons Met Online 0.609 0.264 0.954 0.0010 No. Children Over Age 18 0.801 0.216 1.386 0.0070 Frequency of Send/Receive Email 1.090 0.340 1.840 0.0040 Internet Favorability Index (Q89) -0.247 -0.365 -0.129 <.0001
Loneliness among Older Adults: A National Survey of Adults 45+
35
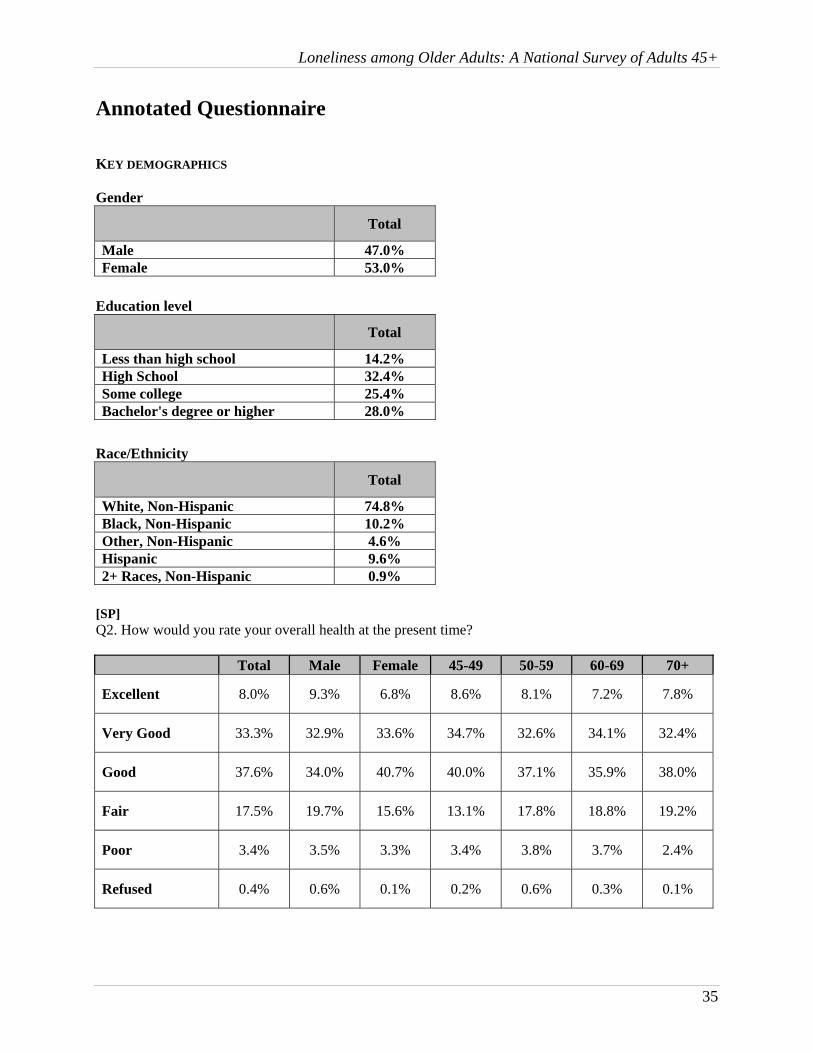
Annotated Questionnaire KEY DEMOGRAPHICS Gender
Total
Male 47.0% Female 53.0%
Education level
Total
Less than high school 14.2% High School 32.4% Some college 25.4% Bachelor's degree or higher 28.0%
Race/Ethnicity
Total
White, Non-Hispanic 74.8% Black, Non-Hispanic 10.2% Other, Non-Hispanic 4.6% Hispanic 9.6% 2+ Races, Non-Hispanic 0.9%
[SP] Q2. How would you rate your overall health at the present time?
Total Male Female 45-49 50-59 60-69 70+
Excellent 8.0% 9.3% 6.8% 8.6% 8.1% 7.2% 7.8%
Very Good 33.3% 32.9% 33.6% 34.7% 32.6% 34.1% 32.4%
Good 37.6% 34.0% 40.7% 40.0% 37.1% 35.9% 38.0%
Fair 17.5% 19.7% 15.6% 13.1% 17.8% 18.8% 19.2%
Poor 3.4% 3.5% 3.3% 3.4% 3.8% 3.7% 2.4%
Refused 0.4% 0.6% 0.1% 0.2% 0.6% 0.3% 0.1%
Loneliness among Older Adults: A National Survey of Adults 45+
36
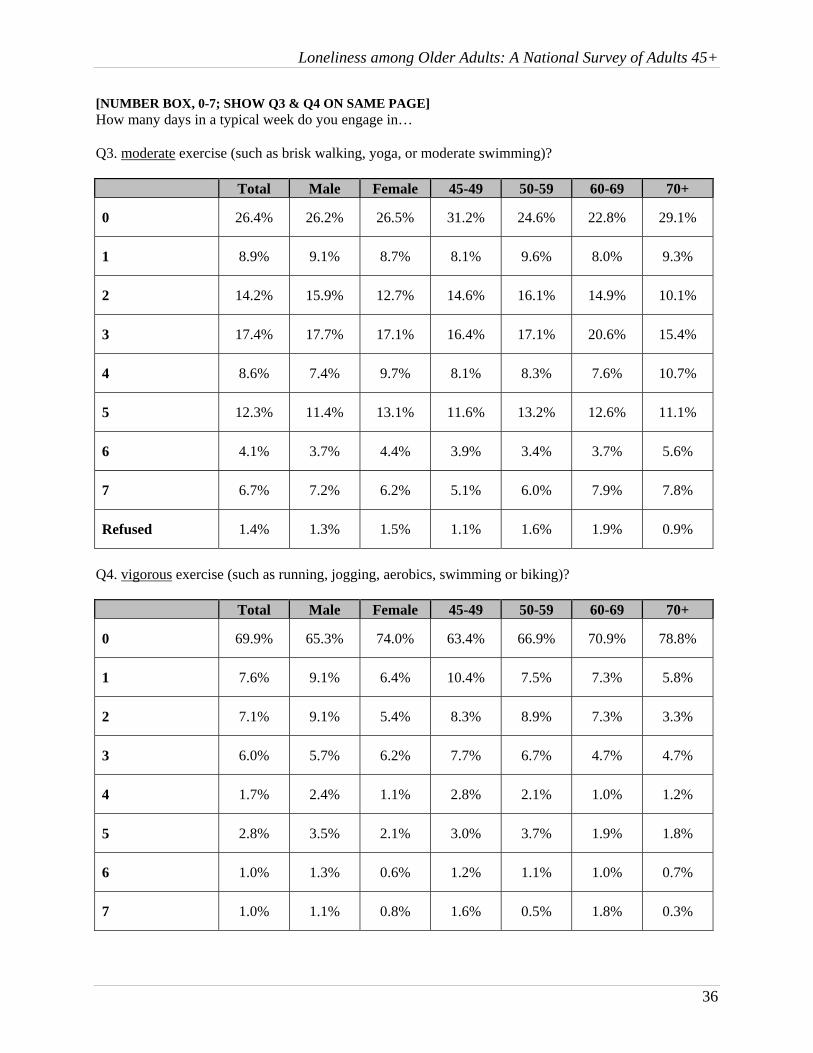
[NUMBER BOX, 0-7; SHOW Q3 & Q4 ON SAME PAGE] How many days in a typical week do you engage in… Q3. moderate exercise (such as brisk walking, yoga, or moderate swimming)?
Total Male Female 45-49 50-59 60-69 70+
0 26.4% 26.2% 26.5% 31.2% 24.6% 22.8% 29.1%
1 8.9% 9.1% 8.7% 8.1% 9.6% 8.0% 9.3%
2 14.2% 15.9% 12.7% 14.6% 16.1% 14.9% 10.1%
3 17.4% 17.7% 17.1% 16.4% 17.1% 20.6% 15.4%
4 8.6% 7.4% 9.7% 8.1% 8.3% 7.6% 10.7%
5 12.3% 11.4% 13.1% 11.6% 13.2% 12.6% 11.1%
6 4.1% 3.7% 4.4% 3.9% 3.4% 3.7% 5.6%
7 6.7% 7.2% 6.2% 5.1% 6.0% 7.9% 7.8%
Refused 1.4% 1.3% 1.5% 1.1% 1.6% 1.9% 0.9%
Q4. vigorous exercise (such as running, jogging, aerobics, swimming or biking)?
Total Male Female 45-49 50-59 60-69 70+
0 69.9% 65.3% 74.0% 63.4% 66.9% 70.9% 78.8%
1 7.6% 9.1% 6.4% 10.4% 7.5% 7.3% 5.8%
2 7.1% 9.1% 5.4% 8.3% 8.9% 7.3% 3.3%
3 6.0% 5.7% 6.2% 7.7% 6.7% 4.7% 4.7%
4 1.7% 2.4% 1.1% 2.8% 2.1% 1.0% 1.2%
5 2.8% 3.5% 2.1% 3.0% 3.7% 1.9% 1.8%
6 1.0% 1.3% 0.6% 1.2% 1.1% 1.0% 0.7%
7 1.0% 1.1% 0.8% 1.6% 0.5% 1.8% 0.3%
Loneliness among Older Adults: A National Survey of Adults 45+
37
Refused 3.0% 2.5% 3.4% 1.6% 2.7% 4.0% 3.4%
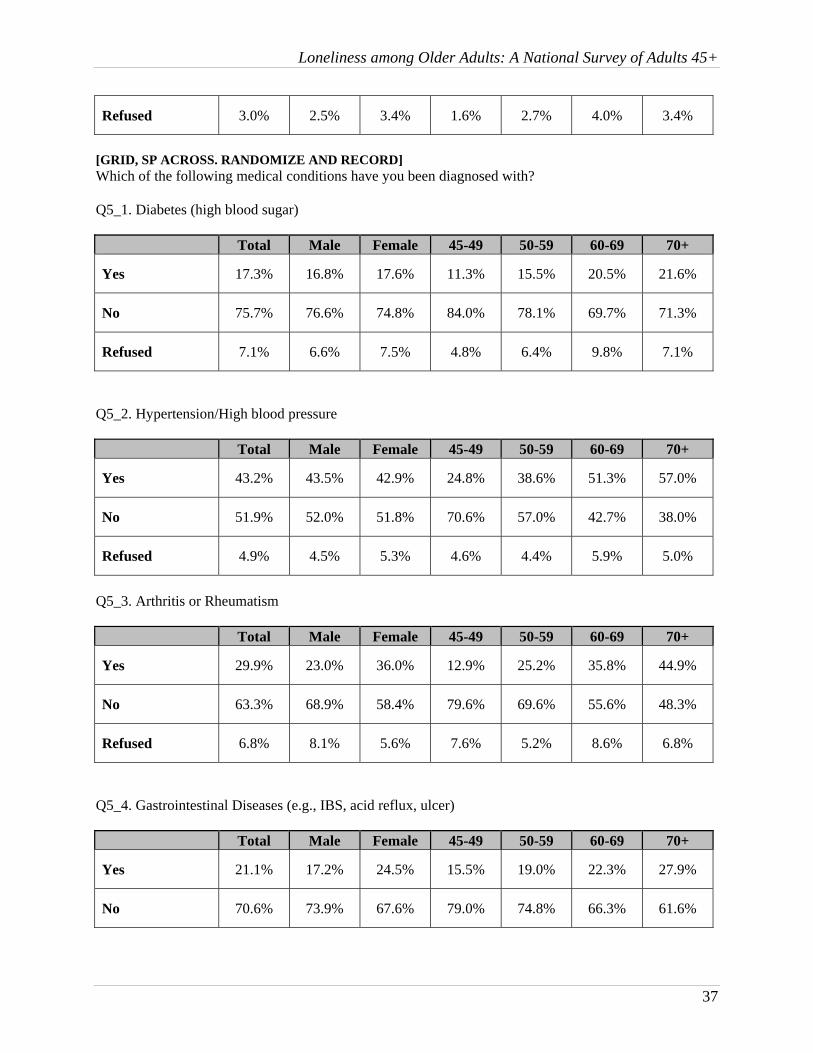
[GRID, SP ACROSS. RANDOMIZE AND RECORD] Which of the following medical conditions have you been diagnosed with? Q5_1. Diabetes (high blood sugar) Total Male Female 45-49 50-59 60-69 70+
Yes 17.3% 16.8% 17.6% 11.3% 15.5% 20.5% 21.6%
No 75.7% 76.6% 74.8% 84.0% 78.1% 69.7% 71.3%
Refused 7.1% 6.6% 7.5% 4.8% 6.4% 9.8% 7.1%
Q5_2. Hypertension/High blood pressure Total Male Female 45-49 50-59 60-69 70+
Yes 43.2% 43.5% 42.9% 24.8% 38.6% 51.3% 57.0%
No 51.9% 52.0% 51.8% 70.6% 57.0% 42.7% 38.0%
Refused 4.9% 4.5% 5.3% 4.6% 4.4% 5.9% 5.0%
Q5_3. Arthritis or Rheumatism Total Male Female 45-49 50-59 60-69 70+
Yes 29.9% 23.0% 36.0% 12.9% 25.2% 35.8% 44.9%
No 63.3% 68.9% 58.4% 79.6% 69.6% 55.6% 48.3%
Refused 6.8% 8.1% 5.6% 7.6% 5.2% 8.6% 6.8%
Q5_4. Gastrointestinal Diseases (e.g., IBS, acid reflux, ulcer) Total Male Female 45-49 50-59 60-69 70+
Yes 21.1% 17.2% 24.5% 15.5% 19.0% 22.3% 27.9%
No 70.6% 73.9% 67.6% 79.0% 74.8% 66.3% 61.6%

Loneliness among Older Adults: A National Survey of Adults 45+
38
Refused 8.3% 8.9% 7.8% 5.5% 6.2% 11.5% 10.5%
Q5_5. Obesity Total Male Female 45-49 50-59 60-69 70+
Yes 16.5% 12.4% 20.1% 13.9% 19.3% 18.3% 12.4%
No 75.8% 79.7% 72.3% 80.6% 74.8% 71.2% 78.1%
Refused 7.7% 7.9% 7.6% 5.5% 5.9% 10.5% 9.5%
Q5_6. Cancer Total Male Female 45-49 50-59 60-69 70+
Yes 10.1% 10.3% 9.9% 3.2% 5.8% 11.5% 21.2%
No 81.4% 80.9% 81.9% 89.8% 86.1% 78.7% 70.3%
Refused 8.5% 8.8% 8.2% 7.1% 8.1% 9.8% 8.6%
Q5_7. Depression Total Male Female 45-49 50-59 60-69 70+
Yes 16.0% 13.4% 18.3% 16.7% 21.8% 15.4% 7.1%
No 75.9% 79.0% 73.1% 77.3% 72.2% 74.4% 81.9%
Refused 8.1% 7.6% 8.5% 6.0% 5.9% 10.2% 11.0%
Q5_8. Anxiety Total Male Female 45-49 50-59 60-69 70+
Yes 11.8% 9.6% 13.8% 12.9% 16.5% 9.7% 6.1%
No 79.9% 82.0% 78.0% 81.5% 77.0% 79.5% 83.4%
Refused 8.3% 8.3% 8.2% 5.6% 6.5% 10.8% 10.5%

Loneliness among Older Adults: A National Survey of Adults 45+
39
Q5_9. Other mood disorder (e.g., ADHD, bipolar disorder) Total Male Female 45-49 50-59 60-69 70+
Yes 4.0% 3.7% 4.2% 6.5% 5.9% 1.8% 1.3%
No 87.0% 87.3% 86.7% 87.3% 86.6% 87.1% 86.8%
Refused 9.0% 9.0% 9.1% 6.2% 7.4% 11.1% 11.9%
Q5_10. Sleep disorder (e.g., insomnia, sleep apnea) Total Male Female 45-49 50-59 60-69 70+
Yes 15.0% 17.0% 13.3% 14.5% 14.3% 18.3% 13.2%
No 77.1% 75.5% 78.5% 79.5% 79.3% 72.1% 76.9%
Refused 7.9% 7.6% 8.2% 6.0% 6.3% 9.7% 9.9%
Q5_11. Cardiovascular /Heart Disease Total Male Female 45-49 50-59 60-69 70+
Yes 12.1% 15.5% 9.1% 4.6% 8.0% 14.5% 22.1%
No 79.8% 76.6% 82.7% 88.9% 85.3% 75.1% 69.0%
Refused 8.1% 7.8% 8.3% 6.5% 6.7% 10.4% 8.9%
Q5_12. High Cholesterol Total Male Female 45-49 50-59 60-69 70+
Yes 40.3% 41.4% 39.3% 24.3% 36.1% 50.2% 49.3%
No 53.8% 52.6% 54.9% 69.1% 58.9% 43.2% 44.4%
Refused 5.9% 6.0% 5.9% 6.5% 5.0% 6.6% 6.4%
Loneliness among Older Adults: A National Survey of Adults 45+
40
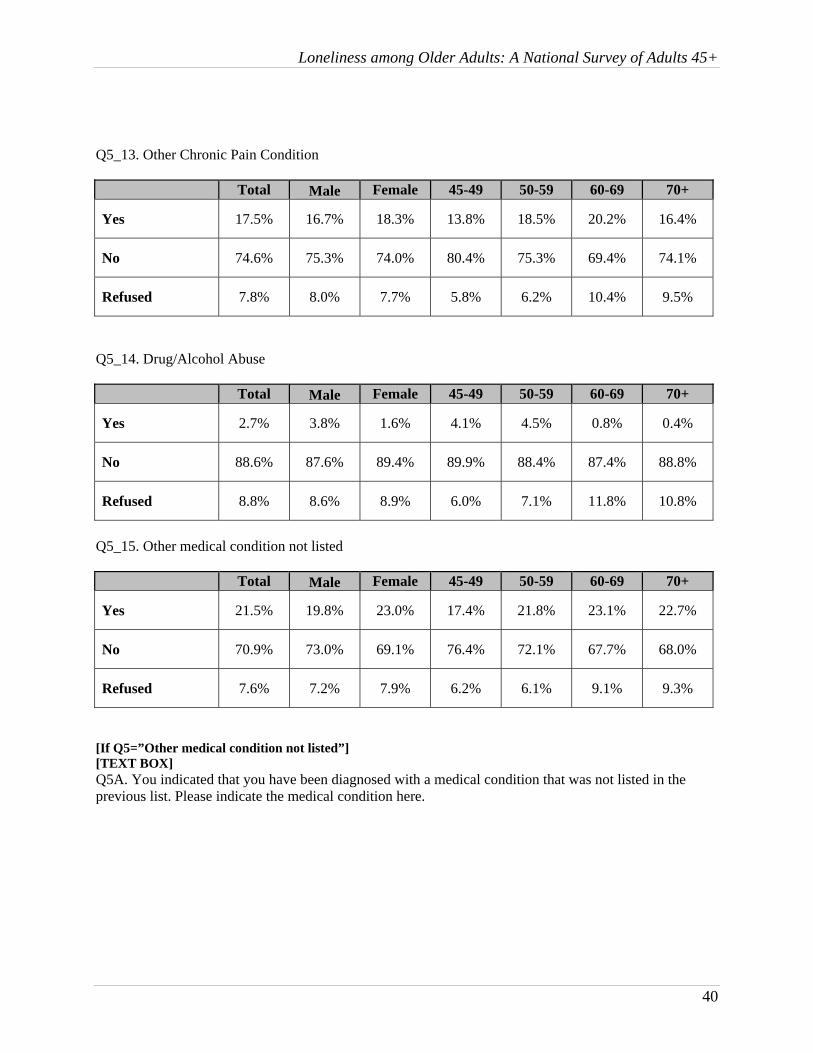
Q5_13. Other Chronic Pain Condition Total Male Female 45-49 50-59 60-69 70+
Yes 17.5% 16.7% 18.3% 13.8% 18.5% 20.2% 16.4%
No 74.6% 75.3% 74.0% 80.4% 75.3% 69.4% 74.1%
Refused 7.8% 8.0% 7.7% 5.8% 6.2% 10.4% 9.5%
Q5_14. Drug/Alcohol Abuse Total Male Female 45-49 50-59 60-69 70+
Yes 2.7% 3.8% 1.6% 4.1% 4.5% 0.8% 0.4%
No 88.6% 87.6% 89.4% 89.9% 88.4% 87.4% 88.8%
Refused 8.8% 8.6% 8.9% 6.0% 7.1% 11.8% 10.8%
Q5_15. Other medical condition not listed Total Male Female 45-49 50-59 60-69 70+
Yes 21.5% 19.8% 23.0% 17.4% 21.8% 23.1% 22.7%
No 70.9% 73.0% 69.1% 76.4% 72.1% 67.7% 68.0%
Refused 7.6% 7.2% 7.9% 6.2% 6.1% 9.1% 9.3%
[If Q5=”Other medical condition not listed”] [TEXT BOX] Q5A. You indicated that you have been diagnosed with a medical condition that was not listed in the previous list. Please indicate the medical condition here.

Loneliness among Older Adults: A National Survey of Adults 45+
41
[SP] Q8. Does any disability, handicap or chronic disease keep you from participating fully in work, school, household, or other activities? Total Male Female 45-49 50-59 60-69 70+
Yes 24.2% 24.3% 24.1% 21.7% 24.7% 26.1% 23.4%
No 75.6% 75.5% 75.6% 78.3% 75.1% 73.6% 76.0%
Refused 0.2% 0.1% 0.3% 0.0% 0.2% 0.3% 0.6%
[IF Q8=1] [SP] Q9. How long have you had this disability? Total Male Female 45-49 50-59 60-69 70+
Less than 1 year 4.8% 2.0% 7.3% 4.1% 3.9% 3.7% 8.2%
1 to 2 years 11.5% 11.6% 11.4% 13.8% 7.0% 11.1% 17.6%
3 to 4 years 11.2% 10.8% 11.7% 14.6% 9.3% 9.0% 14.5%
5 to 9 years 27.5% 26.2% 28.8% 22.8% 32.2% 29.6% 21.4%
10 to 19 years 24.7% 24.7% 24.6% 27.6% 25.2% 24.9% 21.4%
20 years or more 19.5% 23.3% 16.1% 16.3% 22.1% 21.7% 14.5%
Refused 0.8% 1.5% 0.3% 0.8% 0.4% 0.0% 2.5%
[GRID, SP ACROSS]
Q10. On a scale from 1 to 10, where 1 is “extremely low” and 10 is “extremely high,” please rate the overall stress level in your life today.
Total Male Female 45-49 50-59 60-69 70+
Extremely Low -1 6.4% 7.1% 5.8% 3.7% 4.0% 8.2% 10.4%
2 11.2% 11.5% 10.8% 6.9% 7.2% 13.3% 18.8%
3 13.5% 15.4% 11.8% 10.0% 10.5% 17.2% 17.3%
4 10.5% 9.0% 11.8% 11.4% 9.8% 10.5% 10.8%

Loneliness among Older Adults: A National Survey of Adults 45+
42
5 15.6% 15.3% 15.9% 16.0% 14.5% 14.2% 18.4%
6 13.5% 14.2% 12.8% 17.4% 15.8% 11.2% 9.0%
7 11.9% 12.7% 11.1% 11.6% 16.0% 9.8% 7.9%
8 10.7% 9.9% 11.3% 14.1% 13.2% 8.7% 5.9%
9 4.0% 2.4% 5.4% 4.6% 5.9% 3.9% 0.6%
Extremely High - 10 2.3% 1.7% 2.8% 3.3% 2.9% 2.2% 0.4%
Refused 0.5% 0.7% 0.4% 0.9% 0.3% 0.8% 0.4%
[SP] Q12. Do you smoke cigarettes, cigarillos, a pipe or cigars or chew tobacco, and if so, how often per day? Total Male Female 45-49 50-59 60-69 70+
Do not smoke 77.8% 76.3% 79.2% 68.4% 71.6% 84.5% 88.3%
1-4 day 4.6% 5.7% 3.6% 8.5% 5.1% 2.9% 2.4%
5-9 per day 4.7% 4.8% 4.6% 5.3% 6.7% 3.6% 2.1%
10-14 per day 4.4% 3.5% 5.3% 5.5% 6.3% 2.6% 2.5%
15+ per day 7.9% 9.0% 6.9% 12.4% 9.9% 5.9% 3.3%
Refused 0.6% 0.7% 0.5% 0.0% 0.4% 0.4% 1.5%
[SP] Q14. Do you drink alcoholic beverages, and if so, how many drinks do you have per week? Total Male Female 45-49 50-59 60-69 70+ Do not drink alcoholic beverages
45.8% 39.9% 51.0% 44.6% 42.1% 47.3% 50.9%
Less than 1 drink per week
22.7% 20.6% 24.5% 22.4% 24.6% 21.6% 21.2%
1 - 2 drinks per week
9.3% 10.8% 7.9% 12.9% 8.7% 8.6% 7.8%

Loneliness among Older Adults: A National Survey of Adults 45+
43
3 - 5 drinks per week
9.3% 10.3% 8.4% 8.8% 11.1% 9.0% 7.2%
6 -10 drinks per week
7.1% 9.3% 5.1% 4.9% 7.7% 7.3% 7.4%
More than 10 drinks per week
5.2% 8.8% 2.1% 5.5% 5.2% 5.5% 4.9%
Refused 0.7% 0.4% 0.9% 0.9% 0.6% 0.7% 0.6%
[SP] Q16. Do you use recreational drugs, and if so, how often do you use drugs? Total Male Female 45-49 50-59 60-69 70+
Do not use drugs 95.8% 93.2% 98.1% 92.4% 95.5% 96.1% 98.5%
Less than once a month
0.9% 1.0% 0.8% 1.4% 1.0% 0.8% 0.3%
One to two times per month
0.5% 1.1% 0.1% 0.5% 1.1% 0.3% 0.0%
Once a week 0.2% 0.4% 0.1% 0.0% 0.6% 0.1% 0.0%
A couple times a week
0.8% 1.6% 0.1% 2.8% 0.5% 0.6% 0.0%
Every day 0.7% 1.2% 0.3% 1.2% 0.9% 0.7% 0.1%
Refused 1.0% 1.6% 0.6% 1.6% 0.5% 1.4% 1.0%
[SP] Q18. On average, how many hours of sleep do you get per night? Total Male Female 45-49 50-59 60-69 70+
2 hours or less 0.7% 0.8% 0.6% 0.4% 0.9% 0.6% 0.7%
3-5 14.1% 14.0% 14.1% 16.5% 15.8% 13.4% 10.1%
6-7 60.6% 61.4% 59.9% 64.4% 59.9% 60.9% 58.0%
8-10 23.9% 23.0% 24.8% 18.3% 22.6% 24.1% 30.8%
11 hours or more 0.6% 0.6% 0.5% 0.4% 0.6% 1.0% 0.3%
Refused 0.1% 0.1% 0.1% 0.0% 0.3% 0.1% 0.1%

Loneliness among Older Adults: A National Survey of Adults 45+
44
[SP] Q20. On average, how frequently have you had sexual relations with a partner in the past year? Total Male Female 45-49 50-59 60-69 70+
Daily or near daily
3.8% 4.9% 2.8% 8.6% 4.0% 2.1% 1.3%
Once a week 14.0% 17.7% 10.7% 20.2% 16.9% 11.9% 6.4%
A few times a month
16.3% 19.5% 13.5% 25.4% 17.8% 15.8% 7.0%
Once a month 6.0% 6.4% 5.6% 7.2% 6.7% 5.8% 4.0%
A few times in the past year
17.4% 18.1% 16.7% 17.4% 18.0% 19.0% 14.5%
Never 39.0% 30.0% 47.1% 18.5% 33.0% 41.4% 63.3%
Refused 3.5% 3.4% 3.6% 2.6% 3.6% 4.0% 3.6%
[--Personal Relationships--] [IF PPMARIT=1, 6] [SP] Q21. How long have you been married or in a relationship with your current partner? Total Male Female 45-49 50-59 60-69 70+
Less than 1 year 1.0% 0.8% 1.2% 0.5% 1.0% 0.7% 1.9%
1 to 2 years 1.8% 1.7% 1.8% 4.1% 1.5% 0.9% 0.8%
3 to 4 years 3.4% 4.5% 2.3% 5.9% 5.1% 1.4% 0.6%
5 to 9 years 6.3% 6.8% 5.6% 10.3% 9.3% 2.5% 1.4%
10 to 19 years 18.8% 19.7% 17.9% 35.1% 21.6% 11.5% 6.4%
20 years or more 67.8% 65.8% 70.1% 44.1% 61.3% 82.7% 85.4%
Refused 0.9% 0.8% 1.1% 0.0% 0.2% 0.2% 3.6%

Loneliness among Older Adults: A National Survey of Adults 45+
45
[IF PPMARIT=1, 6] [SP] Q22. How satisfied are you in your current relationship with your spouse or partner? Total Male Female 45-49 50-59 60-69 70+
Very satisfied 61.5% 63.5% 59.2% 62.3% 60.2% 60.0% 64.1%
Somewhat satisfied
18.4% 16.4% 20.6% 19.4% 20.1% 19.6% 13.5%
Neither satisfied nor dissatisfied
7.6% 7.9% 7.3% 7.8% 7.1% 8.1% 7.7%
Somewhat unsatisfied
4.6% 4.5% 4.7% 5.7% 6.6% 3.0% 1.9%
Very unsatisfied 6.6% 6.3% 7.0% 4.3% 5.3% 8.5% 8.8%
Refused 1.3% 1.3% 1.2% 0.5% 0.7% 0.7% 3.9%
[IF PPMARIT=3] [SP] Q23. How long have you been divorced? Total Male Female 45-49 50-59 60-69 70+
Less than 1 year 0.2% 0.0% 0.3% 0.0% 0.0% 0.6% 1.1%
1 to 2 years 1.1% 0.9% 1.2% 3.4% 1.3% 0.0% 0.0%
3 to 4 years 5.3% 8.9% 3.2% 12.6% 6.6% 1.3% 3.2%
5 to 9 years 15.2% 18.2% 13.3% 20.7% 14.8% 16.9% 7.5%
10 to 19 years 35.1% 32.2% 36.9% 43.7% 45.9% 25.3% 16.1%
20 years or more 41.5% 37.4% 44.1% 17.2% 29.7% 54.5% 71.0%
Refused 1.6% 2.3% 1.2% 2.3% 1.7% 1.3% 1.1%

Loneliness among Older Adults: A National Survey of Adults 45+
46
[IF PPMARIT=2] [SP] Q24. How long have you been widowed? Total Male Female 45-49 50-59 60-69 70+
Less than 1 year 0.0% 0.0% 0.0% 0.0% 0.0% 0.0% 0.0%
1 to 2 years 8.0% 9.1% 7.7% 42.9% 9.7% 10.7% 5.5%
3 to 4 years 10.9% 18.2% 8.6% 14.3% 29.0% 12.5% 7.1%
5 to 9 years 20.4% 24.2% 19.1% 28.6% 19.4% 30.4% 17.0%
10 to 19 years 36.4% 27.3% 39.2% 14.3% 32.3% 25.0% 41.8%
20 years or more 20.4% 13.6% 22.5% 0.0% 6.5% 21.4% 23.1%
Refused 4.0% 7.6% 2.9% 0.0% 3.2% 0.0% 5.5%
[SP]
Q25. Do you consider yourself to be...
Total Male Female 45-49 50-59 60-69 70+
Heterosexual or straight
93.8% 92.6% 94.8% 92.0% 93.0% 94.7% 95.6%
Lesbian 0.6% 0.0% 1.1% 1.1% 0.8% 0.3% 0.1%
Bisexual 1.2% 1.7% 0.8% 1.4% 1.2% 1.2% 0.7%
Gay 1.6% 3.3% 0.1% 2.1% 2.7% 0.8% 0.1%
Other (please specify)
1.2% 0.8% 1.4% 2.3% 0.7% 1.5% 0.6%
Refused 1.7% 1.6% 1.9% 1.1% 1.6% 1.4% 2.8%

Loneliness among Older Adults: A National Survey of Adults 45+
47
[SP] Q25a. Are your parents still living? Total Male Female 45-49 50-59 60-69 70+
Yes, both 14.8% 14.8% 14.7% 36.2% 20.2% 2.4% 1.6%
Yes, one 25.2% 25.9% 24.5% 37.0% 33.2% 22.4% 5.8%
No 58.8% 57.8% 59.7% 25.9% 44.8% 74.8% 91.0%
Don’t know 0.3% 0.4% 0.3% 0.4% 0.5% 0.1% 0.3%
Refused 0.9% 1.1% 0.8% 0.5% 1.3% 0.3% 1.3%
[NUMBER BOX, 0-15] Q26. How many siblings do you have? Total Male Female 45-49 50-59 60-69 70+
0 7.8% 8.3% 7.4% 6.2% 4.1% 7.6% 15.1%
1 18.9% 19.7% 18.2% 14.5% 17.7% 22.8% 20.4%
2 23.7% 24.6% 22.9% 22.4% 26.4% 23.0% 21.2%
3 16.8% 16.3% 17.3% 19.8% 17.3% 16.2% 14.5%
4 11.6% 11.3% 11.9% 11.6% 11.4% 12.9% 10.7%
5 7.4% 7.2% 7.6% 7.2% 9.5% 6.4% 5.6%
6+ 12.7% 11.0% 14.2% 16.6% 12.4% 10.9% 11.6%
Refused 1.0% 1.6% 0.6% 1.8% 1.1% 0.3% 0.9%
Loneliness among Older Adults: A National Survey of Adults 45+
48
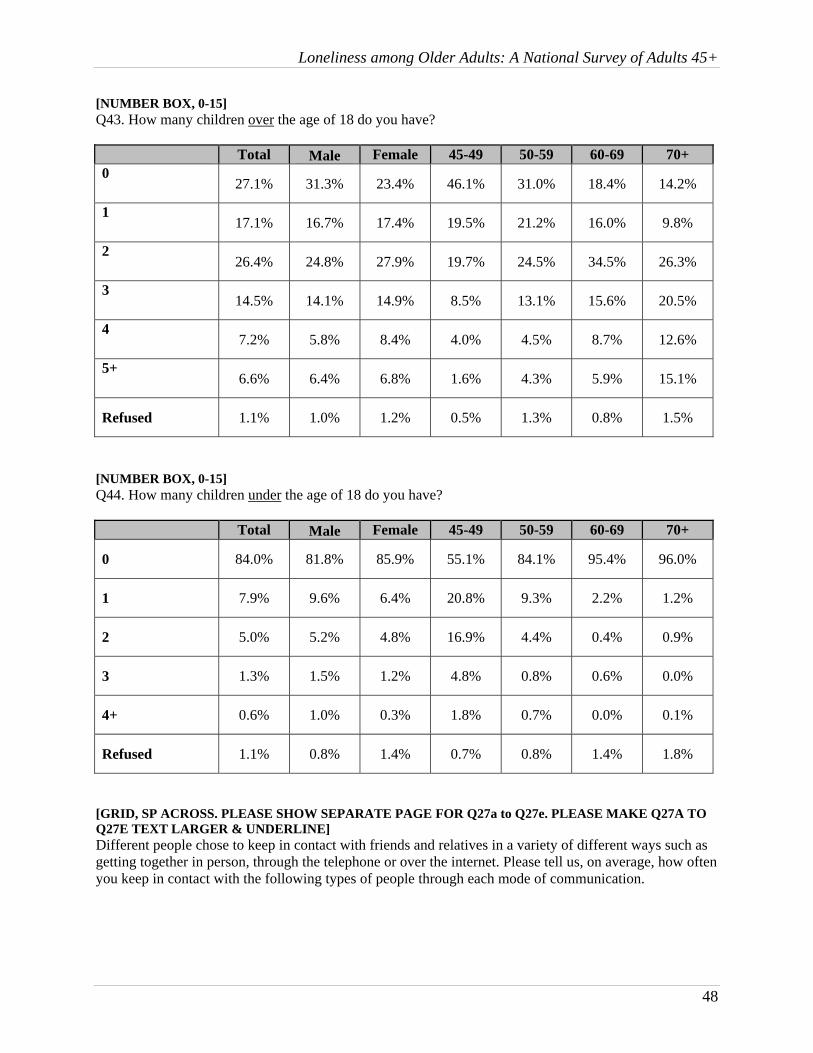
[NUMBER BOX, 0-15] Q43. How many children over the age of 18 do you have? Total Male Female 45-49 50-59 60-69 70+ 0
27.1% 31.3% 23.4% 46.1% 31.0% 18.4% 14.2%
1 17.1% 16.7% 17.4% 19.5% 21.2% 16.0% 9.8%
2 26.4% 24.8% 27.9% 19.7% 24.5% 34.5% 26.3%
3 14.5% 14.1% 14.9% 8.5% 13.1% 15.6% 20.5%
4 7.2% 5.8% 8.4% 4.0% 4.5% 8.7% 12.6%
5+ 6.6% 6.4% 6.8% 1.6% 4.3% 5.9% 15.1%
Refused 1.1% 1.0% 1.2% 0.5% 1.3% 0.8% 1.5%
[NUMBER BOX, 0-15] Q44. How many children under the age of 18 do you have? Total Male Female 45-49 50-59 60-69 70+
0 84.0% 81.8% 85.9% 55.1% 84.1% 95.4% 96.0%
1 7.9% 9.6% 6.4% 20.8% 9.3% 2.2% 1.2%
2 5.0% 5.2% 4.8% 16.9% 4.4% 0.4% 0.9%
3 1.3% 1.5% 1.2% 4.8% 0.8% 0.6% 0.0%
4+ 0.6% 1.0% 0.3% 1.8% 0.7% 0.0% 0.1%
Refused 1.1% 0.8% 1.4% 0.7% 0.8% 1.4% 1.8%
[GRID, SP ACROSS. PLEASE SHOW SEPARATE PAGE FOR Q27a to Q27e. PLEASE MAKE Q27A TO Q27E TEXT LARGER & UNDERLINE] Different people chose to keep in contact with friends and relatives in a variety of different ways such as getting together in person, through the telephone or over the internet. Please tell us, on average, how often you keep in contact with the following types of people through each mode of communication.
Loneliness among Older Adults: A National Survey of Adults 45+
49
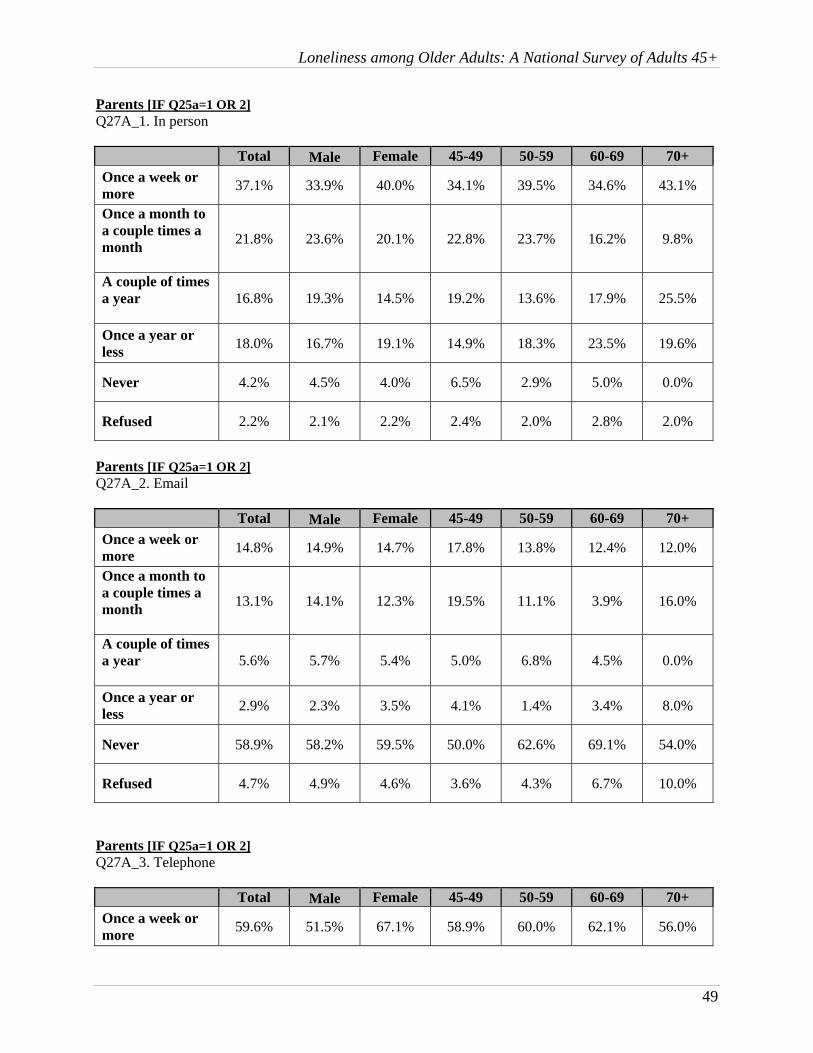
Parents [IF Q25a=1 OR 2] Q27A_1. In person Total Male Female 45-49 50-59 60-69 70+
Once a week or more
37.1% 33.9% 40.0% 34.1% 39.5% 34.6% 43.1%
Once a month to a couple times a month
21.8% 23.6% 20.1% 22.8% 23.7% 16.2% 9.8%
A couple of times a year
16.8% 19.3% 14.5% 19.2% 13.6% 17.9% 25.5%
Once a year or less
18.0% 16.7% 19.1% 14.9% 18.3% 23.5% 19.6%
Never 4.2% 4.5% 4.0% 6.5% 2.9% 5.0% 0.0%
Refused 2.2% 2.1% 2.2% 2.4% 2.0% 2.8% 2.0%
Parents [IF Q25a=1 OR 2] Q27A_2. Email Total Male Female 45-49 50-59 60-69 70+
Once a week or more
14.8% 14.9% 14.7% 17.8% 13.8% 12.4% 12.0%
Once a month to a couple times a month
13.1% 14.1% 12.3% 19.5% 11.1% 3.9% 16.0%
A couple of times a year
5.6% 5.7% 5.4% 5.0% 6.8% 4.5% 0.0%
Once a year or less
2.9% 2.3% 3.5% 4.1% 1.4% 3.4% 8.0%
Never 58.9% 58.2% 59.5% 50.0% 62.6% 69.1% 54.0%
Refused 4.7% 4.9% 4.6% 3.6% 4.3% 6.7% 10.0%
Parents [IF Q25a=1 OR 2] Q27A_3. Telephone Total Male Female 45-49 50-59 60-69 70+
Once a week or more
59.6% 51.5% 67.1% 58.9% 60.0% 62.1% 56.0%
Loneliness among Older Adults: A National Survey of Adults 45+
50
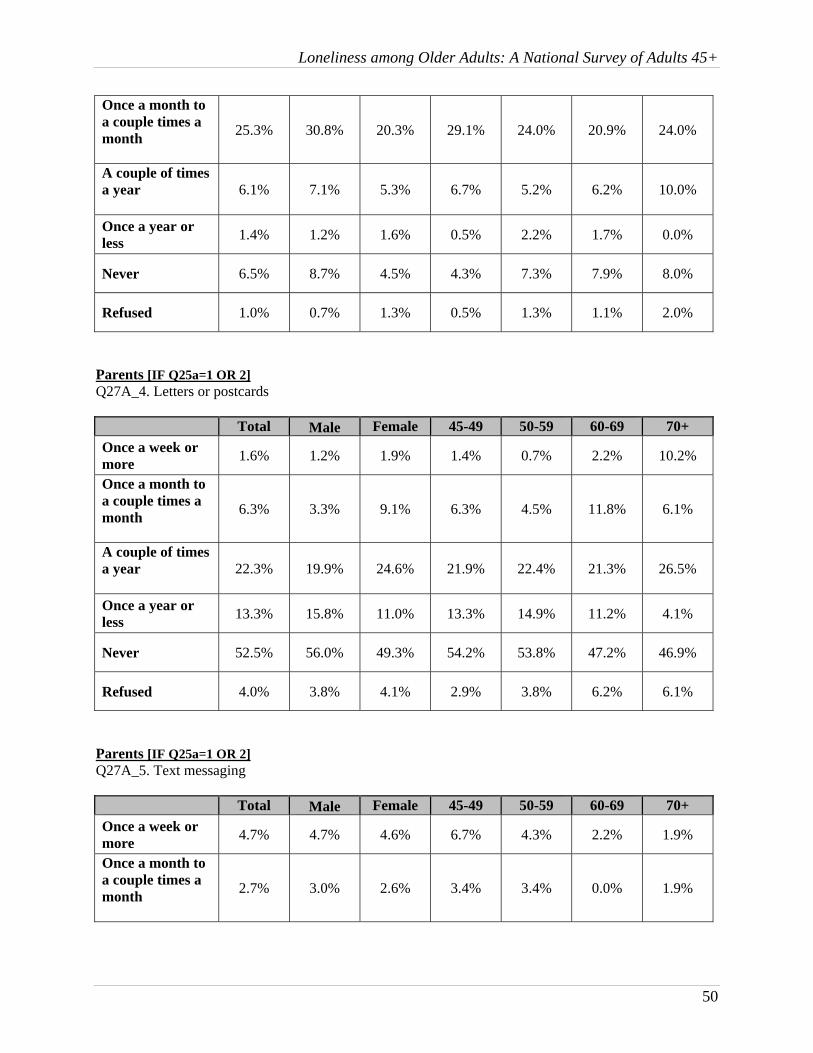
Once a month to a couple times a month
25.3% 30.8% 20.3% 29.1% 24.0% 20.9% 24.0%
A couple of times a year
6.1% 7.1% 5.3% 6.7% 5.2% 6.2% 10.0%
Once a year or less
1.4% 1.2% 1.6% 0.5% 2.2% 1.7% 0.0%
Never 6.5% 8.7% 4.5% 4.3% 7.3% 7.9% 8.0%
Refused 1.0% 0.7% 1.3% 0.5% 1.3% 1.1% 2.0%
Parents [IF Q25a=1 OR 2] Q27A_4. Letters or postcards Total Male Female 45-49 50-59 60-69 70+
Once a week or more
1.6% 1.2% 1.9% 1.4% 0.7% 2.2% 10.2%
Once a month to a couple times a month
6.3% 3.3% 9.1% 6.3% 4.5% 11.8% 6.1%
A couple of times a year
22.3% 19.9% 24.6% 21.9% 22.4% 21.3% 26.5%
Once a year or less
13.3% 15.8% 11.0% 13.3% 14.9% 11.2% 4.1%
Never 52.5% 56.0% 49.3% 54.2% 53.8% 47.2% 46.9%
Refused 4.0% 3.8% 4.1% 2.9% 3.8% 6.2% 6.1%
Parents [IF Q25a=1 OR 2] Q27A_5. Text messaging Total Male Female 45-49 50-59 60-69 70+
Once a week or more
4.7% 4.7% 4.6% 6.7% 4.3% 2.2% 1.9%
Once a month to a couple times a month
2.7% 3.0% 2.6% 3.4% 3.4% 0.0% 1.9%
Loneliness among Older Adults: A National Survey of Adults 45+
51
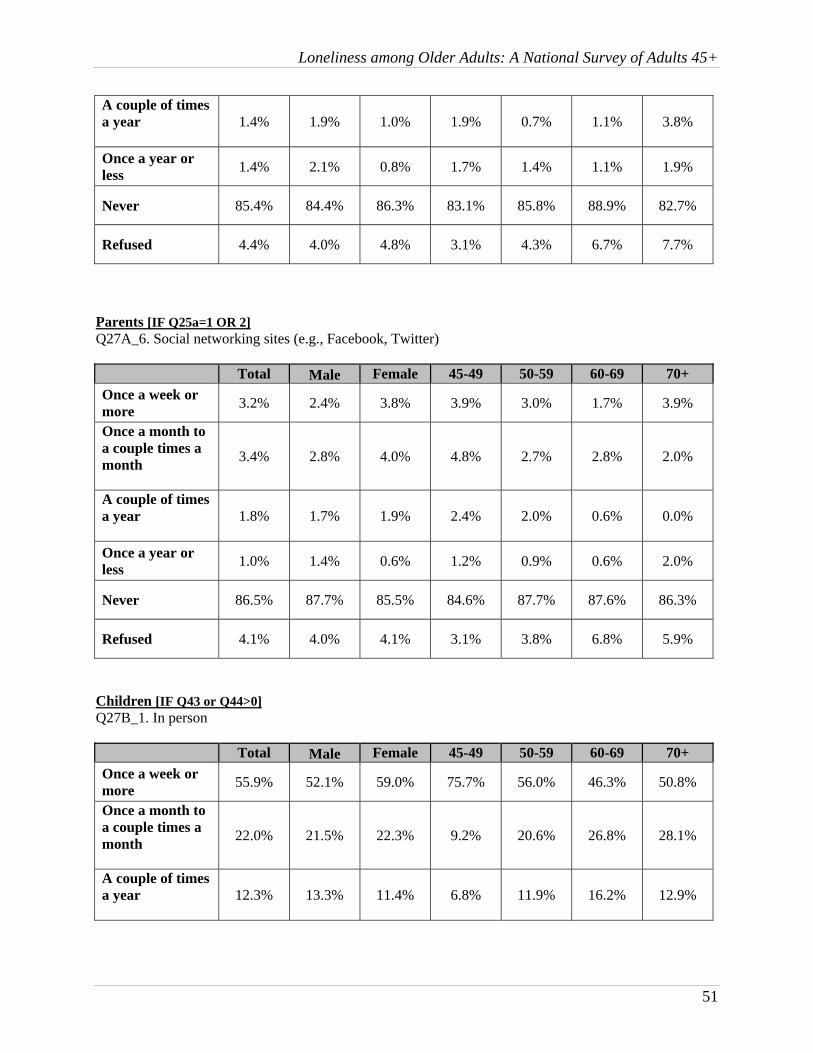
A couple of times a year
1.4% 1.9% 1.0% 1.9% 0.7% 1.1% 3.8%
Once a year or less
1.4% 2.1% 0.8% 1.7% 1.4% 1.1% 1.9%
Never 85.4% 84.4% 86.3% 83.1% 85.8% 88.9% 82.7%
Refused 4.4% 4.0% 4.8% 3.1% 4.3% 6.7% 7.7%
Parents [IF Q25a=1 OR 2] Q27A_6. Social networking sites (e.g., Facebook, Twitter) Total Male Female 45-49 50-59 60-69 70+
Once a week or more
3.2% 2.4% 3.8% 3.9% 3.0% 1.7% 3.9%
Once a month to a couple times a month
3.4% 2.8% 4.0% 4.8% 2.7% 2.8% 2.0%
A couple of times a year
1.8% 1.7% 1.9% 2.4% 2.0% 0.6% 0.0%
Once a year or less
1.0% 1.4% 0.6% 1.2% 0.9% 0.6% 2.0%
Never 86.5% 87.7% 85.5% 84.6% 87.7% 87.6% 86.3%
Refused 4.1% 4.0% 4.1% 3.1% 3.8% 6.8% 5.9%
Children [IF Q43 or Q44>0] Q27B_1. In person Total Male Female 45-49 50-59 60-69 70+
Once a week or more
55.9% 52.1% 59.0% 75.7% 56.0% 46.3% 50.8%
Once a month to a couple times a month
22.0% 21.5% 22.3% 9.2% 20.6% 26.8% 28.1%
A couple of times a year
12.3% 13.3% 11.4% 6.8% 11.9% 16.2% 12.9%
Loneliness among Older Adults: A National Survey of Adults 45+
52
Once a year or less
5.8% 7.3% 4.5% 2.4% 7.1% 6.7% 5.9%
Never 2.7% 4.3% 1.3% 3.5% 3.8% 2.1% 1.0%
Refused 1.4% 1.4% 1.3% 2.4% 0.5% 1.9% 1.2%
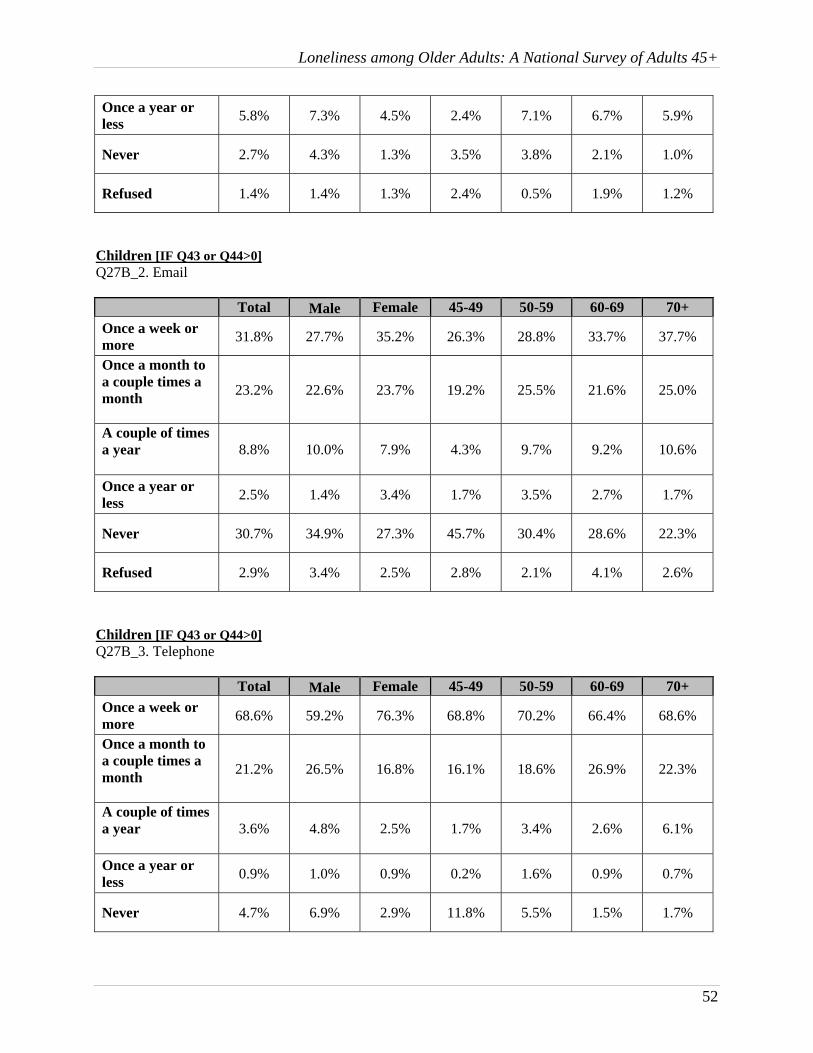
Children [IF Q43 or Q44>0] Q27B_2. Email Total Male Female 45-49 50-59 60-69 70+
Once a week or more
31.8% 27.7% 35.2% 26.3% 28.8% 33.7% 37.7%
Once a month to a couple times a month
23.2% 22.6% 23.7% 19.2% 25.5% 21.6% 25.0%
A couple of times a year
8.8% 10.0% 7.9% 4.3% 9.7% 9.2% 10.6%
Once a year or less
2.5% 1.4% 3.4% 1.7% 3.5% 2.7% 1.7%
Never 30.7% 34.9% 27.3% 45.7% 30.4% 28.6% 22.3%
Refused 2.9% 3.4% 2.5% 2.8% 2.1% 4.1% 2.6%
Children [IF Q43 or Q44>0] Q27B_3. Telephone Total Male Female 45-49 50-59 60-69 70+
Once a week or more
68.6% 59.2% 76.3% 68.8% 70.2% 66.4% 68.6%
Once a month to a couple times a month
21.2% 26.5% 16.8% 16.1% 18.6% 26.9% 22.3%
A couple of times a year
3.6% 4.8% 2.5% 1.7% 3.4% 2.6% 6.1%
Once a year or less
0.9% 1.0% 0.9% 0.2% 1.6% 0.9% 0.7%
Never 4.7% 6.9% 2.9% 11.8% 5.5% 1.5% 1.7%

Loneliness among Older Adults: A National Survey of Adults 45+
53
Refused 1.0% 1.4% 0.6% 1.4% 0.7% 1.7% 0.5%
Children [IF Q43 or Q44>0] Q27B_4. Letters or postcards Total Male Female 45-49 50-59 60-69 70+
Once a week or more
1.7% 1.8% 1.6% 3.1% 2.1% 1.2% 0.9%
Once a month to a couple times a month
6.6% 3.5% 9.1% 4.5% 6.0% 7.2% 8.0%
A couple of times a year
23.5% 18.6% 27.5% 17.3% 19.1% 25.9% 31.5%
Once a year or less
15.2% 14.9% 15.5% 12.1% 15.7% 12.5% 19.5%
Never 49.3% 57.2% 42.7% 60.0% 52.9% 48.5% 37.4%
Refused 3.7% 4.0% 3.5% 3.1% 4.2% 4.6% 2.8%
Children [IF Q43 or Q44>0] Q27B_5. Text messaging Total Male Female 45-49 50-59 60-69 70+
Once a week or more
19.8% 16.7% 22.4% 37.0% 28.4% 10.4% 5.6%
Once a month to a couple times a month
8.9% 9.0% 8.8% 11.1% 11.4% 9.6% 3.3%
A couple of times a year
3.2% 4.0% 2.5% 3.1% 4.4% 3.8% 1.0%
Once a year or less
1.9% 2.6% 1.4% 1.2% 2.0% 2.6% 1.9%
Never 62.9% 64.1% 61.8% 46.0% 50.1% 69.3% 85.2%
Refused 3.3% 3.6% 3.1% 1.7% 3.7% 4.3% 3.0%

Loneliness among Older Adults: A National Survey of Adults 45+
54
Children [IF Q43 or Q44>0] Q27B_6. Social networking sites (e.g., Facebook, Twitter) Total Male Female 45-49 50-59 60-69 70+
Once a week or more
12.8% 10.2% 15.0% 17.0% 17.6% 8.0% 8.2%
Once a month to a couple times a month
8.9% 8.6% 9.2% 7.6% 12.6% 9.2% 4.9%
A couple of times a year
2.5% 3.0% 2.1% 1.9% 2.5% 3.4% 1.9%
Once a year or less
1.8% 1.8% 1.9% 0.7% 1.9% 1.9% 2.8%
Never 70.5% 73.2% 68.3% 68.6% 62.8% 72.9% 79.6%
Refused 3.4% 3.2% 3.4% 4.3% 2.5% 4.5% 2.6%
Siblings [IF Q26>0] Q27C_1. In person Total Male Female 45-49 50-59 60-69 70+
Once a week or more
20.7% 19.6% 21.6% 23.9% 18.9% 20.8% 20.7%
Once a month to a couple times a month
22.0% 22.1% 21.8% 25.2% 21.5% 19.2% 23.0%
A couple of times a year
26.3% 27.0% 25.7% 27.3% 28.9% 25.7% 21.6%
Once a year or less
20.6% 20.2% 20.9% 13.8% 21.3% 25.1% 20.1%
Never 8.8% 9.4% 8.3% 8.4% 8.3% 7.7% 11.5%
Refused 1.7% 1.7% 1.6% 1.3% 1.1% 1.5% 3.2%

Loneliness among Older Adults: A National Survey of Adults 45+
55
Siblings [IF Q26>0] Q27C_2. Email Total Male Female 45-49 50-59 60-69 70+
Once a week or more
16.7% 14.9% 18.2% 17.6% 14.9% 17.7% 17.8%
Once a month to a couple times a month
25.7% 23.6% 27.6% 24.3% 29.0% 24.2% 23.3%
A couple of times a year
11.6% 12.9% 10.5% 14.6% 13.5% 9.6% 7.8%
Once a year or less
4.6% 6.0% 3.4% 5.6% 4.5% 4.2% 4.2%
Never 39.0% 39.5% 38.6% 36.0% 36.2% 42.0% 43.3%
Refused 2.3% 3.1% 1.7% 1.9% 1.8% 2.3% 3.5%
Siblings [IF Q26>0] Q27C_3. Telephone Total Male Female 45-49 50-59 60-69 70+
Once a week or more
34.3% 27.4% 40.2% 37.1% 31.4% 34.1% 37.0%
Once a month to a couple times a month
35.2% 36.0% 34.6% 35.8% 36.0% 37.1% 31.0%
A couple of times a year
16.8% 21.2% 12.9% 14.7% 19.3% 15.5% 15.7%
Once a year or less
4.4% 4.9% 3.9% 4.4% 3.7% 5.4% 4.4%
Never 7.9% 8.8% 7.1% 7.6% 8.3% 6.8% 8.8%
Refused 1.5% 1.6% 1.3% 0.4% 1.3% 1.1% 3.2%

Loneliness among Older Adults: A National Survey of Adults 45+
56
Siblings [IF Q26>0] Q27C_4. Letters or postcards Total Male Female 45-49 50-59 60-69 70+
Once a week or more
0.8% 0.7% 1.0% 0.8% 1.0% 0.6% 0.9%
Once a month to a couple times a month
4.8% 2.9% 6.5% 3.4% 4.0% 5.4% 6.7%
A couple of times a year
22.4% 17.6% 26.7% 22.2% 20.2% 22.1% 27.1%
Once a year or less
17.8% 18.3% 17.5% 16.5% 17.2% 19.1% 18.8%
Never 50.4% 56.7% 45.0% 53.6% 53.9% 48.9% 43.0%
Refused 3.6% 3.9% 3.4% 3.4% 3.7% 3.9% 3.5%
Siblings [IF Q26>0] Q27C_5. Text messaging Total Male Female 45-49 50-59 60-69 70+
Once a week or more
5.4% 3.0% 7.4% 11.7% 6.6% 2.4% 0.9%
Once a month to a couple times a month
6.8% 5.6% 7.8% 12.8% 9.1% 2.6% 2.5%
A couple of times a year
3.6% 4.5% 2.9% 6.5% 4.8% 1.8% 0.9%
Once a year or less
2.3% 2.4% 2.3% 4.0% 2.2% 1.8% 1.4%
Never 78.7% 81.0% 76.6% 62.9% 74.3% 87.8% 90.1%
Refused 3.2% 3.5% 3.0% 2.1% 3.0% 3.6% 4.2%

Loneliness among Older Adults: A National Survey of Adults 45+
57
Siblings [IF Q26>0] Q27C_6. Social networking sites (e.g., Facebook, Twitter) Total Male Female 45-49 50-59 60-69 70+
Once a week or more
6.2% 4.7% 7.4% 8.4% 8.1% 4.4% 2.8%
Once a month to a couple times a month
6.9% 6.0% 7.8% 12.2% 8.2% 3.0% 4.1%
A couple of times a year
3.3% 3.8% 2.9% 5.7% 3.5% 3.5% 0.7%
Once a year or less
1.6% 1.9% 1.4% 1.7% 2.4% 0.8% 1.4%
Never 78.6% 79.9% 77.5% 69.6% 75.0% 84.8% 86.0%
Refused 3.4% 3.8% 3.0% 2.3% 2.8% 3.6% 4.9%
Friends Q27D_1. In person Total Male Female 45-49 50-59 60-69 70+
Once a week or more
51.5% 49.8% 53.0% 51.4% 51.5% 51.6% 51.4%
Once a month to a couple times a month
28.6% 28.9% 28.4% 28.8% 28.4% 31.3% 26.1%
A couple of times a year
10.8% 11.7% 10.1% 9.9% 12.2% 11.1% 9.3%
Once a year or less
4.9% 4.9% 4.9% 7.1% 4.0% 3.3% 6.1%
Never 2.7% 3.3% 2.3% 2.1% 3.2% 1.4% 3.7%
Refused 1.5% 1.5% 1.4% 0.7% 0.7% 1.4% 3.4%

Loneliness among Older Adults: A National Survey of Adults 45+
58
Friends Q27D_2. Email Total Male Female 45-49 50-59 60-69 70+
Once a week or more
34.4% 31.8% 36.7% 32.4% 34.9% 33.3% 36.5%
Once a month to a couple times a month
27.8% 26.0% 29.4% 28.5% 28.6% 28.1% 25.7%
A couple of times a year
7.8% 8.9% 6.9% 8.8% 8.7% 7.7% 5.9%
Once a year or less
2.6% 3.3% 1.9% 2.5% 2.9% 2.2% 2.7%
Never 25.2% 27.4% 23.3% 25.9% 23.8% 25.7% 26.3%
Refused 2.2% 2.6% 1.8% 1.9% 1.2% 2.9% 2.8%
Friends Q27D_3. Telephone Total Male Female 45-49 50-59 60-69 70+
Once a week or more
46.9% 41.1% 52.0% 45.1% 45.5% 50.6% 46.7%
Once a month to a couple times a month
32.5% 32.8% 32.2% 36.2% 32.4% 30.6% 31.6%
A couple of times a year
11.3% 14.1% 8.9% 9.7% 12.4% 11.9% 10.5%
Once a year or less
3.4% 4.1% 2.8% 3.7% 4.8% 1.5% 3.1%
Never 4.3% 6.0% 2.8% 3.7% 3.8% 4.3% 5.5%
Refused 1.6% 1.9% 1.3% 1.6% 1.1% 1.1% 2.7%

Loneliness among Older Adults: A National Survey of Adults 45+
59
Friends Q27D_4. Letters or postcards Total Male Female 45-49 50-59 60-69 70+
Once a week or more
2.0% 1.6% 2.4% 2.6% 2.2% 1.5% 1.6%
Once a month to a couple times a month
5.7% 3.0% 8.1% 5.3% 4.6% 5.2% 8.3%
A couple of times a year
21.5% 15.1% 27.3% 15.5% 20.5% 23.9% 25.8%
Once a year or less
18.4% 18.1% 18.6% 16.8% 16.8% 18.9% 21.8%
Never 48.6% 57.9% 40.5% 56.4% 52.8% 46.7% 37.8%
Refused 3.7% 4.4% 3.1% 3.4% 3.1% 3.7% 4.7%
Friends Q27D_5. Text messaging Total Male Female 45-49 50-59 60-69 70+
Once a week or more
9.9% 9.1% 10.6% 21.7% 12.2% 5.1% 1.5%
Once a month to a couple times a
month
9.1% 8.9% 9.3% 15.3% 12.0% 5.1% 3.7%
A couple of times a year
3.1% 3.3% 2.9% 3.5% 4.5% 2.4% 1.3%
Once a year or less
2.8% 2.9% 2.6% 2.8% 3.4% 2.4% 1.9%
Never 71.7% 72.0% 71.4% 53.3% 65.2% 81.1% 87.3%
Refused 3.4% 3.7% 3.1% 3.4% 2.6% 4.0% 4.3%

Loneliness among Older Adults: A National Survey of Adults 45+
60
Friends Q27D_6. Social networking sites (e.g., Facebook, Twitter) Total Male Female 45-49 50-59 60-69 70+
Once a week or more
12.2% 9.8% 14.3% 17.4% 18.0% 6.8% 4.4%
Once a month to a couple times a month
10.1% 10.1% 10.1% 16.7% 11.0% 7.5% 6.2%
A couple of times a year
3.6% 4.0% 3.3% 4.6% 4.3% 3.6% 1.8%
Once a year or less
2.1% 2.3% 2.0% 2.8% 1.9% 1.8% 2.2%
Never 68.8% 70.3% 67.5% 55.8% 62.7% 77.1% 80.1%
Refused 3.2% 3.5% 2.9% 2.6% 2.2% 3.2% 5.2%
[NUMBER BOX, 0-500] Q28. How many people do you have in your life with whom you most often discuss matters of personal importance? Total Male Female 45-49 50-59 60-69 70+
0 3.7% 5.5% 2.0% 3.0% 3.8% 4.6% 3.0%
1 15.9% 20.9% 11.4% 15.6% 15.9% 16.6% 15.1%
2 20.1% 21.6% 18.7% 18.6% 20.3% 19.9% 21.2%
3 19.7% 18.4% 20.9% 23.0% 20.5% 16.9% 19.0%
4 12.0% 10.0% 13.8% 12.7% 11.6% 11.8% 12.3%
5 12.0% 9.1% 14.6% 10.9% 13.3% 13.3% 9.6%
6+ 15.8% 13.6% 17.8% 14.9% 13.5% 16.1% 19.7%
Refused 0.8% 0.9% 0.8% 1.2% 1.0% 0.8% 0.1%

Loneliness among Older Adults: A National Survey of Adults 45+
61
[IF Q28>0] [MP] Q29. What is your relationship to these individuals? Total Male Female 45-49 50-59 60-69 70+
Friend
65.3% 58.2% 71.5% 64.1% 67.3% 66.8% 61.8%
Spouse or partner
55.8% 66.0% 47.2% 62.7% 55.9% 56.8% 49.0%
Child
41.0% 30.8% 49.6% 28.7% 35.2% 45.2% 55.4%
Parent
20.1% 18.0% 21.9% 37.9% 26.3% 9.2% 7.2%
Other relative
38.2% 31.9% 43.6% 38.1% 36.1% 41.4% 38.2%
Neighbor
9.4% 8.4% 10.2% 5.3% 7.8% 10.8% 13.8%
Coworker
9.0% 8.5% 9.4% 13.4% 12.8% 6.4% 2.1%
Other
6.3% 5.8% 6.8% 6.3% 6.6% 4.4% 7.8%
Refused 0.3% 0.3% 0.3% 0.2% 0.3% 0.1% 0.5%

Loneliness among Older Adults: A National Survey of Adults 45+
62
[NUMBER BOX, 0-500] Q30. How many people do you have in your life who have been very supportive of you during the past year? Total Male Female 45-49 50-59 60-69 70+
N
0 2.9% 4.8% 1.3% 3.2% 3.3% 3.0% 2.1%
1 9.2% 12.8% 6.1% 9.9% 11.0% 9.0% 6.4%
2 11.2% 12.7% 9.9% 9.5% 13.9% 9.5% 10.5%
3 12.5% 13.4% 11.7% 14.8% 11.1% 12.3% 12.7%
4 11.4% 9.8% 12.8% 11.8% 11.7% 12.7% 9.3%
5 13.1% 11.5% 14.5% 13.0% 12.7% 13.5% 13.3%
6+ 38.2% 33.5% 42.4% 36.8% 35.0% 38.7% 43.9%
Refused 1.4% 1.5% 1.4% 1.1% 1.3% 1.4% 1.8%
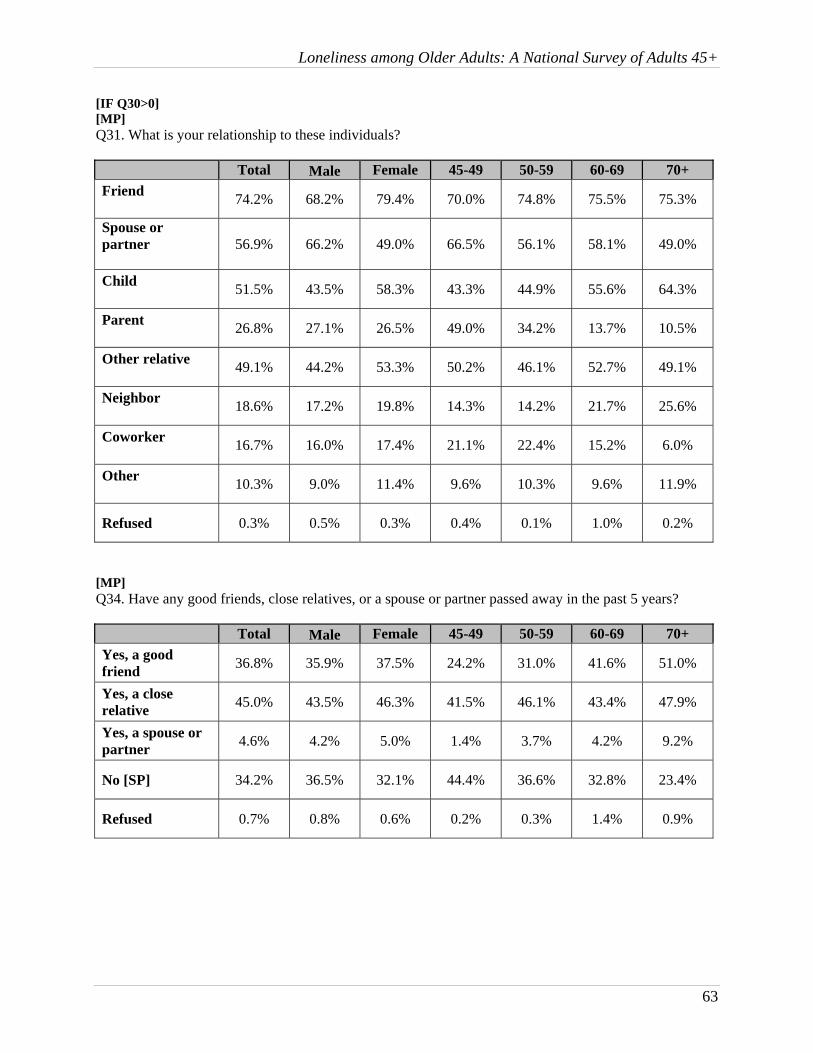
Loneliness among Older Adults: A National Survey of Adults 45+
63
[IF Q30>0] [MP] Q31. What is your relationship to these individuals? Total Male Female 45-49 50-59 60-69 70+
Friend
74.2% 68.2% 79.4% 70.0% 74.8% 75.5% 75.3%
Spouse or partner
56.9% 66.2% 49.0% 66.5% 56.1% 58.1% 49.0%
Child
51.5% 43.5% 58.3% 43.3% 44.9% 55.6% 64.3%
Parent
26.8% 27.1% 26.5% 49.0% 34.2% 13.7% 10.5%
Other relative
49.1% 44.2% 53.3% 50.2% 46.1% 52.7% 49.1%
Neighbor
18.6% 17.2% 19.8% 14.3% 14.2% 21.7% 25.6%
Coworker
16.7% 16.0% 17.4% 21.1% 22.4% 15.2% 6.0%
Other
10.3% 9.0% 11.4% 9.6% 10.3% 9.6% 11.9%
Refused 0.3% 0.5% 0.3% 0.4% 0.1% 1.0% 0.2%
[MP] Q34. Have any good friends, close relatives, or a spouse or partner passed away in the past 5 years? Total Male Female 45-49 50-59 60-69 70+
Yes, a good friend
36.8% 35.9% 37.5% 24.2% 31.0% 41.6% 51.0%
Yes, a close relative
45.0% 43.5% 46.3% 41.5% 46.1% 43.4% 47.9%
Yes, a spouse or partner
4.6% 4.2% 5.0% 1.4% 3.7% 4.2% 9.2%
No [SP] 34.2% 36.5% 32.1% 44.4% 36.6% 32.8% 23.4%
Refused 0.7% 0.8% 0.6% 0.2% 0.3% 1.4% 0.9%

Loneliness among Older Adults: A National Survey of Adults 45+
64
[MP] Q35. Have any good friends or close relatives moved away from you in the past 5 years? Total Male Female 45-49 50-59 60-69 70+
Yes, a good friend
18.9% 16.3% 21.2% 19.6% 19.9% 16.5% 19.5%
Yes, a close relative
14.0% 13.1% 14.7% 13.4% 14.4% 14.1% 13.5%
No [SP] 69.7% 72.8% 66.9% 70.4% 69.3% 70.5% 68.6%
Refused 1.0% 1.4% 0.6% 0.7% 0.5% 1.5% 1.3%
[SP] Q38. Would you say that you have more friends, fewer friends, or about the same number of friends as you did 5 years ago? Total Male Female 45-49 50-59 60-69 70+
More 19.9% 18.3% 21.4% 21.2% 20.5% 18.5% 19.7%
Fewer 23.2% 22.9% 23.4% 25.0% 23.6% 19.6% 24.7%
About the same 56.4% 58.2% 54.7% 53.1% 55.6% 61.5% 54.4%
Refused 0.5% 0.6% 0.5% 0.7% 0.3% 0.3% 1.2%
[SP] Q39. Are you currently providing unpaid care to an adult relative or friend in order to help them care for themselves? Unpaid care may include help with personal needs or household chores, managing finances, arranging for outside services, or regularly visiting to see how they are doing. This person need not live with you. Total Male Female 45-49 50-59 60-69 70+
Yes 19.5% 16.2% 22.5% 19.7% 19.6% 19.9% 18.8%
No 79.6% 82.5% 77.0% 79.8% 79.7% 79.4% 79.6%
Refused 0.9% 1.3% 0.5% 0.5% 0.7% 0.7% 1.6%
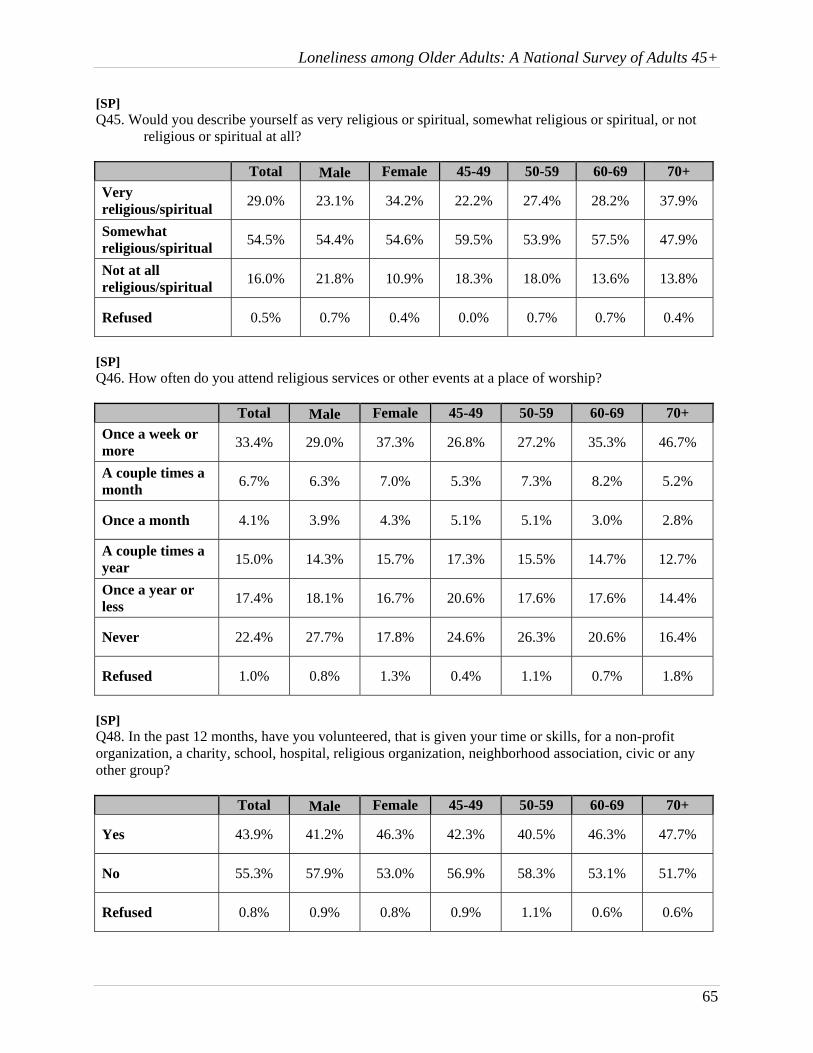
Loneliness among Older Adults: A National Survey of Adults 45+
65
[SP] Q45. Would you describe yourself as very religious or spiritual, somewhat religious or spiritual, or not religious or spiritual at all? Total Male Female 45-49 50-59 60-69 70+
Very religious/spiritual
29.0% 23.1% 34.2% 22.2% 27.4% 28.2% 37.9%
Somewhat religious/spiritual
54.5% 54.4% 54.6% 59.5% 53.9% 57.5% 47.9%
Not at all religious/spiritual
16.0% 21.8% 10.9% 18.3% 18.0% 13.6% 13.8%
Refused 0.5% 0.7% 0.4% 0.0% 0.7% 0.7% 0.4%
[SP] Q46. How often do you attend religious services or other events at a place of worship? Total Male Female 45-49 50-59 60-69 70+
Once a week or more
33.4% 29.0% 37.3% 26.8% 27.2% 35.3% 46.7%
A couple times a month
6.7% 6.3% 7.0% 5.3% 7.3% 8.2% 5.2%
Once a month 4.1% 3.9% 4.3% 5.1% 5.1% 3.0% 2.8%
A couple times a year
15.0% 14.3% 15.7% 17.3% 15.5% 14.7% 12.7%
Once a year or less
17.4% 18.1% 16.7% 20.6% 17.6% 17.6% 14.4%
Never 22.4% 27.7% 17.8% 24.6% 26.3% 20.6% 16.4%
Refused 1.0% 0.8% 1.3% 0.4% 1.1% 0.7% 1.8%
[SP] Q48. In the past 12 months, have you volunteered, that is given your time or skills, for a non-profit organization, a charity, school, hospital, religious organization, neighborhood association, civic or any other group? Total Male Female 45-49 50-59 60-69 70+
Yes 43.9% 41.2% 46.3% 42.3% 40.5% 46.3% 47.7%
No 55.3% 57.9% 53.0% 56.9% 58.3% 53.1% 51.7%
Refused 0.8% 0.9% 0.8% 0.9% 1.1% 0.6% 0.6%

Loneliness among Older Adults: A National Survey of Adults 45+
66
[SP] Q50. Do you belong to any local community organizations, clubs, or groups such as Kiwanis, book clubs, gardening groups, or other social groups? If so, how many? Total Male Female 45-49 50-59 60-69 70+
0 73.9% 76.1% 72.0% 81.0% 79.8% 69.6% 63.7%
1 14.6% 13.1% 15.8% 12.1% 12.0% 16.2% 18.8%
2 7.0% 6.1% 7.8% 4.0% 5.3% 9.1% 9.9%
3 or more 3.8% 3.6% 3.9% 1.8% 2.8% 4.1% 6.7%
Refused 0.7% 1.1% 0.4% 1.1% 0.2% 1.0% 0.9%
[SP] Q51. How many hours per week do you spend watching television, including news and sports? Total Male Female 45-49 50-59 60-69 70+
None 2.6% 2.3% 2.9% 4.2% 3.1% 1.5% 1.8%
1-3
8.4% 7.5% 9.1% 11.1% 9.0% 6.6% 7.0%
4-6 13.5% 12.2% 14.6% 19.5% 13.3% 11.3% 10.8%
7-10 17.4% 18.3% 16.5% 19.5% 19.5% 15.7% 13.8%
11-15 15.5% 15.7% 15.3% 13.7% 15.2% 17.7% 15.1%
16-20 15.5% 16.6% 14.5% 12.5% 13.7% 17.0% 19.3%
21+ 26.6% 26.6% 26.6% 18.5% 25.8% 29.1% 32.0%
Refused 0.6% 0.7% 0.4% 0.9% 0.4% 1.0% 0.3%

Loneliness among Older Adults: A National Survey of Adults 45+
67
[SP] Q53. How many hours per week do you spend on hobbies? This could include activities such as sports, gardening, writing, photography, movie going, and other leisure pursuits. Total Male Female 45-49 50-59 60-69 70+
None 12.0% 13.7% 10.5% 9.8% 11.7% 10.1% 16.4%
1-3
24.9% 21.6% 27.9% 27.8% 26.6% 22.7% 22.2%
4-6 22.2% 20.6% 23.5% 24.4% 24.9% 19.9% 18.5%
7-10 17.7% 19.4% 16.3% 16.5% 18.7% 18.4% 16.3%
11-15 10.1% 10.0% 10.2% 9.1% 8.2% 12.0% 11.7%
16-20 5.3% 6.4% 4.3% 5.6% 4.3% 6.6% 5.0%
21+ 6.9% 7.2% 6.6% 4.6% 5.0% 9.7% 8.7%
Refused 1.0% 1.2% 0.8% 2.1% 0.7% 0.4% 1.0%
[IF PPWORK=1 OR 2] [SP] Q54. Are you retired from a previous career? Total Male Female 45-49 50-59 60-69 70+
Yes 16.6% 19.0% 14.3% 6.7% 10.7% 29.7% 57.7%
No 82.4% 80.1% 84.6% 91.7% 88.7% 68.7% 42.3%
Refused 1.0% 0.9% 1.1% 1.6% 0.6% 1.5% 0.0%
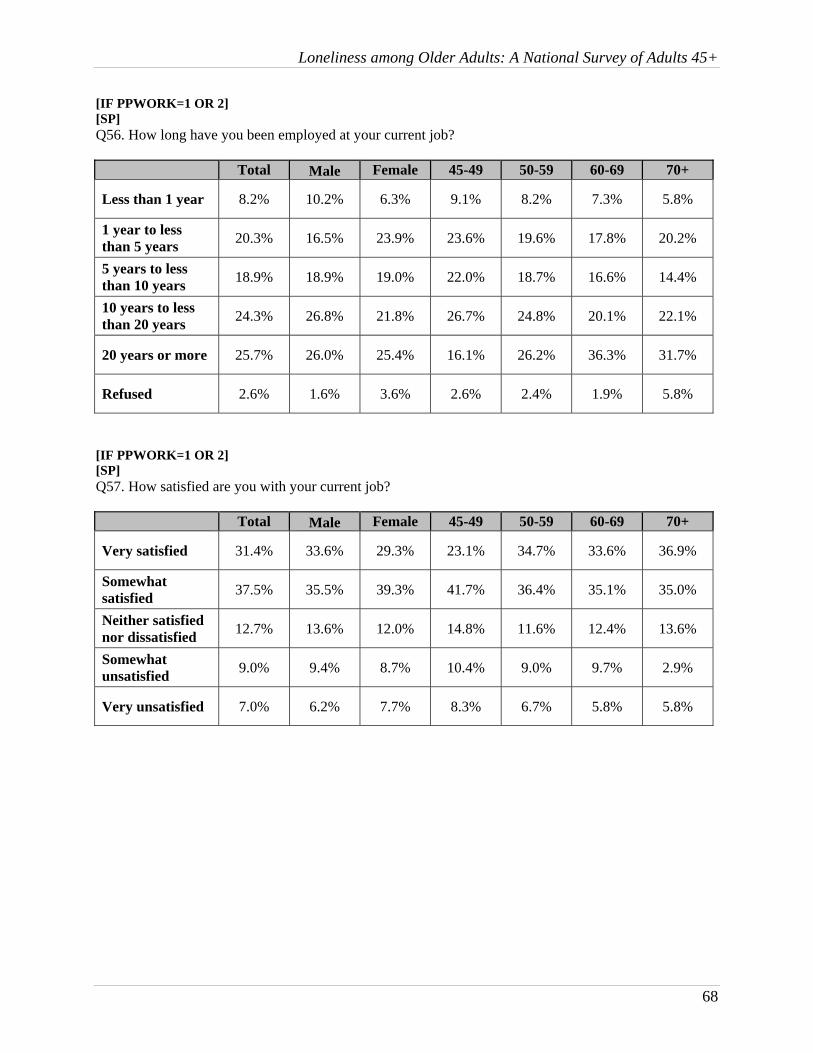
Loneliness among Older Adults: A National Survey of Adults 45+
68
[IF PPWORK=1 OR 2] [SP] Q56. How long have you been employed at your current job? Total Male Female 45-49 50-59 60-69 70+
Less than 1 year 8.2% 10.2% 6.3% 9.1% 8.2% 7.3% 5.8%
1 year to less than 5 years
20.3% 16.5% 23.9% 23.6% 19.6% 17.8% 20.2%
5 years to less than 10 years
18.9% 18.9% 19.0% 22.0% 18.7% 16.6% 14.4%
10 years to less than 20 years
24.3% 26.8% 21.8% 26.7% 24.8% 20.1% 22.1%
20 years or more 25.7% 26.0% 25.4% 16.1% 26.2% 36.3% 31.7%
Refused 2.6% 1.6% 3.6% 2.6% 2.4% 1.9% 5.8%
[IF PPWORK=1 OR 2] [SP] Q57. How satisfied are you with your current job? Total Male Female 45-49 50-59 60-69 70+
Very satisfied 31.4% 33.6% 29.3% 23.1% 34.7% 33.6% 36.9%
Somewhat satisfied
37.5% 35.5% 39.3% 41.7% 36.4% 35.1% 35.0%
Neither satisfied nor dissatisfied
12.7% 13.6% 12.0% 14.8% 11.6% 12.4% 13.6%
Somewhat unsatisfied
9.0% 9.4% 8.7% 10.4% 9.0% 9.7% 2.9%
Very unsatisfied 7.0% 6.2% 7.7% 8.3% 6.7% 5.8% 5.8%

Loneliness among Older Adults: A National Survey of Adults 45+
69
[IF PPWORK=5 OR Q54=1] [SP] Q61. How long have you been retired from your previous career? Total Male Female 45-49 50-59 60-69 70+
Less than 1 year 4.3% 4.7% 4.0% 6.7% 8.9% 5.2% 2.7%
More than 1 year but less than 5 years
18.7% 18.7% 18.7% 20.0% 35.0% 32.0% 6.7%
More than 5 years but less than 10 years
24.7% 24.0% 25.4% 63.3% 18.7% 33.3% 18.3%
10 years or more 51.5% 51.7% 51.2% 10.0% 35.0% 28.9% 71.5%
Refused 0.8% 0.9% 0.7% 0.0% 2.4% 0.5% 0.8%
[IF PPWORK=5 OR Q54=1] [SP] Q63. Have you stayed in contact with any of your former coworkers after your retirement? Total Male Female 45-49 50-59 60-69 70+
Yes, regularly 19.1% 12.2% 25.1% 3.3% 21.1% 22.7% 17.1%
Yes, occasionally 27.4% 28.6% 26.4% 36.7% 22.8% 32.3% 25.0%
Yes, once in a while
28.4% 33.5% 23.9% 40.0% 29.3% 25.3% 29.6%
No 24.4% 25.0% 23.9% 20.0% 26.0% 19.0% 27.8%
Refused 0.6% 0.6% 0.7% 0.0% 0.8% 0.8% 0.5%
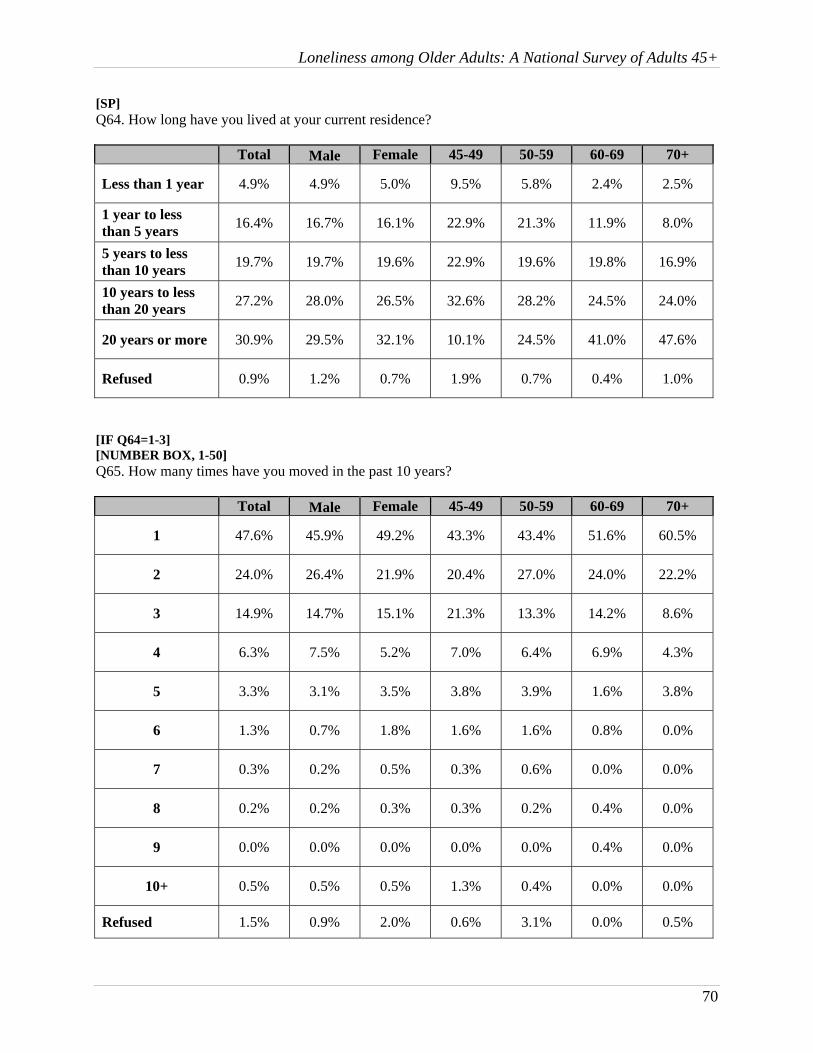
Loneliness among Older Adults: A National Survey of Adults 45+
70
[SP] Q64. How long have you lived at your current residence? Total Male Female 45-49 50-59 60-69 70+
Less than 1 year 4.9% 4.9% 5.0% 9.5% 5.8% 2.4% 2.5%
1 year to less than 5 years
16.4% 16.7% 16.1% 22.9% 21.3% 11.9% 8.0%
5 years to less than 10 years
19.7% 19.7% 19.6% 22.9% 19.6% 19.8% 16.9%
10 years to less than 20 years
27.2% 28.0% 26.5% 32.6% 28.2% 24.5% 24.0%
20 years or more 30.9% 29.5% 32.1% 10.1% 24.5% 41.0% 47.6%
Refused 0.9% 1.2% 0.7% 1.9% 0.7% 0.4% 1.0%
[IF Q64=1-3] [NUMBER BOX, 1-50] Q65. How many times have you moved in the past 10 years?
Total Male Female 45-49 50-59 60-69 70+
1 47.6% 45.9% 49.2% 43.3% 43.4% 51.6% 60.5%
2 24.0% 26.4% 21.9% 20.4% 27.0% 24.0% 22.2%
3 14.9% 14.7% 15.1% 21.3% 13.3% 14.2% 8.6%
4 6.3% 7.5% 5.2% 7.0% 6.4% 6.9% 4.3%
5 3.3% 3.1% 3.5% 3.8% 3.9% 1.6% 3.8%
6 1.3% 0.7% 1.8% 1.6% 1.6% 0.8% 0.0%
7 0.3% 0.2% 0.5% 0.3% 0.6% 0.0% 0.0%
8 0.2% 0.2% 0.3% 0.3% 0.2% 0.4% 0.0%
9 0.0% 0.0% 0.0% 0.0% 0.0% 0.4% 0.0%
10+ 0.5% 0.5% 0.5% 1.3% 0.4% 0.0% 0.0%
Refused 1.5% 0.9% 2.0% 0.6% 3.1% 0.0% 0.5%

Loneliness among Older Adults: A National Survey of Adults 45+
71
[SP] Q67. In general, how safe would you say you are from crime when walking in your neighborhood: would you say you are very safe, somewhat safe, not too safe, or not at all safe? Total Male Female 45-49 50-59 60-69 70+
Very safe 56.6% 60.8% 52.9% 53.8% 54.6% 60.0% 58.7%
Somewhat safe 37.3% 34.2% 39.9% 37.2% 40.2% 34.4% 35.7%
Not too safe 4.4% 3.4% 5.3% 6.5% 3.8% 3.7% 4.1%
Not at all Safe 1.2% 0.9% 1.4% 1.8% 0.7% 1.5% 1.0%
Refused 0.6% 0.6% 0.5% 0.7% 0.8% 0.3% 0.4%
[MP] Q69. Do you own any pets? If so, what kind? Total Male Female 45-49 50-59 60-69 70+
Dog 34.5% 33.9% 35.1% 44.4% 39.0% 31.5% 22.4%
Cat 28.1% 25.9% 30.1% 29.5% 32.8% 26.1% 21.9%
Bird 4.3% 4.8% 3.9% 3.5% 4.9% 4.6% 3.9%
Reptile 1.4% 2.1% 0.9% 2.1% 1.8% 1.2% 0.4%
Other 7.0% 7.2% 6.8% 10.9% 8.4% 5.7% 3.1%
None [SP] 44.1% 45.1% 43.3% 34.5% 38.2% 47.9% 57.4%
Refused 0.4% 0.7% 0.1% 0.4% 0.3% 0.3% 0.4%

Loneliness among Older Adults: A National Survey of Adults 45+
72
[GRID, SP ACROSS] The following statements describe how people sometimes feel. For each statement, please indicate how often you feel the way described. Q70_1. How often do you feel that you are "in tune" with the people around you? Total Male Female 45-49 50-59 60-69 70+
Never 1.3% 1.4% 1.2% 1.8% 1.9% 0.7% 0.7%
Rarely 7.3% 9.1% 5.8% 8.5% 9.5% 6.8% 3.7%
Sometimes 61.5% 62.8% 60.4% 66.9% 63.0% 60.3% 55.7%
Always 28.9% 25.3% 32.1% 21.0% 24.7% 31.5% 39.1%
Refused 1.0% 1.4% 0.6% 1.9% 0.9% 0.7% 0.7%
Q70_2. How often do you feel that you lack companionship? Total Male Female 45-49 50-59 60-69 70+
Never 26.1% 27.5% 24.8% 19.2% 24.2% 28.6% 32.0%
Rarely 29.5% 30.5% 28.6% 30.1% 28.3% 30.0% 30.2%
Sometimes 36.8% 33.9% 39.3% 40.8% 36.8% 36.4% 33.6%
Always 6.7% 6.9% 6.5% 8.1% 9.6% 4.7% 3.4%
Refused 1.0% 1.1% 0.8% 1.8% 1.1% 0.3% 0.7%
Q70_3. How often do you feel that there is no one you can turn to? Total Male Female 45-49 50-59 60-69 70+
Never 40.8% 42.4% 39.3% 31.2% 34.3% 45.6% 53.6%
Rarely 31.1% 30.1% 31.9% 31.9% 33.2% 29.3% 28.9%
Sometimes 23.2% 21.9% 24.4% 29.2% 26.1% 21.6% 15.6%
Always 4.1% 4.5% 3.7% 5.5% 5.6% 3.3% 1.2%
Refused 0.9% 1.1% 0.7% 2.3% 0.8% 0.1% 0.7%

Loneliness among Older Adults: A National Survey of Adults 45+
73
Q70_4. How often do you feel alone? Total Male Female 45-49 50-59 60-69 70+
Never 32.0% 34.1% 30.2% 29.3% 27.4% 34.9% 38.3%
Rarely 34.0% 33.5% 34.4% 32.0% 35.2% 34.4% 33.4%
Sometimes 27.5% 25.4% 29.4% 30.2% 30.1% 26.1% 22.9%
Always 5.1% 5.6% 4.6% 6.4% 6.1% 4.3% 3.3%
Refused 1.4% 1.4% 1.4% 2.1% 1.1% 0.3% 2.1%
Q70_5. How often do you feel part of a group of friends? Total Male Female 45-49 50-59 60-69 70+
Never 5.7% 6.8% 4.8% 4.9% 7.7% 4.8% 4.3%
Rarely 15.7% 17.5% 14.1% 19.9% 18.7% 12.0% 11.1%
Sometimes 46.8% 47.6% 46.0% 48.8% 45.7% 47.5% 45.9%
Always 29.7% 26.0% 33.0% 22.5% 26.0% 34.5% 36.4%
Refused 2.1% 2.1% 2.1% 3.9% 1.8% 1.1% 2.2%
Q70_6. How often do you feel that you have a lot in common with the people around you? Total Male Female 45-49 50-59 60-69 70+
Never 2.5% 3.0% 2.1% 2.8% 3.2% 1.8% 2.2%
Rarely 15.1% 16.3% 14.2% 17.6% 18.3% 11.9% 11.7%
Sometimes 58.2% 59.7% 56.9% 59.7% 57.9% 63.3% 51.8%
Always 22.4% 19.5% 24.9% 17.6% 18.7% 21.7% 32.5%
Refused 1.8% 1.6% 1.9% 2.3% 1.9% 1.2% 1.8%
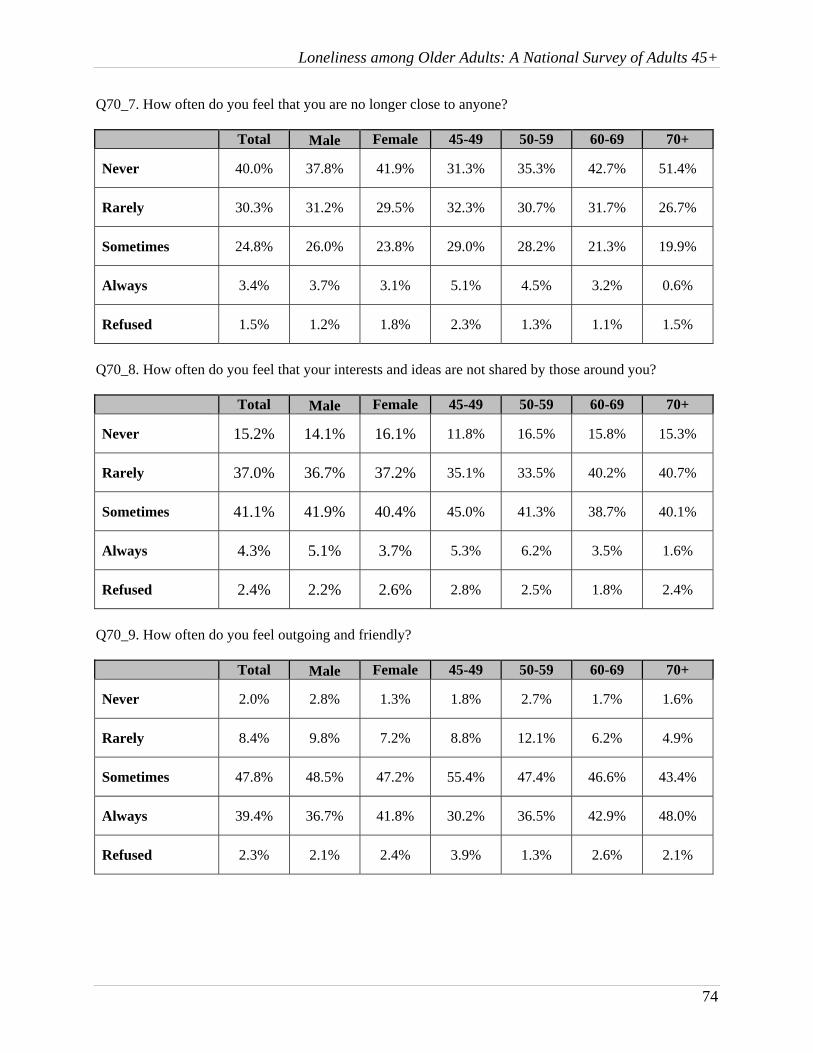
Loneliness among Older Adults: A National Survey of Adults 45+
74
Q70_7. How often do you feel that you are no longer close to anyone? Total Male Female 45-49 50-59 60-69 70+
Never 40.0% 37.8% 41.9% 31.3% 35.3% 42.7% 51.4%
Rarely 30.3% 31.2% 29.5% 32.3% 30.7% 31.7% 26.7%
Sometimes 24.8% 26.0% 23.8% 29.0% 28.2% 21.3% 19.9%
Always 3.4% 3.7% 3.1% 5.1% 4.5% 3.2% 0.6%
Refused 1.5% 1.2% 1.8% 2.3% 1.3% 1.1% 1.5%
Q70_8. How often do you feel that your interests and ideas are not shared by those around you? Total Male Female 45-49 50-59 60-69 70+
Never 15.2% 14.1% 16.1% 11.8% 16.5% 15.8% 15.3%
Rarely 37.0% 36.7% 37.2% 35.1% 33.5% 40.2% 40.7%
Sometimes 41.1% 41.9% 40.4% 45.0% 41.3% 38.7% 40.1%
Always 4.3% 5.1% 3.7% 5.3% 6.2% 3.5% 1.6%
Refused 2.4% 2.2% 2.6% 2.8% 2.5% 1.8% 2.4%
Q70_9. How often do you feel outgoing and friendly? Total Male Female 45-49 50-59 60-69 70+
Never 2.0% 2.8% 1.3% 1.8% 2.7% 1.7% 1.6%
Rarely 8.4% 9.8% 7.2% 8.8% 12.1% 6.2% 4.9%
Sometimes 47.8% 48.5% 47.2% 55.4% 47.4% 46.6% 43.4%
Always 39.4% 36.7% 41.8% 30.2% 36.5% 42.9% 48.0%
Refused 2.3% 2.1% 2.4% 3.9% 1.3% 2.6% 2.1%

Loneliness among Older Adults: A National Survey of Adults 45+
75
Q70_10. How often do you feel close to people? Total Male Female 45-49 50-59 60-69 70+
Never 1.8% 2.6% 1.0% 2.3% 2.2% 0.8% 1.5%
Rarely 11.4% 14.3% 8.8% 14.1% 14.2% 8.7% 7.6%
Sometimes 51.9% 52.0% 51.9% 53.5% 52.7% 54.4% 47.0%
Always 30.4% 26.9% 33.5% 26.1% 27.1% 31.4% 37.9%
Refused 4.5% 4.2% 4.9% 4.0% 3.7% 4.7% 6.1%
Q70_11. How often do you feel left out? Total Male Female 45-49 50-59 60-69 70+
Never 18.4% 19.7% 17.3% 15.0% 16.7% 19.9% 22.5%
Rarely 43.6% 42.8% 44.2% 40.5% 40.1% 45.2% 49.9%
Sometimes 32.4% 32.6% 32.3% 36.8% 35.8% 30.9% 25.1%
Always 3.7% 3.3% 3.9% 4.6% 5.6% 2.2% 1.3%
Refused 1.9% 1.6% 2.3% 3.2% 1.8% 1.8% 1.2%
Q70_12. How often do you feel that your relationships with others are not meaningful? Total Male Female 45-49 50-59 60-69 70+
Never 25.7% 25.0% 26.3% 23.4% 24.3% 26.0% 29.3%
Rarely 37.6% 36.8% 38.3% 32.9% 35.7% 41.3% 40.6%
Sometimes 31.9% 32.7% 31.2% 36.6% 34.1% 28.8% 27.7%
Always 3.2% 3.9% 2.6% 4.0% 4.7% 2.2% 1.3%
Refused 1.6% 1.6% 1.6% 3.0% 1.2% 1.7% 1.0%

Loneliness among Older Adults: A National Survey of Adults 45+
76
Q70_13. How often do you feel that no one really knows you well? Total Male Female 45-49 50-59 60-69 70+
Never 21.7% 21.6% 21.8% 17.6% 20.6% 24.6% 23.5%
Rarely 34.5% 33.4% 35.5% 32.1% 32.1% 35.1% 39.6%
Sometimes 34.6% 35.4% 33.9% 38.8% 35.4% 32.2% 32.4%
Always 7.4% 7.8% 7.1% 9.3% 10.4% 5.7% 3.1%
Refused 1.8% 1.9% 1.7% 2.1% 1.4% 2.4% 1.3%
Q70_14. How often do you feel isolated from others? Total Male Female 45-49 50-59 60-69 70+
Never 31.1% 30.5% 31.6% 22.6% 29.0% 32.6% 39.9%
Rarely 36.6% 36.2% 37.1% 40.0% 34.9% 37.1% 36.1%
Sometimes 25.6% 26.5% 24.9% 29.5% 28.1% 23.5% 20.9%
Always 4.3% 4.6% 4.0% 5.3% 6.5% 3.5% 1.0%
Refused 2.3% 2.2% 2.4% 2.6% 1.5% 3.3% 2.1%
Q70_15. How often do you feel you can find companionship when you want it? Total Male Female 45-49 50-59 60-69 70+
Never 5.7% 6.1% 5.4% 5.6% 7.1% 4.0% 5.6%
Rarely 14.3% 13.6% 14.9% 19.9% 15.7% 13.1% 8.9%
Sometimes 36.9% 37.9% 36.0% 37.9% 38.1% 36.5% 34.4%
Always 41.3% 40.7% 41.7% 34.3% 37.5% 44.4% 49.5%
Refused 1.8% 1.6% 2.0% 2.3% 1.6% 1.9% 1.6%

Loneliness among Older Adults: A National Survey of Adults 45+
77
Q70_16. How often do you feel that there are people who really understand you? Total Male Female 45-49 50-59 60-69 70+
Never 3.4% 3.8% 3.1% 3.2% 4.3% 2.9% 2.7%
Rarely 15.5% 18.7% 12.6% 18.3% 17.3% 14.3% 11.5%
Sometimes 52.3% 50.2% 54.2% 52.9% 51.6% 53.0% 52.4%
Always 27.3% 25.4% 29.0% 24.0% 25.6% 28.0% 32.0%
Refused 1.5% 1.9% 1.1% 1.6% 1.1% 1.8% 1.5%
Q70_17. How often do you feel shy? Total Male Female 45-49 50-59 60-69 70+
Never 17.0% 18.2% 16.0% 12.7% 16.0% 18.4% 20.9%
Rarely 33.3% 34.5% 32.3% 32.6% 32.4% 35.2% 33.1%
Sometimes 42.6% 39.3% 45.5% 45.0% 43.5% 41.3% 40.7%
Always 5.6% 6.1% 5.2% 7.4% 6.7% 3.6% 4.6%
Refused 1.4% 1.9% 0.9% 2.3% 1.3% 1.5% 0.7%
Q70_18. How often do you feel that people are around you but not with you? Total Male Female 45-49 50-59 60-69 70+
Never 15.4% 15.3% 15.5% 13.7% 14.9% 16.0% 16.9%
Rarely 37.1% 35.9% 38.1% 37.1% 35.3% 38.6% 38.2%
Sometimes 42.1% 42.6% 41.6% 42.3% 43.1% 39.4% 43.0%
Always 3.9% 4.5% 3.4% 4.9% 5.4% 3.9% 0.9%
Refused 1.5% 1.7% 1.4% 1.9% 1.3% 2.1% 1.0%

Loneliness among Older Adults: A National Survey of Adults 45+
78
Q70_19. How often do you feel that there are people you can talk to? Total Male Female 45-49 50-59 60-69 70+
Never 2.0% 2.3% 1.8% 2.1% 3.1% 1.0% 1.5%
Rarely 8.7% 11.7% 6.0% 9.5% 11.3% 8.0% 4.4%
Sometimes 38.5% 38.5% 38.6% 42.1% 41.3% 35.6% 34.5%
Always 49.2% 45.7% 52.3% 43.8% 43.3% 53.7% 58.2%
Refused 1.6% 1.9% 1.3% 2.5% 1.1% 1.7% 1.3%
Q70_20. How often do you feel that there are people you can turn to? Total Male Female 45-49 50-59 60-69 70+
Never 1.9% 2.3% 1.5% 1.6% 2.8% 1.2% 1.5%
Rarely 10.0% 12.9% 7.4% 13.6% 13.0% 7.3% 5.0%
Sometimes 34.2% 34.7% 33.9% 36.1% 37.0% 33.5% 29.3%
Always 51.9% 47.7% 55.7% 46.7% 45.5% 55.6% 62.4%
Refused 2.0% 2.5% 1.5% 2.1% 1.7% 2.4% 1.8%
[SP] Q71. Overall, how often do you feel lonely or isolated from those around you? Total Male Female 45-49 50-59 60-69 70+
Always 3.9% 4.2% 3.6% 4.9% 5.8% 2.8% 1.2%
Sometimes 29.3% 28.6% 29.8% 34.7% 31.4% 27.8% 23.1%
Rarely 39.4% 37.7% 40.9% 37.9% 37.8% 38.9% 43.6%
Never 26.7% 28.4% 25.2% 22.0% 24.4% 29.6% 31.0%
Refused 0.8% 1.1% 0.5% 0.5% 0.6% 1.0% 1.2%

Loneliness among Older Adults: A National Survey of Adults 45+
79
[IF Q71=1-3] [SP] Q75. Sometimes loneliness is caused by a specific event or condition such as the loss of a spouse or an unexpected illness, and sometimes there doesn’t seem to be a specific reason why people feel lonely. Is there a specific cause for your feelings of loneliness? Total Male Female 45-49 50-59 60-69 70+
No 69.0% 76.4% 62.8% 68.9% 67.8% 69.7% 70.5%
Yes 29.6% 22.7% 35.4% 28.2% 31.8% 28.9% 27.7%
Refused 1.4% 0.9% 1.9% 3.0% 0.4% 1.4% 1.7%
[GRID, SP ACROSS. RANDOMIZE AND RECORD] Below are some behaviors that people might do to cope with feelings of loneliness or isolation. How often do you do each of the following activities when you are feeling lonely? Q76_1. Talk to a friend or relative Total Male Female 45-49 50-59 60-69 70+
Always 19.3% 13.1% 24.8% 19.4% 18.2% 20.9% 19.3%
Sometimes 58.2% 55.5% 60.6% 57.7% 58.2% 58.4% 58.7%
Rarely 13.1% 18.5% 8.4% 15.3% 14.3% 12.2% 10.5%
Never 6.8% 10.3% 3.8% 5.3% 6.8% 6.6% 8.3%
Refused 2.5% 2.7% 2.3% 2.3% 2.5% 1.8% 3.3%
Q76_2. Watch television Total Male Female 45-49 50-59 60-69 70+
Always 22.5% 22.5% 22.6% 20.1% 24.3% 21.7% 22.8%
Sometimes 55.1% 53.1% 56.9% 54.4% 54.2% 58.5% 53.6%
Rarely 11.2% 11.4% 11.0% 12.5% 10.7% 10.5% 11.4%
Never 8.8% 10.3% 7.5% 9.3% 8.8% 7.9% 9.5%
Refused 2.4% 2.7% 2.1% 3.7% 2.0% 1.4% 2.8%

Loneliness among Older Adults: A National Survey of Adults 45+
80
Q76_3. Write in a diary or journal Total Male Female 45-49 50-59 60-69 70+
Always 2.8% 1.8% 3.6% 1.8% 2.9% 2.6% 3.6%
Sometimes 8.9% 4.6% 12.7% 12.0% 8.6% 7.1% 8.7%
Rarely 10.8% 7.6% 13.7% 11.8% 11.5% 10.1% 9.6%
Never 75.2% 83.3% 68.1% 71.5% 75.1% 78.4% 75.1%
Refused 2.4% 2.8% 2.0% 3.0% 1.9% 1.8% 3.0%
Q76_4. Drink alcohol Total Male Female 45-49 50-59 60-69 70+
Always 1.8% 2.6% 1.0% 2.5% 2.2% 0.8% 1.5%
Sometimes 14.5% 18.2% 11.1% 18.7% 16.7% 14.0% 8.0%
Rarely 17.3% 18.7% 16.2% 21.8% 19.3% 14.0% 14.1%
Never 63.9% 57.6% 69.5% 54.9% 59.1% 69.1% 73.3%
Refused 2.5% 2.9% 2.2% 2.1% 2.7% 2.1% 3.1%
Q76_5. Smoke cigarettes or use other tobacco products Total Male Female 45-49 50-59 60-69 70+
Always 8.6% 8.5% 8.7% 11.6% 12.8% 4.7% 3.7%
Sometimes 9.3% 10.4% 8.3% 14.6% 11.0% 7.0% 4.6%
Rarely 3.6% 4.1% 3.1% 6.3% 3.3% 2.8% 2.4%
Never 76.6% 75.2% 77.9% 65.1% 70.8% 84.0% 87.4%
Refused 1.9% 1.8% 2.0% 2.3% 2.0% 1.5% 1.9%
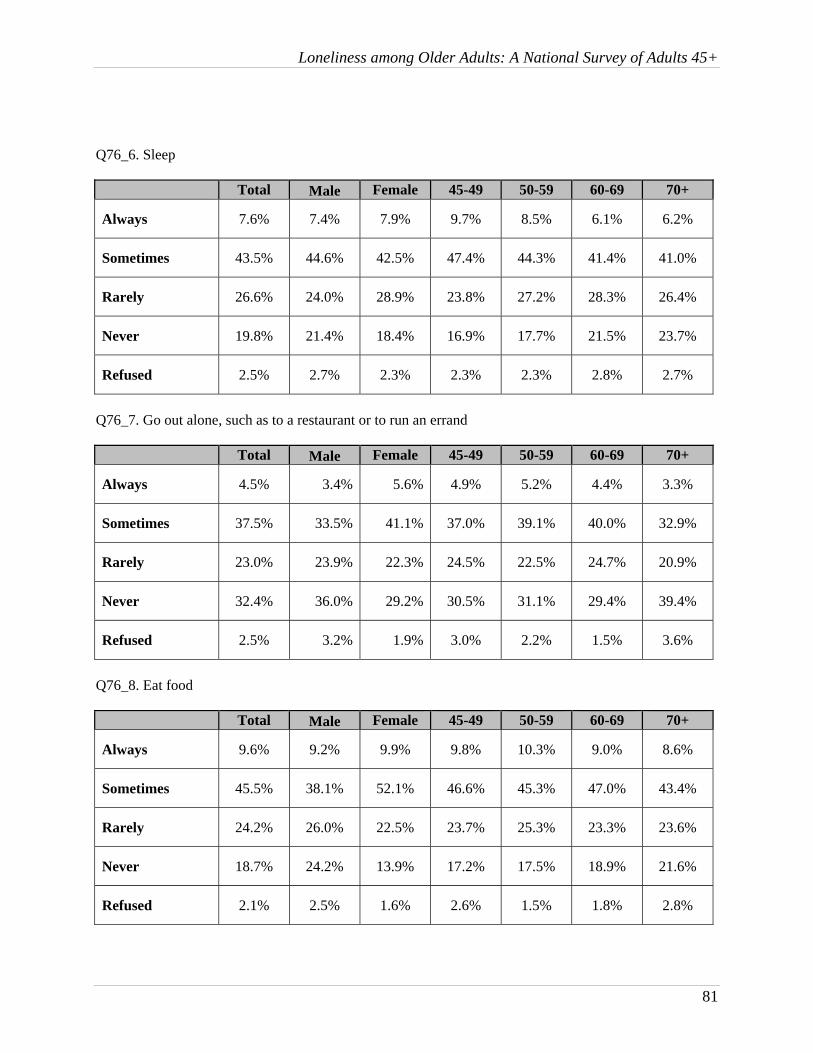
Loneliness among Older Adults: A National Survey of Adults 45+
81
Q76_6. Sleep Total Male Female 45-49 50-59 60-69 70+
Always 7.6% 7.4% 7.9% 9.7% 8.5% 6.1% 6.2%
Sometimes 43.5% 44.6% 42.5% 47.4% 44.3% 41.4% 41.0%
Rarely 26.6% 24.0% 28.9% 23.8% 27.2% 28.3% 26.4%
Never 19.8% 21.4% 18.4% 16.9% 17.7% 21.5% 23.7%
Refused 2.5% 2.7% 2.3% 2.3% 2.3% 2.8% 2.7%
Q76_7. Go out alone, such as to a restaurant or to run an errand Total Male Female 45-49 50-59 60-69 70+
Always 4.5% 3.4% 5.6% 4.9% 5.2% 4.4% 3.3%
Sometimes 37.5% 33.5% 41.1% 37.0% 39.1% 40.0% 32.9%
Rarely 23.0% 23.9% 22.3% 24.5% 22.5% 24.7% 20.9%
Never 32.4% 36.0% 29.2% 30.5% 31.1% 29.4% 39.4%
Refused 2.5% 3.2% 1.9% 3.0% 2.2% 1.5% 3.6%
Q76_8. Eat food Total Male Female 45-49 50-59 60-69 70+
Always 9.6% 9.2% 9.9% 9.8% 10.3% 9.0% 8.6%
Sometimes 45.5% 38.1% 52.1% 46.6% 45.3% 47.0% 43.4%
Rarely 24.2% 26.0% 22.5% 23.7% 25.3% 23.3% 23.6%
Never 18.7% 24.2% 13.9% 17.2% 17.5% 18.9% 21.6%
Refused 2.1% 2.5% 1.6% 2.6% 1.5% 1.8% 2.8%
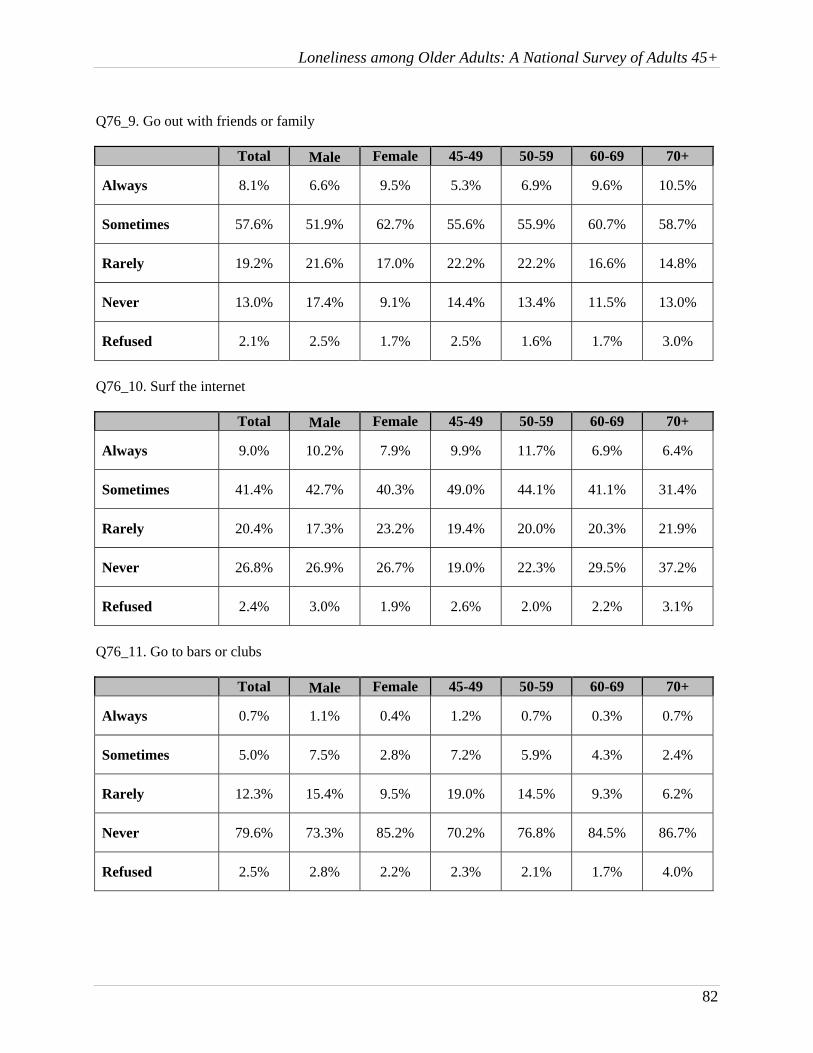
Loneliness among Older Adults: A National Survey of Adults 45+
82
Q76_9. Go out with friends or family Total Male Female 45-49 50-59 60-69 70+
Always 8.1% 6.6% 9.5% 5.3% 6.9% 9.6% 10.5%
Sometimes 57.6% 51.9% 62.7% 55.6% 55.9% 60.7% 58.7%
Rarely 19.2% 21.6% 17.0% 22.2% 22.2% 16.6% 14.8%
Never 13.0% 17.4% 9.1% 14.4% 13.4% 11.5% 13.0%
Refused 2.1% 2.5% 1.7% 2.5% 1.6% 1.7% 3.0%
Q76_10. Surf the internet Total Male Female 45-49 50-59 60-69 70+
Always 9.0% 10.2% 7.9% 9.9% 11.7% 6.9% 6.4%
Sometimes 41.4% 42.7% 40.3% 49.0% 44.1% 41.1% 31.4%
Rarely 20.4% 17.3% 23.2% 19.4% 20.0% 20.3% 21.9%
Never 26.8% 26.9% 26.7% 19.0% 22.3% 29.5% 37.2%
Refused 2.4% 3.0% 1.9% 2.6% 2.0% 2.2% 3.1%
Q76_11. Go to bars or clubs Total Male Female 45-49 50-59 60-69 70+
Always 0.7% 1.1% 0.4% 1.2% 0.7% 0.3% 0.7%
Sometimes 5.0% 7.5% 2.8% 7.2% 5.9% 4.3% 2.4%
Rarely 12.3% 15.4% 9.5% 19.0% 14.5% 9.3% 6.2%
Never 79.6% 73.3% 85.2% 70.2% 76.8% 84.5% 86.7%
Refused 2.5% 2.8% 2.2% 2.3% 2.1% 1.7% 4.0%

Loneliness among Older Adults: A National Survey of Adults 45+
83
Q76_12. Work on a hobby or personal interest Total Male Female 45-49 50-59 60-69 70+
Always 11.2% 9.8% 12.5% 9.2% 10.2% 13.6% 12.1%
Sometimes 56.3% 54.7% 57.8% 57.0% 57.4% 56.9% 53.6%
Rarely 15.1% 15.7% 14.5% 14.5% 15.2% 14.4% 16.0%
Never 15.0% 17.6% 12.7% 16.0% 14.7% 13.4% 16.3%
Refused 2.4% 2.2% 2.5% 3.4% 2.5% 1.7% 2.1%
Q76_13. Attend religious services Total Male Female 45-49 50-59 60-69 70+
Always 10.6% 9.5% 11.6% 5.3% 9.7% 11.6% 15.6%
Sometimes 26.3% 20.8% 31.2% 24.6% 24.7% 27.5% 29.0%
Rarely 20.6% 20.1% 21.0% 23.2% 20.8% 18.8% 19.9%
Never 40.1% 47.2% 33.8% 44.5% 42.3% 40.2% 32.9%
Refused 2.4% 2.5% 2.3% 2.3% 2.6% 1.8% 2.7%
Q76_14. Use drugs Total Male Female 45-49 50-59 60-69 70+
Always 0.6% 1.0% 0.3% 0.9% 0.7% 0.4% 0.4%
Sometimes 1.8% 3.0% 0.7% 3.5% 1.7% 1.9% 0.0%
Rarely 2.4% 3.4% 1.6% 4.8% 3.2% 1.5% 0.3%
Never 92.8% 89.8% 95.5% 88.0% 92.5% 93.9% 96.4%
Refused 2.4% 2.8% 1.9% 2.8% 1.9% 2.2% 2.8%

Loneliness among Older Adults: A National Survey of Adults 45+
84
Q76_15. Take a walk Total Male Female 45-49 50-59 60-69 70+
Always 6.2% 4.9% 7.3% 4.1% 6.7% 7.2% 6.2%
Sometimes 46.3% 42.0% 50.2% 45.3% 47.1% 50.3% 41.5%
Rarely 25.3% 27.8% 23.2% 26.8% 27.1% 23.7% 23.3%
Never 19.6% 21.9% 17.5% 20.1% 17.3% 16.7% 25.8%
Refused 2.6% 3.4% 1.8% 3.7% 1.8% 2.1% 3.3%
Q76_16. Go shopping Total Male Female 45-49 50-59 60-69 70+
Always 3.9% 2.2% 5.4% 3.7% 4.2% 4.3% 3.1%
Sometimes 35.1% 25.0% 44.0% 34.7% 35.9% 36.0% 33.3%
Rarely 29.9% 29.6% 30.2% 30.5% 29.4% 29.9% 30.2%
Never 28.7% 40.5% 18.2% 28.2% 28.2% 28.1% 30.5%
Refused 2.4% 2.7% 2.1% 3.0% 2.3% 1.7% 3.0%
[SP] Q77. On average, how many hours per day are you physically alone? Total Male Female 45-49 50-59 60-69 70+
0-2 hours 34.7% 35.5% 34.0% 39.8% 32.1% 32.9% 36.4%
3-5 hours 21.0% 22.3% 20.0% 24.5% 20.6% 19.9% 19.9%
6-10 hours 17.7% 17.7% 17.6% 17.4% 19.1% 18.1% 15.3%
11-15 hours 10.8% 8.8% 12.5% 9.2% 12.0% 12.4% 8.4%
16-20 hours 7.6% 7.3% 7.8% 5.5% 6.9% 7.7% 10.2%
21-24 hours 7.6% 7.6% 7.5% 2.5% 8.7% 8.6% 9.2%
Refused 0.7% 0.8% 0.5% 1.2% 0.6% 0.4% 0.6%

Loneliness among Older Adults: A National Survey of Adults 45+
85
[SP] [IF Q71=1OR 2] Q78. About how long have you felt lonely or isolated from those around you? Total Male Female 45-49 50-59 60-69 70+
In the past six months
16.2% 19.4% 13.5% 21.8% 13.0% 15.4% 17.1%
Six months to a year
10.4% 8.0% 12.5% 9.3% 10.5% 9.0% 12.8%
One to two years 14.9% 13.4% 16.3% 18.2% 15.1% 14.0% 11.6%
Three to five years
16.5% 13.1% 19.5% 12.9% 18.9% 14.9% 17.7%
Six to ten years 11.6% 11.4% 11.8% 9.3% 10.5% 13.1% 15.9%
More than ten years
27.8% 33.2% 23.0% 25.8% 30.2% 30.8% 20.7%
Refused 2.5% 1.5% 3.4% 2.7% 1.8% 2.7% 4.3%
[IF Q71=1-3] Q79. On average, compared to how you felt 5 years ago, would you say that you are more lonely, less lonely, or about the same? Total Male Female 45-49 50-59 60-69 70+
More lonely 24.9% 22.7% 26.7% 28.0% 26.2% 23.3% 21.2%
Less lonely 26.0% 23.4% 28.2% 28.6% 27.1% 23.1% 24.7%
About the same 48.2% 53.4% 43.9% 41.8% 46.1% 53.2% 52.4%
Refused 1.0% 0.6% 1.3% 1.6% 0.6% 0.4% 1.7%

Loneliness among Older Adults: A National Survey of Adults 45+
86
[--TECHNOLOGY--] [SP] Q82. Now we’d like to ask you some questions about your familiarity with and use of technology. How often do you go online (i.e. use the Internet or email)? Total Male Female 45-49 50-59 60-69 70+
Several times a day
43.4% 46.6% 40.6% 48.0% 46.6% 42.4% 35.9%
About once a day 24.3% 23.5% 25.1% 20.5% 23.2% 23.8% 30.1%
Several times per week
13.3% 12.6% 13.9% 12.2% 14.3% 13.7% 12.1%
About once per week
4.7% 3.7% 5.7% 5.5% 4.3% 5.3% 4.1%
Several times per month
2.7% 2.4% 2.9% 1.8% 2.6% 2.6% 3.4%
About once per month
1.3% 0.8% 1.8% 1.9% 1.0% 1.0% 1.8%
Less often than once per month
1.8% 2.1% 1.6% 1.9% 1.7% 2.4% 1.3%
I do not go online 7.5% 7.1% 7.8% 7.1% 5.4% 8.4% 10.1%
Refused 0.9% 1.1% 0.8% 1.2% 1.0% 0.4% 1.2%
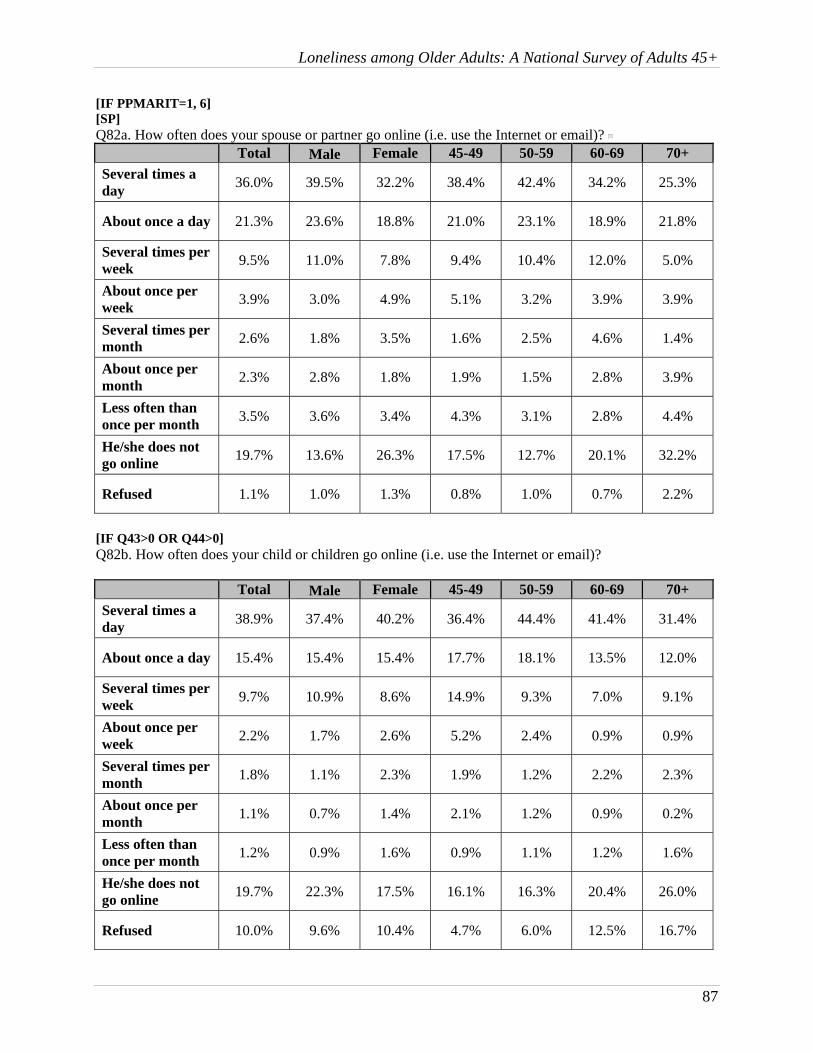
Loneliness among Older Adults: A National Survey of Adults 45+
87
[IF PPMARIT=1, 6] [SP] Q82a. How often does your spouse or partner go online (i.e. use the Internet or email)? Total Male Female 45-49 50-59 60-69 70+
Several times a day
36.0% 39.5% 32.2% 38.4% 42.4% 34.2% 25.3%
About once a day 21.3% 23.6% 18.8% 21.0% 23.1% 18.9% 21.8%
Several times per week
9.5% 11.0% 7.8% 9.4% 10.4% 12.0% 5.0%
About once per week
3.9% 3.0% 4.9% 5.1% 3.2% 3.9% 3.9%
Several times per month
2.6% 1.8% 3.5% 1.6% 2.5% 4.6% 1.4%
About once per month
2.3% 2.8% 1.8% 1.9% 1.5% 2.8% 3.9%
Less often than once per month
3.5% 3.6% 3.4% 4.3% 3.1% 2.8% 4.4%
He/she does not go online
19.7% 13.6% 26.3% 17.5% 12.7% 20.1% 32.2%
Refused 1.1% 1.0% 1.3% 0.8% 1.0% 0.7% 2.2%
[IF Q43>0 OR Q44>0] Q82b. How often does your child or children go online (i.e. use the Internet or email)? Total Male Female 45-49 50-59 60-69 70+
Several times a day
38.9% 37.4% 40.2% 36.4% 44.4% 41.4% 31.4%
About once a day 15.4% 15.4% 15.4% 17.7% 18.1% 13.5% 12.0%
Several times per week
9.7% 10.9% 8.6% 14.9% 9.3% 7.0% 9.1%
About once per week
2.2% 1.7% 2.6% 5.2% 2.4% 0.9% 0.9%
Several times per month
1.8% 1.1% 2.3% 1.9% 1.2% 2.2% 2.3%
About once per month
1.1% 0.7% 1.4% 2.1% 1.2% 0.9% 0.2%
Less often than once per month
1.2% 0.9% 1.6% 0.9% 1.1% 1.2% 1.6%
He/she does not go online
19.7% 22.3% 17.5% 16.1% 16.3% 20.4% 26.0%
Refused 10.0% 9.6% 10.4% 4.7% 6.0% 12.5% 16.7%

Loneliness among Older Adults: A National Survey of Adults 45+
88
[IF Q82=1-7] [GRID, SP ACROSS] How frequently do you do the following activities online? Q83_1. Send or receive e-mail Total Male Female 45-49 50-59 60-69 70+
At least daily 58.3% 59.2% 57.5% 58.3% 59.6% 57.6% 56.7%
At least weekly 22.9% 21.5% 24.2% 20.6% 23.1% 22.6% 25.1%
At least monthly 5.6% 5.5% 5.7% 7.9% 5.1% 5.9% 4.3%
Less than monthly
6.5% 6.9% 6.0% 6.2% 6.3% 6.8% 6.7%
Never 5.9% 6.5% 5.5% 6.5% 5.0% 6.7% 6.2%
Refused 0.8% 0.4% 1.1% 0.6% 0.9% 0.5% 1.0%
Q83_2. Use instant messaging (e.g., AIM, MSN, or Yahoo! Messenger) Total Male Female 45-49 50-59 60-69 70+
At least daily 8.7% 7.9% 9.3% 12.1% 11.6% 4.7% 5.2%
At least weekly 7.6% 8.2% 7.1% 9.8% 8.4% 6.7% 5.8%
At least monthly 3.8% 3.2% 4.3% 4.0% 4.8% 3.0% 2.8%
Less than monthly
10.7% 12.0% 9.6% 12.7% 12.6% 9.4% 7.3%
Never 68.4% 67.8% 68.9% 60.5% 61.6% 75.3% 78.5%
Refused 0.8% 0.8% 0.8% 0.8% 1.0% 0.9% 0.3%
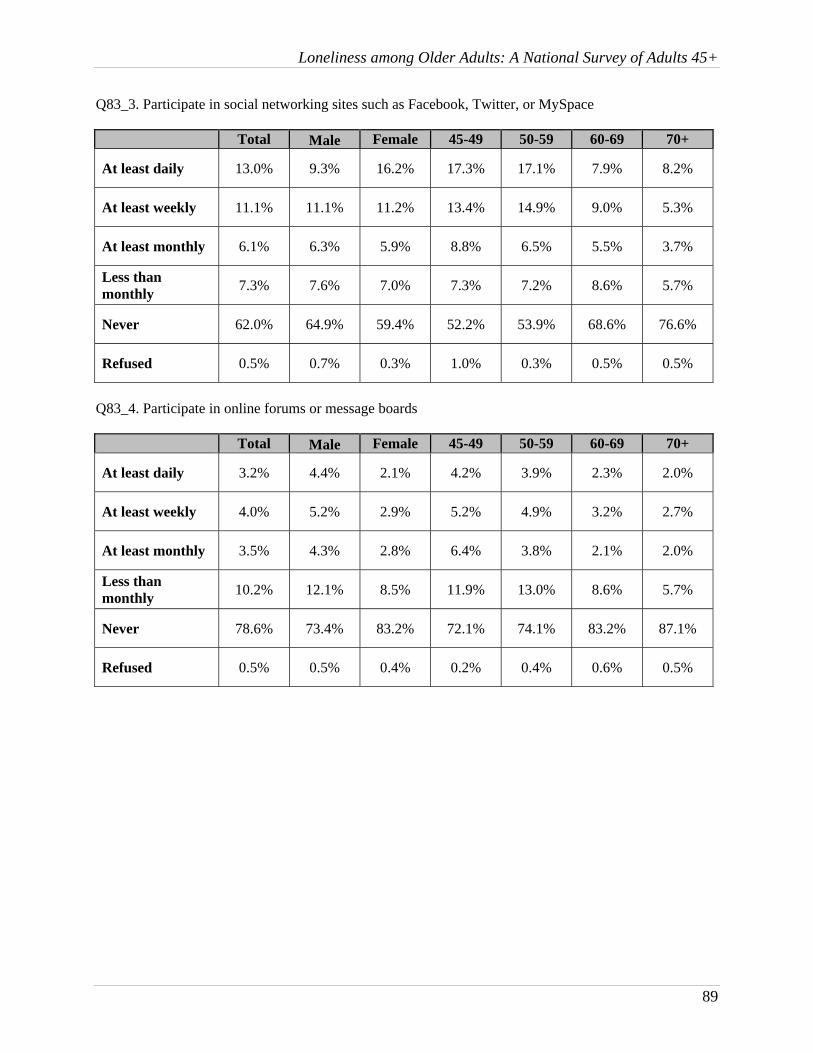
Loneliness among Older Adults: A National Survey of Adults 45+
89
Q83_3. Participate in social networking sites such as Facebook, Twitter, or MySpace Total Male Female 45-49 50-59 60-69 70+
At least daily 13.0% 9.3% 16.2% 17.3% 17.1% 7.9% 8.2%
At least weekly 11.1% 11.1% 11.2% 13.4% 14.9% 9.0% 5.3%
At least monthly 6.1% 6.3% 5.9% 8.8% 6.5% 5.5% 3.7%
Less than monthly
7.3% 7.6% 7.0% 7.3% 7.2% 8.6% 5.7%
Never 62.0% 64.9% 59.4% 52.2% 53.9% 68.6% 76.6%
Refused 0.5% 0.7% 0.3% 1.0% 0.3% 0.5% 0.5%
Q83_4. Participate in online forums or message boards Total Male Female 45-49 50-59 60-69 70+
At least daily 3.2% 4.4% 2.1% 4.2% 3.9% 2.3% 2.0%
At least weekly 4.0% 5.2% 2.9% 5.2% 4.9% 3.2% 2.7%
At least monthly 3.5% 4.3% 2.8% 6.4% 3.8% 2.1% 2.0%
Less than monthly
10.2% 12.1% 8.5% 11.9% 13.0% 8.6% 5.7%
Never 78.6% 73.4% 83.2% 72.1% 74.1% 83.2% 87.1%
Refused 0.5% 0.5% 0.4% 0.2% 0.4% 0.6% 0.5%
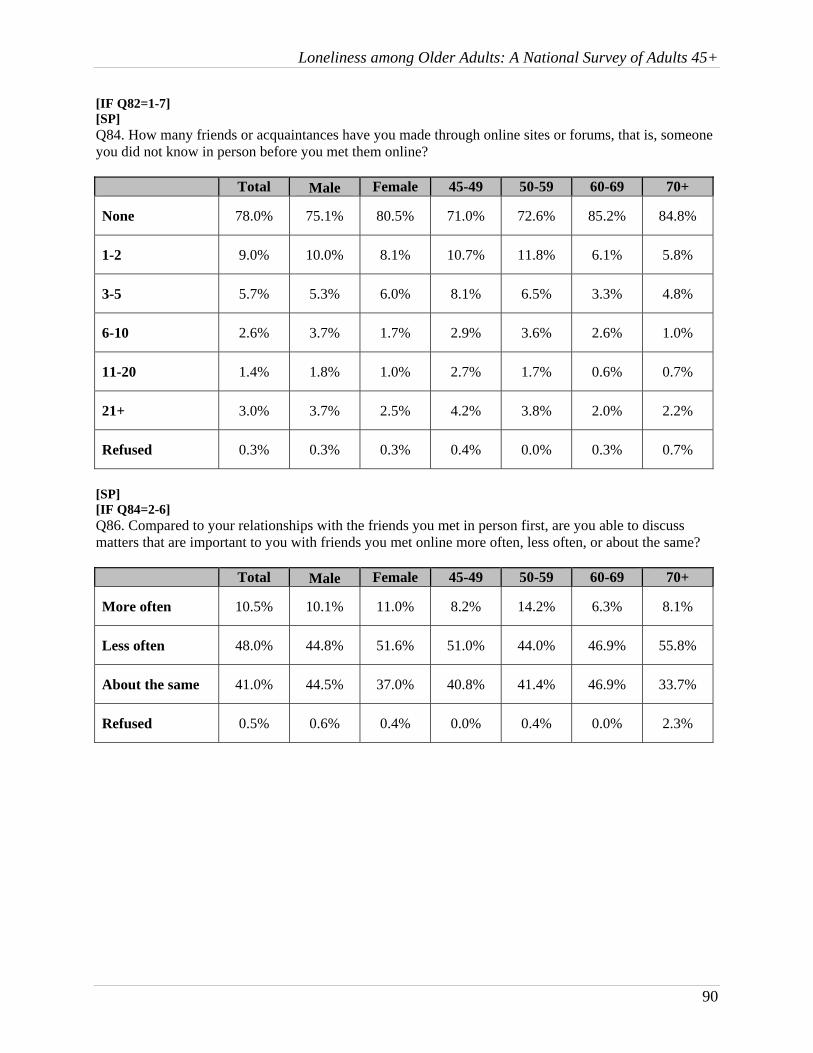
Loneliness among Older Adults: A National Survey of Adults 45+
90
[IF Q82=1-7] [SP] Q84. How many friends or acquaintances have you made through online sites or forums, that is, someone you did not know in person before you met them online? Total Male Female 45-49 50-59 60-69 70+
None 78.0% 75.1% 80.5% 71.0% 72.6% 85.2% 84.8%
1-2 9.0% 10.0% 8.1% 10.7% 11.8% 6.1% 5.8%
3-5 5.7% 5.3% 6.0% 8.1% 6.5% 3.3% 4.8%
6-10 2.6% 3.7% 1.7% 2.9% 3.6% 2.6% 1.0%
11-20 1.4% 1.8% 1.0% 2.7% 1.7% 0.6% 0.7%
21+ 3.0% 3.7% 2.5% 4.2% 3.8% 2.0% 2.2%
Refused 0.3% 0.3% 0.3% 0.4% 0.0% 0.3% 0.7%
[SP] [IF Q84=2-6] Q86. Compared to your relationships with the friends you met in person first, are you able to discuss matters that are important to you with friends you met online more often, less often, or about the same? Total Male Female 45-49 50-59 60-69 70+
More often 10.5% 10.1% 11.0% 8.2% 14.2% 6.3% 8.1%
Less often 48.0% 44.8% 51.6% 51.0% 44.0% 46.9% 55.8%
About the same 41.0% 44.5% 37.0% 40.8% 41.4% 46.9% 33.7%
Refused 0.5% 0.6% 0.4% 0.0% 0.4% 0.0% 2.3%

Loneliness among Older Adults: A National Survey of Adults 45+
91
[IF Q82=1-7] [GRID, SP ACROSS. RANDOMIZE AND RECORD] Below is a series of statements about internet relationships. Please indicate how much you agree or disagree with each statement. Q89_A. The internet has brought me closer together with my friends and family
Total Male Female 45-49 50-59 60-69 70+
Strongly agree 7.5% 6.5% 8.3% 8.0% 7.0% 7.3% 7.8%
Somewhat agree 21.8% 21.3% 22.2% 19.7% 20.7% 22.0% 25.3%
Neither agree nor disagree
33.0% 34.7% 31.5% 33.3% 34.9% 33.1% 29.3%
Somewhat disagree
12.0% 12.1% 11.8% 14.2% 10.7% 10.3% 13.8%
Strongly disagree 24.3% 24.0% 24.5% 23.4% 25.4% 25.1% 22.3%
Refused 1.5% 1.3% 1.7% 1.3% 1.3% 2.1% 1.3%
Q89_B. The internet makes it easier for me to share personal or uncomfortable information Total Male Female 45-49 50-59 60-69 70+
Strongly agree 3.6% 4.0% 3.2% 5.6% 4.6% 1.4% 2.7%
Somewhat agree 10.2% 11.0% 9.5% 13.4% 10.5% 8.0% 9.3%
Neither agree nor disagree
34.3% 37.0% 31.9% 39.2% 35.2% 33.2% 30.0%
Somewhat disagree
12.8% 13.1% 12.6% 11.9% 13.2% 12.3% 13.5%
Strongly disagree 37.1% 33.3% 40.6% 28.6% 34.8% 43.2% 41.7%
Refused 1.9% 1.5% 2.2% 1.3% 1.6% 1.8% 2.8%
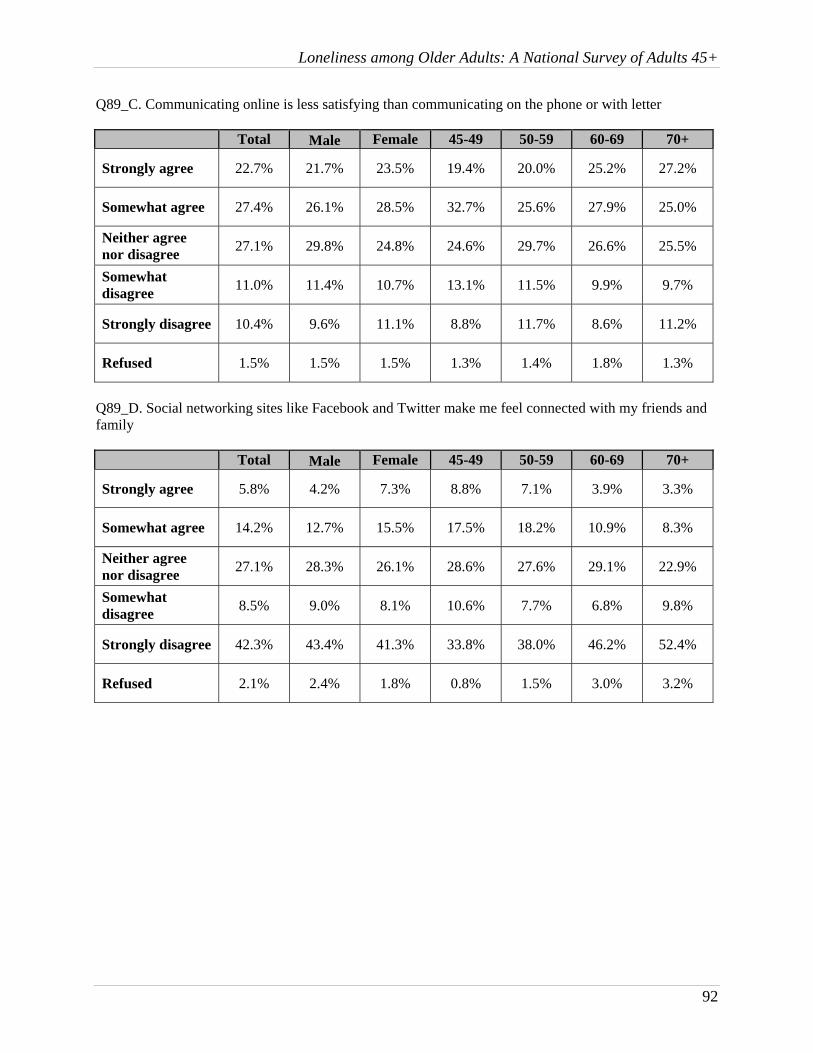
Loneliness among Older Adults: A National Survey of Adults 45+
92
Q89_C. Communicating online is less satisfying than communicating on the phone or with letter Total Male Female 45-49 50-59 60-69 70+
Strongly agree 22.7% 21.7% 23.5% 19.4% 20.0% 25.2% 27.2%
Somewhat agree 27.4% 26.1% 28.5% 32.7% 25.6% 27.9% 25.0%
Neither agree nor disagree
27.1% 29.8% 24.8% 24.6% 29.7% 26.6% 25.5%
Somewhat disagree
11.0% 11.4% 10.7% 13.1% 11.5% 9.9% 9.7%
Strongly disagree 10.4% 9.6% 11.1% 8.8% 11.7% 8.6% 11.2%
Refused 1.5% 1.5% 1.5% 1.3% 1.4% 1.8% 1.3%
Q89_D. Social networking sites like Facebook and Twitter make me feel connected with my friends and family Total Male Female 45-49 50-59 60-69 70+
Strongly agree 5.8% 4.2% 7.3% 8.8% 7.1% 3.9% 3.3%
Somewhat agree 14.2% 12.7% 15.5% 17.5% 18.2% 10.9% 8.3%
Neither agree nor disagree
27.1% 28.3% 26.1% 28.6% 27.6% 29.1% 22.9%
Somewhat disagree
8.5% 9.0% 8.1% 10.6% 7.7% 6.8% 9.8%
Strongly disagree 42.3% 43.4% 41.3% 33.8% 38.0% 46.2% 52.4%
Refused 2.1% 2.4% 1.8% 0.8% 1.5% 3.0% 3.2%
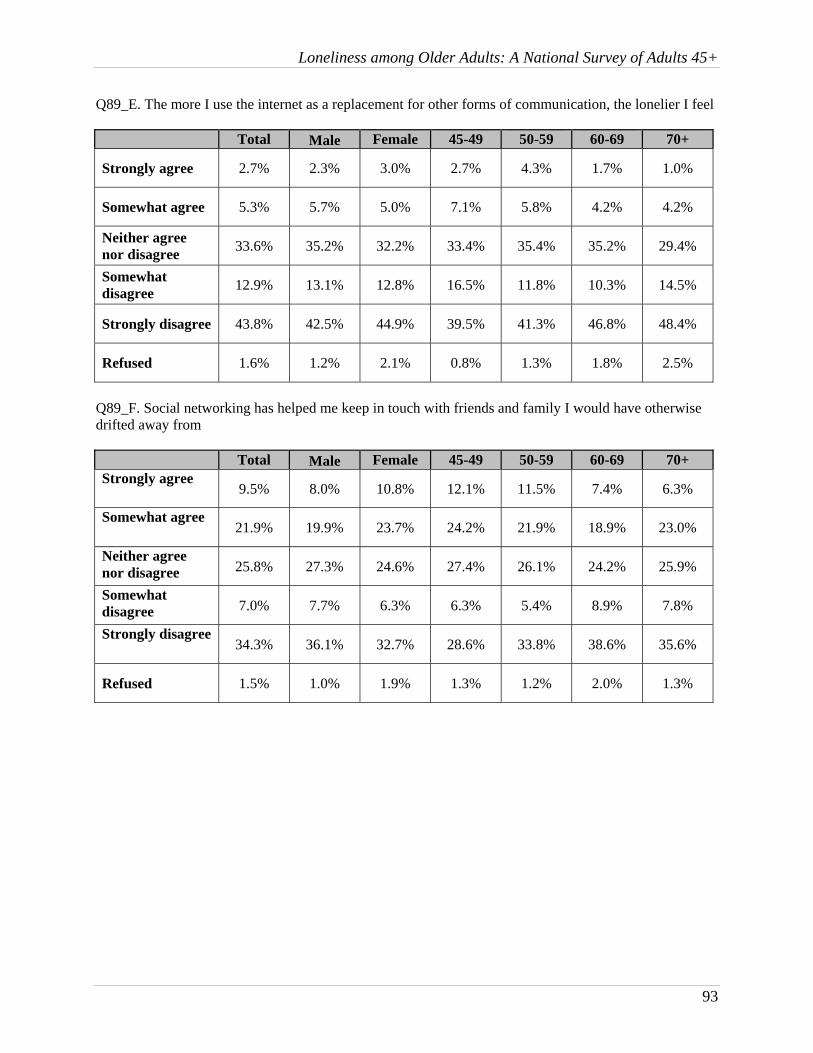
Loneliness among Older Adults: A National Survey of Adults 45+
93
Q89_E. The more I use the internet as a replacement for other forms of communication, the lonelier I feel Total Male Female 45-49 50-59 60-69 70+
Strongly agree 2.7% 2.3% 3.0% 2.7% 4.3% 1.7% 1.0%
Somewhat agree 5.3% 5.7% 5.0% 7.1% 5.8% 4.2% 4.2%
Neither agree nor disagree
33.6% 35.2% 32.2% 33.4% 35.4% 35.2% 29.4%
Somewhat disagree
12.9% 13.1% 12.8% 16.5% 11.8% 10.3% 14.5%
Strongly disagree 43.8% 42.5% 44.9% 39.5% 41.3% 46.8% 48.4%
Refused 1.6% 1.2% 2.1% 0.8% 1.3% 1.8% 2.5%
Q89_F. Social networking has helped me keep in touch with friends and family I would have otherwise drifted away from Total Male Female 45-49 50-59 60-69 70+ Strongly agree
9.5% 8.0% 10.8% 12.1% 11.5% 7.4% 6.3%
Somewhat agree 21.9% 19.9% 23.7% 24.2% 21.9% 18.9% 23.0%
Neither agree nor disagree 25.8% 27.3% 24.6% 27.4% 26.1% 24.2% 25.9%
Somewhat disagree 7.0% 7.7% 6.3% 6.3% 5.4% 8.9% 7.8%
Strongly disagree 34.3% 36.1% 32.7% 28.6% 33.8% 38.6% 35.6%
Refused 1.5% 1.0% 1.9% 1.3% 1.2% 2.0% 1.3%

Loneliness among Older Adults: A National Survey of Adults 45+
94
Q89_G. I have fewer “deep” friendship connections now that I keep in touch with people using the internet Total Male Female 45-49 50-59 60-69 70+
Strongly agree 2.9% 3.0% 2.9% 3.8% 3.6% 1.4% 2.8%
Somewhat agree 6.6% 7.8% 5.5% 8.8% 7.4% 5.0% 5.2%
Neither agree nor disagree
33.7% 35.0% 32.7% 34.4% 35.1% 33.9% 30.7%
Somewhat disagree
15.0% 14.7% 15.3% 16.2% 15.0% 13.6% 15.4%
Strongly disagree 39.9% 37.8% 41.7% 34.6% 37.3% 44.1% 43.7%
Refused 1.9% 1.8% 2.0% 2.1% 1.6% 2.0% 2.2%
Q89_H. I would recommend using the internet to others in order to help with loneliness Total Male Female 45-49 50-59 60-69 70+
Strongly agree 7.6% 7.4% 7.8% 9.4% 8.6% 5.9% 6.5%
Somewhat agree 19.7% 20.4% 19.1% 16.9% 19.7% 18.5% 23.5%
Neither agree nor disagree
38.5% 40.8% 36.4% 39.0% 37.4% 39.4% 38.7%
Somewhat disagree
12.0% 11.2% 12.7% 15.4% 9.9% 12.0% 12.3%
Strongly disagree 20.6% 19.2% 21.8% 18.1% 22.6% 22.5% 17.5%
Refused 1.6% 1.1% 2.1% 1.2% 1.8% 1.7% 1.5%

Loneliness among Older Adults: A National Survey of Adults 45+
95
Q89_I. Technology has made it harder to spend time with my friends and family in person Total Male Female 45-49 50-59 60-69 70+
Strongly agree 2.8% 2.5% 3.2% 4.0% 3.2% 1.5% 2.7%
Somewhat agree 8.0% 8.4% 7.7% 7.7% 8.7% 6.8% 8.5%
Neither agree nor disagree
29.9% 31.6% 28.4% 30.3% 30.5% 31.2% 26.9%
Somewhat disagree
18.0% 18.2% 17.9% 20.7% 17.2% 17.1% 18.0%
Strongly disagree 39.5% 37.8% 41.0% 35.3% 39.2% 41.4% 41.6%
Refused 1.8% 1.6% 1.9% 1.9% 1.2% 2.0% 2.3%
Q89_J. I find it easy to balance my time on the internet with in person activities and obligations Total Male Female 45-49 50-59 60-69 70+
Strongly agree 24.8% 24.5% 25.1% 21.9% 29.2% 24.4% 20.7%
Somewhat agree 20.7% 20.8% 20.5% 25.0% 19.6% 21.5% 17.7%
Neither agree nor disagree
32.4% 34.1% 30.9% 34.4% 30.9% 32.1% 33.4%
Somewhat disagree
6.9% 6.3% 7.5% 6.7% 6.3% 7.0% 8.0%
Strongly disagree 13.6% 12.9% 14.2% 11.0% 12.8% 13.3% 17.7%
Refused 1.6% 1.4% 1.7% 1.0% 1.2% 1.7% 2.5%
[SP] Q90. As a result of technology such as the internet and mobile phones, do you spend more time, less time, or about the same amount of time on family activities as you did 5 years ago? Total Male Female 45-49 50-59 60-69 70+
More time 10.2% 9.4% 11.0% 12.0% 12.6% 7.5% 7.9%
Less time 12.0% 12.4% 11.6% 17.8% 12.7% 10.0% 8.1%
About the same amount of time
76.8% 76.8% 76.8% 69.0% 74.1% 81.7% 82.4%
Refused 1.0% 1.3% 0.7% 1.2% 0.6% 0.8% 1.6%

Loneliness among Older Adults: A National Survey of Adults 45+
96
[SP] Q91. As a result of technology such as the internet and mobile phones, do you spend more time, less time, or about the same amount of time having intimate conversations as you did 5 years ago? Total Male Female 45-49 50-59 60-69 70+
More time 9.2% 8.4% 9.9% 9.5% 11.5% 7.5% 7.1%
Less time 15.5% 13.9% 17.0% 21.3% 15.6% 15.0% 11.2%
About the same amount of time
73.2% 75.8% 70.9% 66.0% 71.3% 75.5% 79.7%
Refused 2.1% 2.0% 2.1% 3.2% 1.6% 2.1% 1.9%
Related Documents