Page | 1 5 March 2015 LONDON STOCK EXCHANGE GROUP PLC ANNOUNCEMENT OF PRELIMINARY RESULTS FOR THE PERIOD ENDED 31 DECEMBER 2014 Unless stated otherwise, all figures in the highlights below relate to performance for 12 months to 31 December 2014 and comparisons with the prior 12 month period Strong financial performance in 2014 – total income up 26 per cent to £1.38 billion Revenue up 32 per to £1.28 billion – and up 12 per cent on organic constant currency basis with growth across all main business areas Core operating expenses 1 tightly managed - up 5 per cent on organic constant currency basis, partly reflecting costs arising from amendments to OTC clearing arrangements Upgraded €60 million (£49 million) cost synergy target with LCH.Clearnet successfully achieved Adjusted operating profit 1 up 8 per cent on organic constant currency basis to £558.0 million; adjusted profit before tax 1 of £491.7 million, up 19 per cent (2013: £412.7 million) Adjusted basic EPS 1 up 7 per cent at 103.3 pence (2013: 96.5 pence); basic EPS of 56.5 pence (2013: 64.2 pence) Group strongly positioned to develop further as a leading market infrastructure provider: - Successful acquisition of Frank Russell Company creates, with FTSE, a global leader in indices – further extends the Group’s geographic and product range - LCH.Clearnet to launch new, open access, portfolio margining service for all users to maximise margin efficiencies across listed and cleared OTC interest rate derivatives (IRD) portfolios, utilising the world’s largest IRD liquidity pool from SwapClear - New licensing agreement signed with CBOE, to develop index options based on FTSE and Russell indices – to start trading in the US in April 2015 Proposed final dividend of 12.8 pence per share, up 6.5 per cent on an equivalent basis; total dividend of 22.5 pence per share for the 9 month period, equivalent to 75 per cent of the payment that the Board would have made for a full year to March 2015 Statutory results for 9 month period to 31 December 2014 Reported total income for 9 months to end December 2014 of £1,044.0 million; adjusted profit before tax 1 of £368.2 million; and, adjusted basic EPS 1 of 75.6 pence 1 before amortisation and impairment of purchased intangibles and goodwill, non-recurring items and excluding unrealised net investment gains/losses at LCH.Clearnet

Welcome message from author
This document is posted to help you gain knowledge. Please leave a comment to let me know what you think about it! Share it to your friends and learn new things together.
Transcript
Page | 1
5 March 2015
LONDON STOCK EXCHANGE GROUP PLC ANNOUNCEMENT OF PRELIMINARY RESULTS FOR THE PERIOD ENDED
31 DECEMBER 2014
Unless stated otherwise, all figures in the highlights below relate to performance for 12 months to 31 December 2014 and comparisons with the prior 12 month period
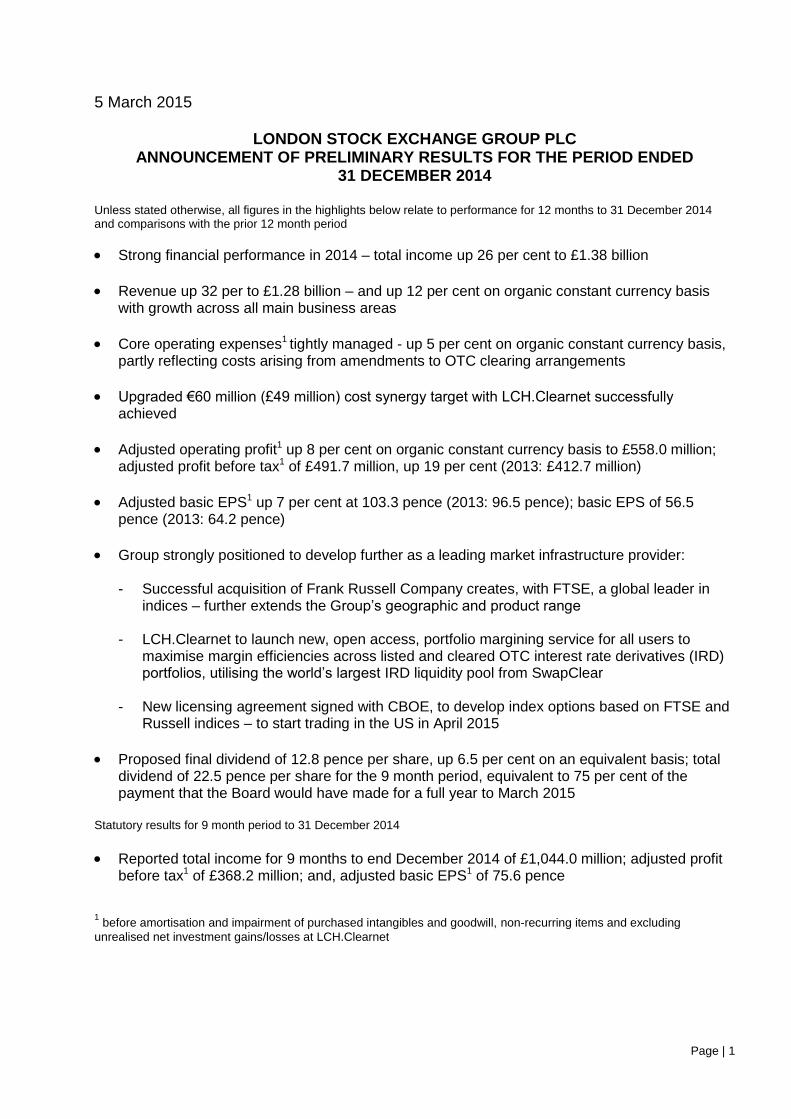
Strong financial performance in 2014 – total income up 26 per cent to £1.38 billion
Revenue up 32 per to £1.28 billion – and up 12 per cent on organic constant currency basis with growth across all main business areas
Core operating expenses1 tightly managed - up 5 per cent on organic constant currency basis, partly reflecting costs arising from amendments to OTC clearing arrangements
Upgraded €60 million (£49 million) cost synergy target with LCH.Clearnet successfully achieved
Adjusted operating profit1 up 8 per cent on organic constant currency basis to £558.0 million; adjusted profit before tax1 of £491.7 million, up 19 per cent (2013: £412.7 million)
Adjusted basic EPS1 up 7 per cent at 103.3 pence (2013: 96.5 pence); basic EPS of 56.5 pence (2013: 64.2 pence)
Group strongly positioned to develop further as a leading market infrastructure provider:
- Successful acquisition of Frank Russell Company creates, with FTSE, a global leader in indices – further extends the Group’s geographic and product range
- LCH.Clearnet to launch new, open access, portfolio margining service for all users to
maximise margin efficiencies across listed and cleared OTC interest rate derivatives (IRD) portfolios, utilising the world’s largest IRD liquidity pool from SwapClear
- New licensing agreement signed with CBOE, to develop index options based on FTSE and Russell indices – to start trading in the US in April 2015
Proposed final dividend of 12.8 pence per share, up 6.5 per cent on an equivalent basis; total dividend of 22.5 pence per share for the 9 month period, equivalent to 75 per cent of the payment that the Board would have made for a full year to March 2015
Statutory results for 9 month period to 31 December 2014
Reported total income for 9 months to end December 2014 of £1,044.0 million; adjusted profit before tax1 of £368.2 million; and, adjusted basic EPS1 of 75.6 pence
1 before amortisation and impairment of purchased intangibles and goodwill, non-recurring items and excluding
unrealised net investment gains/losses at LCH.Clearnet
Page | 2
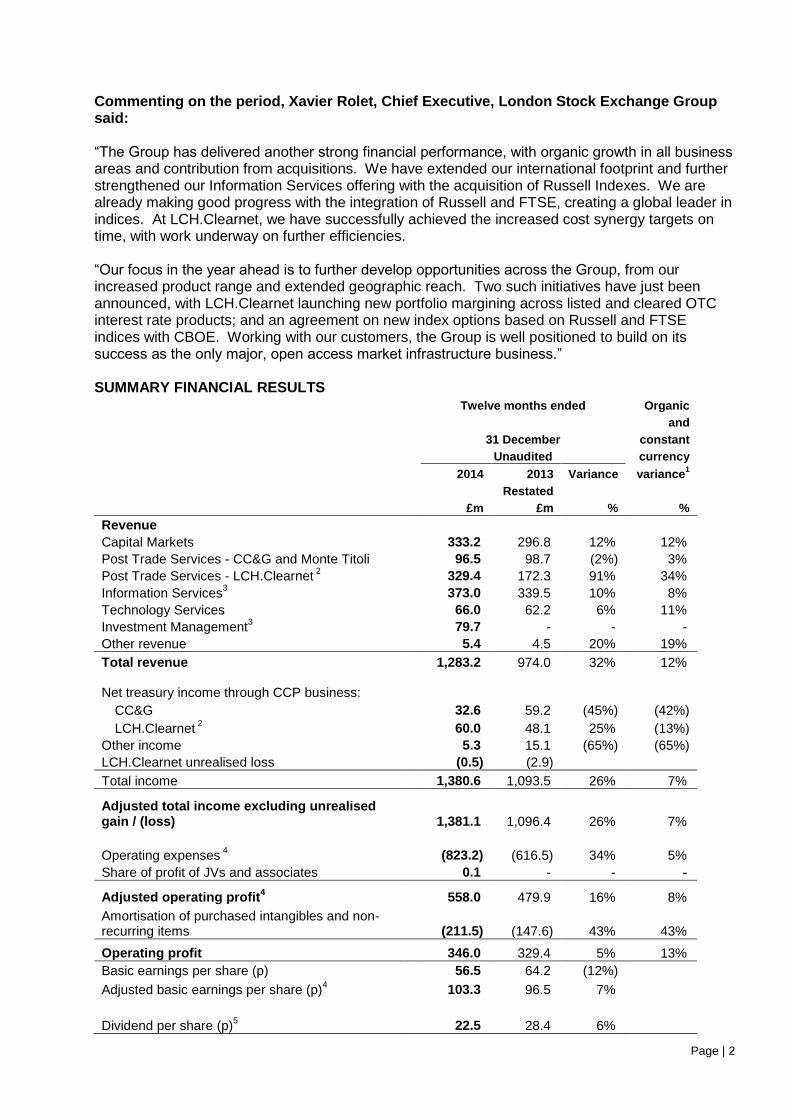
Commenting on the period, Xavier Rolet, Chief Executive, London Stock Exchange Group said: “The Group has delivered another strong financial performance, with organic growth in all business areas and contribution from acquisitions. We have extended our international footprint and further strengthened our Information Services offering with the acquisition of Russell Indexes. We are already making good progress with the integration of Russell and FTSE, creating a global leader in indices. At LCH.Clearnet, we have successfully achieved the increased cost synergy targets on time, with work underway on further efficiencies. “Our focus in the year ahead is to further develop opportunities across the Group, from our increased product range and extended geographic reach. Two such initiatives have just been announced, with LCH.Clearnet launching new portfolio margining across listed and cleared OTC interest rate products; and an agreement on new index options based on Russell and FTSE indices with CBOE. Working with our customers, the Group is well positioned to build on its success as the only major, open access market infrastructure business.” SUMMARY FINANCIAL RESULTS
Twelve months ended Organic
and
31 December constant
Unaudited currency
2014 2013 Variance variance1
Restated
£m £m % %
Revenue
Capital Markets 333.2 296.8 12% 12%
Post Trade Services - CC&G and Monte Titoli 96.5 98.7 (2%) 3%
Post Trade Services - LCH.Clearnet 2 329.4 172.3 91% 34%
Information Services3 373.0 339.5 10% 8%
Technology Services 66.0 62.2 6% 11%
Investment Management3 79.7 - - -
Other revenue 5.4 4.5 20% 19%
Total revenue 1,283.2 974.0 32% 12%
Net treasury income through CCP business:
CC&G 32.6 59.2 (45%) (42%)
LCH.Clearnet 2 60.0 48.1 25% (13%)
Other income 5.3 15.1 (65%) (65%)
LCH.Clearnet unrealised loss (0.5) (2.9) Total income 1,380.6 1,093.5 26% 7%
Adjusted total income excluding unrealised gain / (loss)
1,381.1 1,096.4 26% 7%
Operating expenses 4 (823.2) (616.5) 34% 5%
Share of profit of JVs and associates 0.1 - - -
Adjusted operating profit4
558.0 479.9 16% 8%
Amortisation of purchased intangibles and non-recurring items
(211.5) (147.6) 43% 43%
Operating profit 346.0 329.4 5% 13%
Basic earnings per share (p) 56.5 64.2 (12%) Adjusted basic earnings per share (p)
4 103.3 96.5 7%
Dividend per share (p)5
22.5 28.4 6%
Page | 3
1Organic growth is calculated in respect of businesses owned for at least 12 months in either period and so excludes
EuroTLX, FTSE TMX, Bonds.com and Frank Russell Company with the exception of LCH.Clearnet. LCH.Clearnet organic and constant currency comparative includes the published revenues for the period from January to April 2014 prior to acquisition. The Group’s principal foreign exchange exposure arises from translating our European based euro reporting businesses into sterling. 2LCH.Clearnet 2013 represents eight months ended 31 December 2013
3Russell Index (included in Information Services) and Russell Investment Management, revenue from 3 December 2014
4before amortisation and impairment of purchased intangibles and goodwill, non-recurring items and excluding
unrealised net investment gains/losses at LCH.Clearnet 5dividend paid for 9 months period, change on an equivalent basis
Unless otherwise stated, all figures refer to the 12 months ended 31 December 2014 and comparisons are against the same corresponding period in the previous year
Post period end As announced on 5 February 2015, the Group has concluded the comprehensive review of the investment management business of Russell Investments (“Russell Investment Management”). The comprehensive review focused principally on assessing the strategic fit of Russell Investment Management with the Group’s long term strategy. After careful consideration the conclusion of the comprehensive review is to explore a sale of this business in its entirety. LSEG has already received a number of expressions of interest in a potential acquisition of Russell Investment Management reflecting the high quality of its business and market leading positions.
Contacts: London Stock Exchange Group plc Victoria Brough Paul Froud
Media Investor Relations
+44 (0) 20 7797 1222 +44 (0) 20 7797 3322
Finsbury Guy Lamming / David Henderson Barclays (Corporate Brokers) Kunal Gandhi RBC Capital Markets (Corporate Brokers) Oliver Hearsey
+44 (0) 207 251 3801 +44 (0) 20 7623 2323 +44 (0) 20 7653 4000
Further information The Group will host a presentation of its Preliminary Results for analysts and shareholders today at 10:00am (GMT) at 10 Paternoster Square, London EC4M 7LS. The presentation will be accessible via live webcast, which can be viewed at http://www.lseg.com/investor-relations or listened to on the numbers below: Participant UK Dial-In Numbers: 0800 376 7922 Participant Std International Dial-In: +44 (0) 2071 928 000 Conference ID # 888 926 16
Page | 4
For further information, please call the Group’s Investor Relations team on +44 (0) 20 7797 3322. CEO REVIEW Overview London Stock Exchange Group has enjoyed another successful year. The completion of the acquisition of Frank Russell Company significantly enhances our international presence, particularly in North America, the world’s largest financial services market. The combination of FTSE with Russell Indexes creates a truly global index provider, and presents exciting new opportunities for our organisation. We have also made good progress on the integration of LCH.Clearnet into the Group while continuing to grow organically through our existing businesses around the world. One of the Group’s principal objectives is to provide access to capital for UK and international companies, giving them access to one of the world’s largest and deepest pools of liquidity. In 2014, we were delighted to welcome 219 new firms, both large and small, to our markets in London and Italy making it our busiest year for IPOs since 2007. The Group has also expanded its pioneering ELITE programme, designed to support SME. Already home to over 200 Italian and UK companies, it is helping to fast-track the development and capital raising process for some of the best and brightest of Europe’s high growth private companies and the programme is now being rolled out across Europe. All the right ingredients in Europe’s economy exist to generate notable and sustainable economic growth, including a strong entrepreneurial culture, and our innovative programme offers these companies access to advisors, investment and education, ingredients vital for their continued development. Our unwavering commitment to operating an open-access model remains a key differentiator on the global stage and leaves LSEG well positioned to capitalise on future opportunities, promoting safer and more efficient markets. Building best in class capabilities Innovation and partnership are core values for the Group and we have continued to develop our offering across equities, fixed income and derivatives. IDEM, our Italian derivatives market, saw a 20 per cent increase in volumes and extended the range of products to include weekly single stock options. The derivatives market in London received regulatory approval to offer stock, depositary receipt and index options to US investors, while in equities London Stock Exchange confirmed plans to introduce a new intra-day midday auction. The move, which is in direct response to demand from customers, will encourage larger, institutional and smaller retail size trading to take place in a lit, price-forming venue. Turquoise, the Group’s pan-European trading platform saw its average daily value traded rise by 42 per cent. Its new Turquoise Block Discovery tool was designed to enhance opportunities for block trading and went live with the support of several major brokers for block trading in October. In fixed income, MTS saw the value traded on its cash markets increase by 32 per cent while the exchange traded product team welcomed the 150th fixed income ETF to London’s markets and it continued to consolidate its market leading position in European ETF daily trading volumes.
Page | 5
In our post trade businesses, both LCH.Clearnet and CC&G received approval for reauthorisation under EMIR. Risk management is a key contributor to stable financial markets and the Group’s central counterparties (CCPs) helped their members and customers efficiently manage their risk positions across a range of assets, many of which are now required to be centrally cleared. Regulation and policy debate has put a renewed focus on CCPs and under Suneel Bakhshi’s leadership LCH.Clearnet has remained at the forefront of the debate on risk management recovery and resolution. LCH.Clearnet and CC&G continue to contribute to the work underway at a national, EU and international level to improve the transparency of CCPs’ risk management policies and procedures in order to further strengthen their resilience. Creating a global business Diversification remains a cornerstone of our Group strategy and we have again made good progress this year in this respect. LCH.Clearnet’s position as a leading global multi-asset clearing provider was reinforced during the year. Record volumes were processed through SwapClear, with $642 trillion of notional cleared in 2014. More significantly, the expansion of its innovative compression services contributed to a reduced level of notional outstanding at SwapClear, from $426 trillion at the start of 2014 to $362 trillion at the end of the year, a milestone in the efficient management of risk. In FX, ForexClear expanded the number of currencies cleared and signed new members to the service. globeSettle, the Group’s CSD, based in Luxembourg, signed agreements with three CCPs to offer collateral location services in addition to the provision of settlement, custody and asset servicing for J.P. Morgan’s international collateral management business. The trend towards increased passive investing has been a key contributor to FTSE’s global growth over the past few years. FTSE continued to respond to investor demand for innovative, tailored solutions, launching a range of new products throughout the year including factor-based indices, a new frontier index and taking further steps to allow investors to prepare for China’s eventual inclusion in global indices. FTSE also expanded its fixed income offering winning contracts in Australia and Latin America. MillenniumIT remained at the forefront of LSEG’s commitment to building global partnerships and saw with a number of notable contract wins including an agreement with Casablanca Stock Exchange and Aequitas, a new Canadian exchange platform. London Stock Exchange signed capital markets agreements with The Nigerian Stock Exchange to facilitate companies’ dual listings in London and Lagos and, in October, the Moroccan Central Securities Depository signed a number of cooperation agreements with LSEG. GATElab, our multi-asset electronic trading systems provider, was named as accredited software vendor by Moscow Exchange. Developing opportunities Our customers remain at the centre of all that we do. We continue to seek ways in which to work together and develop strategic partnerships to help them respond efficiently to the implementation of regulatory change and the evolving industry landscape. A good example of this is through UnaVista, which signed an innovative partnership with Wipro. The agreement combines Wipro’s expertise in consultancy and operations with UnaVista’s flexible and scalable software providing solutions that will help financial firms access a hosted environment for end-to-end reconciliation services. Monte Titoli also remains on track to become the largest CSD operator in the first wave of T2S, which will be introduced across Europe in 2015, enabling us to deliver pan-European settlement services for an increasingly global customer base.
Page | 6
To ensure that we continue to capitalise on the number of opportunities across the Group, we have strengthened the senior management team with key appointments to the Executive Committee. Nikhil Rathi has joined as Head of International Development and Chief of Staff, and Serge Harry was appointed LSEG Country Head for France, Benelux and Germany, as well as Chairman of globeSettle. Finally, we were also pleased to welcome Len Brennan, CEO of Russell Investments, to the Executive Committee in December 2014, following the completion of the acquisition of Frank Russell Company. Outlook The Group’s transformation has continued throughout 2014. We are an international business with a broad suite of markets, products and services focused on meeting the needs and aspirations of our global customers. Our revenues and our profitability reflect this ongoing diversification. Following the acquisition of Frank Russell Company, approximately a third of the Group’s revenues, for example, will now come from the US, a key growth market for us in the coming years. Colleagues across the Group continue to impress with their enthusiasm and commitment to deliver on our stated strategic objectives around capital formation, risk management and intellectual property. Our focus in the year ahead is to further develop the opportunities across the Group. I am confident that we will build on the strong foundations achieved throughout the past year. Financial review The Group has changed its financial year end to 31 December. As a consequence, this report shows audited results for the 9 months to 31 December 2014. To provide further insight, we also show information on a calendar 12 month basis (unaudited), with commentary and analysis in comparison with the equivalent 12 months ended 31 December 2013. Key: FY2014 is the financial year from 1st April 2013 to 31st March 2014 (audited); CY2013 is the calendar year from 1st January to 31st December 2013 (unaudited); CY2014 is the calendar year from 1st January to 31st December 2014 (unaudited); All percentage variances used for income analysis quoted are on an organic and constant currency basis
9 months ended
Dec 2014
12 months ended
Mar 2014
Revenue £m £m
Capital Markets 249.1 309.5 Post Trade Services - CC&G and Monte Titoli 71.5 98.4 Post Trade Services - LCH.Clearnet¹ 238.7 263.0 Information Services including Frank Russell Indexes 281.0 348.7 Technology Services 47.3 64.0 Investment management 79.7 - Other 4.1 4.7
Total revenue 971.4 1,088.3
Net Treasury Income - CC&G 23.2 47.6 - LCH.Clearnet
1 45.9 62.2
Other income 3.5 11.5
Total income 1,044.0 1,209.6

Page | 7
Adjusted total income excluding unrealised gains/(losses)² 1,043.9 1,213.1
Operating expenses² (626.5) (698.4)
Share of profit after tax of associates 0.1 -
Adjusted operating profit² 417.5 514.7
Operating profit 242.1 353.1
Adjusted basic earnings per share² 75.6p 98.6p
Basic earnings per share 37.9p 63.0p 1 LCH.Clearnet results consolidated from acquisition in May 2013.
2 Before amortisation and impairment of purchased intangibles and goodwill, non-recurring items and unrealised net investment
gains/losses at LCH.Clearnet, which is taken through other income (£0.1m gain in the 9 months to Dec 2014; £3.5m loss in FY2014; £0.5m loss in CY2014; £2.9m loss in CY2013). Capital Markets
9 months ended Dec
2014
12 months ended Mar
2014
Revenue £m £m
Primary Markets Annual Fees 33.6 41.2 Admission Fees 34.6 39.9
Total Primary Markets 68.2 81.1
Secondary Markets Cash equities: UK & Turquoise 74.9 94.5 Cash equities: Italy 28.0 36.1 Derivatives 14.9 19.6 Fixed income 56.3 68.1
Total Secondary Markets 174.1 218.3
Other 6.8 10.1
Total revenue 249.1 309.5
Operating expenses (123.9) (164.8)
Operating profit 125.2 144.7
12 months ended Dec
2014 (unaudited)
12 months ended Dec
2013 (unaudited)
Variance Variance at organic
and constant currency
Revenue £m £m % %
Primary Markets Annual Fees 44.2 40.2 10 11 Admission Fees 44.6 37.2 20 17
Total Primary Markets 88.8 77.4 15 14
Secondary Markets Cash equities: UK & Turquoise 101.2 91.4 11 11 Cash equities: Italy 38.0 35.6 7 12 Derivatives 20.0 19.5 3 8 Fixed income 75.9 63.2 20 12
Total Secondary Markets 235.1 209.7 12 11
Other 9.3 9.7 (4) -
Total revenue 333.2 296.8 12 12
Operating expenses (170.4) (163.8) 4 (1)
Operating profit 162.8 133.0 22 27
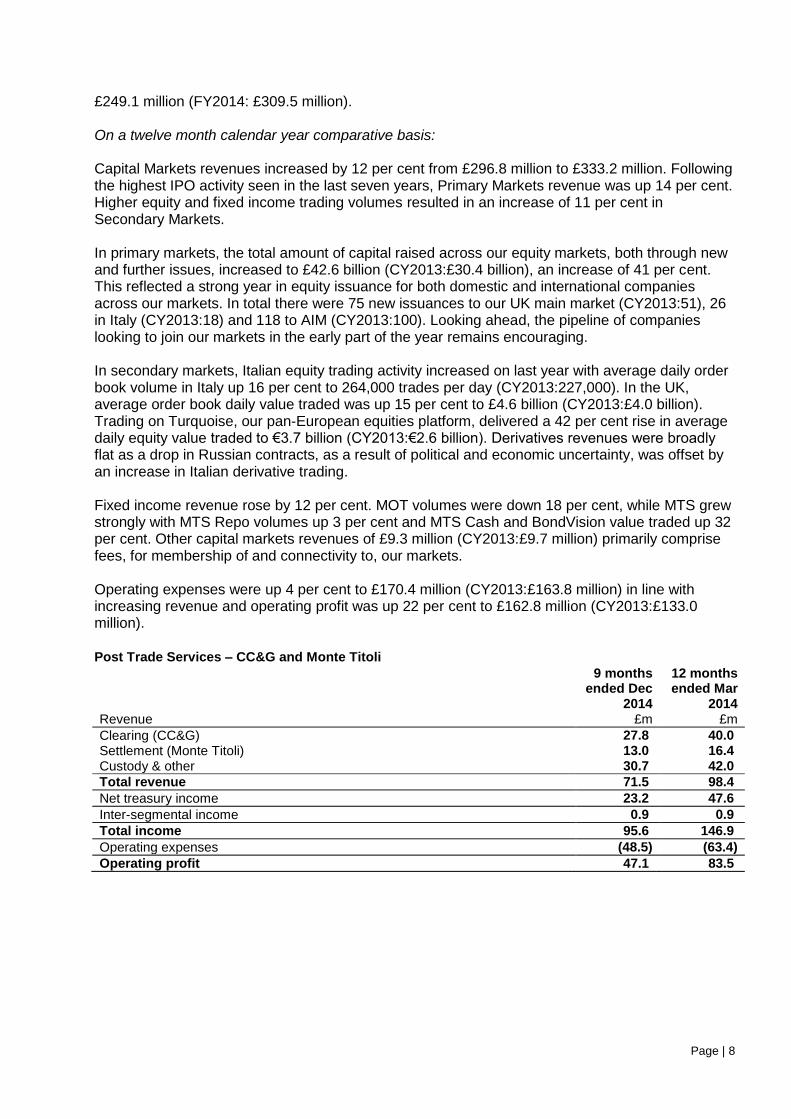
Capital Markets 9 month revenue, which comprises primary and secondary market activities, was
Page | 8
£249.1 million (FY2014: £309.5 million). On a twelve month calendar year comparative basis: Capital Markets revenues increased by 12 per cent from £296.8 million to £333.2 million. Following the highest IPO activity seen in the last seven years, Primary Markets revenue was up 14 per cent. Higher equity and fixed income trading volumes resulted in an increase of 11 per cent in Secondary Markets. In primary markets, the total amount of capital raised across our equity markets, both through new and further issues, increased to £42.6 billion (CY2013:£30.4 billion), an increase of 41 per cent. This reflected a strong year in equity issuance for both domestic and international companies across our markets. In total there were 75 new issuances to our UK main market (CY2013:51), 26 in Italy (CY2013:18) and 118 to AIM (CY2013:100). Looking ahead, the pipeline of companies looking to join our markets in the early part of the year remains encouraging. In secondary markets, Italian equity trading activity increased on last year with average daily order book volume in Italy up 16 per cent to 264,000 trades per day (CY2013:227,000). In the UK, average order book daily value traded was up 15 per cent to £4.6 billion (CY2013:£4.0 billion). Trading on Turquoise, our pan-European equities platform, delivered a 42 per cent rise in average daily equity value traded to €3.7 billion (CY2013:€2.6 billion). Derivatives revenues were broadly flat as a drop in Russian contracts, as a result of political and economic uncertainty, was offset by an increase in Italian derivative trading. Fixed income revenue rose by 12 per cent. MOT volumes were down 18 per cent, while MTS grew strongly with MTS Repo volumes up 3 per cent and MTS Cash and BondVision value traded up 32 per cent. Other capital markets revenues of £9.3 million (CY2013:£9.7 million) primarily comprise fees, for membership of and connectivity to, our markets. Operating expenses were up 4 per cent to £170.4 million (CY2013:£163.8 million) in line with increasing revenue and operating profit was up 22 per cent to £162.8 million (CY2013:£133.0 million). Post Trade Services – CC&G and Monte Titoli
9 months ended Dec
2014
12 months ended Mar
2014 Revenue £m £m
Clearing (CC&G) 27.8 40.0 Settlement (Monte Titoli) 13.0 16.4 Custody & other 30.7 42.0
Total revenue 71.5 98.4
Net treasury income 23.2 47.6
Inter-segmental income 0.9 0.9
Total income 95.6 146.9
Operating expenses (48.5) (63.4)
Operating profit 47.1 83.5
Page | 9
12 months ended Dec
2014 (unaudited)
12 months ended Dec
2013 (unaudited) Variance
Variance at organic
and constant currency
Revenue £m £m % %
Clearing (CC&G) 38.2 39.9 (4) 1 Settlement (Monte Titoli) 17.4 16.7 4 9 Custody & other 40.9 42.1 (3) 2
Total revenue 96.5 98.7 (2) 3
Net treasury income 32.6 59.2 (45) (42)
Inter-segmental income 1.1 0.5 114 86
Total income 130.2 158.4 (18) (14)
Operating expenses (67.3) (58.9) 14 16
Operating profit 62.9 99.5 (37) (32)
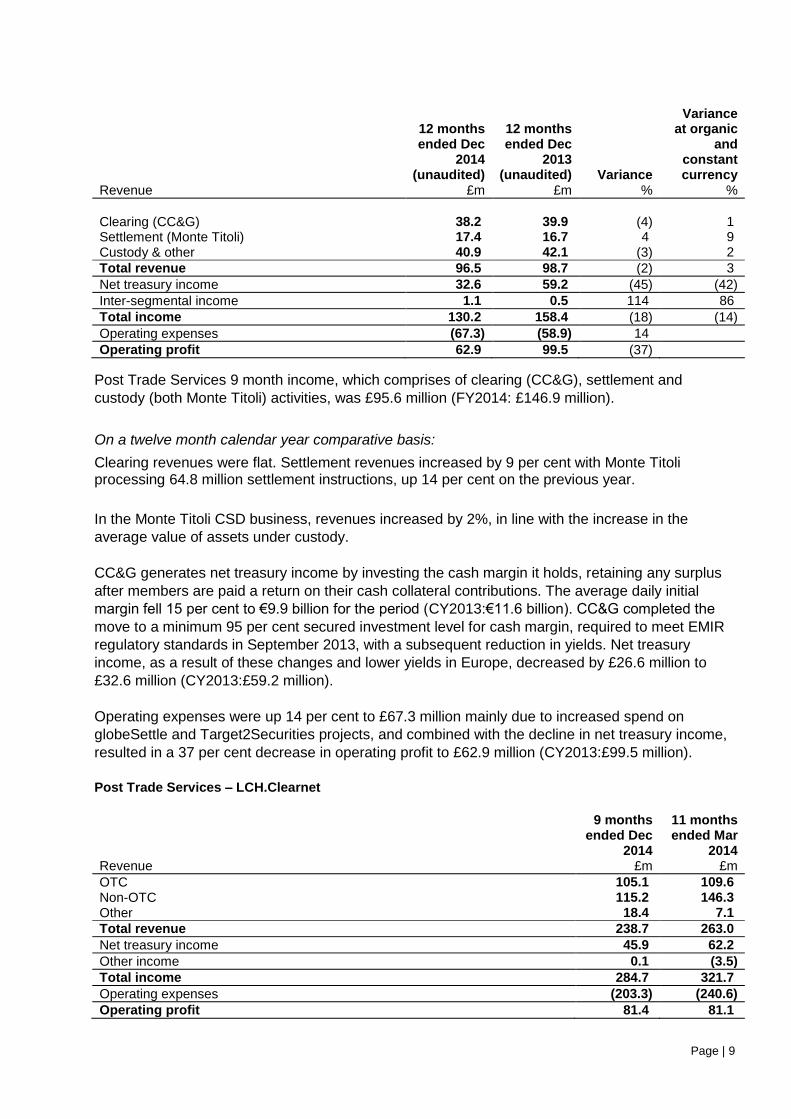
Post Trade Services 9 month income, which comprises of clearing (CC&G), settlement and
custody (both Monte Titoli) activities, was £95.6 million (FY2014: £146.9 million).
On a twelve month calendar year comparative basis:
Clearing revenues were flat. Settlement revenues increased by 9 per cent with Monte Titoli processing 64.8 million settlement instructions, up 14 per cent on the previous year.
In the Monte Titoli CSD business, revenues increased by 2%, in line with the increase in the
average value of assets under custody.
CC&G generates net treasury income by investing the cash margin it holds, retaining any surplus
after members are paid a return on their cash collateral contributions. The average daily initial
margin fell 15 per cent to €9.9 billion for the period (CY2013:€11.6 billion). CC&G completed the
move to a minimum 95 per cent secured investment level for cash margin, required to meet EMIR
regulatory standards in September 2013, with a subsequent reduction in yields. Net treasury
income, as a result of these changes and lower yields in Europe, decreased by £26.6 million to
£32.6 million (CY2013:£59.2 million).
Operating expenses were up 14 per cent to £67.3 million mainly due to increased spend on
globeSettle and Target2Securities projects, and combined with the decline in net treasury income,
resulted in a 37 per cent decrease in operating profit to £62.9 million (CY2013:£99.5 million).
Post Trade Services – LCH.Clearnet
9 months ended Dec
2014
11 months ended Mar
2014 Revenue £m £m
OTC 105.1 109.6 Non-OTC 115.2 146.3 Other 18.4 7.1
Total revenue 238.7 263.0
Net treasury income 45.9 62.2
Other income 0.1 (3.5)
Total income 284.7 321.7
Operating expenses (203.3) (240.6)
Operating profit 81.4 81.1
Page | 10
12 months ended Dec
2014 (unaudited)
8 months ended Dec
2013 (unaudited)
Variance Variance at organic
and constant
currency1
Revenue £m £m % %
OTC 138.2 76.4 81 34 Non-OTC 159.8 101.8 57 8 Other 31.4 (5.9) - -
Total revenue 329.4 172.3 91 34
Net treasury income 60.0 48.1 25 (13)
Other income (0.5) (2.9) - -
Total income 388.9 217.5 79 24
Operating expenses (275.0) (168.3) 63 50
Operating profit 113.9 49.2 132 156 1 LCH organic and constant currency comparison include the published revenues for the period from January to April 2013 prior to
acquisition
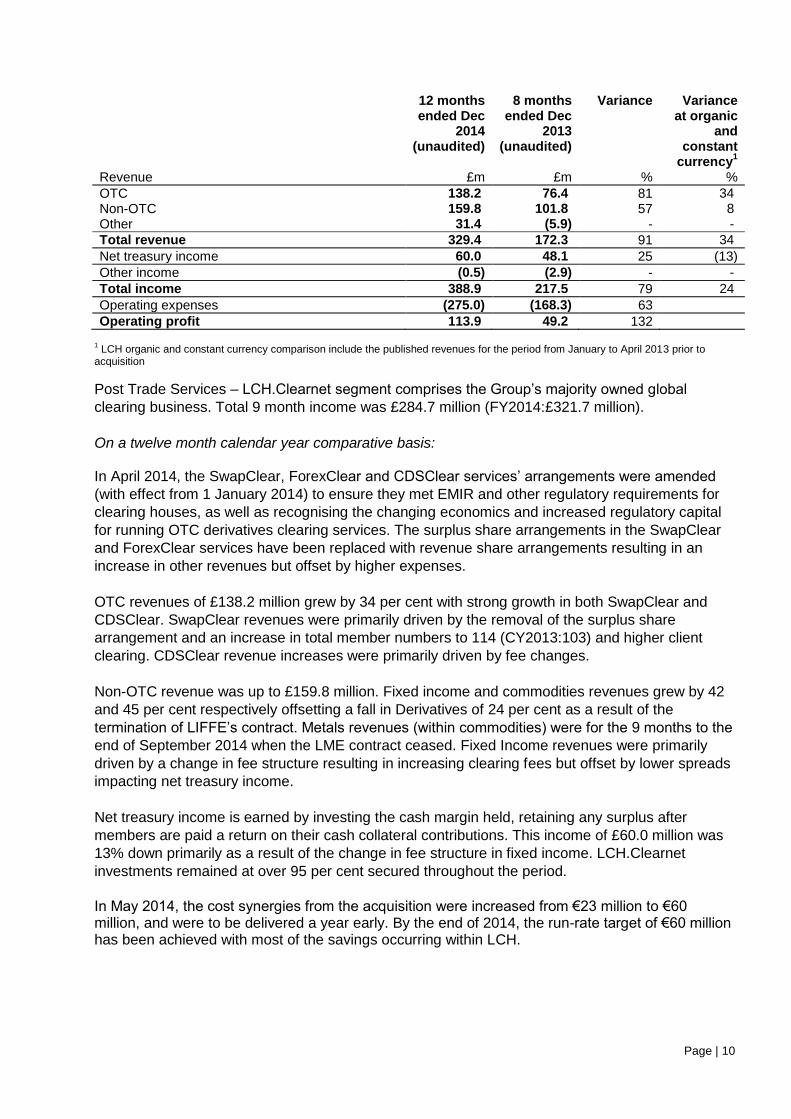
Post Trade Services – LCH.Clearnet segment comprises the Group’s majority owned global
clearing business. Total 9 month income was £284.7 million (FY2014:£321.7 million).
On a twelve month calendar year comparative basis:
In April 2014, the SwapClear, ForexClear and CDSClear services’ arrangements were amended
(with effect from 1 January 2014) to ensure they met EMIR and other regulatory requirements for
clearing houses, as well as recognising the changing economics and increased regulatory capital
for running OTC derivatives clearing services. The surplus share arrangements in the SwapClear
and ForexClear services have been replaced with revenue share arrangements resulting in an
increase in other revenues but offset by higher expenses.
OTC revenues of £138.2 million grew by 34 per cent with strong growth in both SwapClear and
CDSClear. SwapClear revenues were primarily driven by the removal of the surplus share
arrangement and an increase in total member numbers to 114 (CY2013:103) and higher client
clearing. CDSClear revenue increases were primarily driven by fee changes.
Non-OTC revenue was up to £159.8 million. Fixed income and commodities revenues grew by 42
and 45 per cent respectively offsetting a fall in Derivatives of 24 per cent as a result of the
termination of LIFFE’s contract. Metals revenues (within commodities) were for the 9 months to the
end of September 2014 when the LME contract ceased. Fixed Income revenues were primarily
driven by a change in fee structure resulting in increasing clearing fees but offset by lower spreads
impacting net treasury income.
Net treasury income is earned by investing the cash margin held, retaining any surplus after
members are paid a return on their cash collateral contributions. This income of £60.0 million was
13% down primarily as a result of the change in fee structure in fixed income. LCH.Clearnet
investments remained at over 95 per cent secured throughout the period.
In May 2014, the cost synergies from the acquisition were increased from €23 million to €60 million, and were to be delivered a year early. By the end of 2014, the run-rate target of €60 million has been achieved with most of the savings occurring within LCH.
Page | 11
Information Services
9 months ended Dec
2014
12 months ended Mar
2014 Revenue £m £m
FTSE revenues 140.7 174.0 Russell Indexes 10.0 0.0 Real Time Data 61.0 90.8 Other information services 69.3 83.9
Total revenue 281.0 348.7
Operating expenses (135.9) (179.0)
Operating profit 145.1 169.7
12 months ended Dec
2014 (unaudited)
12 months ended Dec
2013 (unaudited) Variance
Variance at organic
and constant currency
Revenue £m £m % %
FTSE revenues 186.8 164.5 14 14 Russell Indexes 10.0 0.0 - - Real time data 84.3 94.4 (11) (9) Other information services 91.9 80.6 14 16
Total revenue 373.0 339.5 10 8
Operating expenses (182.9) (178.1) 3
(1)
Operating profit 190.1 161.4 18 16
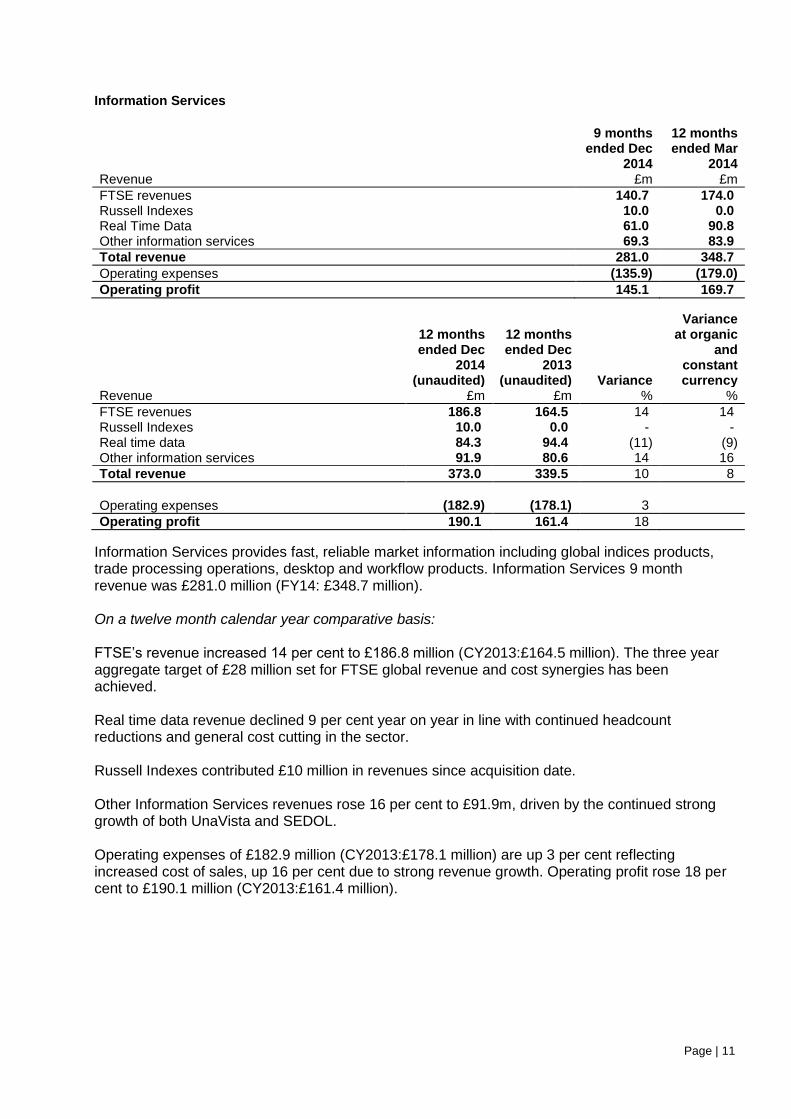
Information Services provides fast, reliable market information including global indices products, trade processing operations, desktop and workflow products. Information Services 9 month revenue was £281.0 million (FY14: £348.7 million). On a twelve month calendar year comparative basis: FTSE’s revenue increased 14 per cent to £186.8 million (CY2013:£164.5 million). The three year aggregate target of £28 million set for FTSE global revenue and cost synergies has been achieved. Real time data revenue declined 9 per cent year on year in line with continued headcount reductions and general cost cutting in the sector. Russell Indexes contributed £10 million in revenues since acquisition date. Other Information Services revenues rose 16 per cent to £91.9m, driven by the continued strong growth of both UnaVista and SEDOL. Operating expenses of £182.9 million (CY2013:£178.1 million) are up 3 per cent reflecting increased cost of sales, up 16 per cent due to strong revenue growth. Operating profit rose 18 per cent to £190.1 million (CY2013:£161.4 million).
Page | 12
Technology Services
9 months ended Dec
2014
12 months ended Mar
2014 Revenue £m £m
Millennium IT 19.6 31.5 Technology 27.7 32.5
Total revenue 47.3 64.0
Inter-segmental revenue 7.1 10.9
Total income 54.4 74.9
Operating expenses (49.8) (63.1)
Operating profit 4.6 11.8
12 months ended Dec
2014 (unaudited)
12 months ended Dec
2013 (unaudited)
Variance Variance at organic
and constant currency
Revenue £m £m % %
Millennium IT 29.7 29.3 1 8 Technology 36.3 32.9 10 13
Total revenue 66.0 62.2 6 11
Inter-segmental revenue 10.1 16.5 (39) (35)
Total income 76.1 78.7 (3) 1
Operating expenses (64.1) (57.3) 12 53
Operating profit 12.0 21.4 (44) (66)
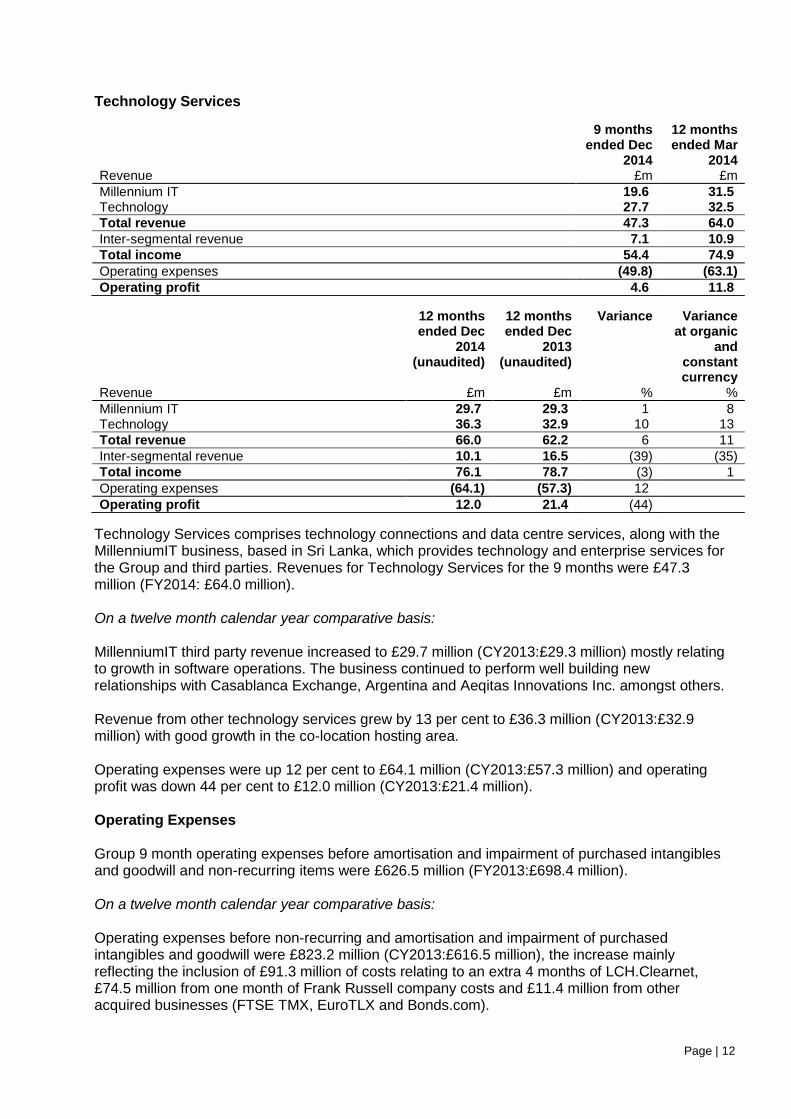
Technology Services comprises technology connections and data centre services, along with the MillenniumIT business, based in Sri Lanka, which provides technology and enterprise services for the Group and third parties. Revenues for Technology Services for the 9 months were £47.3 million (FY2014: £64.0 million). On a twelve month calendar year comparative basis: MillenniumIT third party revenue increased to £29.7 million (CY2013:£29.3 million) mostly relating to growth in software operations. The business continued to perform well building new relationships with Casablanca Exchange, Argentina and Aeqitas Innovations Inc. amongst others. Revenue from other technology services grew by 13 per cent to £36.3 million (CY2013:£32.9 million) with good growth in the co-location hosting area. Operating expenses were up 12 per cent to £64.1 million (CY2013:£57.3 million) and operating profit was down 44 per cent to £12.0 million (CY2013:£21.4 million). Operating Expenses Group 9 month operating expenses before amortisation and impairment of purchased intangibles and goodwill and non-recurring items were £626.5 million (FY2013:£698.4 million). On a twelve month calendar year comparative basis: Operating expenses before non-recurring and amortisation and impairment of purchased intangibles and goodwill were £823.2 million (CY2013:£616.5 million), the increase mainly reflecting the inclusion of £91.3 million of costs relating to an extra 4 months of LCH.Clearnet, £74.5 million from one month of Frank Russell company costs and £11.4 million from other acquired businesses (FTSE TMX, EuroTLX and Bonds.com).
Page | 13
Operating expenses were 5 per cent higher on an organic basis after removing currency variances of £4.1 million. Organic growth, including inflation, of £33.6 million included the impact of several one-off items and the amendment of OTC services’ arrangements in LCH.Clearnet resulting in higher expenses (offset by higher revenues). Non-Recurring Items Non-recurring items include an impairment of £21.8 million relating to licenses recognised on the acquisition of the LCH.Clearnet Group, £54.6 million in transaction costs primarily relating to the acquisition of Frank Russell Company and £11.6 million of integration costs. Impact of Frank Russell Company
Following the acquisition of Frank Russell Company on 2 December 2014, £15.3 million adjusted
operating profit has been consolidated into the Group. The Index business generated gross
income of £10.0 million with a further £79.7 million from the Investment Management and other
business. Total ETF assets under management benchmarked to Russell Indexes as at the end of
December 2014 was $153 billion, with assets under management of $273 billion for the Investment
Management business. On 5 February 2015, LSEG announced it was exploring the sale of the
Russell Investment Management business.
Finance income and expense and taxation On a twelve month basis net finance costs were £68.1 million, up £0.9 million on the prior year including £1.8 million of arrangement fees paid for £600 million of new, committed credit facilities arranged to underpin the financing of Frank Russell Company. The Group’s effective tax rate on profit before amortisation of purchased intangibles and non-recurring items was 25.6 per cent, lower than the last period (March 2014: 28.2 per cent). This reflects the on-going reduction in the UK statutory corporation tax rate to 21 per cent (March 2014: 23 per cent) and the reversal of the temporary increase in Italian corporate tax of 8.5 per cent. This is offset by the consolidation of Frank Russell Company effective 2 December 2014 which is taxed predominantly in the US where profits are subject to minimum combined federal tax and state tax rates of 35 per cent. Cash flow and balance sheet
The Group’s business continued to be strongly cash generative during the period, with cash
generated from operations of £413.4 million. Total investment in the period, net of dividends
received, was £1,456.3 million principally due to the Group investing in the acquisitions of Frank
Russell Company and Bonds.com and £59.2 million of capital expenditure offset by acquired cash
from acquisitions of £290.8 million.
At 31 December 2014, the Group had net assets of £2,955.3 million (FY2014: £2,003.0 million), the increase in the period reflecting an equity base bolstered by the Rights Issue successfully undertaken in September 2014. Intangible assets increased by £1,822.3 million, mainly reflecting goodwill and purchased intangibles recognised from the purchase of Frank Russell Company. The central counterparty clearing business assets and liabilities within LCH.Clearnet and CC&G largely offset each other but are shown gross on the balance sheet as the amounts receivable and payable are with different counterparties.
Page | 14
Net debt, Facilities and Credit Ratings
At 31 December 2014, the Group had operating net debt of £1,587.4 million after adjusting for
£1,011.3 million of cash and cash equivalents held to support regulatory and operational
requirements, including cash and cash equivalents set aside by Frank Russell Company mainly to
support its investment management activities and all cash and cash equivalents at LCH.Clearnet
Group together with a further £200 million covering requirements at other LSEG companies.
The Group’s gross borrowings increased by £502.7 million during the 9 months to 31 December
2014 reflecting the financing of the acquisitions of Frank Russell Company and Bonds.com which
extend the Group’s North American footprint.
In June 2014, the Group signed a new £600 million unsecured, revolving bank facility package, on
improved terms, to provide additional debt headroom ahead of the Frank Russell Company
acquisition and financial flexibility for the medium term. The new facility is committed for up to 3
years providing the Group with a degree of optionality over the shorter end of its debt maturity
profile. At 31 December 2014, the Group had debt and drawn committed credit lines totalling
£1,726.4 million, with maturities extending from July 2016 out to 2021. With over £500 million of
undrawn bank lines currently available, together with continuing strong cash generation, the Group
also remains well positioned to fund future growth.
The Group’s interest cover (the coverage of net finance expense by earnings before interest, taxation, depreciation and amortisation, both before non-recurring items) increased to 9.4 times (March 2014: 8.6 times) due to a favourable change in the mix of net finance costs during the 9 months to 31 December 2014 covered by improving EBITDA. Whilst the Group’s organic cash generation remained strong, leverage had increased by the second half of the year following the partially debt funded acquisition of Frank Russell Company. Net adjusted leverage peaked below 2.4 times in early December 2014 with debt levels controlled through a successful Rights Issue which had raised over £960 million, before associated costs, two months earlier. As at 31 December 2014, operating net debt to adjusted EBITDA was 2.1 times (March 2014: 1.9 times) with the position expected to remain above Group’s target range for leverage of one to two times for a temporary period.
The Group’s long term credit ratings remained a point of focus during the 9 months to 31 December 2014. Standard & Poor’s resolved its credit watch linked to the Group’s de-leveraging progress following the LCH.Clearnet majority acquisition in 2013 by affirming its A- long term rating of LSEG and re-affirmed the rating again following the acquisition of Frank Russell Company later in 2014. However, as part of its work on LSEG, Standard & Poor’s also concluded its “rating above the sovereign” assessment of the Group, which focused on a stress to our Italian operations , (deemed a material contributor to the Group’s consolidated revenues), and concluded that, for the first time, a direct link to the rating of Italy should be established. Standard & Poor’s downgraded Italy to BBB- in December 2014 and, therefore, LSEG’s rating followed with a one notch downgrade to BBB+. Standard & Poor’s simultaneously affirmed LCH.Clearnet’s rating at A+ with a stable outlook. Moody’s continues to rate LSEG at Baa2 and both Moody’s and Standard & Poor’s had assigned a negative outlook against their respective ratings as at 31 December 2014 pending progress on deleveraging following the implementation of the comprehensive review of the Frank Russell Company investment management business.
Page | 15
Foreign Exchange
The Group’s principal foreign exchange exposure arises as a result of translating its foreign
currency earnings, assets and liabilities into LSEG’s reporting currency of sterling. For the 12
months to the 31 December 2014, the principal exposure for the Group remained its European
based euro reporting businesses. A €10c movement in the average £/€ rate for the year would
have changed the Group’s operating profit for the year before amortisation of purchased
intangibles and non-recurring items by approximately £26 million.
Our two recent US based acquisitions will re-balance the Group’s operational currency mix, increasing the US dollar contribution to earnings and diversifying our FX exposure. The Group manages its translation risk exposure by matching the currency of its debt (including debt effectively swapped from sterling into currency) to the currency of its earnings, where possible, to ensure its key financial metrics are protected from material foreign exchange rate volatility. The debt funded element of the acquisition of the Frank Russell Company was US dollar denominated, appropriately sized to broadly balance against the Group’s projected US dollar earnings component.
Earnings per Share
The Group recorded adjusted basic earnings per share, which excludes amortisation and
impairment of purchased intangible assets and goodwill, non-recurring items and unrealisable
gains/losses on investments, of 75.6 pence. On a twelve month comparative basis adjusted basic
earning per share was 103.3 pence, a rise of 7 per cent. Basic earning per share were 37.9 pence.
On a twelve month calendar year comparative basis basic earnings per share decreased by 12 per
cent to 56.5 pence (CY2013:64.2 pence) as a result of increased amortisation, transaction costs,
interest payments following the acquisition of Frank Russell Company and impairments to licenses
relating to the LCH.Clearnet acquisition.
Dividend The Board is proposing a final dividend of 12.8 pence per share, an increase of 6.5 per cent on an equivalent basis. This results in a total dividend of 22.5 pence per share for the 9 month period, equivalent to 75 per cent of the dividend that would have been paid for a full 12 month period. The final dividend will be paid on 2 June 2015, to shareholders on the register as at 8 May 2015. The Group remains committed to a progressive dividend policy, paying sustainable interim and final dividends split approximately on a one-third/two-thirds basis respectively.
Page | 16
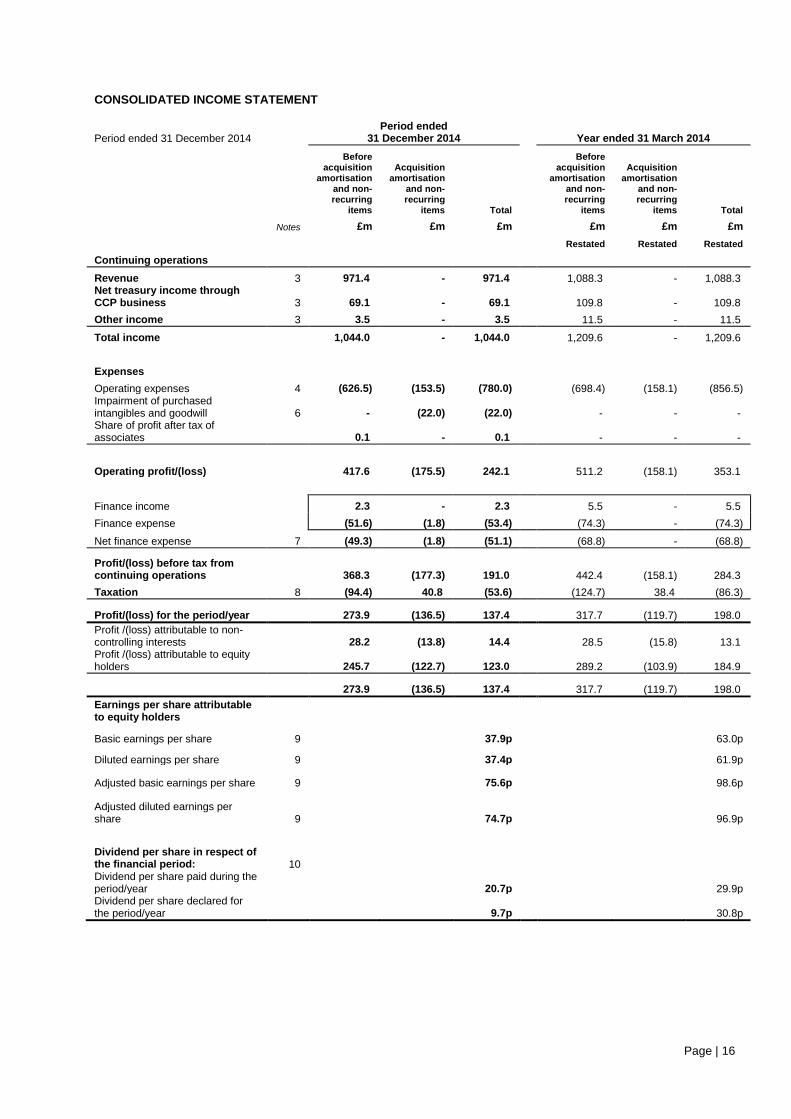
CONSOLIDATED INCOME STATEMENT
Period ended 31 December 2014 Period ended
31 December 2014 Year ended 31 March 2014
Before acquisition
amortisation and non-recurring
items
Acquisition amortisation
and non-recurring
items Total
Before acquisition
amortisation and non-recurring
items
Acquisition amortisation
and non-recurring
items Total
Notes £m £m £m £m £m £m
Restated Restated Restated
Continuing operations
Revenue 3 971.4 - 971.4 1,088.3 - 1,088.3 Net treasury income through CCP business 3 69.1 - 69.1 109.8 - 109.8
Other income 3 3.5 - 3.5 11.5 - 11.5
Total income 1,044.0 - 1,044.0 1,209.6 - 1,209.6
Expenses
Operating expenses 4 (626.5) (153.5) (780.0) (698.4) (158.1) (856.5) Impairment of purchased intangibles and goodwill 6 - (22.0) (22.0) - - - Share of profit after tax of associates 0.1 - 0.1 - - -
Operating profit/(loss) 417.6 (175.5) 242.1 511.2 (158.1) 353.1
Finance income 2.3 - 2.3 5.5 - 5.5
Finance expense (51.6) (1.8) (53.4) (74.3) - (74.3)
Net finance expense 7 (49.3) (1.8) (51.1) (68.8) - (68.8)
Profit/(loss) before tax from continuing operations 368.3 (177.3) 191.0 442.4 (158.1) 284.3
Taxation 8 (94.4) 40.8 (53.6) (124.7) 38.4 (86.3)
Profit/(loss) for the period/year 273.9 (136.5) 137.4 317.7 (119.7) 198.0
Profit /(loss) attributable to non-controlling interests 28.2 (13.8) 14.4 28.5 (15.8) 13.1 Profit /(loss) attributable to equity holders 245.7 (122.7) 123.0 289.2 (103.9) 184.9
273.9 (136.5) 137.4 317.7 (119.7) 198.0
Earnings per share attributable to equity holders
Basic earnings per share 9 37.9p 63.0p
Diluted earnings per share 9 37.4p 61.9p
Adjusted basic earnings per share 9 75.6p 98.6p
Adjusted diluted earnings per share 9 74.7p 96.9p
Dividend per share in respect of the financial period: 10 Dividend per share paid during the period/year 20.7p 29.9p Dividend per share declared for the period/year 9.7p 30.8p
Page | 17
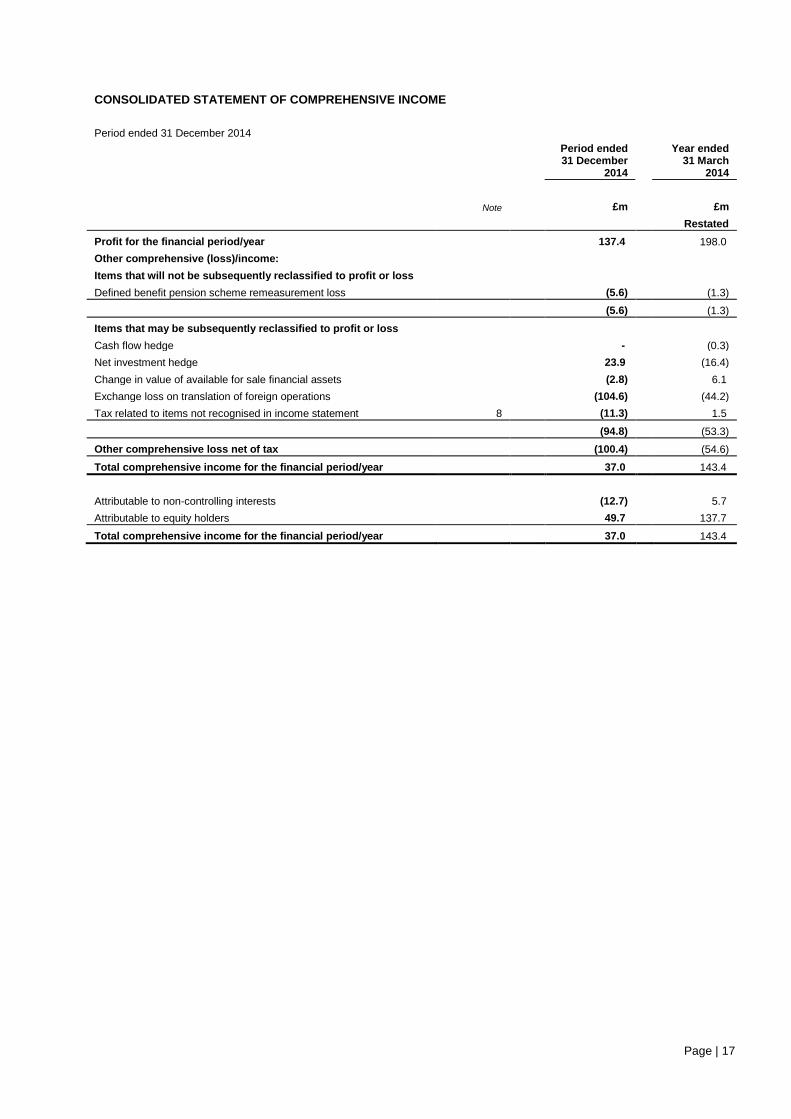
CONSOLIDATED STATEMENT OF COMPREHENSIVE INCOME
Period ended 31 December 2014
Period ended 31 December
2014
Year ended 31 March
2014
Note £m £m
Restated
Profit for the financial period/year 137.4 198.0
Other comprehensive (loss)/income:
Items that will not be subsequently reclassified to profit or loss
Defined benefit pension scheme remeasurement loss (5.6) (1.3)
(5.6) (1.3)
Items that may be subsequently reclassified to profit or loss
Cash flow hedge - (0.3)
Net investment hedge 23.9 (16.4)
Change in value of available for sale financial assets (2.8) 6.1
Exchange loss on translation of foreign operations (104.6) (44.2)
Tax related to items not recognised in income statement 8 (11.3) 1.5
(94.8) (53.3)
Other comprehensive loss net of tax (100.4) (54.6)
Total comprehensive income for the financial period/year 37.0 143.4
Attributable to non-controlling interests (12.7) 5.7
Attributable to equity holders 49.7 137.7
Total comprehensive income for the financial period/year 37.0 143.4

Page | 18
BALANCE SHEET
31 December 2014 31 December 2014 31 March 2014 31 March 2013
Notes £m £m £m
Restated Restated
Assets
Non-current assets
Property, plant and equipment 115.6 93.3 80.1
Intangible assets 11 4,492.0 2,669.7 2,238.7
Investment in associates 12.1 0.3 0.6
Investment in subsidiary undertakings - - -
Deferred tax assets 12 76.5 42.2 19.2
Derivative financial instruments 13 22.7 6.7 4.3
Available for sale investments 13 4.8 4.8 -
Retirement benefit asset 16.0 14.5 -
Other non-current assets 13 64.8 38.0 12.0
4,804.5 2,869.5 2,354.9
Current assets
Inventories 6.6 0.5 1.5
Trade and other receivables 571.1 250.5 185.7
Derivative financial instruments 13 0.4 - -
CCP financial assets 429,952.8 476,424.4 137,620.2
CCP cash and cash equivalents (restricted) 21,493.0 27,351.8 8,476.2
CCP clearing business assets 13 451,445.8 503,776.2 146,096.4
Current tax 24.3 22.3 24.6
Assets held at fair value 13 12.4 18.7 6.1
Cash and cash equivalents 1,127.2 919.2 446.2
453,187.8 504,987.4 146,760.5
Assets held for sale 5.3 - -
Total assets 457,997.6 507,856.9 149,115.4
Liabilities
Current liabilities
Trade and other payables 727.4 401.5 230.0
Derivative financial instruments 13 - 3.4 0.1
CCP clearing business liabilities 13 451,467.5 503,747.4 146,088.1
Current tax 51.6 14.8 43.2
Borrowings 14 789.9 278.7 0.4
Provisions 27 0.9 2.8 1.1
453,037.3 504,448.6 146,362.9
Non-current liabilities
Borrowings 14 936.5 945.0 796.4
Other non-current payables 13 73.3 - 3.4
Derivative financial instruments 13 - 4.0 3.5
Deferred income 4.9 - -
Deferred tax liabilities 12 859.5 323.6 267.1
Retirement benefit obligations 39.8 36.9 25.6
Other non-current liabilities 13 77.5 79.2 -
Provisions 13.5 16.6 26.2
2,005.0 1,405.3 1,122.2
Total liabilities 455,042.4 505,853.9 147,485.1
Net assets 2,955.3 2,003.0 1,630.3
Equity
Capital and reserves attributable to the Company's equity holders
Ordinary share capital 16 23.9 18.8 18.8
Share premium 16 957.7 - -
Retained earnings/(losses) 20.0 (46.2) (108.8)
Other reserves 1,524.9 1,592.4 1,644.4
Total shareholders' funds 2,526.5 1,565.0 1,554.4
Non-controlling interests 428.8 438.0 75.9
Total equity 2,955.3 2,003.0 1,630.3
Page | 19
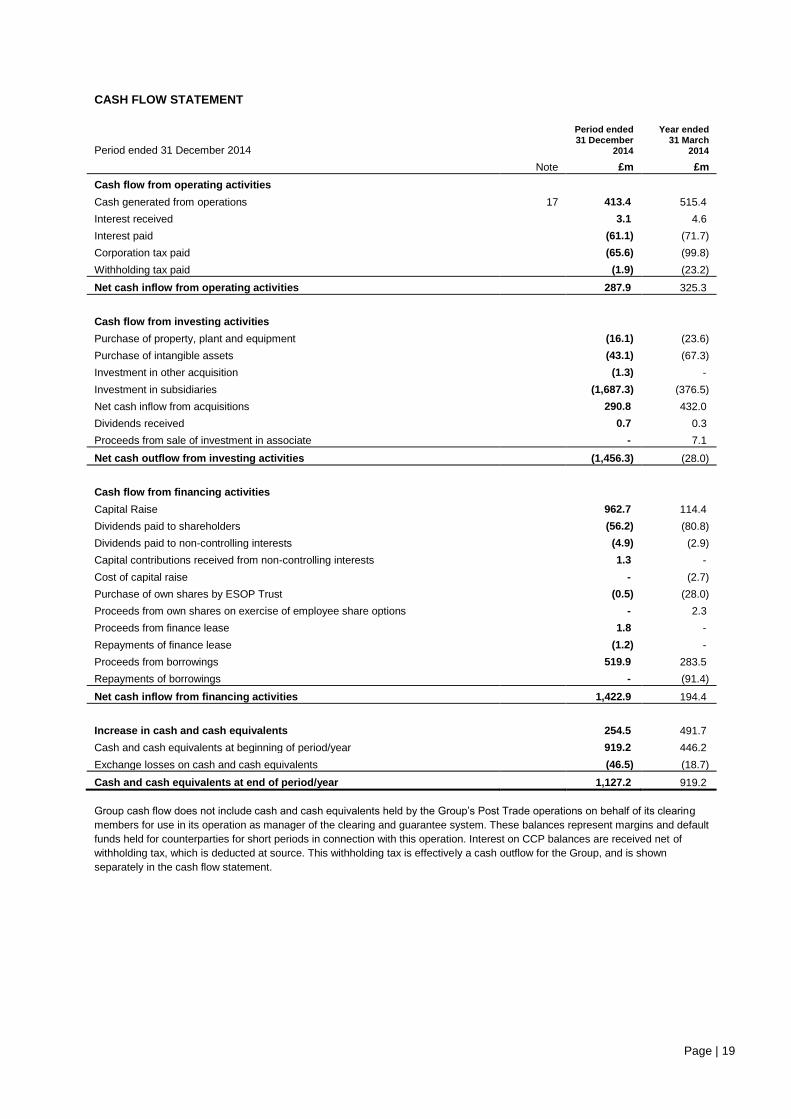
CASH FLOW STATEMENT
Period ended 31 December 2014
Period ended 31 December
2014
Year ended 31 March
2014
Note £m £m
Cash flow from operating activities
Cash generated from operations 17 413.4 515.4
Interest received 3.1 4.6
Interest paid (61.1) (71.7)
Corporation tax paid (65.6) (99.8)
Withholding tax paid (1.9) (23.2)
Net cash inflow from operating activities 287.9 325.3
Cash flow from investing activities
Purchase of property, plant and equipment (16.1) (23.6)
Purchase of intangible assets (43.1) (67.3)
Investment in other acquisition (1.3) -
Investment in subsidiaries (1,687.3) (376.5)
Net cash inflow from acquisitions 290.8 432.0
Dividends received 0.7 0.3
Proceeds from sale of investment in associate - 7.1
Net cash outflow from investing activities (1,456.3) (28.0)
Cash flow from financing activities
Capital Raise 962.7 114.4
Dividends paid to shareholders (56.2) (80.8)
Dividends paid to non-controlling interests (4.9) (2.9)
Capital contributions received from non-controlling interests 1.3 -
Cost of capital raise - (2.7)
Purchase of own shares by ESOP Trust (0.5) (28.0)
Proceeds from own shares on exercise of employee share options - 2.3
Proceeds from finance lease 1.8 -
Repayments of finance lease (1.2) -
Proceeds from borrowings 519.9 283.5
Repayments of borrowings - (91.4)
Net cash inflow from financing activities 1,422.9 194.4
Increase in cash and cash equivalents 254.5 491.7
Cash and cash equivalents at beginning of period/year 919.2 446.2
Exchange losses on cash and cash equivalents (46.5) (18.7)
Cash and cash equivalents at end of period/year 1,127.2 919.2
Group cash flow does not include cash and cash equivalents held by the Group’s Post Trade operations on behalf of its clearing
members for use in its operation as manager of the clearing and guarantee system. These balances represent margins and default
funds held for counterparties for short periods in connection with this operation. Interest on CCP balances are received net of
withholding tax, which is deducted at source. This withholding tax is effectively a cash outflow for the Group, and is shown
separately in the cash flow statement.
Page | 20
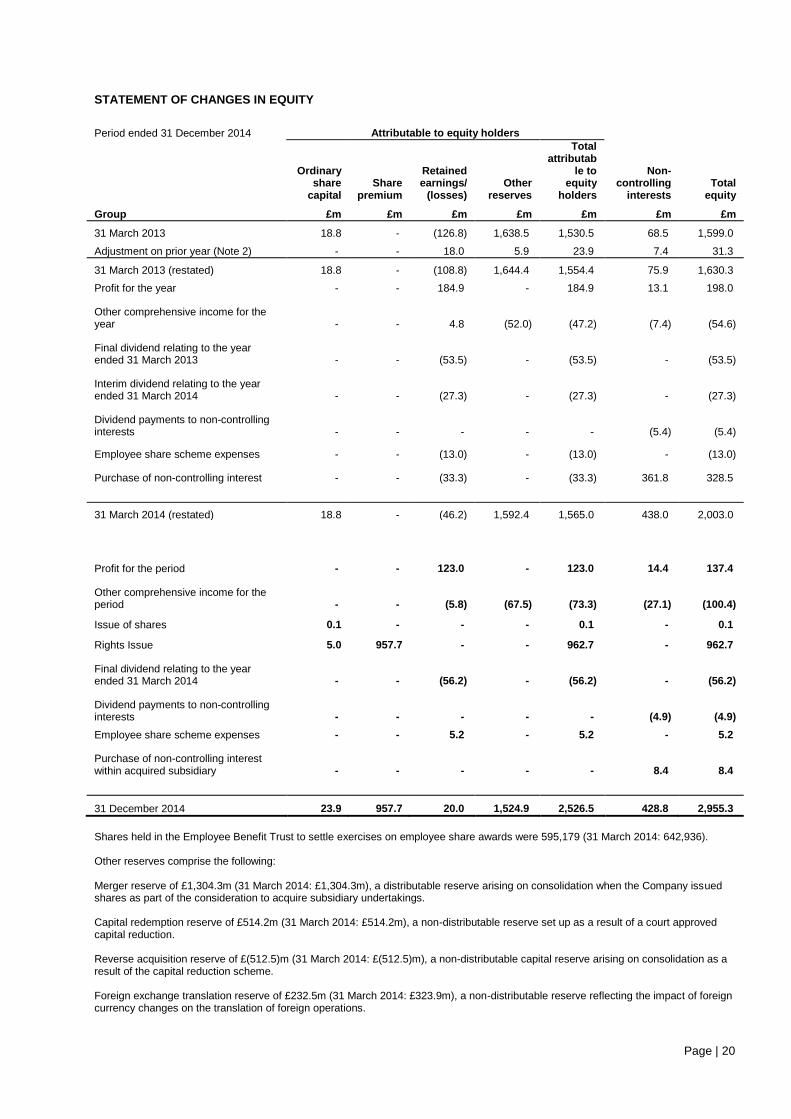
STATEMENT OF CHANGES IN EQUITY
Period ended 31 December 2014 Attributable to equity holders
Ordinary share
capital Share
premium
Retained earnings/
(losses) Other
reserves
Total attributab
le to equity
holders
Non-controlling
interests Total
equity
Group £m £m £m £m £m £m £m
31 March 2013 18.8 - (126.8) 1,638.5 1,530.5 68.5 1,599.0
Adjustment on prior year (Note 2) - - 18.0 5.9 23.9 7.4 31.3
31 March 2013 (restated) 18.8 - (108.8) 1,644.4 1,554.4 75.9 1,630.3
Profit for the year - - 184.9 - 184.9 13.1 198.0
Other comprehensive income for the year - - 4.8 (52.0) (47.2) (7.4) (54.6)
Final dividend relating to the year ended 31 March 2013 - - (53.5) - (53.5) - (53.5)
Interim dividend relating to the year ended 31 March 2014 - - (27.3) - (27.3) - (27.3)
Dividend payments to non-controlling interests - - - - - (5.4) (5.4)
Employee share scheme expenses - - (13.0) - (13.0) - (13.0)
Purchase of non-controlling interest - - (33.3) - (33.3) 361.8 328.5
31 March 2014 (restated) 18.8 - (46.2) 1,592.4 1,565.0 438.0 2,003.0
Profit for the period - - 123.0 - 123.0 14.4 137.4
Other comprehensive income for the period - - (5.8) (67.5) (73.3) (27.1) (100.4)
Issue of shares 0.1 - - - 0.1 - 0.1
Rights Issue 5.0 957.7 - - 962.7 - 962.7
Final dividend relating to the year ended 31 March 2014 - - (56.2) - (56.2) - (56.2)
Dividend payments to non-controlling interests - - - - - (4.9) (4.9)
Employee share scheme expenses - - 5.2 - 5.2 - 5.2
Purchase of non-controlling interest within acquired subsidiary - - - - - 8.4 8.4
31 December 2014 23.9 957.7 20.0 1,524.9 2,526.5 428.8 2,955.3
Shares held in the Employee Benefit Trust to settle exercises on employee share awards were 595,179 (31 March 2014: 642,936). Other reserves comprise the following: Merger reserve of £1,304.3m (31 March 2014: £1,304.3m), a distributable reserve arising on consolidation when the Company issued shares as part of the consideration to acquire subsidiary undertakings. Capital redemption reserve of £514.2m (31 March 2014: £514.2m), a non-distributable reserve set up as a result of a court approved capital reduction. Reverse acquisition reserve of £(512.5)m (31 March 2014: £(512.5)m), a non-distributable capital reserve arising on consolidation as a result of the capital reduction scheme. Foreign exchange translation reserve of £232.5m (31 March 2014: £323.9m), a non-distributable reserve reflecting the impact of foreign currency changes on the translation of foreign operations.
Page | 21
Hedging reserve of £(13.6)m (31 March 2014: £(37.5)m), a non-distributable reserve representing the cumulative fair value adjustment recognised in respect of net investment and cash flow hedges undertaken in accordance with hedge accounting principles. NOTES TO THE FINANCIAL STATEMENTS
1. Basis of preparation and accounting policies The Group’s consolidated financial statements are prepared in accordance with International Financial Reporting Standards (IFRS) and IFRS Interpretations Committee (IFRIC) interpretations endorsed by the European Union, and with those parts of the Companies Act 2006 applicable to companies reporting under IFRS. The principal accounting policies applied in the preparation of these consolidated financial statements are set out below. These policies have been consistently applied to all the periods presented, unless otherwise stated. The financial statements are prepared under the historical cost convention as modified by the revaluation of assets and liabilities held at fair value and on the basis of the Group’s accounting policies. The Group uses a columnar format for the presentation of its consolidated income statement. This enables the Group to aid the reader’s understanding of its results by presenting profit for the year before amortisation of purchased intangible assets and non-recurring items. This is the profit measure used to calculate adjusted earnings per share and is considered to be the most appropriate as it best reflects the Group’s underlying, recurring cash earnings and is the primary measure of performance monitored by the Group’s Executive Committee. Profit before acquisition amortisation and non-recurring items is reconciled to profit before taxation on the face of the income statement. The Group has changed its financial year end to 31 December. As a consequence, the financial statements shows results for 9 months to 31 December 2014, with the comparatives remaining for the year to 31 March 2014. Consolidation The consolidated financial statements comprise the financial statements of the Company and its subsidiaries with all inter-company balances and transactions eliminated, together with the Group’s attributable share of the results of associates. The results of subsidiaries sold or acquired are included in the income statement up to, or from, the date that control passes. Control is achieved when the Group is exposed, or has rights, to variable returns from its involvement with the investee and has the ability to affect those returns through its power over the investee. As permitted by Section 408 of the Companies Act 2006, the Company’s income statement has not been included in these financial statements. Investments in associates are accounted for under the equity method. The Group’s investments in associates are initially recognised at cost, and its share of profits or losses after tax from associates is included in the consolidated income statement. Cumulative post-acquisition movements are adjusted against the carrying amount of the investment in the Group’s balance sheet. The financial statements of associates are used by the Group to apply the equity method, under which the Group’s income statement reflects the Group’s share of the results of operations of the associates. A company is considered an associate where the Group has a significant influence. Significant influence is the power to participate in the financial and operating policy decisions of the investee, but is not control or joint control over those policies. The acquisition of subsidiaries is accounted for using the purchase method. The cost of the acquisition is measured at the aggregate of the fair values, at the date of exchange, of assets given, liabilities incurred or assumed, and equity instruments issued by the Group in exchange for control of the acquiree. Adjustments to fair values include those made to bring accounting policies into line with those of the Group. The Group applies a policy of treating transactions with non-controlling interests through the economic entity model. Transactions with non-controlling interests are recognised in equity. Where the non-controlling interest has an option to dispose of their holding to the Group, then these costs are recognised at the fair value of the option at the balance sheet date.
Recent accounting developments The following standards and interpretations have been issued by the International Accounting Standards Board (IASB) and IFRIC and have been adopted in these financial statements: IFRS 10, ‘Consolidated financial statements’ and amendments regarding control; IFRS 11, ‘Joint arrangements’ ; IFRS 12, ‘Disclosure of interests in other entities’ and amendments; Amendments to IAS 19, ‘Employee Benefits’ on Defined Benefit Plans: Employee Contributions; IAS 27 (Revised 2011), ‘Separate financial statements’ and amendments; IAS 28 (Revised 2011), ‘Associates and joint ventures’; Amendments to IAS 32, ‘Financial instruments: Presentation’ on Offsetting Financial Assets and Financial Liabilities; Amendments to IAS 36, ‘Impairment of assets’ on recoverable amount disclosures; Amendment to IAS 39 ‘Financial instruments: Recognition and measurement’, on novation of derivatives and hedge accounting; Annual Improvements 2010-2012 and Annual Improvements 2011-2013; and IFRIC 21, ‘Levies’. The adoption of these standards did not have a material impact on these consolidated financial statements.
Page | 22
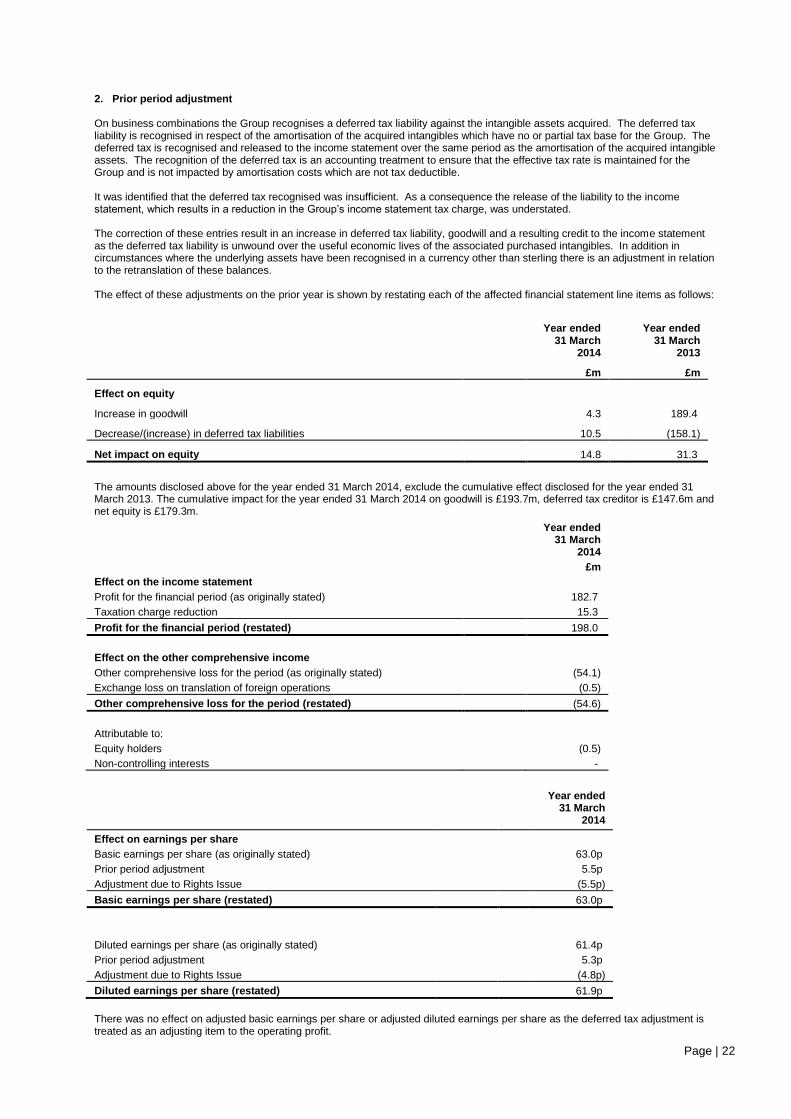
2. Prior period adjustment On business combinations the Group recognises a deferred tax liability against the intangible assets acquired. The deferred tax liability is recognised in respect of the amortisation of the acquired intangibles which have no or partial tax base for the Group. The deferred tax is recognised and released to the income statement over the same period as the amortisation of the acquired intangible assets. The recognition of the deferred tax is an accounting treatment to ensure that the effective tax rate is maintained for the Group and is not impacted by amortisation costs which are not tax deductible. It was identified that the deferred tax recognised was insufficient. As a consequence the release of the liability to the income statement, which results in a reduction in the Group’s income statement tax charge, was understated. The correction of these entries result in an increase in deferred tax liability, goodwill and a resulting credit to the income statement as the deferred tax liability is unwound over the useful economic lives of the associated purchased intangibles. In addition in circumstances where the underlying assets have been recognised in a currency other than sterling there is an adjustment in relation to the retranslation of these balances. The effect of these adjustments on the prior year is shown by restating each of the affected financial statement line items as follows:
Year ended 31 March
2014
Year ended 31 March
2013
£m £m
Effect on equity
Increase in goodwill 4.3 189.4
Decrease/(increase) in deferred tax liabilities 10.5 (158.1)
Net impact on equity 14.8 31.3
The amounts disclosed above for the year ended 31 March 2014, exclude the cumulative effect disclosed for the year ended 31 March 2013. The cumulative impact for the year ended 31 March 2014 on goodwill is £193.7m, deferred tax creditor is £147.6m and net equity is £179.3m.
Year ended 31 March
2014
£m
Effect on the income statement
Profit for the financial period (as originally stated) 182.7
Taxation charge reduction 15.3
Profit for the financial period (restated) 198.0
Effect on the other comprehensive income
Other comprehensive loss for the period (as originally stated) (54.1)
Exchange loss on translation of foreign operations (0.5)
Other comprehensive loss for the period (restated) (54.6)
Attributable to:
Equity holders (0.5)
Non-controlling interests -
Year ended 31 March
2014 Effect on earnings per share
Basic earnings per share (as originally stated) 63.0p
Prior period adjustment 5.5p
Adjustment due to Rights Issue (5.5p)
Basic earnings per share (restated) 63.0p
Diluted earnings per share (as originally stated) 61.4p
Prior period adjustment 5.3p
Adjustment due to Rights Issue (4.8p)
Diluted earnings per share (restated) 61.9p
There was no effect on adjusted basic earnings per share or adjusted diluted earnings per share as the deferred tax adjustment is treated as an adjusting item to the operating profit.
Page | 23
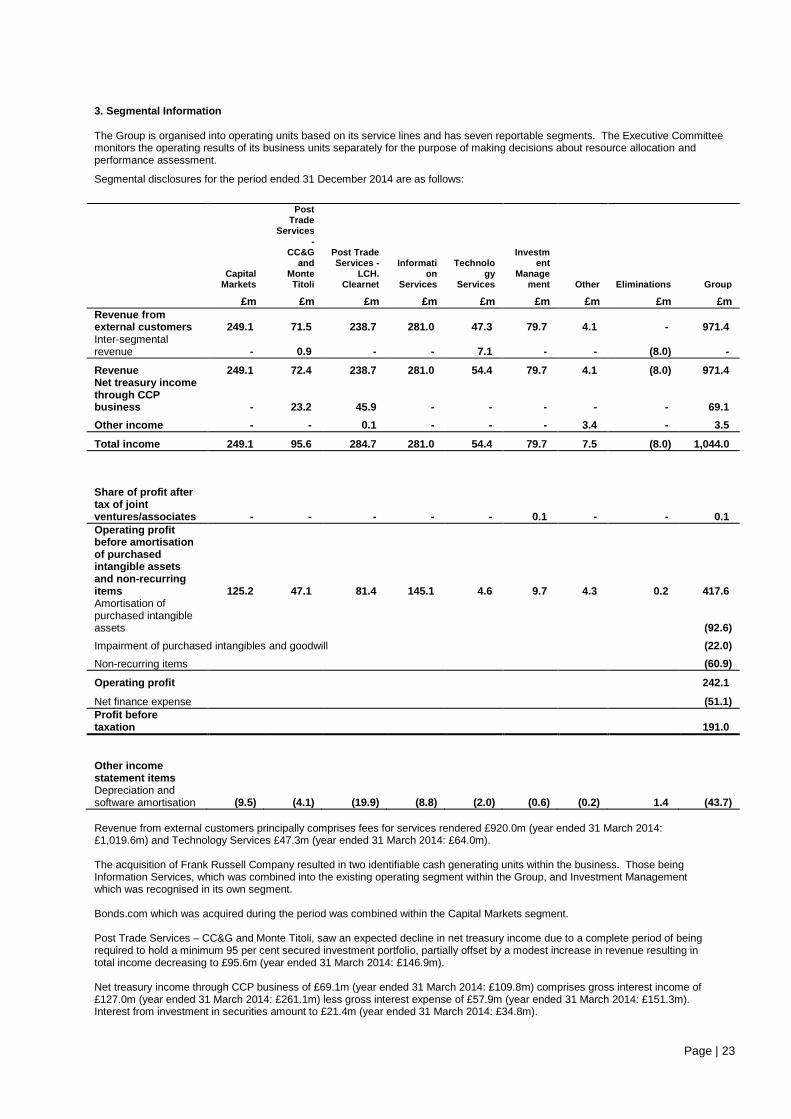
3. Segmental Information The Group is organised into operating units based on its service lines and has seven reportable segments. The Executive Committee monitors the operating results of its business units separately for the purpose of making decisions about resource allocation and performance assessment.
Segmental disclosures for the period ended 31 December 2014 are as follows:
Capital
Markets
Post Trade
Services -
CC&G and
Monte Titoli
Post Trade Services -
LCH. Clearnet
Information
Services
Technology
Services
Investment
Management Other Eliminations Group
£m £m £m £m £m £m £m £m £m
Revenue from external customers 249.1 71.5 238.7 281.0 47.3 79.7 4.1 - 971.4 Inter-segmental revenue - 0.9 - - 7.1 - - (8.0) -
Revenue 249.1 72.4 238.7 281.0 54.4 79.7 4.1 (8.0) 971.4 Net treasury income through CCP business - 23.2 45.9 - - - - - 69.1
Other income - - 0.1 - - - 3.4 - 3.5
Total income 249.1 95.6 284.7 281.0 54.4 79.7 7.5 (8.0) 1,044.0
Share of profit after tax of joint ventures/associates - - - - - 0.1 - - 0.1
Operating profit before amortisation of purchased intangible assets and non-recurring items 125.2 47.1 81.4 145.1 4.6 9.7 4.3 0.2 417.6 Amortisation of purchased intangible assets (92.6)
Impairment of purchased intangibles and goodwill (22.0)
Non-recurring items (60.9)
Operating profit 242.1
Net finance expense (51.1)
Profit before taxation 191.0
Other income statement items Depreciation and software amortisation (9.5) (4.1) (19.9) (8.8) (2.0) (0.6) (0.2) 1.4 (43.7)
Revenue from external customers principally comprises fees for services rendered £920.0m (year ended 31 March 2014: £1,019.6m) and Technology Services £47.3m (year ended 31 March 2014: £64.0m). The acquisition of Frank Russell Company resulted in two identifiable cash generating units within the business. Those being Information Services, which was combined into the existing operating segment within the Group, and Investment Management which was recognised in its own segment. Bonds.com which was acquired during the period was combined within the Capital Markets segment. Post Trade Services – CC&G and Monte Titoli, saw an expected decline in net treasury income due to a complete period of being required to hold a minimum 95 per cent secured investment portfolio, partially offset by a modest increase in revenue resulting in total income decreasing to £95.6m (year ended 31 March 2014: £146.9m). Net treasury income through CCP business of £69.1m (year ended 31 March 2014: £109.8m) comprises gross interest income of £127.0m (year ended 31 March 2014: £261.1m) less gross interest expense of £57.9m (year ended 31 March 2014: £151.3m). Interest from investment in securities amount to £21.4m (year ended 31 March 2014: £34.8m).
Page | 24
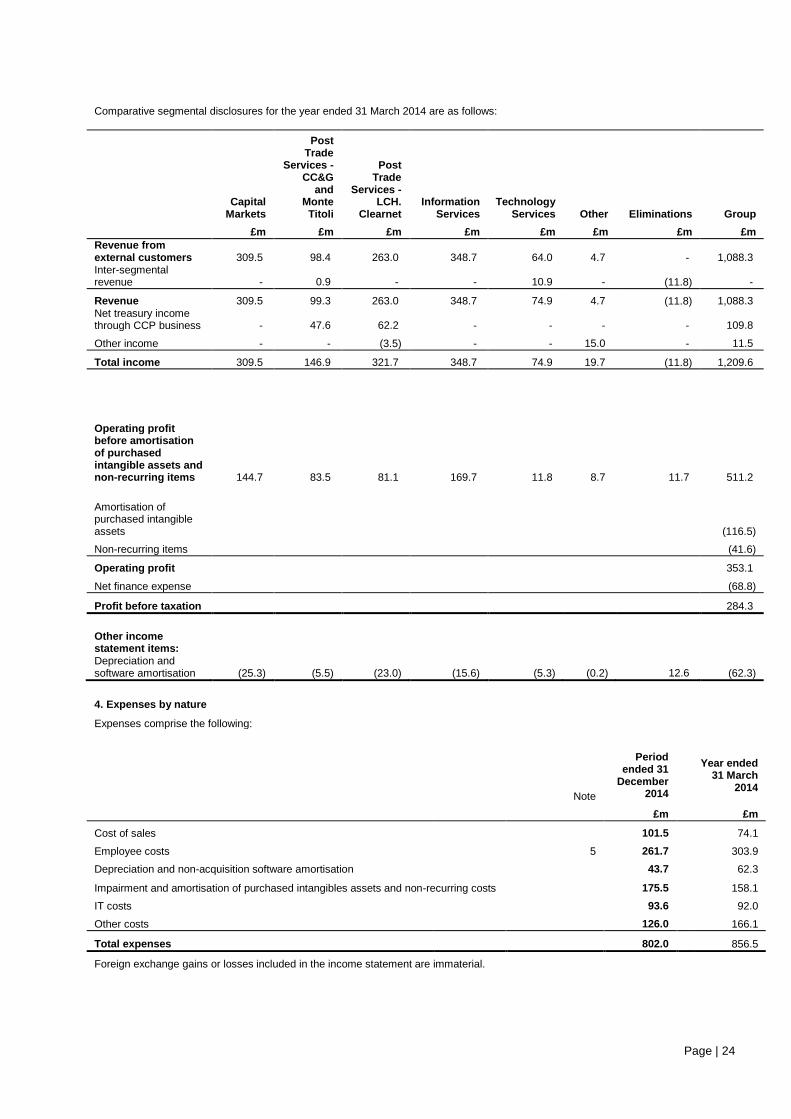
Comparative segmental disclosures for the year ended 31 March 2014 are as follows:
Capital
Markets
Post Trade
Services - CC&G
and Monte
Titoli
Post Trade
Services - LCH.
Clearnet Information
Services Technology
Services Other Eliminations Group
£m £m £m £m £m £m £m £m
Revenue from external customers 309.5 98.4 263.0 348.7 64.0 4.7 - 1,088.3 Inter-segmental revenue - 0.9 - - 10.9 - (11.8) -
Revenue 309.5 99.3 263.0 348.7 74.9 4.7 (11.8) 1,088.3 Net treasury income through CCP business - 47.6 62.2 - - - - 109.8
Other income - - (3.5) - - 15.0 - 11.5
Total income 309.5 146.9 321.7 348.7 74.9 19.7 (11.8) 1,209.6
Operating profit before amortisation of purchased intangible assets and non-recurring items 144.7 83.5 81.1 169.7 11.8 8.7 11.7 511.2
Amortisation of purchased intangible assets (116.5)
Non-recurring items (41.6)
Operating profit 353.1
Net finance expense (68.8)
Profit before taxation 284.3
Other income statement items: Depreciation and software amortisation (25.3) (5.5) (23.0) (15.6) (5.3) (0.2) 12.6 (62.3)
4. Expenses by nature
Expenses comprise the following:
Note
Period ended 31
December 2014
Year ended
31 March 2014
£m £m
Cost of sales 101.5 74.1
Employee costs 5 261.7 303.9
Depreciation and non-acquisition software amortisation 43.7 62.3
Impairment and amortisation of purchased intangibles assets and non-recurring costs 175.5 158.1
IT costs 93.6 92.0
Other costs 126.0 166.1
Total expenses 802.0 856.5
Foreign exchange gains or losses included in the income statement are immaterial.
Page | 25
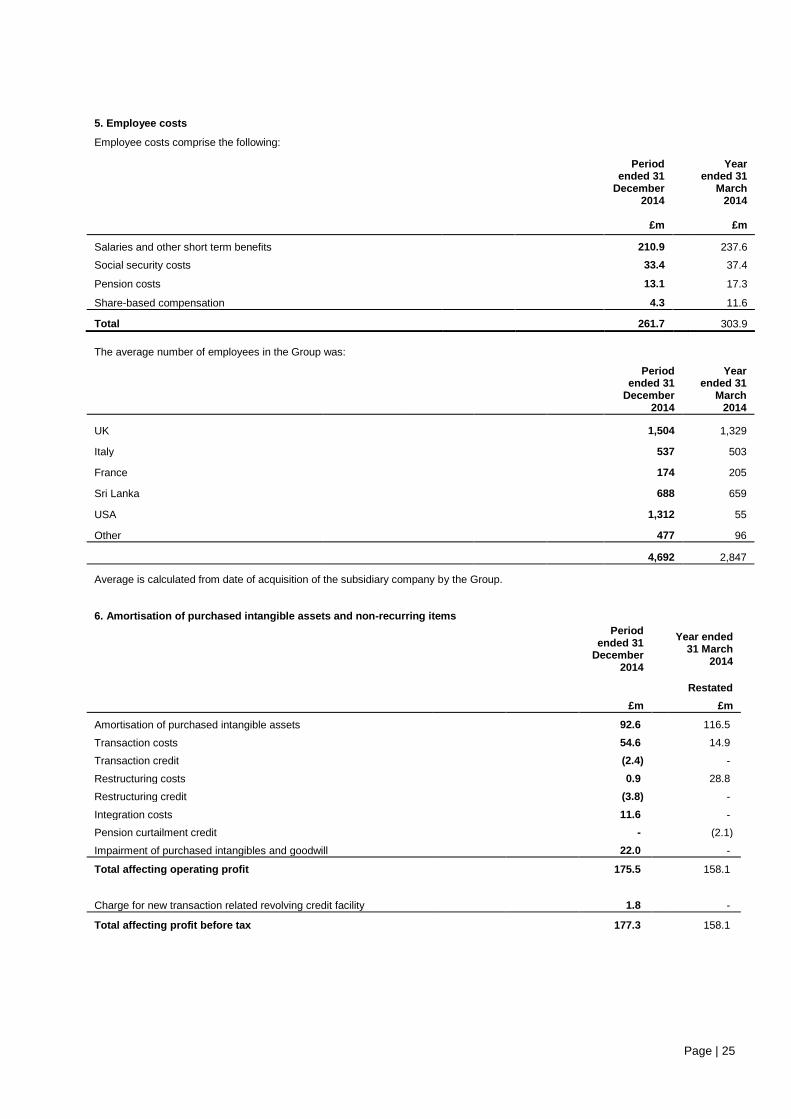
5. Employee costs
Employee costs comprise the following:
Period ended 31
December 2014
Year ended 31
March 2014
£m £m
Salaries and other short term benefits 210.9 237.6
Social security costs 33.4 37.4
Pension costs 13.1 17.3
Share-based compensation 4.3 11.6
Total 261.7 303.9
The average number of employees in the Group was:
Period ended 31
December 2014
Year ended 31
March 2014
UK 1,504 1,329
Italy 537 503
France 174 205
Sri Lanka 688 659
USA 1,312 55
Other 477 96
4,692 2,847
Average is calculated from date of acquisition of the subsidiary company by the Group.
6. Amortisation of purchased intangible assets and non-recurring items
Period ended 31
December 2014
Year ended
31 March 2014
Restated
£m £m
Amortisation of purchased intangible assets 92.6 116.5
Transaction costs 54.6 14.9
Transaction credit (2.4) -
Restructuring costs 0.9 28.8
Restructuring credit (3.8) -
Integration costs 11.6 -
Pension curtailment credit - (2.1)
Impairment of purchased intangibles and goodwill 22.0 -
Total affecting operating profit 175.5 158.1
Charge for new transaction related revolving credit facility 1.8 -
Total affecting profit before tax 177.3 158.1
Page | 26
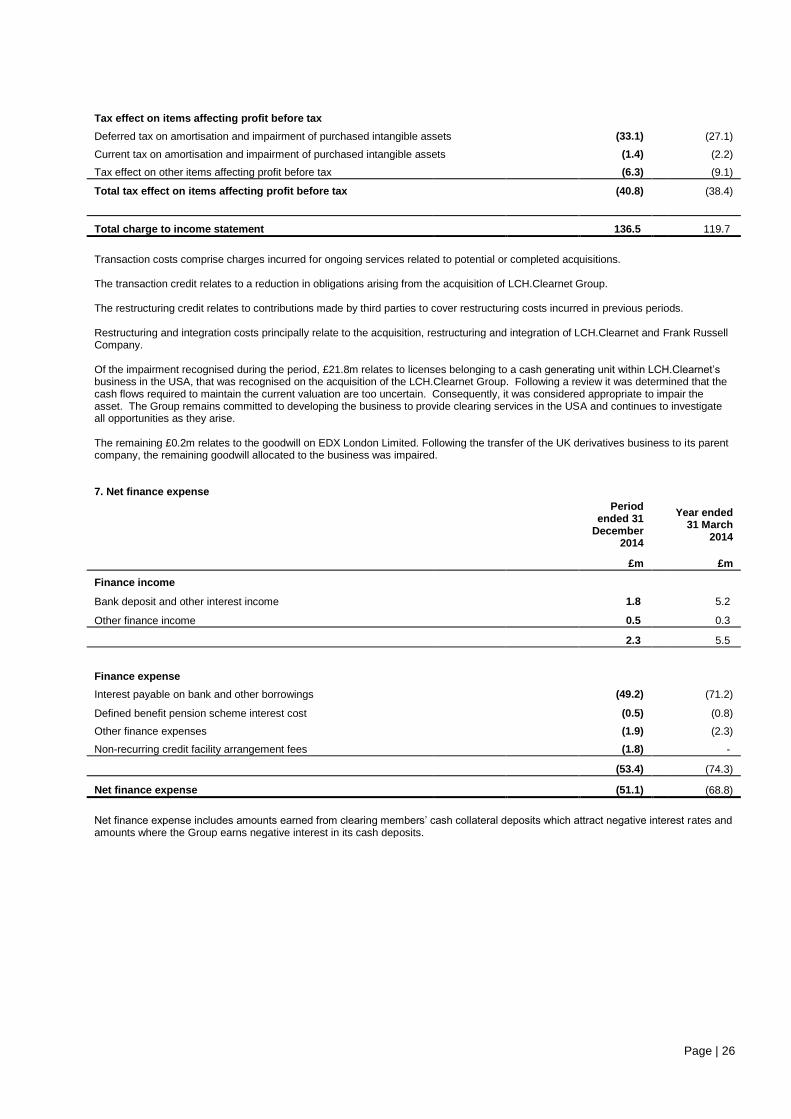
Tax effect on items affecting profit before tax
Deferred tax on amortisation and impairment of purchased intangible assets (33.1) (27.1)
Current tax on amortisation and impairment of purchased intangible assets (1.4) (2.2)
Tax effect on other items affecting profit before tax (6.3) (9.1)
Total tax effect on items affecting profit before tax (40.8) (38.4)
Total charge to income statement 136.5 119.7
Transaction costs comprise charges incurred for ongoing services related to potential or completed acquisitions. The transaction credit relates to a reduction in obligations arising from the acquisition of LCH.Clearnet Group. The restructuring credit relates to contributions made by third parties to cover restructuring costs incurred in previous periods. Restructuring and integration costs principally relate to the acquisition, restructuring and integration of LCH.Clearnet and Frank Russell Company. Of the impairment recognised during the period, £21.8m relates to licenses belonging to a cash generating unit within LCH.Clearnet’s business in the USA, that was recognised on the acquisition of the LCH.Clearnet Group. Following a review it was determined that the cash flows required to maintain the current valuation are too uncertain. Consequently, it was considered appropriate to impair the asset. The Group remains committed to developing the business to provide clearing services in the USA and continues to investigate all opportunities as they arise. The remaining £0.2m relates to the goodwill on EDX London Limited. Following the transfer of the UK derivatives business to its parent company, the remaining goodwill allocated to the business was impaired.
7. Net finance expense
Period ended 31
December 2014
Year ended
31 March 2014
£m £m
Finance income
Bank deposit and other interest income 1.8 5.2
Other finance income 0.5 0.3
2.3 5.5
Finance expense
Interest payable on bank and other borrowings (49.2) (71.2)
Defined benefit pension scheme interest cost (0.5) (0.8)
Other finance expenses (1.9) (2.3)
Non-recurring credit facility arrangement fees (1.8) -
(53.4) (74.3)
Net finance expense (51.1) (68.8)
Net finance expense includes amounts earned from clearing members’ cash collateral deposits which attract negative interest rates and amounts where the Group earns negative interest in its cash deposits.
Page | 27
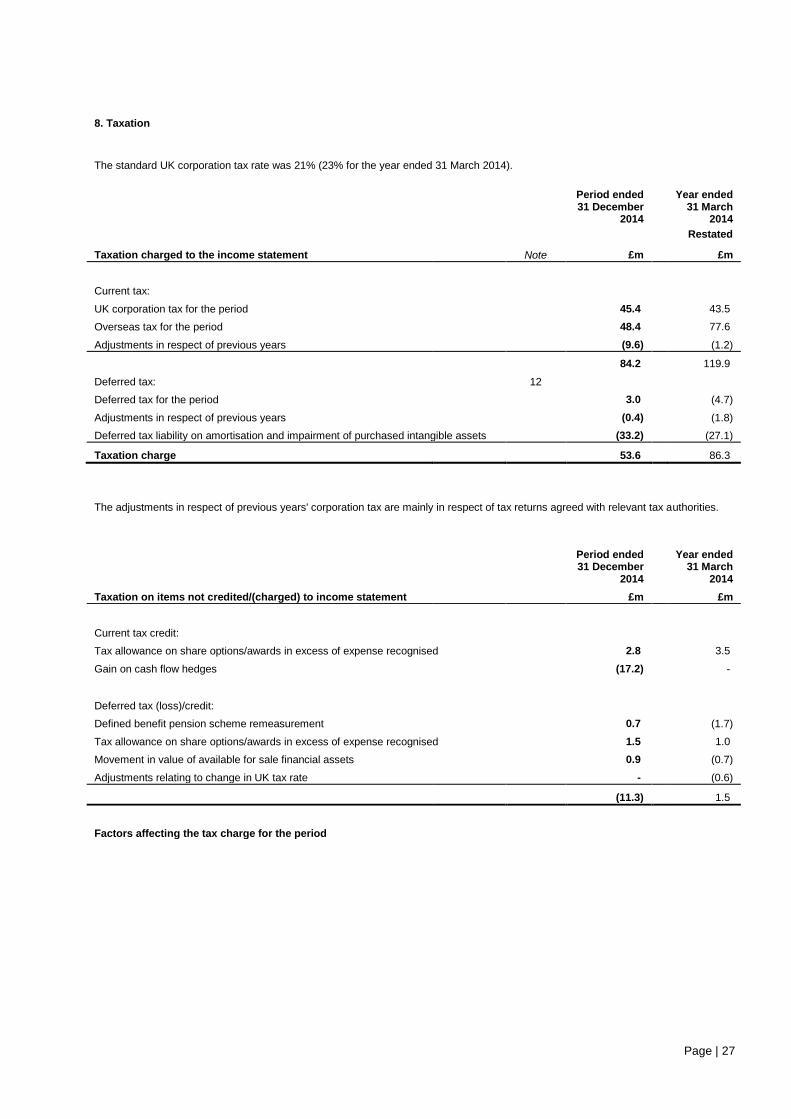
8. Taxation
The standard UK corporation tax rate was 21% (23% for the year ended 31 March 2014).
Period ended 31 December
2014
Year ended 31 March
2014
Restated
Taxation charged to the income statement Note £m £m
Current tax:
UK corporation tax for the period 45.4 43.5
Overseas tax for the period 48.4 77.6
Adjustments in respect of previous years (9.6) (1.2)
84.2 119.9
Deferred tax: 12
Deferred tax for the period 3.0 (4.7)
Adjustments in respect of previous years (0.4) (1.8)
Deferred tax liability on amortisation and impairment of purchased intangible assets (33.2) (27.1)
Taxation charge 53.6 86.3
The adjustments in respect of previous years' corporation tax are mainly in respect of tax returns agreed with relevant tax authorities.
Period ended 31 December
2014
Year ended 31 March
2014
Taxation on items not credited/(charged) to income statement £m £m
Current tax credit:
Tax allowance on share options/awards in excess of expense recognised 2.8 3.5
Gain on cash flow hedges (17.2) -
Deferred tax (loss)/credit:
Defined benefit pension scheme remeasurement 0.7 (1.7)
Tax allowance on share options/awards in excess of expense recognised 1.5 1.0
Movement in value of available for sale financial assets 0.9 (0.7)
Adjustments relating to change in UK tax rate - (0.6)
(11.3) 1.5
Factors affecting the tax charge for the period
Page | 28
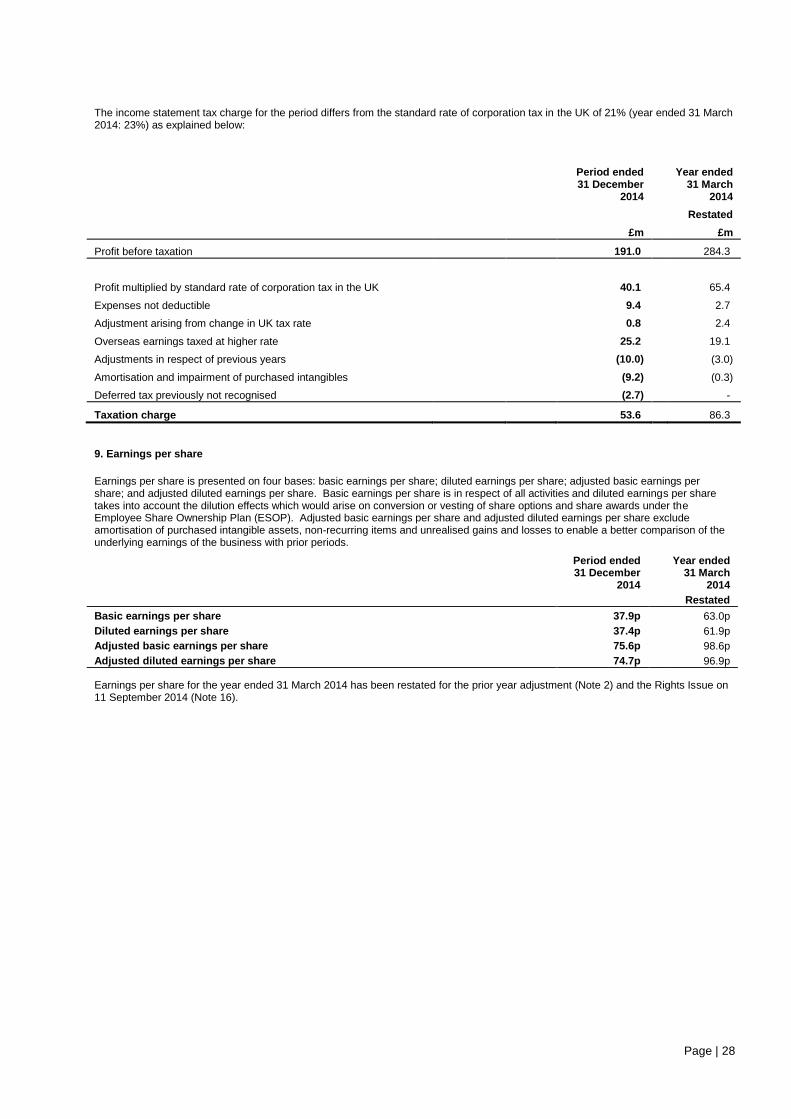
The income statement tax charge for the period differs from the standard rate of corporation tax in the UK of 21% (year ended 31 March 2014: 23%) as explained below:
Period ended 31 December
2014
Year ended 31 March
2014
Restated
£m £m
Profit before taxation 191.0 284.3
Profit multiplied by standard rate of corporation tax in the UK 40.1 65.4
Expenses not deductible 9.4 2.7
Adjustment arising from change in UK tax rate 0.8 2.4
Overseas earnings taxed at higher rate 25.2 19.1
Adjustments in respect of previous years (10.0) (3.0)
Amortisation and impairment of purchased intangibles (9.2) (0.3)
Deferred tax previously not recognised (2.7) -
Taxation charge 53.6 86.3
9. Earnings per share
Earnings per share is presented on four bases: basic earnings per share; diluted earnings per share; adjusted basic earnings per share; and adjusted diluted earnings per share. Basic earnings per share is in respect of all activities and diluted earnings per share takes into account the dilution effects which would arise on conversion or vesting of share options and share awards under the Employee Share Ownership Plan (ESOP). Adjusted basic earnings per share and adjusted diluted earnings per share exclude amortisation of purchased intangible assets, non-recurring items and unrealised gains and losses to enable a better comparison of the underlying earnings of the business with prior periods.
Period ended 31 December
2014
Year ended 31 March
2014
Restated
Basic earnings per share 37.9p 63.0p
Diluted earnings per share 37.4p 61.9p
Adjusted basic earnings per share 75.6p 98.6p
Adjusted diluted earnings per share 74.7p 96.9p
Earnings per share for the year ended 31 March 2014 has been restated for the prior year adjustment (Note 2) and the Rights Issue on 11 September 2014 (Note 16).
Page | 29
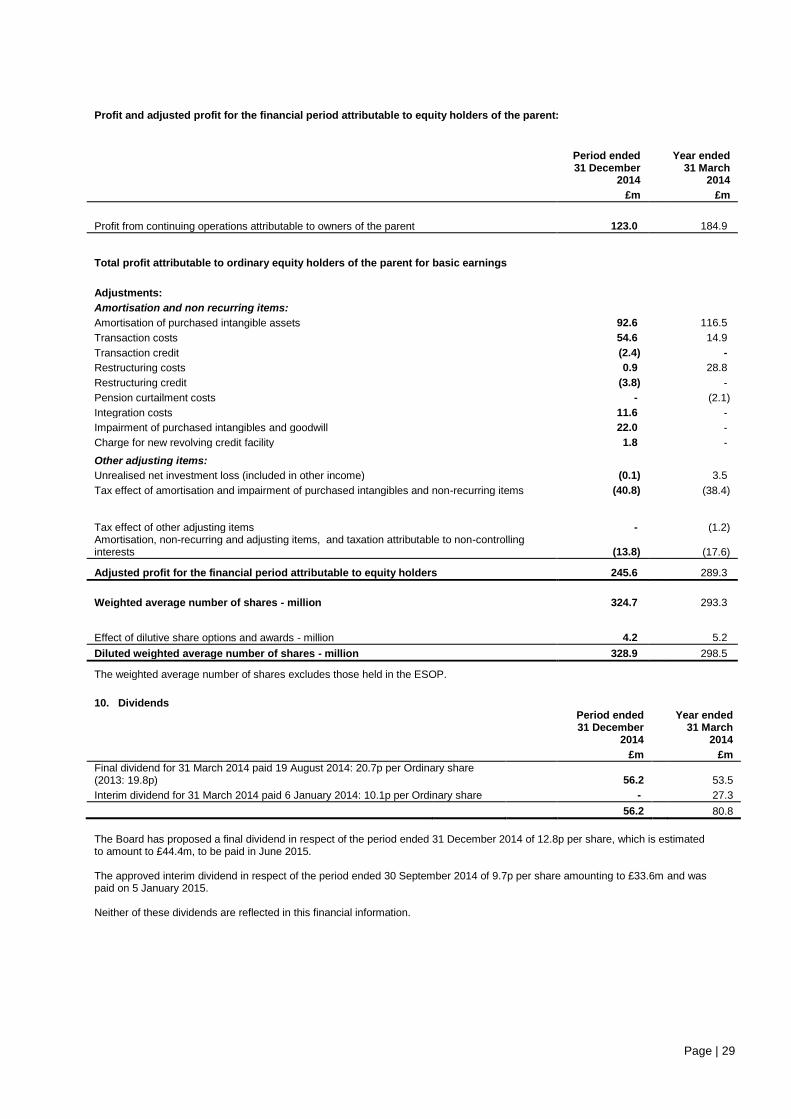
Profit and adjusted profit for the financial period attributable to equity holders of the parent:
Period ended 31 December
2014
Year ended 31 March
2014
£m £m
Profit from continuing operations attributable to owners of the parent 123.0 184.9
Total profit attributable to ordinary equity holders of the parent for basic earnings
Adjustments:
Amortisation and non recurring items:
Amortisation of purchased intangible assets 92.6 116.5
Transaction costs 54.6 14.9
Transaction credit (2.4) -
Restructuring costs 0.9 28.8
Restructuring credit (3.8) -
Pension curtailment costs - (2.1)
Integration costs 11.6 -
Impairment of purchased intangibles and goodwill 22.0 -
Charge for new revolving credit facility 1.8 -
Other adjusting items:
Unrealised net investment loss (included in other income) (0.1) 3.5
Tax effect of amortisation and impairment of purchased intangibles and non-recurring items (40.8) (38.4)
Tax effect of other adjusting items - (1.2) Amortisation, non-recurring and adjusting items, and taxation attributable to non-controlling interests (13.8) (17.6)
Adjusted profit for the financial period attributable to equity holders 245.6 289.3
Weighted average number of shares - million 324.7 293.3
Effect of dilutive share options and awards - million 4.2 5.2
Diluted weighted average number of shares - million 328.9 298.5
The weighted average number of shares excludes those held in the ESOP.
10. Dividends
Period ended 31 December
2014
Year ended 31 March
2014
£m £m
Final dividend for 31 March 2014 paid 19 August 2014: 20.7p per Ordinary share (2013: 19.8p) 56.2 53.5
Interim dividend for 31 March 2014 paid 6 January 2014: 10.1p per Ordinary share - 27.3
56.2 80.8
The Board has proposed a final dividend in respect of the period ended 31 December 2014 of 12.8p per share, which is estimated to amount to £44.4m, to be paid in June 2015. The approved interim dividend in respect of the period ended 30 September 2014 of 9.7p per share amounting to £33.6m and was paid on 5 January 2015. Neither of these dividends are reflected in this financial information.
Page | 30
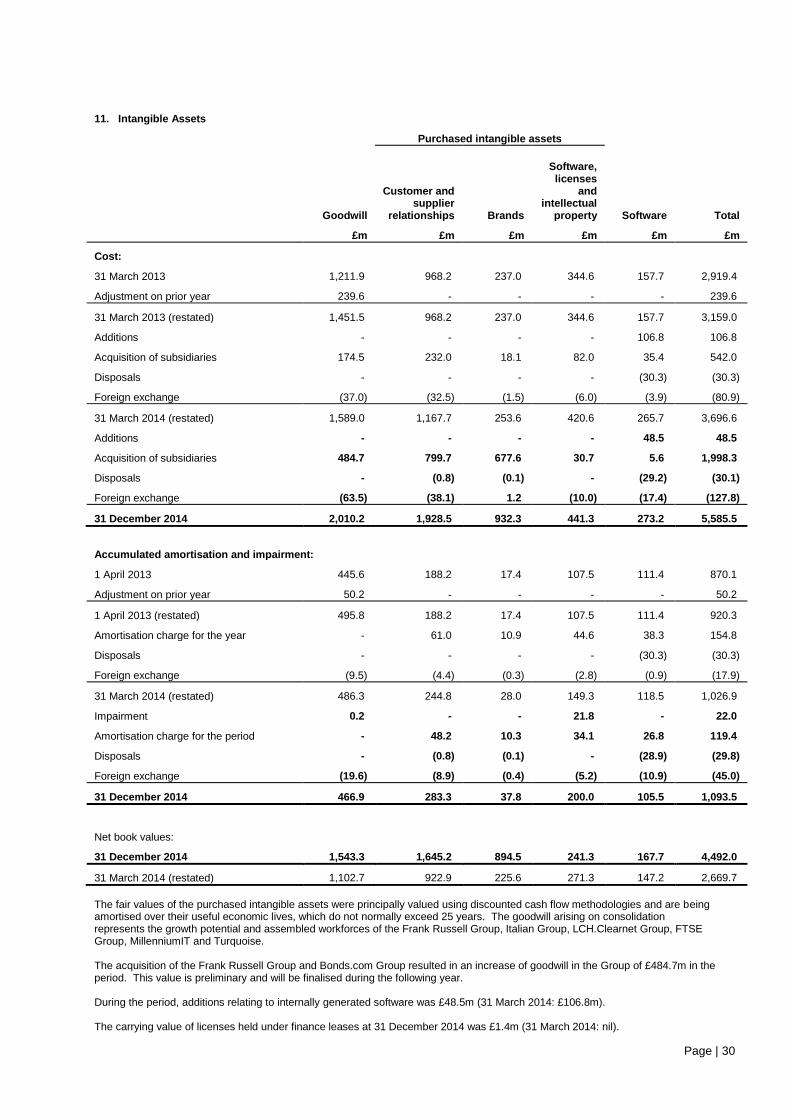
11. Intangible Assets
Purchased intangible assets
Goodwill
Customer and supplier
relationships Brands
Software, licenses
and intellectual
property Software Total
£m £m £m £m £m £m
Cost:
31 March 2013 1,211.9 968.2 237.0 344.6 157.7 2,919.4
Adjustment on prior year 239.6 - - - - 239.6
31 March 2013 (restated) 1,451.5 968.2 237.0 344.6 157.7 3,159.0
Additions - - - - 106.8 106.8
Acquisition of subsidiaries 174.5 232.0 18.1 82.0 35.4 542.0
Disposals - - - - (30.3) (30.3)
Foreign exchange (37.0) (32.5) (1.5) (6.0) (3.9) (80.9)
31 March 2014 (restated) 1,589.0 1,167.7 253.6 420.6 265.7 3,696.6
Additions - - - - 48.5 48.5
Acquisition of subsidiaries 484.7 799.7 677.6 30.7 5.6 1,998.3
Disposals - (0.8) (0.1) - (29.2) (30.1)
Foreign exchange (63.5) (38.1) 1.2 (10.0) (17.4) (127.8)
31 December 2014 2,010.2 1,928.5 932.3 441.3 273.2 5,585.5
Accumulated amortisation and impairment:
1 April 2013 445.6 188.2 17.4 107.5 111.4 870.1
Adjustment on prior year 50.2 - - - - 50.2
1 April 2013 (restated) 495.8 188.2 17.4 107.5 111.4 920.3
Amortisation charge for the year - 61.0 10.9 44.6 38.3 154.8
Disposals - - - - (30.3) (30.3)
Foreign exchange (9.5) (4.4) (0.3) (2.8) (0.9) (17.9)
31 March 2014 (restated) 486.3 244.8 28.0 149.3 118.5 1,026.9
Impairment 0.2 - - 21.8 - 22.0
Amortisation charge for the period - 48.2 10.3 34.1 26.8 119.4
Disposals - (0.8) (0.1) - (28.9) (29.8)
Foreign exchange (19.6) (8.9) (0.4) (5.2) (10.9) (45.0)
31 December 2014 466.9 283.3 37.8 200.0 105.5 1,093.5
Net book values:
31 December 2014 1,543.3 1,645.2 894.5 241.3 167.7 4,492.0
31 March 2014 (restated) 1,102.7 922.9 225.6 271.3 147.2 2,669.7
The fair values of the purchased intangible assets were principally valued using discounted cash flow methodologies and are being amortised over their useful economic lives, which do not normally exceed 25 years. The goodwill arising on consolidation represents the growth potential and assembled workforces of the Frank Russell Group, Italian Group, LCH.Clearnet Group, FTSE Group, MillenniumIT and Turquoise. The acquisition of the Frank Russell Group and Bonds.com Group resulted in an increase of goodwill in the Group of £484.7m in the period. This value is preliminary and will be finalised during the following year. During the period, additions relating to internally generated software was £48.5m (31 March 2014: £106.8m). The carrying value of licenses held under finance leases at 31 December 2014 was £1.4m (31 March 2014: nil).
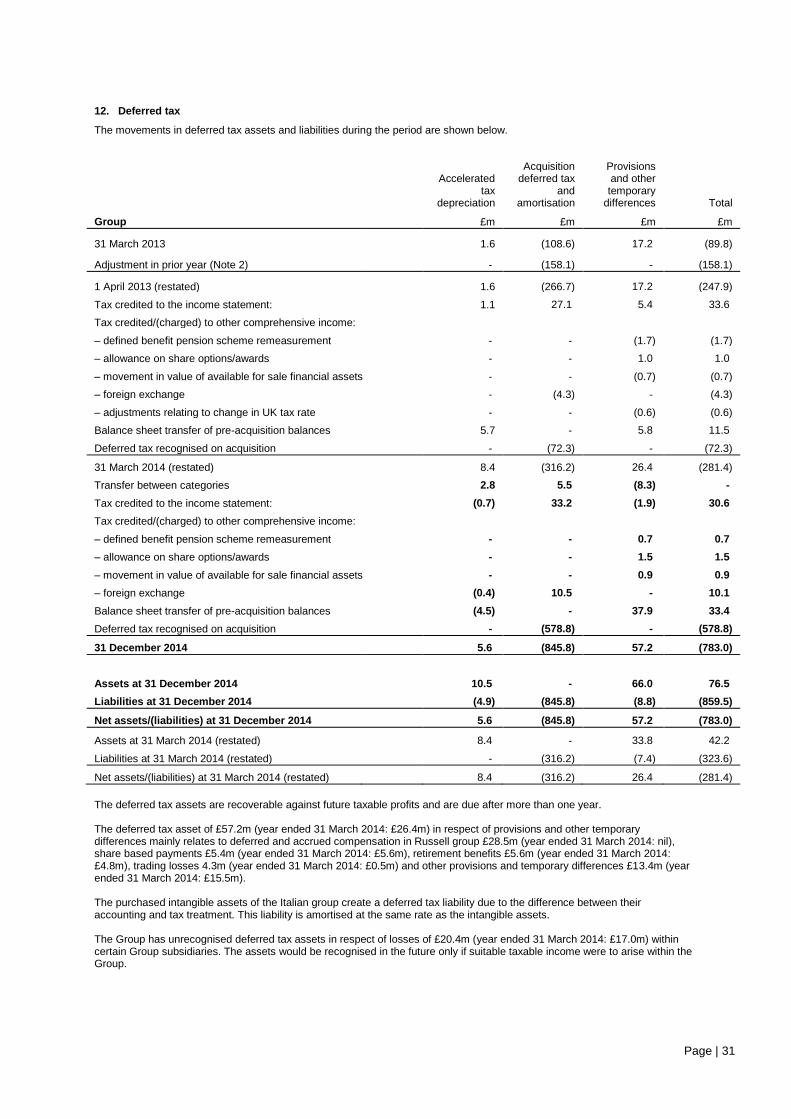
Page | 31
12. Deferred tax
The movements in deferred tax assets and liabilities during the period are shown below.
Accelerated tax
depreciation
Acquisition deferred tax
and amortisation
Provisions and other temporary
differences Total
Group £m £m £m £m
31 March 2013 1.6 (108.6) 17.2 (89.8)
Adjustment in prior year (Note 2) - (158.1) - (158.1)
1 April 2013 (restated) 1.6 (266.7) 17.2 (247.9)
Tax credited to the income statement: 1.1 27.1 5.4 33.6
Tax credited/(charged) to other comprehensive income:
– defined benefit pension scheme remeasurement - - (1.7) (1.7)
– allowance on share options/awards - - 1.0 1.0
– movement in value of available for sale financial assets - - (0.7) (0.7)
– foreign exchange - (4.3) - (4.3)
– adjustments relating to change in UK tax rate - - (0.6) (0.6)
Balance sheet transfer of pre-acquisition balances 5.7 - 5.8 11.5
Deferred tax recognised on acquisition - (72.3) - (72.3)
31 March 2014 (restated) 8.4 (316.2) 26.4 (281.4)
Transfer between categories 2.8 5.5 (8.3) -
Tax credited to the income statement: (0.7) 33.2 (1.9) 30.6
Tax credited/(charged) to other comprehensive income:
– defined benefit pension scheme remeasurement - - 0.7 0.7
– allowance on share options/awards - - 1.5 1.5
– movement in value of available for sale financial assets - - 0.9 0.9
– foreign exchange (0.4) 10.5 - 10.1
Balance sheet transfer of pre-acquisition balances (4.5) - 37.9 33.4
Deferred tax recognised on acquisition - (578.8) - (578.8)
31 December 2014 5.6 (845.8) 57.2 (783.0)
Assets at 31 December 2014 10.5 - 66.0 76.5
Liabilities at 31 December 2014 (4.9) (845.8) (8.8) (859.5)
Net assets/(liabilities) at 31 December 2014 5.6 (845.8) 57.2 (783.0)
Assets at 31 March 2014 (restated) 8.4 - 33.8 42.2
Liabilities at 31 March 2014 (restated) - (316.2) (7.4) (323.6)
Net assets/(liabilities) at 31 March 2014 (restated) 8.4 (316.2) 26.4 (281.4)
The deferred tax assets are recoverable against future taxable profits and are due after more than one year. The deferred tax asset of £57.2m (year ended 31 March 2014: £26.4m) in respect of provisions and other temporary differences mainly relates to deferred and accrued compensation in Russell group £28.5m (year ended 31 March 2014: nil), share based payments £5.4m (year ended 31 March 2014: £5.6m), retirement benefits £5.6m (year ended 31 March 2014: £4.8m), trading losses 4.3m (year ended 31 March 2014: £0.5m) and other provisions and temporary differences £13.4m (year ended 31 March 2014: £15.5m). The purchased intangible assets of the Italian group create a deferred tax liability due to the difference between their accounting and tax treatment. This liability is amortised at the same rate as the intangible assets. The Group has unrecognised deferred tax assets in respect of losses of £20.4m (year ended 31 March 2014: £17.0m) within certain Group subsidiaries. The assets would be recognised in the future only if suitable taxable income were to arise within the Group.

Page | 32
13. Financial assets and financial liabilities
Financial instruments by category The financial instruments of the Group are categorised as follows:
Loans and
receivables
Held-to-maturity
assets
Available for sale at fair value
through OCI
Financial instruments at fair value
through profit or loss Total
31 December 2014 £m £m £m £m £m
Assets as per balance sheet
Financial assets of the CCP clearing business:
– CCP trading assets - - - 293,722.9
293,722.9
– Receivables for repurchase transactions 113,084.8 - - -
113,084.8
– Other receivables from clearing members 2,908.3 - - - 2,908.3
– Financial assets held at fair value - - 11,112.9 9,123.9 20,236.8
– Cash and cash equivalents of clearing members 21,493.0 - - - 21,493.0
Financial assets of the CCP clearing business 137,486.1 - 11,112.9 302,846.8
451,445.8
Assets held at fair value - - - 12.4 12.4
Total financial assets for CCP clearing 137,486.1 - 11,112.9 302,859.2
451,458.2
Other non-current assets 42.9 - - 21.9 64.8
Trade and other receivables 567.5 - - 3.6 571.1
Cash and cash equivalents 1,052.0 - - 75.2 1,127.2
Available for sale financial assets - - 4.8 - 4.8
Derivatives not designated as hedges
- Foreign exchange forward contracts - - - 0.4 0.4 Derivatives used for hedging
Fair value hedges:
- Cross currency interest rate swaps - - - 22.7 22.7
Total 139,148.5 - 11,117.7 302,983.0 453,249.2
There were no transfers between categories during the period.
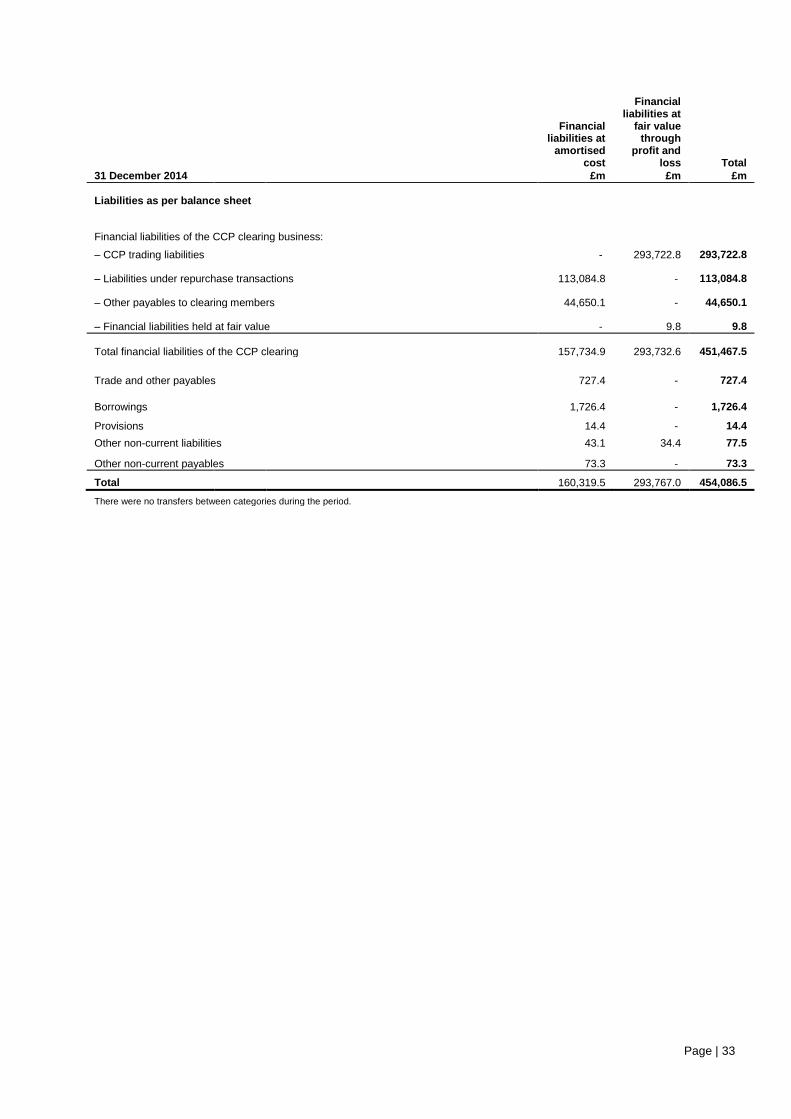
Page | 33
Financial liabilities at
amortised cost
Financial liabilities at
fair value through
profit and loss Total
31 December 2014 £m £m £m
Liabilities as per balance sheet
Financial liabilities of the CCP clearing business:
– CCP trading liabilities - 293,722.8 293,722.8
– Liabilities under repurchase transactions 113,084.8 - 113,084.8
– Other payables to clearing members 44,650.1 - 44,650.1
– Financial liabilities held at fair value - 9.8 9.8
Total financial liabilities of the CCP clearing 157,734.9 293,732.6 451,467.5
Trade and other payables 727.4 - 727.4
Borrowings 1,726.4 - 1,726.4
Provisions 14.4 - 14.4
Other non-current liabilities 43.1 34.4 77.5
Other non-current payables 73.3 - 73.3
Total 160,319.5 293,767.0 454,086.5 There were no transfers between categories during the period.
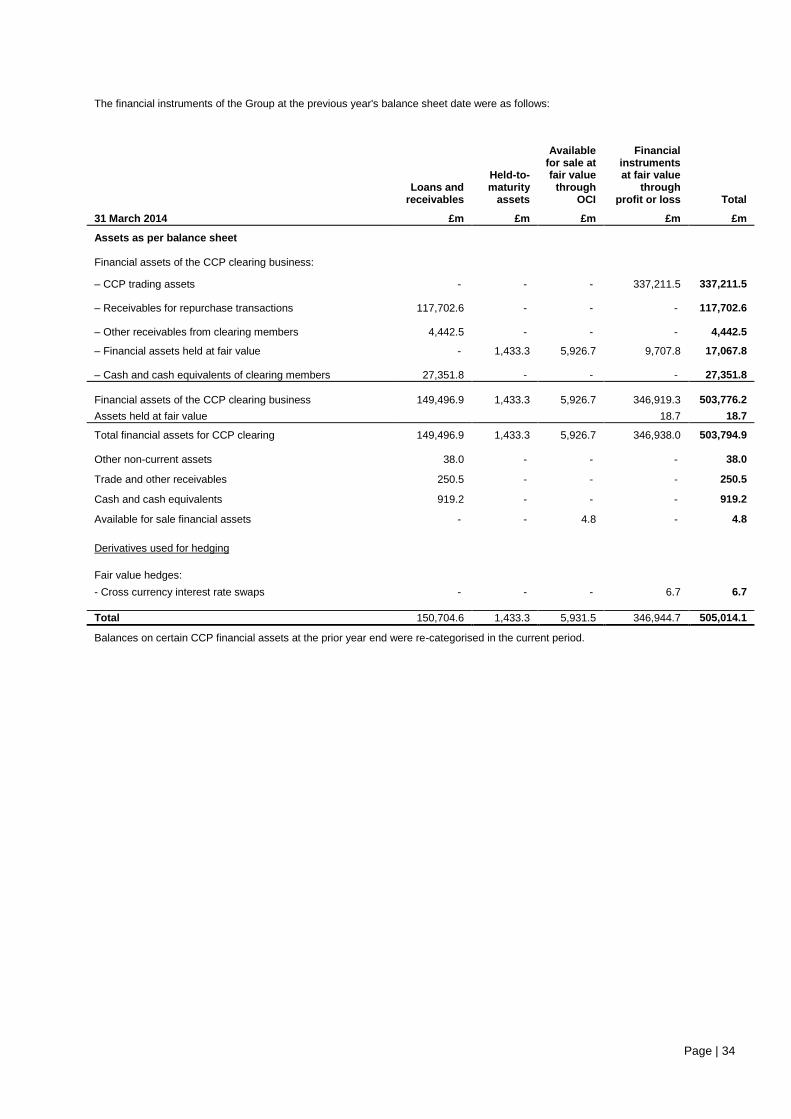
Page | 34
The financial instruments of the Group at the previous year's balance sheet date were as follows:
Loans and
receivables
Held-to-maturity
assets
Available for sale at fair value
through OCI
Financial instruments at fair value
through profit or loss Total
31 March 2014 £m £m £m £m £m
Assets as per balance sheet Financial assets of the CCP clearing business:
– CCP trading assets - - - 337,211.5 337,211.5
– Receivables for repurchase transactions 117,702.6 - - - 117,702.6
– Other receivables from clearing members 4,442.5 - - - 4,442.5
– Financial assets held at fair value - 1,433.3 5,926.7 9,707.8 17,067.8
– Cash and cash equivalents of clearing members 27,351.8 - - - 27,351.8
Financial assets of the CCP clearing business 149,496.9 1,433.3 5,926.7 346,919.3 503,776.2
Assets held at fair value 18.7 18.7
Total financial assets for CCP clearing 149,496.9 1,433.3 5,926.7 346,938.0 503,794.9 Other non-current assets 38.0 - - - 38.0
Trade and other receivables 250.5 - - - 250.5
Cash and cash equivalents 919.2 - - - 919.2
Available for sale financial assets - - 4.8 - 4.8
Derivatives used for hedging
Fair value hedges:
- Cross currency interest rate swaps - - - 6.7 6.7
Total 150,704.6 1,433.3 5,931.5 346,944.7 505,014.1
Balances on certain CCP financial assets at the prior year end were re-categorised in the current period.
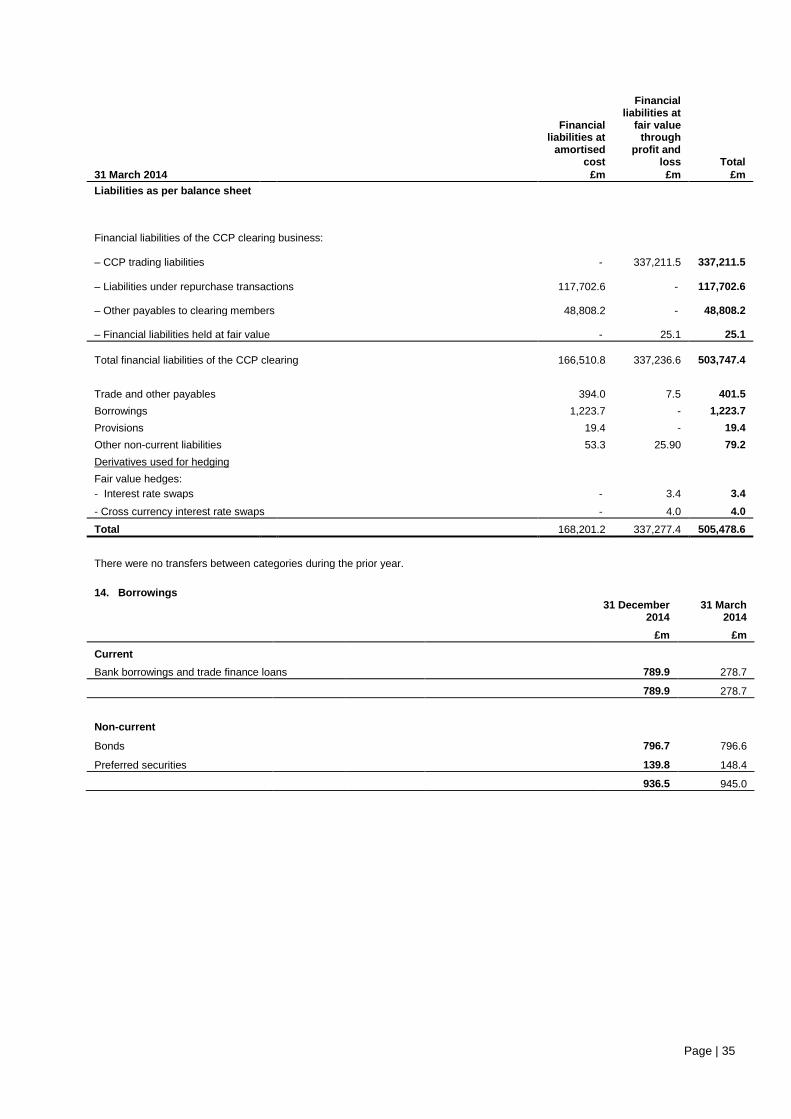
Page | 35
Financial liabilities at
amortised cost
Financial liabilities at
fair value through
profit and loss Total
31 March 2014 £m £m £m
Liabilities as per balance sheet
Financial liabilities of the CCP clearing business:
– CCP trading liabilities - 337,211.5
337,211.5
– Liabilities under repurchase transactions 117,702.6 -
117,702.6
– Other payables to clearing members 48,808.2 - 48,808.2
– Financial liabilities held at fair value - 25.1 25.1
Total financial liabilities of the CCP clearing 166,510.8 337,236.6
503,747.4
Trade and other payables 394.0 7.5 401.5
Borrowings 1,223.7 - 1,223.7
Provisions 19.4 - 19.4
Other non-current liabilities 53.3 25.90 79.2
Derivatives used for hedging
Fair value hedges:
- Interest rate swaps - 3.4 3.4
- Cross currency interest rate swaps - 4.0 4.0
Total 168,201.2 337,277.4 505,478.6
There were no transfers between categories during the prior year.
14. Borrowings
31 December
2014 31 March
2014
£m £m
Current
Bank borrowings and trade finance loans 789.9 278.7
789.9 278.7
Non-current
Bonds 796.7 796.6
Preferred securities 139.8 148.4
936.5 945.0
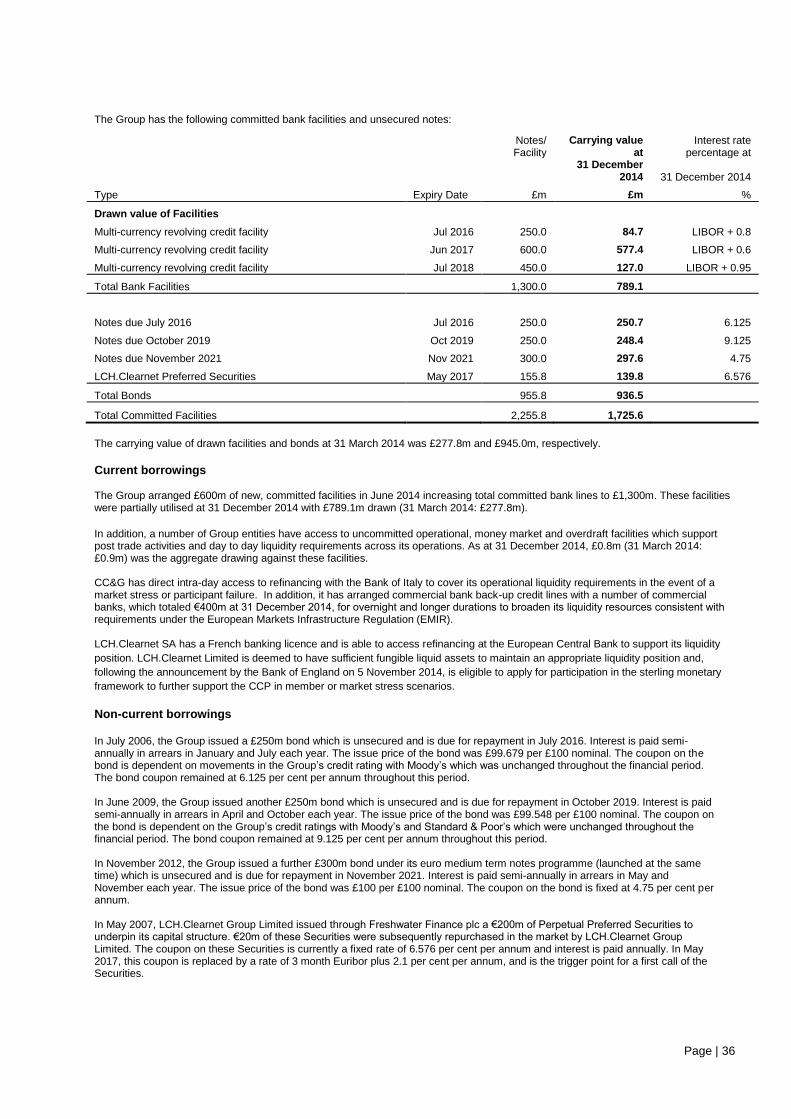
Page | 36
The Group has the following committed bank facilities and unsecured notes:
Notes/ Facility
Carrying value at
Interest rate percentage at
31 December
2014 31 December 2014
Type Expiry Date £m £m %
Drawn value of Facilities
Multi-currency revolving credit facility Jul 2016 250.0 84.7 LIBOR + 0.8
Multi-currency revolving credit facility Jun 2017 600.0 577.4 LIBOR + 0.6
Multi-currency revolving credit facility Jul 2018 450.0 127.0 LIBOR + 0.95
Total Bank Facilities 1,300.0 789.1
Notes due July 2016 Jul 2016 250.0 250.7 6.125
Notes due October 2019 Oct 2019 250.0 248.4 9.125
Notes due November 2021 Nov 2021 300.0 297.6 4.75
LCH.Clearnet Preferred Securities May 2017 155.8 139.8 6.576
Total Bonds 955.8 936.5
Total Committed Facilities 2,255.8 1,725.6
The carrying value of drawn facilities and bonds at 31 March 2014 was £277.8m and £945.0m, respectively.
Current borrowings
The Group arranged £600m of new, committed facilities in June 2014 increasing total committed bank lines to £1,300m. These facilities were partially utilised at 31 December 2014 with £789.1m drawn (31 March 2014: £277.8m).
In addition, a number of Group entities have access to uncommitted operational, money market and overdraft facilities which support post trade activities and day to day liquidity requirements across its operations. As at 31 December 2014, £0.8m (31 March 2014: £0.9m) was the aggregate drawing against these facilities. CC&G has direct intra-day access to refinancing with the Bank of Italy to cover its operational liquidity requirements in the event of a market stress or participant failure. In addition, it has arranged commercial bank back-up credit lines with a number of commercial banks, which totaled €400m at 31 December 2014, for overnight and longer durations to broaden its liquidity resources consistent with requirements under the European Markets Infrastructure Regulation (EMIR). LCH.Clearnet SA has a French banking licence and is able to access refinancing at the European Central Bank to support its liquidity
position. LCH.Clearnet Limited is deemed to have sufficient fungible liquid assets to maintain an appropriate liquidity position and,
following the announcement by the Bank of England on 5 November 2014, is eligible to apply for participation in the sterling monetary
framework to further support the CCP in member or market stress scenarios.
Non-current borrowings In July 2006, the Group issued a £250m bond which is unsecured and is due for repayment in July 2016. Interest is paid semi-annually in arrears in January and July each year. The issue price of the bond was £99.679 per £100 nominal. The coupon on the bond is dependent on movements in the Group’s credit rating with Moody’s which was unchanged throughout the financial period. The bond coupon remained at 6.125 per cent per annum throughout this period. In June 2009, the Group issued another £250m bond which is unsecured and is due for repayment in October 2019. Interest is paid semi-annually in arrears in April and October each year. The issue price of the bond was £99.548 per £100 nominal. The coupon on the bond is dependent on the Group’s credit ratings with Moody’s and Standard & Poor’s which were unchanged throughout the financial period. The bond coupon remained at 9.125 per cent per annum throughout this period. In November 2012, the Group issued a further £300m bond under its euro medium term notes programme (launched at the same time) which is unsecured and is due for repayment in November 2021. Interest is paid semi-annually in arrears in May and November each year. The issue price of the bond was £100 per £100 nominal. The coupon on the bond is fixed at 4.75 per cent per annum. In May 2007, LCH.Clearnet Group Limited issued through Freshwater Finance plc a €200m of Perpetual Preferred Securities to underpin its capital structure. €20m of these Securities were subsequently repurchased in the market by LCH.Clearnet Group Limited. The coupon on these Securities is currently a fixed rate of 6.576 per cent per annum and interest is paid annually. In May 2017, this coupon is replaced by a rate of 3 month Euribor plus 2.1 per cent per annum, and is the trigger point for a first call of the Securities.
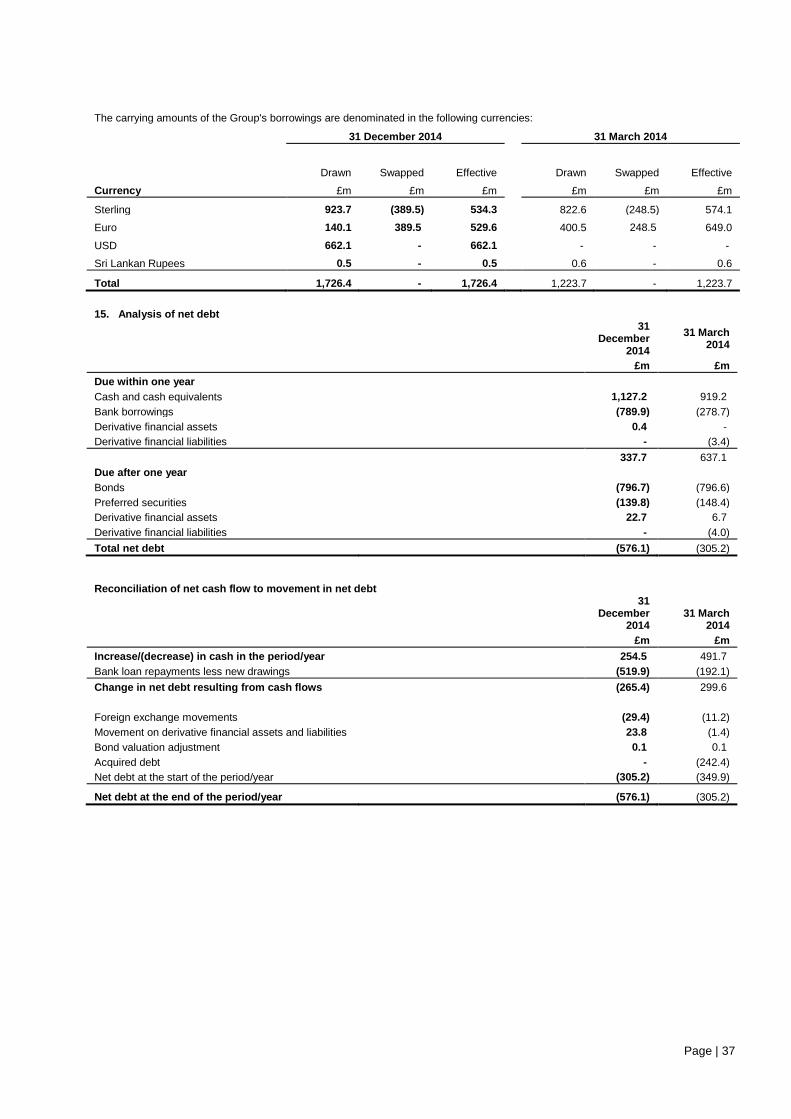
Page | 37
The carrying amounts of the Group's borrowings are denominated in the following currencies:
31 December 2014 31 March 2014
Drawn Swapped Effective Drawn Swapped Effective
Currency £m £m £m £m £m £m
Sterling 923.7 (389.5) 534.3 822.6 (248.5) 574.1
Euro 140.1 389.5 529.6 400.5 248.5 649.0
USD 662.1 - 662.1 - - -
Sri Lankan Rupees 0.5 - 0.5 0.6 - 0.6
Total 1,726.4 - 1,726.4 1,223.7 - 1,223.7
15. Analysis of net debt
31 December
2014
31 March 2014
£m £m
Due within one year
Cash and cash equivalents 1,127.2 919.2
Bank borrowings (789.9) (278.7)
Derivative financial assets 0.4 -
Derivative financial liabilities - (3.4)
337.7 637.1
Due after one year
Bonds (796.7) (796.6)
Preferred securities (139.8) (148.4)
Derivative financial assets 22.7 6.7
Derivative financial liabilities - (4.0)
Total net debt (576.1) (305.2)
Reconciliation of net cash flow to movement in net debt
31 December
2014 31 March
2014
£m £m
Increase/(decrease) in cash in the period/year 254.5 491.7
Bank loan repayments less new drawings (519.9) (192.1)
Change in net debt resulting from cash flows (265.4) 299.6
Foreign exchange movements (29.4) (11.2)
Movement on derivative financial assets and liabilities 23.8 (1.4)
Bond valuation adjustment 0.1 0.1
Acquired debt - (242.4)
Net debt at the start of the period/year (305.2) (349.9)
Net debt at the end of the period/year (576.1) (305.2)
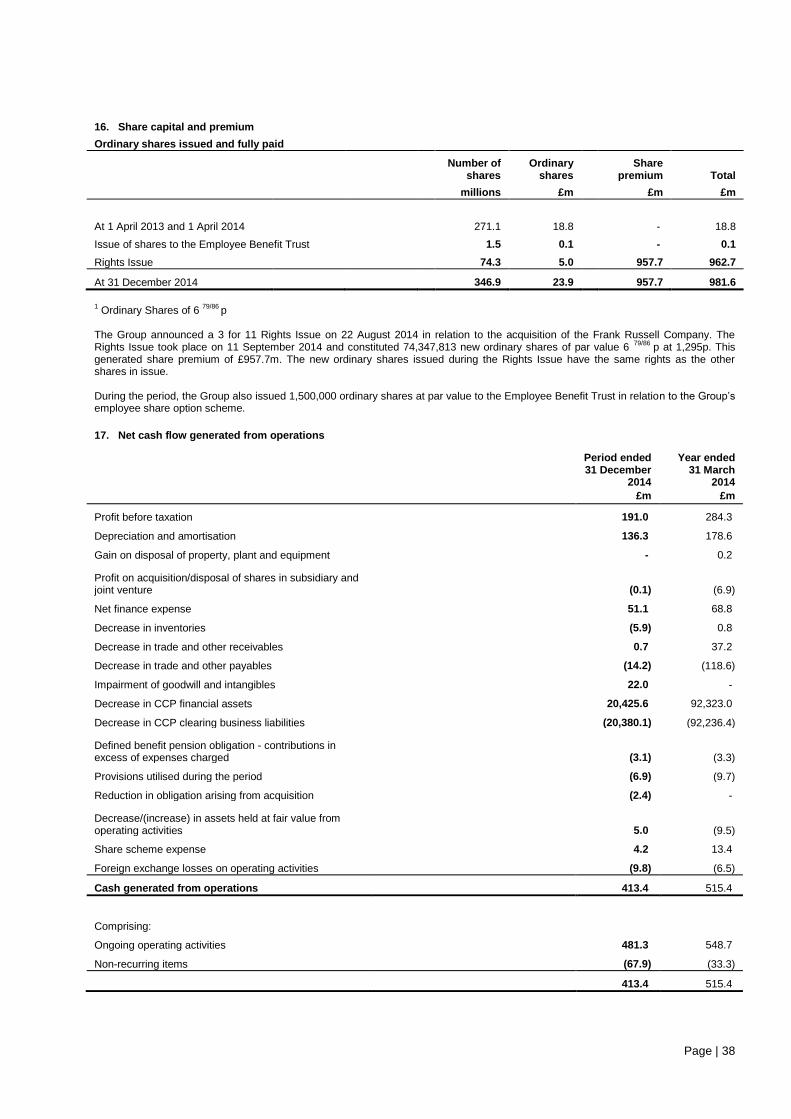
Page | 38
16. Share capital and premium
Ordinary shares issued and fully paid
Number of
shares Ordinary
shares Share
premium Total
millions £m £m £m
At 1 April 2013 and 1 April 2014 271.1 18.8 - 18.8
Issue of shares to the Employee Benefit Trust 1.5 0.1 - 0.1
Rights Issue 74.3 5.0 957.7 962.7
At 31 December 2014 346.9 23.9 957.7 981.6
1 Ordinary Shares of 6
79/86 p
The Group announced a 3 for 11 Rights Issue on 22 August 2014 in relation to the acquisition of the Frank Russell Company. The Rights Issue took place on 11 September 2014 and constituted 74,347,813 new ordinary shares of par value 6
79/86 p at 1,295p. This
generated share premium of £957.7m. The new ordinary shares issued during the Rights Issue have the same rights as the other shares in issue. During the period, the Group also issued 1,500,000 ordinary shares at par value to the Employee Benefit Trust in relation to the Group’s employee share option scheme.
17. Net cash flow generated from operations
Period ended 31 December
2014
Year ended 31 March
2014
£m £m
Profit before taxation 191.0 284.3
Depreciation and amortisation 136.3 178.6
Gain on disposal of property, plant and equipment - 0.2
Profit on acquisition/disposal of shares in subsidiary and joint venture (0.1) (6.9)
Net finance expense 51.1 68.8
Decrease in inventories (5.9) 0.8
Decrease in trade and other receivables 0.7 37.2
Decrease in trade and other payables (14.2) (118.6)
Impairment of goodwill and intangibles 22.0 -
Decrease in CCP financial assets 20,425.6 92,323.0
Decrease in CCP clearing business liabilities (20,380.1) (92,236.4)
Defined benefit pension obligation - contributions in excess of expenses charged (3.1) (3.3)
Provisions utilised during the period (6.9) (9.7)
Reduction in obligation arising from acquisition (2.4) -
Decrease/(increase) in assets held at fair value from operating activities 5.0 (9.5)
Share scheme expense 4.2 13.4
Foreign exchange losses on operating activities (9.8) (6.5)
Cash generated from operations 413.4 515.4
Comprising:
Ongoing operating activities 481.3 548.7
Non-recurring items (67.9) (33.3)
413.4 515.4
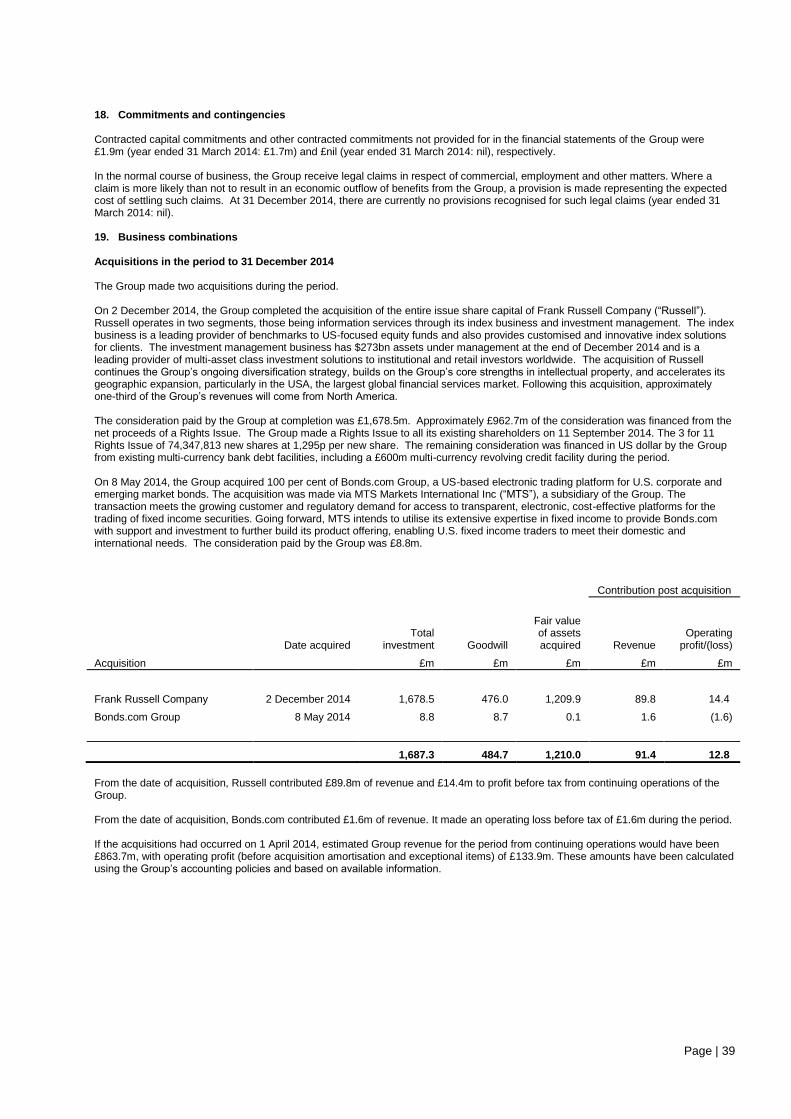
Page | 39
18. Commitments and contingencies Contracted capital commitments and other contracted commitments not provided for in the financial statements of the Group were £1.9m (year ended 31 March 2014: £1.7m) and £nil (year ended 31 March 2014: nil), respectively. In the normal course of business, the Group receive legal claims in respect of commercial, employment and other matters. Where a claim is more likely than not to result in an economic outflow of benefits from the Group, a provision is made representing the expected cost of settling such claims. At 31 December 2014, there are currently no provisions recognised for such legal claims (year ended 31 March 2014: nil). 19. Business combinations Acquisitions in the period to 31 December 2014 The Group made two acquisitions during the period. On 2 December 2014, the Group completed the acquisition of the entire issue share capital of Frank Russell Company (“Russell”). Russell operates in two segments, those being information services through its index business and investment management. The index business is a leading provider of benchmarks to US-focused equity funds and also provides customised and innovative index solutions for clients. The investment management business has $273bn assets under management at the end of December 2014 and is a leading provider of multi-asset class investment solutions to institutional and retail investors worldwide. The acquisition of Russell continues the Group’s ongoing diversification strategy, builds on the Group’s core strengths in intellectual property, and accelerates its geographic expansion, particularly in the USA, the largest global financial services market. Following this acquisition, approximately one-third of the Group’s revenues will come from North America. The consideration paid by the Group at completion was £1,678.5m. Approximately £962.7m of the consideration was financed from the net proceeds of a Rights Issue. The Group made a Rights Issue to all its existing shareholders on 11 September 2014. The 3 for 11 Rights Issue of 74,347,813 new shares at 1,295p per new share. The remaining consideration was financed in US dollar by the Group from existing multi-currency bank debt facilities, including a £600m multi-currency revolving credit facility during the period. On 8 May 2014, the Group acquired 100 per cent of Bonds.com Group, a US-based electronic trading platform for U.S. corporate and emerging market bonds. The acquisition was made via MTS Markets International Inc (“MTS”), a subsidiary of the Group. The transaction meets the growing customer and regulatory demand for access to transparent, electronic, cost-effective platforms for the trading of fixed income securities. Going forward, MTS intends to utilise its extensive expertise in fixed income to provide Bonds.com with support and investment to further build its product offering, enabling U.S. fixed income traders to meet their domestic and international needs. The consideration paid by the Group was £8.8m.
Contribution post acquisition
Date acquired Total
investment Goodwill
Fair value of assets acquired Revenue
Operating profit/(loss)
Acquisition £m £m £m £m £m
Frank Russell Company 2 December 2014 1,678.5 476.0 1,209.9 89.8 14.4
Bonds.com Group 8 May 2014 8.8 8.7 0.1 1.6 (1.6)
1,687.3 484.7 1,210.0 91.4 12.8
From the date of acquisition, Russell contributed £89.8m of revenue and £14.4m to profit before tax from continuing operations of the Group. From the date of acquisition, Bonds.com contributed £1.6m of revenue. It made an operating loss before tax of £1.6m during the period. If the acquisitions had occurred on 1 April 2014, estimated Group revenue for the period from continuing operations would have been £863.7m, with operating profit (before acquisition amortisation and exceptional items) of £133.9m. These amounts have been calculated using the Group’s accounting policies and based on available information.
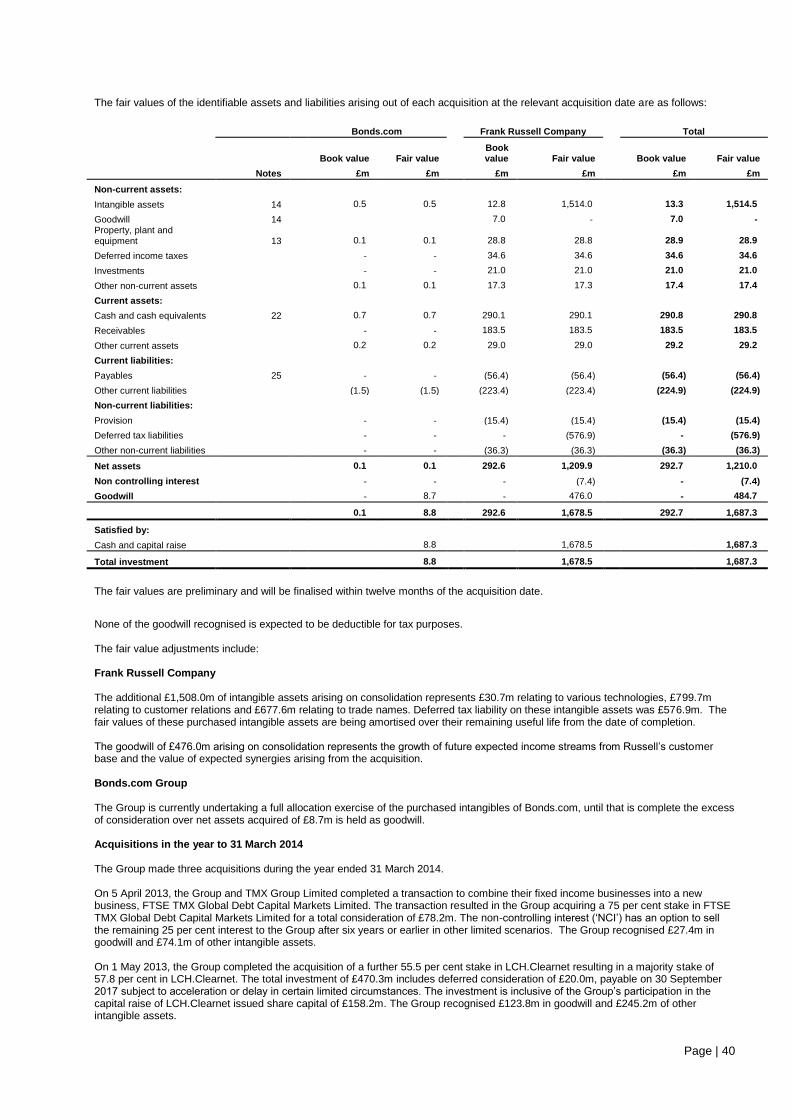
Page | 40
The fair values of the identifiable assets and liabilities arising out of each acquisition at the relevant acquisition date are as follows:
Bonds.com Frank Russell Company Total
Book value Fair value Book value Fair value Book value Fair value
Notes £m £m £m £m £m £m
Non-current assets:
Intangible assets 14 0.5 0.5 12.8 1,514.0 13.3 1,514.5
Goodwill 14 7.0 - 7.0 - Property, plant and equipment 13 0.1 0.1 28.8 28.8 28.9 28.9
Deferred income taxes - - 34.6 34.6 34.6 34.6
Investments - - 21.0 21.0 21.0 21.0
Other non-current assets 0.1 0.1 17.3 17.3 17.4 17.4
Current assets:
Cash and cash equivalents 22 0.7 0.7 290.1 290.1 290.8 290.8
Receivables - - 183.5 183.5 183.5 183.5
Other current assets 0.2 0.2 29.0 29.0 29.2 29.2
Current liabilities:
Payables 25 - - (56.4) (56.4) (56.4) (56.4)
Other current liabilities (1.5) (1.5) (223.4) (223.4) (224.9) (224.9)
Non-current liabilities:
Provision - - (15.4) (15.4) (15.4) (15.4)
Deferred tax liabilities - - - (576.9) - (576.9)
Other non-current liabilities - - (36.3) (36.3) (36.3) (36.3)
Net assets 0.1 0.1 292.6 1,209.9 292.7 1,210.0
Non controlling interest - - - (7.4) - (7.4)
Goodwill - 8.7 - 476.0 - 484.7
0.1 8.8 292.6 1,678.5 292.7 1,687.3
Satisfied by:
Cash and capital raise 8.8 1,678.5 1,687.3
Total investment 8.8 1,678.5 1,687.3
The fair values are preliminary and will be finalised within twelve months of the acquisition date.
None of the goodwill recognised is expected to be deductible for tax purposes. The fair value adjustments include: Frank Russell Company The additional £1,508.0m of intangible assets arising on consolidation represents £30.7m relating to various technologies, £799.7m relating to customer relations and £677.6m relating to trade names. Deferred tax liability on these intangible assets was £576.9m. The fair values of these purchased intangible assets are being amortised over their remaining useful life from the date of completion. The goodwill of £476.0m arising on consolidation represents the growth of future expected income streams from Russell’s customer base and the value of expected synergies arising from the acquisition. Bonds.com Group The Group is currently undertaking a full allocation exercise of the purchased intangibles of Bonds.com, until that is complete the excess of consideration over net assets acquired of £8.7m is held as goodwill. Acquisitions in the year to 31 March 2014 The Group made three acquisitions during the year ended 31 March 2014. On 5 April 2013, the Group and TMX Group Limited completed a transaction to combine their fixed income businesses into a new business, FTSE TMX Global Debt Capital Markets Limited. The transaction resulted in the Group acquiring a 75 per cent stake in FTSE TMX Global Debt Capital Markets Limited for a total consideration of £78.2m. The non-controlling interest (‘NCI’) has an option to sell the remaining 25 per cent interest to the Group after six years or earlier in other limited scenarios. The Group recognised £27.4m in goodwill and £74.1m of other intangible assets. On 1 May 2013, the Group completed the acquisition of a further 55.5 per cent stake in LCH.Clearnet resulting in a majority stake of 57.8 per cent in LCH.Clearnet. The total investment of £470.3m includes deferred consideration of £20.0m, payable on 30 September 2017 subject to acceleration or delay in certain limited circumstances. The investment is inclusive of the Group’s participation in the capital raise of LCH.Clearnet issued share capital of £158.2m. The Group recognised £123.8m in goodwill and £245.2m of other intangible assets.

Page | 41
On 23 September 2013, the Group acquired a 70 per cent interest in EuroTLX SIM SpA for a consideration of £26.1m and £0.9m in deferred consideration. The NCI has an option to sell the remaining 30 per cent interest to the Group. The value of the option is dependent on achieving growth and cost synergies in the next financial year. The Group recognised £15.6m in goodwill and £10.9m of other intangible assets. There were no material changes to the preliminary fair values. 20. Events after the reporting period On 5 February 2015, the Group announced the completion of the comprehensive review focused principally on assessing the strategic fit of Russell Investment Management with the Group’s long term strategy. After careful consideration, the conclusion of the comprehensive review is to explore a sale of this business in its entirety. The Group has already received a number of expressions of interest in a potential acquisition of Russell Investment Management reflecting the high quality of its business and market leading positions. A sale process of the business has now commenced. On 4 March 2015, the Board approved the allotment and issue of 225,476 ordinary shares of 6
79/86p each in the Company to satisfy
options granted under the Company’s Save-As-You-Earn and International Sharesave Plans.
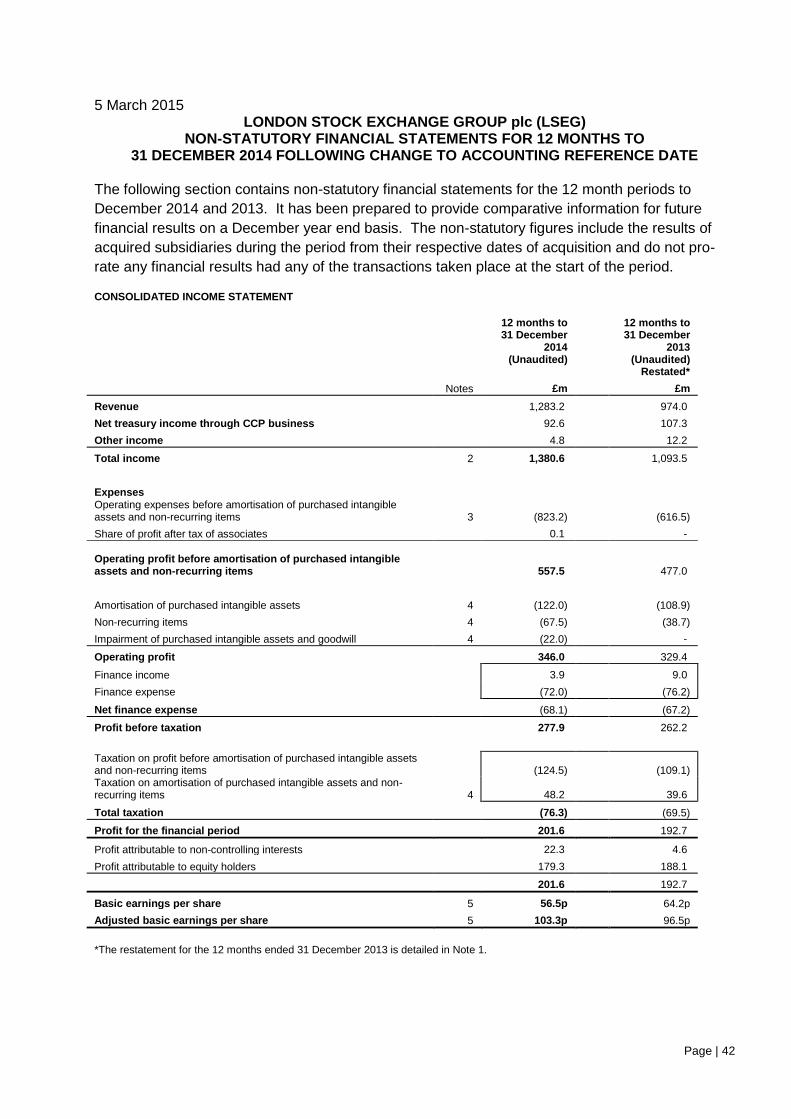
Page | 42
5 March 2015 LONDON STOCK EXCHANGE GROUP plc (LSEG)
NON-STATUTORY FINANCIAL STATEMENTS FOR 12 MONTHS TO 31 DECEMBER 2014 FOLLOWING CHANGE TO ACCOUNTING REFERENCE DATE
The following section contains non-statutory financial statements for the 12 month periods to
December 2014 and 2013. It has been prepared to provide comparative information for future
financial results on a December year end basis. The non-statutory figures include the results of
acquired subsidiaries during the period from their respective dates of acquisition and do not pro-
rate any financial results had any of the transactions taken place at the start of the period.
CONSOLIDATED INCOME STATEMENT
12 months to 31 December
2014
12 months to 31 December
2013
(Unaudited)
(Unaudited)
Restated*
Notes £m £m
Revenue 1,283.2 974.0
Net treasury income through CCP business 92.6 107.3
Other income 4.8 12.2
Total income 2 1,380.6 1,093.5
Expenses Operating expenses before amortisation of purchased intangible
assets and non-recurring items 3 (823.2) (616.5)
Share of profit after tax of associates 0.1 -
Operating profit before amortisation of purchased intangible assets and non-recurring items 557.5 477.0
Amortisation of purchased intangible assets 4 (122.0) (108.9)
Non-recurring items 4 (67.5) (38.7)
Impairment of purchased intangible assets and goodwill 4 (22.0) -
Operating profit
346.0 329.4
Finance income 3.9 9.0
Finance expense (72.0) (76.2)
Net finance expense
(68.1) (67.2)
Profit before taxation 277.9 262.2
Taxation on profit before amortisation of purchased intangible assets
and non-recurring items (124.5) (109.1) Taxation on amortisation of purchased intangible assets and non-recurring items 4 48.2 39.6
Total taxation
(76.3) (69.5)
Profit for the financial period 201.6 192.7
Profit attributable to non-controlling interests 22.3 4.6
Profit attributable to equity holders 179.3 188.1
201.6 192.7
Basic earnings per share 5 56.5p 64.2p
Adjusted basic earnings per share 5 103.3p 96.5p
*The restatement for the 12 months ended 31 December 2013 is detailed in Note 1.
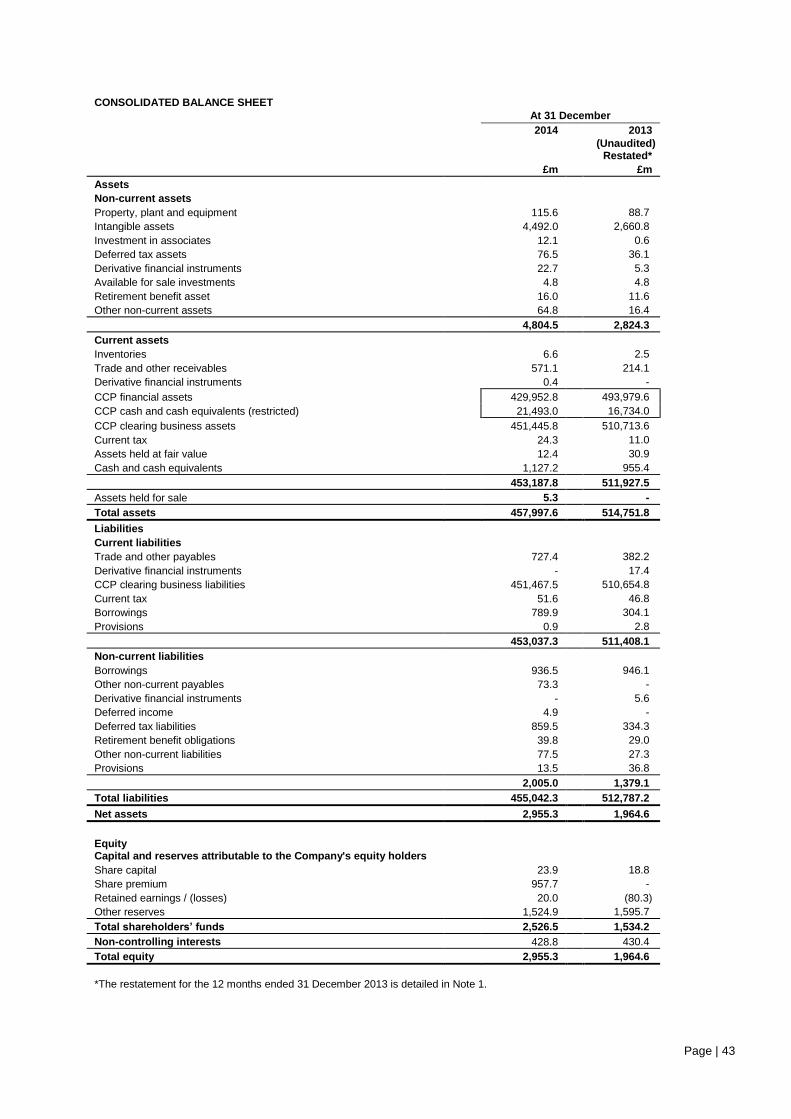
Page | 43
CONSOLIDATED BALANCE SHEET
At 31 December
2014 2013
(Unaudited)
Restated*
£m £m
Assets
Non-current assets
Property, plant and equipment 115.6 88.7
Intangible assets
4,492.0 2,660.8
Investment in associates 12.1 0.6
Deferred tax assets 76.5 36.1
Derivative financial instruments 22.7 5.3
Available for sale investments 4.8 4.8
Retirement benefit asset 16.0 11.6
Other non-current assets 64.8 16.4
4,804.5 2,824.3
Current assets
Inventories 6.6 2.5
Trade and other receivables 571.1 214.1
Derivative financial instruments 0.4 -
CCP financial assets 429,952.8 493,979.6
CCP cash and cash equivalents (restricted) 21,493.0 16,734.0
CCP clearing business assets 451,445.8 510,713.6
Current tax 24.3 11.0
Assets held at fair value 12.4 30.9
Cash and cash equivalents 1,127.2 955.4
453,187.8 511,927.5
Assets held for sale 5.3 -
Total assets 457,997.6 514,751.8
Liabilities
Current liabilities
Trade and other payables 727.4 382.2
Derivative financial instruments - 17.4
CCP clearing business liabilities 451,467.5 510,654.8
Current tax 51.6 46.8
Borrowings 789.9 304.1
Provisions 0.9 2.8
453,037.3 511,408.1
Non-current liabilities
Borrowings 936.5 946.1
Other non-current payables 73.3 -
Derivative financial instruments - 5.6
Deferred income 4.9 -
Deferred tax liabilities 859.5 334.3
Retirement benefit obligations 39.8 29.0
Other non-current liabilities 77.5 27.3
Provisions 13.5 36.8
2,005.0 1,379.1
Total liabilities 455,042.3 512,787.2
Net assets 2,955.3 1,964.6
Equity Capital and reserves attributable to the Company's equity holders
Share capital 23.9 18.8
Share premium 957.7 -
Retained earnings / (losses) 20.0 (80.3)
Other reserves 1,524.9 1,595.7
Total shareholders’ funds 2,526.5 1,534.2
Non-controlling interests 428.8 430.4
Total equity 2,955.3 1,964.6
*The restatement for the 12 months ended 31 December 2013 is detailed in Note 1.
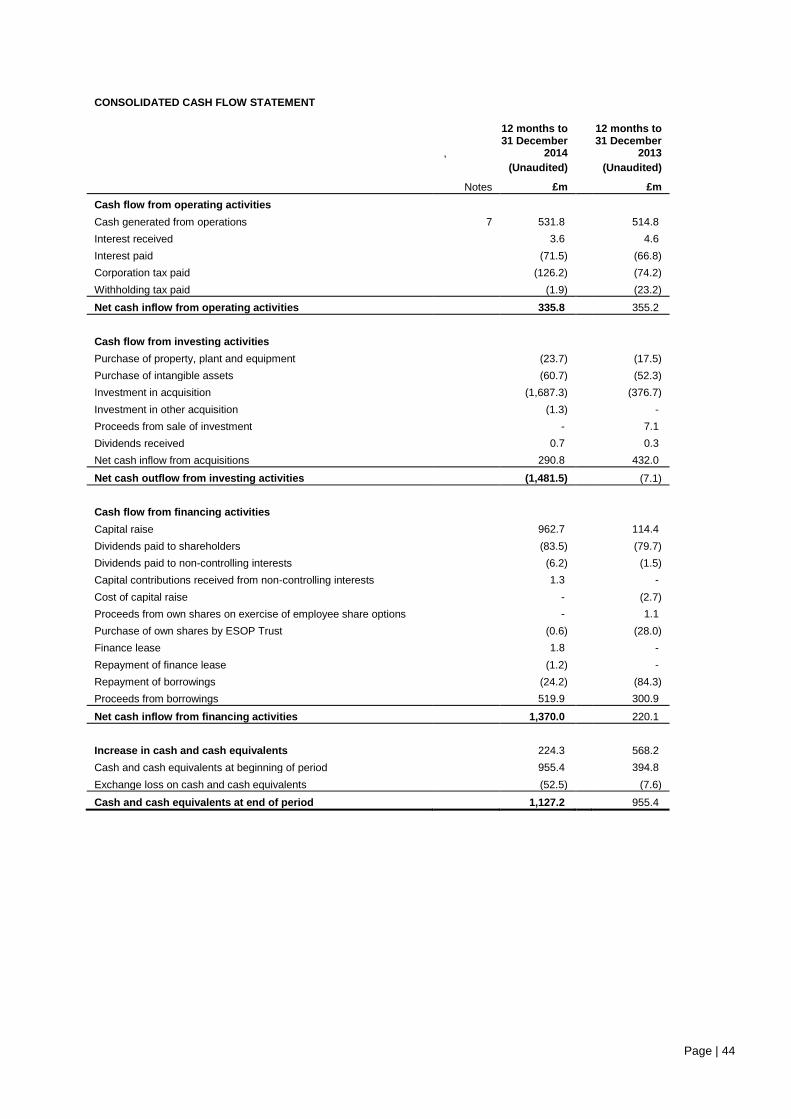
Page | 44
CONSOLIDATED CASH FLOW STATEMENT
,
12 months to 31 December
2014
12 months to 31 December
2013
(Unaudited) (Unaudited)
Notes £m £m
Cash flow from operating activities
Cash generated from operations 7 531.8 514.8
Interest received 3.6 4.6
Interest paid (71.5) (66.8)
Corporation tax paid (126.2) (74.2)
Withholding tax paid (1.9) (23.2)
Net cash inflow from operating activities 335.8 355.2
Cash flow from investing activities
Purchase of property, plant and equipment (23.7) (17.5)
Purchase of intangible assets (60.7) (52.3)
Investment in acquisition (1,687.3) (376.7)
Investment in other acquisition (1.3) -
Proceeds from sale of investment - 7.1
Dividends received 0.7 0.3
Net cash inflow from acquisitions 290.8 432.0
Net cash outflow from investing activities (1,481.5) (7.1)
Cash flow from financing activities
Capital raise 962.7 114.4
Dividends paid to shareholders (83.5) (79.7)
Dividends paid to non-controlling interests (6.2) (1.5)
Capital contributions received from non-controlling interests 1.3 -
Cost of capital raise - (2.7)
Proceeds from own shares on exercise of employee share options - 1.1
Purchase of own shares by ESOP Trust (0.6) (28.0)
Finance lease 1.8 -
Repayment of finance lease (1.2) -
Repayment of borrowings (24.2) (84.3)
Proceeds from borrowings 519.9 300.9
Net cash inflow from financing activities 1,370.0 220.1
Increase in cash and cash equivalents 224.3 568.2
Cash and cash equivalents at beginning of period 955.4 394.8
Exchange loss on cash and cash equivalents (52.5) (7.6)
Cash and cash equivalents at end of period 1,127.2 955.4
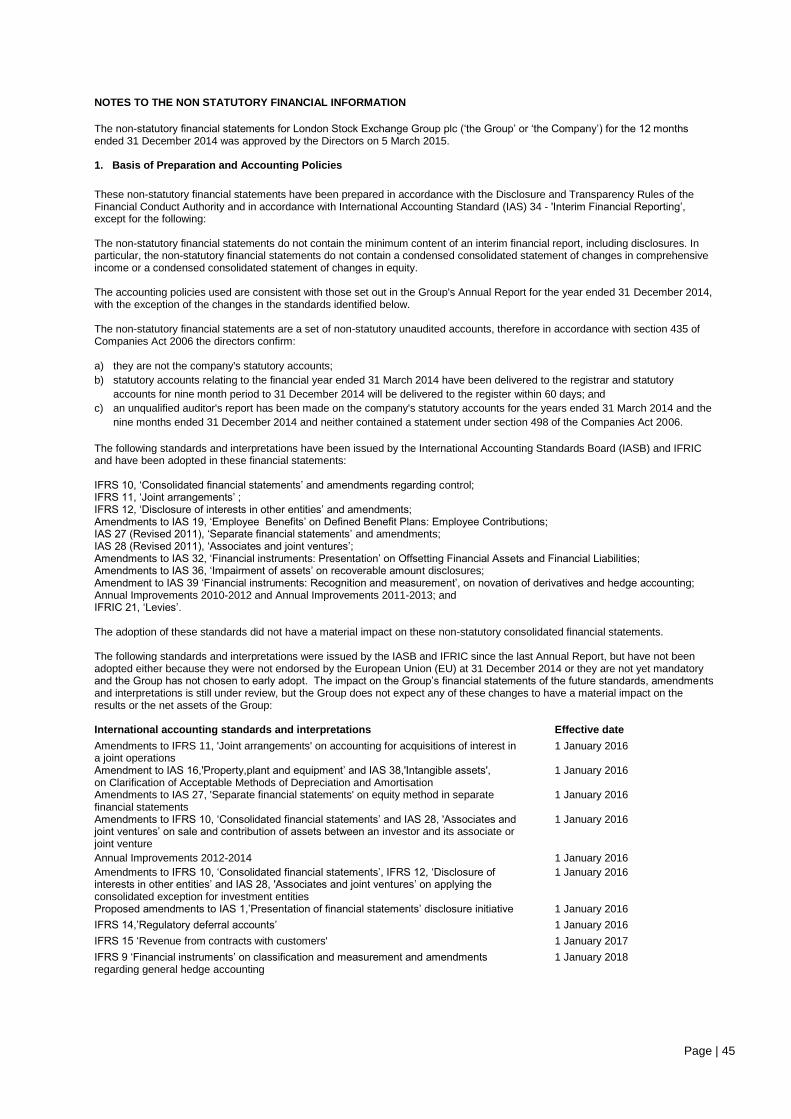
Page | 45
NOTES TO THE NON STATUTORY FINANCIAL INFORMATION
The non-statutory financial statements for London Stock Exchange Group plc (‘the Group’ or ‘the Company’) for the 12 months ended 31 December 2014 was approved by the Directors on 5 March 2015. 1. Basis of Preparation and Accounting Policies
These non-statutory financial statements have been prepared in accordance with the Disclosure and Transparency Rules of the Financial Conduct Authority and in accordance with International Accounting Standard (IAS) 34 - 'Interim Financial Reporting’, except for the following: The non-statutory financial statements do not contain the minimum content of an interim financial report, including disclosures. In particular, the non-statutory financial statements do not contain a condensed consolidated statement of changes in comprehensive income or a condensed consolidated statement of changes in equity. The accounting policies used are consistent with those set out in the Group's Annual Report for the year ended 31 December 2014, with the exception of the changes in the standards identified below. The non-statutory financial statements are a set of non-statutory unaudited accounts, therefore in accordance with section 435 of Companies Act 2006 the directors confirm: a) they are not the company's statutory accounts;
b) statutory accounts relating to the financial year ended 31 March 2014 have been delivered to the registrar and statutory
accounts for nine month period to 31 December 2014 will be delivered to the register within 60 days; and
c) an unqualified auditor's report has been made on the company's statutory accounts for the years ended 31 March 2014 and the
nine months ended 31 December 2014 and neither contained a statement under section 498 of the Companies Act 2006.
The following standards and interpretations have been issued by the International Accounting Standards Board (IASB) and IFRIC and have been adopted in these financial statements: IFRS 10, ‘Consolidated financial statements’ and amendments regarding control; IFRS 11, ‘Joint arrangements’ ; IFRS 12, ‘Disclosure of interests in other entities’ and amendments; Amendments to IAS 19, ‘Employee Benefits’ on Defined Benefit Plans: Employee Contributions; IAS 27 (Revised 2011), ‘Separate financial statements’ and amendments; IAS 28 (Revised 2011), ‘Associates and joint ventures’; Amendments to IAS 32, ‘Financial instruments: Presentation’ on Offsetting Financial Assets and Financial Liabilities; Amendments to IAS 36, ‘Impairment of assets’ on recoverable amount disclosures; Amendment to IAS 39 ‘Financial instruments: Recognition and measurement’, on novation of derivatives and hedge accounting; Annual Improvements 2010-2012 and Annual Improvements 2011-2013; and IFRIC 21, ‘Levies’. The adoption of these standards did not have a material impact on these non-statutory consolidated financial statements. The following standards and interpretations were issued by the IASB and IFRIC since the last Annual Report, but have not been adopted either because they were not endorsed by the European Union (EU) at 31 December 2014 or they are not yet mandatory and the Group has not chosen to early adopt. The impact on the Group’s financial statements of the future standards, amendments and interpretations is still under review, but the Group does not expect any of these changes to have a material impact on the results or the net assets of the Group: International accounting standards and interpretations Effective date
Amendments to IFRS 11, 'Joint arrangements' on accounting for acquisitions of interest in a joint operations
1 January 2016
Amendment to IAS 16,'Property,plant and equipment’ and IAS 38,'Intangible assets', on Clarification of Acceptable Methods of Depreciation and Amortisation
1 January 2016
Amendments to IAS 27, 'Separate financial statements' on equity method in separate financial statements
1 January 2016
Amendments to IFRS 10, ‘Consolidated financial statements’ and IAS 28, 'Associates and joint ventures’ on sale and contribution of assets between an investor and its associate or joint venture
1 January 2016
Annual Improvements 2012-2014 1 January 2016
Amendments to IFRS 10, ‘Consolidated financial statements’, IFRS 12, ‘Disclosure of interests in other entities’ and IAS 28, 'Associates and joint ventures’ on applying the consolidated exception for investment entities
1 January 2016
Proposed amendments to IAS 1,’Presentation of financial statements’ disclosure initiative 1 January 2016
IFRS 14,’Regulatory deferral accounts’ 1 January 2016
IFRS 15 ‘Revenue from contracts with customers' 1 January 2017
IFRS 9 ‘Financial instruments’ on classification and measurement and amendments regarding general hedge accounting
1 January 2018

Page | 46
The preparation of the non-statutory financial statements requires management to make estimates and assumptions that affect the reported income and expense, assets and liabilities and disclosure of contingencies at the date of the non-statutory financial statements. Although these estimates and assumptions are based on management's best judgment at the date of the non-statutory financial statements, actual results may differ from these estimates. For these non-statutory financial statements the Group is not adopting the columnar format for its consolidated income statement. Prior period restatements
The restatement to the 12 months ended 31 December 2013 relates to insufficient deferred tax liability being recognised against historical intangible assets acquired and the 2014 Rights Issue. The deferred tax liability is recognised in respect of the amortisation of the acquired intangibles which have no or partial tax base for the Group. The deferred tax is then released to the income statement over the same period as the amortisation of the acquired intangible assets. The correction of these entries result in an increase in deferred tax liability, goodwill and a resulting credit to the income statement as the deferred tax liability is unwound over the useful economic lives of the associated purchased intangibles. In addition in circumstances where the underlying assets have been recognised in a currency other than sterling there is an adjustment in relation to the retranslation of these balances. On 22 August 2014, the Group announced a Rights Issue in relation to its proposed acquisition of the Frank Russell Company. The Rights Issue constituted 74,347,813 new ordinary shares of par value 6 79/86 at 1,295p. This generated share premium of £957.7m. Consequently the 2013 basic and adjusted earnings per share numbers have been restated using the weighted average share count as if the rights issue had taken place at the start of the period.
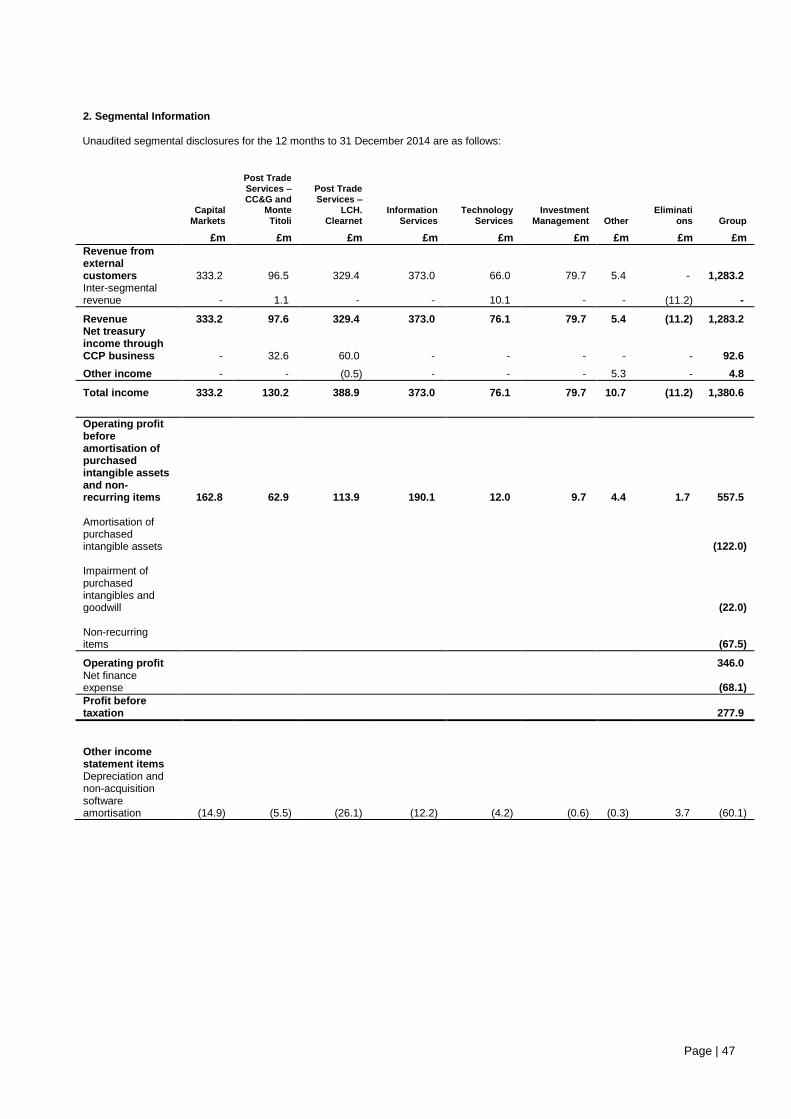
Page | 47
2. Segmental Information Unaudited segmental disclosures for the 12 months to 31 December 2014 are as follows:
Capital
Markets
Post Trade Services – CC&G and
Monte Titoli
Post Trade Services –
LCH. Clearnet
Information Services
Technology Services
Investment Management
Other
Eliminati
ons Group
£m £m £m £m £m £m £m £m £m
Revenue from external customers 333.2 96.5 329.4 373.0 66.0 79.7 5.4 - 1,283.2 Inter-segmental revenue - 1.1 - - 10.1 - - (11.2) -
Revenue 333.2 97.6 329.4 373.0 76.1 79.7 5.4 (11.2) 1,283.2 Net treasury income through CCP business - 32.6 60.0 - - - - - 92.6
Other income - - (0.5) - - - 5.3 - 4.8
Total income 333.2 130.2 388.9 373.0 76.1 79.7 10.7 (11.2) 1,380.6
Operating profit before amortisation of purchased intangible assets and non-recurring items 162.8 62.9 113.9 190.1 12.0 9.7 4.4 1.7 557.5 Amortisation of purchased intangible assets (122.0) Impairment of purchased intangibles and goodwill (22.0) Non-recurring items (67.5)
Operating profit 346.0 Net finance expense (68.1)
Profit before taxation 277.9
Other income statement items Depreciation and non-acquisition software amortisation (14.9) (5.5) (26.1) (12.2) (4.2) (0.6) (0.3) 3.7 (60.1)
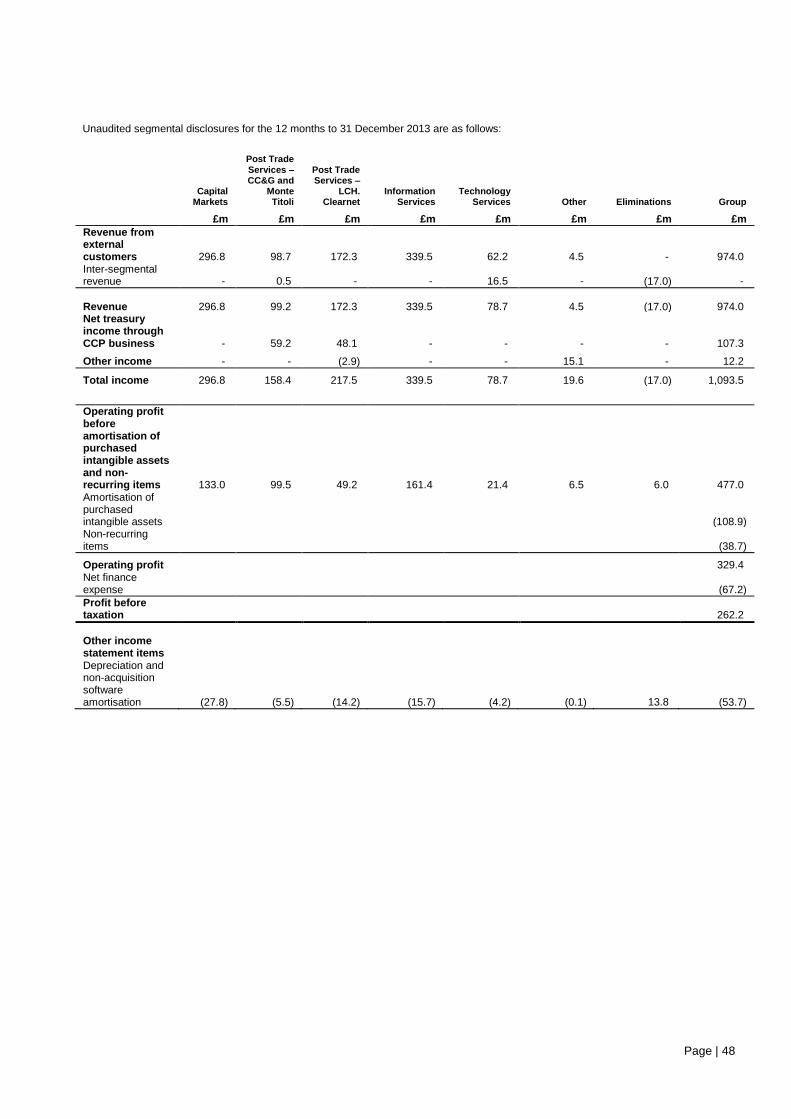
Page | 48
Unaudited segmental disclosures for the 12 months to 31 December 2013 are as follows:
Capital
Markets
Post Trade Services – CC&G and
Monte Titoli
Post Trade Services –
LCH. Clearnet
Information Services
Technology Services
Other
Eliminations Group
£m £m £m £m £m £m £m £m
Revenue from external customers 296.8 98.7 172.3 339.5 62.2 4.5 - 974.0 Inter-segmental revenue - 0.5 - - 16.5
-
(17.0) -
Revenue 296.8 99.2 172.3 339.5 78.7 4.5
(17.0) 974.0 Net treasury income through CCP business - 59.2 48.1 - - - - 107.3
Other income - - (2.9) - - 15.1 - 12.2
Total income 296.8 158.4 217.5 339.5 78.7 19.6 (17.0) 1,093.5
Operating profit before amortisation of purchased intangible assets and non-recurring items 133.0 99.5 49.2 161.4 21.4 6.5 6.0 477.0 Amortisation of purchased intangible assets (108.9) Non-recurring items (38.7)
Operating profit 329.4 Net finance expense (67.2)
Profit before taxation 262.2
Other income statement items Depreciation and non-acquisition software amortisation (27.8) (5.5) (14.2) (15.7) (4.2) (0.1) 13.8 (53.7)
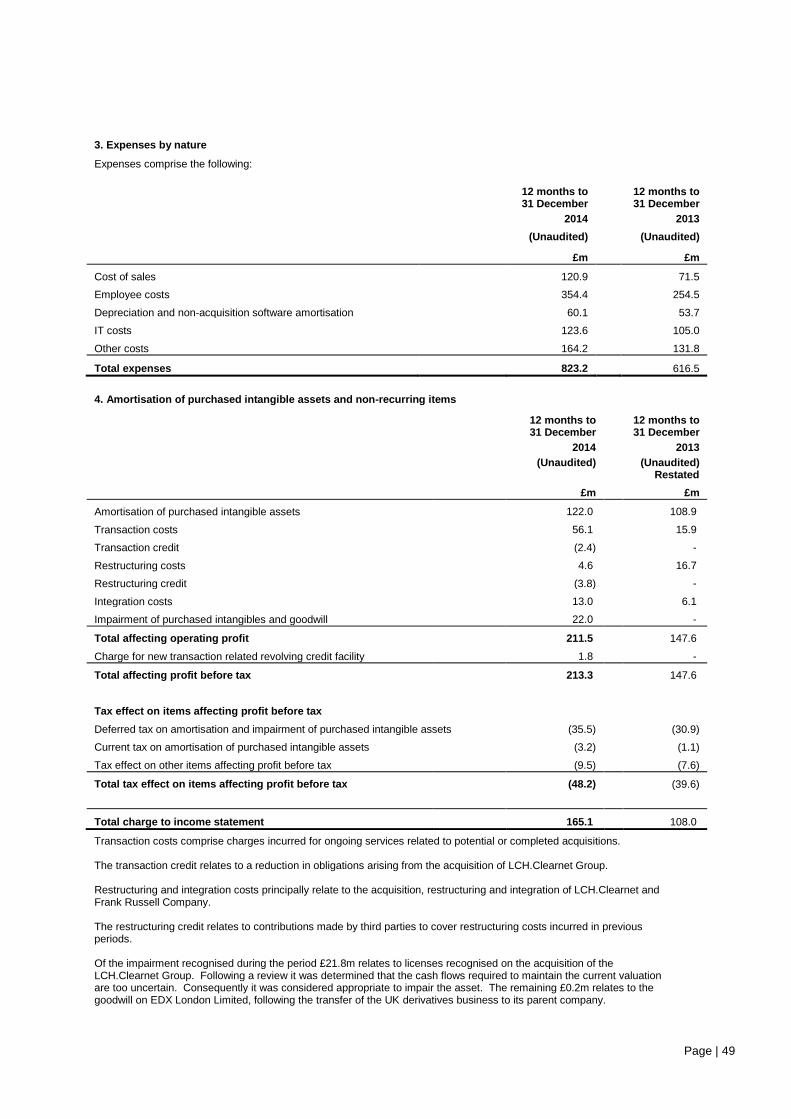
Page | 49
3. Expenses by nature
Expenses comprise the following:
12 months to 31 December
12 months to 31 December
2014 2013
(Unaudited) (Unaudited)
£m £m
Cost of sales
120.9 71.5
Employee costs
354.4 254.5
Depreciation and non-acquisition software amortisation
60.1 53.7
IT costs
123.6 105.0
Other costs
164.2 131.8
Total expenses
823.2 616.5
4. Amortisation of purchased intangible assets and non-recurring items
12 months to 31 December
12 months to 31 December
2014 2013
(Unaudited)
(Unaudited)
Restated
£m £m
Amortisation of purchased intangible assets
122.0 108.9
Transaction costs 56.1 15.9
Transaction credit (2.4) -
Restructuring costs 4.6 16.7
Restructuring credit (3.8) -
Integration costs 13.0 6.1
Impairment of purchased intangibles and goodwill 22.0 -
Total affecting operating profit 211.5 147.6
Charge for new transaction related revolving credit facility 1.8 -
Total affecting profit before tax 213.3 147.6
Tax effect on items affecting profit before tax
Deferred tax on amortisation and impairment of purchased intangible assets (35.5) (30.9)
Current tax on amortisation of purchased intangible assets (3.2) (1.1)
Tax effect on other items affecting profit before tax (9.5) (7.6)
Total tax effect on items affecting profit before tax (48.2) (39.6)
Total charge to income statement 165.1 108.0 Transaction costs comprise charges incurred for ongoing services related to potential or completed acquisitions. The transaction credit relates to a reduction in obligations arising from the acquisition of LCH.Clearnet Group. Restructuring and integration costs principally relate to the acquisition, restructuring and integration of LCH.Clearnet and Frank Russell Company. The restructuring credit relates to contributions made by third parties to cover restructuring costs incurred in previous periods. Of the impairment recognised during the period £21.8m relates to licenses recognised on the acquisition of the LCH.Clearnet Group. Following a review it was determined that the cash flows required to maintain the current valuation are too uncertain. Consequently it was considered appropriate to impair the asset. The remaining £0.2m relates to the goodwill on EDX London Limited, following the transfer of the UK derivatives business to its parent company.
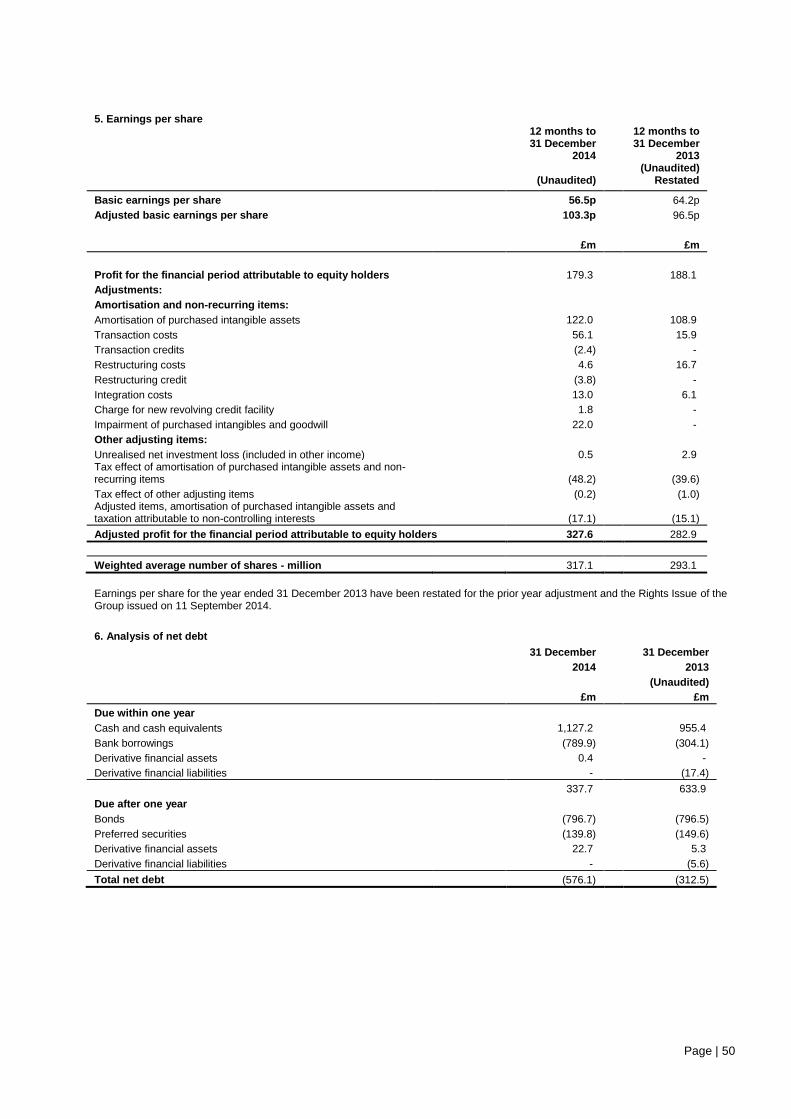
Page | 50
5. Earnings per share
12 months to 31 December
2014
12 months to 31 December
2013
(Unaudited) (Unaudited)
Restated Basic earnings per share 56.5p 64.2p
Adjusted basic earnings per share 103.3p 96.5p
£m £m
Profit for the financial period attributable to equity holders 179.3 188.1
Adjustments: Amortisation and non-recurring items:
Amortisation of purchased intangible assets 122.0 108.9
Transaction costs 56.1 15.9
Transaction credits (2.4) -
Restructuring costs 4.6 16.7
Restructuring credit (3.8) -
Integration costs 13.0 6.1
Charge for new revolving credit facility 1.8 -
Impairment of purchased intangibles and goodwill 22.0 -
Other adjusting items:
Unrealised net investment loss (included in other income) 0.5 2.9 Tax effect of amortisation of purchased intangible assets and non-recurring items (48.2) (39.6)
Tax effect of other adjusting items (0.2) (1.0) Adjusted items, amortisation of purchased intangible assets and taxation attributable to non-controlling interests (17.1) (15.1)
Adjusted profit for the financial period attributable to equity holders 327.6 282.9
Weighted average number of shares - million 317.1 293.1
Earnings per share for the year ended 31 December 2013 have been restated for the prior year adjustment and the Rights Issue of the Group issued on 11 September 2014.
6. Analysis of net debt
31 December 31 December
2014 2013
(Unaudited)
£m £m
Due within one year
Cash and cash equivalents 1,127.2 955.4
Bank borrowings (789.9) (304.1)
Derivative financial assets 0.4 -
Derivative financial liabilities - (17.4)
337.7 633.9
Due after one year Bonds (796.7) (796.5)
Preferred securities (139.8) (149.6)
Derivative financial assets 22.7 5.3
Derivative financial liabilities - (5.6)
Total net debt (576.1) (312.5)
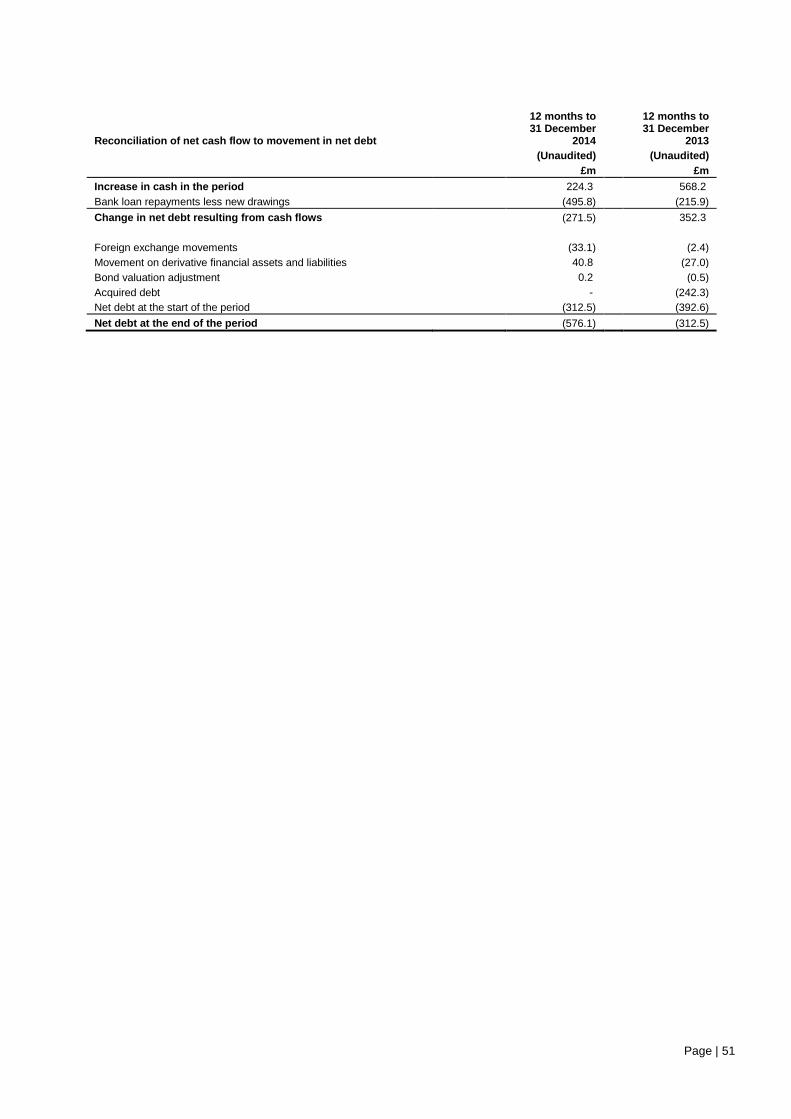
Page | 51
Reconciliation of net cash flow to movement in net debt
12 months to 31 December
2014
12 months to 31 December
2013
(Unaudited) (Unaudited)
£m £m
Increase in cash in the period 224.3 568.2
Bank loan repayments less new drawings (495.8) (215.9)
Change in net debt resulting from cash flows (271.5) 352.3
Foreign exchange movements (33.1) (2.4)
Movement on derivative financial assets and liabilities 40.8 (27.0)
Bond valuation adjustment 0.2 (0.5)
Acquired debt - (242.3)
Net debt at the start of the period (312.5) (392.6)
Net debt at the end of the period (576.1) (312.5)
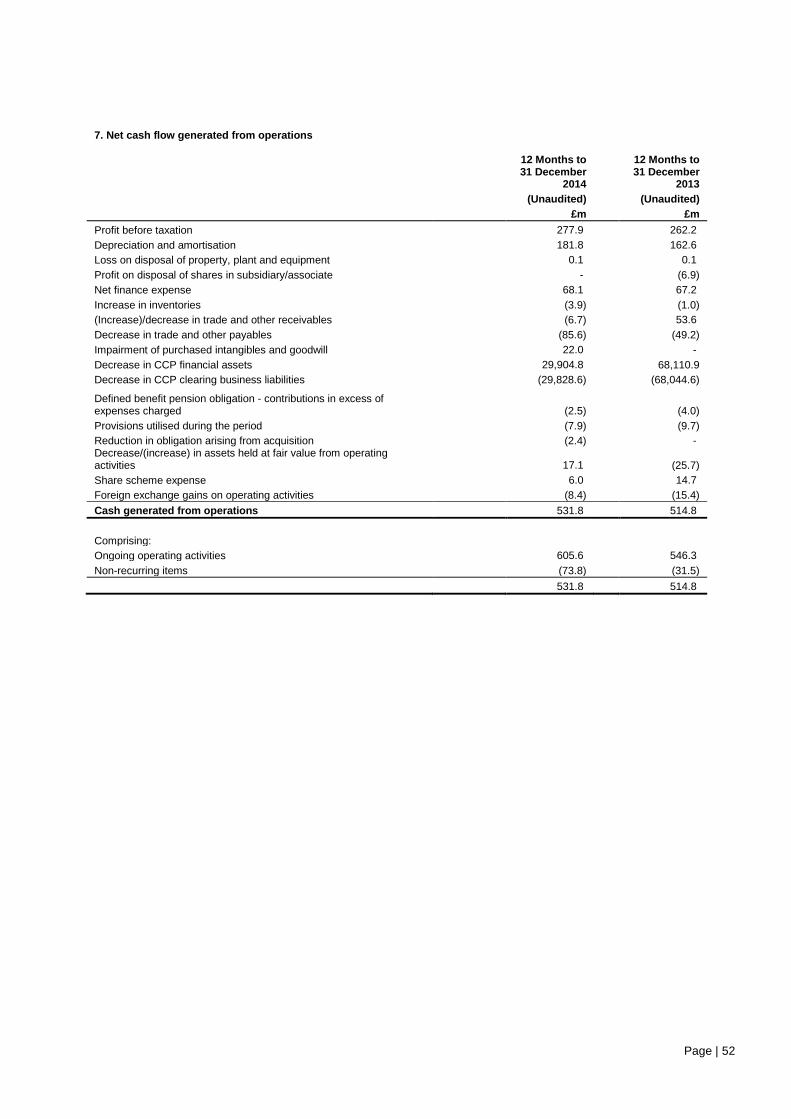
Page | 52
7. Net cash flow generated from operations
12 Months to 31 December
2014
12 Months to 31 December
2013
(Unaudited) (Unaudited)
£m £m
Profit before taxation 277.9 262.2
Depreciation and amortisation 181.8 162.6
Loss on disposal of property, plant and equipment 0.1 0.1
Profit on disposal of shares in subsidiary/associate - (6.9)
Net finance expense 68.1 67.2
Increase in inventories (3.9) (1.0)
(Increase)/decrease in trade and other receivables (6.7) 53.6
Decrease in trade and other payables (85.6) (49.2)
Impairment of purchased intangibles and goodwill 22.0 -
Decrease in CCP financial assets 29,904.8 68,110.9
Decrease in CCP clearing business liabilities (29,828.6) (68,044.6)
Defined benefit pension obligation - contributions in excess of expenses charged (2.5) (4.0)
Provisions utilised during the period (7.9) (9.7)
Reduction in obligation arising from acquisition (2.4) - Decrease/(increase) in assets held at fair value from operating activities 17.1 (25.7)
Share scheme expense 6.0 14.7
Foreign exchange gains on operating activities (8.4) (15.4)
Cash generated from operations 531.8 514.8
Comprising: Ongoing operating activities 605.6 546.3
Non-recurring items (73.8) (31.5)
531.8 514.8
Related Documents