Pianola Visualization of Multivariate Time-Series Security Event Data Alistair Thomson 1 , Martin Graham 2 & Jessie Kennedy 2 1 ECS Security Ltd, 2 Edinburgh Napier University 1 IV 2013, London, UK, 16-18 July 2013

Welcome message from author
This document is posted to help you gain knowledge. Please leave a comment to let me know what you think about it! Share it to your friends and learn new things together.
Transcript

PianolaVisualization of Multivariate Time-Series Security Event Data
Alistair Thomson1, Martin Graham2 & Jessie Kennedy2
1ECS Security Ltd, 2Edinburgh Napier University
1 IV 2013, London, UK, 16-18 July 2013

Introduction
Cybersecurity is obviously a big problem
42% increase in attacks in just the last year*
But less obvious is that smaller businesses are
targeted
31% of attacks are against businesses with fewer than
250 employees*
Such businesses lack resources for dedicated
security threat analysis
Employee in charge of network security is probably
responsible for many other tasks in the company too
*Figures from Symantec 2013 Internet Security Threat Report, Vol. 182 IV 2013, London, UK, 16-18 July 2013
IDS + Log Files
IV 2013, London, UK, 16-18 July 20133
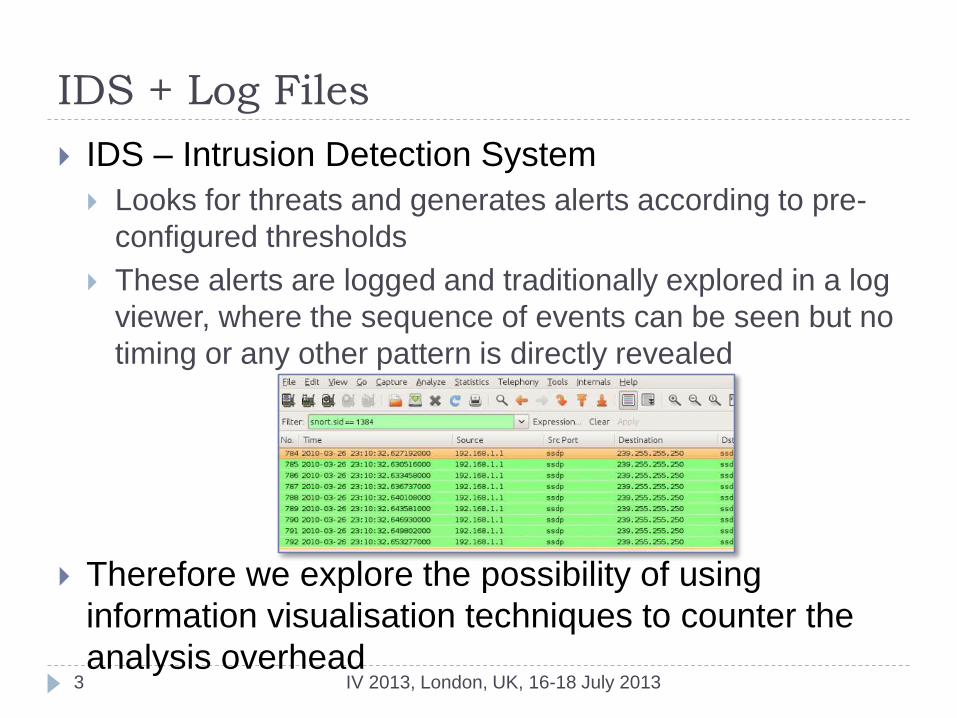
IDS – Intrusion Detection System
Looks for threats and generates alerts according to pre-
configured thresholds
These alerts are logged and traditionally explored in a log
viewer, where the sequence of events can be seen but no
timing or any other pattern is directly revealed
Therefore we explore the possibility of using
information visualisation techniques to counter the
analysis overhead

Example of how analysts do it
IV 2013, London, UK, 16-18 July 20134
http://www.symantec.com/connect/articles/ids-logs-
forensics-investigations-analysis-compromised-
honeypot
Unix command and pipelines
Expert users
Quick
SQL Queries

Existing Visualisation Systems
SnortView IDS Rainstorm
Plots alerts over time,
temporal patterns are
revealed, only shows
~40 alerts at any one
time
Can show large amounts of data, but issues with colour-coding and reserves space for inactive addresses
5 IV 2013, London, UK, 16-18 July 2013

Existing Visualisation Systems
VizAlert SpiralView
Radial tool around a node-link graph, but congestion means all but most recent events end up summarised
Reveals daily/weekly
patterns, rich
interaction, but we are
looking at short
timescales (~1 day)6 IV 2013, London, UK, 16-18 July 2013

Low cognitive overhead (perception)
Supply them with actionable information
Easily integrated into their workflow
Suitable timeframe in real-time (~24 hours)
Need to see at least hundreds of alerts
Pianola Requirements
IV 2013, London, UK, 16-18 July 20137

Komlodi et al’s Task Analysis Framework
1. Monitoring: Simple overview of data, pattern and outlier
recognition
2. Analysis: Multiple views, zoom, drill-down, linked views,
filtering
3. Response: Reporting, annotation, saving views
Our visualisation concentrates on delivering the first
two
Design
IV 2013, London, UK, 16-18 July 20138

Design
IV 2013, London, UK, 16-18 July 20139
Monitoring: Simple overview of data, pattern and outlier
recognition
What
Severity Size
Where
Target Y Axis
When
Time X Axis
These three attributes should be mapped to the
prominent visual attributes

Design
IV 2013, London, UK, 16-18 July 201310
Analysis: Multiple views, zoom, drill-down, linked views,
filtering
Views
Main alert panel (x, y, size)
Summary views by
Destinations, sources, ports, alert classifications
Linked together, selection in one view links to others
Time-period zoomable to shorter timeframes
Filtering of low-level alerts to show only severe alerts

Implementation
IV 2013, London, UK, 16-18 July 201311
Processing - easy to learn and prototype

Demo
IV 2013, London, UK, 16-18 July 201312
Demo

Evaluation
IV 2013, London, UK, 16-18 July 201313
Evaluation of Pianola vs CLI based approach
Why vs CLI?
It’s what security analysts are familiar with
(+ we didn’t have access to the other visualisation tools)
Participants
6 postgrads, 1 grad, 1 undergrad, 1 research fellow
All studying (or had studied) IDS systems
Data
Artifically created small datasets, 1000 suspicious events
over 24 hours on 20 machines
Evaluation
IV 2013, London, UK, 16-18 July 201314
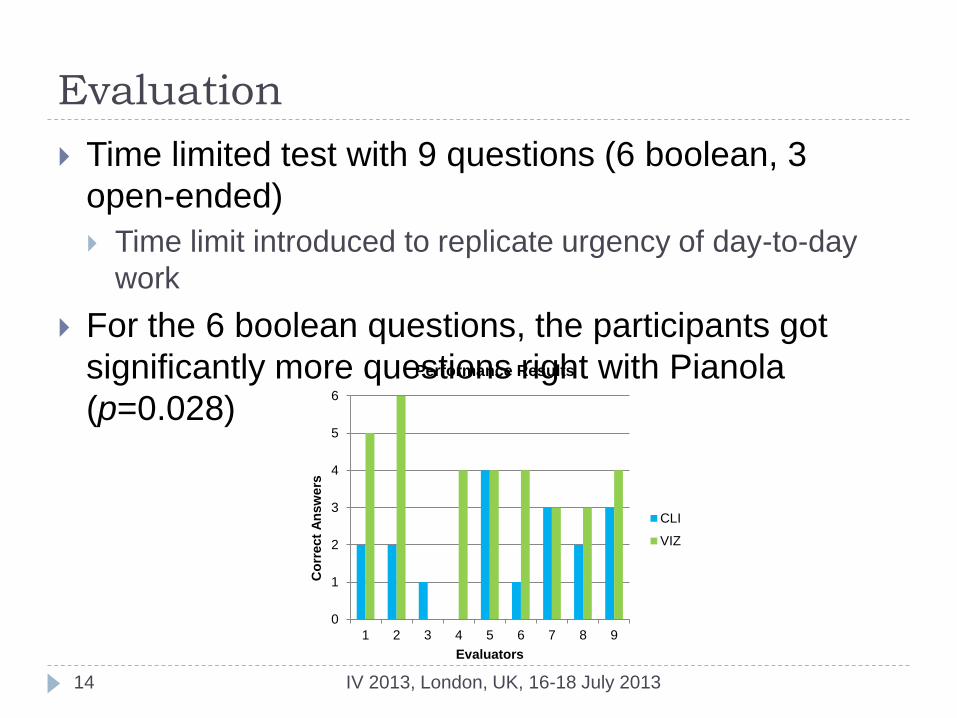
Time limited test with 9 questions (6 boolean, 3
open-ended)
Time limit introduced to replicate urgency of day-to-day
work
For the 6 boolean questions, the participants got
significantly more questions right with Pianola
(p=0.028)
0
1
2
3
4
5
6
1 2 3 4 5 6 7 8 9
Co
rrect
An
sw
ers
Evaluators
Performance Results
CLI
VIZ

Evaluation
IV 2013, London, UK, 16-18 July 201315
Open-Ended Q’s
The users stated they found the same amount of
patterns/clusters and more watchlist hosts with Pianola
than with the CLI
Some issues with interface
Time-slider slightly awkward to use
Message box sometimes obtrusive / cut-off

Evaluation
IV 2013, London, UK, 16-18 July 201316
The participants registered subjective ratings with
the NASA Task-Load Index Scale (lower is better;
scale 0-28)
0
7
14
21
28
Co
gnitiv
e
Tem
pora
l
Perf
orm
ance
Effort
Fru
str
ation
Av
era
ge S
co
re
TLX Dimension
Average Workload by condition
CLI
VIZ

Evaluation
IV 2013, London, UK, 16-18 July 201317
The participants registered subjective ratings with
the NASA Task-Load Index Scale (lower is better;
scale 0-28)
0
20
40
60
80
100
120
140
1 2 3 4 5 6 7 8 9
Co
mb
ined
TL
X S
co
re
Evaluators
Evaluators' total Workload Scores for both conditions
CLI
VIZ

Evaluation
IV 2013, London, UK, 16-18 July 201318
Overall, participants showed significant objective and
subjective preference for Pianola over the CLI
approach

Conclusion
Did we achieve our aims?
The Task Workload q’naire showed we achieved a lower
cognitive overhead than the CLI case
Though it was ‘Effort’ that was significantly less rather than
‘Cognitive’
Probably the weakest point is integration into workflow (as
with most visualisations full-stop), but adding
export/import/annotations functions would not be more
cumbersome than for any other tool
The objective results of the test also showed the
participants were able to find actionable information more
reliably than with a CLI
19 IV 2013, London, UK, 16-18 July 2013

Conclusion
Even our quite simple visualisation outperforms a
CLI for the test data set (which isn’t large admittedly)
So why are security analysts still preferring their
command line and non-visual tools?
Failure to engage in workflow?
Scalability?
Too academic?
20 IV 2013, London, UK, 16-18 July 2013

Identified Improvements for Pianola
IV 2013, London, UK, 16-18 July 201321
Visual Scalability
Currently 50 sources / destinations, 1000’s of alerts
Focus & Context techniques could show more alerts at
known busy periods (9-5 working day)
Annotation and sharing capabilities
One analyst can mark events with descriptions and share
with others

Thank you
Any Questions?
22 IV 2013, London, UK, 16-18 July 2013
Related Documents