LOGS : HOW TO USE THEM FOR QUALITIATIVE RESERVOIR EVALUATION

LOGS : HOW TO USE THEM FOR QUALITIATIVE RESERVOIR EVALUATION.
Dec 16, 2015
Welcome message from author
This document is posted to help you gain knowledge. Please leave a comment to let me know what you think about it! Share it to your friends and learn new things together.
Transcript

LOGS : HOW TO USE THEM FOR QUALITIATIVE RESERVOIR EVALUATION

Program :
- Introduction/Objective
- Drilling/Mudlogging – A brief overview
- Depth and Datum reference
- Drilling/Mudlogging. Mandatory data for logs interpretation
- Logging Tools/Data acquisition
- Tools – Principles (Brief or Optional)
- Data acquisition – Quality Control
- Quick-look Methodology – « Understand » the well
- Main steps of the Quick Look approach
- Example #1: Sand/Shale environment Correction with Quantitative results
- Example#2 : Carbonates environment Correction with Quantitative results
-Conclusion/Main points
MGU – 20th Mar. 2014 2
HOW TO USE LOGS FOR QUALITATIVE RESERVOIR EVALUATION

3 …always the same measurements
Different types of rigs…

4
•Geological aspect:
• Sedimentology
• Structural
•Links with Geophysic (seismic)
• Time Depth conversion
• Petro elastic Model
•Reservoir aspect Main subject of this 1 day course
• Net to Gross
• Porosity
• Saturation
MGU – 20th Mar. 2014
WHY LOGGING ACQUISITION (LWD OR WL)
5
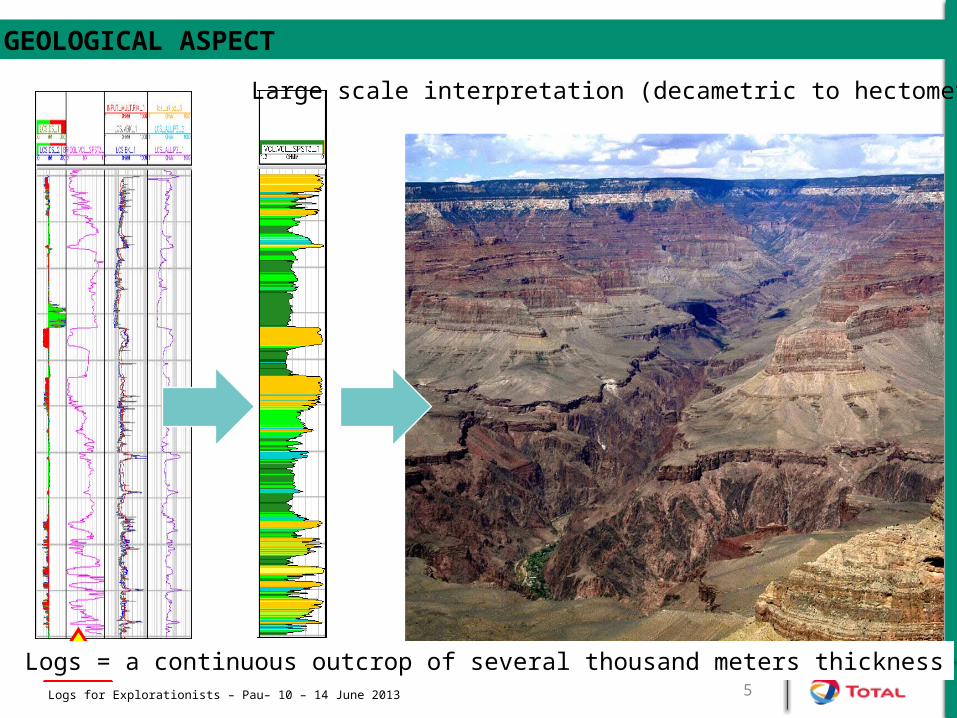
Logs = a continuous outcrop of several thousand meters thickness
Large scale interpretation (decametric to hectometric)
Logs for Explorationists – Pau– 10 – 14 June 2013
GEOLOGICAL ASPECT

6
Well to seismic Tie Petro Elastic Model
-Reservoir Characterization
-Fluid characterization
-Fluid Substitution
-Monitoring (4D)
Logs for Explorationists – Pau– 10 – 14 June 2013
WELL VS SEISMIC RELATIONSHIP

MD : Measure Depth/RTTVD : True Vertical Depth / RTTVDSS : True Vertical Depth / MSL (Mean Sea Level)
For all of them (MD, TVD,…) « Driller » and « Logger » depth are available
Wire Line depth is the referenceMGU – 20th Mar. 2014
REFERENCES DEPTH/DATUM

MGU – 20th Mar. 2014
GAS SHOWS 2/2

9-
Relation résolution verticale-profondeur d'investigation
induction deep
array inductionlatérolog deepneutron
gamma-raydensité
micro-résistivité0
50
100
150
200
250
0 50 100 150 200 250
profondeur d'investigation (cm)
réso
luti
on
ver
tica
le (
cm)
Depth of investigation (cm)
Ver
tica
l re
solu
tio
n (
cm)
NMR
FLUSHED ZONE
MGU – 20th Mar. 2014
DEPTH OF INVESTIGATION vs VERTICAL RESOLUTION

10-
Shoulders
Borehole axis
Rmc
Rxo
Rt
Res
istiv
ity
Rxo
Rt
Rw
Rmf
Sw
Sxo
Rs
Rm
Unflushed Zone
Flushed Zone
Mud cake
Drilling Mud
Rayon
Rmc
Rm
MGU – 20th Mar. 2014
INVASION PROFILE AND RESISTIVITY

LOGS – QUICK-LOOK PRINCIPLES
Raw data
Non Reservoir levels identification-Shaly levels- tight levels
Reservoirs intervalsLogs QC and badhole detection
Lithology Determination Logs and Xplot
Hydrocarbon Bearing reservoirGas effect identification
Water bearing reservoir
Clean reservoir Shaly reservoir
Porosity determination
Rw (SP, Archie…) Sw (Archie Formula)
MGU – 20th Mar. 2014
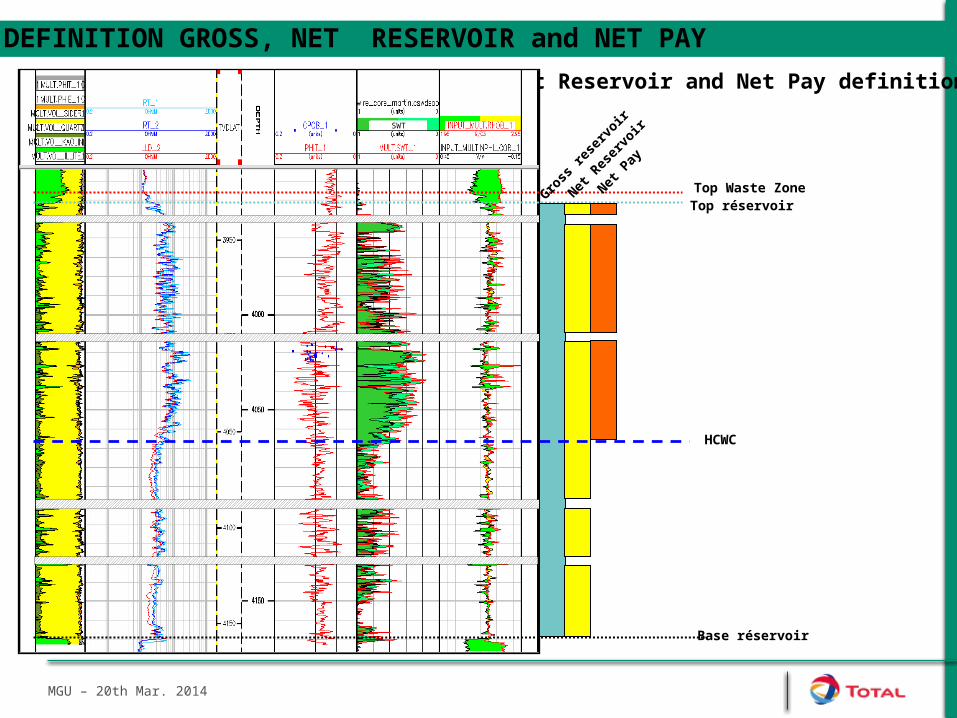
Net Reservoir and Net Pay definitions
Top réservoirTop Waste Zone
Base réservoir
HCWC
Gross
rese
rvoir
Net R
eser
voir
Net P
ay
SWT
MGU – 20th Mar. 2014
DEFINITION GROSS, NET RESERVOIR and NET PAY

LITHOLOGY DETERMINATION
Neutron/Density (limestone calibration) Identification of lithology in the water zone
#14 pu
#6 pu
Limestone Water bearing
Limestone compatible scale
Water bearing zone+
PEF (Photo Electric Factor)
PEF Limestone value : 5 B/E
PEF Dolomite
value : 3 B/E
Sandstone Water bearing
Dolomite Water bearing
Good consistency between all the is mandatory
Shale
Shale
PEF is independant of the porosity.
Neut/Dens separation around 10/14 p.u. Pure
Dolomite response
Neut/Dens superimposed Pure calcite response
Neut/Dens separation around 6 p.u.value Pure
Sandstone response
PEF Quartz value : 1.8/2
B/E

FLUIDS IDENTIFICATION – GAS EFFECT
Comparison between Rhob and Nphi Oil : extremely limited impact (Rhob and Nphi mainly impacted by lithology) Gas : effect superimposed on lithology effect
Rhob value decrease Phi_Dens overestimated due to the very low density of gas
Nphi value decrease Phi_Neutron underestimated due to the very low IH of gas
Neut/Dens Separation increase when Gas saturation is high close to the borehole. If this zone is partially or completely flushed by the mudfiltrate, the Gas Effect is reduced or null
If the porosity is very low (tight gas) Gas effect can be very low or null
Gas and Oil can not be differentiated with resistivity
Gas effect in Limestone Reservoir Gas effect in Sandstone Reservoir
Gas Gas
Water
MGU – 20th Mar. 2014

• Porosity in the water or oil zone Direct value on Neut/Dens
• Porosity of the reservoir with gas effect (known lithology) Direct value on Neut/Dens
Water Sst: Porosity 15%
Water Lst: Porosity 15%
Water Dolomite: Porosity 15%
Limestone calibrated
0.00
1/3 – 2/3 of the Neut/Density Separation
0.00
Gas Sst: Porosity 16.5%
1/3 2/3
Half of the Neut/Density Separation
From Quick Look Method From Quantitative interpretation
MGU – 20th Mar. 2014
POROSITY ESTIMATION / COMPUTATION

Comparison Rxo et Rt
• In the water leg:
– Low Resistivities
– Rt // to Rxo over a significant thickness.
• Contact Water – HC
Rxo translated on Rt
Low Res + curves //
HC – Wat Contact
From Quick Look Method From Quantitative interpretation
Gas – Oil Contact
Oil – Wat Contact
MGU – 20th Mar. 2014
CONTACTS DETERMINATION

SATURATION ESTIMATION
Sa R
Rwm
w
t
n= æè
öø×
æè
öøF
Archie Formula for clean reservoir only
In a water bearing reservoir : Sw = 1
- Common value for a :1- Common value for m :2- F determined by quick look- Rt measured by resistivity tools (Deep Investigation)
Rw = Fm x Rta
Rw can be calculated in the water zone
Porosity estimation in the water zone
Rw Determination
Rt : Red curve
Sw = 100%
Sw in the hydrocarbon bearing zone.
Can be calculated on several points during a
quick look approach

- Take into account all the mudlogging (gas, cuttings…) and drilling data (drilling phase, mud properties…)
- Logs Quality Control is a mandatory step before any type of interpretation
- Impact of a deep mud filtrate invasion
- Impact of borehole shape (washout, mudcakes)
- Detect any kind of acquisition problem
- Consistency between tool answers is very important. If not questions have to be asked:
- Problem of mineralogy
- Problem of fluids
- Problem of acquisition
- …
- Be careful with resistivity variations: a lot of informations within these curves but affected by many parameters:
- Fluid content (Water, mud filtrate, HC)
- Porosity
- Water salinity
- Cementation factor « m »
- …
- Each interpretation – Quick Look or quantitative – has to be geologicaly coherent. It means volume of minerals and porosity have to be compatible with the regional context
MGU – 20th Mar. 2014
CONCLUSION/ MAIN POINTS

NOTES/COMMENTS
Rhob Nphi DT PEF GR
g/cc v/v us/ft B/e API
Quartz 2.65 -0.02 55 1.8 Low
Calcite 2.71 0 49 5 Low
Dolomite 2.86 0.02 44 3 Low
Anhydrite 2.96 -0.01 50 5 Low
Salt 2.16 -0.02 67 4.65 Low
Pyrite 5 -0.02 39 17 Low
KFeldspar 2.52 -0.02 69 2.86 High
Micas (muscovite) 2.82 0.2 49 2.4 High
Barite 4.48 -0.01 267 Low
Lignite 1.19 0.47 160 0.2
LOGGING TOOL RESPONSE IN SEDIMENTARY MINERALS
•Be careful with resistivity variations: a lot of informations within these curves but affected by many parameters:-Fluid content (Water, mud filtrate, HC)-Water salinity -Cementation factor « m » linked to tortuosity of the porous network
- 1.6/1.7 in unconsolidated reservoir (very high porosity and permeability)- Around 2 in “classical” clastic reservoir- Up to 2.3/2.5 in tight or very tight clastic reservoir- Extremely variable in carbonates reservoir
-Porosity
MGU – 20th Mar. 2014
Related Documents