TIBCO LogLogic ® Log Management Intelligence (LMI) User Guide Software Release 6.1.1 July 2017 Two-Second Advantage ®

Welcome message from author
This document is posted to help you gain knowledge. Please leave a comment to let me know what you think about it! Share it to your friends and learn new things together.
Transcript
Two-Second Ad
TIBCO LogLogic® Log Management Intelligence (LMI)
User GuideSoftware Release 6.1.1July 2017
vantage®
Important Information
SOME TIBCO SOFTWARE EMBEDS OR BUNDLES OTHER TIBCO SOFTWARE. USE OF SUCH EMBEDDED OR BUNDLED TIBCO SOFTWARE IS SOLELY TO ENABLE THE FUNCTIONALITY (OR PROVIDE LIMITED ADD-ON FUNCTIONALITY) OF THE LICENSED TIBCO SOFTWARE. THE EMBEDDED OR BUNDLED SOFTWARE IS NOT LICENSED TO BE USED OR ACCESSED BY ANY OTHER TIBCO SOFTWARE OR FOR ANY OTHER PURPOSE.USE OF TIBCO SOFTWARE AND THIS DOCUMENT IS SUBJECT TO THE TERMS AND CONDITIONS OF A LICENSE AGREEMENT FOUND IN EITHER A SEPARATELY EXECUTED SOFTWARE LICENSE AGREEMENT, OR, IF THERE IS NO SUCH SEPARATE AGREEMENT, THE CLICKWRAP END USER LICENSE AGREEMENT WHICH IS DISPLAYED DURING DOWNLOAD OR INSTALLATION OF THE SOFTWARE (AND WHICH IS DUPLICATED IN THE LICENSE FILE) OR IF THERE IS NO SUCH SOFTWARE LICENSE AGREEMENT OR CLICKWRAP END USER LICENSE AGREEMENT, THE LICENSE(S) LOCATED IN THE “LICENSE” FILE(S) OF THE SOFTWARE. USE OF THIS DOCUMENT IS SUBJECT TO THOSE TERMS AND CONDITIONS, AND YOUR USE HEREOF SHALL CONSTITUTE ACCEPTANCE OF AND AN AGREEMENT TO BE BOUND BY THE SAME.This document contains confidential information that is subject to U.S. and international copyright laws and treaties. No part of this document may be reproduced in any form without the written authorization of TIBCO Software Inc.TIBCO, Two-Second Advantage, and LogLogic are either registered trademarks or trademarks of TIBCO Software Inc. in the United States and/or other countries.All other product and company names and marks mentioned in this document are the property of their respective owners and are mentioned for identification purposes only.THIS SOFTWARE MAY BE AVAILABLE ON MULTIPLE OPERATING SYSTEMS. HOWEVER, NOT ALL OPERATING SYSTEM PLATFORMS FOR A SPECIFIC SOFTWARE VERSION ARE RELEASED AT THE SAME TIME. SEE THE README FILE FOR THE AVAILABILITY OF THIS SOFTWARE VERSION ON A SPECIFIC OPERATING SYSTEM PLATFORM.THIS DOCUMENT IS PROVIDED “AS IS” WITHOUT WARRANTY OF ANY KIND, EITHER EXPRESS OR IMPLIED, INCLUDING, BUT NOT LIMITED TO, THE IMPLIED WARRANTIES OF MERCHANTABILITY, FITNESS FOR A PARTICULAR PURPOSE, OR NON-INFRINGEMENT.THIS DOCUMENT COULD INCLUDE TECHNICAL INACCURACIES OR TYPOGRAPHICAL ERRORS. CHANGES ARE PERIODICALLY ADDED TO THE INFORMATION HEREIN; THESE CHANGES WILL BE INCORPORATED IN NEW EDITIONS OF THIS DOCUMENT. TIBCO SOFTWARE INC. MAY MAKE IMPROVEMENTS AND/OR CHANGES IN THE PRODUCT(S) AND/OR THE PROGRAM(S) DESCRIBED IN THIS DOCUMENT AT ANY TIME.THE CONTENTS OF THIS DOCUMENT MAY BE MODIFIED AND/OR QUALIFIED, DIRECTLY OR INDIRECTLY, BY OTHER DOCUMENTATION WHICH ACCOMPANIES THIS SOFTWARE, INCLUDING BUT NOT LIMITED TO ANY RELEASE NOTES AND "READ ME" FILES.Copyright © 2002-2017 TIBCO Software Inc. All rights reserved.TIBCO Software Inc. Confidential Information
| iii
Contents
Preface . . . . . . . . . . . . . . . . . . . . . . . . . . . . . . . . . . . . . . . . . . . . . . . . . . . . . . . . . . . . . . . . . . . . . . . . ix
Related Documents . . . . . . . . . . . . . . . . . . . . . . . . . . . . . . . . . . . . . . . . . . . . . . . . . . . . . . . . . . . . . . . . . . . . . . . . . x
Typographical Conventions . . . . . . . . . . . . . . . . . . . . . . . . . . . . . . . . . . . . . . . . . . . . . . . . . . . . . . . . . . . . . . . . . . xii
Connecting with TIBCO Resources . . . . . . . . . . . . . . . . . . . . . . . . . . . . . . . . . . . . . . . . . . . . . . . . . . . . . . . . . . . .xivHow to Join TIBCO Community . . . . . . . . . . . . . . . . . . . . . . . . . . . . . . . . . . . . . . . . . . . . . . . . . . . . . . . . . . .xivHow to Access TIBCO Documentation. . . . . . . . . . . . . . . . . . . . . . . . . . . . . . . . . . . . . . . . . . . . . . . . . . . . . .xivHow to Contact TIBCO Support . . . . . . . . . . . . . . . . . . . . . . . . . . . . . . . . . . . . . . . . . . . . . . . . . . . . . . . . . . .xiv
Chapter 1 Using LogLogic Appliances . . . . . . . . . . . . . . . . . . . . . . . . . . . . . . . . . . . . . . . . . . . . . .1
LogLogic Appliance Overview . . . . . . . . . . . . . . . . . . . . . . . . . . . . . . . . . . . . . . . . . . . . . . . . . . . . . . . . . . . . . . . . . 2
Appliance User Functions . . . . . . . . . . . . . . . . . . . . . . . . . . . . . . . . . . . . . . . . . . . . . . . . . . . . . . . . . . . . . . . . . . . . 3
LogLogic Product Families. . . . . . . . . . . . . . . . . . . . . . . . . . . . . . . . . . . . . . . . . . . . . . . . . . . . . . . . . . . . . . . . . . . . 5LogLogic LX Product Family. . . . . . . . . . . . . . . . . . . . . . . . . . . . . . . . . . . . . . . . . . . . . . . . . . . . . . . . . . . . . . . 5LogLogic MX Product Family . . . . . . . . . . . . . . . . . . . . . . . . . . . . . . . . . . . . . . . . . . . . . . . . . . . . . . . . . . . . . . 6LogLogic ST Product Family. . . . . . . . . . . . . . . . . . . . . . . . . . . . . . . . . . . . . . . . . . . . . . . . . . . . . . . . . . . . . . . 6Scalable Infrastructure . . . . . . . . . . . . . . . . . . . . . . . . . . . . . . . . . . . . . . . . . . . . . . . . . . . . . . . . . . . . . . . . . . . 7
Chapter 2 Viewing Dashboards . . . . . . . . . . . . . . . . . . . . . . . . . . . . . . . . . . . . . . . . . . . . . . . . . . . .9
Viewing System Status . . . . . . . . . . . . . . . . . . . . . . . . . . . . . . . . . . . . . . . . . . . . . . . . . . . . . . . . . . . . . . . . . . . . . 10
Viewing Multiple Systems Status (Management Station) . . . . . . . . . . . . . . . . . . . . . . . . . . . . . . . . . . . . . . . . . . . 15Viewing Message Rate . . . . . . . . . . . . . . . . . . . . . . . . . . . . . . . . . . . . . . . . . . . . . . . . . . . . . . . . . . . . . . . . . . 17Viewing CPU Usage . . . . . . . . . . . . . . . . . . . . . . . . . . . . . . . . . . . . . . . . . . . . . . . . . . . . . . . . . . . . . . . . . . . . 18
Viewing Log Source Status . . . . . . . . . . . . . . . . . . . . . . . . . . . . . . . . . . . . . . . . . . . . . . . . . . . . . . . . . . . . . . . . . . 20Viewing Unapproved Messages . . . . . . . . . . . . . . . . . . . . . . . . . . . . . . . . . . . . . . . . . . . . . . . . . . . . . . . . . . . 24Viewing Recent Messages . . . . . . . . . . . . . . . . . . . . . . . . . . . . . . . . . . . . . . . . . . . . . . . . . . . . . . . . . . . . . . . 24
Viewing Log Source Data Trend . . . . . . . . . . . . . . . . . . . . . . . . . . . . . . . . . . . . . . . . . . . . . . . . . . . . . . . . . . . . . . 26
Managing Your Dashboard . . . . . . . . . . . . . . . . . . . . . . . . . . . . . . . . . . . . . . . . . . . . . . . . . . . . . . . . . . . . . . . . . . 27Managing Widgets . . . . . . . . . . . . . . . . . . . . . . . . . . . . . . . . . . . . . . . . . . . . . . . . . . . . . . . . . . . . . . . . . . . . . 28Defining your Dashboard Canvas Settings . . . . . . . . . . . . . . . . . . . . . . . . . . . . . . . . . . . . . . . . . . . . . . . . . . . 39
Chapter 3 Viewing Real Time Log Messages . . . . . . . . . . . . . . . . . . . . . . . . . . . . . . . . . . . . . . . .41
Accessing and Selecting Real Time Messages to View . . . . . . . . . . . . . . . . . . . . . . . . . . . . . . . . . . . . . . . . . . . . 42
Viewing Log Messages in Real Time. . . . . . . . . . . . . . . . . . . . . . . . . . . . . . . . . . . . . . . . . . . . . . . . . . . . . . . . . . . 46
Java Security Settings . . . . . . . . . . . . . . . . . . . . . . . . . . . . . . . . . . . . . . . . . . . . . . . . . . . . . . . . . . . . . . . . . . . . . . 47
TIBCO LogLogic® Log Management Intelligence (LMI) User Guide
iv | Contents
Modifying your Java settings . . . . . . . . . . . . . . . . . . . . . . . . . . . . . . . . . . . . . . . . . . . . . . . . . . . . . . . . . . . . . 47
Chapter 4 Searching Collected Log Messages . . . . . . . . . . . . . . . . . . . . . . . . . . . . . . . . . . . . . . 49
Search Overview. . . . . . . . . . . . . . . . . . . . . . . . . . . . . . . . . . . . . . . . . . . . . . . . . . . . . . . . . . . . . . . . . . . . . . . . . . 50
Using Index Search. . . . . . . . . . . . . . . . . . . . . . . . . . . . . . . . . . . . . . . . . . . . . . . . . . . . . . . . . . . . . . . . . . . . . . . . 52Search Expression Rules. . . . . . . . . . . . . . . . . . . . . . . . . . . . . . . . . . . . . . . . . . . . . . . . . . . . . . . . . . . . . . . . 52Running an Index Search . . . . . . . . . . . . . . . . . . . . . . . . . . . . . . . . . . . . . . . . . . . . . . . . . . . . . . . . . . . . . . . 53Using the Search Results Tab . . . . . . . . . . . . . . . . . . . . . . . . . . . . . . . . . . . . . . . . . . . . . . . . . . . . . . . . . . . . 56Using the Search History Tab . . . . . . . . . . . . . . . . . . . . . . . . . . . . . . . . . . . . . . . . . . . . . . . . . . . . . . . . . . . . 64Using the Search Filters Tab . . . . . . . . . . . . . . . . . . . . . . . . . . . . . . . . . . . . . . . . . . . . . . . . . . . . . . . . . . . . . 66Using the Clipboard Tab. . . . . . . . . . . . . . . . . . . . . . . . . . . . . . . . . . . . . . . . . . . . . . . . . . . . . . . . . . . . . . . . . 66
Tag-Based Searches Using the Tag Picker Interface . . . . . . . . . . . . . . . . . . . . . . . . . . . . . . . . . . . . . . . . . . . . . . 69
Using Regular Expression Search . . . . . . . . . . . . . . . . . . . . . . . . . . . . . . . . . . . . . . . . . . . . . . . . . . . . . . . . . . . . 70Using Distributed Regular Expression Search. . . . . . . . . . . . . . . . . . . . . . . . . . . . . . . . . . . . . . . . . . . . . . . . 72Viewing Pending and Running Searches. . . . . . . . . . . . . . . . . . . . . . . . . . . . . . . . . . . . . . . . . . . . . . . . . . . . 74Viewing RegEx Search Results . . . . . . . . . . . . . . . . . . . . . . . . . . . . . . . . . . . . . . . . . . . . . . . . . . . . . . . . . . . 76
Using Search Filters . . . . . . . . . . . . . . . . . . . . . . . . . . . . . . . . . . . . . . . . . . . . . . . . . . . . . . . . . . . . . . . . . . . . . . . 77Adding a Search Filter . . . . . . . . . . . . . . . . . . . . . . . . . . . . . . . . . . . . . . . . . . . . . . . . . . . . . . . . . . . . . . . . . . 77Search Filter Options . . . . . . . . . . . . . . . . . . . . . . . . . . . . . . . . . . . . . . . . . . . . . . . . . . . . . . . . . . . . . . . . . . . 79Putting Your Logins Search Filter to Work . . . . . . . . . . . . . . . . . . . . . . . . . . . . . . . . . . . . . . . . . . . . . . . . . . . 81Adding Additional Parameters to a Pre-Defined Regular Expression Search Filter. . . . . . . . . . . . . . . . . . . . 82Modifying a Search Filter . . . . . . . . . . . . . . . . . . . . . . . . . . . . . . . . . . . . . . . . . . . . . . . . . . . . . . . . . . . . . . . . 84
Viewing All Saved Index Searches . . . . . . . . . . . . . . . . . . . . . . . . . . . . . . . . . . . . . . . . . . . . . . . . . . . . . . . . . . . . 86
Using and Creating All Index Reports. . . . . . . . . . . . . . . . . . . . . . . . . . . . . . . . . . . . . . . . . . . . . . . . . . . . . . . . . . 87
Chapter 5 Creating and Managing Alerts . . . . . . . . . . . . . . . . . . . . . . . . . . . . . . . . . . . . . . . . . . . 89
Viewing and Handling Alerts . . . . . . . . . . . . . . . . . . . . . . . . . . . . . . . . . . . . . . . . . . . . . . . . . . . . . . . . . . . . . . . . . 90
Manage Alert Templates . . . . . . . . . . . . . . . . . . . . . . . . . . . . . . . . . . . . . . . . . . . . . . . . . . . . . . . . . . . . . . . . . . . . 93Adding a New Alert Template Format . . . . . . . . . . . . . . . . . . . . . . . . . . . . . . . . . . . . . . . . . . . . . . . . . . . . . . 93Viewing and Modifying an Alert Template . . . . . . . . . . . . . . . . . . . . . . . . . . . . . . . . . . . . . . . . . . . . . . . . . . . 97Removing an Alert Template . . . . . . . . . . . . . . . . . . . . . . . . . . . . . . . . . . . . . . . . . . . . . . . . . . . . . . . . . . . . . 98
Managing Alert Rules . . . . . . . . . . . . . . . . . . . . . . . . . . . . . . . . . . . . . . . . . . . . . . . . . . . . . . . . . . . . . . . . . . . . . . 99Preconfigured System Alerts . . . . . . . . . . . . . . . . . . . . . . . . . . . . . . . . . . . . . . . . . . . . . . . . . . . . . . . . . . . . . 99Adding a New Alert Rule . . . . . . . . . . . . . . . . . . . . . . . . . . . . . . . . . . . . . . . . . . . . . . . . . . . . . . . . . . . . . . . 101Parsed Data Alerts. . . . . . . . . . . . . . . . . . . . . . . . . . . . . . . . . . . . . . . . . . . . . . . . . . . . . . . . . . . . . . . . . . . . 106Modifying or Removing An Alert . . . . . . . . . . . . . . . . . . . . . . . . . . . . . . . . . . . . . . . . . . . . . . . . . . . . . . . . . 107
Chapter 6 Generating Real-Time Reports . . . . . . . . . . . . . . . . . . . . . . . . . . . . . . . . . . . . . . . . . 109
Preparing a Real-Time Report . . . . . . . . . . . . . . . . . . . . . . . . . . . . . . . . . . . . . . . . . . . . . . . . . . . . . . . . . . . . . . 110Generating a Report: An Example. . . . . . . . . . . . . . . . . . . . . . . . . . . . . . . . . . . . . . . . . . . . . . . . . . . . . . . . 114Available Operators . . . . . . . . . . . . . . . . . . . . . . . . . . . . . . . . . . . . . . . . . . . . . . . . . . . . . . . . . . . . . . . . . . . 116
TIBCO LogLogic® Log Management Intelligence (LMI) User Guide
Contents | v
Access Control Reports . . . . . . . . . . . . . . . . . . . . . . . . . . . . . . . . . . . . . . . . . . . . . . . . . . . . . . . . . . . . . . . . . . . . 119Permission Modification Reports . . . . . . . . . . . . . . . . . . . . . . . . . . . . . . . . . . . . . . . . . . . . . . . . . . . . . . . . . 120User Access Reports . . . . . . . . . . . . . . . . . . . . . . . . . . . . . . . . . . . . . . . . . . . . . . . . . . . . . . . . . . . . . . . . . . 121User Authentication Reports. . . . . . . . . . . . . . . . . . . . . . . . . . . . . . . . . . . . . . . . . . . . . . . . . . . . . . . . . . . . . 122User Created/Deleted Reports . . . . . . . . . . . . . . . . . . . . . . . . . . . . . . . . . . . . . . . . . . . . . . . . . . . . . . . . . . . 123User Last Activity Reports . . . . . . . . . . . . . . . . . . . . . . . . . . . . . . . . . . . . . . . . . . . . . . . . . . . . . . . . . . . . . . 124Windows Events Reports . . . . . . . . . . . . . . . . . . . . . . . . . . . . . . . . . . . . . . . . . . . . . . . . . . . . . . . . . . . . . . . 126
Database Activity Reports . . . . . . . . . . . . . . . . . . . . . . . . . . . . . . . . . . . . . . . . . . . . . . . . . . . . . . . . . . . . . . . . . . 128All Database Events Reports . . . . . . . . . . . . . . . . . . . . . . . . . . . . . . . . . . . . . . . . . . . . . . . . . . . . . . . . . . . . 129Database Access Report . . . . . . . . . . . . . . . . . . . . . . . . . . . . . . . . . . . . . . . . . . . . . . . . . . . . . . . . . . . . . . . 130Database Data Access Report . . . . . . . . . . . . . . . . . . . . . . . . . . . . . . . . . . . . . . . . . . . . . . . . . . . . . . . . . . . 131Database Privilege Modifications Report . . . . . . . . . . . . . . . . . . . . . . . . . . . . . . . . . . . . . . . . . . . . . . . . . . . 132Database System Modifications Report . . . . . . . . . . . . . . . . . . . . . . . . . . . . . . . . . . . . . . . . . . . . . . . . . . . . 133
IBM i5/OS Activity Reports . . . . . . . . . . . . . . . . . . . . . . . . . . . . . . . . . . . . . . . . . . . . . . . . . . . . . . . . . . . . . . . . . 134All Log Entry Types Reports . . . . . . . . . . . . . . . . . . . . . . . . . . . . . . . . . . . . . . . . . . . . . . . . . . . . . . . . . . . . . 135System Object Access Reports . . . . . . . . . . . . . . . . . . . . . . . . . . . . . . . . . . . . . . . . . . . . . . . . . . . . . . . . . . 137User Access By Connection Reports . . . . . . . . . . . . . . . . . . . . . . . . . . . . . . . . . . . . . . . . . . . . . . . . . . . . . . 140User Actions Reports . . . . . . . . . . . . . . . . . . . . . . . . . . . . . . . . . . . . . . . . . . . . . . . . . . . . . . . . . . . . . . . . . . 142User Jobs Reports . . . . . . . . . . . . . . . . . . . . . . . . . . . . . . . . . . . . . . . . . . . . . . . . . . . . . . . . . . . . . . . . . . . . 145
Threat Management Reports. . . . . . . . . . . . . . . . . . . . . . . . . . . . . . . . . . . . . . . . . . . . . . . . . . . . . . . . . . . . . . . . 148IDS/IPS Activity Reports. . . . . . . . . . . . . . . . . . . . . . . . . . . . . . . . . . . . . . . . . . . . . . . . . . . . . . . . . . . . . . . . 149Threat Activity Reports . . . . . . . . . . . . . . . . . . . . . . . . . . . . . . . . . . . . . . . . . . . . . . . . . . . . . . . . . . . . . . . . . 150Configuration Activity Reports . . . . . . . . . . . . . . . . . . . . . . . . . . . . . . . . . . . . . . . . . . . . . . . . . . . . . . . . . . . 151Scan Activity Reports . . . . . . . . . . . . . . . . . . . . . . . . . . . . . . . . . . . . . . . . . . . . . . . . . . . . . . . . . . . . . . . . . . 153Security Summary Reports . . . . . . . . . . . . . . . . . . . . . . . . . . . . . . . . . . . . . . . . . . . . . . . . . . . . . . . . . . . . . 154DB IPS Activity Reports . . . . . . . . . . . . . . . . . . . . . . . . . . . . . . . . . . . . . . . . . . . . . . . . . . . . . . . . . . . . . . . . 155HIPS Activity Reports . . . . . . . . . . . . . . . . . . . . . . . . . . . . . . . . . . . . . . . . . . . . . . . . . . . . . . . . . . . . . . . . . . 156
Mail Activity Reports . . . . . . . . . . . . . . . . . . . . . . . . . . . . . . . . . . . . . . . . . . . . . . . . . . . . . . . . . . . . . . . . . . . . . . 158Exchange 2000/03 SMTP Reports . . . . . . . . . . . . . . . . . . . . . . . . . . . . . . . . . . . . . . . . . . . . . . . . . . . . . . . . 159Exchange 2000/03 Activity Reports . . . . . . . . . . . . . . . . . . . . . . . . . . . . . . . . . . . . . . . . . . . . . . . . . . . . . . . 160Exchange 2000/03 Delay Reports . . . . . . . . . . . . . . . . . . . . . . . . . . . . . . . . . . . . . . . . . . . . . . . . . . . . . . . . 161Exchange 2000/03 Size Reports . . . . . . . . . . . . . . . . . . . . . . . . . . . . . . . . . . . . . . . . . . . . . . . . . . . . . . . . . 162Server Activity Reports . . . . . . . . . . . . . . . . . . . . . . . . . . . . . . . . . . . . . . . . . . . . . . . . . . . . . . . . . . . . . . . . . 163Exchange 2007/10 Activity Reports . . . . . . . . . . . . . . . . . . . . . . . . . . . . . . . . . . . . . . . . . . . . . . . . . . . . . . . 163Exchange 2007/10 Mail Size Reports . . . . . . . . . . . . . . . . . . . . . . . . . . . . . . . . . . . . . . . . . . . . . . . . . . . . . 164
Network Activity Reports . . . . . . . . . . . . . . . . . . . . . . . . . . . . . . . . . . . . . . . . . . . . . . . . . . . . . . . . . . . . . . . . . . . 166Accepted Connections Reports . . . . . . . . . . . . . . . . . . . . . . . . . . . . . . . . . . . . . . . . . . . . . . . . . . . . . . . . . . 168Active FW Connections Reports. . . . . . . . . . . . . . . . . . . . . . . . . . . . . . . . . . . . . . . . . . . . . . . . . . . . . . . . . . 169Active VPN Connections Reports. . . . . . . . . . . . . . . . . . . . . . . . . . . . . . . . . . . . . . . . . . . . . . . . . . . . . . . . . 170Application Distribution Reports . . . . . . . . . . . . . . . . . . . . . . . . . . . . . . . . . . . . . . . . . . . . . . . . . . . . . . . . . . 171Denied Connections Reports . . . . . . . . . . . . . . . . . . . . . . . . . . . . . . . . . . . . . . . . . . . . . . . . . . . . . . . . . . . . 172FTP Connections Reports . . . . . . . . . . . . . . . . . . . . . . . . . . . . . . . . . . . . . . . . . . . . . . . . . . . . . . . . . . . . . . 174VPN Access Reports . . . . . . . . . . . . . . . . . . . . . . . . . . . . . . . . . . . . . . . . . . . . . . . . . . . . . . . . . . . . . . . . . . 175VPN Sessions Reports . . . . . . . . . . . . . . . . . . . . . . . . . . . . . . . . . . . . . . . . . . . . . . . . . . . . . . . . . . . . . . . . . 176
TIBCO LogLogic® Log Management Intelligence (LMI) User Guide
vi | Contents
VPN Top Lists Reports. . . . . . . . . . . . . . . . . . . . . . . . . . . . . . . . . . . . . . . . . . . . . . . . . . . . . . . . . . . . . . . . . 177Web Cache Activity Reports . . . . . . . . . . . . . . . . . . . . . . . . . . . . . . . . . . . . . . . . . . . . . . . . . . . . . . . . . . . . 178Web Surfing Activity Report . . . . . . . . . . . . . . . . . . . . . . . . . . . . . . . . . . . . . . . . . . . . . . . . . . . . . . . . . . . . . 179DHCP Activity Report . . . . . . . . . . . . . . . . . . . . . . . . . . . . . . . . . . . . . . . . . . . . . . . . . . . . . . . . . . . . . . . . . 180DHCP Granted/Renewed Activity Report . . . . . . . . . . . . . . . . . . . . . . . . . . . . . . . . . . . . . . . . . . . . . . . . . . 181DHCP Denied Activity Report . . . . . . . . . . . . . . . . . . . . . . . . . . . . . . . . . . . . . . . . . . . . . . . . . . . . . . . . . . . 182NAT64 Activity Report . . . . . . . . . . . . . . . . . . . . . . . . . . . . . . . . . . . . . . . . . . . . . . . . . . . . . . . . . . . . . . . . . 183
Operational Reports . . . . . . . . . . . . . . . . . . . . . . . . . . . . . . . . . . . . . . . . . . . . . . . . . . . . . . . . . . . . . . . . . . . . . . 185All Unparsed Events Reports. . . . . . . . . . . . . . . . . . . . . . . . . . . . . . . . . . . . . . . . . . . . . . . . . . . . . . . . . . . . 186Firewall Statistics Reports . . . . . . . . . . . . . . . . . . . . . . . . . . . . . . . . . . . . . . . . . . . . . . . . . . . . . . . . . . . . . . 186Total Message Count Reports . . . . . . . . . . . . . . . . . . . . . . . . . . . . . . . . . . . . . . . . . . . . . . . . . . . . . . . . . . . 187Security Events Reports . . . . . . . . . . . . . . . . . . . . . . . . . . . . . . . . . . . . . . . . . . . . . . . . . . . . . . . . . . . . . . . 188System Events Reports . . . . . . . . . . . . . . . . . . . . . . . . . . . . . . . . . . . . . . . . . . . . . . . . . . . . . . . . . . . . . . . . 189VPN Events Reports . . . . . . . . . . . . . . . . . . . . . . . . . . . . . . . . . . . . . . . . . . . . . . . . . . . . . . . . . . . . . . . . . . 190
Policy Reports . . . . . . . . . . . . . . . . . . . . . . . . . . . . . . . . . . . . . . . . . . . . . . . . . . . . . . . . . . . . . . . . . . . . . . . . . . . 192Check Point Policies Reports. . . . . . . . . . . . . . . . . . . . . . . . . . . . . . . . . . . . . . . . . . . . . . . . . . . . . . . . . . . . 193Network Policies Reports. . . . . . . . . . . . . . . . . . . . . . . . . . . . . . . . . . . . . . . . . . . . . . . . . . . . . . . . . . . . . . . 193Rules/Policies Reports. . . . . . . . . . . . . . . . . . . . . . . . . . . . . . . . . . . . . . . . . . . . . . . . . . . . . . . . . . . . . . . . . 194ECM Policy Reports. . . . . . . . . . . . . . . . . . . . . . . . . . . . . . . . . . . . . . . . . . . . . . . . . . . . . . . . . . . . . . . . . . . 195
Enterprise Content Management . . . . . . . . . . . . . . . . . . . . . . . . . . . . . . . . . . . . . . . . . . . . . . . . . . . . . . . . . . . . 197ECM Activity Reports. . . . . . . . . . . . . . . . . . . . . . . . . . . . . . . . . . . . . . . . . . . . . . . . . . . . . . . . . . . . . . . . . . 198Content Management Reports. . . . . . . . . . . . . . . . . . . . . . . . . . . . . . . . . . . . . . . . . . . . . . . . . . . . . . . . . . . 199Security Settings Reports . . . . . . . . . . . . . . . . . . . . . . . . . . . . . . . . . . . . . . . . . . . . . . . . . . . . . . . . . . . . . . 199Expiration and Disposition Reports . . . . . . . . . . . . . . . . . . . . . . . . . . . . . . . . . . . . . . . . . . . . . . . . . . . . . . . 200
HP NonStop Audit . . . . . . . . . . . . . . . . . . . . . . . . . . . . . . . . . . . . . . . . . . . . . . . . . . . . . . . . . . . . . . . . . . . . . . . . 202Configuration Changes Reports . . . . . . . . . . . . . . . . . . . . . . . . . . . . . . . . . . . . . . . . . . . . . . . . . . . . . . . . . 203Failed and Successful Logins Reports. . . . . . . . . . . . . . . . . . . . . . . . . . . . . . . . . . . . . . . . . . . . . . . . . . . . . 204Object Changes Reports . . . . . . . . . . . . . . . . . . . . . . . . . . . . . . . . . . . . . . . . . . . . . . . . . . . . . . . . . . . . . . . 205HP NonStop Audit Activity Reports . . . . . . . . . . . . . . . . . . . . . . . . . . . . . . . . . . . . . . . . . . . . . . . . . . . . . . . 206User Actions Reports. . . . . . . . . . . . . . . . . . . . . . . . . . . . . . . . . . . . . . . . . . . . . . . . . . . . . . . . . . . . . . . . . . 207Object Access Reports . . . . . . . . . . . . . . . . . . . . . . . . . . . . . . . . . . . . . . . . . . . . . . . . . . . . . . . . . . . . . . . . 208
IBM z/OS Activity . . . . . . . . . . . . . . . . . . . . . . . . . . . . . . . . . . . . . . . . . . . . . . . . . . . . . . . . . . . . . . . . . . . . . . . . 209Resource Access Reports . . . . . . . . . . . . . . . . . . . . . . . . . . . . . . . . . . . . . . . . . . . . . . . . . . . . . . . . . . . . . . 210Security Modifications Reports . . . . . . . . . . . . . . . . . . . . . . . . . . . . . . . . . . . . . . . . . . . . . . . . . . . . . . . . . . 211System Access/Configuration Reports . . . . . . . . . . . . . . . . . . . . . . . . . . . . . . . . . . . . . . . . . . . . . . . . . . . . 212Unix System Services Reports . . . . . . . . . . . . . . . . . . . . . . . . . . . . . . . . . . . . . . . . . . . . . . . . . . . . . . . . . . 212Login/Logout Reports . . . . . . . . . . . . . . . . . . . . . . . . . . . . . . . . . . . . . . . . . . . . . . . . . . . . . . . . . . . . . . . . . 213Violation Reports . . . . . . . . . . . . . . . . . . . . . . . . . . . . . . . . . . . . . . . . . . . . . . . . . . . . . . . . . . . . . . . . . . . . . 214
Storage Systems Activity . . . . . . . . . . . . . . . . . . . . . . . . . . . . . . . . . . . . . . . . . . . . . . . . . . . . . . . . . . . . . . . . . . 216Filer Access Reports . . . . . . . . . . . . . . . . . . . . . . . . . . . . . . . . . . . . . . . . . . . . . . . . . . . . . . . . . . . . . . . . . . 216
Flow Activity . . . . . . . . . . . . . . . . . . . . . . . . . . . . . . . . . . . . . . . . . . . . . . . . . . . . . . . . . . . . . . . . . . . . . . . . . . . . 218Application Usage Reports . . . . . . . . . . . . . . . . . . . . . . . . . . . . . . . . . . . . . . . . . . . . . . . . . . . . . . . . . . . . . 218User Browsing Reports . . . . . . . . . . . . . . . . . . . . . . . . . . . . . . . . . . . . . . . . . . . . . . . . . . . . . . . . . . . . . . . . 219
TIBCO LogLogic® Log Management Intelligence (LMI) User Guide
Contents | vii
Top Users Reports . . . . . . . . . . . . . . . . . . . . . . . . . . . . . . . . . . . . . . . . . . . . . . . . . . . . . . . . . . . . . . . . . . . . 220
All Saved Reports . . . . . . . . . . . . . . . . . . . . . . . . . . . . . . . . . . . . . . . . . . . . . . . . . . . . . . . . . . . . . . . . . . . . . . . . 222
Chapter 7 Setting User Preferences. . . . . . . . . . . . . . . . . . . . . . . . . . . . . . . . . . . . . . . . . . . . . . .223
Viewing Your LogApp Account . . . . . . . . . . . . . . . . . . . . . . . . . . . . . . . . . . . . . . . . . . . . . . . . . . . . . . . . . . . . . . . 224
Changing Login Landing Page. . . . . . . . . . . . . . . . . . . . . . . . . . . . . . . . . . . . . . . . . . . . . . . . . . . . . . . . . . . . . . . 225
Changing the Account Password . . . . . . . . . . . . . . . . . . . . . . . . . . . . . . . . . . . . . . . . . . . . . . . . . . . . . . . . . . . . . 226
Chapter 8 Advanced Features . . . . . . . . . . . . . . . . . . . . . . . . . . . . . . . . . . . . . . . . . . . . . . . . . . .227
Advanced Search Overview. . . . . . . . . . . . . . . . . . . . . . . . . . . . . . . . . . . . . . . . . . . . . . . . . . . . . . . . . . . . . . . . . 229Infrastructure Queries. . . . . . . . . . . . . . . . . . . . . . . . . . . . . . . . . . . . . . . . . . . . . . . . . . . . . . . . . . . . . . . . . . 230Using Content Assist . . . . . . . . . . . . . . . . . . . . . . . . . . . . . . . . . . . . . . . . . . . . . . . . . . . . . . . . . . . . . . . . . . 231Using the Search Field . . . . . . . . . . . . . . . . . . . . . . . . . . . . . . . . . . . . . . . . . . . . . . . . . . . . . . . . . . . . . . . . . 232Using the Time Field. . . . . . . . . . . . . . . . . . . . . . . . . . . . . . . . . . . . . . . . . . . . . . . . . . . . . . . . . . . . . . . . . . . 232Using Smart Lists . . . . . . . . . . . . . . . . . . . . . . . . . . . . . . . . . . . . . . . . . . . . . . . . . . . . . . . . . . . . . . . . . . . . . 233Using Monthly Index . . . . . . . . . . . . . . . . . . . . . . . . . . . . . . . . . . . . . . . . . . . . . . . . . . . . . . . . . . . . . . . . . . . 233
Search Results . . . . . . . . . . . . . . . . . . . . . . . . . . . . . . . . . . . . . . . . . . . . . . . . . . . . . . . . . . . . . . . . . . . . . . . . . . 234Charts . . . . . . . . . . . . . . . . . . . . . . . . . . . . . . . . . . . . . . . . . . . . . . . . . . . . . . . . . . . . . . . . . . . . . . . . . . . . . . 235Columns . . . . . . . . . . . . . . . . . . . . . . . . . . . . . . . . . . . . . . . . . . . . . . . . . . . . . . . . . . . . . . . . . . . . . . . . . . . . 237Data . . . . . . . . . . . . . . . . . . . . . . . . . . . . . . . . . . . . . . . . . . . . . . . . . . . . . . . . . . . . . . . . . . . . . . . . . . . . . . . 244
About Bloks . . . . . . . . . . . . . . . . . . . . . . . . . . . . . . . . . . . . . . . . . . . . . . . . . . . . . . . . . . . . . . . . . . . . . . . . . . . . . 254Filter Bloks . . . . . . . . . . . . . . . . . . . . . . . . . . . . . . . . . . . . . . . . . . . . . . . . . . . . . . . . . . . . . . . . . . . . . . . . . . 254Viewing All Bloks . . . . . . . . . . . . . . . . . . . . . . . . . . . . . . . . . . . . . . . . . . . . . . . . . . . . . . . . . . . . . . . . . . . . . 255Adding a Blok . . . . . . . . . . . . . . . . . . . . . . . . . . . . . . . . . . . . . . . . . . . . . . . . . . . . . . . . . . . . . . . . . . . . . . . . 255Modifying Bloks . . . . . . . . . . . . . . . . . . . . . . . . . . . . . . . . . . . . . . . . . . . . . . . . . . . . . . . . . . . . . . . . . . . . . . 256Deleting Bloks. . . . . . . . . . . . . . . . . . . . . . . . . . . . . . . . . . . . . . . . . . . . . . . . . . . . . . . . . . . . . . . . . . . . . . . . 256Time Bloks . . . . . . . . . . . . . . . . . . . . . . . . . . . . . . . . . . . . . . . . . . . . . . . . . . . . . . . . . . . . . . . . . . . . . . . . . . 257Manage Bloks. . . . . . . . . . . . . . . . . . . . . . . . . . . . . . . . . . . . . . . . . . . . . . . . . . . . . . . . . . . . . . . . . . . . . . . . 258
Manage Dashboard . . . . . . . . . . . . . . . . . . . . . . . . . . . . . . . . . . . . . . . . . . . . . . . . . . . . . . . . . . . . . . . . . . . . . . . 261Viewing Dashboards. . . . . . . . . . . . . . . . . . . . . . . . . . . . . . . . . . . . . . . . . . . . . . . . . . . . . . . . . . . . . . . . . . . 262Adding Widgets to a Dashboard. . . . . . . . . . . . . . . . . . . . . . . . . . . . . . . . . . . . . . . . . . . . . . . . . . . . . . . . . . 263Editing a Widget . . . . . . . . . . . . . . . . . . . . . . . . . . . . . . . . . . . . . . . . . . . . . . . . . . . . . . . . . . . . . . . . . . . . . . 274Deleting a Widget . . . . . . . . . . . . . . . . . . . . . . . . . . . . . . . . . . . . . . . . . . . . . . . . . . . . . . . . . . . . . . . . . . . . . 275Duplicating a Dashboard . . . . . . . . . . . . . . . . . . . . . . . . . . . . . . . . . . . . . . . . . . . . . . . . . . . . . . . . . . . . . . . 275Deleting a Dashboard. . . . . . . . . . . . . . . . . . . . . . . . . . . . . . . . . . . . . . . . . . . . . . . . . . . . . . . . . . . . . . . . . . 275
Managing Data Models . . . . . . . . . . . . . . . . . . . . . . . . . . . . . . . . . . . . . . . . . . . . . . . . . . . . . . . . . . . . . . . . . . . . 277Viewing Data Models . . . . . . . . . . . . . . . . . . . . . . . . . . . . . . . . . . . . . . . . . . . . . . . . . . . . . . . . . . . . . . . . . . 280Adding a Data Model in Graphical Mode . . . . . . . . . . . . . . . . . . . . . . . . . . . . . . . . . . . . . . . . . . . . . . . . . . . 281Adding a Data Model in Raw Mode . . . . . . . . . . . . . . . . . . . . . . . . . . . . . . . . . . . . . . . . . . . . . . . . . . . . . . . 292Enabling or Disabling Data Models. . . . . . . . . . . . . . . . . . . . . . . . . . . . . . . . . . . . . . . . . . . . . . . . . . . . . . . . 294Editing Data Models . . . . . . . . . . . . . . . . . . . . . . . . . . . . . . . . . . . . . . . . . . . . . . . . . . . . . . . . . . . . . . . . . . . 294Duplicating Data Models. . . . . . . . . . . . . . . . . . . . . . . . . . . . . . . . . . . . . . . . . . . . . . . . . . . . . . . . . . . . . . . . 295
TIBCO LogLogic® Log Management Intelligence (LMI) User Guide
viii | Contents
Deleting Data Models. . . . . . . . . . . . . . . . . . . . . . . . . . . . . . . . . . . . . . . . . . . . . . . . . . . . . . . . . . . . . . . . . . 295
Using the REST API . . . . . . . . . . . . . . . . . . . . . . . . . . . . . . . . . . . . . . . . . . . . . . . . . . . . . . . . . . . . . . . . . . . . . . 296Constructing REST Requests . . . . . . . . . . . . . . . . . . . . . . . . . . . . . . . . . . . . . . . . . . . . . . . . . . . . . . . . . . . 296REST API Endpoint ( baseurl ) . . . . . . . . . . . . . . . . . . . . . . . . . . . . . . . . . . . . . . . . . . . . . . . . . . . . . . . . . . 297Response Status Codes . . . . . . . . . . . . . . . . . . . . . . . . . . . . . . . . . . . . . . . . . . . . . . . . . . . . . . . . . . . . . . . 297
REST API Support for Advanced Search . . . . . . . . . . . . . . . . . . . . . . . . . . . . . . . . . . . . . . . . . . . . . . . . . . . . . . 299Creating a Query . . . . . . . . . . . . . . . . . . . . . . . . . . . . . . . . . . . . . . . . . . . . . . . . . . . . . . . . . . . . . . . . . . . . . 299Retrieving Results . . . . . . . . . . . . . . . . . . . . . . . . . . . . . . . . . . . . . . . . . . . . . . . . . . . . . . . . . . . . . . . . . . . . 300Deleting a Query . . . . . . . . . . . . . . . . . . . . . . . . . . . . . . . . . . . . . . . . . . . . . . . . . . . . . . . . . . . . . . . . . . . . . 301Creating Sub-Queries . . . . . . . . . . . . . . . . . . . . . . . . . . . . . . . . . . . . . . . . . . . . . . . . . . . . . . . . . . . . . . . . . 301
Appendix A Syslog Host Field Character Sets . . . . . . . . . . . . . . . . . . . . . . . . . . . . . . . . . . . . . 303
Syslog Header Character Sets . . . . . . . . . . . . . . . . . . . . . . . . . . . . . . . . . . . . . . . . . . . . . . . . . . . . . . . . . . . . . . 304
Exceptions . . . . . . . . . . . . . . . . . . . . . . . . . . . . . . . . . . . . . . . . . . . . . . . . . . . . . . . . . . . . . . . . . . . . . . . . . . . . . 305
Appendix B Supported Regular Expression Characters . . . . . . . . . . . . . . . . . . . . . . . . . . . . . 307
Appendix C Search Syntax Reference . . . . . . . . . . . . . . . . . . . . . . . . . . . . . . . . . . . . . . . . . . . . 309
Event Query Language Reference . . . . . . . . . . . . . . . . . . . . . . . . . . . . . . . . . . . . . . . . . . . . . . . . . . . . . . . . . . . 310USE Statement . . . . . . . . . . . . . . . . . . . . . . . . . . . . . . . . . . . . . . . . . . . . . . . . . . . . . . . . . . . . . . . . . . . . . . 312FILTER Statement . . . . . . . . . . . . . . . . . . . . . . . . . . . . . . . . . . . . . . . . . . . . . . . . . . . . . . . . . . . . . . . . . . . . 314Predefined Functions. . . . . . . . . . . . . . . . . . . . . . . . . . . . . . . . . . . . . . . . . . . . . . . . . . . . . . . . . . . . . . . . . . 320COLUMNS Statement . . . . . . . . . . . . . . . . . . . . . . . . . . . . . . . . . . . . . . . . . . . . . . . . . . . . . . . . . . . . . . . . . 327GROUP BY Statement. . . . . . . . . . . . . . . . . . . . . . . . . . . . . . . . . . . . . . . . . . . . . . . . . . . . . . . . . . . . . . . . . 328SORT BY Statement . . . . . . . . . . . . . . . . . . . . . . . . . . . . . . . . . . . . . . . . . . . . . . . . . . . . . . . . . . . . . . . . . . 330LIMIT Statement . . . . . . . . . . . . . . . . . . . . . . . . . . . . . . . . . . . . . . . . . . . . . . . . . . . . . . . . . . . . . . . . . . . . . 331Optimizing Queries for Performance . . . . . . . . . . . . . . . . . . . . . . . . . . . . . . . . . . . . . . . . . . . . . . . . . . . . . . 331Text Search . . . . . . . . . . . . . . . . . . . . . . . . . . . . . . . . . . . . . . . . . . . . . . . . . . . . . . . . . . . . . . . . . . . . . . . . . 332Search Examples. . . . . . . . . . . . . . . . . . . . . . . . . . . . . . . . . . . . . . . . . . . . . . . . . . . . . . . . . . . . . . . . . . . . . 333
TIBCO LogLogic® Log Management Intelligence (LMI) User Guide
| ix
Preface
This guide is an operational guide for LogLogic appliances. It covers topics related to managing dashboards, reports, alerts, and performing searches to manage and use the log data collected and aggregated from all types of source systems in your enterprise.
Topics
• Related Documents on page x
• Typographical Conventions on page xii
• Connecting with TIBCO Resources on page xiv
TIBCO LogLogic® Log Management Intelligence (LMI) User Guide
x | Related Documents
Related Documents
The TIBCO LogLogic® documentation is available on the TIBCO LogLogic® documentation page.
The following documents contain information about the LogLogic appliances:
• TIBCO LogLogic® Log Management Intelligence (LMI) Release Notes — Provides information specific to the release including product information, new features and functionality, resolved issues, and known issues. Check the TIBCO Product Support site for notifications and product information that was not available at release time.
• TIBCO LogLogic® Log Management Intelligence (LMI) Hardware Installation Guide — Describes how to get started with your LogLogic Appliance. In addition, the guide includes details about the Appliance hardware for all models.
• TIBCO LogLogic® Log Management Intelligence (LMI) Configuration and Upgrade Guide — Describes how to install and upgrade the LogLogic Appliance software.
• TIBCO LogLogic® Log Management Intelligence (LMI) User Guide — Describes how to use the LogLogic solution, viewing dashboard, managing reports, managing alerts, and performing searches.
• TIBCO LogLogic® Log Management Intelligence (LMI) Administration Guide — Describes how to administer the LogLogic solution including all Management and Administration menu options.
• TIBCO LogLogic® Log Source Packages Configuration Guides — Describe how to support log data from various log sources. There is a separate manual for each supported log source. These documents include documentation on LogLogic Collectors as well as documentation on how to configure log sources to work with the LogLogic solution.
• TIBCO LogLogic® Log Source Packages Collector Guides — Describe how to implement support for using a LogLogic Collector for specific log sources such as IBM i5/OS and ISS Site Protector.
• TIBCO LogLogic® Log Management Intelligence (LMI) Web Services API Implementation Guide — Describes how to implement the LogLogic Web Services APIs to manage reports, manage alerts, perform searches, and administrate the system.
• TIBCO LogLogic® Log Management Intelligence (LMI) Syslog Alert Message Format Quick Reference Guide — Describes the LogLogic Syslog alert message format.
TIBCO LogLogic® Log Management Intelligence (LMI) User Guide
Preface | xi
• TIBCO LogLogic® Log Management Intelligence (LMI) Enterprise Virtual Appliance Quick Start Guide— Provides instructions on how to quickly set up the TIBCO Enterprise Virtual Appliance.
• TIBCO LogLogic® Log Management Intelligence (LMI) Log Source Report Mapping Guide — Provides a set of tables listing Log Source Reports by Device Type, sorted by UI Category.
• TIBCO LogLogic® Log Management Intelligence (LMI) XML Import/Export Entities Reference Guide—Describes how to manually import, export, and edit XML files into and from the appliance when not using the appliance UI.
TIBCO LogLogic® Log Management Intelligence (LMI) User Guide
xii | Typographical Conventions
Typographical Conventions
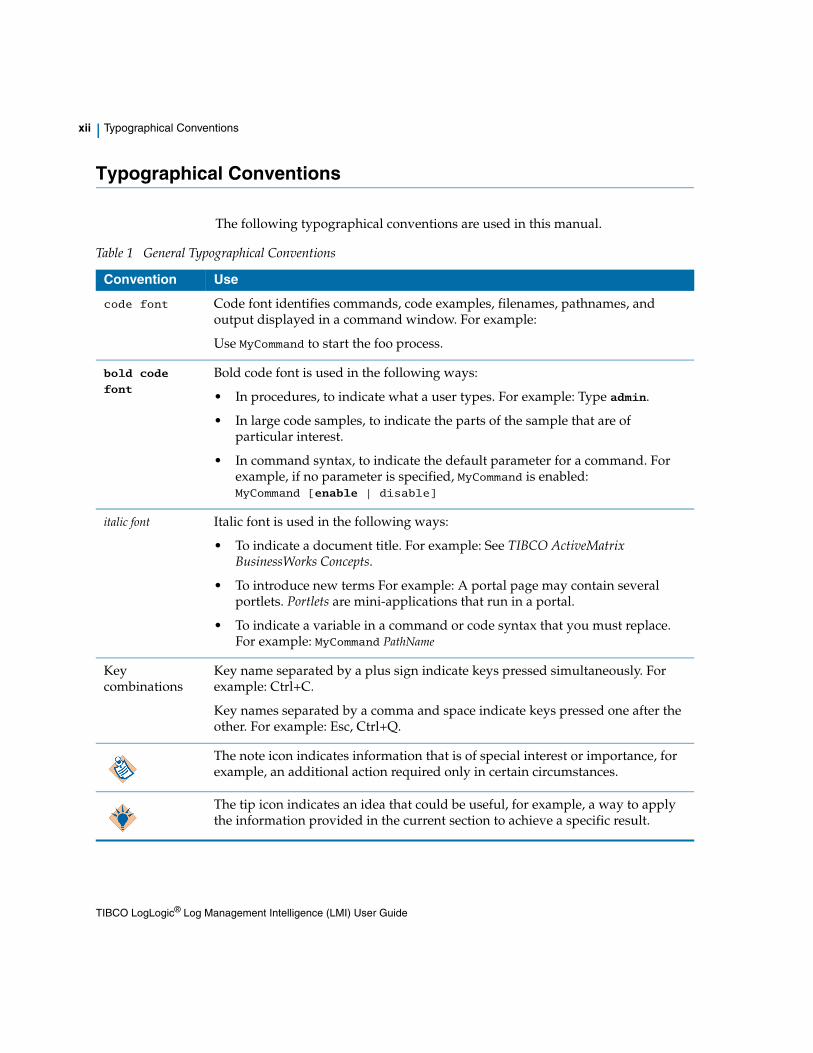
The following typographical conventions are used in this manual.
Table 1 General Typographical Conventions
Convention Use
code font Code font identifies commands, code examples, filenames, pathnames, and output displayed in a command window. For example:
Use MyCommand to start the foo process.
bold code
font Bold code font is used in the following ways:
• In procedures, to indicate what a user types. For example: Type admin.
• In large code samples, to indicate the parts of the sample that are of particular interest.
• In command syntax, to indicate the default parameter for a command. For example, if no parameter is specified, MyCommand is enabled: MyCommand [enable | disable]
italic font Italic font is used in the following ways:
• To indicate a document title. For example: See TIBCO ActiveMatrix BusinessWorks Concepts.
• To introduce new terms For example: A portal page may contain several portlets. Portlets are mini-applications that run in a portal.
• To indicate a variable in a command or code syntax that you must replace. For example: MyCommand PathName
Key combinations
Key name separated by a plus sign indicate keys pressed simultaneously. For example: Ctrl+C.
Key names separated by a comma and space indicate keys pressed one after the other. For example: Esc, Ctrl+Q.
The note icon indicates information that is of special interest or importance, for example, an additional action required only in certain circumstances.
The tip icon indicates an idea that could be useful, for example, a way to apply the information provided in the current section to achieve a specific result.
TIBCO LogLogic® Log Management Intelligence (LMI) User Guide
Preface | xiii
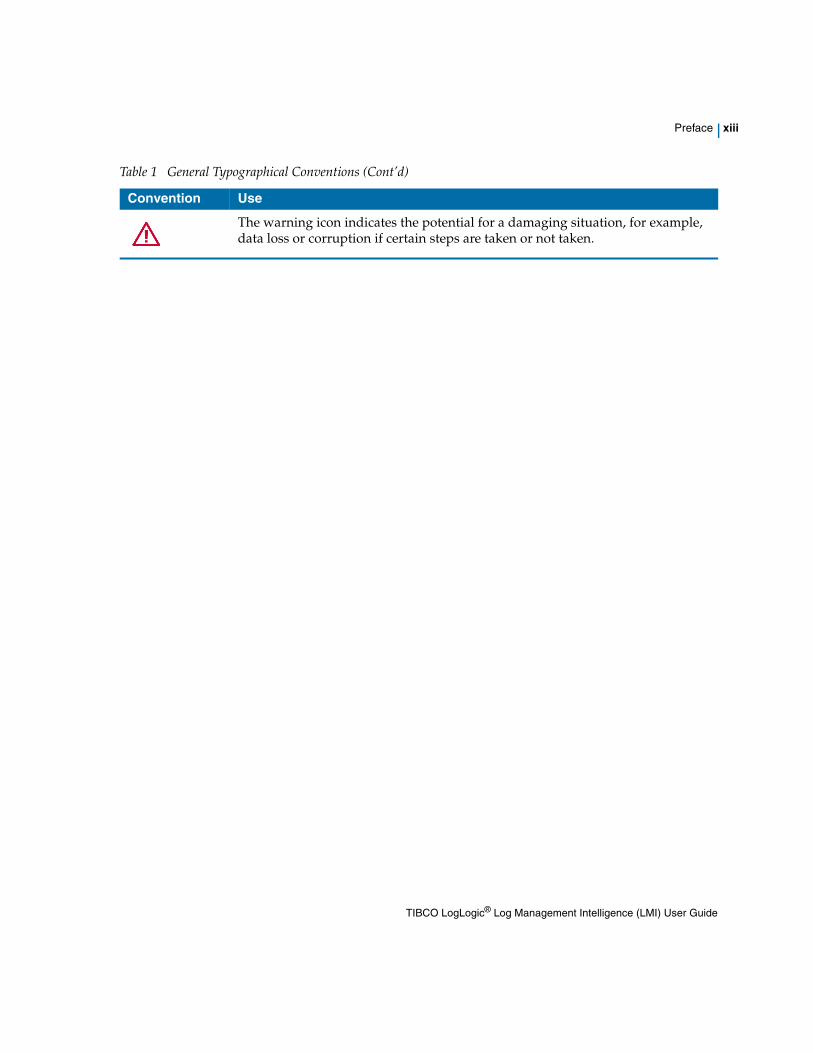
The warning icon indicates the potential for a damaging situation, for example, data loss or corruption if certain steps are taken or not taken.
Table 1 General Typographical Conventions (Cont’d)
Convention Use
TIBCO LogLogic® Log Management Intelligence (LMI) User Guide
xiv | Connecting with TIBCO Resources
Connecting with TIBCO Resources
How to Join TIBCO CommunityTIBCO Community is an online destination for TIBCO customers, partners, and resident experts. It is a place to share and access the collective experience of the TIBCO Community. TIBCO Community offers forums, blogs, and access to a variety of resources. To register, go to the following web address:
https://community.tibco.com
How to Access TIBCO DocumentationThe latest documentation for all TIBCO products is available on the TIBCO Documentation site (https://docs.tibco.com), which is updated more frequently than any documentation that might be included with the product.
Documentation for TIBCO LogLogic® products is available on the TIBCO LogLogic documentation page.
How to Contact TIBCO SupportFor comments or problems with this manual or the software it addresses, contact TIBCO Support as follows:
• For an overview of TIBCO Support, and information about getting started with TIBCO Support, visit this site:
http://www.tibco.com/services/support
• If you already have a valid maintenance or support contract, visit this site:
https://support.tibco.com
Entry to this site requires a user name and password. If you do not have a user name, you can request one.
TIBCO LogLogic® Log Management Intelligence (LMI) User Guide
Using LogLogic Appliances | 1
Chapter 1 Using LogLogic Appliances
Topics
• LogLogic Appliance Overview on page 2
• Appliance User Functions on page 3
• LogLogic Product Families on page 5
TIBCO LogLogic® Log Management Intelligence (LMI) User Guide
2 | Chapter 1 Using LogLogic Appliances
LogLogic Appliance Overview
Log data can comprise up to 25 percent of all enterprise data. Log data also contains critical information that can improve security, compliance and availability. Until now most companies have relied on ineffective and inefficient homegrown solutions and manual processes to manage this data.
LogLogic provides the industry's first enterprise class, end-to-end log management solution. Using LogLogic’s log management solutions, IT organizations can analyze and archive network log data for the purpose of compliance and legal protection, decision support for network security remediation, and increased network performance and improved availability.
LogLogic log management appliances simplify, automate, and reduce the cost of log data aggregation and retention, eliminating the need for servers, tape libraries, and archival administrators. If the network grows, simply rack and stack additional appliances as needed.
TIBCO LogLogic® Log Management Intelligence (LMI) User Guide
Appliance User Functions | 3
Appliance User Functions
There are two primary user types on a LogLogic appliance:
• User – monitors appliance operations, runs searches, manages alerts, and creates and runs reports based on collected data
• Administrator – configures and maintains the appliance itself, including managing log sources, user accounts, appliance configurations, running backups, and more
Depending on access permissions, a user can perform User functions, Administrator functions, or both. This manual describes User tasks and functions. For Administrator information, see the TIBCO LogLogic® Log Management Intelligence (LMI) Administration Guide.
Dashboard, Reports, Search, and Alert functions can be opened by clicking their respective icons on the home page or by clicking their buttons on the top navigation menu on the home page.
Management, and Administration functions for the appliance are opened by clicking their buttons on the top menu on the home page. For more information on these functions, see TIBCO LogLogic® Log Management Intelligence (LMI) Administration Guide.
Online Help can be opened by clicking the Help icon on any page. Brief video tutorials provide tips and guidance by example for many new LogLogic features. Tutorials can be accessed from the home page and from certain application pages.
The appliance GUI provides access to all Administrator and User functions. Administrators can perform all functions on the appliance, while Users are limited to functions that have been assigned to them by the System Administrator.
The functions in the navigation menu vary depending on the appliance product family. For example, an ST appliance displays fewer options than the LX appliance because certain features are not available on ST appliances. In addition, Reports may show different entries, depending on the Log Source Packages (LSPs) installed.
For all text fields throughout the UI, null is not a valid entry.
TIBCO LogLogic® Log Management Intelligence (LMI) User Guide
4 | Chapter 1 Using LogLogic Appliances
In addition to documentation, the LogLogic appliance is supported by comprehensive, context-sensitive online Help, which can be opened from any UI page in the application. Clicking the question mark (?) opens Help for the particular tab that is highlighted. Clicking the question mark (?) Help on the topmost menu bar opens the entire online Help repository, plus a Table of Contents, an Index, and a Search function within Help. Take a moment to explore Help to discover the rich content offered there.
TIBCO LogLogic® Log Management Intelligence (LMI) User Guide
LogLogic Product Families | 5
LogLogic Product Families
LogLogic offers three families of products to provide better, faster, and smarter log management, database security, and regulatory compliance solutions to corporations:
• LogLogic LX appliances are purpose-built appliances for real-time log data collection and analysis. These appliances slash response times to network security and utilization incidents, boost IT productivity, and reduce the corporate cost of security and performance event remediation.
• LogLogic MX appliances perform real-time log data collection and analysis ideal for mid-size and large companies. These appliances slash response times to network security and utilization incidents, boost IT productivity, and are optimized to provide for log data needs in a non-enterprise environment.
• LogLogic ST appliances automate the entire log data archival process, minimizing administration costs while providing more secure log data capture and retention.
LogLogic appliances bring visibility of compliance activity metrics to CIOs and CSOs, and control over activities to the compliance team, permitting them to review the compliance timeliness and compliance posture mandated by Sarbanes-Oxley (SOX) and Payment Card Industry Data Security Standard (PCI-DSS).
LogLogic appliances provide the highest log collection and analysis performance amongst all log management vendors. Log events are received and indexed in real-time. The LogLogic appliances have clearly-stated metrics that cannot be matched.
LogLogic LX Product FamilyFeaturing a parallel processing architecture, the appliances centralize log data collection and retention by simultaneously processing raw log data and metalog data. Distributed real-time reporting and targeted queries let administrators take immediate action on network issues from a centralized management console.
These appliances help enterprises harness the power of log data for a safer, more reliable network, while reducing corporate IT costs and providing rapid return on investment.
LX Benefits
LX product family appliances offer the following benefits:
TIBCO LogLogic® Log Management Intelligence (LMI) User Guide

6 | Chapter 1 Using LogLogic Appliances
• Real-Time Reports, ad-hoc queries and fast drill downs to speed up identification, isolation and repair of security and network incidents
• Non-disruptive installation and plug-and-play operation: no changes to network configurations, no integration with other systems, no training required, available in minutes
• Self-maintaining, embedded database technology that eliminates the need for DB administration
To view photographs of the LX appliance layout, see the TIBCO LogLogic® Log Management Intelligence (LMI) Hardware Installation Guide.
LogLogic MX Product FamilyThe appliances centralize log data collection and retention by simultaneously processing raw log data and metalog data at any volume. Designed specifically for mid-size and large companies, MX appliances provide the disk space and processing power required for most non-enterprise environments.
MX appliance features support the need to harness the power of log data for a safer, more reliable network, while reducing corporate IT costs and providing rapid return on investment. MX appliances are designed for installations where data must be retained longer than LX appliances provide, but where enterprise features such as failover* and managing other log appliances are not required.
MX Benefits
MX product family appliances offer the following benefits:
• Real-time reports, ad-hoc queries and fast drill downs to speed up identification, isolation and repair of security and network incidents
• Features and specifications targeted specifically to mid-size and large companies
• Self-maintaining, embedded database technology that eliminates the need for DB administration
To view photographs of the MX appliance layout, see the TIBCO LogLogic® Log Management Intelligence (LMI) Hardware Installation Guide.
LogLogic ST Product FamilyAvailable in compact, rack-mountable systems with up to 8 terabytes of compressed data on on-board storage and interfaces to NAS devices, the ST appliances archive up to 10 years 11 months of log data while eliminating the need for servers, tape libraries, and archive administrators.
TIBCO LogLogic® Log Management Intelligence (LMI) User Guide
LogLogic Product Families | 7
The ST SAN (Storage Area Network) product offers virtually unlimited archive storage.
When used with LogLogic's LX appliances, ST appliances guarantee complete and accurate transmission of network equipment logs from anywhere on the enterprise WAN or LAN. ST appliances feature an n-Tier architecture controlled by a management console that centralizes long-term log data archival while allowing for distributed log analysis and broader data accessibility.
ST Benefits
ST product family appliances offer the following benefits:
• High volume log data aggregation from centralized and remote log data sources
• Long-term retention of unaltered, complete, raw log messages at a secure, central location to make archives unimpeachable
• Distributed architecture of remote collection and central storage make log data collection and retention infinitely scalable
• Self-maintaining, embedded database technology that eliminates the need for DB administration
To view photographs of the ST appliance layout, see the TIBCO LogLogic® Log Management Intelligence (LMI) Hardware Installation Guide.
Scalable InfrastructureThe scalable LogLogic network infrastructure significantly accelerates response time to data center security and availability events, while providing complete log data archives for compliance and legal protection. LogLogic appliances make log data in enterprise networks truly useful for the first time, improving corporate security, compliance and network availability, while reducing IT costs and costly network downtime, and improving corporate return on IT investment.
TIBCO LogLogic® Log Management Intelligence (LMI) User Guide

8 | Chapter 1 Using LogLogic Appliances
TIBCO LogLogic® Log Management Intelligence (LMI) User Guide
Viewing Dashboards | 9
Chapter 2 Viewing Dashboards
LogLogic appliances let you monitor a large variety of data to observe the system’s status and the widgets saved on your Dashboard.
Topics
• Viewing System Status on page 10
• Viewing Multiple Systems Status (Management Station) on page 15
• Viewing Log Source Status on page 20
• Viewing Log Source Data Trend on page 26
• Managing Your Dashboard on page 27
TIBCO LogLogic® Log Management Intelligence (LMI) User Guide
10 | Chapter 2 Viewing Dashboards
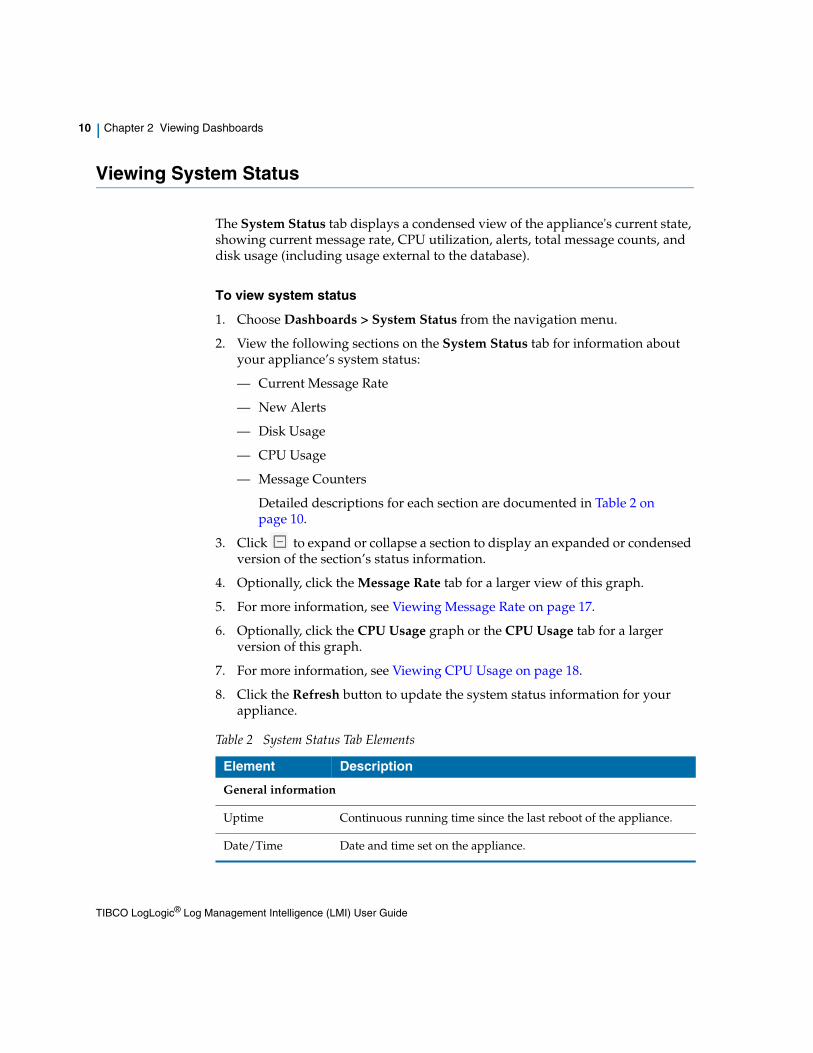
Viewing System Status
The System Status tab displays a condensed view of the appliance's current state, showing current message rate, CPU utilization, alerts, total message counts, and disk usage (including usage external to the database).
To view system status
1. Choose Dashboards > System Status from the navigation menu.
2. View the following sections on the System Status tab for information about your appliance’s system status:
— Current Message Rate
— New Alerts
— Disk Usage
— CPU Usage
— Message Counters
Detailed descriptions for each section are documented in Table 2 on page 10.
3. Click to expand or collapse a section to display an expanded or condensed version of the section’s status information.
4. Optionally, click the Message Rate tab for a larger view of this graph.
5. For more information, see Viewing Message Rate on page 17.
6. Optionally, click the CPU Usage graph or the CPU Usage tab for a larger version of this graph.
7. For more information, see Viewing CPU Usage on page 18.
8. Click the Refresh button to update the system status information for your appliance.
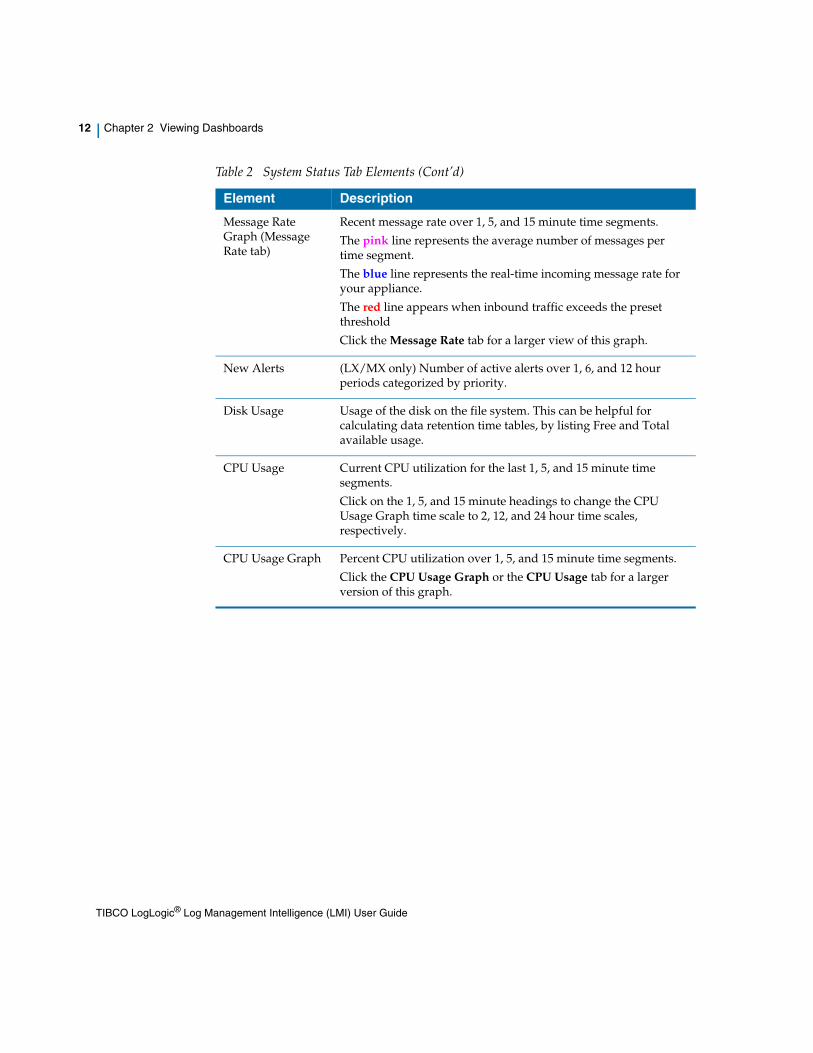
Table 2 System Status Tab Elements
Element Description
General information
Uptime Continuous running time since the last reboot of the appliance.
Date/Time Date and time set on the appliance.
TIBCO LogLogic® Log Management Intelligence (LMI) User Guide
Viewing System Status | 11
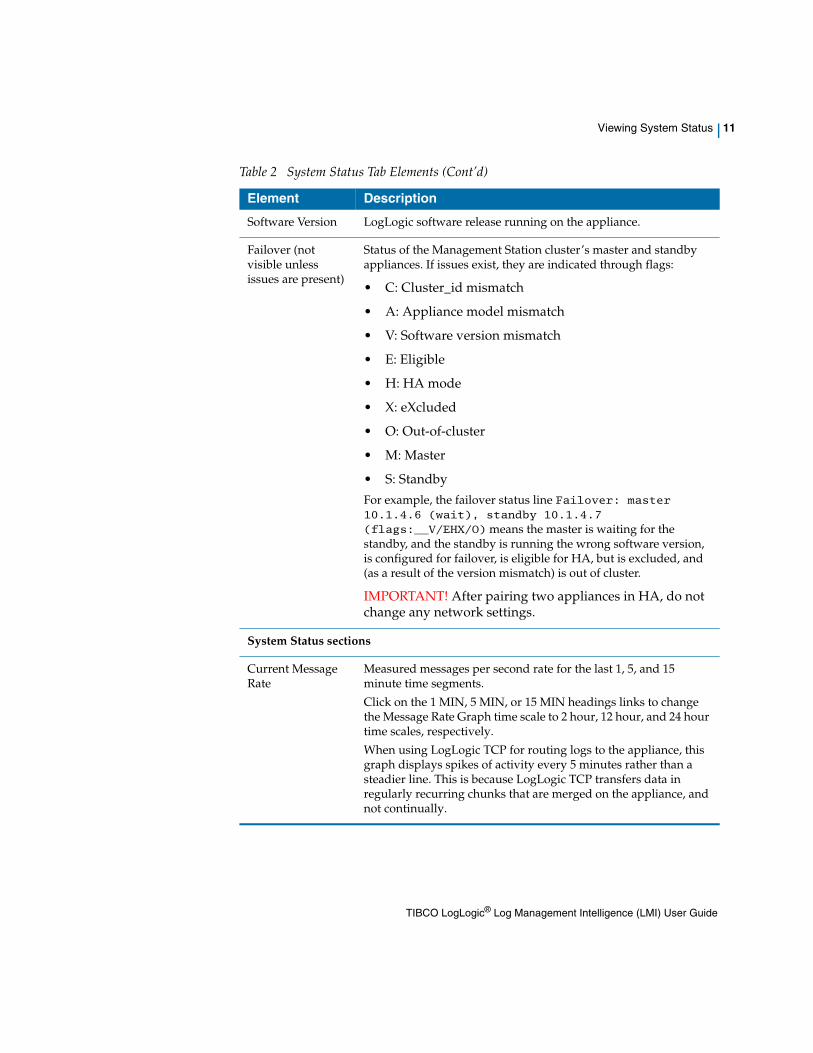
Software Version LogLogic software release running on the appliance.
Failover (not visible unless issues are present)
Status of the Management Station cluster’s master and standby appliances. If issues exist, they are indicated through flags:
• C: Cluster_id mismatch
• A: Appliance model mismatch
• V: Software version mismatch
• E: Eligible
• H: HA mode
• X: eXcluded
• O: Out-of-cluster
• M: Master
• S: Standby
For example, the failover status line Failover: master 10.1.4.6 (wait), standby 10.1.4.7 (flags:__V/EHX/O) means the master is waiting for the standby, and the standby is running the wrong software version, is configured for failover, is eligible for HA, but is excluded, and (as a result of the version mismatch) is out of cluster.
IMPORTANT! After pairing two appliances in HA, do not change any network settings.
System Status sections
Current Message Rate
Measured messages per second rate for the last 1, 5, and 15 minute time segments.
Click on the 1 MIN, 5 MIN, or 15 MIN headings links to change the Message Rate Graph time scale to 2 hour, 12 hour, and 24 hour time scales, respectively.
When using LogLogic TCP for routing logs to the appliance, this graph displays spikes of activity every 5 minutes rather than a steadier line. This is because LogLogic TCP transfers data in regularly recurring chunks that are merged on the appliance, and not continually.
Table 2 System Status Tab Elements (Cont’d)
Element Description
TIBCO LogLogic® Log Management Intelligence (LMI) User Guide
12 | Chapter 2 Viewing Dashboards
Message Rate Graph (Message Rate tab)
Recent message rate over 1, 5, and 15 minute time segments.
The pink line represents the average number of messages per time segment.
The blue line represents the real-time incoming message rate for your appliance.
The red line appears when inbound traffic exceeds the preset threshold
Click the Message Rate tab for a larger view of this graph.
New Alerts (LX/MX only) Number of active alerts over 1, 6, and 12 hour periods categorized by priority.
Disk Usage Usage of the disk on the file system. This can be helpful for calculating data retention time tables, by listing Free and Total available usage.
CPU Usage Current CPU utilization for the last 1, 5, and 15 minute time segments.
Click on the 1, 5, and 15 minute headings to change the CPU Usage Graph time scale to 2, 12, and 24 hour time scales, respectively.
CPU Usage Graph Percent CPU utilization over 1, 5, and 15 minute time segments.
Click the CPU Usage Graph or the CPU Usage tab for a larger version of this graph.
Table 2 System Status Tab Elements (Cont’d)
Element Description
TIBCO LogLogic® Log Management Intelligence (LMI) User Guide
Viewing System Status | 13
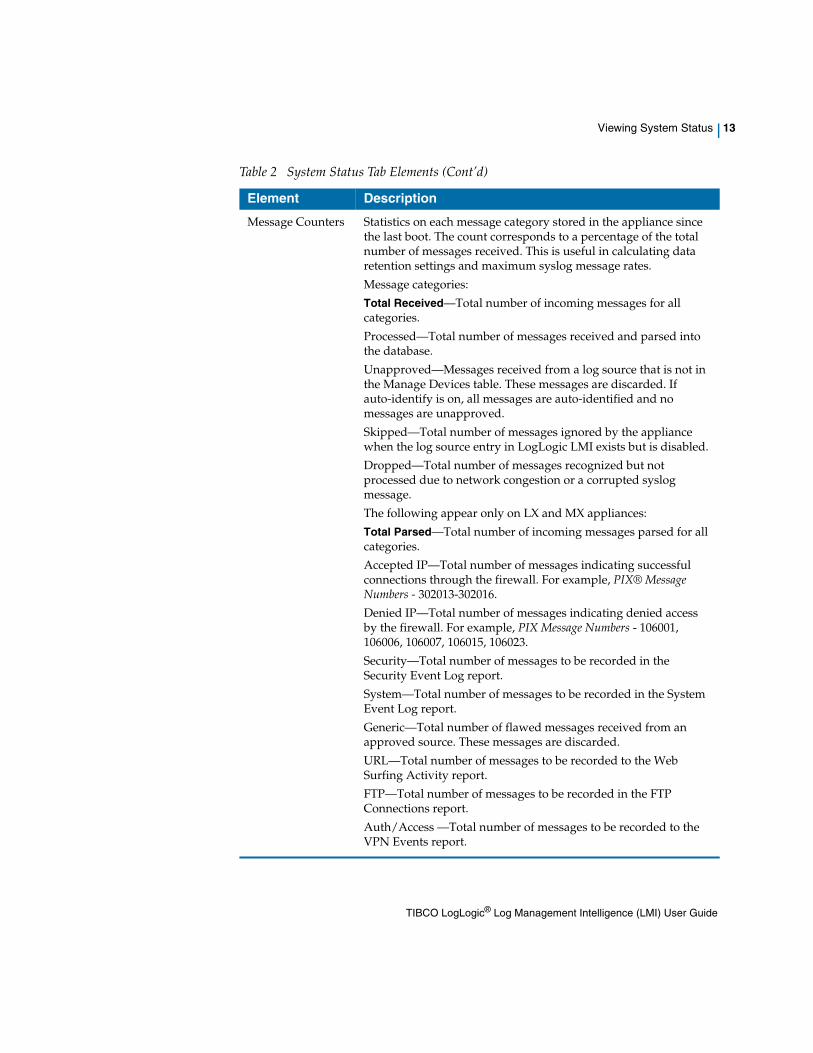
Message Counters Statistics on each message category stored in the appliance since the last boot. The count corresponds to a percentage of the total number of messages received. This is useful in calculating data retention settings and maximum syslog message rates.
Message categories:
Total Received—Total number of incoming messages for all categories.
Processed—Total number of messages received and parsed into the database.
Unapproved—Messages received from a log source that is not in the Manage Devices table. These messages are discarded. If auto-identify is on, all messages are auto-identified and no messages are unapproved.
Skipped—Total number of messages ignored by the appliance when the log source entry in LogLogic LMI exists but is disabled.
Dropped—Total number of messages recognized but not processed due to network congestion or a corrupted syslog message.
The following appear only on LX and MX appliances:
Total Parsed—Total number of incoming messages parsed for all categories.
Accepted IP—Total number of messages indicating successful connections through the firewall. For example, PIX® Message Numbers - 302013-302016.
Denied IP—Total number of messages indicating denied access by the firewall. For example, PIX Message Numbers - 106001, 106006, 106007, 106015, 106023.
Security—Total number of messages to be recorded in the Security Event Log report.
System—Total number of messages to be recorded in the System Event Log report.
Generic—Total number of flawed messages received from an approved source. These messages are discarded.
URL—Total number of messages to be recorded to the Web Surfing Activity report.
FTP—Total number of messages to be recorded in the FTP Connections report.
Auth/Access —Total number of messages to be recorded to the VPN Events report.
Table 2 System Status Tab Elements (Cont’d)
Element Description
TIBCO LogLogic® Log Management Intelligence (LMI) User Guide
14 | Chapter 2 Viewing Dashboards
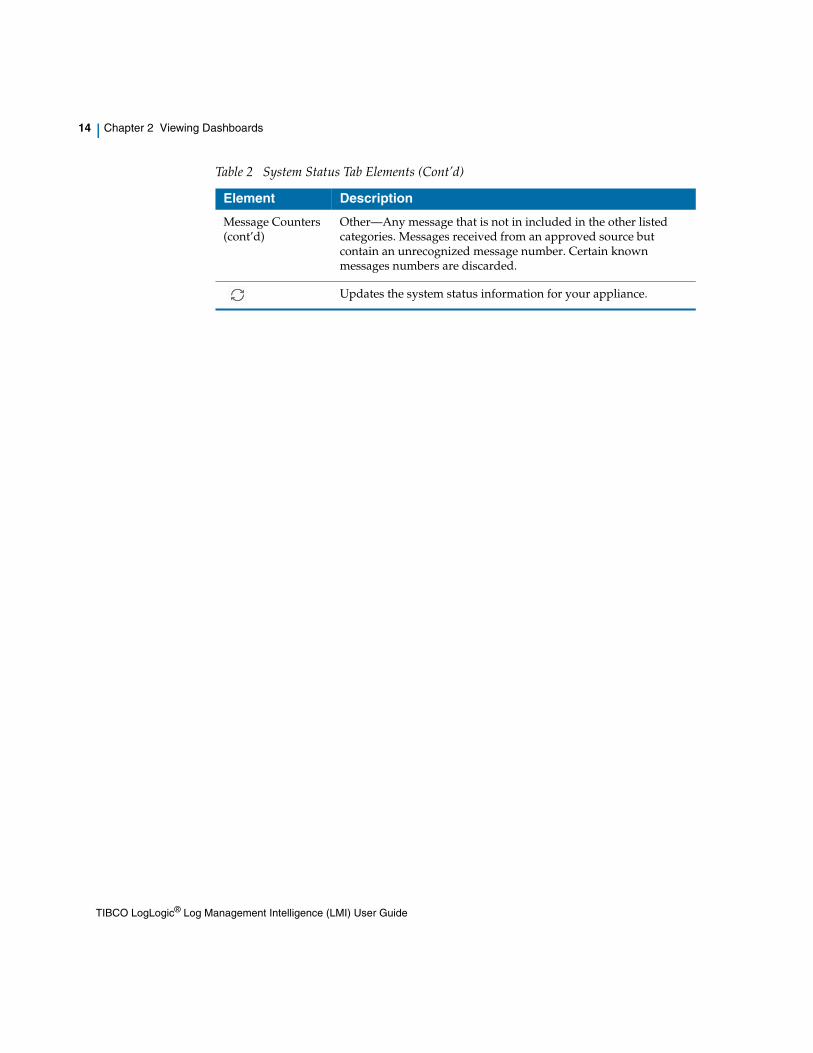
Message Counters (cont’d)
Other—Any message that is not in included in the other listed categories. Messages received from an approved source but contain an unrecognized message number. Certain known messages numbers are discarded.
Updates the system status information for your appliance.
Table 2 System Status Tab Elements (Cont’d)
Element Description
TIBCO LogLogic® Log Management Intelligence (LMI) User Guide
Viewing Multiple Systems Status (Management Station) | 15
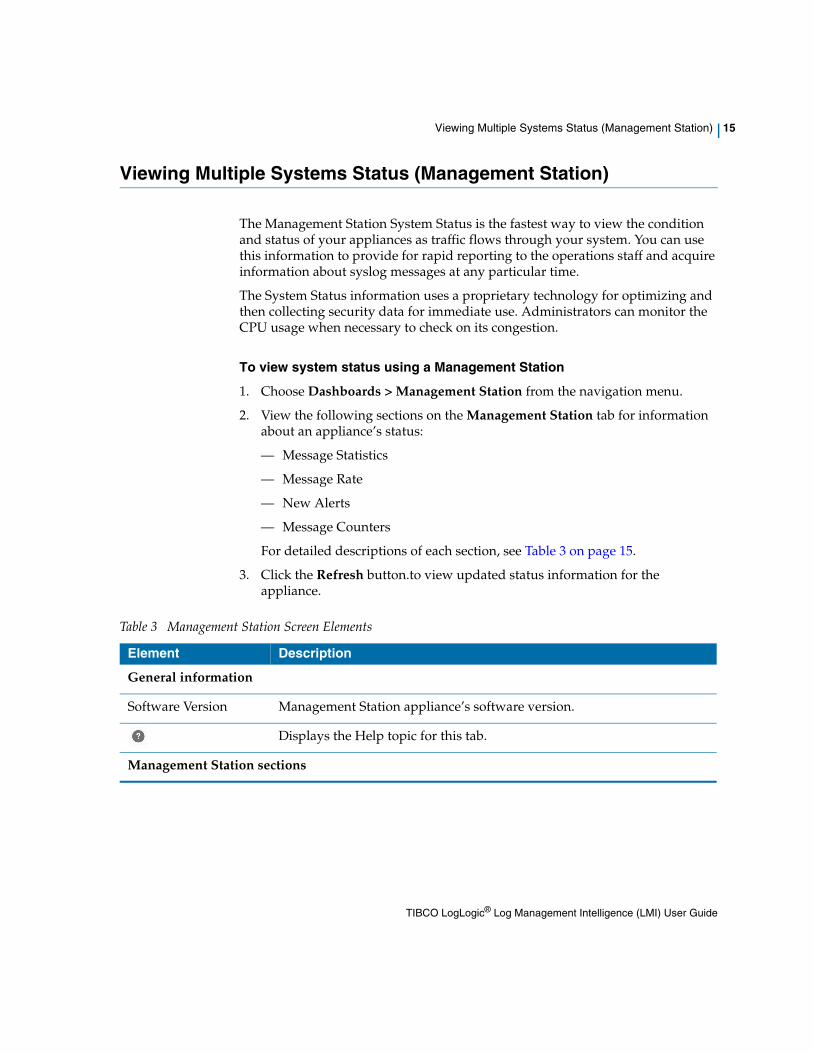
Viewing Multiple Systems Status (Management Station)
The Management Station System Status is the fastest way to view the condition and status of your appliances as traffic flows through your system. You can use this information to provide for rapid reporting to the operations staff and acquire information about syslog messages at any particular time.
The System Status information uses a proprietary technology for optimizing and then collecting security data for immediate use. Administrators can monitor the CPU usage when necessary to check on its congestion.
To view system status using a Management Station
1. Choose Dashboards > Management Station from the navigation menu.
2. View the following sections on the Management Station tab for information about an appliance’s status:
— Message Statistics
— Message Rate
— New Alerts
— Message Counters
For detailed descriptions of each section, see Table 3 on page 15.
3. Click the Refresh button.to view updated status information for the appliance.
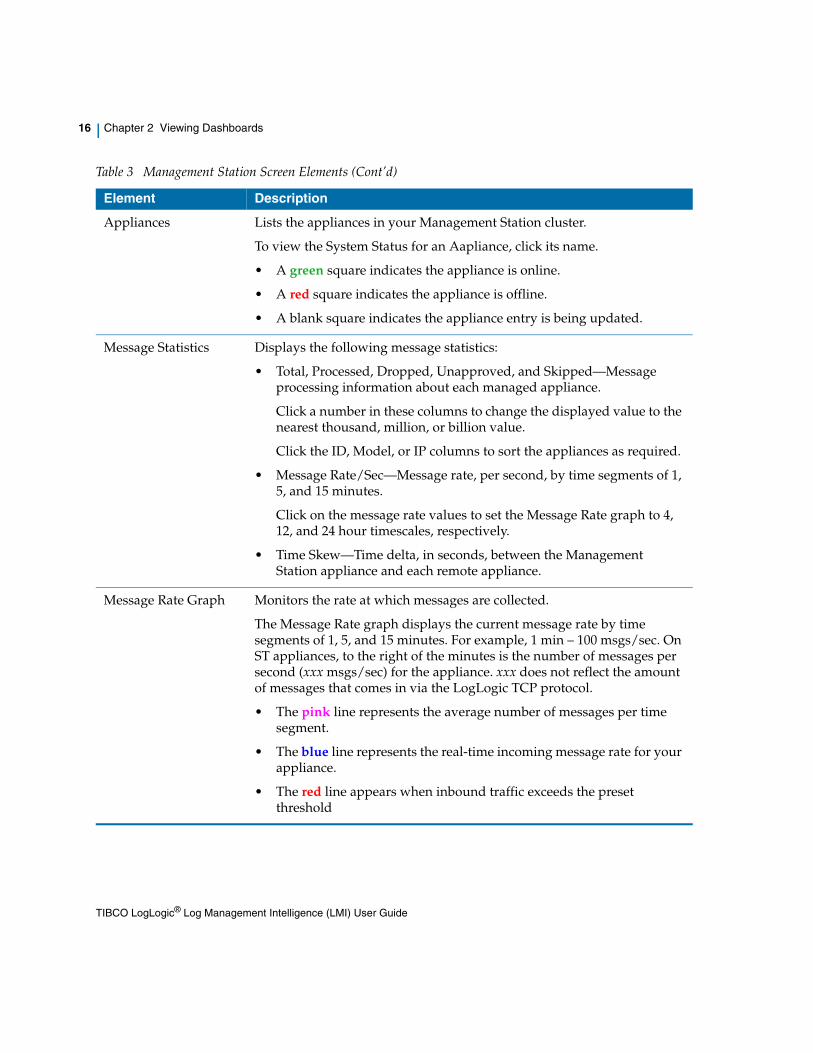
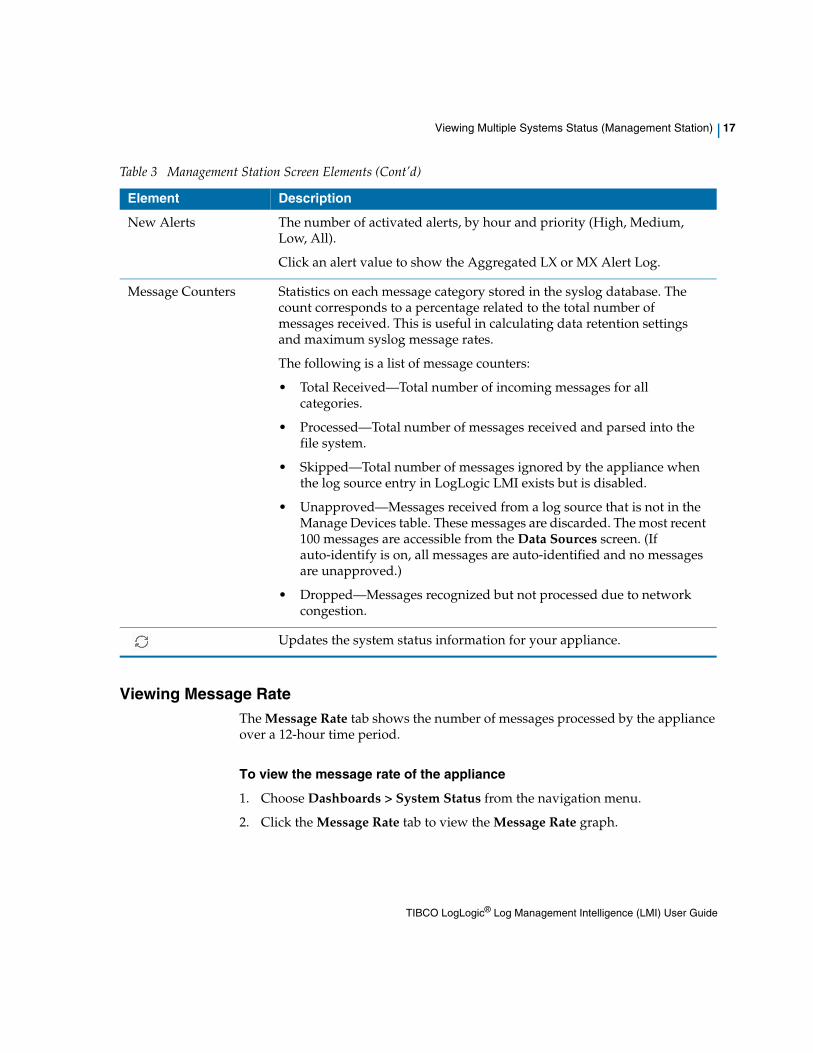
Table 3 Management Station Screen Elements
Element Description
General information
Software Version Management Station appliance’s software version.
Displays the Help topic for this tab.
Management Station sections
TIBCO LogLogic® Log Management Intelligence (LMI) User Guide
16 | Chapter 2 Viewing Dashboards
Appliances Lists the appliances in your Management Station cluster.
To view the System Status for an Aapliance, click its name.
• A green square indicates the appliance is online.
• A red square indicates the appliance is offline.
• A blank square indicates the appliance entry is being updated.
Message Statistics Displays the following message statistics:
• Total, Processed, Dropped, Unapproved, and Skipped—Message processing information about each managed appliance.
Click a number in these columns to change the displayed value to the nearest thousand, million, or billion value.
Click the ID, Model, or IP columns to sort the appliances as required.
• Message Rate/Sec—Message rate, per second, by time segments of 1, 5, and 15 minutes.
Click on the message rate values to set the Message Rate graph to 4, 12, and 24 hour timescales, respectively.
• Time Skew—Time delta, in seconds, between the Management Station appliance and each remote appliance.
Message Rate Graph Monitors the rate at which messages are collected.
The Message Rate graph displays the current message rate by time segments of 1, 5, and 15 minutes. For example, 1 min – 100 msgs/sec. On ST appliances, to the right of the minutes is the number of messages per second (xxx msgs/sec) for the appliance. xxx does not reflect the amount of messages that comes in via the LogLogic TCP protocol.
• The pink line represents the average number of messages per time segment.
• The blue line represents the real-time incoming message rate for your appliance.
• The red line appears when inbound traffic exceeds the preset threshold
Table 3 Management Station Screen Elements (Cont’d)
Element Description
TIBCO LogLogic® Log Management Intelligence (LMI) User Guide
Viewing Multiple Systems Status (Management Station) | 17
Viewing Message RateThe Message Rate tab shows the number of messages processed by the appliance over a 12-hour time period.
To view the message rate of the appliance
1. Choose Dashboards > System Status from the navigation menu.
2. Click the Message Rate tab to view the Message Rate graph.
New Alerts The number of activated alerts, by hour and priority (High, Medium, Low, All).
Click an alert value to show the Aggregated LX or MX Alert Log.
Message Counters Statistics on each message category stored in the syslog database. The count corresponds to a percentage related to the total number of messages received. This is useful in calculating data retention settings and maximum syslog message rates.
The following is a list of message counters:
• Total Received—Total number of incoming messages for all categories.
• Processed—Total number of messages received and parsed into the file system.
• Skipped—Total number of messages ignored by the appliance when the log source entry in LogLogic LMI exists but is disabled.
• Unapproved—Messages received from a log source that is not in the Manage Devices table. These messages are discarded. The most recent 100 messages are accessible from the Data Sources screen. (If auto-identify is on, all messages are auto-identified and no messages are unapproved.)
• Dropped—Messages recognized but not processed due to network congestion.
Updates the system status information for your appliance.
Table 3 Management Station Screen Elements (Cont’d)
Element Description
TIBCO LogLogic® Log Management Intelligence (LMI) User Guide
18 | Chapter 2 Viewing Dashboards
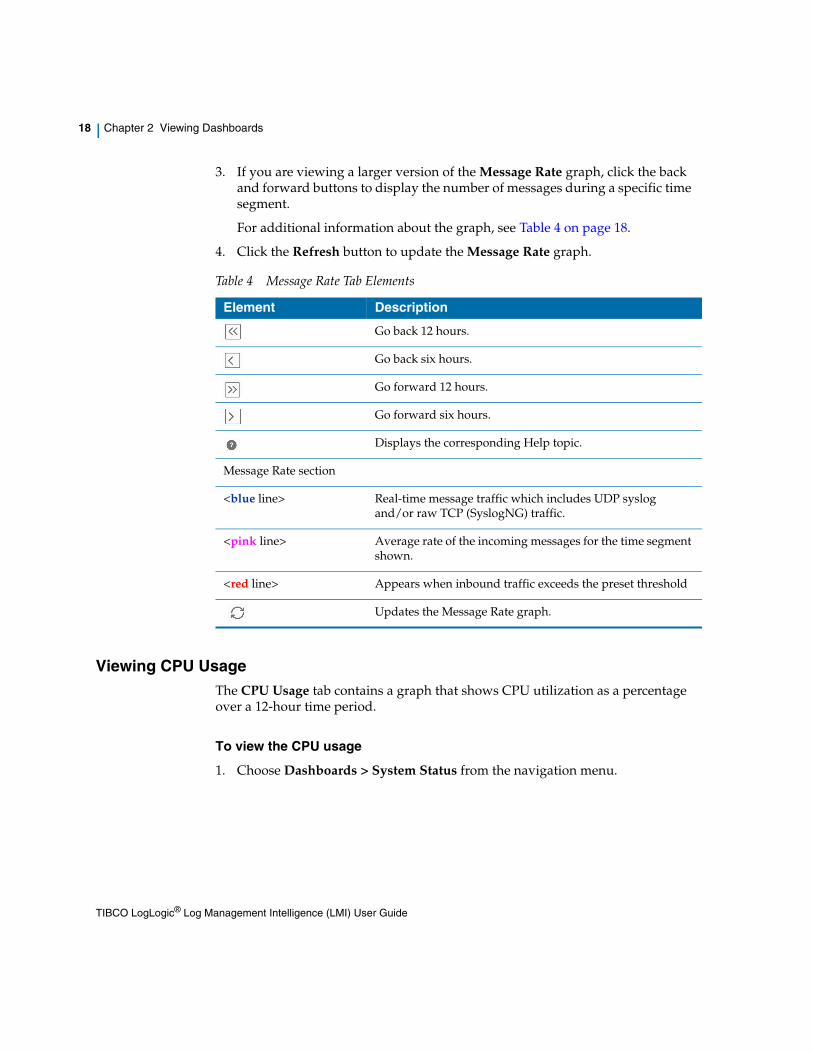
3. If you are viewing a larger version of the Message Rate graph, click the back and forward buttons to display the number of messages during a specific time segment.
For additional information about the graph, see Table 4 on page 18.
4. Click the Refresh button to update the Message Rate graph.
Viewing CPU UsageThe CPU Usage tab contains a graph that shows CPU utilization as a percentage over a 12-hour time period.
To view the CPU usage
1. Choose Dashboards > System Status from the navigation menu.
Table 4 Message Rate Tab Elements
Element Description
Go back 12 hours.
Go back six hours.
Go forward 12 hours.
Go forward six hours.
Displays the corresponding Help topic.
Message Rate section
<blue line> Real-time message traffic which includes UDP syslog and/or raw TCP (SyslogNG) traffic.
<pink line> Average rate of the incoming messages for the time segment shown.
<red line> Appears when inbound traffic exceeds the preset threshold
Updates the Message Rate graph.
TIBCO LogLogic® Log Management Intelligence (LMI) User Guide
Viewing Multiple Systems Status (Management Station) | 19
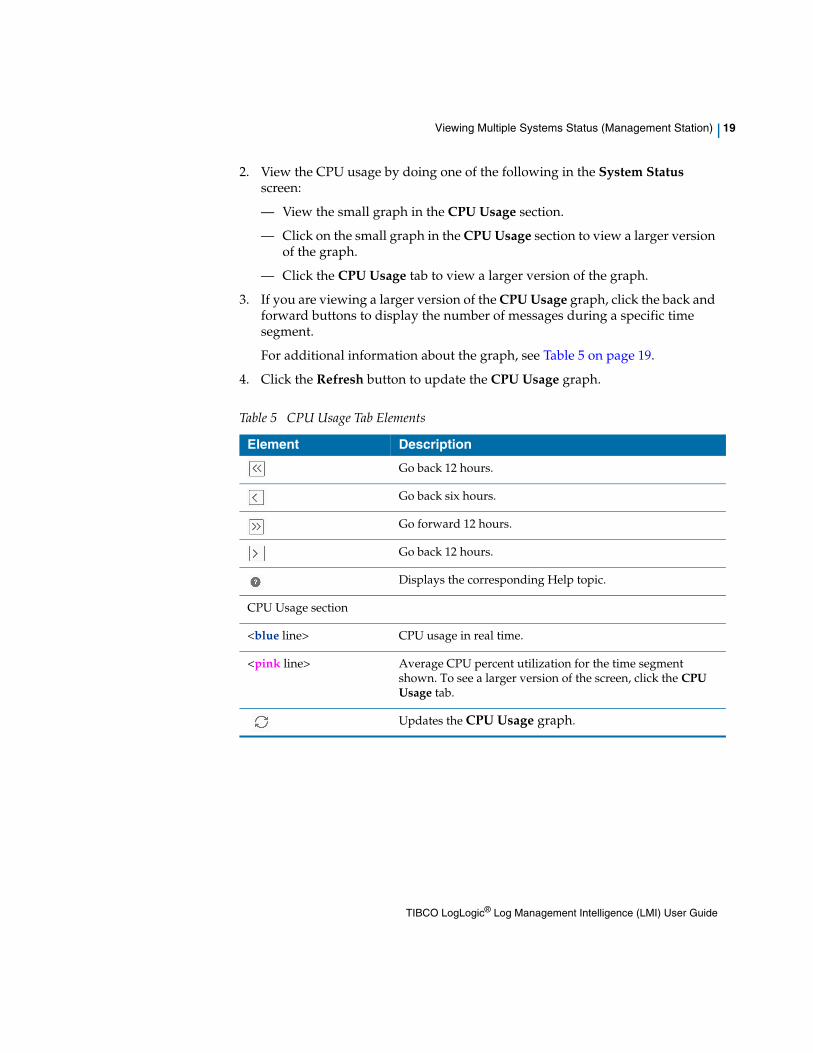
2. View the CPU usage by doing one of the following in the System Status screen:
— View the small graph in the CPU Usage section.
— Click on the small graph in the CPU Usage section to view a larger version of the graph.
— Click the CPU Usage tab to view a larger version of the graph.
3. If you are viewing a larger version of the CPU Usage graph, click the back and forward buttons to display the number of messages during a specific time segment.
For additional information about the graph, see Table 5 on page 19.
4. Click the Refresh button to update the CPU Usage graph.
Table 5 CPU Usage Tab Elements
Element Description
Go back 12 hours.
Go back six hours.
Go forward 12 hours.
Go back 12 hours.
Displays the corresponding Help topic.
CPU Usage section
<blue line> CPU usage in real time.
<pink line> Average CPU percent utilization for the time segment shown. To see a larger version of the screen, click the CPU Usage tab.
Updates the CPU Usage graph.
TIBCO LogLogic® Log Management Intelligence (LMI) User Guide
20 | Chapter 2 Viewing Dashboards
Viewing Log Source Status
The Log Source Status tab lets you view statistics for each source device.
To view the log source status
1. Choose Dashboards > Log Source Status from the navigation Menu.
2. View the following log status information for each source device:
— Name
— IP Address
— Type
— Last Received Time
— Collector Domain
— Total Message Count
— Byte Rate/Sec
— Description
For detailed descriptions of each item, see Table 6 on page 20.
3. Click the Refresh button to update the view of your devices.
4. Optionally, click to print all the items in the list.
Log Source Status Descriptions
Table 6 lists and describes the elements in the Log Source Status tab.
If during auto-discover a device has the same name as an existing device, a random number is appended to the device name.
Table 6 Log Source Status Tab Elements
Element Description
Saves the report in a CSV format. You can view the file in Excel as a spreadsheet.
Note: The CSV file saves and displays a maximum of 10,000 lines. A generated report can contain more than this number.
TIBCO LogLogic® Log Management Intelligence (LMI) User Guide
Viewing Log Source Status | 21
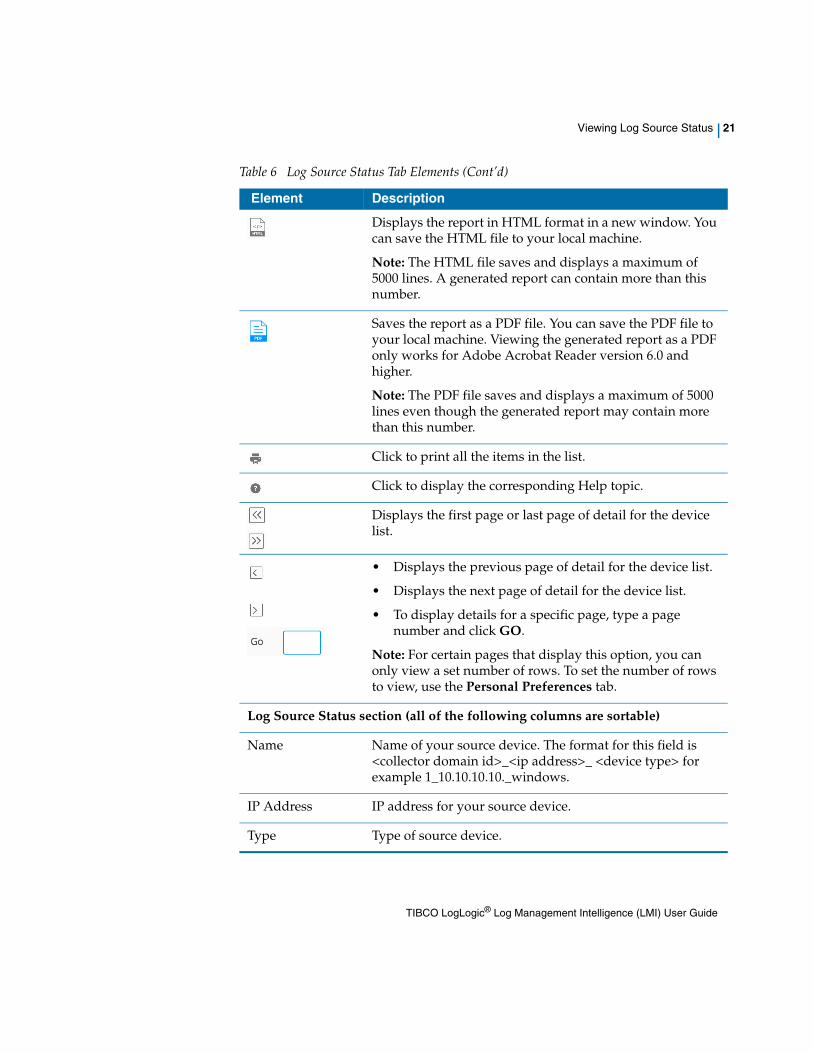
Displays the report in HTML format in a new window. You can save the HTML file to your local machine.
Note: The HTML file saves and displays a maximum of 5000 lines. A generated report can contain more than this number.
Saves the report as a PDF file. You can save the PDF file to your local machine. Viewing the generated report as a PDF only works for Adobe Acrobat Reader version 6.0 and higher.
Note: The PDF file saves and displays a maximum of 5000 lines even though the generated report may contain more than this number.
Click to print all the items in the list.
Click to display the corresponding Help topic.
Displays the first page or last page of detail for the device list.
• Displays the previous page of detail for the device list.
• Displays the next page of detail for the device list.
• To display details for a specific page, type a page number and click GO.
Note: For certain pages that display this option, you can only view a set number of rows. To set the number of rows to view, use the Personal Preferences tab.
Log Source Status section (all of the following columns are sortable)
Name Name of your source device. The format for this field is <collector domain id>_<ip address>_ <device type> for example 1_10.10.10.10._windows.
IP Address IP address for your source device.
Type Type of source device.
Table 6 Log Source Status Tab Elements (Cont’d)
Element Description
TIBCO LogLogic® Log Management Intelligence (LMI) User Guide
22 | Chapter 2 Viewing Dashboards
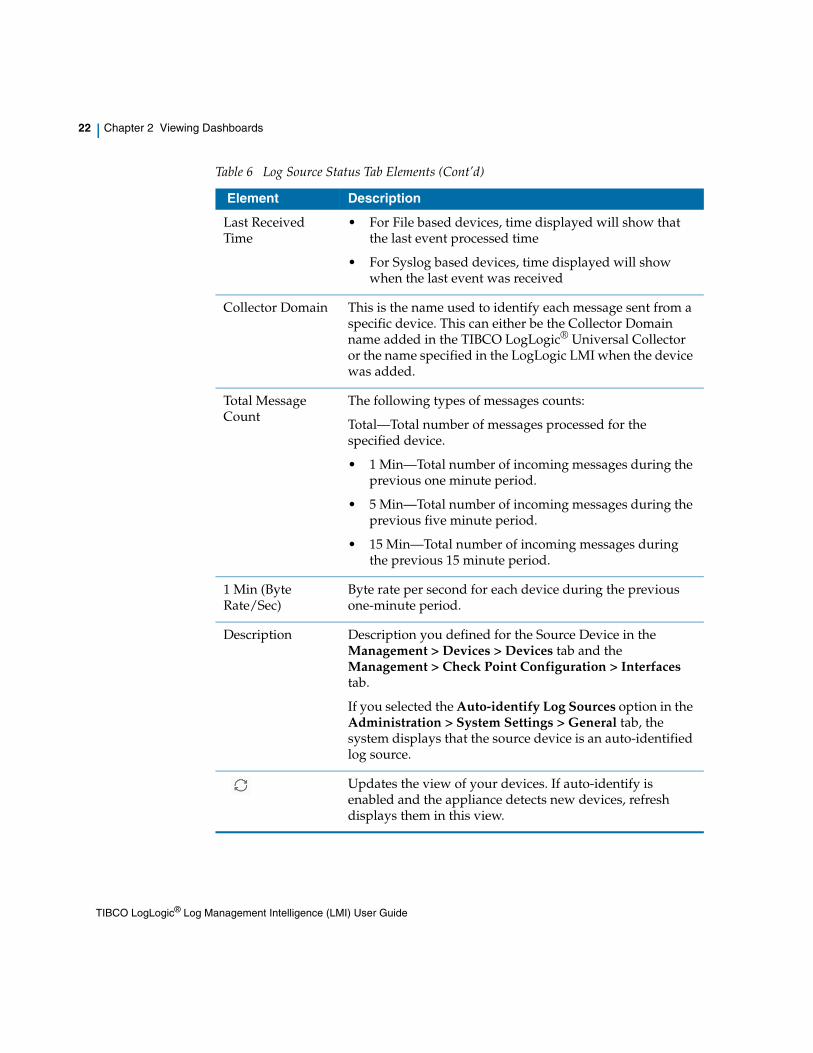
Last Received Time
• For File based devices, time displayed will show that the last event processed time
• For Syslog based devices, time displayed will show when the last event was received
Collector Domain This is the name used to identify each message sent from a specific device. This can either be the Collector Domain name added in the TIBCO LogLogic® Universal Collector or the name specified in the LogLogic LMI when the device was added.
Total Message Count
The following types of messages counts:
Total—Total number of messages processed for the specified device.
• 1 Min—Total number of incoming messages during the previous one minute period.
• 5 Min—Total number of incoming messages during the previous five minute period.
• 15 Min—Total number of incoming messages during the previous 15 minute period.
1 Min (Byte Rate/Sec)
Byte rate per second for each device during the previous one-minute period.
Description Description you defined for the Source Device in the Management > Devices > Devices tab and the Management > Check Point Configuration > Interfaces tab.
If you selected the Auto-identify Log Sources option in the Administration > System Settings > General tab, the system displays that the source device is an auto-identified log source.
Updates the view of your devices. If auto-identify is enabled and the appliance detects new devices, refresh displays them in this view.
Table 6 Log Source Status Tab Elements (Cont’d)
Element Description
TIBCO LogLogic® Log Management Intelligence (LMI) User Guide
Viewing Log Source Status | 23
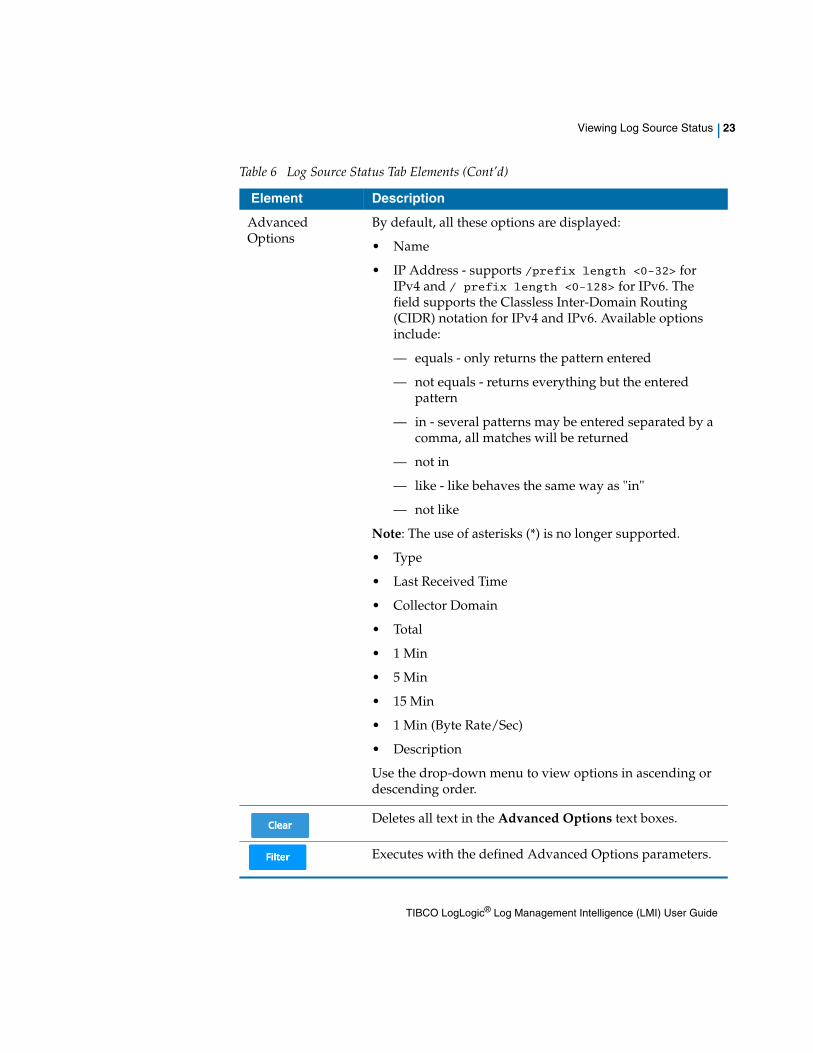
Advanced Options
By default, all these options are displayed:
• Name
• IP Address - supports /prefix length <0-32> for IPv4 and / prefix length <0-128> for IPv6. The field supports the Classless Inter-Domain Routing (CIDR) notation for IPv4 and IPv6. Available options include:
— equals - only returns the pattern entered
— not equals - returns everything but the entered pattern
— in - several patterns may be entered separated by a comma, all matches will be returned
— not in
— like - like behaves the same way as "in"
— not like
Note: The use of asterisks (*) is no longer supported.
• Type
• Last Received Time
• Collector Domain
• Total
• 1 Min
• 5 Min
• 15 Min
• 1 Min (Byte Rate/Sec)
• Description
Use the drop-down menu to view options in ascending or descending order.
Deletes all text in the Advanced Options text boxes.
Executes with the defined Advanced Options parameters.
Table 6 Log Source Status Tab Elements (Cont’d)
Element Description
TIBCO LogLogic® Log Management Intelligence (LMI) User Guide
24 | Chapter 2 Viewing Dashboards
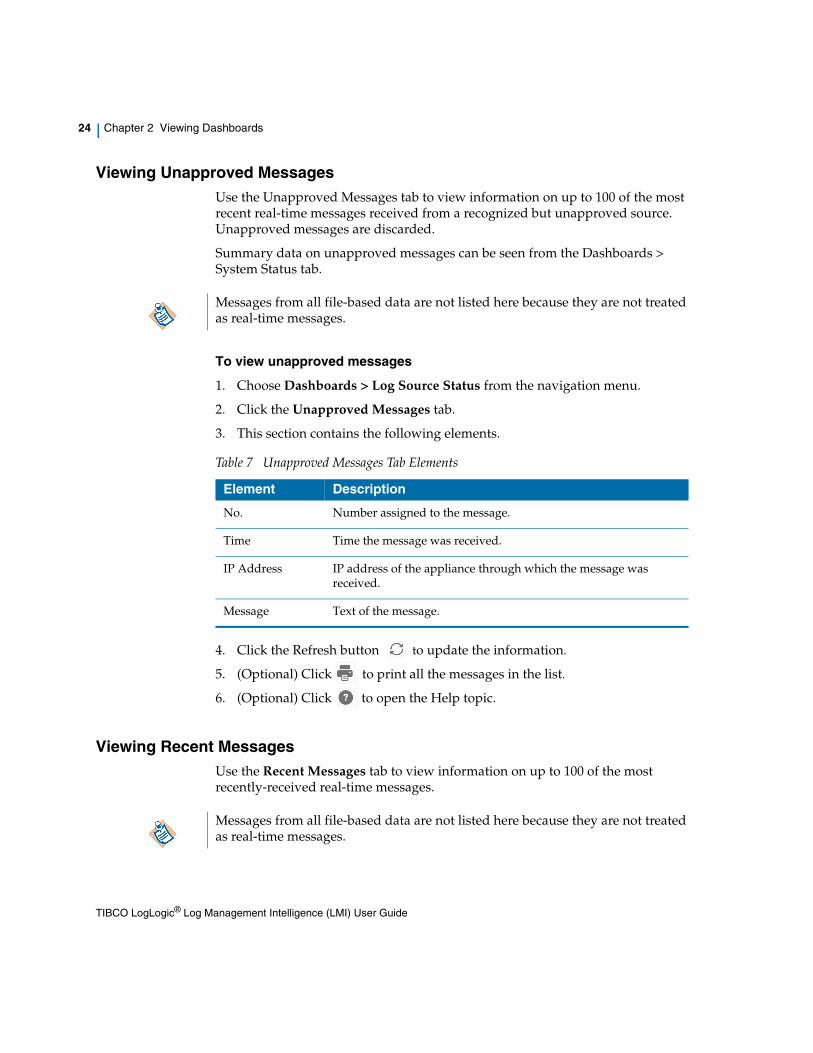
Viewing Unapproved MessagesUse the Unapproved Messages tab to view information on up to 100 of the most recent real-time messages received from a recognized but unapproved source. Unapproved messages are discarded.
Summary data on unapproved messages can be seen from the Dashboards > System Status tab.
To view unapproved messages
1. Choose Dashboards > Log Source Status from the navigation menu.
2. Click the Unapproved Messages tab.
3. This section contains the following elements.
4. Click the Refresh button to update the information.
5. (Optional) Click to print all the messages in the list.
6. (Optional) Click to open the Help topic.
Viewing Recent MessagesUse the Recent Messages tab to view information on up to 100 of the most recently-received real-time messages.
Messages from all file-based data are not listed here because they are not treated as real-time messages.
Table 7 Unapproved Messages Tab Elements
Element Description
No. Number assigned to the message.
Time Time the message was received.
IP Address IP address of the appliance through which the message was received.
Message Text of the message.
Messages from all file-based data are not listed here because they are not treated as real-time messages.
TIBCO LogLogic® Log Management Intelligence (LMI) User Guide
Viewing Log Source Status | 25
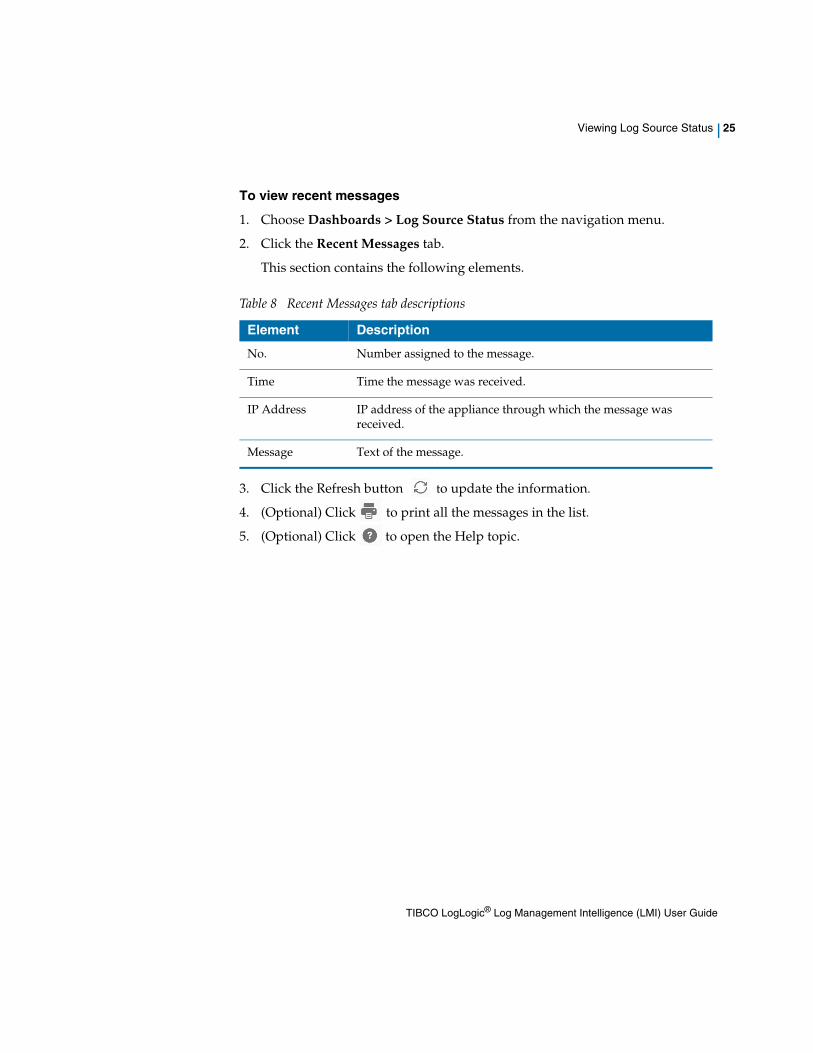
To view recent messages
1. Choose Dashboards > Log Source Status from the navigation menu.
2. Click the Recent Messages tab.
This section contains the following elements.
3. Click the Refresh button to update the information.
4. (Optional) Click to print all the messages in the list.
5. (Optional) Click to open the Help topic.
Table 8 Recent Messages tab descriptions
Element Description
No. Number assigned to the message.
Time Time the message was received.
IP Address IP address of the appliance through which the message was received.
Message Text of the message.
TIBCO LogLogic® Log Management Intelligence (LMI) User Guide
26 | Chapter 2 Viewing Dashboards
Viewing Log Source Data Trend
The Log Source Data Trend tab displays the graphs of incoming Syslog Data rate in MB from all sources over the last 24 hours. The top graph displays Realtime Logs, and the bottom graph shows File Transfer Logs. Log data that has been fully indexed is represented by blue bars; log data to be indexed is represented by orange bars. The bar graphs refresh once per minute.
To view log source data trend
1. Choose Dashboards > Log Source Data Trend from the navigation menu.
2. View the Syslog data from all sources within the last 24 hours as shown below.
TIBCO LogLogic® Log Management Intelligence (LMI) User Guide
Managing Your Dashboard | 27
Managing Your Dashboard
The My Dashboard menu allows you to customize your Dashboard with visualizations, known as “widgets”, representing report results, search results, alerts, and appliance performance. For example, If you have an index search showing web surfing activity within the Intranet, this data can be presented on your Dashboard using the Trend Graph widget, and refreshed periodically with recent data from an Index Search.
The system admin can specify the maximum number of widgets that can be displayed on your Dashboard using the Administration > System Settings > General tab.
Widget Types
You can create different types of widgets to add to your dashboard canvas. The different types are:
• Summary: Displays top 10 results from any Report saved with the “Summarized” option. It also displays All Index Reports as well as Index Searches that are grouped by option (except grouped by Time). For details, see Managing Summary Widgets on page 29.
• Trend: Displays a trend of Index Search “hits” occurring over a period of 1 day, 1 week or 1 month. For details, see Managing Trend Widgets on page 32.
• Alerts: Displays recent triggered alerts matching your specified filters. For details, see Managing Alert Widgets on page 36.
It is possible to exceed the recommended number of widgets (10) on your My Dashboard. However, graphical errors may result in the data displayed. Similarly, if you set the amount of data to be displayed inside each widget beyond the recommended value of 10, graphical errors may result.
TIBCO LogLogic® Log Management Intelligence (LMI) User Guide
28 | Chapter 2 Viewing Dashboards
• System: Displays Network and File based data ingest trends, Disk usage, and CPU usage utilization. For details, see Managing System Widgets on page 38.
About My Dashboard
By default, the dashboard canvas displays some pre-configured widgets. The Widgets link enables you to add widgets to your dashboard. A new widget is always added on the upper left side on your dashboard canvas. If a widget is already added to the dashboard, you cannot add the same widget to the dashboard again. For detailed information about widgets, see Managing Widgets on page 28.
To view your dashboard
1. Access Dashboards > My Dashboard from the navigation menu.
2. View your My Dashboard canvas.
Managing WidgetsThe Dashboard is highly customizable with widgets and data of your selection. The Widgets link allows you to view and add existing widgets to your dashboard, create new widgets, edit existing widgets settings, or remove widgets from the system.
• The widget list is only populated by reports. Therefore, you must save a report before you can create a widget.
• Imported Compliance Suites are templates and not reports. Hence, you need to save one in order to populate in the Widget list.
• Widgets show data from time periods as specified (Once every few hours, Once a day, Once a week, and Once a month). The widget data is refreshed after the time period has completely passed. For example: If you specify Once a day time frame, and feed data at 2:17pm, the widget data will be refreshed after midnight. Similarly, if you specify Once a week time frame, then the widget data will be refreshed after Sunday midnight.
• Widget report is always executed according to its schedule. Only when a widget is first created, and added to dashboard, the widget report executes outside the schedule. Therefore, If you wish to modify a widget report schedule, first delete the widget, and then re-create a new widget with new schedule.
The NAS/SAN Disk Usage widget will display only on the ST appliance.
TIBCO LogLogic® Log Management Intelligence (LMI) User Guide
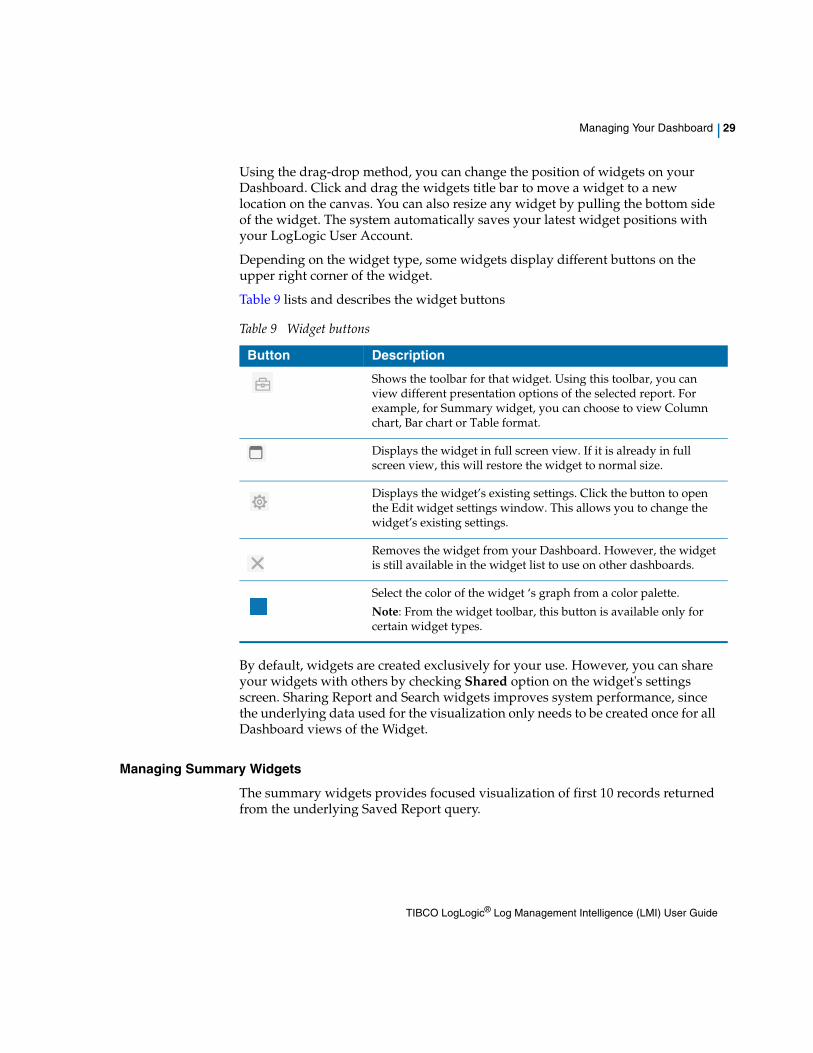
Managing Your Dashboard | 29
Using the drag-drop method, you can change the position of widgets on your Dashboard. Click and drag the widgets title bar to move a widget to a new location on the canvas. You can also resize any widget by pulling the bottom side of the widget. The system automatically saves your latest widget positions with your LogLogic User Account.
Depending on the widget type, some widgets display different buttons on the upper right corner of the widget.
Table 9 lists and describes the widget buttons
By default, widgets are created exclusively for your use. However, you can share your widgets with others by checking Shared option on the widget's settings screen. Sharing Report and Search widgets improves system performance, since the underlying data used for the visualization only needs to be created once for all Dashboard views of the Widget.
Managing Summary Widgets
The summary widgets provides focused visualization of first 10 records returned from the underlying Saved Report query.
Table 9 Widget buttons
Button Description
Shows the toolbar for that widget. Using this toolbar, you can view different presentation options of the selected report. For example, for Summary widget, you can choose to view Column chart, Bar chart or Table format.
Displays the widget in full screen view. If it is already in full screen view, this will restore the widget to normal size.
Displays the widget’s existing settings. Click the button to open the Edit widget settings window. This allows you to change the widget’s existing settings.
Removes the widget from your Dashboard. However, the widget is still available in the widget list to use on other dashboards.
Select the color of the widget ‘s graph from a color palette.
Note: From the widget toolbar, this button is available only for certain widget types.
TIBCO LogLogic® Log Management Intelligence (LMI) User Guide
30 | Chapter 2 Viewing Dashboards
If you click , the report displays more view options such as Column Chart, Bar Chart, Table, Axis Label, and Drilldown. The Drilldown button takes you to the actual report page where you can run the report with the same log sources. The time frame on the widget is defined separately than the actual report’s time range. Similarly, when a widget is shared and if you don’t have similar privileges as the widget owner, you may not be able to view the same data as displayed in the widget.
For more information on other widget buttons, see Table 9 on page 29.
To add an existing summary widget to your dashboard
1. Access Dashboards > My Dashboard > Widgets from the navigation menu.
2. Click the icon to begin adding a widget. The Widgets pane appears.
3. Click the Summary icon. A list of existing summary widgets, if any, is displayed in the second pane.
4. Select the widget from the list. The widget’s settings are displayed for your review in the third pane.
5. Click Add to Dashboard to add the widget to your dashboard.
To create a new summary widget
1. Navigate to the Dashboards > My Dashboard > Widgets menu.
2. Click the icon to begin adding a widget. The Widgets pane appears.
3. Click the Summary icon. A list of existing summary widgets, if any, is displayed in the second pane.
4. Click the Create New link to create a new widget. The new widget settings pane appears.
5. Enter the Name and Description of the widget.
6. Select a report from the Report list as explained in Table 10.
If a widget is already added to the dashboard, you cannot add the same widget to the dashboard again.
To create a summary widget, you must have the Reporting privileges. For more information about privileges, see Managing Users in the TIBCO LogLogic® Log Management Intelligence (LMI) Administration Guide
TIBCO LogLogic® Log Management Intelligence (LMI) User Guide
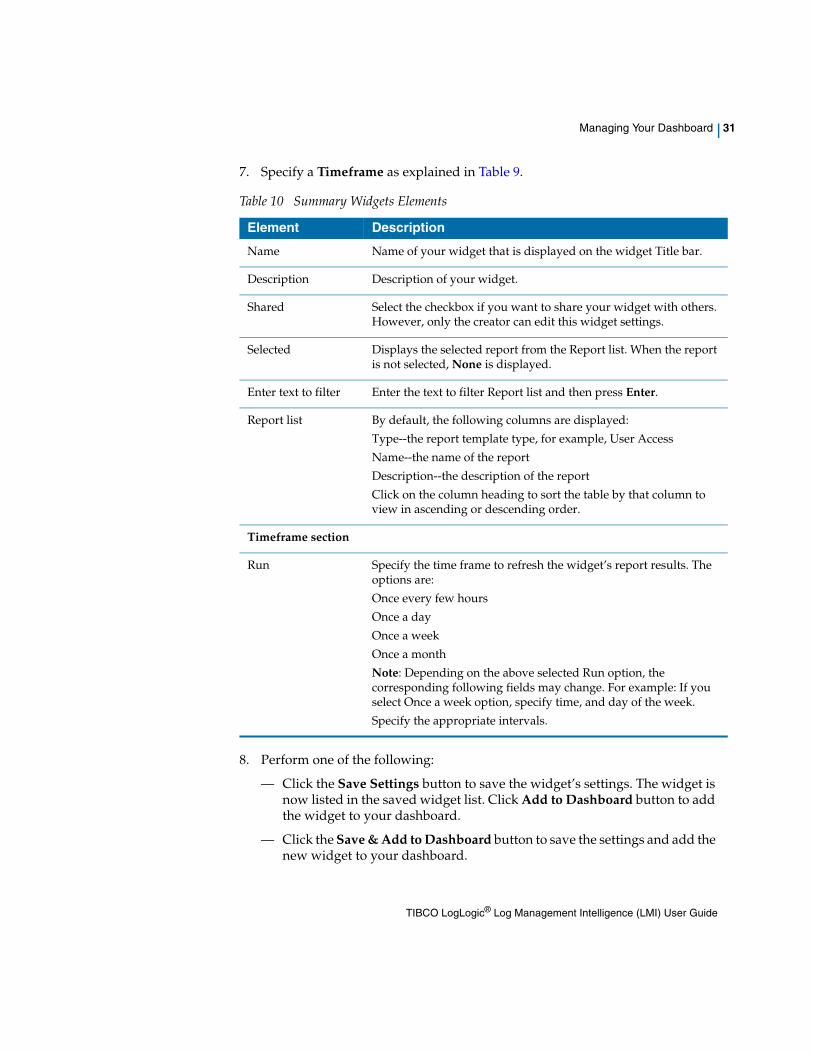
Managing Your Dashboard | 31
7. Specify a Timeframe as explained in Table 9.
8. Perform one of the following:
— Click the Save Settings button to save the widget’s settings. The widget is now listed in the saved widget list. Click Add to Dashboard button to add the widget to your dashboard.
— Click the Save & Add to Dashboard button to save the settings and add the new widget to your dashboard.
Table 10 Summary Widgets Elements
Element Description
Name Name of your widget that is displayed on the widget Title bar.
Description Description of your widget.
Shared Select the checkbox if you want to share your widget with others. However, only the creator can edit this widget settings.
Selected Displays the selected report from the Report list. When the report is not selected, None is displayed.
Enter text to filter Enter the text to filter Report list and then press Enter.
Report list By default, the following columns are displayed:
Type--the report template type, for example, User Access
Name--the name of the report
Description--the description of the report
Click on the column heading to sort the table by that column to view in ascending or descending order.
Timeframe section
Run Specify the time frame to refresh the widget’s report results. The options are:
Once every few hours
Once a day
Once a week
Once a month
Note: Depending on the above selected Run option, the corresponding following fields may change. For example: If you select Once a week option, specify time, and day of the week.
Specify the appropriate intervals.
TIBCO LogLogic® Log Management Intelligence (LMI) User Guide
32 | Chapter 2 Viewing Dashboards
To edit an existing summary widget’s settings
1. Select a widget from the saved widget list.
2. Make the appropriate changes.
3. Click the Save Settings button to save the new settings.
Managing Trend Widgets
The Trend widget displays a trend of Index Search “hits” occurring over a period of 1 day, 1 week or 1 month.
If you click , the report displays more view options such as Column Chart, Line Chart, and Drilldown. The Drilldown button takes you to the actual report page where you can run the report with the same log sources. The time frame on the widget is defined separately than the actual report’s time range. Similarly, when a widget is shared and if you don’t have similar privileges as the widget owner, you may not be able to view the same data as displayed in the widget.
For more information on other widget buttons, see Table 9 on page 29.
Only the creator of the widget can edit that widget’s settings.
The Save & Add to Dashboard button is available only when the widget is not on your dashboard.
TIBCO LogLogic® Log Management Intelligence (LMI) User Guide
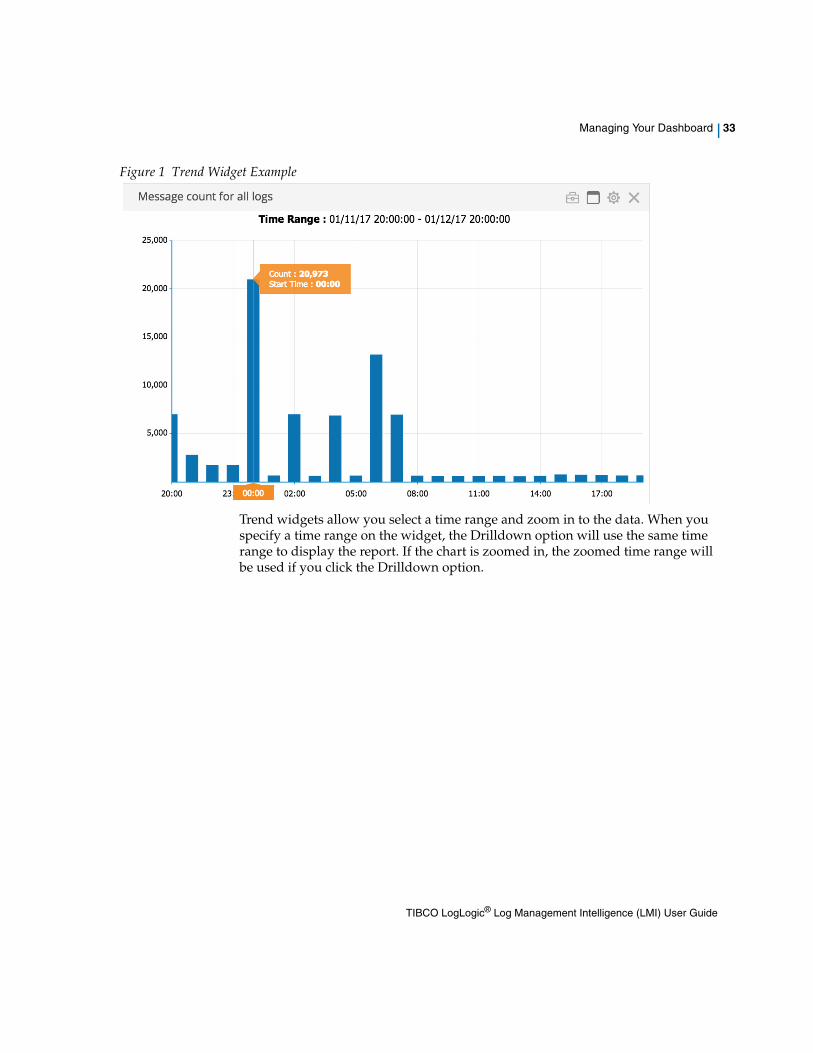
Managing Your Dashboard | 33
Figure 1 Trend Widget Example
Trend widgets allow you select a time range and zoom in to the data. When you specify a time range on the widget, the Drilldown option will use the same time range to display the report. If the chart is zoomed in, the zoomed time range will be used if you click the Drilldown option.
TIBCO LogLogic® Log Management Intelligence (LMI) User Guide
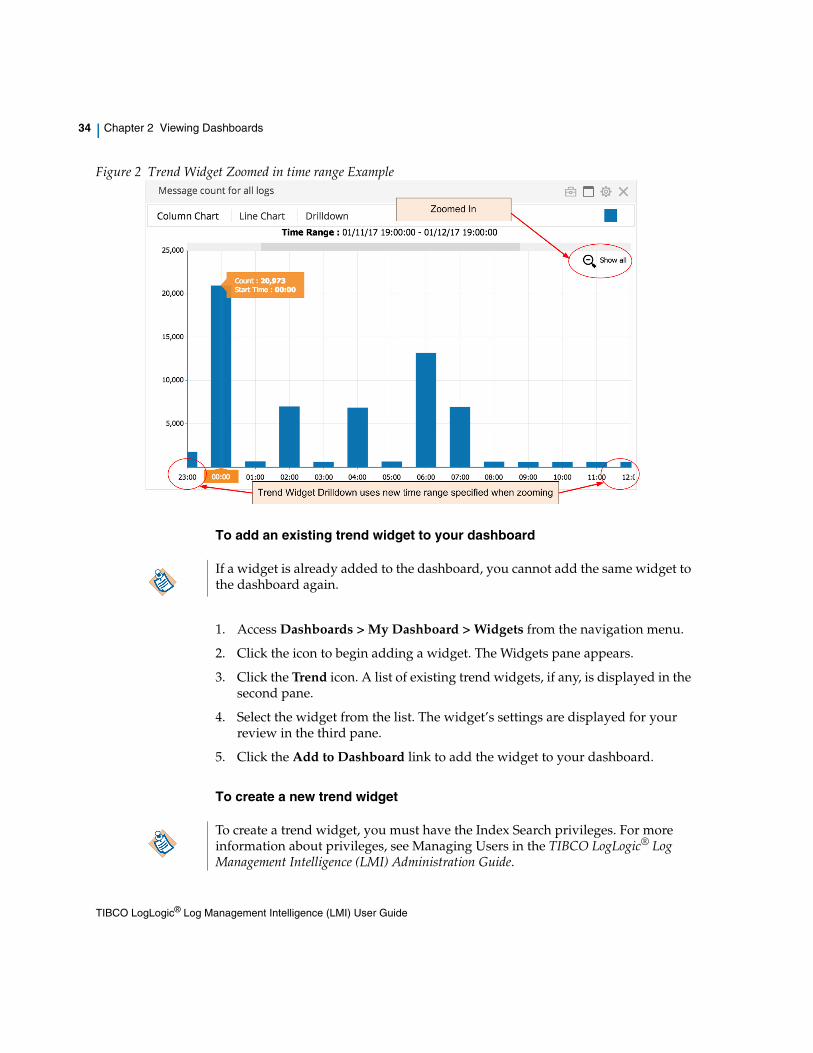
34 | Chapter 2 Viewing Dashboards
Figure 2 Trend Widget Zoomed in time range Example
To add an existing trend widget to your dashboard
1. Access Dashboards > My Dashboard > Widgets from the navigation menu.
2. Click the icon to begin adding a widget. The Widgets pane appears.
3. Click the Trend icon. A list of existing trend widgets, if any, is displayed in the second pane.
4. Select the widget from the list. The widget’s settings are displayed for your review in the third pane.
5. Click the Add to Dashboard link to add the widget to your dashboard.
To create a new trend widget
If a widget is already added to the dashboard, you cannot add the same widget to the dashboard again.
To create a trend widget, you must have the Index Search privileges. For more information about privileges, see Managing Users in the TIBCO LogLogic® Log Management Intelligence (LMI) Administration Guide.
TIBCO LogLogic® Log Management Intelligence (LMI) User Guide
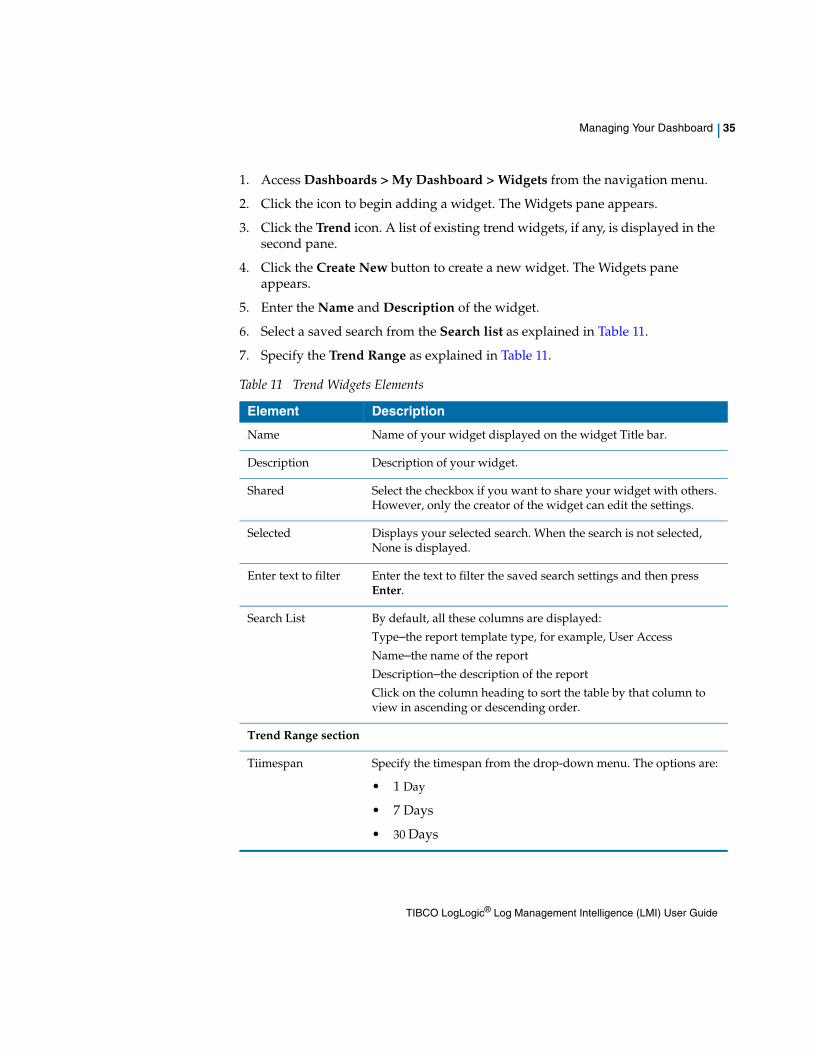
Managing Your Dashboard | 35
1. Access Dashboards > My Dashboard > Widgets from the navigation menu.
2. Click the icon to begin adding a widget. The Widgets pane appears.
3. Click the Trend icon. A list of existing trend widgets, if any, is displayed in the second pane.
4. Click the Create New button to create a new widget. The Widgets pane appears.
5. Enter the Name and Description of the widget.
6. Select a saved search from the Search list as explained in Table 11.
7. Specify the Trend Range as explained in Table 11.
Table 11 Trend Widgets Elements
Element Description
Name Name of your widget displayed on the widget Title bar.
Description Description of your widget.
Shared Select the checkbox if you want to share your widget with others. However, only the creator of the widget can edit the settings.
Selected Displays your selected search. When the search is not selected, None is displayed.
Enter text to filter Enter the text to filter the saved search settings and then press Enter.
Search List By default, all these columns are displayed:
Type–the report template type, for example, User Access
Name–the name of the report
Description–the description of the report
Click on the column heading to sort the table by that column to view in ascending or descending order.
Trend Range section
Tiimespan Specify the timespan from the drop-down menu. The options are:
• 1 Day
• 7 Days
• 30 Days
TIBCO LogLogic® Log Management Intelligence (LMI) User Guide
36 | Chapter 2 Viewing Dashboards
8. Perform one of the following:
— Click the Save Settings button to save the widget’s settings. The widget is now listed in the saved widget list. Click Add to Dashboard button to add the widget to your dashboard.
— Click the Save & Add to Dashboard button to save the settings and add the new widget to your dashboard.
To edit an existing trend widget’s settings
1. Select a widget from the saved widget list.
2. Make the appropriate changes.
3. Click the Save Settings button to save the new settings.
Managing Alert Widgets
The Alert widget displays recent triggered alerts matching your specified filters.
If you click , the report displays more view options such as Enable, and Disable. For more information on other widget buttons, see Table 9 on page 29.
To add an existing alert widget to your dashboard
1. Access Dashboards > My Dashboard > Widgets from the navigation menu.
2. Click the icon to begin adding a widget. The Widgets pane appears.
3. Click the Alerts icon. A list of existing alert widgets, if any, is displayed in the second pane.
4. Select the widget from the list. The widget’s settings are displayed for your review in the third pane.
5. Click the Add to Dashboard link to add the widget to your dashboard.
Only the creator of the widget can edit that widget’s settings.
The Save & Add to Dashboard button is available only when the widget is not on your dashboard.
If a widget is already added to the dashboard, you cannot add the same widget to the dashboard again.
TIBCO LogLogic® Log Management Intelligence (LMI) User Guide
Managing Your Dashboard | 37
To create a new alert widget
1. Access Dashboards > My Dashboard > Widgets from the navigation menu.
2. Click the icon to begin adding a widget. The Widgets pane appears.
3. Click the Alerts icon. A list of existing alert widgets, if any, is displayed in the second pane.
4. Click the Create New button to create a new widget. The Widgets pane appears.
5. Enter the Name and Description of the widget.
6. Specify how to show alerts based on Type & Priority or Custom selection as explained in Table 12.
7. Specify number of alerts from the Show most recent list as explained in Table 12.
To create an alert widget, you must have the Manage Alerts privileges. For more information about privileges, see Managing Users in the TIBCO LogLogic® Log Management Intelligence (LMI) Administration Guide.
Table 12 Alerts Widgets Elements
Element Description
Name Specify the name of your widget displayed on the widget Title bar.
Description Specify the description of your widget.
Shared Select the checkbox if you want to share this widget with others. However, only the creator can edit this widget settings.
Only show section
Type & Priority Select this option to specify the type of system and priority. Click the checkbox to select the priority level.
Custom Selection Select this option to specify alerts from the existing list.
Selected Once you select the alert rule from the Available list, it appears under this column.
Available Displays list of available alert rules. Select the alert by clicking the appropriate alert rule name (or names). This allows you define certain triggered alerts on your dashboard.
TIBCO LogLogic® Log Management Intelligence (LMI) User Guide
38 | Chapter 2 Viewing Dashboards
8. Perform one of the following:
— Click the Save Settings button to save the widget’s settings. The widget is now listed in the saved widget list. Click the Add to Dashboard button to add the widget to your dashboard.
— Click the Save & Add to Dashboard button to save and add the new widget to your dashboard.
To edit an existing alert widget’s settings
1. Select a widget from the saved widget list.
2. Make the appropriate changes.
3. Click the Save Settings button to save the new settings..
Managing System Widgets
The System widget displays four pre-defined widgets: Network-based Data Ingest, File-based Data Ingest, Disk Usage, and CPU.
For more information on widget buttons, see Table 9 on page 29.
If you click the Show Toolbar button, the report displays more view options such as Hour range from 2 Hr, 6 Hr, and 12 Hr. For more information on other widget buttons, see Table 9 on page 29.
Show most recent Specify how many alerts to be displayed in the widget. The options are:
• 10 Alerts
• 25 Alerts
• 50 Alerts
• 100 Alerts
Table 12 Alerts Widgets Elements (Cont’d)
Element Description
Only the creator of the widget can edit that widget’s settings.
The Save & Add to Dashboard button is available only when the widget is not already on your Dashboard.
TIBCO LogLogic® Log Management Intelligence (LMI) User Guide
Managing Your Dashboard | 39
To add a system widget to your dashboard
1. Access Dashboards > My Dashboard > Widgets from the navigation menu.
2. Click the icon to begin adding a widget. The Widgets pane appears.
3. Click the System icon. The pre-defined widgets are displayed in the second pane.
4. Move your mouse over the widget name from the list of pre-defined widgets, to view the details in the pop-up window.
5. Click the Add to Dashboard button. The widget is added to your dashboard. .
Defining your Dashboard Canvas SettingsYou can specify the number and size of columns on your Dashboard canvas.
To define your dashboard canvas settings
1. Access Dashboards > My Dashboard from the navigation menu.
2. Click the icon . The Edit dashboard settings window appears.
3. Specify the number of columns from the column layout options: One Column, Two Columns, or Three Columns.
4. If you select two or three columns, specify the width of the column by dragging the slider to the desired width.
5. You can preview your column settings in the Preview window.
6. Click Save Settings to save your Dashboard settings. The widgets on your Dashboard are rearranged as per the new Dashboard settings.
If a widget is already added to the dashboard, you cannot add the same widget to the Dashboard again.
TIBCO LogLogic® Log Management Intelligence (LMI) User Guide

40 | Chapter 2 Viewing Dashboards
TIBCO LogLogic® Log Management Intelligence (LMI) User Guide
Viewing Real Time Log Messages | 41
Chapter 3 Viewing Real Time Log Messages
The Real Time Viewer provides a scrolling display of log messages from all log sources as the appliance receives them. You can either filter messages or view all log messages unfiltered as they arrive.
Real Time Viewer displays log messages only for syslog log sources, not for file transfer or database log source types (including log messages forwarded using LogLogic TCP).
Topics
• Accessing and Selecting Real Time Messages to View on page 42
• Viewing Log Messages in Real Time on page 46
• Java Security Settings on page 47
TIBCO LogLogic® Log Management Intelligence (LMI) User Guide
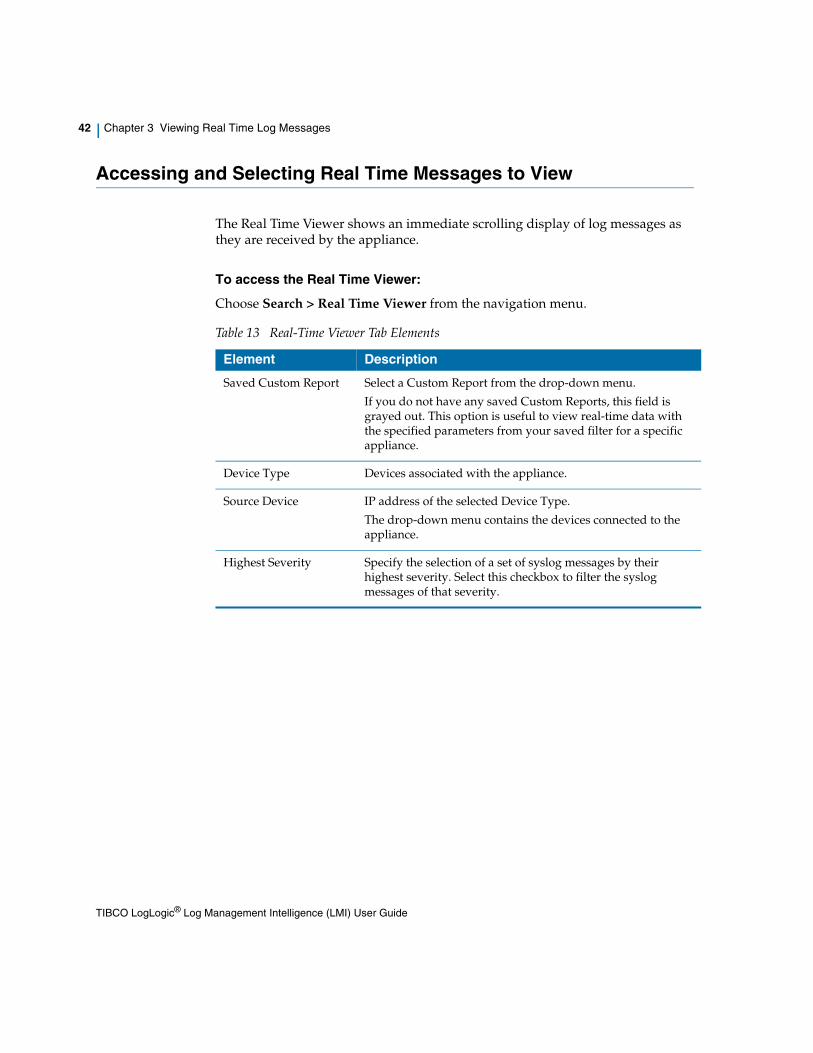
42 | Chapter 3 Viewing Real Time Log Messages
Accessing and Selecting Real Time Messages to View
The Real Time Viewer shows an immediate scrolling display of log messages as they are received by the appliance.
To access the Real Time Viewer:
Choose Search > Real Time Viewer from the navigation menu.
Table 13 Real-Time Viewer Tab Elements
Element Description
Saved Custom Report Select a Custom Report from the drop-down menu.
If you do not have any saved Custom Reports, this field is grayed out. This option is useful to view real-time data with the specified parameters from your saved filter for a specific appliance.
Device Type Devices associated with the appliance.
Source Device IP address of the selected Device Type.
The drop-down menu contains the devices connected to the appliance.
Highest Severity Specify the selection of a set of syslog messages by their highest severity. Select this checkbox to filter the syslog messages of that severity.
TIBCO LogLogic® Log Management Intelligence (LMI) User Guide
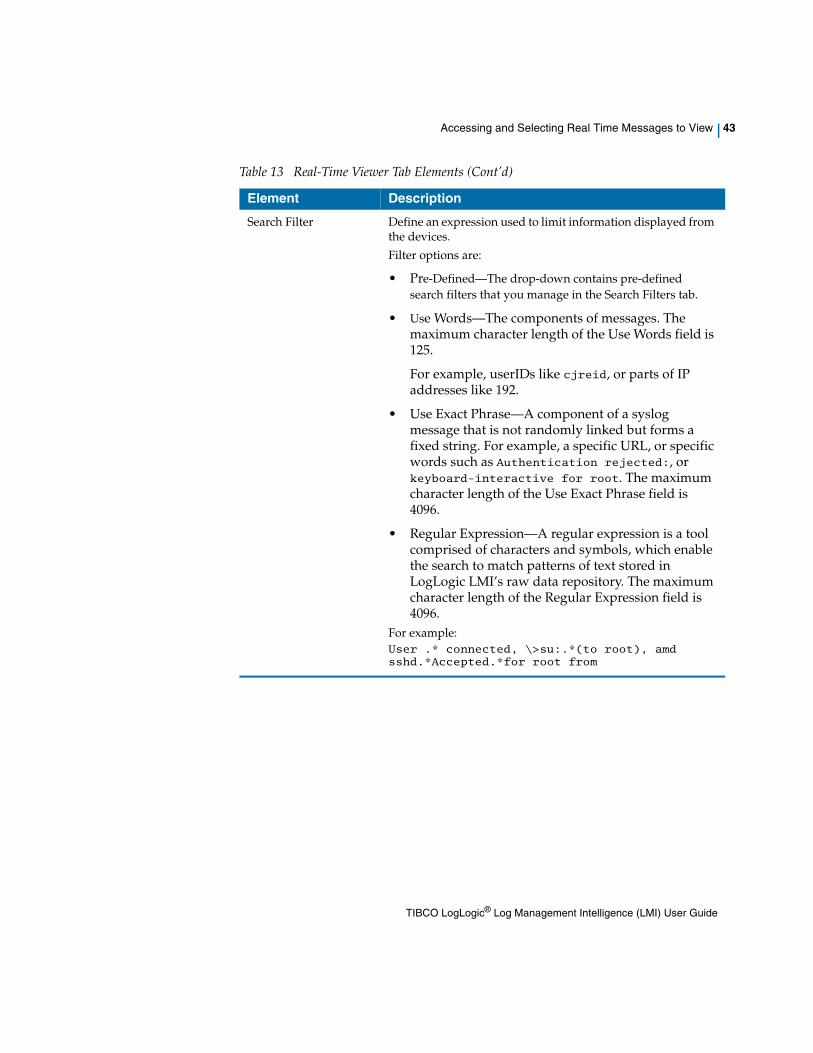
Accessing and Selecting Real Time Messages to View | 43
Search Filter Define an expression used to limit information displayed from the devices.
Filter options are:
• Pre-Defined—The drop-down contains pre-defined search filters that you manage in the Search Filters tab.
• Use Words—The components of messages. The maximum character length of the Use Words field is 125.
For example, userIDs like cjreid, or parts of IP addresses like 192.
• Use Exact Phrase—A component of a syslog message that is not randomly linked but forms a fixed string. For example, a specific URL, or specific words such as Authentication rejected:, or keyboard-interactive for root. The maximum character length of the Use Exact Phrase field is 4096.
• Regular Expression—A regular expression is a tool comprised of characters and symbols, which enable the search to match patterns of text stored in LogLogic LMI’s raw data repository. The maximum character length of the Regular Expression field is 4096.
For example:User .* connected, \>su:.*(to root), amd sshd.*Accepted.*for root from
Table 13 Real-Time Viewer Tab Elements (Cont’d)
Element Description
TIBCO LogLogic® Log Management Intelligence (LMI) User Guide
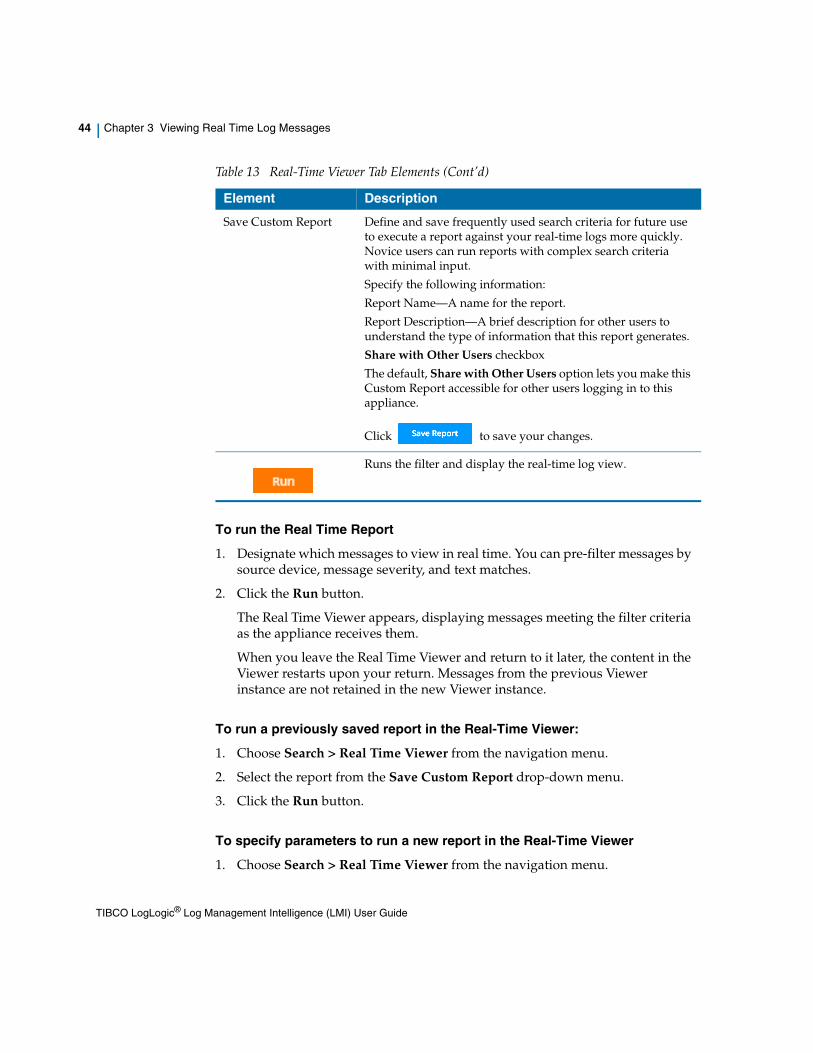
44 | Chapter 3 Viewing Real Time Log Messages
To run the Real Time Report
1. Designate which messages to view in real time. You can pre-filter messages by source device, message severity, and text matches.
2. Click the Run button.
The Real Time Viewer appears, displaying messages meeting the filter criteria as the appliance receives them.
When you leave the Real Time Viewer and return to it later, the content in the Viewer restarts upon your return. Messages from the previous Viewer instance are not retained in the new Viewer instance.
To run a previously saved report in the Real-Time Viewer:
1. Choose Search > Real Time Viewer from the navigation menu.
2. Select the report from the Save Custom Report drop-down menu.
3. Click the Run button.
To specify parameters to run a new report in the Real-Time Viewer
1. Choose Search > Real Time Viewer from the navigation menu.
Save Custom Report Define and save frequently used search criteria for future use to execute a report against your real-time logs more quickly. Novice users can run reports with complex search criteria with minimal input.
Specify the following information:
Report Name—A name for the report.
Report Description—A brief description for other users to understand the type of information that this report generates.
Share with Other Users checkbox
The default, Share with Other Users option lets you make this Custom Report accessible for other users logging in to this appliance.
Click to save your changes.
Runs the filter and display the real-time log view.
Table 13 Real-Time Viewer Tab Elements (Cont’d)
Element Description
TIBCO LogLogic® Log Management Intelligence (LMI) User Guide
Accessing and Selecting Real Time Messages to View | 45
2. Select the device type.
3. Select the source device connected to your appliance.
4. Choose the severity level. To specify the highest level, check the Highest Severity checkbox.
5. Type your search criteria to limit information displayed from the device(s).
6. Click the Run button.
To save a Custom Report in the Real-Time Viewer
After specifying the parameters for your report, save the report:
1. Click to expand the Save Custom Report section.
2. Type a name for your report and provide a brief description.
3. If you do not plan to share the report with other users logging in to the appliance, uncheck the Share with Other Users checkbox. By default, this checkbox is selected.
4. Click the Save Report button to save your changes.
TIBCO LogLogic® Log Management Intelligence (LMI) User Guide
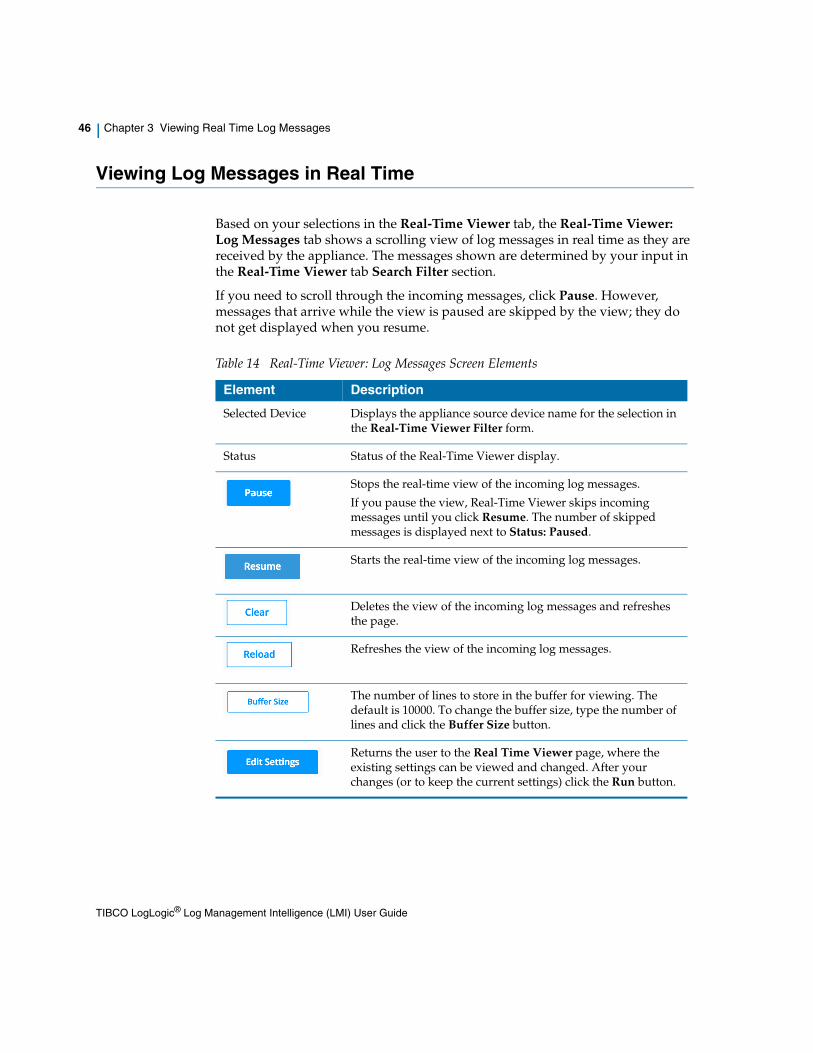
46 | Chapter 3 Viewing Real Time Log Messages
Viewing Log Messages in Real Time
Based on your selections in the Real-Time Viewer tab, the Real-Time Viewer: Log Messages tab shows a scrolling view of log messages in real time as they are received by the appliance. The messages shown are determined by your input in the Real-Time Viewer tab Search Filter section.
If you need to scroll through the incoming messages, click Pause. However, messages that arrive while the view is paused are skipped by the view; they do not get displayed when you resume.
Table 14 Real-Time Viewer: Log Messages Screen Elements
Element Description
Selected Device Displays the appliance source device name for the selection in the Real-Time Viewer Filter form.
Status Status of the Real-Time Viewer display.
Stops the real-time view of the incoming log messages.
If you pause the view, Real-Time Viewer skips incoming messages until you click Resume. The number of skipped messages is displayed next to Status: Paused.
Starts the real-time view of the incoming log messages.
Deletes the view of the incoming log messages and refreshes the page.
Refreshes the view of the incoming log messages.
The number of lines to store in the buffer for viewing. The default is 10000. To change the buffer size, type the number of lines and click the Buffer Size button.
Returns the user to the Real Time Viewer page, where the existing settings can be viewed and changed. After your changes (or to keep the current settings) click the Run button.
TIBCO LogLogic® Log Management Intelligence (LMI) User Guide
Java Security Settings | 47
Java Security Settings
After updating your version of Java, use one of the following procedures to allow the Real Timer Viewer to be launched successfully. If these steps are not followed when you run the Real Time Viewer after a Java update, its status remains as “waiting for connection”.
1. On your Windows system, from Start > Control Panel select Java (64-bit).
2. In the Java Control Panel window ,select the Security tab.
3. Click the Edit Site List button, enter your LMI IP Address, and save. You can use either IPv4 or IPv6 address.
The LMI is added to the exception site list and when you run the Real Time Viewer the status will be Connection Established.
If Java (64-bit) doesn't exist then, perform the following steps:
1. On your Windows system, from Start > Control Panel select Java.
2. In the Java Control Panel window select the Security tab.
3. Set the Security Level to the lowest which will allow all Java programs to run on your computer.
Modifying your Java settingsYou need to modify your Java settings for Real-Time Viewer client connections. The Real-Time Viewer uses Java applet; some versions of Java might not work. Java 1.8.0.x is recommended.
If you are running Java 1.8.0.x, add LMI to the Java 8 security exceptions to allow LMI to connect. You can use either IPv4 or IPv6 addresses. In the following example, IPv6 addresses have been used.
1. As administrator, update your file C:\Program Files
(x86)\Java\jre1.8.0_31\lib\security\java.policy and
grant the following permission to non-abbreviated IPv6 address:grant { permission java.net.SocketPermission
"fd00:0:0:0:0:aaaa:a73:1a3d", "connect,resolve";
};
You can also add permissions to both abbreviated and non-abbreviated addresses:grant { permission java.net.SocketPermission
"fd00:0:0:0:0:aaaa:a73:1a3d", "connect,resolve";
};
TIBCO LogLogic® Log Management Intelligence (LMI) User Guide
48 | Chapter 3 Viewing Real Time Log Messages
grant { permission java.net.SocketPermission
"fd00::aaaa:a73:1a3d", "connect,resolve"; };
The IP address should be replaced with the IP address of your appliance.
2. In Control Panel > java > Security add the following to the exception list:https://[fd00::aaaa:a73:1a3d]:443, where
"fd00::aaaa:a73:1a3d” is your appliance IP
https://[fd00:0:0:0:0:aaaa:a73:1a3d]:443, where
"fd00:0:0:0:0:aaaa:a73:1a3d” is the
non-abbreviated version for your appliance IP
The appliance IP address can be either IPv4 or IPv6. Both are supported. If you are not sure which one to use, contact your LMI administrator.
TIBCO LogLogic® Log Management Intelligence (LMI) User Guide
Searching Collected Log Messages | 49
Chapter 4 Searching Collected Log Messages
As the appliance collects log data from your log sources, you can search on those collected log messages. In addition to running various simple and complex searches, you can define search filters and run reports.
Pre-defining search filters lets you include specific search criteria in an Index Search, a Regular Expression Search, the Real Time Viewer, and All Saved Searches without having to re-enter the filtering criteria each time.
Topics
• Search Overview on page 50
• Using Index Search on page 52
• Tag-Based Searches Using the Tag Picker Interface on page 69
• Using Regular Expression Search on page 70
• Using Search Filters on page 77
• Viewing All Saved Index Searches on page 86
• Using and Creating All Index Reports on page 87
For details on Boolean expressions, Regular Expression usage, what gets indexed, and available delimiters, see the Search Strings topic in the Online Help.
To reload and open older, compressed log data for viewing on an appliance, download and view the files on your workstation.
TIBCO LogLogic® Log Management Intelligence (LMI) User Guide
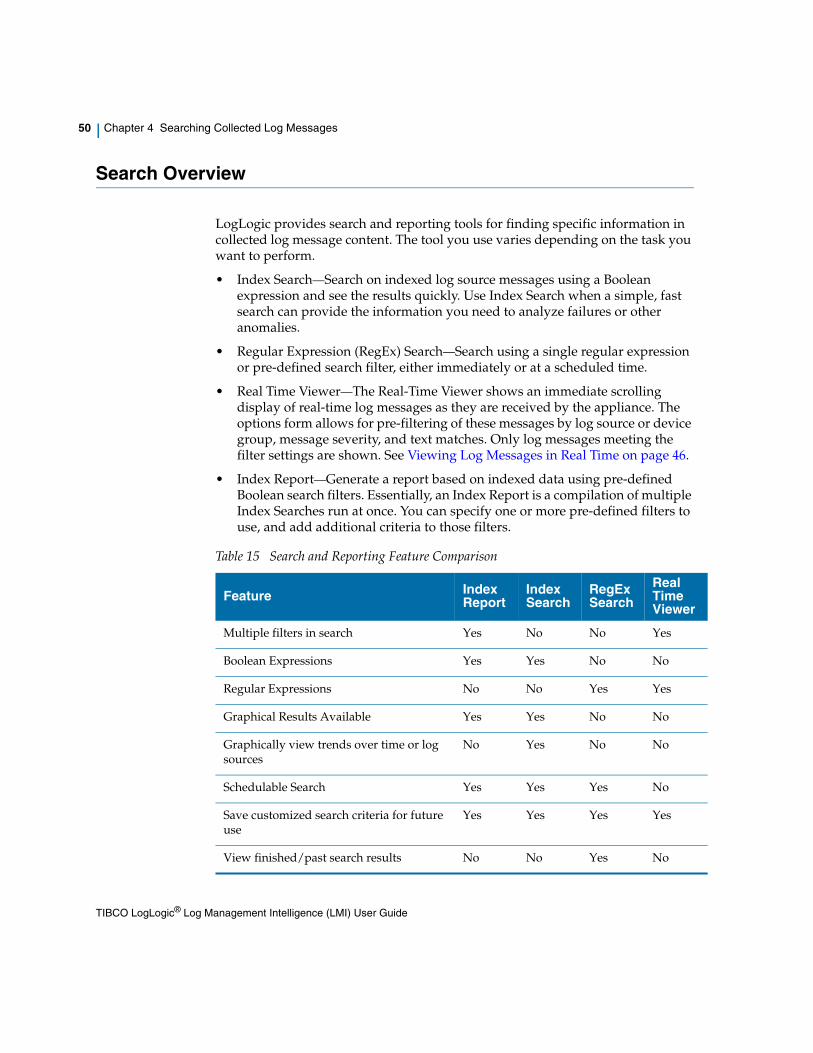
50 | Chapter 4 Searching Collected Log Messages
Search Overview
LogLogic provides search and reporting tools for finding specific information in collected log message content. The tool you use varies depending on the task you want to perform.
• Index Search—Search on indexed log source messages using a Boolean expression and see the results quickly. Use Index Search when a simple, fast search can provide the information you need to analyze failures or other anomalies.
• Regular Expression (RegEx) Search—Search using a single regular expression or pre-defined search filter, either immediately or at a scheduled time.
• Real Time Viewer—The Real-Time Viewer shows an immediate scrolling display of real-time log messages as they are received by the appliance. The options form allows for pre-filtering of these messages by log source or device group, message severity, and text matches. Only log messages meeting the filter settings are shown. See Viewing Log Messages in Real Time on page 46.
• Index Report—Generate a report based on indexed data using pre-defined Boolean search filters. Essentially, an Index Report is a compilation of multiple Index Searches run at once. You can specify one or more pre-defined filters to use, and add additional criteria to those filters.
Table 15 Search and Reporting Feature Comparison
Feature Index Report
Index Search
RegEx Search
Real Time Viewer
Multiple filters in search Yes No No Yes
Boolean Expressions Yes Yes No No
Regular Expressions No No Yes Yes
Graphical Results Available Yes Yes No No
Graphically view trends over time or log sources
No Yes No No
Schedulable Search Yes Yes Yes No
Save customized search criteria for future use
Yes Yes Yes Yes
View finished/past search results No No Yes No
TIBCO LogLogic® Log Management Intelligence (LMI) User Guide

Search Overview | 51
For a simple search to match a specific string, use Index Search. To search for strings that match more complex patterns, use RegEx Search.
TIBCO LogLogic® Log Management Intelligence (LMI) User Guide
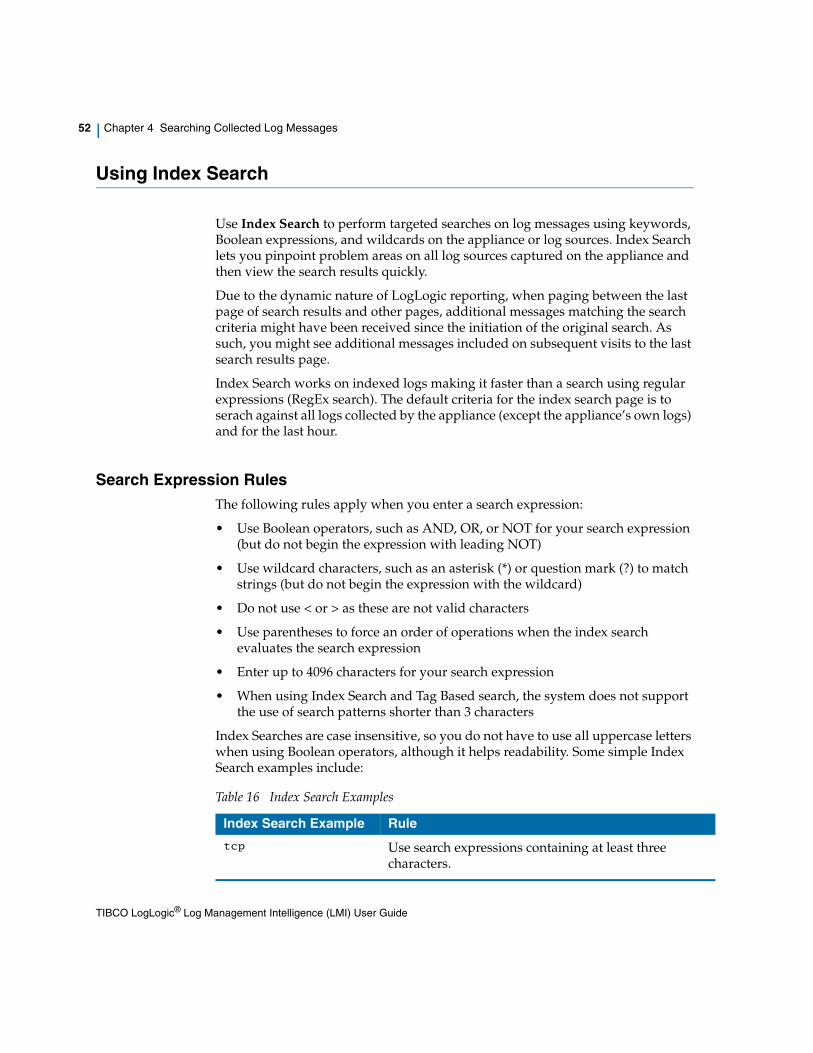
52 | Chapter 4 Searching Collected Log Messages
Using Index Search
Use Index Search to perform targeted searches on log messages using keywords, Boolean expressions, and wildcards on the appliance or log sources. Index Search lets you pinpoint problem areas on all log sources captured on the appliance and then view the search results quickly.
Due to the dynamic nature of LogLogic reporting, when paging between the last page of search results and other pages, additional messages matching the search criteria might have been received since the initiation of the original search. As such, you might see additional messages included on subsequent visits to the last search results page.
Index Search works on indexed logs making it faster than a search using regular expressions (RegEx search). The default criteria for the index search page is to serach against all logs collected by the appliance (except the appliance’s own logs) and for the last hour.
Search Expression RulesThe following rules apply when you enter a search expression:
• Use Boolean operators, such as AND, OR, or NOT for your search expression (but do not begin the expression with leading NOT)
• Use wildcard characters, such as an asterisk (*) or question mark (?) to match strings (but do not begin the expression with the wildcard)
• Do not use < or > as these are not valid characters
• Use parentheses to force an order of operations when the index search evaluates the search expression
• Enter up to 4096 characters for your search expression
• When using Index Search and Tag Based search, the system does not support the use of search patterns shorter than 3 characters
Index Searches are case insensitive, so you do not have to use all uppercase letters when using Boolean operators, although it helps readability. Some simple Index Search examples include:
Table 16 Index Search Examples
Index Search Example Rule
tcp Use search expressions containing at least three characters.
TIBCO LogLogic® Log Management Intelligence (LMI) User Guide
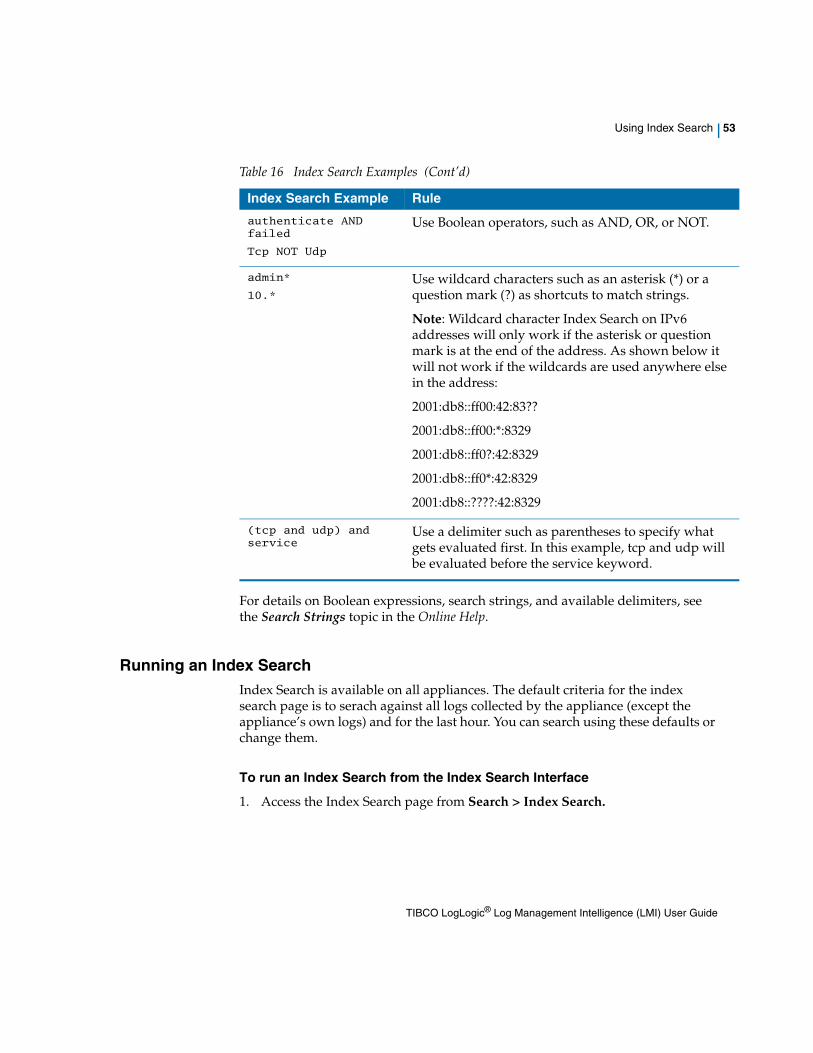
Using Index Search | 53
For details on Boolean expressions, search strings, and available delimiters, see the Search Strings topic in the Online Help.
Running an Index SearchIndex Search is available on all appliances. The default criteria for the index search page is to serach against all logs collected by the appliance (except the appliance’s own logs) and for the last hour. You can search using these defaults or change them.
To run an Index Search from the Index Search Interface
1. Access the Index Search page from Search > Index Search.
authenticate AND failed
Tcp NOT Udp
Use Boolean operators, such as AND, OR, or NOT.
admin*
10.*
Use wildcard characters such as an asterisk (*) or a question mark (?) as shortcuts to match strings.
Note: Wildcard character Index Search on IPv6 addresses will only work if the asterisk or question mark is at the end of the address. As shown below it will not work if the wildcards are used anywhere else in the address:
2001:db8::ff00:42:83??
2001:db8::ff00:*:8329
2001:db8::ff0?:42:8329
2001:db8::ff0*:42:8329
2001:db8::????:42:8329
(tcp and udp) and service
Use a delimiter such as parentheses to specify what gets evaluated first. In this example, tcp and udp will be evaluated before the service keyword.
Table 16 Index Search Examples (Cont’d)
Index Search Example Rule
TIBCO LogLogic® Log Management Intelligence (LMI) User Guide
54 | Chapter 4 Searching Collected Log Messages
2. Enter your search expression in the search text box and click the Run button.
If you want, you can adjust the search scope and rerun the search by selecting specific log sources and/or a different timeframe.
Selecting Specific Log Sources
To perform a more targeted search, you can narrow the search scope to a group of log sources, such as all firewall interfaces, all routers, all General Syslog, Microsoft sources, other UNIX, or LogLogic appliances.
The default rule is set as All Sources except LogLogic. This includes all logs except LogLogic appliance logs. You can add any individual and/or group of non-LogLogic sources to this rule. However, if you specify any other log source, other than LogLogic source, the default rule will be removed from the filter list (from the left pane) and the new log source is added. This enhancement applies to only system-defined groups and not the user-defined groups. For example, if you select a user-defined group that only includes LogLogic source, then the default rule will be removed.
On the Management Station, you can select from one managed appliance or all appliances, or particular groups of appliances (for example, all LX appliances or all ST appliances) on which to run the search. The Choose Device pop-up automatically populates the log sources included on all defined groups.
To run a targeted Index Search
1. Click the All Sources except LogLogic button to open the Select Source(s) window.
Do not use < or > in your search expression as these are not valid characters.
When appliance selection is “All”, “All LX/MX”, or “All ST”, only system defined groups (e.g. All Cisco PIX) and user defined global groups that reside on the management station will be displayed.
TIBCO LogLogic® Log Management Intelligence (LMI) User Guide
Using Index Search | 55
2. Select log sources from the Add Log Sources pane. You can select sources by appliance, and filter by Name, Collector Domain, IP Address, Group or Type.
a. If you picked “Name”, enter a Source Name, a specific Device Name or a Name Mask. Wild cards are accepted in this field.
b. If you picked "Collector Domain", enter the name of the Collector Domain. This is the name used to identify each message sent from a specific device.
c. If you picked “IP Address”, enter a Source IP Address, a specific IP Address or an IP Address Mask. Wild cards are accepted in this field.
d. If you picked “Group”, enter a Group Name, or click the down arrow to the right of the text field and select “All” or one of the other Group names displayed in the drop-down box.
e. If you picked “Type”, enter a Source Type (a specific device type), or click the down arrow to the right of the text field and select “All” or one of the other Device Types displayed in the drop-down box.
3. To create a rule, first filter by Name or Type to retrieve the list of devices. Then click << Add filters as a rule. This creates a dynamic rule containing all listed devices, on the right pane.
4. Enter a name for the dynamic rule in the pop-up window and click OK.
5. Click on the sources you want in your report and then click << Add selected log sources to add the selected devices and filters to the left-hand pane.
6. Click Set. The new Index Report search selection appears in the Sources row. The Index Search Sources field displays the newly added log sources.
Select Time Frame for an Index Search
To select time frame for an Index Search
1. Click the calendar icon (to the right of Last Hour) to launch the Date and Time Range Picker.
2. Select a preset time interval by clicking the down arrow to the right of Last Hour, or pick a timeframe from the pop-up calendar. Click Set.
3. Click Run.
4. At the Search pop-up, select whether you want to retrieve all messages. Click Yes. After a few moments, the Index Search results will be displayed.
When adding a large number of devices, create a dynamic rule that contains all listed devices.
TIBCO LogLogic® Log Management Intelligence (LMI) User Guide
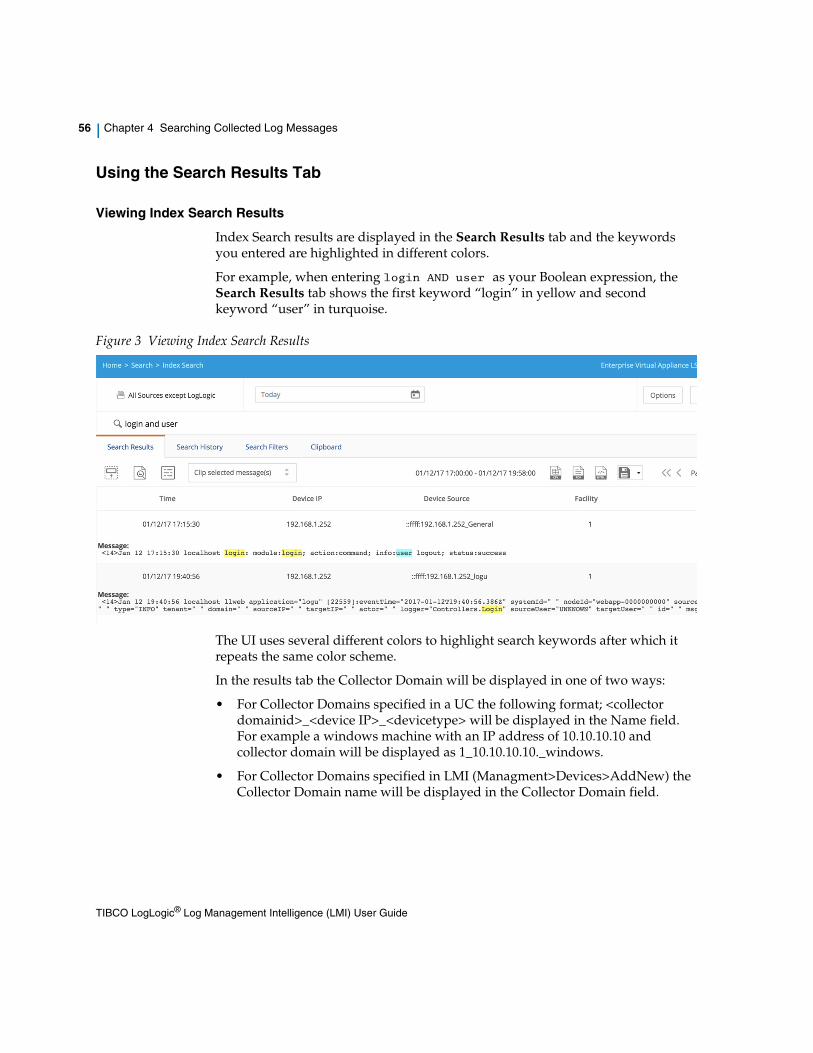
56 | Chapter 4 Searching Collected Log Messages
Using the Search Results Tab
Viewing Index Search Results
Index Search results are displayed in the Search Results tab and the keywords you entered are highlighted in different colors.
For example, when entering login AND user as your Boolean expression, the Search Results tab shows the first keyword “login” in yellow and second keyword “user” in turquoise.
Figure 3 Viewing Index Search Results
The UI uses several different colors to highlight search keywords after which it repeats the same color scheme.
In the results tab the Collector Domain will be displayed in one of two ways:
• For Collector Domains specified in a UC the following format; <collector domainid>_<device IP>_<devicetype> will be displayed in the Name field. For example a windows machine with an IP address of 10.10.10.10 and collector domain will be displayed as 1_10.10.10.10._windows.
• For Collector Domains specified in LMI (Managment>Devices>AddNew) the Collector Domain name will be displayed in the Collector Domain field.
TIBCO LogLogic® Log Management Intelligence (LMI) User Guide
Using Index Search | 57
To view search results using different view options
1. From the top right of the Index Search screen, click the View drop-down menu to open different view options. The options are: Reset to Default, Show Timeline, Hide Meta Header, View by, Chart Type.
2. The Search Results view options are:
Configuring Search Results Settings
To configure Search Results settings
1. From the top right of the Index Search page, click the Options button. The Columns and Grouping window appears as shown below.
2. Optionally, enter a filter keyword in the Keyword field to narrow the displayed columns in your report.
3. Select the appropriate Column Name by clicking in the checkbox to include or exclude that column from your report. You can change the column name by clicking on the name. The column name field becomes an editable field allowing you to make the changes.
4. Click or to move the selected column.
5. Choose the Display options.
Table 17 Index Report Search--View options
Element Description
Reset to Default Resets to default settings.
Show Timeline Select this checkbox to show timeline graph.
Hide Meta Header
Select this checkbox to hide the metadata header information.
View By Select the option to view by Time or Device type.
Chart Type Select the type. The options are Bar chart or Line chart.
If you enter the same column name for two columns, the Index Search Results page displays the results for those two columns merged into one column.
TIBCO LogLogic® Log Management Intelligence (LMI) User Guide
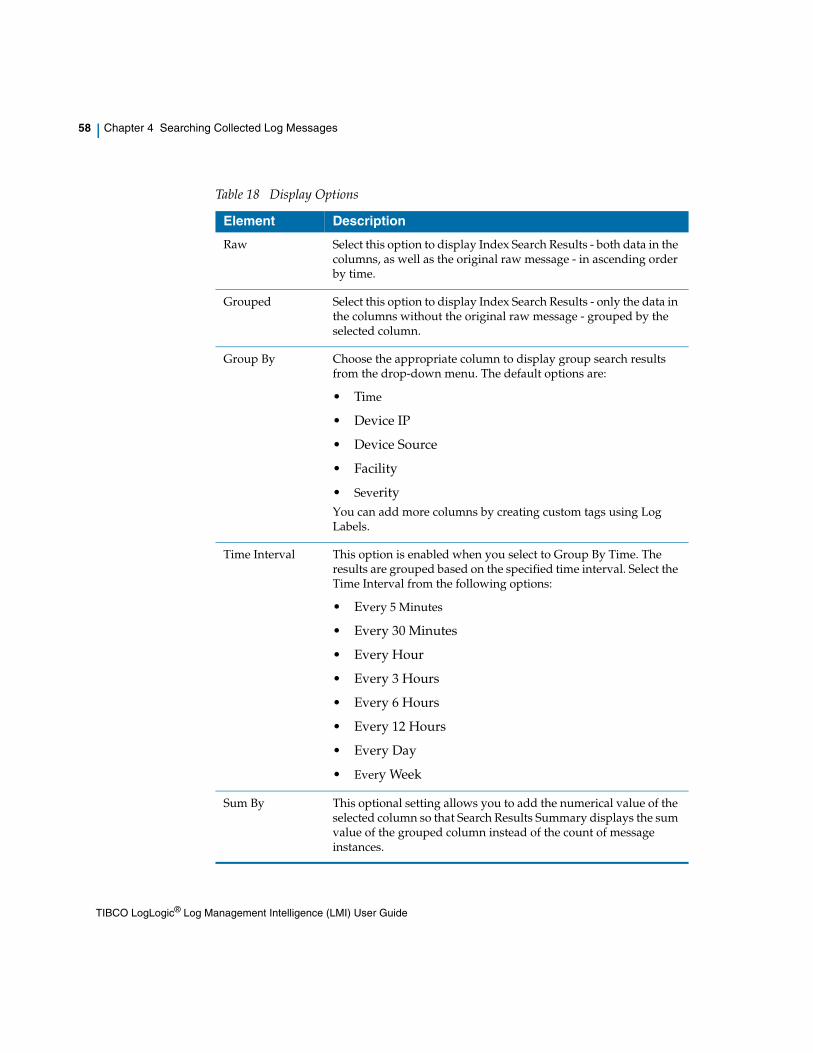
58 | Chapter 4 Searching Collected Log Messages
Table 18 Display Options
Element Description
Raw Select this option to display Index Search Results - both data in the columns, as well as the original raw message - in ascending order by time.
Grouped Select this option to display Index Search Results - only the data in the columns without the original raw message - grouped by the selected column.
Group By Choose the appropriate column to display group search results from the drop-down menu. The default options are:
• Time
• Device IP
• Device Source
• Facility
• SeverityYou can add more columns by creating custom tags using Log Labels.
Time Interval This option is enabled when you select to Group By Time. The results are grouped based on the specified time interval. Select the Time Interval from the following options:
• Every 5 Minutes
• Every 30 Minutes
• Every Hour
• Every 3 Hours
• Every 6 Hours
• Every 12 Hours
• Every Day
• Every Week
Sum By This optional setting allows you to add the numerical value of the selected column so that Search Results Summary displays the sum value of the grouped column instead of the count of message instances.
TIBCO LogLogic® Log Management Intelligence (LMI) User Guide
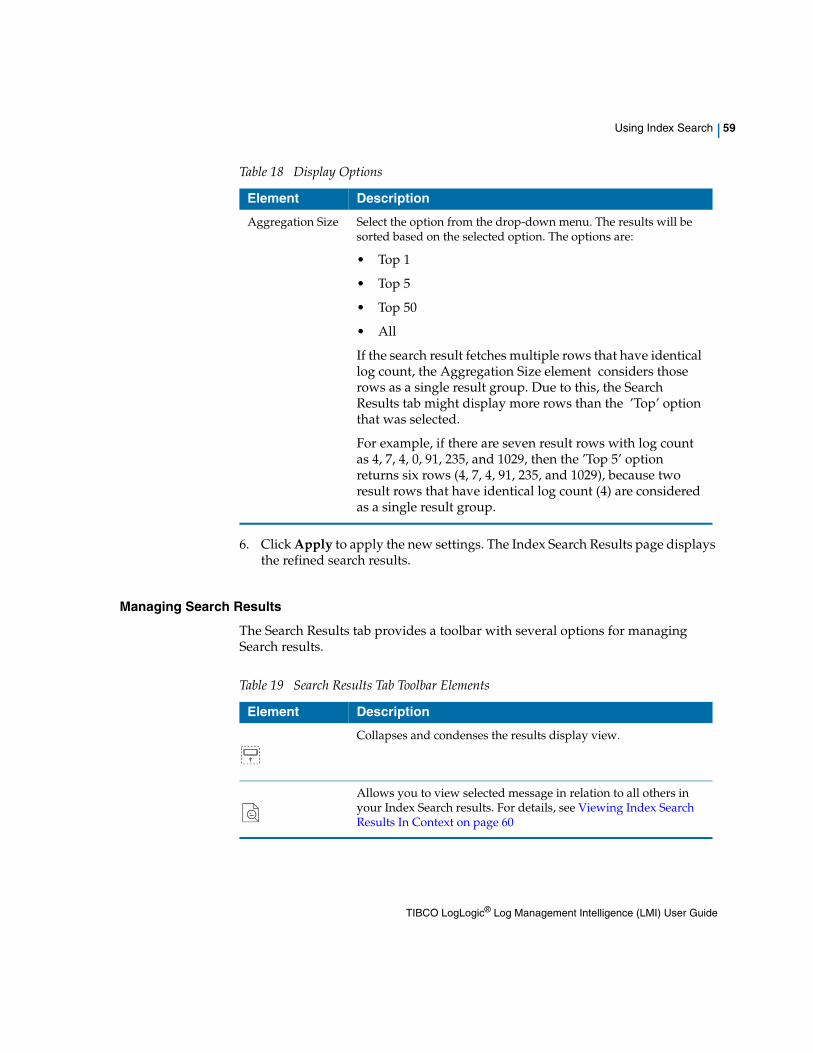
Using Index Search | 59
6. Click Apply to apply the new settings. The Index Search Results page displays the refined search results.
Managing Search Results
The Search Results tab provides a toolbar with several options for managing Search results.
Aggregation Size Select the option from the drop-down menu. The results will be sorted based on the selected option. The options are:
• Top 1
• Top 5
• Top 50
• All
If the search result fetches multiple rows that have identical log count, the Aggregation Size element considers those rows as a single result group. Due to this, the Search Results tab might display more rows than the ’Top’ option that was selected.
For example, if there are seven result rows with log count as 4, 7, 4, 0, 91, 235, and 1029, then the ’Top 5’ option returns six rows (4, 7, 4, 91, 235, and 1029), because two result rows that have identical log count (4) are considered as a single result group.
Table 18 Display Options
Element Description
Table 19 Search Results Tab Toolbar Elements
Element Description
Collapses and condenses the results display view.
Allows you to view selected message in relation to all others in your Index Search results. For details, see Viewing Index Search Results In Context on page 60
TIBCO LogLogic® Log Management Intelligence (LMI) User Guide
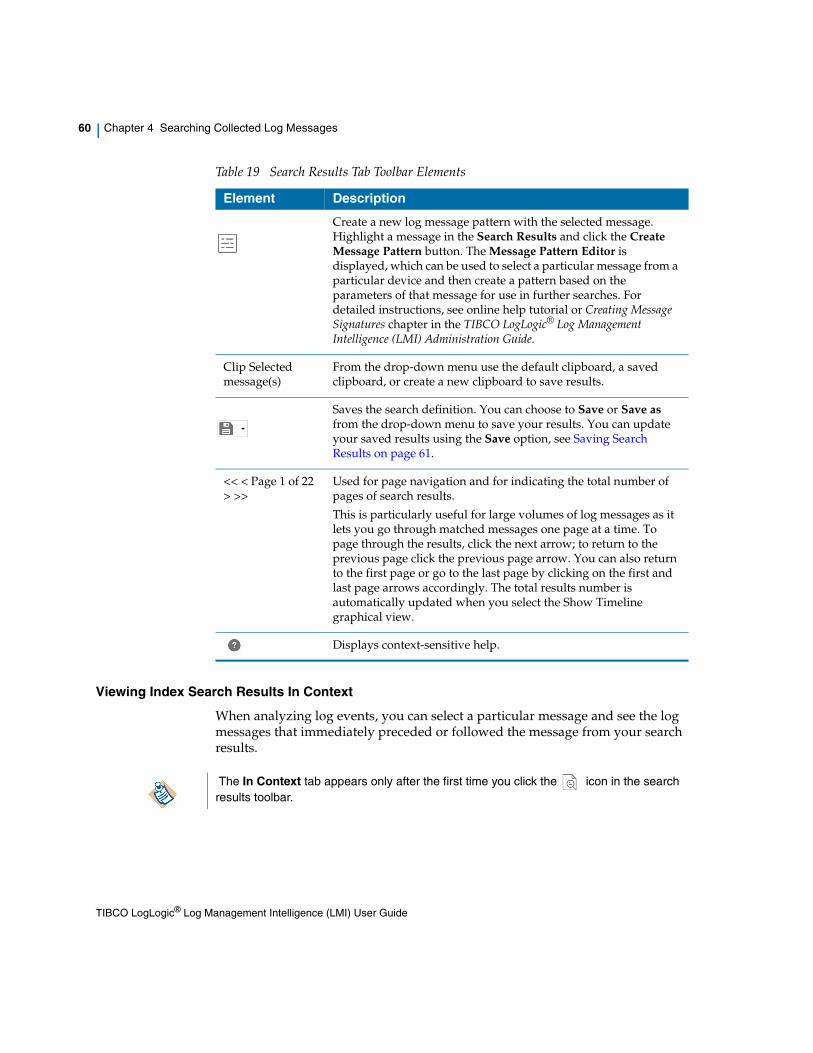
60 | Chapter 4 Searching Collected Log Messages
Viewing Index Search Results In Context
When analyzing log events, you can select a particular message and see the log messages that immediately preceded or followed the message from your search results.
Create a new log message pattern with the selected message. Highlight a message in the Search Results and click the Create Message Pattern button. The Message Pattern Editor is displayed, which can be used to select a particular message from a particular device and then create a pattern based on the parameters of that message for use in further searches. For detailed instructions, see online help tutorial or Creating Message Signatures chapter in the TIBCO LogLogic® Log Management Intelligence (LMI) Administration Guide.
Clip Selected message(s)
From the drop-down menu use the default clipboard, a saved clipboard, or create a new clipboard to save results.
Saves the search definition. You can choose to Save or Save as from the drop-down menu to save your results. You can update your saved results using the Save option, see Saving Search Results on page 61.
<< < Page 1 of 22 > >>
Used for page navigation and for indicating the total number of pages of search results.
This is particularly useful for large volumes of log messages as it lets you go through matched messages one page at a time. To page through the results, click the next arrow; to return to the previous page click the previous page arrow. You can also return to the first page or go to the last page by clicking on the first and last page arrows accordingly. The total results number is automatically updated when you select the Show Timeline graphical view.
Displays context-sensitive help.
Table 19 Search Results Tab Toolbar Elements
Element Description
The In Context tab appears only after the first time you click the icon in the search results toolbar.
TIBCO LogLogic® Log Management Intelligence (LMI) User Guide
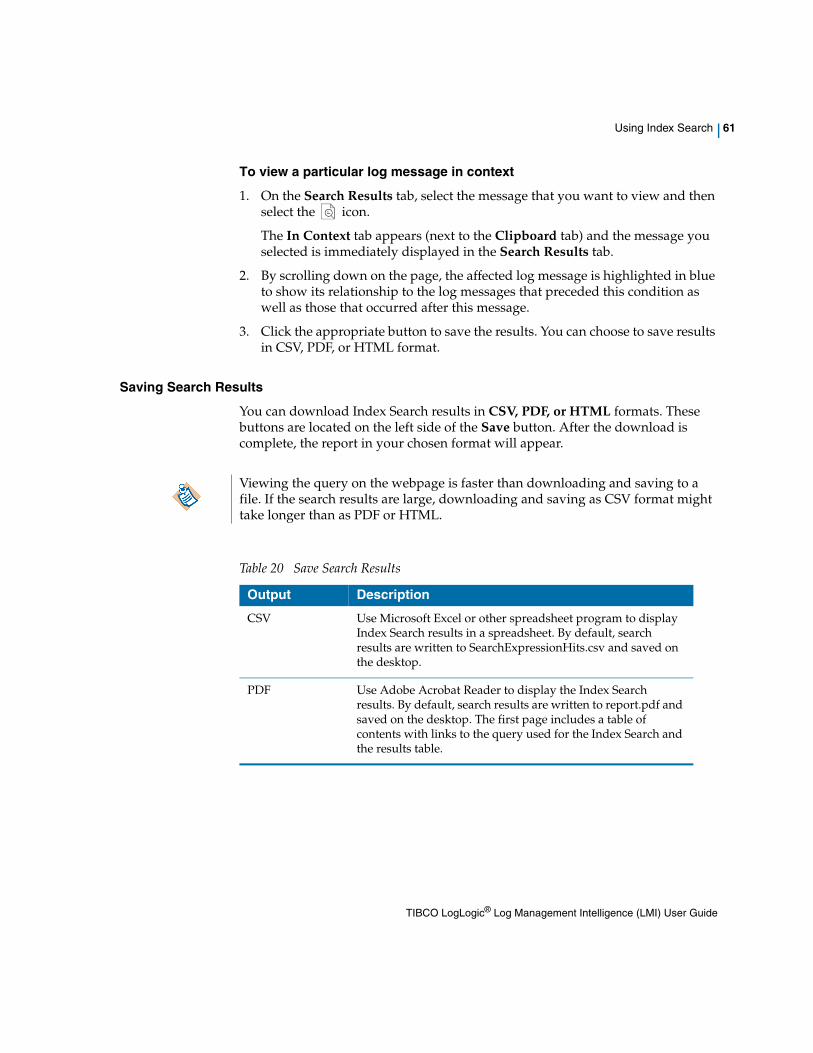
Using Index Search | 61
To view a particular log message in context
1. On the Search Results tab, select the message that you want to view and then select the icon.
The In Context tab appears (next to the Clipboard tab) and the message you selected is immediately displayed in the Search Results tab.
2. By scrolling down on the page, the affected log message is highlighted in blue to show its relationship to the log messages that preceded this condition as well as those that occurred after this message.
3. Click the appropriate button to save the results. You can choose to save results in CSV, PDF, or HTML format.
Saving Search Results
You can download Index Search results in CSV, PDF, or HTML formats. These buttons are located on the left side of the Save button. After the download is complete, the report in your chosen format will appear.
Viewing the query on the webpage is faster than downloading and saving to a file. If the search results are large, downloading and saving as CSV format might take longer than as PDF or HTML.
Table 20 Save Search Results
Output Description
CSV Use Microsoft Excel or other spreadsheet program to display Index Search results in a spreadsheet. By default, search results are written to SearchExpressionHits.csv and saved on the desktop.
PDF Use Adobe Acrobat Reader to display the Index Search results. By default, search results are written to report.pdf and saved on the desktop. The first page includes a table of contents with links to the query used for the Index Search and the results table.
TIBCO LogLogic® Log Management Intelligence (LMI) User Guide
62 | Chapter 4 Searching Collected Log Messages
To save search results report
1. Click Save As option from the icon drop-down menu to save the report. You can update the saved report by using the Save option. The Save As Report window appears.
2. Enter the name and description of the report in the Name and Description fields respectively. The Name field is a mandatory field.
3. Select the Suite option from the drop-down menu.
4. Select the Share? checkbox if you want to share the report.
5. Select the desired print option. For Grouped Search, the options are: Print Summary Report or Print Detailed Report.
6. Click Save to save the results.
Viewing Trends
After running Index Searches, you can use the View menu to view search results graphically using the timeline option. The trend output you see is based on your chosen time range and chosen devices referenced by the Index Search and always includes only the messages and devices for that distribution.
The trend feature can be a powerful tool during your analysis of certain events and lets you see trends for certain activities by Time and Device.
Each option lets you view timeline data in either bar chart or line chart format. These charts show:
• the time or device on the x-axis
HTML Opens a new tab in your Web browser and immediately displays HTML Index Search results as a LogLogic report. The HTML results include a table of contents with links to the query used for the Index Search and the results table. By default, the downloaded results are saved as LogLogicReport.zip in a temp folder on the local drive. You can use your own company logo on the report, see the General tab under System Settings.
Table 20 Save Search Results
Output Description
Do not use any special characters in the Description field when saving the Index report.
TIBCO LogLogic® Log Management Intelligence (LMI) User Guide
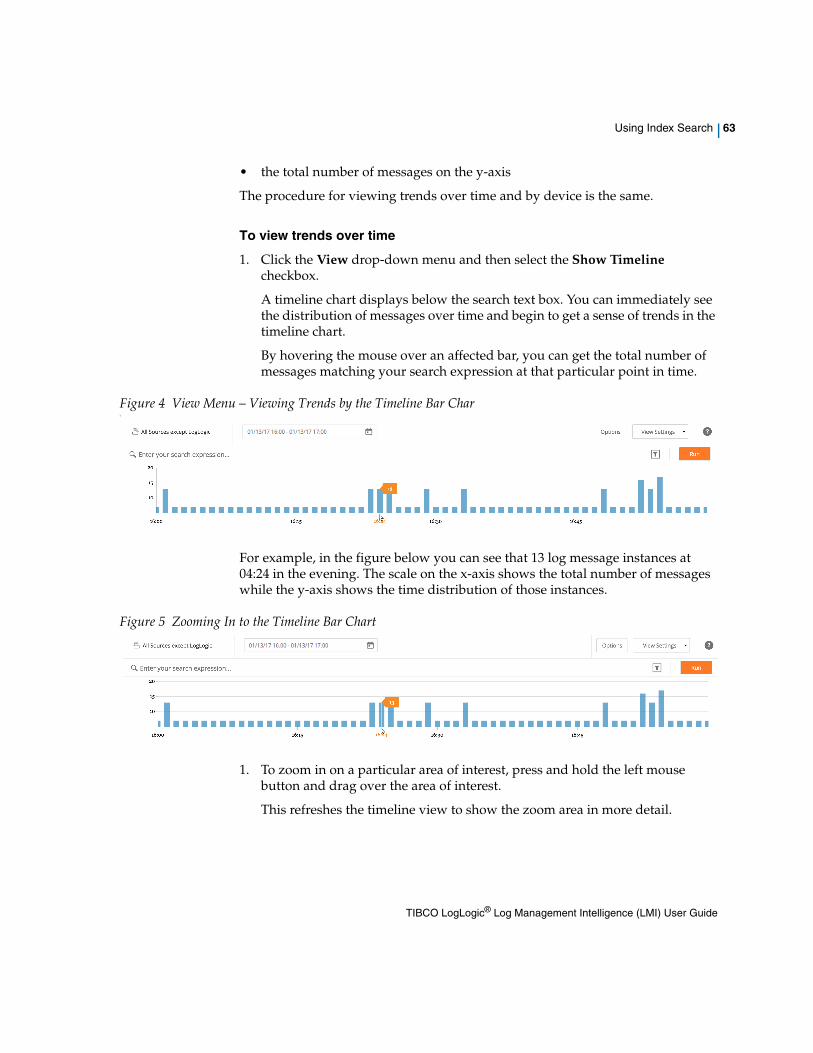
Using Index Search | 63
• the total number of messages on the y-axis
The procedure for viewing trends over time and by device is the same.
To view trends over time
1. Click the View drop-down menu and then select the Show Timeline checkbox.
A timeline chart displays below the search text box. You can immediately see the distribution of messages over time and begin to get a sense of trends in the timeline chart.
By hovering the mouse over an affected bar, you can get the total number of messages matching your search expression at that particular point in time.
Figure 4 View Menu – Viewing Trends by the Timeline Bar Chart
For example, in the figure below you can see that 13 log message instances at 04:24 in the evening. The scale on the x-axis shows the total number of messages while the y-axis shows the time distribution of those instances.
Figure 5 Zooming In to the Timeline Bar Chart
1. To zoom in on a particular area of interest, press and hold the left mouse button and drag over the area of interest.
This refreshes the timeline view to show the zoom area in more detail.
TIBCO LogLogic® Log Management Intelligence (LMI) User Guide
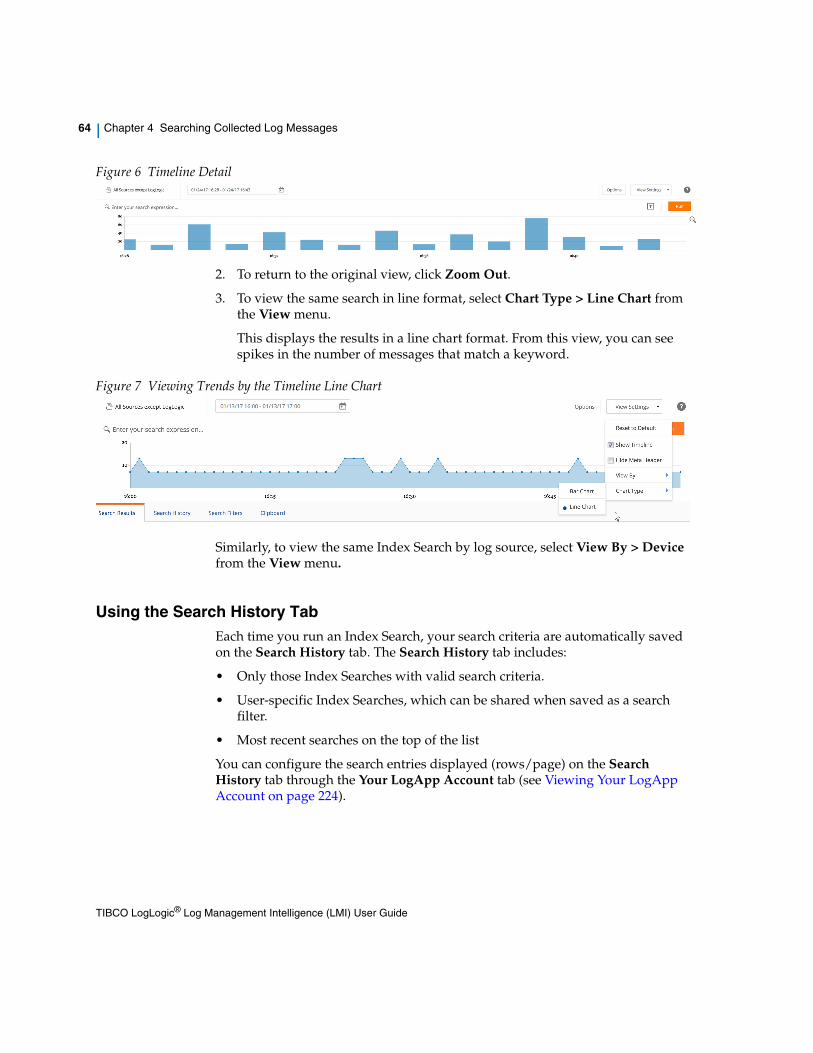
64 | Chapter 4 Searching Collected Log Messages
Figure 6 Timeline Detail
2. To return to the original view, click Zoom Out.
3. To view the same search in line format, select Chart Type > Line Chart from the View menu.
This displays the results in a line chart format. From this view, you can see spikes in the number of messages that match a keyword.
Figure 7 Viewing Trends by the Timeline Line Chart
Similarly, to view the same Index Search by log source, select View By > Device from the View menu.
Using the Search History TabEach time you run an Index Search, your search criteria are automatically saved on the Search History tab. The Search History tab includes:
• Only those Index Searches with valid search criteria.
• User-specific Index Searches, which can be shared when saved as a search filter.
• Most recent searches on the top of the list
You can configure the search entries displayed (rows/page) on the Search History tab through the Your LogApp Account tab (see Viewing Your LogApp Account on page 224).
TIBCO LogLogic® Log Management Intelligence (LMI) User Guide
Using Index Search | 65
Saving an Index Search as a Filter
While search histories are user-specific, you can save an Index Search as a search filter. You can use these saved search filters yourself or you can share these saved search filters with other users of the appliance.
To save an Index Search as a search filter
1. Click Search History to see the history of Index Searches.
2. Select the saved Index Search message and then click the button. The Save As Filter dialog box is displayed.
3. Enter a name, description and expression for the filter.
4. The filter name and description helps you and other users to quickly understand the type of information that generates when running this Index Search.
5. If you want to share this filter with other users, click the Shared with other users checkbox.
6. Click Add.
The Index Search is saved as a filter. You can use the filter in two places:
— Search > Index Search > Search Filters tab
— Search > All Search Filters tab
Running a Previously Saved Search Expression
Since your Index Searches are automatically saved for you on the Search History tab, you can browse through these previously saved sets of search criteria and run them again.
To run a previously saved Index Search
From the Search History tab, select the saved Index Search that you want to run and then click .
Do not use < or > in your search expression as these are not valid characters.
TIBCO LogLogic® Log Management Intelligence (LMI) User Guide
66 | Chapter 4 Searching Collected Log Messages
Using the Search Filters TabThe Search Filters tab lists all saved search filters created on the Search History tab. The Search Filters tab includes the button in the toolbar making it convenient to run a previously saved search filter.
The Search Filters tab organizes search filters by their name and displays the search expression used for the search filter in the Expression column.
To view or use a previously saved Index Search filter
1. Select the filter from the table and then click .
This copies the search expression and enters it in the search expression text box.
2. Press Enter to run the search filter.
This loads all the results of the search on the Search Results tab.
Using the Clipboard TabThe Index Search Clipboard is an important tool for investigating and troubleshooting log events. For example, during your analysis of a certain event, you might find an item of interest in one or more log messages. Once identified, you can create a Clipboard and copy and paste the affected log message(s) onto the Clipboard.
You can create several clipboards until you have found everything you need to help you with your analysis as you drill down on the details. After saving clipped messages to the clipboard, you can view them on Clipboard tab and on the Search Results tab.
The Clipboard tab provides a toolbar with several options for using clipped messages. These options include:
• - Adds a new clipboard
• - Deletes one or more clipped messages
• - Allows you view or edit the clipped message
Adding a New Clipboard
You can add a clipboard from:
All of your saved search filters show up on the Search Filters tab and on the Index Report tab.
TIBCO LogLogic® Log Management Intelligence (LMI) User Guide
Using Index Search | 67
• the Search Results page
• the Clipboard tab
The procedures are essentially the same for adding a new Clipboard. The next procedure shows how to add a Clipboard from the Search Results tab.
To add a new Clipboard from the Search Results tab
1. On the Search Results tab, select messages to add to the clipboard from the search results.
2. To select more than one message to add to the Clipboard, hold the Shift key as you click on each message.
3. From the Clip selected message(s) drop-down menu, select New Clipboard.
4. The Add Clipboard dialog box opens.
5. Enter a name for clipboard in the Name field.
6. If you enter an existing clipboard name, the messages are added to that existing clipboard.
7. Add a description for the clipped message in the Annotate field and click Add.
The clipboard is added to the Clipboard tab and it is also available from the Search Results tab. You can go back and view or edit the clipped message(s) later on to allow for more analysis.
Viewing or Editing Clipped Messages
After saving clipped messages and annotating them, you can view or edit clipboards on the Clipboard tab.
To view or edit clipped messages
1. On the Clipboard tab, select the clipboard that you want to view or edit and click .
You can add up to 1,000 messages to a Clipboard. Each user is able to create up to 100 Clipboards.
TIBCO LogLogic® Log Management Intelligence (LMI) User Guide
68 | Chapter 4 Searching Collected Log Messages
The Edit Clipboard dialog box appears. You can change the following:
— the Name of the clipped message
— the Annotation for the clipped message
— remove one or more clipped log messages
2. Modify the Name, Annotation, or remove log messages and click Update.
Deleting Clipped Messages
You can manage the clipboard table by deleting unwanted clipped messages.
To delete a clipped message
1. On the Clipboard tab, select the Clipboard you want to delete and click the Delete button.
2. To delete more than one clipped message, hold down the shift key and select the messages you want to delete and then click the Delete button.
The selected messages are deleted from the Clipboard tab.
TIBCO LogLogic® Log Management Intelligence (LMI) User Guide
Tag-Based Searches Using the Tag Picker Interface | 69
Tag-Based Searches Using the Tag Picker Interface
You may use the new Tag Picker Interface to access saved search terms in order to quickly run an updated Index Report.
To start an Index Search using the Tag Picker Interface
1. Access the Index Search page by going to Search > Index Search. Click the arrow next to the text box labeled “Enter your search expression...". The Tag Picker Interface opens.
2. Select an Event Type and left-click. The selected Event Type appears in the Enter your search expression... text box.
3. Add a Boolean operator (AND) to the search expression, and left-click a saved Field Tag. The selected Field Tag appears after the Boolean operator in the Search Expression text box.
4. Add a wild card (*) to recall all saved Field Tags with that name. Click Run.
5. Select View and display the Bar Chart for the search expression.
6. Compare with the previous saved Index Search results for this expression.
You can specify special characters such as spaces, forward-slashes (/) etc. inside the quotes for Field Tags. For example: Identity: “John Smith”; Domain: “domain name / JOHN SMITH”.
TIBCO LogLogic® Log Management Intelligence (LMI) User Guide
70 | Chapter 4 Searching Collected Log Messages
Using Regular Expression Search
Use the RegEx Search Filter tab to find specific types of data based on search expressions and time intervals you define. RegEx Search provides more powerful search filter options than Index Search, though RegEx Search can take longer to process and is less interactive.
To specify parameters for a new search
1. Select Search > Regular Expression Search from the navigation menu.
2. (Management Station only) Select the appliance (or All Appliances) on which to run the search.
3. Select the Device Type.
4. Select the Source Device, or all devices, connected to the appliance.
To view Global groups created on this Management Station, you must select All Appliances under Appliance.
Devices with Collector Domain will be displayed in one of two ways:
— For Collector Domains specified in a UC the following format; <collector domainid>_<device IP>_<devicetype> will be displayed in the Name field. For example a windows machine with an IP address of 10.10.10.10 and collector domain will be displayed as 1_10.10.10.10_windows.
— For Collector Domains specified in LMI (Managment>Devices>AddNew) the Collector Domain name will be displayed in the Collector Domain field.
5. Specify the Time Interval which to search for data passing through your appliance.
6. Define your Search Filter. Select one of the following options and specify the respective parameters.
— Retrieve All—Use to retrieve all log files collected during a specified time interval regardless of the defined search expression parameters.
— Pre-Defined—Select a pre-defined search expression (defined in/by search filters). All search filters you create appear in the drop-down menu as a pre-defined search expression. If the selected filter includes multiple
A working knowledge of regular expressions is a prerequisite.
TIBCO LogLogic® Log Management Intelligence (LMI) User Guide
Using Regular Expression Search | 71
parameter fields, a text field for each parameter appears. The maximum length for each field is 25 characters.
— Use Words—Use a specific word(s) as a search parameter.
— Use Exact Phrase—Use an exact phrase as a search parameter.
— Regular Expression—Use a regular expression as a search parameter.
For more information about modifying or creating search expressions, see Using Search Filters on page 77.
7. Specify the Time Interval to search for data passing through your appliance.
8. Set a time for the search; do one of the following:
— Select the Schedule Search to Run Immediately checkbox to start your search of archived data immediately.
— Define a time to start the search of archived data. If the selected time is in the past, the search runs immediately. This search is useful if you know exactly which data source you want to search and do not need to search a time interval.
9. Enter a Search Name for the search.
10. Select the Notify me when this search completes checkbox to receive a notification that the search has completed.
11. To generate the report, click the Run button.
To generate a previously saved report
1. Select Search > Regular Expression Search from the navigation menu.
2. In the RegEx Search Filter tab, select the report from the Saved Custom Report drop-down menu.
— To generate the report, click the Run button.
— To export the report data to a file in CSV format, click the Save as CSV button.
To save a Custom Report
After specifying the parameters for your report, save the report:
Concurrent Regular Expression Searches apply only to the appliance models above the 1000 series. You can select the number of concurrent searches to perform. The default is one, but you can choose to perform up to four searches concurrently. To specify more than four, you must edit the capability.xml file.
TIBCO LogLogic® Log Management Intelligence (LMI) User Guide
72 | Chapter 4 Searching Collected Log Messages
1. Click to expand the Save Custom Report section.
2. Type a name for your report and provide a brief description.
3. If you do not plan to share the report with other users logging in to the appliance, uncheck the Share with Other Users checkbox. By default, this checkbox is selected.
4. If packages are present on the appliance, the Add Report to Package drop-down menu is visible letting you select a package in which to include this report.
5. Click the Save Report button to save your changes.
Using Distributed Regular Expression SearchUse Distributed RegEx Search to select all configured appliances to run a RegEx search and retrieve the merged results from the Remote Appliances and the Management Station.
Prerequisites:
• Add remote appliances — Refer to the “Creating a Management Station Cluster” section in the TIBCO LogLogic® Log Management Intelligence (LMI) Administration Guide.
• Your administrator must provide access to each of the remote appliances for you to have access to the data on the remote appliances. Access to appliances is provided via the Appliances tab of the User Edit page. For more information about user privileges, refer to the “Managing Users” chapter in the TIBCO LogLogic® Log Management Intelligence (LMI) Administration Guide.
To run a Distributed RegEx Search.
1. Select Search > Regular Expression Search from the navigation menu.
2. For a Distributed RegEx Search you must select All Appliances.
The Management Station and all Remote Appliances must have LogLogic LMI v5.4.2 or newer installed.
The Distributed RegEx Search does not support Custom Reports on the Management Station.
TIBCO LogLogic® Log Management Intelligence (LMI) User Guide
Using Regular Expression Search | 73
3. Select the Device Type.
— If “All” is selected, the Source Device menu will allow you to select all devices or select a single device from the Management Station.
— Select from a list of device types configured on the Management Station
4. Select the Source Device.
— If “All” is selected then logs from both the Management Station and Remote Appliances will be returned.
Search results are based on the device name and will mostly be returned from the Management Station. However, if the Management Station and Remote Appliances happen to have the same device name then the logs from both the Management Station and the Remote Appliance will be returned.
5. Define your Search Filter. Select one of the following options and specify the respective parameters.
— Retrieve All — Use to retrieve all log files collected during a specified time interval regardless of the defined search expression parameters.
— Pre-Defined — Select a pre-defined search expression (defined in/by search filters). All search filters you create appear in the drop-down menu as a pre-defined search expression. If the selected filter includes multiple parameter fields, a text field for each parameter appears. The maximum length for each field is 25 characters.
— Use Words — Use a specific word(s) as a search parameter.
— Use Exact Phrase — Use an exact phrase as a search parameter.
— Regular Expression — Use a regular expression as a search parameter.
For more information about modifying or creating search expressions, see Using Index Search on page 52.
6. Specify the Time Interval to search for data passing through your appliance.
7. Select the Notify me when this search completes checkbox to receive a notification that the search has completed.
8. Set a time for the search; do one of the following:
— Select the Schedule Search to Run Immediately checkbox to start your search of archived data immediately.
— Define a time to start the search of archived data. If the selected time is in the past, the search runs immediately. This search is useful if you know exactly which data source you want to search and do not need to search a time interval.
TIBCO LogLogic® Log Management Intelligence (LMI) User Guide
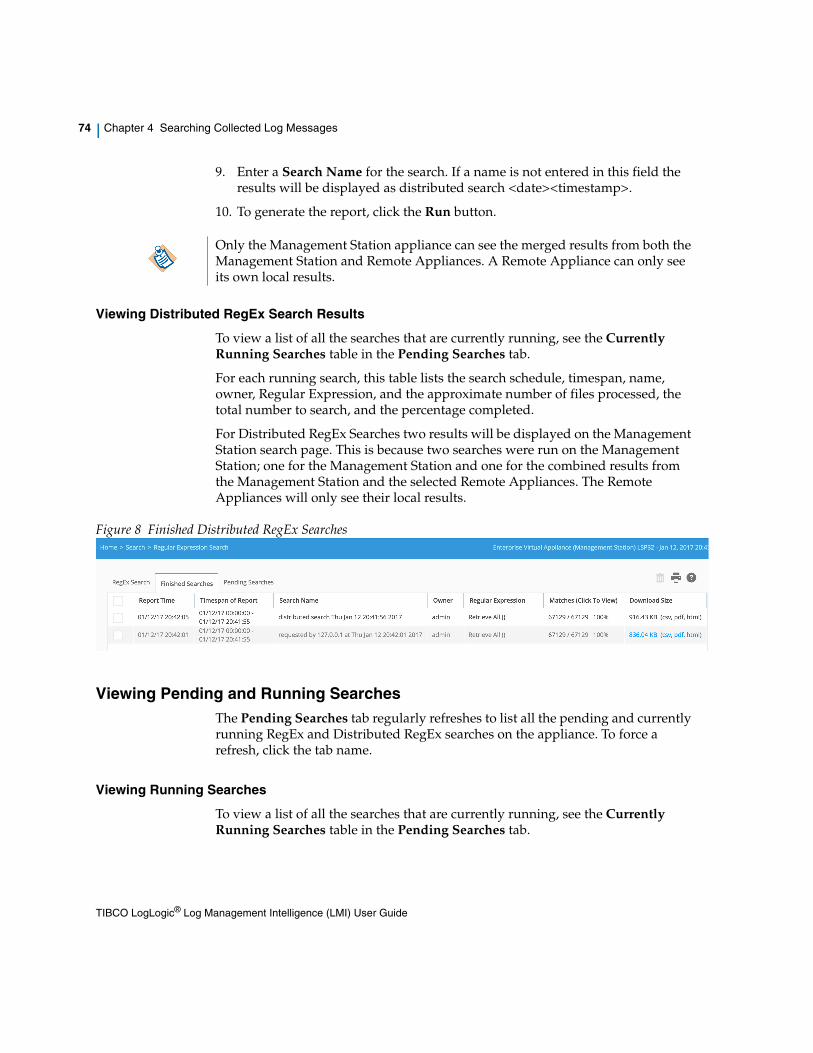
74 | Chapter 4 Searching Collected Log Messages
9. Enter a Search Name for the search. If a name is not entered in this field the results will be displayed as distributed search <date><timestamp>.
10. To generate the report, click the Run button.
Viewing Distributed RegEx Search Results
To view a list of all the searches that are currently running, see the Currently Running Searches table in the Pending Searches tab.
For each running search, this table lists the search schedule, timespan, name, owner, Regular Expression, and the approximate number of files processed, the total number to search, and the percentage completed.
For Distributed RegEx Searches two results will be displayed on the Management Station search page. This is because two searches were run on the Management Station; one for the Management Station and one for the combined results from the Management Station and the selected Remote Appliances. The Remote Appliances will only see their local results.
Figure 8 Finished Distributed RegEx Searches
Viewing Pending and Running SearchesThe Pending Searches tab regularly refreshes to list all the pending and currently running RegEx and Distributed RegEx searches on the appliance. To force a refresh, click the tab name.
Viewing Running Searches
To view a list of all the searches that are currently running, see the Currently Running Searches table in the Pending Searches tab.
Only the Management Station appliance can see the merged results from both the Management Station and Remote Appliances. A Remote Appliance can only see its own local results.
TIBCO LogLogic® Log Management Intelligence (LMI) User Guide
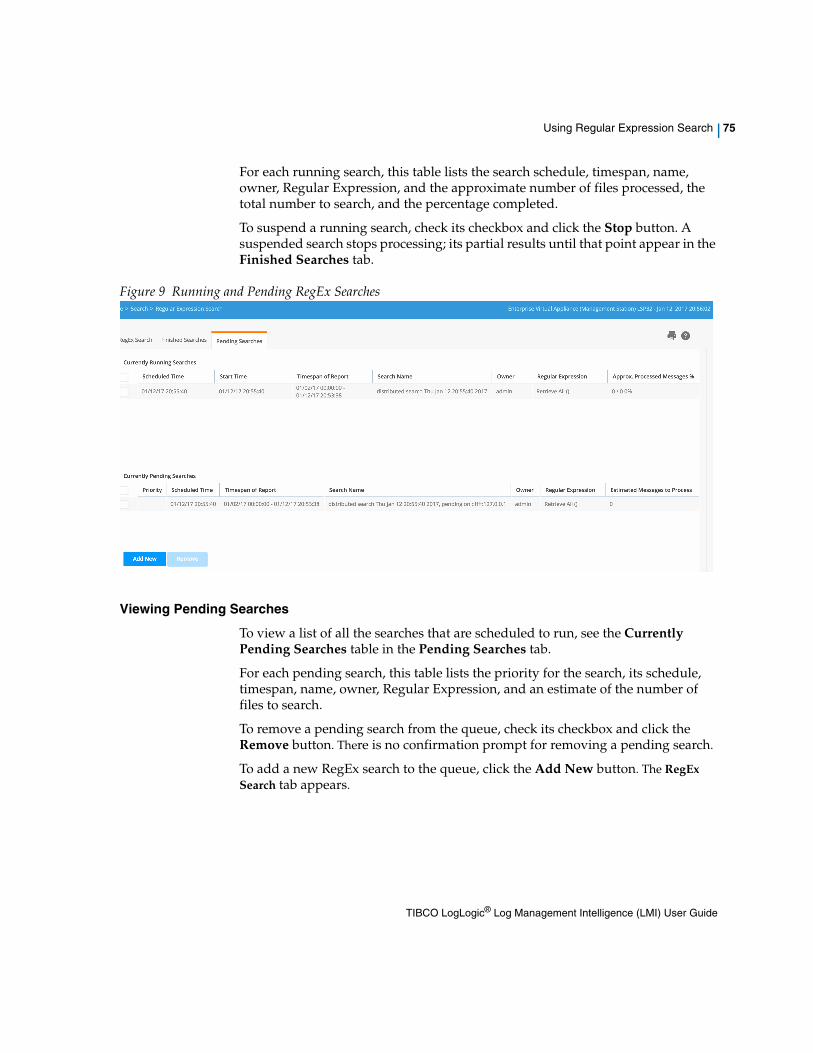
Using Regular Expression Search | 75
For each running search, this table lists the search schedule, timespan, name, owner, Regular Expression, and the approximate number of files processed, the total number to search, and the percentage completed.
To suspend a running search, check its checkbox and click the Stop button. A suspended search stops processing; its partial results until that point appear in the Finished Searches tab.
Figure 9 Running and Pending RegEx Searches
Viewing Pending Searches
To view a list of all the searches that are scheduled to run, see the Currently Pending Searches table in the Pending Searches tab.
For each pending search, this table lists the priority for the search, its schedule, timespan, name, owner, Regular Expression, and an estimate of the number of files to search.
To remove a pending search from the queue, check its checkbox and click the Remove button. There is no confirmation prompt for removing a pending search.
To add a new RegEx search to the queue, click the Add New button. The RegEx Search tab appears.
TIBCO LogLogic® Log Management Intelligence (LMI) User Guide
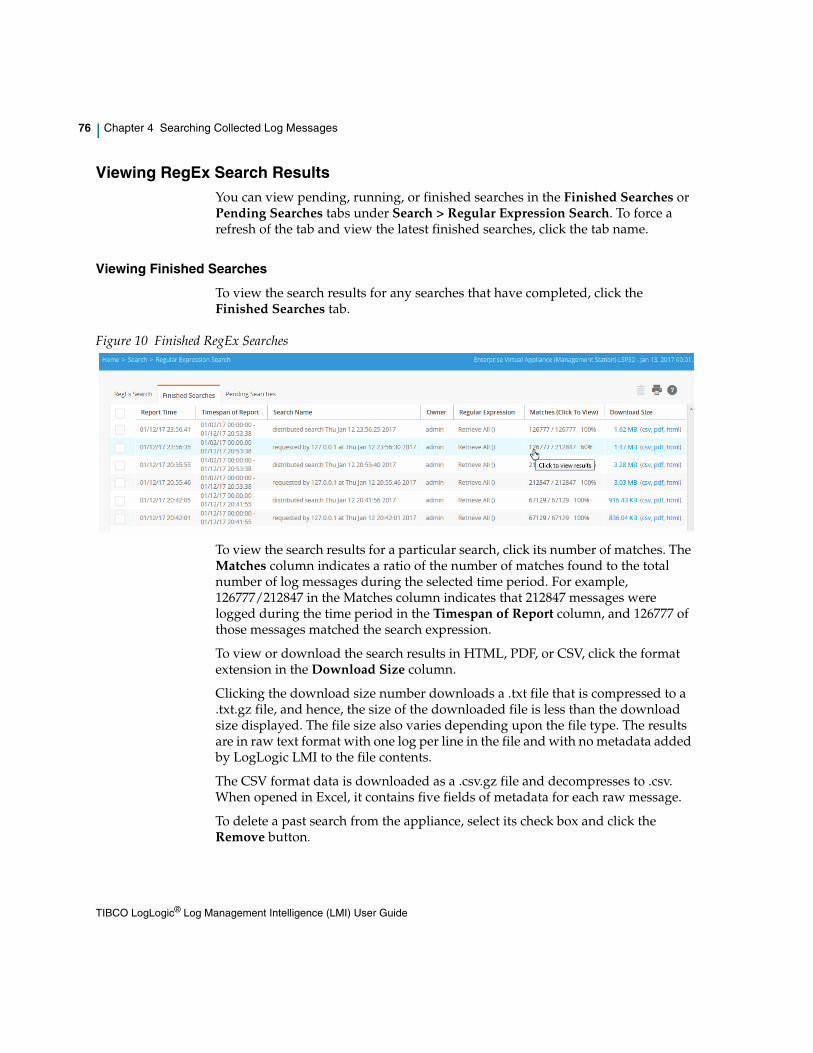
76 | Chapter 4 Searching Collected Log Messages
Viewing RegEx Search ResultsYou can view pending, running, or finished searches in the Finished Searches or Pending Searches tabs under Search > Regular Expression Search. To force a refresh of the tab and view the latest finished searches, click the tab name.
Viewing Finished Searches
To view the search results for any searches that have completed, click the Finished Searches tab.
Figure 10 Finished RegEx Searches
To view the search results for a particular search, click its number of matches. The Matches column indicates a ratio of the number of matches found to the total number of log messages during the selected time period. For example, 126777/212847 in the Matches column indicates that 212847 messages were logged during the time period in the Timespan of Report column, and 126777 of those messages matched the search expression.
To view or download the search results in HTML, PDF, or CSV, click the format extension in the Download Size column.
Clicking the download size number downloads a .txt file that is compressed to a .txt.gz file, and hence, the size of the downloaded file is less than the download size displayed. The file size also varies depending upon the file type. The results are in raw text format with one log per line in the file and with no metadata added by LogLogic LMI to the file contents.
The CSV format data is downloaded as a .csv.gz file and decompresses to .csv. When opened in Excel, it contains five fields of metadata for each raw message.
To delete a past search from the appliance, select its check box and click the Remove button.
TIBCO LogLogic® Log Management Intelligence (LMI) User Guide
Using Search Filters | 77
Using Search Filters
Search filters are user-created filters (saved search patterns) that can be used in:
• Alerts
• Real-Time Viewer
• Index Search
• RegEx Search
• Index Reports
• Message routing rules
You can also filter your results using the Find field. Enter the keywords in the Find field to view the filtered results based on your search keywords. You can filter results based on all columns.
The All Search Filters page lists all search filters:
• You created in the Add Search Filter page
• You created and saved from the Index Search History tab (see Saving an Index Search as a Filter on page 65)
• Available to you, including shareable filters created or owned by other users
Adding a Search FilterTo add a search filter for complex pattern matching, use the Add Search Filter page.
The Find field does not support the use of Japanese.
Avoid using a regular expression when a non-regular expression alternative is available. Regular expressions are almost always less effective and more error prone than non-regular expressions. For instance, instead of using the regular expression ”r;^[^:]://.\.loglogic\.com/.*$” you should write ”r;url.domain=loglogic.com”r;. You can also use a wild card symbol for searches. Using a wild card for regular expression searches indicate how many occurrences to match. For example, * means matching the preceding element zero or more times, whereas + means matching the element one or more times.
TIBCO LogLogic® Log Management Intelligence (LMI) User Guide
78 | Chapter 4 Searching Collected Log Messages
To add a search filter
1. Select Search > All Search Filters from the navigation menu.
2. Click the Add New button.
3. Type a name for your new search filter.
4. Sharing - Read Only is the default setting for a new search filter; other users of this appliance may see and use the new search filter. Set the radio button to No to prevent others from seeing and using the new search filter. Set the radio button to Read Write to allow others to see and modify the new search filter.
5. Type a brief description of the new search filter.
This description helps you remember what the filter is for, and describes it to other users if you shared the filter.
6. Select a search filter option and enter the search filter criteria (see Search Filter Options on page 79.
For this example we will select the following option and a single filter criterion:
a. Select the radio button Use Exact Phrase.
b. Enter $username in the Use Exact Phrase text field.
7. Click the Add button.
When adding the very first Search Filter to the appliance, you may see the message “There is no Search Filter defined in the system” immediately after clicking Add. Refresh the appliance memory by clicking Regular Expression Search in the navigation menu; then click Search Filters in the menu, and your new Search Filter will appear in the list.
TIBCO LogLogic® Log Management Intelligence (LMI) User Guide
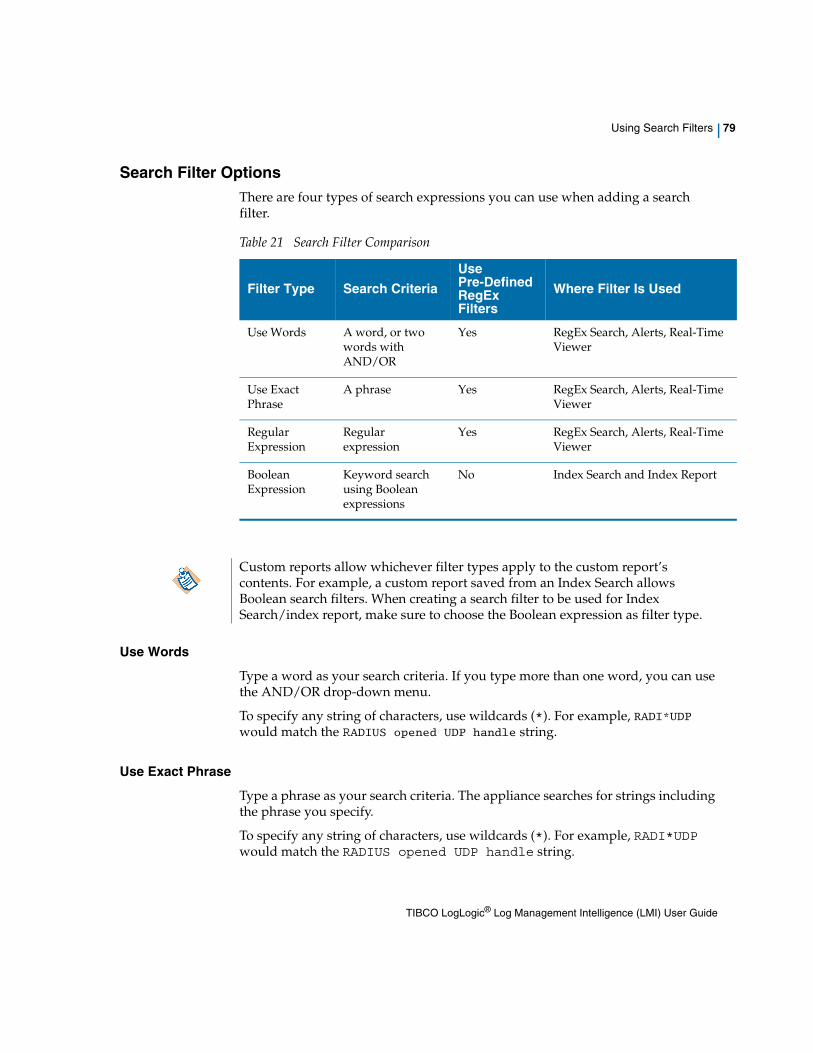
Using Search Filters | 79
Search Filter OptionsThere are four types of search expressions you can use when adding a search filter.
Use Words
Type a word as your search criteria. If you type more than one word, you can use the AND/OR drop-down menu.
To specify any string of characters, use wildcards (*). For example, RADI*UDP would match the RADIUS opened UDP handle string.
Use Exact Phrase
Type a phrase as your search criteria. The appliance searches for strings including the phrase you specify.
To specify any string of characters, use wildcards (*). For example, RADI*UDP would match the RADIUS opened UDP handle string.
Table 21 Search Filter Comparison
Filter Type Search Criteria
Use Pre-Defined RegEx Filters
Where Filter Is Used
Use Words A word, or two words with AND/OR
Yes RegEx Search, Alerts, Real-Time Viewer
Use Exact Phrase
A phrase Yes RegEx Search, Alerts, Real-Time Viewer
Regular Expression
Regular expression
Yes RegEx Search, Alerts, Real-Time Viewer
Boolean Expression
Keyword search using Boolean expressions
No Index Search and Index Report
Custom reports allow whichever filter types apply to the custom report’s contents. For example, a custom report saved from an Index Search allows Boolean search filters. When creating a search filter to be used for Index Search/index report, make sure to choose the Boolean expression as filter type.
TIBCO LogLogic® Log Management Intelligence (LMI) User Guide
80 | Chapter 4 Searching Collected Log Messages
You can also define a parameter field using $fieldname. For example, $username $zipcode $phone displays text entry fields when you select the search filter in the RegEx Search tab. Field names with spaces in them display only the first word in the RegEx Search tab. For more information, see Adding Additional Parameters to a Pre-Defined Regular Expression Search Filter on page 82.
Regular Expression
Type a regular expression as your search criteria; that is, a single character, a string of characters, or a string of numbers. A regular expression (RegEx) is a pattern that is matched against a subject string from left to right. Most characters stand for themselves in a pattern and match the corresponding characters in the subject.
The power of regular expressions comes from the ability to include alternatives and repetitions in the pattern. These are encoded in the pattern by use of metacharacters which, instead of standing for themselves, are interpreted in a special way.
You can use a wildcard symbol (*) for searches. Using a wildcard for RegEx searches means the * matches the preceding element zero or more times.
Once you add a regular expression, the values you enter are stored as parameters in the database. To use this regular expression with alerts, Real-Time Viewer, or RegEx Search, select the Pre-Defined radio button.
If you are creating a search filter for an alert, the search filter must be a regular expression.
Boolean Expression
Type a keyword that uses Boolean operators such as AND, OR, or NOT. For example:
“Portmapped translation built for gaddr” and NOT 155.363.777.53
Boolean expressions can search only indexed data. Indexing increases performance when searching unparsed data. It is most effective when used to find a rare occurrence of a string.
In addition to entering a keyword, you can also type:
Avoid using a regular expression when a non-regular expression alternative is available. Regular expressions are almost always less effective and more error prone than non-regular expressions. For instance, instead of using the regular expression ^[^:]*://.*\.loglogic\.com/.*$” you should write url.domain=loglogic.com.
TIBCO LogLogic® Log Management Intelligence (LMI) User Guide
Using Search Filters | 81
• Numbers and words which are three or more characters
• Terms under three characters, preceded by =. For example, for terms such as user=a or priority=7 the a and 7 are indexed.
Your Boolean expression should be no longer than 4096 characters in length.
For more on using Boolean search strings, see the Search Strings topic in the Online Help.
Putting Your Logins Search Filter to WorkComplete the following steps to start using your Logins search filter:
1. Select Regular Expression Search from the navigation menu.
2. On the RegEx Search Filter tab that appears, select the Pre-Defined radio button.
3. In the Pre-Defined text field (Select Expression), click the drop-down menu arrow, select Logins search, and click on the filter name. The filter form reloads and now displays “Logins search” in the Pre-Defined text field.
Note that because you specified the parameter $username in the Use Exact Phrase text field when you defined your Logins search filter, the appliance has opened a new text box next to username in which you may further define the type of user to search for.
4. Enter “admin” in the username text field to search for that class of user alone, or enter the wildcard * to search for logins from all users.
5. Select a Start Time to run your Logins search (immediately in this example).
6. Enter a name for your search in the Search Name text field.
7. Click the Save Custom Report menu expansion arrow and enter a Report Name and Report Description, and select whether to Share with Others.
8. Click Save Report.
9. Click Run.
TIBCO LogLogic® Log Management Intelligence (LMI) User Guide
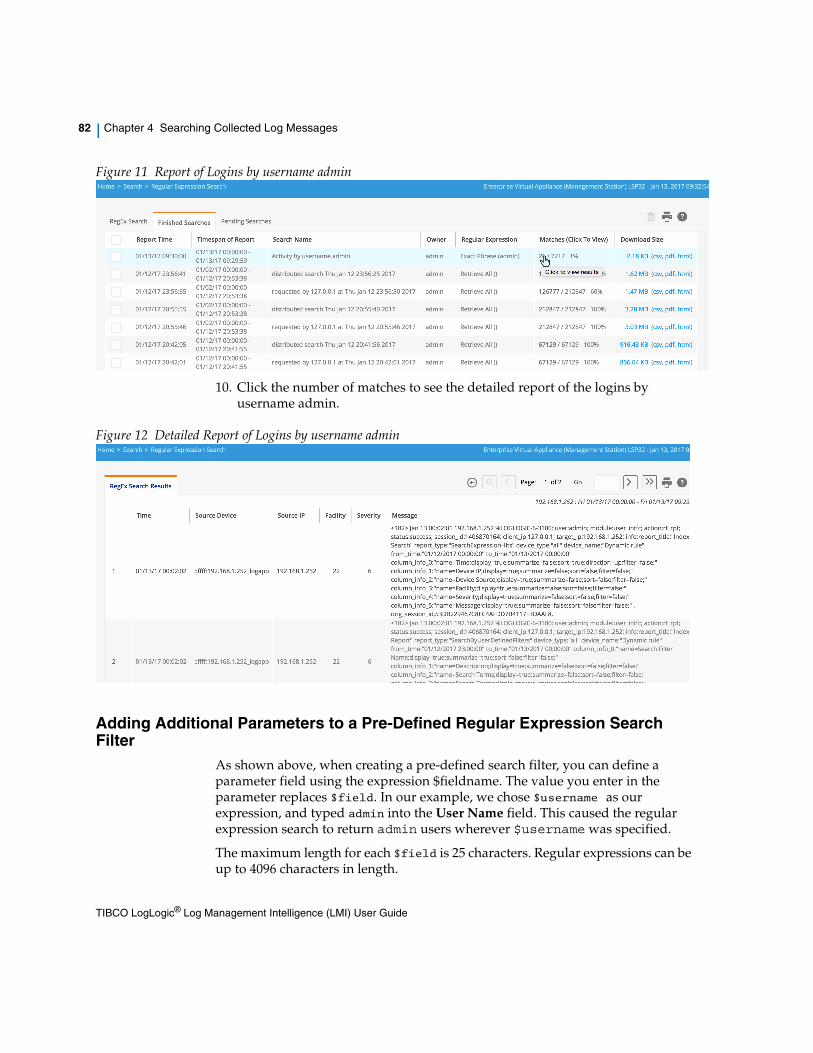
82 | Chapter 4 Searching Collected Log Messages
Figure 11 Report of Logins by username admin
10. Click the number of matches to see the detailed report of the logins by username admin.
Figure 12 Detailed Report of Logins by username admin
Adding Additional Parameters to a Pre-Defined Regular Expression Search Filter
As shown above, when creating a pre-defined search filter, you can define a parameter field using the expression $fieldname. The value you enter in the parameter replaces $field. In our example, we chose $username as our expression, and typed admin into the User Name field. This caused the regular expression search to return admin users wherever $username was specified.
The maximum length for each $field is 25 characters. Regular expressions can be up to 4096 characters in length.
TIBCO LogLogic® Log Management Intelligence (LMI) User Guide
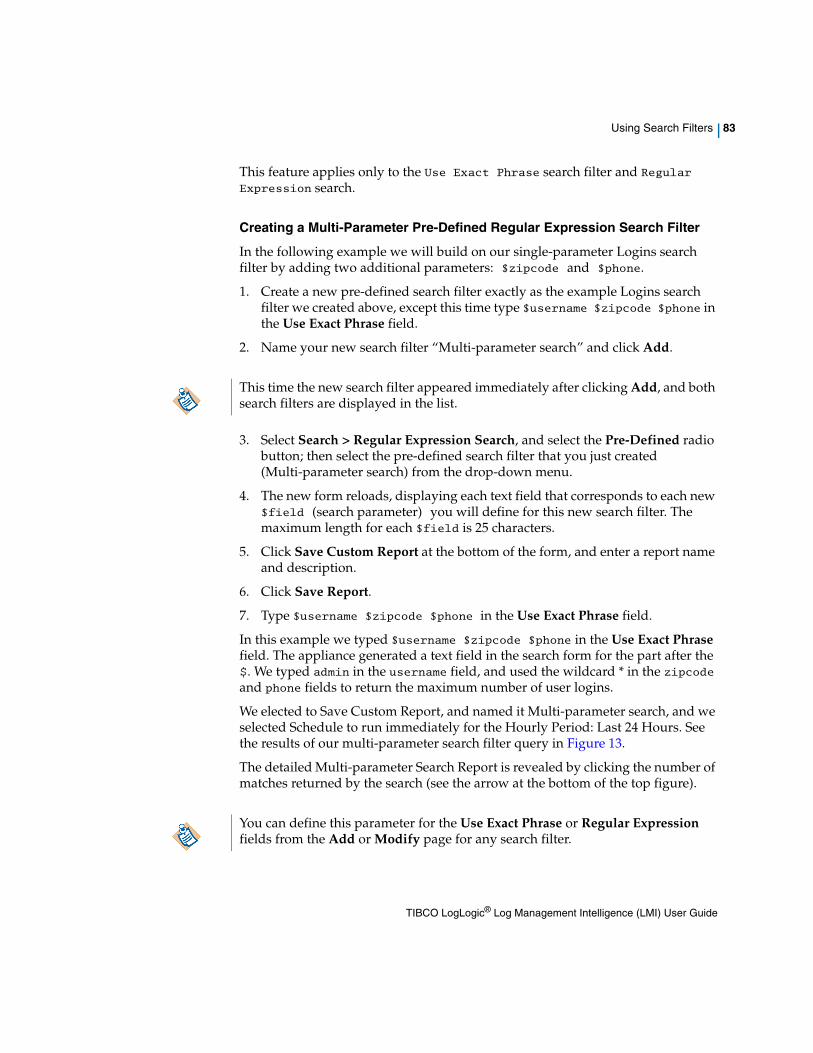
Using Search Filters | 83
This feature applies only to the Use Exact Phrase search filter and Regular Expression search.
Creating a Multi-Parameter Pre-Defined Regular Expression Search Filter
In the following example we will build on our single-parameter Logins search filter by adding two additional parameters: $zipcode and $phone.
1. Create a new pre-defined search filter exactly as the example Logins search filter we created above, except this time type $username $zipcode $phone in the Use Exact Phrase field.
2. Name your new search filter “Multi-parameter search” and click Add.
3. Select Search > Regular Expression Search, and select the Pre-Defined radio button; then select the pre-defined search filter that you just created (Multi-parameter search) from the drop-down menu.
4. The new form reloads, displaying each text field that corresponds to each new $field (search parameter) you will define for this new search filter. The maximum length for each $field is 25 characters.
5. Click Save Custom Report at the bottom of the form, and enter a report name and description.
6. Click Save Report.
7. Type $username $zipcode $phone in the Use Exact Phrase field.
In this example we typed $username $zipcode $phone in the Use Exact Phrase field. The appliance generated a text field in the search form for the part after the $. We typed admin in the username field, and used the wildcard * in the zipcode and phone fields to return the maximum number of user logins.
We elected to Save Custom Report, and named it Multi-parameter search, and we selected Schedule to run immediately for the Hourly Period: Last 24 Hours. See the results of our multi-parameter search filter query in Figure 13.
The detailed Multi-parameter Search Report is revealed by clicking the number of matches returned by the search (see the arrow at the bottom of the top figure).
This time the new search filter appeared immediately after clicking Add, and both search filters are displayed in the list.
You can define this parameter for the Use Exact Phrase or Regular Expression fields from the Add or Modify page for any search filter.
TIBCO LogLogic® Log Management Intelligence (LMI) User Guide
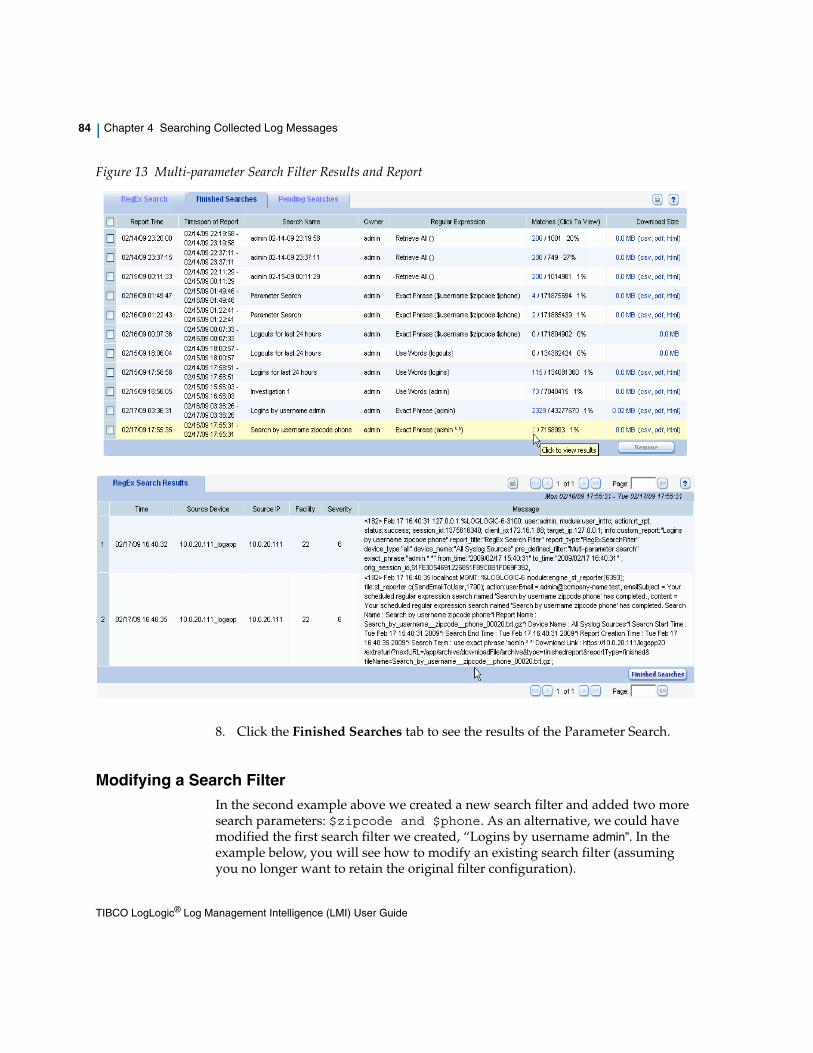
84 | Chapter 4 Searching Collected Log Messages
Figure 13 Multi-parameter Search Filter Results and Report
8. Click the Finished Searches tab to see the results of the Parameter Search.
Modifying a Search FilterIn the second example above we created a new search filter and added two more search parameters: $zipcode and $phone. As an alternative, we could have modified the first search filter we created, “Logins by username admin”. In the example below, you will see how to modify an existing search filter (assuming you no longer want to retain the original filter configuration).
TIBCO LogLogic® Log Management Intelligence (LMI) User Guide
Using Search Filters | 85
To modify an existing search filter
1. Select Search > Search Filters from the navigation menu.
2. Click on the name of the filter you want to change.
3. The Modify Search Filter tab appears with the same options as Adding a Search Filter on page 77.
4. Modify the search filter name, description, filter options and criteria, or sharing with other users as needed.
5. Now we think that IP address would be more valuable to us than zipcode and phone, so we elect to modify our multi-parameter search filter to suit our new needs.
6. Click the Update button to modify the search filter.
7. Select Regular Expression Search from the navigation menu.
8. Click the Pre-Defined radio button on the RegEx Search Filter tab.
9. Select Multi-parameter search from the drop-down menu in the Select Expression field (but do not enter search parameters until you complete Step 8 below).
10. Click the Save Report button at the bottom of the form and enter a new report name and description. Click Save Report.
11. Return to the search parameter text fields and enter your new parameters (username = admin, and ipaddress = wildcard *).
12. Click Run.
13. Click Finished Searches and then click the number of matches returned to see the results.
We could also simply delete the filter and create a new one.
TIBCO LogLogic® Log Management Intelligence (LMI) User Guide
86 | Chapter 4 Searching Collected Log Messages
Viewing All Saved Index Searches
The All Saved Searches screen displays a list of all saved searches for specific types of data based on search expressions and time intervals you have defined and saved in the past. All saved searches and types, such as Index Search, RegEx Search, Index Report, etc., that are stored in the system are visible on this page.
Click the Run icon and regenerate the report with a different time range, or click the Edit icon and change the saved report parameters before rerunning the report. You can also filter the list of saved reports displayed by title by typing a key word from the report title in the Find field and pressing Enter. The keyword or words will be highlighted in the resulting list. To restore the full list of saved reports, clear the Find field and press Enter again.
You can also create reports from this page by clicking the down-arrow in the Create Report button and selecting among Index Search, Regular Expression Search, and Real Time Viewer.
• For more information on Real Time Viewer, see Viewing Log Messages in Real Time on page 46.
• For more information on Index Search, see Using Index Search on page 52.
• For more information on Regular Expression Search, see Using Regular Expression Search on page 70.
TIBCO LogLogic® Log Management Intelligence (LMI) User Guide
Using and Creating All Index Reports | 87
Using and Creating All Index Reports
Use the All Index Reports screen to view a list of all saved searches for specific types of data based on search expressions and time intervals you defined. You can use these results to verify information found in your reports.
The results provide the number of hits for each selected search filter, which you can view in a table or a graphical chart. From the table, you can drill down to view the specific hits for a filter in detail similar to Index Search results.
To create an Index Report
1. From Search menu, select All Index Reports submenu.
2. Click Create Report to open the Properties window.
3. Select log sources from the right-hand pane. You can select sources by appliance, and filter returns by Name, IP Address, Group or Type.
a. If you picked “Name”, enter a Source Name, a specific Device Name or a Name Mask. Wild cards are accepted in this field.
b. If you picked "Collector Domain", enter the name of the Collector Domain. This is the name used to identify each message sent from a specific device.
c. If you picked “IP Address”, enter a Source IP Address, a specific IP Address or an IP Address Mask. Wild cards are accepted in this field.
d. If you picked “Group”, enter a Group Name, or click the down arrow to the right of the text field and select “All” or one of the other Group names displayed in the drop-down box.
e. If you picked “Type”, enter a Source Type (a specific device type), or click the down arrow to the right of the text field and select “All” or one of the other Device Types displayed in the drop-down box
4. Click <<Add as a rule, and enter a name in the text field of the dynamic rule pop-up.
5. Click OK to add the selected source and filters to the left-hand pane.
6. On the right-hand pane select a device name (or names) from the list by clicking its name.
7. Click <<Add selected log sources to add devices from the selected source to which you want to apply the filters when running the report.
8. Click Columns and Filters to select the columns for your report and choose filters for your results. Click in the field under the Value column and enter a
TIBCO LogLogic® Log Management Intelligence (LMI) User Guide
88 | Chapter 4 Searching Collected Log Messages
term for the filter (such as login, id, etc.). Then click in the field under the Operator column and pick an operator from the drop-down.
Click Apply. The selected operator and value will move to the left-hand column.
9. Click Index Report Search Selections to select from the available expressions to be used in the report. If none are available, click New Expression... to add a new Boolean search expression for use in any Index Report.
10. In the Add Search Expression... popup that appears, enter Name, Description, Expression, and then click Sharing to define whether others can use or modify the new filter. Click Save.
11. Place a checkmark next to the new search expression and click << Apply Selections to add them to the left-hand pane for use in filtering your report. Then click Save As.
12. Enter a name and description of the report in the pop-up. Select Share with others if desired. Click Save & Close. The new report will appear in the list of all saved Index Reports.
13. Click in the Name field and enter a term to search for entries in the Saved Reports list. Hit Enter. Any term found in the list of report titles will be highlighted; all other reports not containing the search term will no longer show in the list of Saved Reports. Clear the search term in the Name field and hit Enter to see all Saved Reports again.
14. Click the Run icon in the Actions column. The Date and Time Range Picker pops up, with Last Hour as the default setting. Click the down arrow next to Last Hour to reveal several other options (Last 2, 3, 6 12 18 or 24 Hours; Today; Yesterday). Select the timeframe from the Date and Time Range Picker, and click Run again to execute the report.
On the results page, click Display Chart. Both Pie and Bar charts are available. The chart segments can be highlighted by mousing over them. Right-clicking on the chart or segments opens a print menu.
Do not use < or > in your search expression as these are not valid characters.
TIBCO LogLogic® Log Management Intelligence (LMI) User Guide
Creating and Managing Alerts | 89
Chapter 5 Creating and Managing Alerts
Alerts notify you of any unusual traffic on the network or detect anomalies on log sources or the LogLogic appliance itself.
You can create alerts specific to your monitoring needs, and use alerts that come pre-configured with TIBCO LogLogic® Compliance Suites or TIBCO LogLogic®
Log Source Packages (LSP). You can also update existing alerts or remove them as needed. Similarly, you can define a new custom alert template and manage the existing custom alert templates. Using the template variables, you can define the alert email subject and alert message body for custom alerts.
You can import/export the custom alert templates and formats between appliances. For more details, refer to the TIBCO LogLogic® Log Management Intelligence (LMI) Administration Guide.
For any alert, you can designate SNMP trap receivers, Syslog receivers, and Email recipients so people can receive notification of alerts via email.
Topics
• Viewing and Handling Alerts on page 90
• Manage Alert Templates on page 93
• Adding a New Alert Template Format on page 93
• Viewing and Modifying an Alert Template on page 97
• Removing an Alert Template on page 98
• Managing Alert Rules on page 99
• Adding a New Alert Rule on page 101
• Modifying or Removing An Alert on page 107
TIBCO LogLogic® Log Management Intelligence (LMI) User Guide
90 | Chapter 5 Creating and Managing Alerts
Viewing and Handling Alerts
The Show Triggered Alerts page lists events triggered by rules defined for this appliance to monitor and report on. The Show Triggered Alerts page lets you:
• View all alerts
• Filter shown alerts by alert category, priority, alert type, and keywords
• View all system alerts only, regardless of priority
• Change the alert category to Acknowledged
• Delete the alerts permanently
• (Management Station only) View alerts on a specific managed appliance or on all managed appliances
When an alert is triggered, Alert Viewer shows the alert category as New.
To filter and view alerts
1. Choose Alerts > Show Triggered Alerts from the home page.
2. Select the type of alerts to display from the Show drop-down menu.
— All States shows all alerts in all categories.
— New or Acknowledged Alerts shows only alerts in the selected category.
3. Select the alert priority to view from the second drop-down menu. The options are: All Priorities, High, Medium, Low, and All System Alerts. To view all system alerts regardless of priority, select All System Alerts.
4. Select the type of alert from the third drop-down menu. To view all types of alerts, select All Types.
5. (Management Station only) Select the appliance from which to view triggered alerts. To aggregate alerts from all managed appliances into a single list, select All.
When the Data Privacy mode is enabled, these types of alerts will not be displayed on the Show Triggered Alerts page: VPN Connection Alert, VPN Statistic Alert, VPN Message Alert, Pre-defined Search Filter Alert, Cisco PIX/ASA Messages Alert, and Network Policy Alert. For more information on Data Privacy mode, see Managing System Settings chapter in the TIBCO LogLogic® Log Management Intelligence (LMI) Administration Guide.
TIBCO LogLogic® Log Management Intelligence (LMI) User Guide
Viewing and Handling Alerts | 91
6. To filter using the keywords, enter the keywords in the Find field and press Enter. To search based on Priority and Type, select the respective drop-down menus. For the remaining columns, enter the keyword in the Find field to filter the list.
The filtered results will be displayed.
The Show Triggered Alerts page displays the specified alerts with the following details:
To page through and move alerts
To page through multiple results to your query:
• Use the navigation buttons to go to the first, previous, next, or last page, respectively.
• Type the page number and click to view the results on a specific page
To acknowledge or remove alerts:
• To move alerts to the Acknowledged category, select their checkboxes and click .
• To delete selected alerts, select their checkboxes and click .
• To delete all alerts permanently, regardless of priority, click .
• To print alerts, click .
Table 22 Alert Details
Element Description
Time Time the alert triggered.
Source IP Source IP address contained in the syslog message. If an alert is for multiple devices, Device Group is shown as the Source IP.
Priority The priority of the alert. An alert's priority is specified in the General tab.
Type The Log appliance alert type. For a list of alert types, see Table 26 on page 100 and see Table 27 on page 102.
Alert Destination Email addresses, trap receivers, or syslog receiver where notifications were sent when the alert triggered.
TIBCO LogLogic® Log Management Intelligence (LMI) User Guide

92 | Chapter 5 Creating and Managing Alerts
• To open help, click .
Move an alert to the Acknowledged category once you have been notified of the alert. Remove an alert once the cause of the alert is corrected.
TIBCO LogLogic® Log Management Intelligence (LMI) User Guide
Manage Alert Templates | 93
Manage Alert Templates
The Manage Alert Templates menu allows you to define a new alert template format and manage the custom alert templates. Using the template variables, you can edit the alert message.
The Manage Alert Templates page displays the following details:
Adding a New Alert Template FormatYou can define a new alert template format using the Add New Alert Format option.
To add an alert
1. Choose Alerts > Manage Alert Templates from the navigation menu.
2. The Manage Alert Templates page appears.
3. Click the Add New button. The Add New Alert Format window appears.
4. Define a template name in the Name field. This must a unique name for each template.
5. From the Alert Type drop-down menu, select the type of alert.
Table 23 Manage Alert Templates Details
Element Description
Filter By Names Filter using the template names. Enter the keywords and press Enter to view the filtered list.
Name Name of the alert template.
Type Type of the alert.
Template Type Type of template.
Max Message Length
Indicates the maximum character length (including the alert email subject and the alert message) that will be displayed.
Used By Alert(s) Click the List link to view a list of alerts used by this template.
For an ST appliance, only four alert types are available: Adaptive Baseline Alert, Message Volume Alert, Search Filter Alert, and System Alert.
TIBCO LogLogic® Log Management Intelligence (LMI) User Guide
94 | Chapter 5 Creating and Managing Alerts
6. Select the Template Type from the drop-down menu. The options are: Email, Alert History, SNMP Trap, and Syslog. Once you select the template type, the default body for the selected type appears in the Body field.
7. Select a variable from the Variables list.
8. Once you select a variable, the actual string for the selected variable appears in the Variable Text field.
TIBCO LogLogic® Log Management Intelligence (LMI) User Guide
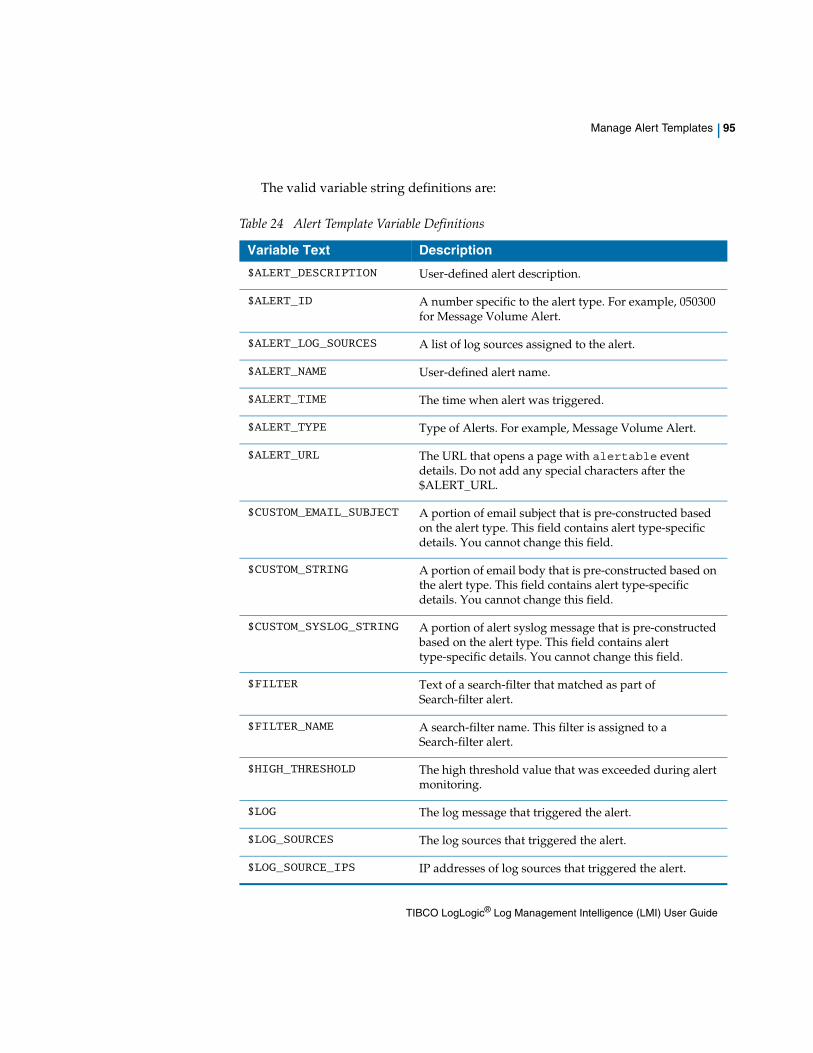
Manage Alert Templates | 95
The valid variable string definitions are:
Table 24 Alert Template Variable Definitions
Variable Text Description
$ALERT_DESCRIPTION User-defined alert description.
$ALERT_ID A number specific to the alert type. For example, 050300 for Message Volume Alert.
$ALERT_LOG_SOURCES A list of log sources assigned to the alert.
$ALERT_NAME User-defined alert name.
$ALERT_TIME The time when alert was triggered.
$ALERT_TYPE Type of Alerts. For example, Message Volume Alert.
$ALERT_URL The URL that opens a page with alertable event details. Do not add any special characters after the $ALERT_URL.
$CUSTOM_EMAIL_SUBJECT A portion of email subject that is pre-constructed based on the alert type. This field contains alert type-specific details. You cannot change this field.
$CUSTOM_STRING A portion of email body that is pre-constructed based on the alert type. This field contains alert type-specific details. You cannot change this field.
$CUSTOM_SYSLOG_STRING A portion of alert syslog message that is pre-constructed based on the alert type. This field contains alert type-specific details. You cannot change this field.
$FILTER Text of a search-filter that matched as part of Search-filter alert.
$FILTER_NAME A search-filter name. This filter is assigned to a Search-filter alert.
$HIGH_THRESHOLD The high threshold value that was exceeded during alert monitoring.
$LOG The log message that triggered the alert.
$LOG_SOURCES The log sources that triggered the alert.
$LOG_SOURCE_IPS IP addresses of log sources that triggered the alert.
TIBCO LogLogic® Log Management Intelligence (LMI) User Guide
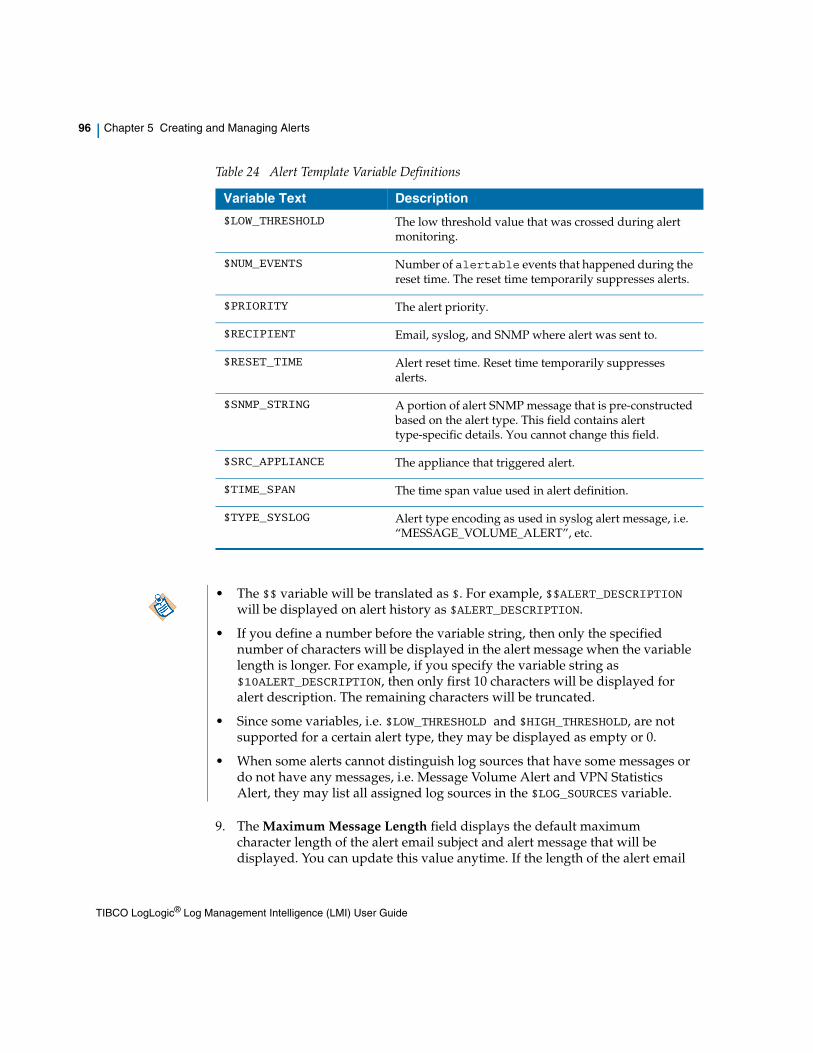
96 | Chapter 5 Creating and Managing Alerts
9. The Maximum Message Length field displays the default maximum character length of the alert email subject and alert message that will be displayed. You can update this value anytime. If the length of the alert email
$LOW_THRESHOLD The low threshold value that was crossed during alert monitoring.
$NUM_EVENTS Number of alertable events that happened during the reset time. The reset time temporarily suppresses alerts.
$PRIORITY The alert priority.
$RECIPIENT Email, syslog, and SNMP where alert was sent to.
$RESET_TIME Alert reset time. Reset time temporarily suppresses alerts.
$SNMP_STRING A portion of alert SNMP message that is pre-constructed based on the alert type. This field contains alert type-specific details. You cannot change this field.
$SRC_APPLIANCE The appliance that triggered alert.
$TIME_SPAN The time span value used in alert definition.
$TYPE_SYSLOG Alert type encoding as used in syslog alert message, i.e. “MESSAGE_VOLUME_ALERT”, etc.
Table 24 Alert Template Variable Definitions
Variable Text Description
• The $$ variable will be translated as $. For example, $$ALERT_DESCRIPTION will be displayed on alert history as $ALERT_DESCRIPTION.
• If you define a number before the variable string, then only the specified number of characters will be displayed in the alert message when the variable length is longer. For example, if you specify the variable string as $10ALERT_DESCRIPTION, then only first 10 characters will be displayed for alert description. The remaining characters will be truncated.
• Since some variables, i.e. $LOW_THRESHOLD and $HIGH_THRESHOLD, are not supported for a certain alert type, they may be displayed as empty or 0.
• When some alerts cannot distinguish log sources that have some messages or do not have any messages, i.e. Message Volume Alert and VPN Statistics Alert, they may list all assigned log sources in the $LOG_SOURCES variable.
TIBCO LogLogic® Log Management Intelligence (LMI) User Guide
Manage Alert Templates | 97
subject and alert message is longer than the specified value, then the email subject will be truncated.
10. When you select the Template Type as Email, the Subject field appears with default subject. Add or change the subject description that will appear in the email. You must enter either email Subject or email Body. You cannot keep both these fields blank.
11. Add or change the default body of the selected template type in the Body field. You can select multiple variables. When adding, make sure you copy and paste the exact variable string (from Variable Text field) in the Body field.
12. Click the Add button to save the new template format. The newly added template will be displayed on the Manage Alert Templates page.
Viewing and Modifying an Alert TemplateYou can only view the default (system defined) alert templates. You cannot edit or delete the default alert templates. However, you can update or delete the custom (user defined) templates.
To view the default alert template format
1. Choose Alerts > Manage Alert Templates from the navigation menu.
2. Click on the default alert template name to view the format details. The following illustration displays the Network Policy Email template format.
To modify a custom alert template format
1. Choose Alerts > Manage Alert Templates from the navigation menu.
2. The Manage Alert Templates page appears.
3. Click on the template name to update the format details. You can only update the custom alert templates.
4. Make the necessary changes. Click the Update button to save the changes.
When the selected Template Type is Email, the default maximum character length is 65503.
You cannot have <subject>, </subject>, <body>, and </body> tags in the Subject or Body field.
TIBCO LogLogic® Log Management Intelligence (LMI) User Guide

98 | Chapter 5 Creating and Managing Alerts
5. If you wish to save the template format with a different name for a later use, update the template Name and click Save As.
Removing an Alert TemplateYou cannot delete the default alert templates. However, you can delete the custom alert templates.
To remove an alert template
1. Choose Alerts > Manage Alert Templates from the navigation menu.
2. Select the checkbox next to the template name and click the Remove selected template(s) button (that is located above the list on the top banner). You can only delete the custom templates.
3. Click Yes on the confirmation window to delete the selected alert template. The confirmation window lists all associated alert rules for the selected template.
The selected template will be removed from the Manage Alert Template list.
When you delete the selected template, all associated alert rules that are using this template will use the default templates.
TIBCO LogLogic® Log Management Intelligence (LMI) User Guide
Managing Alert Rules | 99
Managing Alert Rules
Manage Alert Rules lets you define rules to detect unusual traffic on your network or detect appliance system anomalies. You can add, modify, or remove alerts. You can configure alerts to generate SNMP events, syslog receiver and/or send an email notification when the alert rule is triggered. Each appliance includes a default set of alerts. You can modify these alerts and add to them as needed. You do not need to set up an SNMP or syslog server for the default alerts.
The Manage Alert Rules page displays the following details:
Preconfigured System AlertsSystem Alerts notify you when system health and status criteria exceed the acceptable bounds. All LogLogic appliances include several system alerts that are preconfigured and enabled. By default, these alerts have:
• Email notifications sent to the appliance admin user
• Priority set to high
If you have the Manage Alerts privileges, you can modify or delete alerts created by other users.
Table 25 Manage Alert Rules Details
Element Description
Find Filter using the keywords. Enter the keywords in the Find field and press Enter.
Name Name of the alert.
Type Type of the alert.
Priority The defined priority of the alert.
Enabled Indicates whether the alert is active:
—You must assign a User and Alert Receiver for this alert.
—You must assign a Device for this alert.
Description Description of the alert.
TIBCO LogLogic® Log Management Intelligence (LMI) User Guide
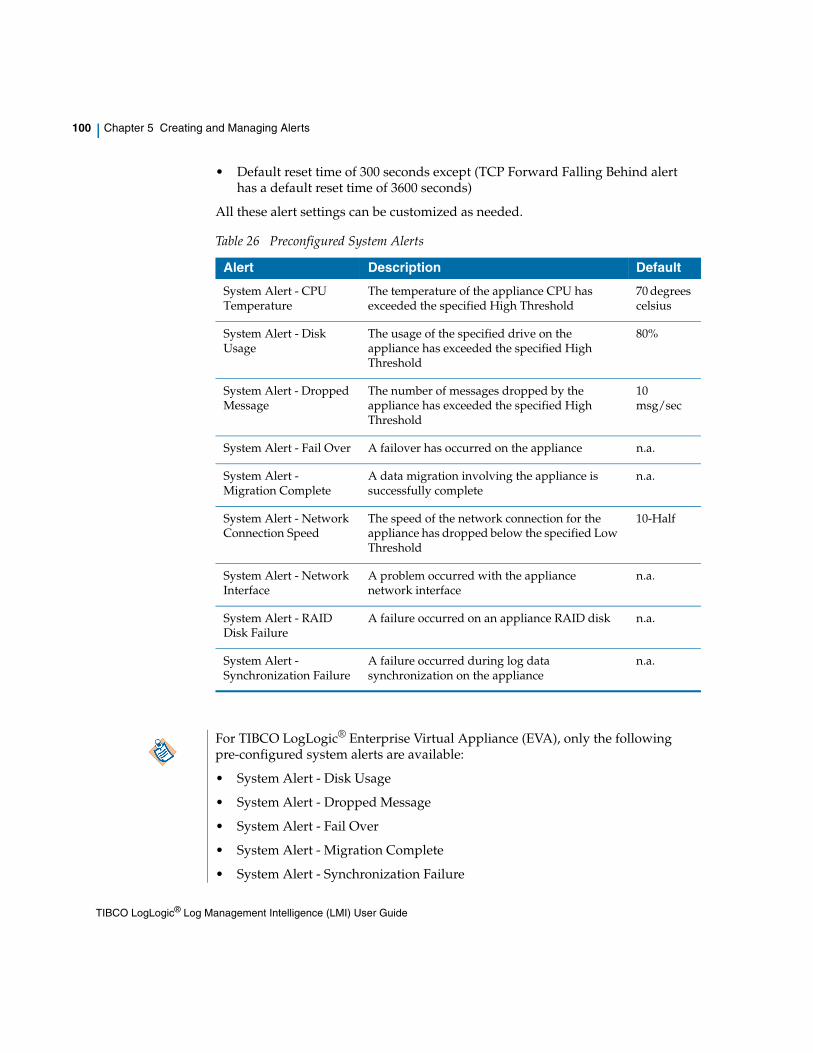
100 | Chapter 5 Creating and Managing Alerts
• Default reset time of 300 seconds except (TCP Forward Falling Behind alert has a default reset time of 3600 seconds)
All these alert settings can be customized as needed.
Table 26 Preconfigured System Alerts
Alert Description Default
System Alert - CPU Temperature
The temperature of the appliance CPU has exceeded the specified High Threshold
70 degrees celsius
System Alert - Disk Usage
The usage of the specified drive on the appliance has exceeded the specified High Threshold
80%
System Alert - Dropped Message
The number of messages dropped by the appliance has exceeded the specified High Threshold
10 msg/sec
System Alert - Fail Over A failover has occurred on the appliance n.a.
System Alert - Migration Complete
A data migration involving the appliance is successfully complete
n.a.
System Alert - Network Connection Speed
The speed of the network connection for the appliance has dropped below the specified Low Threshold
10-Half
System Alert - Network Interface
A problem occurred with the appliance network interface
n.a.
System Alert - RAID Disk Failure
A failure occurred on an appliance RAID disk n.a.
System Alert - Synchronization Failure
A failure occurred during log data synchronization on the appliance
n.a.
For TIBCO LogLogic® Enterprise Virtual Appliance (EVA), only the following pre-configured system alerts are available:
• System Alert - Disk Usage
• System Alert - Dropped Message
• System Alert - Fail Over
• System Alert - Migration Complete
• System Alert - Synchronization Failure
TIBCO LogLogic® Log Management Intelligence (LMI) User Guide
Managing Alert Rules | 101
Adding a New Alert RuleAdding an alert to the appliance involves selecting the type of alert, enabling the alert, specifying the log sources to monitor, and specifying alert recipients (SNMP traps, syslog receivers, and email user IDs).
Modifying an alert lets you change the same options available here for adding an alert.
To add an alert rule
1. Choose Alerts > Manage Alert Rules from the navigation menu.
2. Click the Add New button.
3. In the Type tab, select an alert type.
When setting up an alert, do not pick search expressions with variables in them. Doing so treats variables as having a literal meaning.
TIBCO LogLogic® Log Management Intelligence (LMI) User Guide
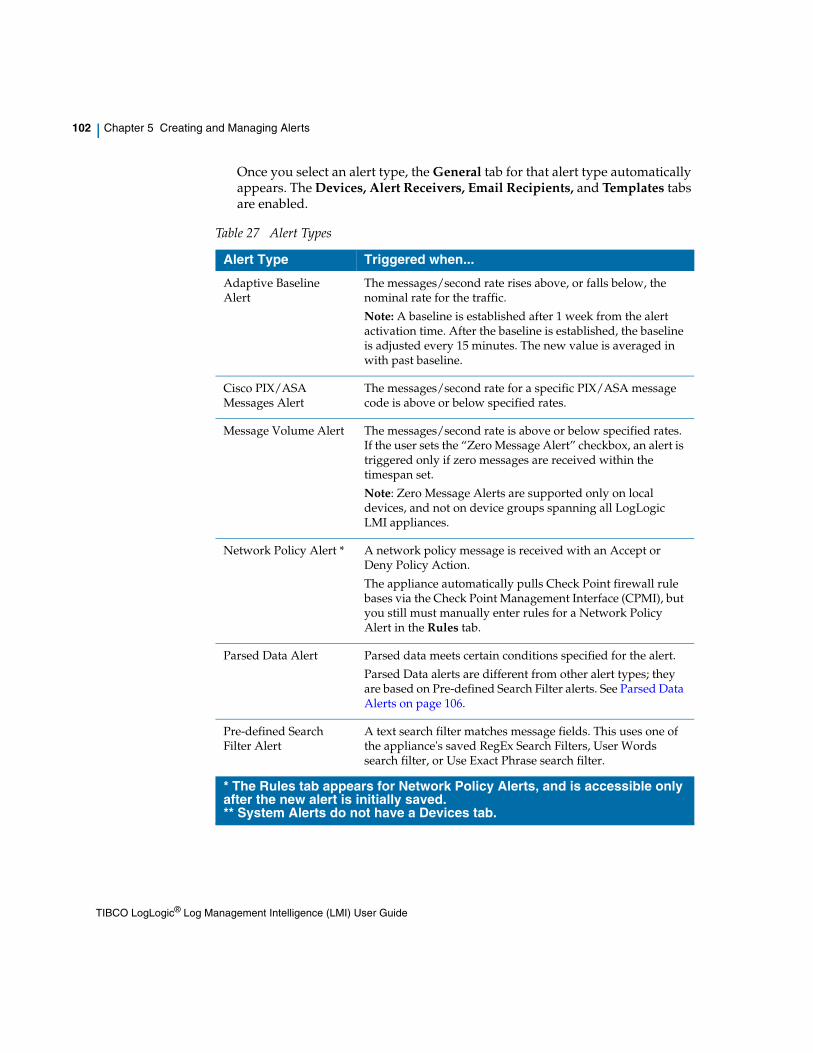
102 | Chapter 5 Creating and Managing Alerts
Once you select an alert type, the General tab for that alert type automatically appears. The Devices, Alert Receivers, Email Recipients, and Templates tabs are enabled.
Table 27 Alert Types
Alert Type Triggered when...
Adaptive Baseline Alert
The messages/second rate rises above, or falls below, the nominal rate for the traffic.
Note: A baseline is established after 1 week from the alert activation time. After the baseline is established, the baseline is adjusted every 15 minutes. The new value is averaged in with past baseline.
Cisco PIX/ASA Messages Alert
The messages/second rate for a specific PIX/ASA message code is above or below specified rates.
Message Volume Alert The messages/second rate is above or below specified rates. If the user sets the “Zero Message Alert” checkbox, an alert is triggered only if zero messages are received within the timespan set.
Note: Zero Message Alerts are supported only on local devices, and not on device groups spanning all LogLogic LMI appliances.
Network Policy Alert * A network policy message is received with an Accept or Deny Policy Action.
The appliance automatically pulls Check Point firewall rule bases via the Check Point Management Interface (CPMI), but you still must manually enter rules for a Network Policy Alert in the Rules tab.
Parsed Data Alert Parsed data meets certain conditions specified for the alert.
Parsed Data alerts are different from other alert types; they are based on Pre-defined Search Filter alerts. See Parsed Data Alerts on page 106.
Pre-defined Search Filter Alert
A text search filter matches message fields. This uses one of the appliance's saved RegEx Search Filters, User Words search filter, or Use Exact Phrase search filter.
* The Rules tab appears for Network Policy Alerts, and is accessible only after the new alert is initially saved.** System Alerts do not have a Devices tab.
TIBCO LogLogic® Log Management Intelligence (LMI) User Guide
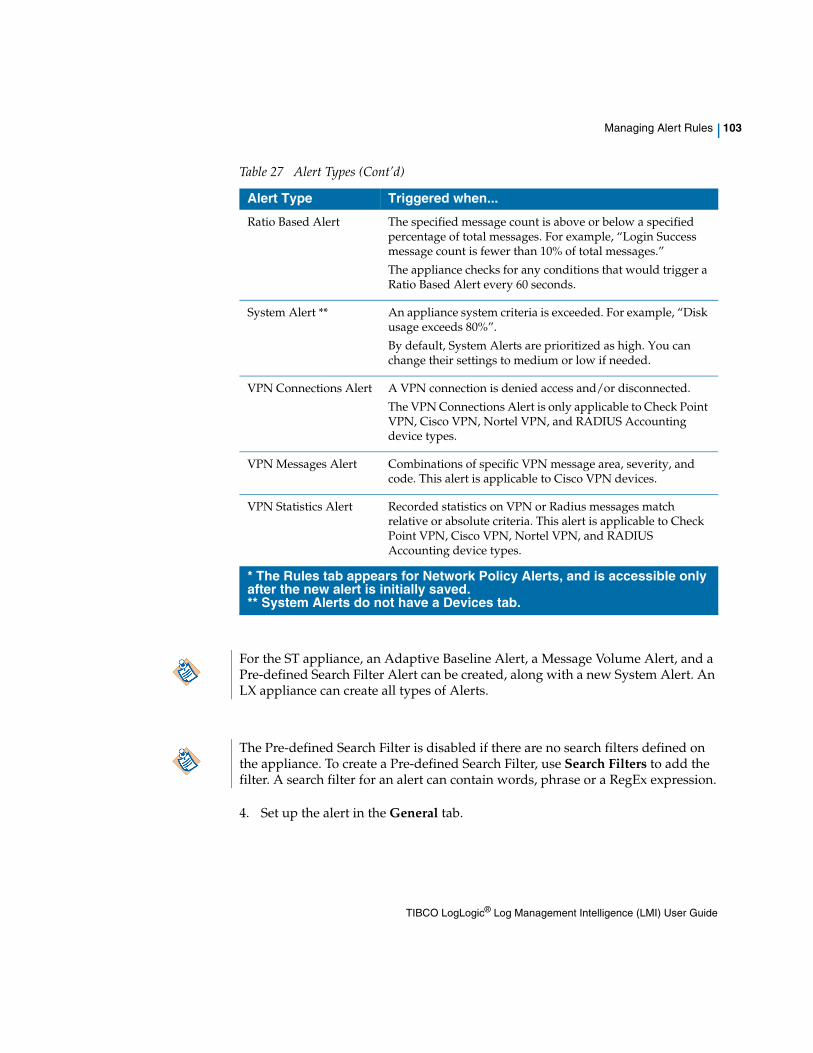
Managing Alert Rules | 103
4. Set up the alert in the General tab.
Ratio Based Alert The specified message count is above or below a specified percentage of total messages. For example, “Login Success message count is fewer than 10% of total messages.”
The appliance checks for any conditions that would trigger a Ratio Based Alert every 60 seconds.
System Alert ** An appliance system criteria is exceeded. For example, “Disk usage exceeds 80%”.
By default, System Alerts are prioritized as high. You can change their settings to medium or low if needed.
VPN Connections Alert A VPN connection is denied access and/or disconnected.
The VPN Connections Alert is only applicable to Check Point VPN, Cisco VPN, Nortel VPN, and RADIUS Accounting device types.
VPN Messages Alert Combinations of specific VPN message area, severity, and code. This alert is applicable to Cisco VPN devices.
VPN Statistics Alert Recorded statistics on VPN or Radius messages match relative or absolute criteria. This alert is applicable to Check Point VPN, Cisco VPN, Nortel VPN, and RADIUS Accounting device types.
Table 27 Alert Types (Cont’d)
Alert Type Triggered when...
* The Rules tab appears for Network Policy Alerts, and is accessible only after the new alert is initially saved.** System Alerts do not have a Devices tab.
For the ST appliance, an Adaptive Baseline Alert, a Message Volume Alert, and a Pre-defined Search Filter Alert can be created, along with a new System Alert. An LX appliance can create all types of Alerts.
The Pre-defined Search Filter is disabled if there are no search filters defined on the appliance. To create a Pre-defined Search Filter, use Search Filters to add the filter. A search filter for an alert can contain words, phrase or a RegEx expression.
TIBCO LogLogic® Log Management Intelligence (LMI) User Guide
104 | Chapter 5 Creating and Managing Alerts
Options on the General tab vary depending on the alert type. For a complete list of options for a specific alert type, see the Online Help for that alert type. These steps include typical options:
a. Enter a Name for the alert.
b. Set the alert Priority. (High is the default.)
c. Select to Enable the alert. This enables the alert once you click the Add button.
d. (Optional) Enter a specific SNMP OID to further define the alert.
For example, this is helpful to define so your administrator/receiver knows that all alerts triggered with this SNMP OID originates from a specific device and alert.
e. Enter a Description for the alert.
f. Select the Enable Schedule checkbox to specify the time period for scheduling the alerts. Select the appropriate Time and Day box to specify the schedule. The selected box turns blue. To remove any particular time slot, click on the blue box.
5. Specify log sources for the alert in the Devices tab.
All the log sources on the appliance are listed in Available Devices. When you move a device to the Selected Devices section, the alerts you configure are activated for those devices. You can define different alerts for different devices.
For available devices where the Collector Domain was specified in a UC the following format; <collector domainid>_<device IP>_<devicetype> will be displayed. For example a windows machine with an IP address of 10.10.10.10 and collector domain will be displayed as 1_10.10.10.10._windows.
Select the Track all devices individually checkbox to generate independent alert messages for each selected device. The reset time tracks for the group as a
Enter a name and description unique enough to easily identify the alert in a large list.
TIBCO LogLogic® Log Management Intelligence (LMI) User Guide
Managing Alert Rules | 105
whole and you can change alert properties using one alert for the device group.
6. Specify SNMP trap receivers and syslog receivers for the alert in the Alert Receivers tab.
You can define alerts for both SNMP traps, syslog receivers and users or for SNMP traps only. The Alert Receivers tab lists all the available traps and syslog for the appliance. You must configure SNMP traps, syslog receivers, and/or add specific traps.For more information about Alert Receivers, see the TIBCO LogLogic® Log Management Intelligence (LMI) Administration Guide.
7. Specify people to receive alerts via email in the Email Recipients tab.
You can define alerts for both users and SNMP traps or for users only. Available Users lists all the users available for the appliance.
For more information about adding users, see the TIBCO LogLogic® Log Management Intelligence (LMI) Administration Guide.
8. Select templates for each alert type from the drop-down menu. The Templates tab displays all available templates for each alert type: History, SNMP, Syslog, and Email.Once you select the template, the format is displayed below.
By default, the Default option for the Alert Email Template is selected to send the default email message. In this case, from the Message Size drop-down, select Long or Short message forms. Place a check in the Enable View Alert Detail from Email checkbox to provide additional alert detail in email. To define or modify template formats, see Manage Alert Templates on page 93.
9. The Rules tab is enabled only for Network Policy Alerts. The Rules tab allows for defining the Accept (or Deny) Source and Destination IP Address Ranges,
When configuring any alerts (except for System Alerts) on logs transferred using LogLogic TCP, the alert reporting can be slightly less than real-time. Because LogLogic TCP sends data in chunks that the appliance incrementally merges, an alert can appear anywhere between real-time and up to 5 minutes later. As a result, for example, Message Volume rates can be determined when averaging over a 5 minute or greater increment, but do not provide meaningful averages for smaller timespans. For Cisco PIX/ASA Messages alerts, the Timespan setting should be at least 60 seconds.
Email messages that include an alert are limited to 1024 bytes. Any additional alert text is truncated in the email message.
TIBCO LogLogic® Log Management Intelligence (LMI) User Guide
106 | Chapter 5 Creating and Managing Alerts
Port Ranges, and Protocols. When adding a Network Policy alert, you must save the alert and then modify it to access the Rules tab.Use the Rules tab to define parameters for the alert. For example, define firewall policy rules you want to monitor for this alert. A single alert can have a single rule or multiple rules. You must add an alert before defining rules. You can define up to 1000 rules for each alert. If you leave the fields blank and add the rule, you are still defining an alert. The appliance accepts all values if you leave the fields blank.
10. Click the Add button to add the new alert to the appliance.
Parsed Data AlertsParsed Data alerts are created differently from other alert types. There is no Parsed Data alert type to select in the interface; its creation is based on a Pre-defined Search Filter alert. The Filter specifies matching values that are extracted by the parser from the log messages.
To use Parsed Data alert, you need to know the name of the database table where parsed logs will be stored along with the column names. You can find the exact column names using the Management > Column Manager page to create the search filter for this alert type. For more information, see Managing Column Manager chapter in the TIBCO LogLogic® Log Management Intelligence (LMI) Administration Guide. When specifying the matching values, data type should be considered for the relevant table columns. For example, IP address must be a numeric type, i.e. 32-bit integer and not the string representation such as 169.1.1.1.
1. Create a Pre-defined Search Filter:
a. Name the filter.
b. For filter type, select Use Exact Phrase.
c. For the DB table, specify _table=. (Only one _table= entry is allowed.)
d. Specify columns and values to match as name/value pairs separated by columns. For example:_table=Authentication,actionID=2,statusID=4
The Devices, Alert Receivers, and Email Recipients tabs list disabled log sources, receivers, or recipients marked as (disabled). Disabled entries are ignored during processing, but are listed in these tabs so they’re automatically present when enabled again (via the Management > Devices, Administration > Alert Receivers, or Management > Users tabs, respectively).
TIBCO LogLogic® Log Management Intelligence (LMI) User Guide
Managing Alert Rules | 107
2. Create a Pre-defined Search Filter alert:
a. Name the Search Filter alert with a prefix _parsed. For example, _parsed_Login Failure.
b. Select the Pre-defined Search Filter you created for this alert.
Usage notes:
— Parsed data alerts apply only to messages from configured log sources.
— Parsed data alerts apply only to the tables configured in the alert.
— Parsed data alerts are not supported on ST appliances.
— Do not configure the same alert for both real-time and pulled data files. Create separate alerts for each, with the same search expression.
Modifying or Removing An AlertYou can modify alert settings or remove alerts from the Manage Alert Rules page. The same tabs appear when you add an alert (see Adding a New Alert Rule on page 101.
To edit, or remove an existing alert rule
1. Click the alert name in the Name column.
2. View the settings for the Alert Rule on the General tab, the Alert Receivers tab, the Email Recipients tab, and the Templates tab. Change the settings and click Update or Cancel to retain.
3. To remove an existing alert, click the alert’s checkbox and then click the Remove button. The Remove Alerts tab appears, where you can confirm or cancel the removal.
TIBCO LogLogic® Log Management Intelligence (LMI) User Guide

108 | Chapter 5 Creating and Managing Alerts
TIBCO LogLogic® Log Management Intelligence (LMI) User Guide
Generating Real-Time Reports | 109
Chapter 6 Generating Real-Time Reports
Real-Time Reports let you search and generate reports for monitoring various real-time activities derived from the log data that is collected from your log sources. Each Real-Time Report category contains multiple specific reports.
Topics
• Preparing a Real-Time Report on page 110
• Access Control Reports on page 119
• Database Activity Reports on page 128
• IBM i5/OS Activity Reports on page 134
• Threat Management Reports on page 148
• Mail Activity Reports on page 158
• Network Activity Reports on page 166
• Operational Reports on page 185
• Policy Reports on page 192
• Enterprise Content Management on page 197
• HP NonStop Audit on page 202
• IBM z/OS Activity on page 209
• Storage Systems Activity on page 216
• Flow Activity on page 218
• All Saved Reports on page 222
Depending on LSP packages, and your selected log sources, you may see different types of reports, columns, and optional filters for each report.
TIBCO LogLogic® Log Management Intelligence (LMI) User Guide
110 | Chapter 6 Generating Real-Time Reports
Preparing a Real-Time Report
The Real-Time Reports are a central component to LogLogic’s Agile Reporting, which lets you quickly view detailed information about your collected log data, catered to your specific needs.
Real-Time Reports can take longer than Saved Reports because they run against all up-to-the-minute raw log data, not against stored summarized log data. Real-Time Reports capture all hits in collected raw log data that meet the report's criteria.
To generate a Real-Time Report, refer to the procedure and illustrations shown in Generating a Report: An Example on page 114.
Select a Source or Sources and Search Filters
1. In the navigation menu under Reports, select the category and type of report to generate.
2. Click Create Report to open the Properties window.
When two devices have the same IP address but only one has a Collector Domain ID users might see duplicate data (data combined from both domains).
TIBCO LogLogic® Log Management Intelligence (LMI) User Guide
Preparing a Real-Time Report | 111
3. Under Add Log Sources, click the down arrow next to Select and pick a filter (Name, Collector Domain IP Address, Group or Type) to filter returns.
a. If you picked “Name”, enter a Source Name, a specific Device Name or a Name Mask. Wild cards are accepted in this field.
b. If you picked "Collector Domain", enter the name of the Collector Domain. This is the name used to identify each message sent from a specific device.
c. If you picked “IP Address”, enter a Source IP Address, a specific IP Address or an IP Address Mask. Wild cards are accepted in this field.
d. If you picked “Group”, enter a Group Name, or click the down arrow to the right of the text field and select “All” or one of the other Group names displayed in the drop-down box.
e. If you picked “Type”, enter a Source Type (a specific device type), or click the down arrow to the right of the text field and select “All” or one of the other Device Types displayed in the drop-down box.
4. If desired, add a second filter by clicking the + sign and repeating Step 3 as often as you like.
5. To delete a filter, click the - sign to remove the last selection made (repeat if needed). Do not click Cancel unless you want to cancel your report.
6. Click <<Add as a rule, and enter a name in the text field of the dynamic rule pop-up.
7. Click OK to add the selected source and filters to the left-hand pane.
8. Select a device name (or names) by clicking its name.
9. Click <<Add selected log sources to add devices from the selected source to which you want to apply the filters when running the report.
10. Click Run to initiate a report of the selected source and devices with the filters you chose in Step 3.
Select Time Frame and Run a Report
1. When you click Run in Step 10, the Date and Time Range Picker pops up, with Last Hour as the default setting. Click the down arrow next to Last Hour to reveal several other options (Last 2, 3, 6 12 18 or 24 Hours; Today; Yesterday).
When adding a large number of devices, create a dynamic rule which contains all listed devices. To create a rule, first filter by Name or Type to retrieve the list of devices. Then, click the << Add filters as a rule button that will create a dynamic rule which contains all listed devices on the right pane.
TIBCO LogLogic® Log Management Intelligence (LMI) User Guide
112 | Chapter 6 Generating Real-Time Reports
2. To select a different date range, click the small calendar icon to the right of the current Date and Hour display and chose any month and day for the start of the report period. Move to the right and click the second small calendar icon to chose any month and day for the end of the report period.
3. Click Run again to execute the report.
Resize & Move Columns, Create Charts, Print and Download a Report
1. On the results page, you may resize and move the columns to the positions you prefer by clicking on them and dragging.
2. To see detailed information for a particular Source device, click the number of returns for the device in the Count column.
3. Click <back to summarized results and then click Display Chart. Both Pie and Bar charts are available. The chart segments can be highlighted by mousing over them. Right-clicking on the chart or segments opens a print menu.
4. Reports may be downloaded in CSV, PDF, or HTML format by clicking on the icons below the Display Chart button.
Modify Report Settings and Time Frame
1. Clicking the Edit Settings button opens up a Properties window again, this time allowing you to Add Columns and Filters if desired.
2. Enter your selections for Add Columns and Filters (if any) and click Save As.
3. Enter a name and description for the report in the pop-up window. Select Share with others if desired. Click Save & Close.
4. Click Run Again to execute your report with the new filtering criteria. The new report will appear in the list of all Saved Reports (from Reports > All Saved Reports).
5. Click the date range (blue type at top left) to modify the timeframe for your report. The Date and Time Range Picker appears, with Last Hour as the default setting. Follow the steps listed in Select Time Frame and Run a Report on page 111.
The charts are populated based on column that is used as a data source. For example, Denied Connections: On Demand (Chart for: Attempts); where Attempts is the column name that is used as a data source for the chart. If you need to display a chart based on different column, you must sort the report by the column, and the column must have numeric values.
TIBCO LogLogic® Log Management Intelligence (LMI) User Guide
Preparing a Real-Time Report | 113
6. From the list of Saved Reports (access Reports > All Saved Reports), you may click Run or Edit to modify the report settings of any Saved Report.
7. To search for a particular report or report series in the Saved Reports list, click in the Find field and enter a search term.
8. Press Enter. Any term found in the list of report titles will be highlighted; all other reports not containing the search term will no longer show in the list of Saved Reports. Clear the search term in the Find field and press Enter to see all Saved Reports again.
9. You may add a schedule for a Saved Report by clicking the report Name and then clicking Schedule selected.
The Scheduling window opens. You can define a Timeframe, Email Recipients (pre-defined system users), and Formatting options. Click the Manage Recipients button to update the appliance address book. Using this option, you can add new or modify recipient addresses that are non-defined system users (that are not defined under Management > Users page).
10. You may delete a Saved Report from the list by clicking the report Name and then clicking Remove selected. You will see a pop-up message asking you to Confirm Deletion.
Saving a Generated Report
There are several options for saving a generated report, available from the icons at the top of the report results:
• Save as CSV—Downloads and saves the report data in a comma-separated .csv file, viewable in spreadsheet applications such as Microsoft Excel.
• Save as PDF—Downloads and saves the report data in a PDF file, viewable in Acrobat format such as Adobe Acrobat Reader.
• View as HTML—Open the report data formatted in a new browser window or tab, from which you can also download the HTML file for archival.
TIBCO LogLogic® Log Management Intelligence (LMI) User Guide
114 | Chapter 6 Generating Real-Time Reports
Rerunning a Saved Report
To rerun a saved report, go to Reports > All Saved Reports and select a previously saved report. You may click the Run icon and regenerate the report with a different time range, or click the Edit icon and change the saved report parameters before rerunning the report. All options are available, not just the ones originally selected. You may customize the new report using new filters and wildcards.
Generating a Report: An ExampleThis example shows how to generate a Network Activity report that displays denied connection activity related to the IP addresses you select. The steps below apply to the generation of all reports on the appliance except the Check Point Policies report, which lists current Check Point Firewall policy rules on log sources connected to your appliance.
The other exception is All Saved Reports, which lists previous search results, saved as reports, and selected to be shared with others at the time of generation.
To generate a Denied Connections Report
1. Select Reports > Network Activity > Denied Connections from the home page menu.
2. Click the Create Report button.
3. Select the log source connected to the appliance.
4. Select log sources from the list by clicking its name (or names). Click Add selected log sources to move them to the Log Sources list.
5. Click Run to run the report.
6. Specify the time interval to search for data passing through the appliance and click Run.
7. On the Denied Connections results page, adjust the order and position of columns.
Wildcard searches are supported for IP addresses and detailed messages.
TIBCO LogLogic® Log Management Intelligence (LMI) User Guide
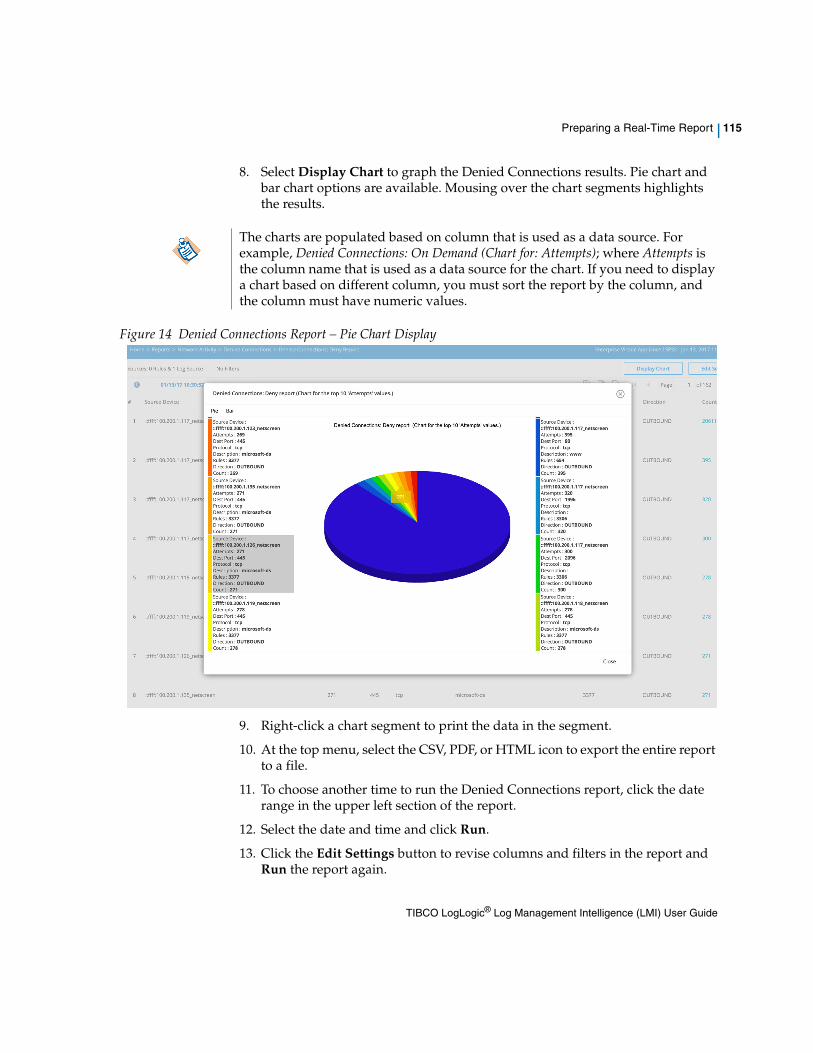
Preparing a Real-Time Report | 115
8. Select Display Chart to graph the Denied Connections results. Pie chart and bar chart options are available. Mousing over the chart segments highlights the results.
Figure 14 Denied Connections Report – Pie Chart Display
9. Right-click a chart segment to print the data in the segment.
10. At the top menu, select the CSV, PDF, or HTML icon to export the entire report to a file.
11. To choose another time to run the Denied Connections report, click the date range in the upper left section of the report.
12. Select the date and time and click Run.
13. Click the Edit Settings button to revise columns and filters in the report and Run the report again.
The charts are populated based on column that is used as a data source. For example, Denied Connections: On Demand (Chart for: Attempts); where Attempts is the column name that is used as a data source for the chart. If you need to display a chart based on different column, you must sort the report by the column, and the column must have numeric values.
TIBCO LogLogic® Log Management Intelligence (LMI) User Guide
116 | Chapter 6 Generating Real-Time Reports
To re-run and edit settings of a previously saved report (Denied Connections):
1. Select Reports > Network Activity > Denied Connections from the Home page.
2. To run the saved report, click and then click the Run button on the Date and Time Range Picker that pops up.
3. After the Denied Connections report opens, click the Edit Settings button.
4. Click Properties to open the Properties Dialog pane.
5. Enter your data and click OK.
6. To add a schedule for the Denied Connections report, click the Scheduling link.
The Add a Schedule pane opens on the right side. You can define a Timeframe, Email Recipients (pre-defined system users), and Formatting options. Click the Manage Recipients button to update the appliance address book. Using this option, you can add new or modify recipient addresses that are non-defined system users (that are not defined under Management > Users page).
7. Click the Add Schedule button at the bottom of the Timeframe pane to confirm the schedule for the Denied Connections report.
8. Click Save and Close on the Properties window to save your entries.
9. View the saved schedule for the Denied Connections report.
10. To make further changes to the Denied Connections report, repeat Steps 1 — 9.
Available OperatorsEach report has multiple filter operators available that are listed in Table 28 on page 117.
• If the value is null, you can filter using --null--.
• If the value is an empty string, you can filter using two single quotes ".
Some report columns display as empty when the actual value is either null or an empty string.
TIBCO LogLogic® Log Management Intelligence (LMI) User Guide
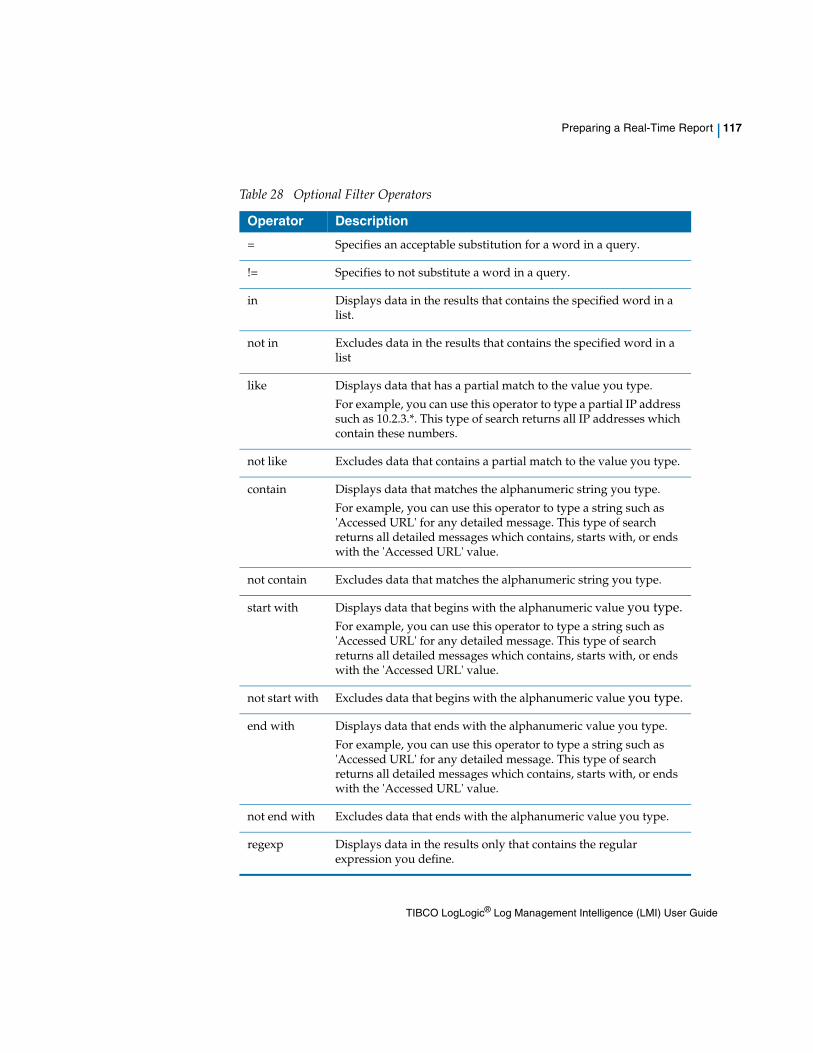
Preparing a Real-Time Report | 117
Table 28 Optional Filter Operators
Operator Description
= Specifies an acceptable substitution for a word in a query.
!= Specifies to not substitute a word in a query.
in Displays data in the results that contains the specified word in a list.
not in Excludes data in the results that contains the specified word in a list
like Displays data that has a partial match to the value you type.
For example, you can use this operator to type a partial IP address such as 10.2.3.*. This type of search returns all IP addresses which contain these numbers.
not like Excludes data that contains a partial match to the value you type.
contain Displays data that matches the alphanumeric string you type.
For example, you can use this operator to type a string such as 'Accessed URL' for any detailed message. This type of search returns all detailed messages which contains, starts with, or ends with the 'Accessed URL' value.
not contain Excludes data that matches the alphanumeric string you type.
start with Displays data that begins with the alphanumeric value you type.For example, you can use this operator to type a string such as 'Accessed URL' for any detailed message. This type of search returns all detailed messages which contains, starts with, or ends with the 'Accessed URL' value.
not start with Excludes data that begins with the alphanumeric value you type.
end with Displays data that ends with the alphanumeric value you type.
For example, you can use this operator to type a string such as 'Accessed URL' for any detailed message. This type of search returns all detailed messages which contains, starts with, or ends with the 'Accessed URL' value.
not end with Excludes data that ends with the alphanumeric value you type.
regexp Displays data in the results only that contains the regular expression you define.
TIBCO LogLogic® Log Management Intelligence (LMI) User Guide
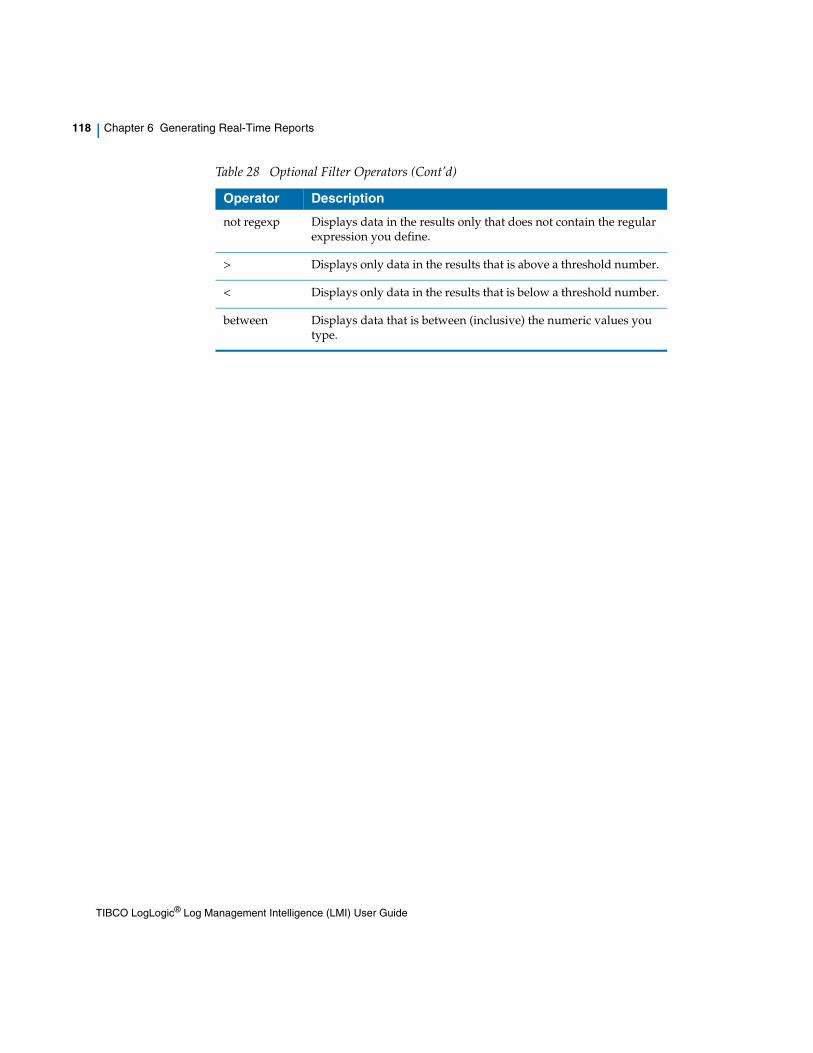
118 | Chapter 6 Generating Real-Time Reports
not regexp Displays data in the results only that does not contain the regular expression you define.
> Displays only data in the results that is above a threshold number.
< Displays only data in the results that is below a threshold number.
between Displays data that is between (inclusive) the numeric values you type.
Table 28 Optional Filter Operators (Cont’d)
Operator Description
TIBCO LogLogic® Log Management Intelligence (LMI) User Guide
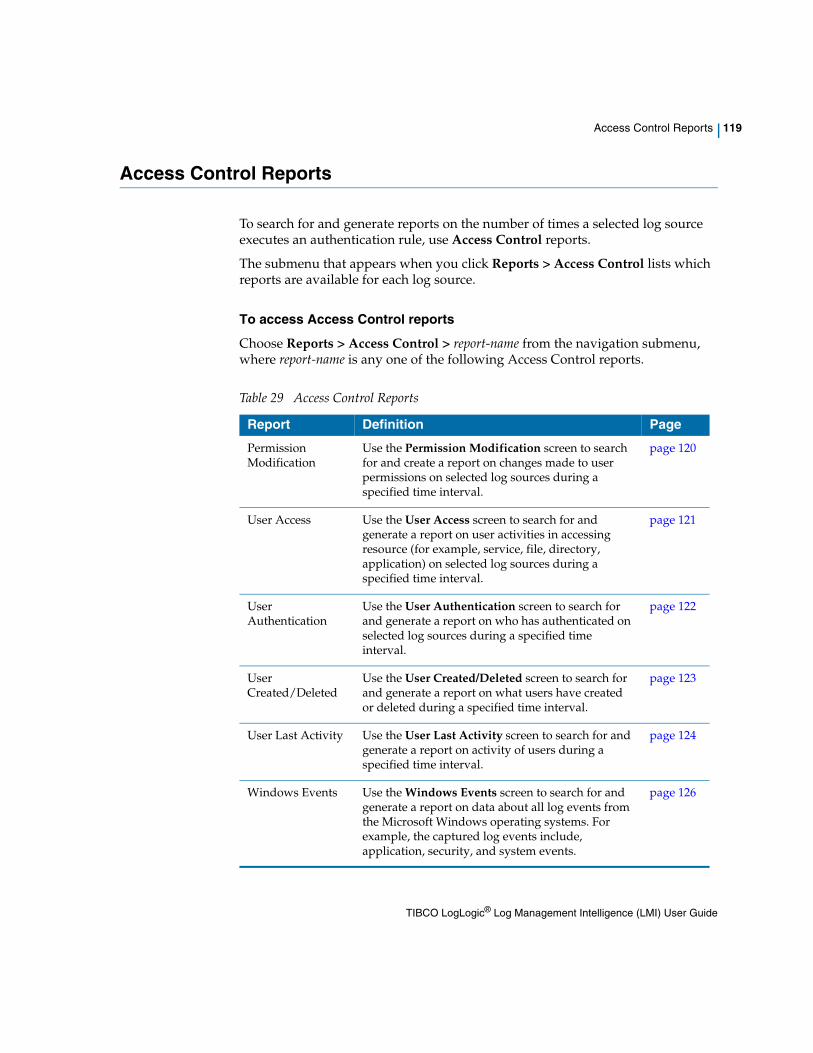
Access Control Reports | 119
Access Control Reports
To search for and generate reports on the number of times a selected log source executes an authentication rule, use Access Control reports.
The submenu that appears when you click Reports > Access Control lists which reports are available for each log source.
To access Access Control reports
Choose Reports > Access Control > report-name from the navigation submenu, where report-name is any one of the following Access Control reports.
Table 29 Access Control Reports
Report Definition Page
Permission Modification
Use the Permission Modification screen to search for and create a report on changes made to user permissions on selected log sources during a specified time interval.
page 120
User Access Use the User Access screen to search for and generate a report on user activities in accessing resource (for example, service, file, directory, application) on selected log sources during a specified time interval.
page 121
User Authentication
Use the User Authentication screen to search for and generate a report on who has authenticated on selected log sources during a specified time interval.
page 122
User Created/Deleted
Use the User Created/Deleted screen to search for and generate a report on what users have created or deleted during a specified time interval.
page 123
User Last Activity Use the User Last Activity screen to search for and generate a report on activity of users during a specified time interval.
page 124
Windows Events Use the Windows Events screen to search for and generate a report on data about all log events from the Microsoft Windows operating systems. For example, the captured log events include, application, security, and system events.
page 126
TIBCO LogLogic® Log Management Intelligence (LMI) User Guide
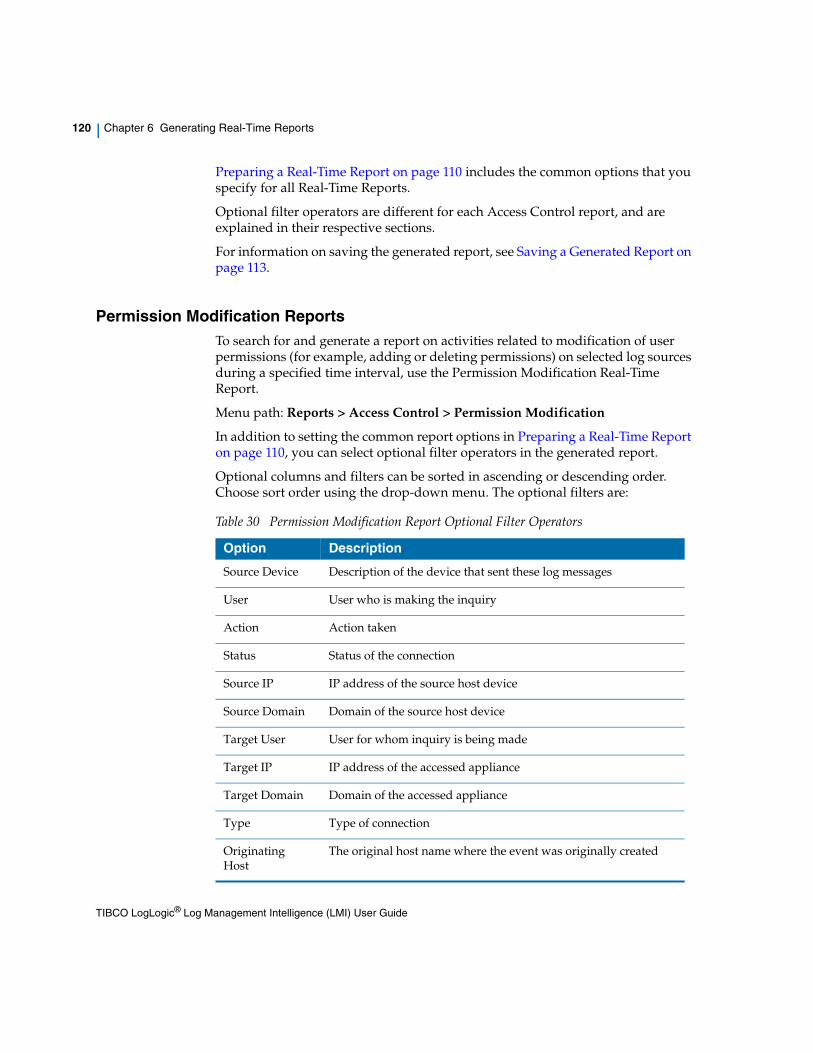
120 | Chapter 6 Generating Real-Time Reports
Preparing a Real-Time Report on page 110 includes the common options that you specify for all Real-Time Reports.
Optional filter operators are different for each Access Control report, and are explained in their respective sections.
For information on saving the generated report, see Saving a Generated Report on page 113.
Permission Modification ReportsTo search for and generate a report on activities related to modification of user permissions (for example, adding or deleting permissions) on selected log sources during a specified time interval, use the Permission Modification Real-Time Report.
Menu path: Reports > Access Control > Permission Modification
In addition to setting the common report options in Preparing a Real-Time Report on page 110, you can select optional filter operators in the generated report.
Optional columns and filters can be sorted in ascending or descending order. Choose sort order using the drop-down menu. The optional filters are:
Table 30 Permission Modification Report Optional Filter Operators
Option Description
Source Device Description of the device that sent these log messages
User User who is making the inquiry
Action Action taken
Status Status of the connection
Source IP IP address of the source host device
Source Domain Domain of the source host device
Target User User for whom inquiry is being made
Target IP IP address of the accessed appliance
Target Domain Domain of the accessed appliance
Type Type of connection
Originating Host
The original host name where the event was originally created
TIBCO LogLogic® Log Management Intelligence (LMI) User Guide
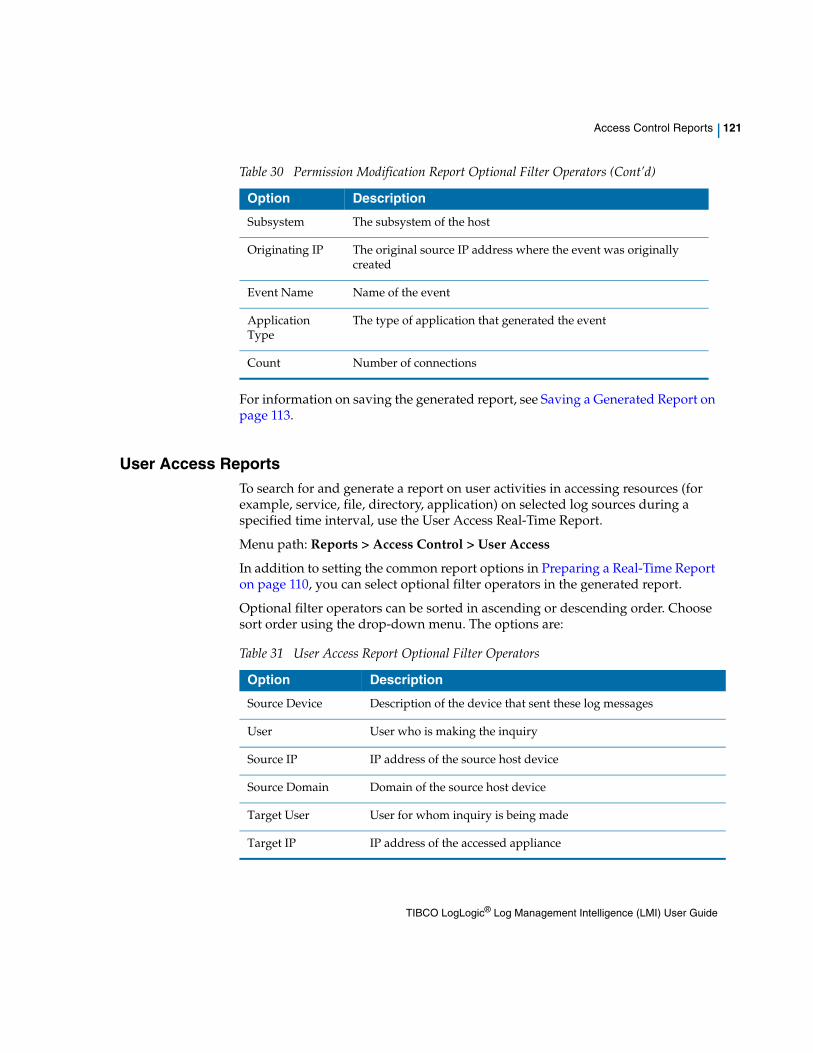
Access Control Reports | 121
For information on saving the generated report, see Saving a Generated Report on page 113.
User Access ReportsTo search for and generate a report on user activities in accessing resources (for example, service, file, directory, application) on selected log sources during a specified time interval, use the User Access Real-Time Report.
Menu path: Reports > Access Control > User Access
In addition to setting the common report options in Preparing a Real-Time Report on page 110, you can select optional filter operators in the generated report.
Optional filter operators can be sorted in ascending or descending order. Choose sort order using the drop-down menu. The options are:
Subsystem The subsystem of the host
Originating IP The original source IP address where the event was originally created
Event Name Name of the event
Application Type
The type of application that generated the event
Count Number of connections
Table 30 Permission Modification Report Optional Filter Operators (Cont’d)
Option Description
Table 31 User Access Report Optional Filter Operators
Option Description
Source Device Description of the device that sent these log messages
User User who is making the inquiry
Source IP IP address of the source host device
Source Domain Domain of the source host device
Target User User for whom inquiry is being made
Target IP IP address of the accessed appliance
TIBCO LogLogic® Log Management Intelligence (LMI) User Guide
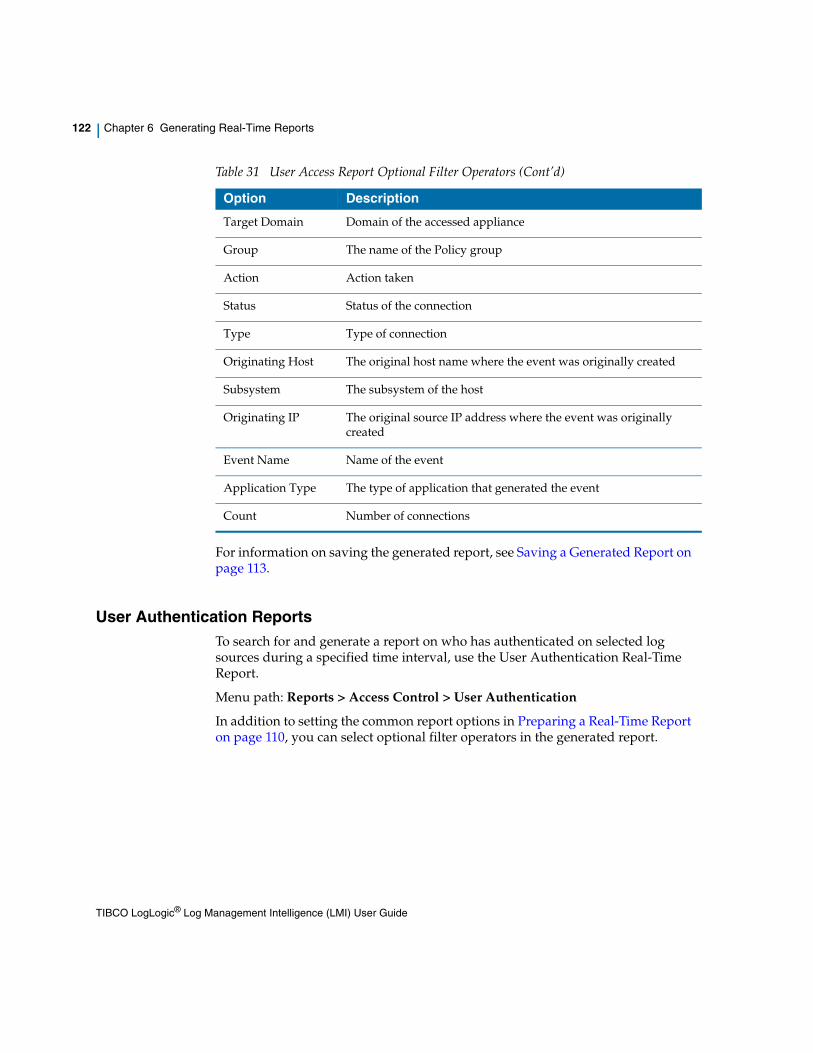
122 | Chapter 6 Generating Real-Time Reports
For information on saving the generated report, see Saving a Generated Report on page 113.
User Authentication ReportsTo search for and generate a report on who has authenticated on selected log sources during a specified time interval, use the User Authentication Real-Time Report.
Menu path: Reports > Access Control > User Authentication
In addition to setting the common report options in Preparing a Real-Time Report on page 110, you can select optional filter operators in the generated report.
Target Domain Domain of the accessed appliance
Group The name of the Policy group
Action Action taken
Status Status of the connection
Type Type of connection
Originating Host The original host name where the event was originally created
Subsystem The subsystem of the host
Originating IP The original source IP address where the event was originally created
Event Name Name of the event
Application Type The type of application that generated the event
Count Number of connections
Table 31 User Access Report Optional Filter Operators (Cont’d)
Option Description
TIBCO LogLogic® Log Management Intelligence (LMI) User Guide
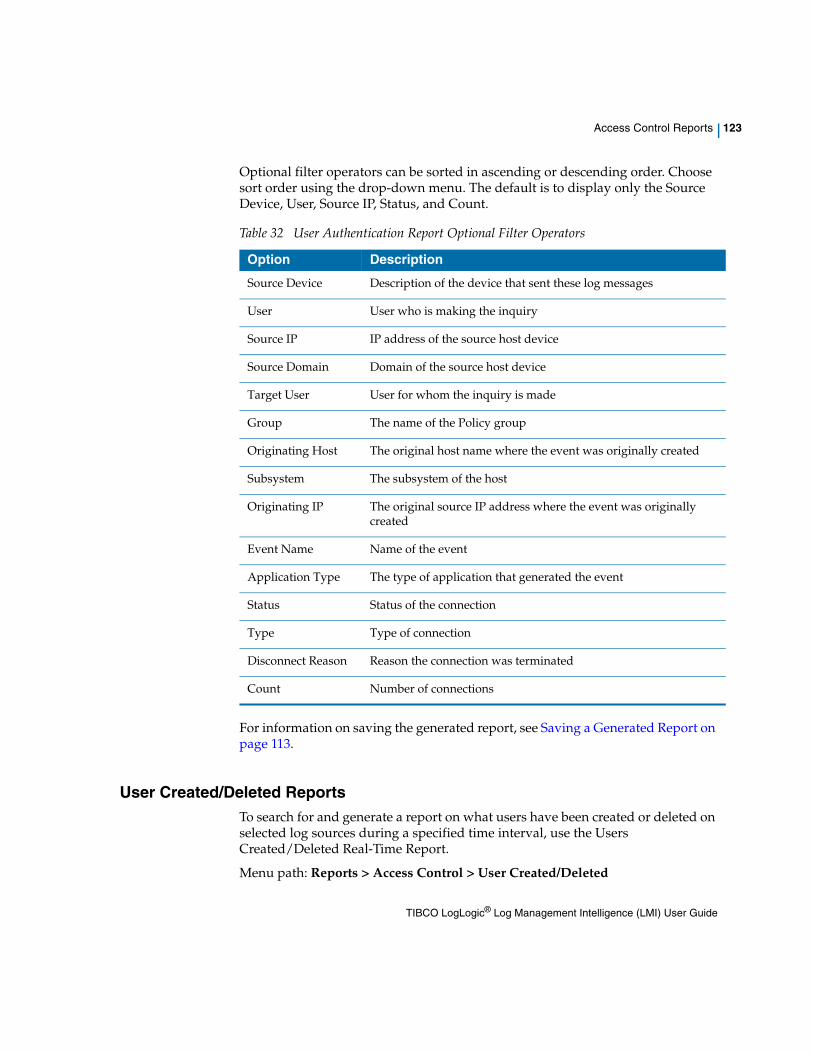
Access Control Reports | 123
Optional filter operators can be sorted in ascending or descending order. Choose sort order using the drop-down menu. The default is to display only the Source Device, User, Source IP, Status, and Count.
For information on saving the generated report, see Saving a Generated Report on page 113.
User Created/Deleted ReportsTo search for and generate a report on what users have been created or deleted on selected log sources during a specified time interval, use the Users Created/Deleted Real-Time Report.
Menu path: Reports > Access Control > User Created/Deleted
Table 32 User Authentication Report Optional Filter Operators
Option Description
Source Device Description of the device that sent these log messages
User User who is making the inquiry
Source IP IP address of the source host device
Source Domain Domain of the source host device
Target User User for whom the inquiry is made
Group The name of the Policy group
Originating Host The original host name where the event was originally created
Subsystem The subsystem of the host
Originating IP The original source IP address where the event was originally created
Event Name Name of the event
Application Type The type of application that generated the event
Status Status of the connection
Type Type of connection
Disconnect Reason Reason the connection was terminated
Count Number of connections
TIBCO LogLogic® Log Management Intelligence (LMI) User Guide
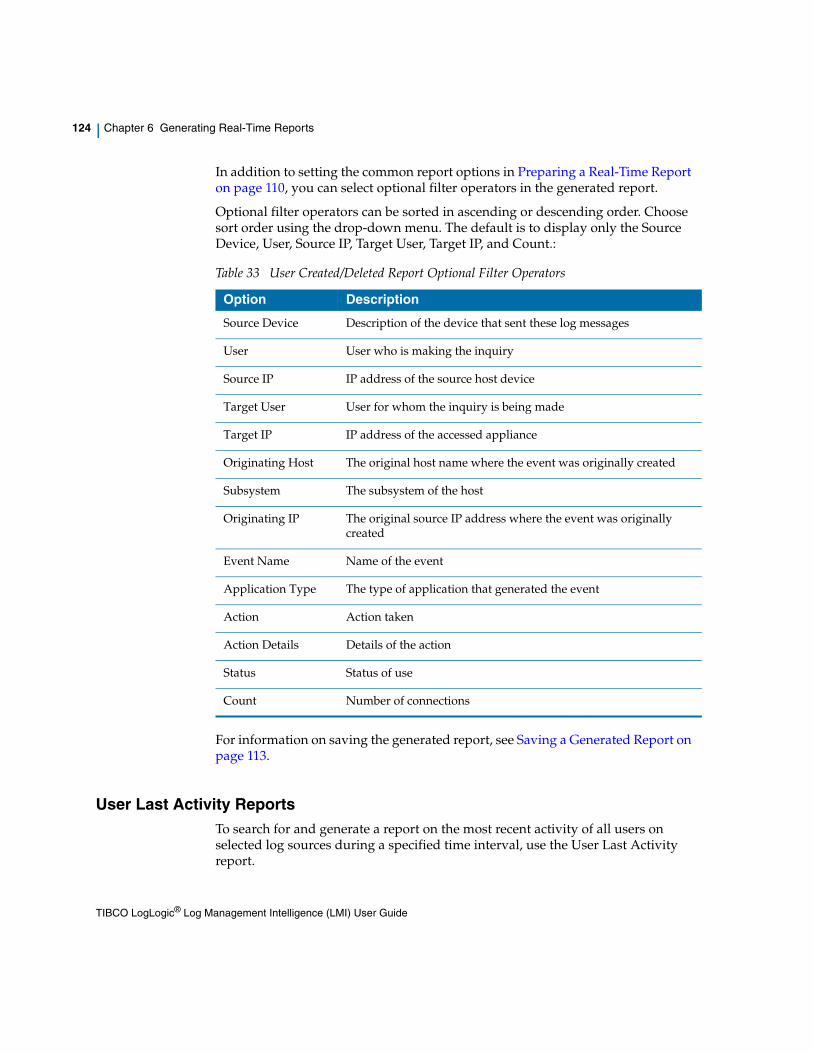
124 | Chapter 6 Generating Real-Time Reports
In addition to setting the common report options in Preparing a Real-Time Report on page 110, you can select optional filter operators in the generated report.
Optional filter operators can be sorted in ascending or descending order. Choose sort order using the drop-down menu. The default is to display only the Source Device, User, Source IP, Target User, Target IP, and Count.:
For information on saving the generated report, see Saving a Generated Report on page 113.
User Last Activity ReportsTo search for and generate a report on the most recent activity of all users on selected log sources during a specified time interval, use the User Last Activity report.
Table 33 User Created/Deleted Report Optional Filter Operators
Option Description
Source Device Description of the device that sent these log messages
User User who is making the inquiry
Source IP IP address of the source host device
Target User User for whom the inquiry is being made
Target IP IP address of the accessed appliance
Originating Host The original host name where the event was originally created
Subsystem The subsystem of the host
Originating IP The original source IP address where the event was originally created
Event Name Name of the event
Application Type The type of application that generated the event
Action Action taken
Action Details Details of the action
Status Status of use
Count Number of connections
TIBCO LogLogic® Log Management Intelligence (LMI) User Guide
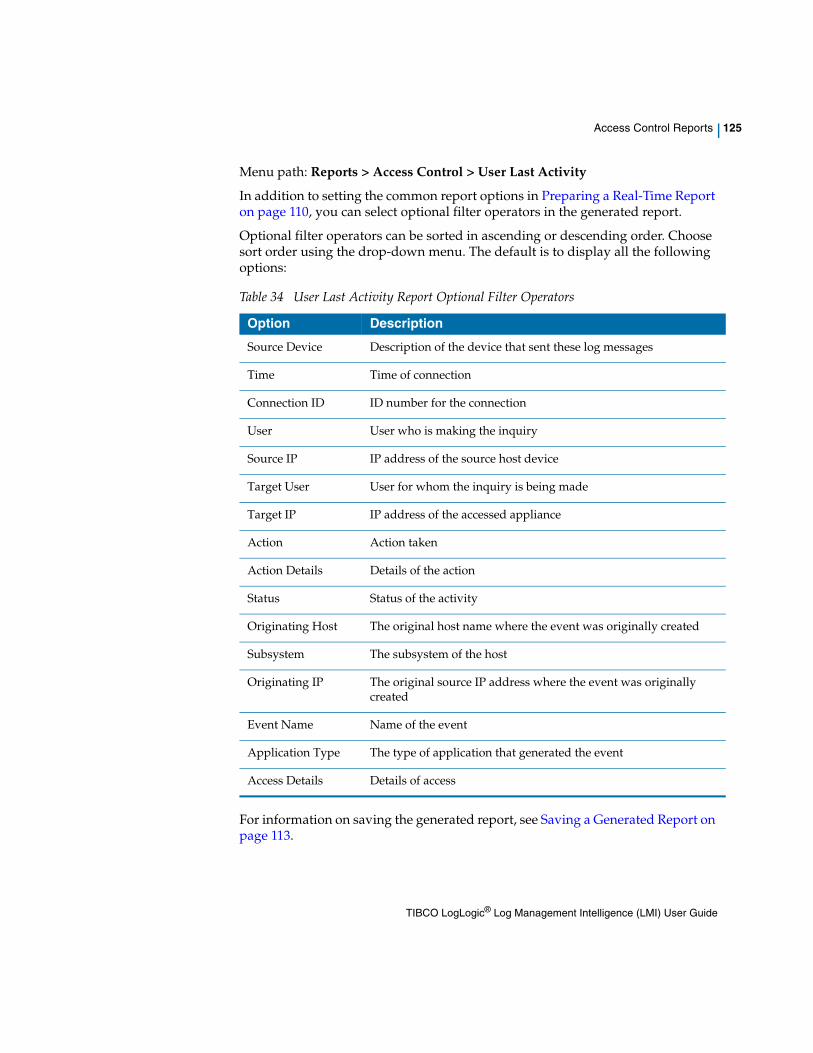
Access Control Reports | 125
Menu path: Reports > Access Control > User Last Activity
In addition to setting the common report options in Preparing a Real-Time Report on page 110, you can select optional filter operators in the generated report.
Optional filter operators can be sorted in ascending or descending order. Choose sort order using the drop-down menu. The default is to display all the following options:
For information on saving the generated report, see Saving a Generated Report on page 113.
Table 34 User Last Activity Report Optional Filter Operators
Option Description
Source Device Description of the device that sent these log messages
Time Time of connection
Connection ID ID number for the connection
User User who is making the inquiry
Source IP IP address of the source host device
Target User User for whom the inquiry is being made
Target IP IP address of the accessed appliance
Action Action taken
Action Details Details of the action
Status Status of the activity
Originating Host The original host name where the event was originally created
Subsystem The subsystem of the host
Originating IP The original source IP address where the event was originally created
Event Name Name of the event
Application Type The type of application that generated the event
Access Details Details of access
TIBCO LogLogic® Log Management Intelligence (LMI) User Guide
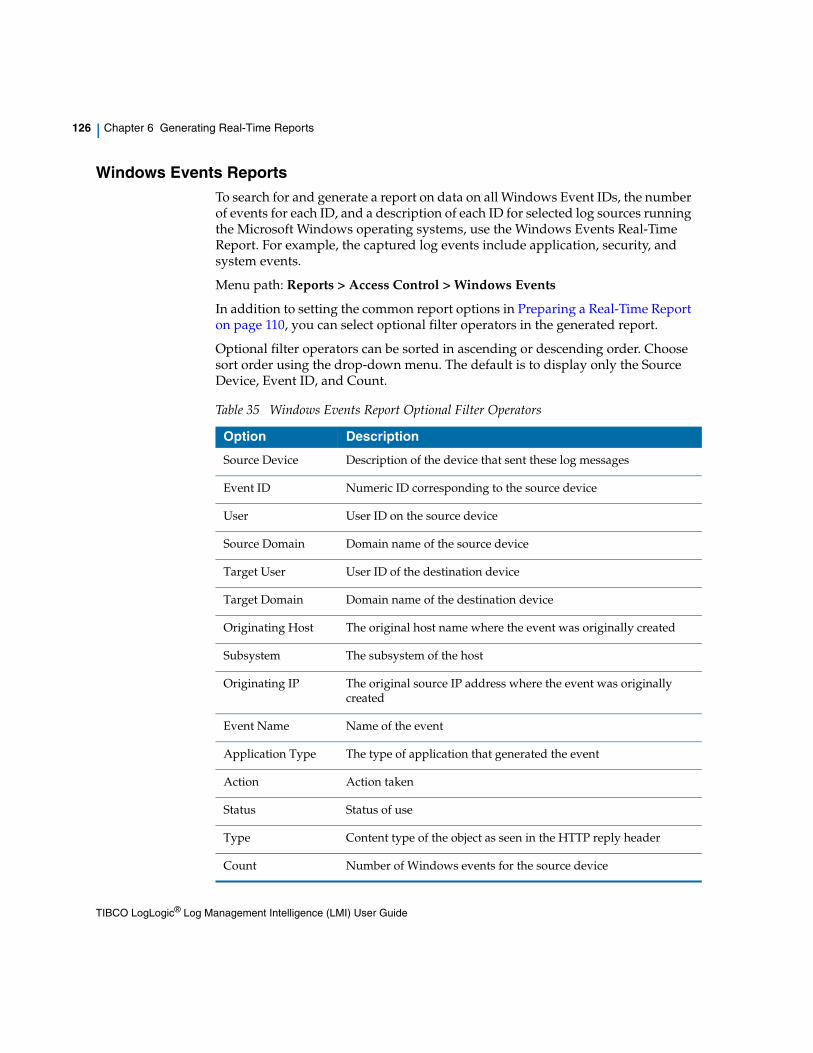
126 | Chapter 6 Generating Real-Time Reports
Windows Events ReportsTo search for and generate a report on data on all Windows Event IDs, the number of events for each ID, and a description of each ID for selected log sources running the Microsoft Windows operating systems, use the Windows Events Real-Time Report. For example, the captured log events include application, security, and system events.
Menu path: Reports > Access Control > Windows Events
In addition to setting the common report options in Preparing a Real-Time Report on page 110, you can select optional filter operators in the generated report.
Optional filter operators can be sorted in ascending or descending order. Choose sort order using the drop-down menu. The default is to display only the Source Device, Event ID, and Count.
Table 35 Windows Events Report Optional Filter Operators
Option Description
Source Device Description of the device that sent these log messages
Event ID Numeric ID corresponding to the source device
User User ID on the source device
Source Domain Domain name of the source device
Target User User ID of the destination device
Target Domain Domain name of the destination device
Originating Host The original host name where the event was originally created
Subsystem The subsystem of the host
Originating IP The original source IP address where the event was originally created
Event Name Name of the event
Application Type The type of application that generated the event
Action Action taken
Status Status of use
Type Content type of the object as seen in the HTTP reply header
Count Number of Windows events for the source device
TIBCO LogLogic® Log Management Intelligence (LMI) User Guide

Access Control Reports | 127
For information on saving the generated report, see Saving a Generated Report on page 113.
TIBCO LogLogic® Log Management Intelligence (LMI) User Guide
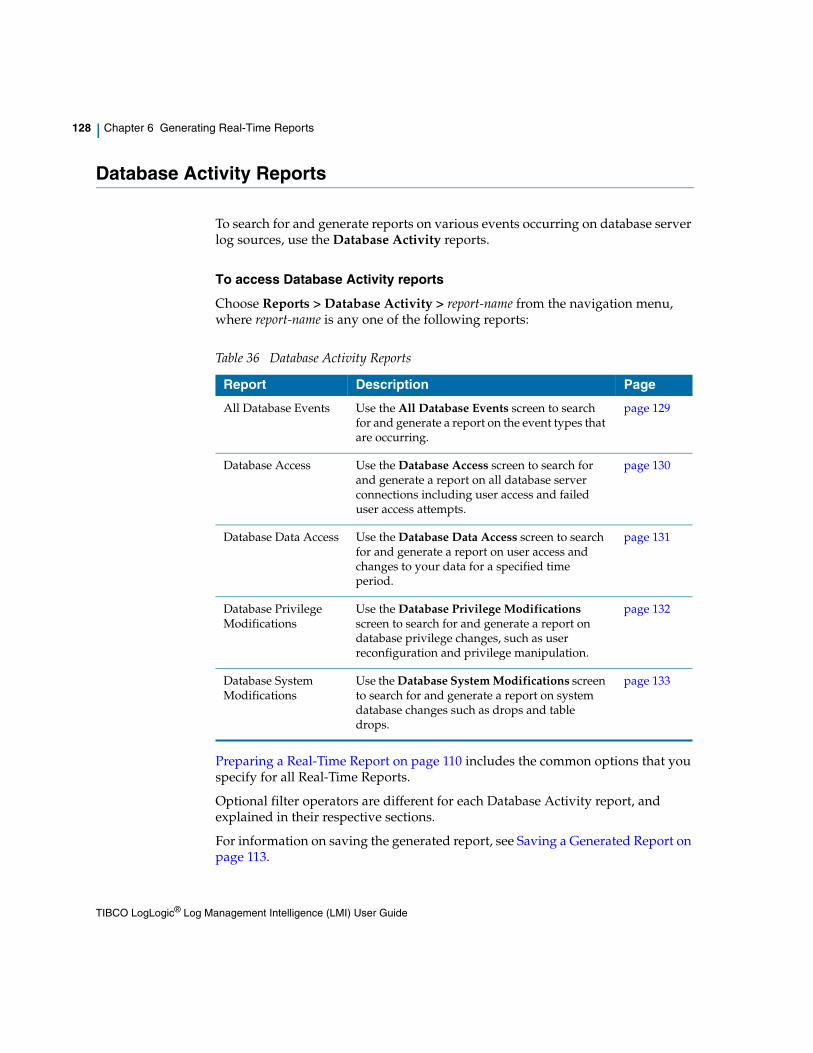
128 | Chapter 6 Generating Real-Time Reports
Database Activity Reports
To search for and generate reports on various events occurring on database server log sources, use the Database Activity reports.
To access Database Activity reports
Choose Reports > Database Activity > report-name from the navigation menu, where report-name is any one of the following reports:
Preparing a Real-Time Report on page 110 includes the common options that you specify for all Real-Time Reports.
Optional filter operators are different for each Database Activity report, and explained in their respective sections.
For information on saving the generated report, see Saving a Generated Report on page 113.
Table 36 Database Activity Reports
Report Description Page
All Database Events Use the All Database Events screen to search for and generate a report on the event types that are occurring.
page 129
Database Access Use the Database Access screen to search for and generate a report on all database server connections including user access and failed user access attempts.
page 130
Database Data Access Use the Database Data Access screen to search for and generate a report on user access and changes to your data for a specified time period.
page 131
Database Privilege Modifications
Use the Database Privilege Modifications screen to search for and generate a report on database privilege changes, such as user reconfiguration and privilege manipulation.
page 132
Database System Modifications
Use the Database System Modifications screen to search for and generate a report on system database changes such as drops and table drops.
page 133
TIBCO LogLogic® Log Management Intelligence (LMI) User Guide
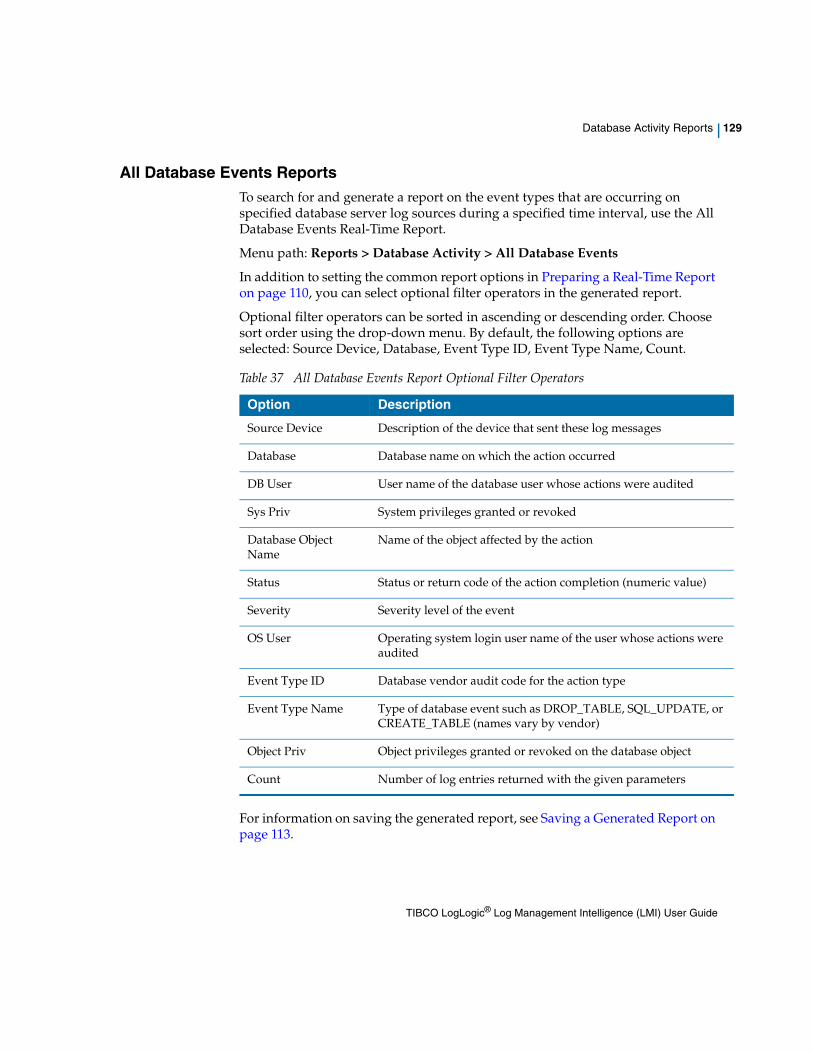
Database Activity Reports | 129
All Database Events ReportsTo search for and generate a report on the event types that are occurring on specified database server log sources during a specified time interval, use the All Database Events Real-Time Report.
Menu path: Reports > Database Activity > All Database Events
In addition to setting the common report options in Preparing a Real-Time Report on page 110, you can select optional filter operators in the generated report.
Optional filter operators can be sorted in ascending or descending order. Choose sort order using the drop-down menu. By default, the following options are selected: Source Device, Database, Event Type ID, Event Type Name, Count.
For information on saving the generated report, see Saving a Generated Report on page 113.
Table 37 All Database Events Report Optional Filter Operators
Option Description
Source Device Description of the device that sent these log messages
Database Database name on which the action occurred
DB User User name of the database user whose actions were audited
Sys Priv System privileges granted or revoked
Database Object Name
Name of the object affected by the action
Status Status or return code of the action completion (numeric value)
Severity Severity level of the event
OS User Operating system login user name of the user whose actions were audited
Event Type ID Database vendor audit code for the action type
Event Type Name Type of database event such as DROP_TABLE, SQL_UPDATE, or CREATE_TABLE (names vary by vendor)
Object Priv Object privileges granted or revoked on the database object
Count Number of log entries returned with the given parameters
TIBCO LogLogic® Log Management Intelligence (LMI) User Guide
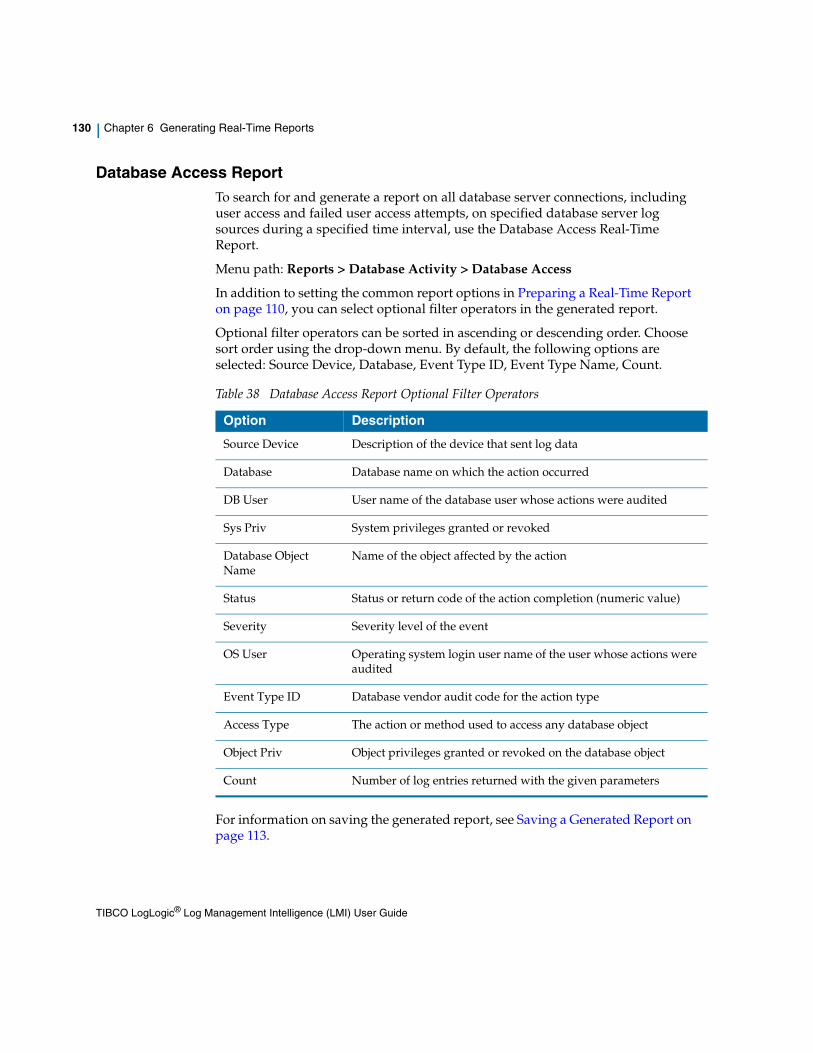
130 | Chapter 6 Generating Real-Time Reports
Database Access ReportTo search for and generate a report on all database server connections, including user access and failed user access attempts, on specified database server log sources during a specified time interval, use the Database Access Real-Time Report.
Menu path: Reports > Database Activity > Database Access
In addition to setting the common report options in Preparing a Real-Time Report on page 110, you can select optional filter operators in the generated report.
Optional filter operators can be sorted in ascending or descending order. Choose sort order using the drop-down menu. By default, the following options are selected: Source Device, Database, Event Type ID, Event Type Name, Count.
For information on saving the generated report, see Saving a Generated Report on page 113.
Table 38 Database Access Report Optional Filter Operators
Option Description
Source Device Description of the device that sent log data
Database Database name on which the action occurred
DB User User name of the database user whose actions were audited
Sys Priv System privileges granted or revoked
Database Object Name
Name of the object affected by the action
Status Status or return code of the action completion (numeric value)
Severity Severity level of the event
OS User Operating system login user name of the user whose actions were audited
Event Type ID Database vendor audit code for the action type
Access Type The action or method used to access any database object
Object Priv Object privileges granted or revoked on the database object
Count Number of log entries returned with the given parameters
TIBCO LogLogic® Log Management Intelligence (LMI) User Guide
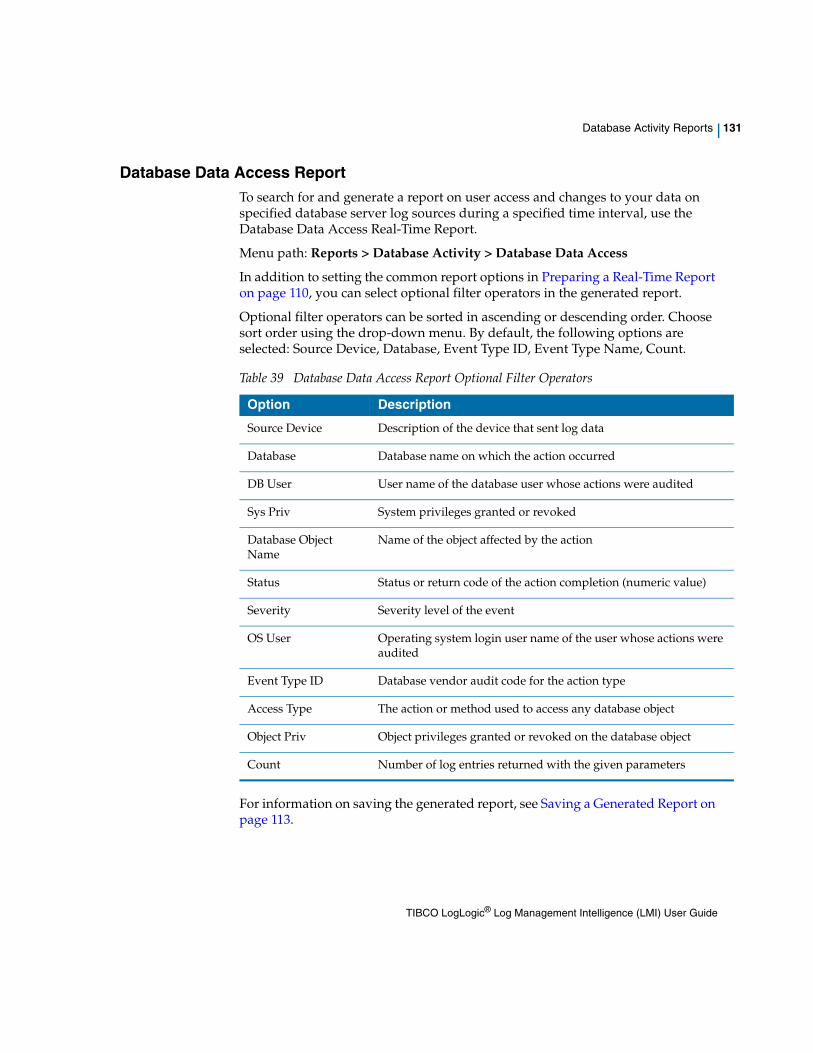
Database Activity Reports | 131
Database Data Access ReportTo search for and generate a report on user access and changes to your data on specified database server log sources during a specified time interval, use the Database Data Access Real-Time Report.
Menu path: Reports > Database Activity > Database Data Access
In addition to setting the common report options in Preparing a Real-Time Report on page 110, you can select optional filter operators in the generated report.
Optional filter operators can be sorted in ascending or descending order. Choose sort order using the drop-down menu. By default, the following options are selected: Source Device, Database, Event Type ID, Event Type Name, Count.
For information on saving the generated report, see Saving a Generated Report on page 113.
Table 39 Database Data Access Report Optional Filter Operators
Option Description
Source Device Description of the device that sent log data
Database Database name on which the action occurred
DB User User name of the database user whose actions were audited
Sys Priv System privileges granted or revoked
Database Object Name
Name of the object affected by the action
Status Status or return code of the action completion (numeric value)
Severity Severity level of the event
OS User Operating system login user name of the user whose actions were audited
Event Type ID Database vendor audit code for the action type
Access Type The action or method used to access any database object
Object Priv Object privileges granted or revoked on the database object
Count Number of log entries returned with the given parameters
TIBCO LogLogic® Log Management Intelligence (LMI) User Guide
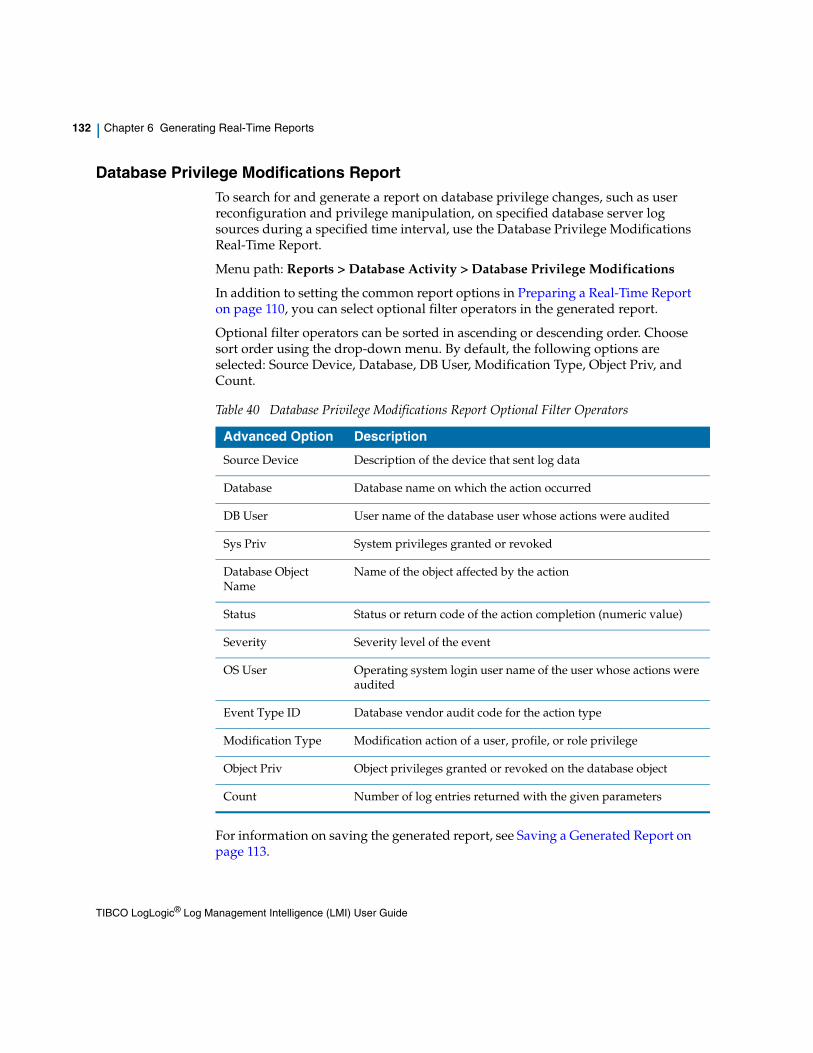
132 | Chapter 6 Generating Real-Time Reports
Database Privilege Modifications ReportTo search for and generate a report on database privilege changes, such as user reconfiguration and privilege manipulation, on specified database server log sources during a specified time interval, use the Database Privilege Modifications Real-Time Report.
Menu path: Reports > Database Activity > Database Privilege Modifications
In addition to setting the common report options in Preparing a Real-Time Report on page 110, you can select optional filter operators in the generated report.
Optional filter operators can be sorted in ascending or descending order. Choose sort order using the drop-down menu. By default, the following options are selected: Source Device, Database, DB User, Modification Type, Object Priv, and Count.
For information on saving the generated report, see Saving a Generated Report on page 113.
Table 40 Database Privilege Modifications Report Optional Filter Operators
Advanced Option Description
Source Device Description of the device that sent log data
Database Database name on which the action occurred
DB User User name of the database user whose actions were audited
Sys Priv System privileges granted or revoked
Database Object Name
Name of the object affected by the action
Status Status or return code of the action completion (numeric value)
Severity Severity level of the event
OS User Operating system login user name of the user whose actions were audited
Event Type ID Database vendor audit code for the action type
Modification Type Modification action of a user, profile, or role privilege
Object Priv Object privileges granted or revoked on the database object
Count Number of log entries returned with the given parameters
TIBCO LogLogic® Log Management Intelligence (LMI) User Guide
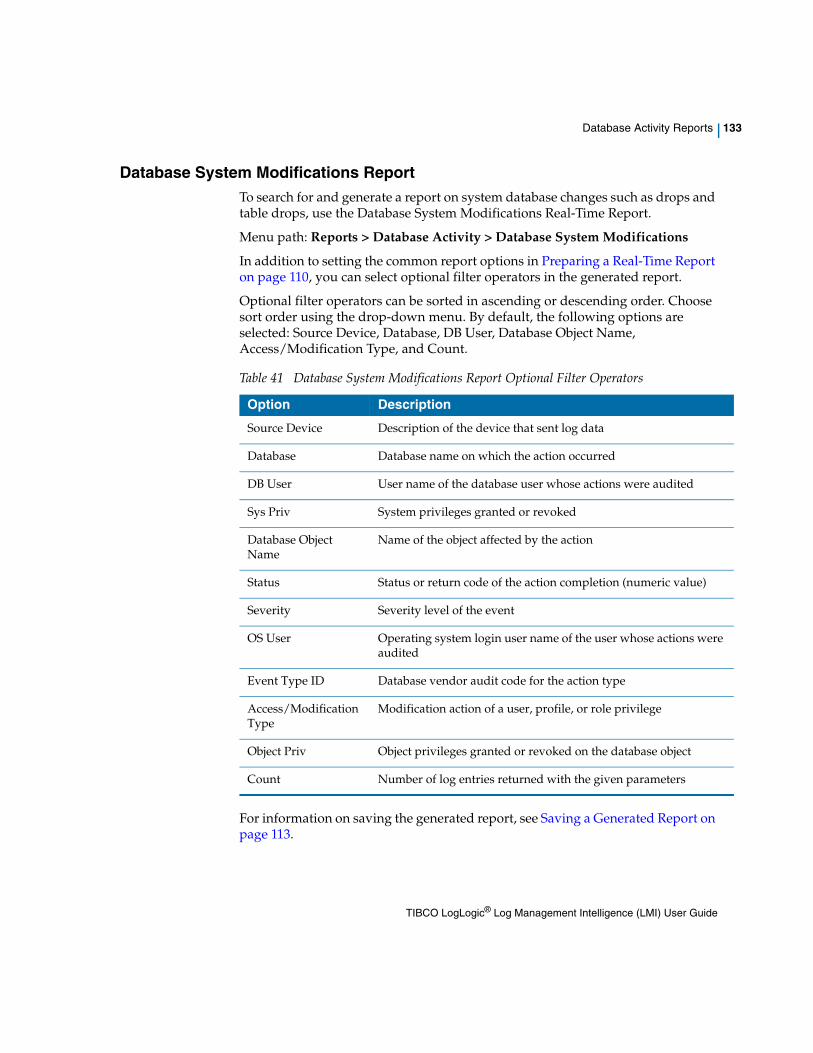
Database Activity Reports | 133
Database System Modifications ReportTo search for and generate a report on system database changes such as drops and table drops, use the Database System Modifications Real-Time Report.
Menu path: Reports > Database Activity > Database System Modifications
In addition to setting the common report options in Preparing a Real-Time Report on page 110, you can select optional filter operators in the generated report.
Optional filter operators can be sorted in ascending or descending order. Choose sort order using the drop-down menu. By default, the following options are selected: Source Device, Database, DB User, Database Object Name, Access/Modification Type, and Count.
For information on saving the generated report, see Saving a Generated Report on page 113.
Table 41 Database System Modifications Report Optional Filter Operators
Option Description
Source Device Description of the device that sent log data
Database Database name on which the action occurred
DB User User name of the database user whose actions were audited
Sys Priv System privileges granted or revoked
Database Object Name
Name of the object affected by the action
Status Status or return code of the action completion (numeric value)
Severity Severity level of the event
OS User Operating system login user name of the user whose actions were audited
Event Type ID Database vendor audit code for the action type
Access/Modification Type
Modification action of a user, profile, or role privilege
Object Priv Object privileges granted or revoked on the database object
Count Number of log entries returned with the given parameters
TIBCO LogLogic® Log Management Intelligence (LMI) User Guide
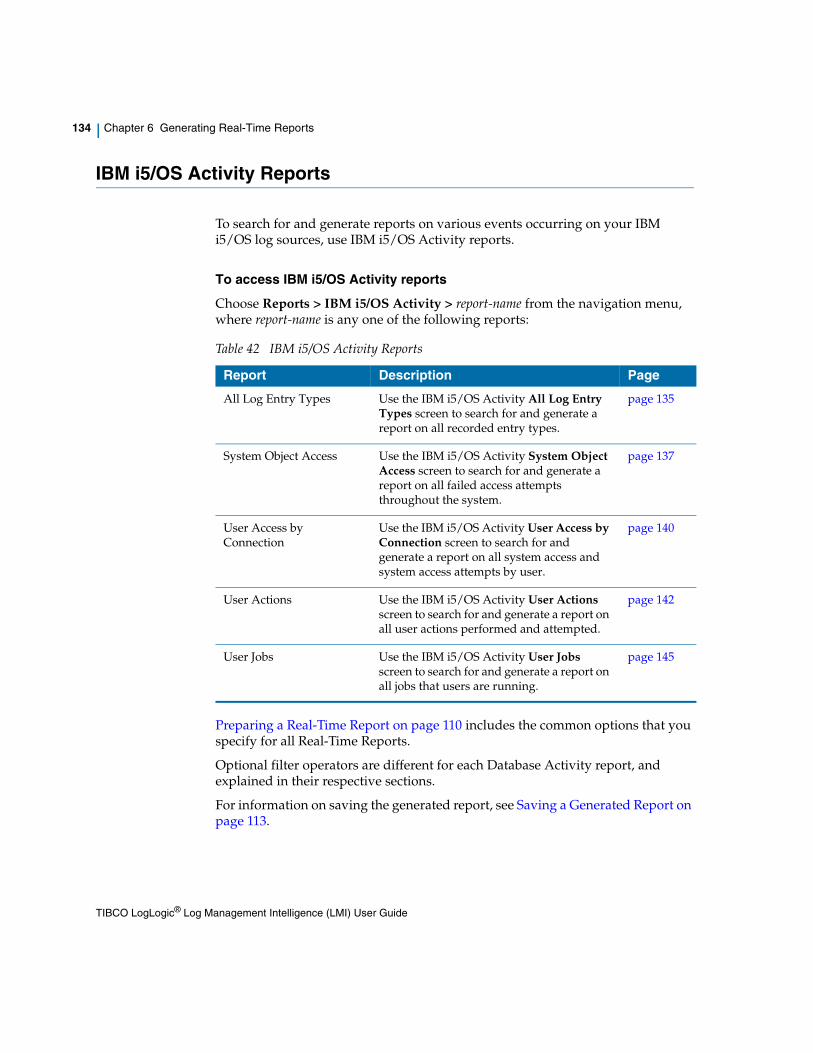
134 | Chapter 6 Generating Real-Time Reports
IBM i5/OS Activity Reports
To search for and generate reports on various events occurring on your IBM i5/OS log sources, use IBM i5/OS Activity reports.
To access IBM i5/OS Activity reports
Choose Reports > IBM i5/OS Activity > report-name from the navigation menu, where report-name is any one of the following reports:
Preparing a Real-Time Report on page 110 includes the common options that you specify for all Real-Time Reports.
Optional filter operators are different for each Database Activity report, and explained in their respective sections.
For information on saving the generated report, see Saving a Generated Report on page 113.
Table 42 IBM i5/OS Activity Reports
Report Description Page
All Log Entry Types Use the IBM i5/OS Activity All Log Entry Types screen to search for and generate a report on all recorded entry types.
page 135
System Object Access Use the IBM i5/OS Activity System Object Access screen to search for and generate a report on all failed access attempts throughout the system.
page 137
User Access by Connection
Use the IBM i5/OS Activity User Access by Connection screen to search for and generate a report on all system access and system access attempts by user.
page 140
User Actions Use the IBM i5/OS Activity User Actions screen to search for and generate a report on all user actions performed and attempted.
page 142
User Jobs Use the IBM i5/OS Activity User Jobs screen to search for and generate a report on all jobs that users are running.
page 145
TIBCO LogLogic® Log Management Intelligence (LMI) User Guide
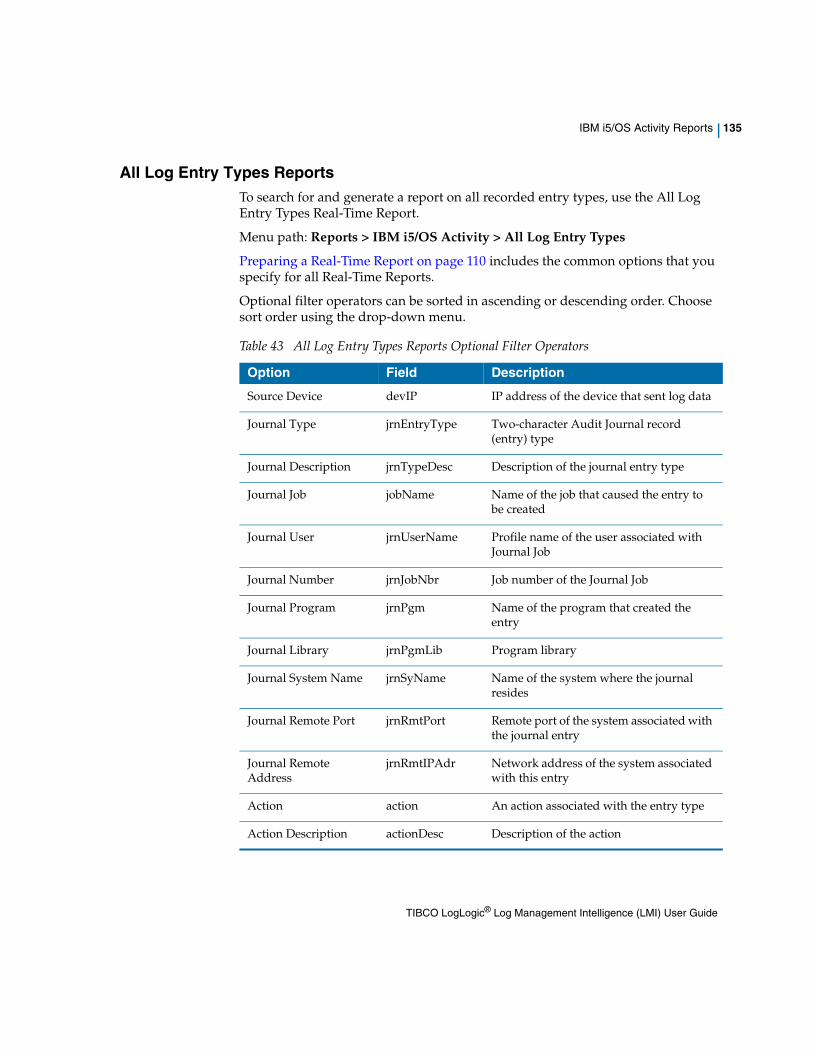
IBM i5/OS Activity Reports | 135
All Log Entry Types ReportsTo search for and generate a report on all recorded entry types, use the All Log Entry Types Real-Time Report.
Menu path: Reports > IBM i5/OS Activity > All Log Entry Types
Preparing a Real-Time Report on page 110 includes the common options that you specify for all Real-Time Reports.
Optional filter operators can be sorted in ascending or descending order. Choose sort order using the drop-down menu.
Table 43 All Log Entry Types Reports Optional Filter Operators
Option Field Description
Source Device devIP IP address of the device that sent log data
Journal Type jrnEntryType Two-character Audit Journal record (entry) type
Journal Description jrnTypeDesc Description of the journal entry type
Journal Job jobName Name of the job that caused the entry to be created
Journal User jrnUserName Profile name of the user associated with Journal Job
Journal Number jrnJobNbr Job number of the Journal Job
Journal Program jrnPgm Name of the program that created the entry
Journal Library jrnPgmLib Program library
Journal System Name jrnSyName Name of the system where the journal resides
Journal Remote Port jrnRmtPort Remote port of the system associated with the journal entry
Journal Remote Address
jrnRmtIPAdr Network address of the system associated with this entry
Action action An action associated with the entry type
Action Description actionDesc Description of the action
TIBCO LogLogic® Log Management Intelligence (LMI) User Guide
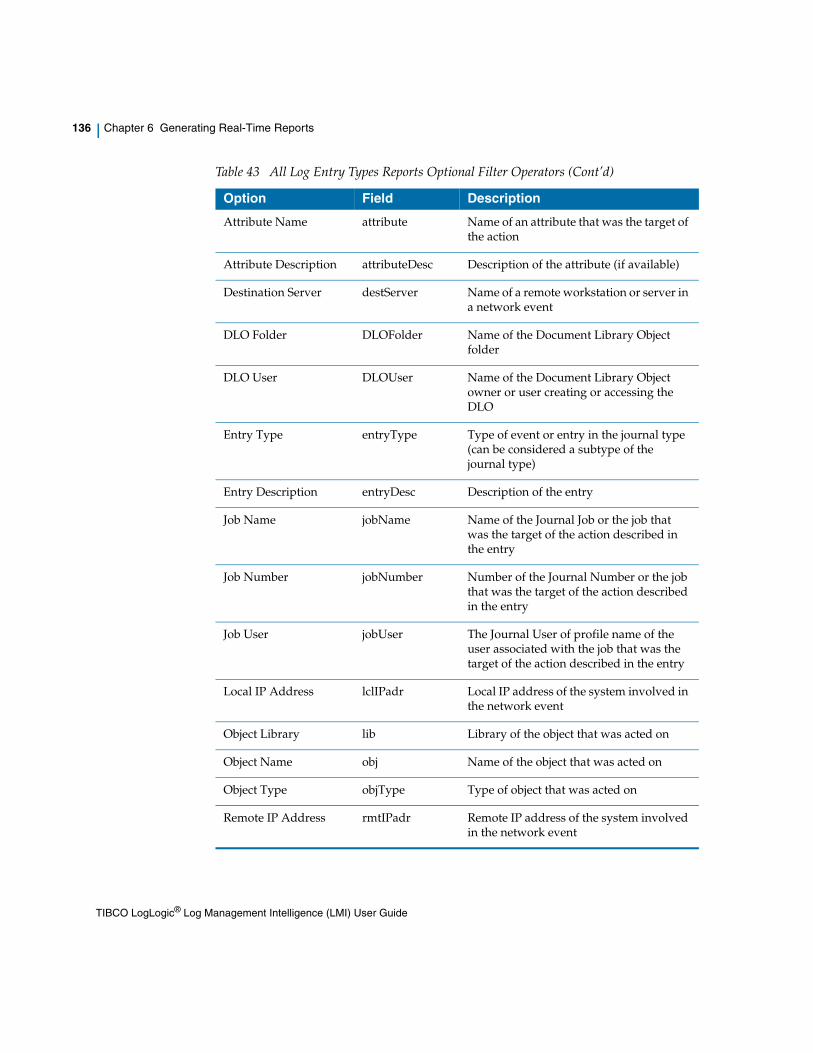
136 | Chapter 6 Generating Real-Time Reports
Attribute Name attribute Name of an attribute that was the target of the action
Attribute Description attributeDesc Description of the attribute (if available)
Destination Server destServer Name of a remote workstation or server in a network event
DLO Folder DLOFolder Name of the Document Library Object folder
DLO User DLOUser Name of the Document Library Object owner or user creating or accessing the DLO
Entry Type entryType Type of event or entry in the journal type (can be considered a subtype of the journal type)
Entry Description entryDesc Description of the entry
Job Name jobName Name of the Journal Job or the job that was the target of the action described in the entry
Job Number jobNumber Number of the Journal Number or the job that was the target of the action described in the entry
Job User jobUser The Journal User of profile name of the user associated with the job that was the target of the action described in the entry
Local IP Address lclIPadr Local IP address of the system involved in the network event
Object Library lib Library of the object that was acted on
Object Name obj Name of the object that was acted on
Object Type objType Type of object that was acted on
Remote IP Address rmtIPadr Remote IP address of the system involved in the network event
Table 43 All Log Entry Types Reports Optional Filter Operators (Cont’d)
Option Field Description
TIBCO LogLogic® Log Management Intelligence (LMI) User Guide
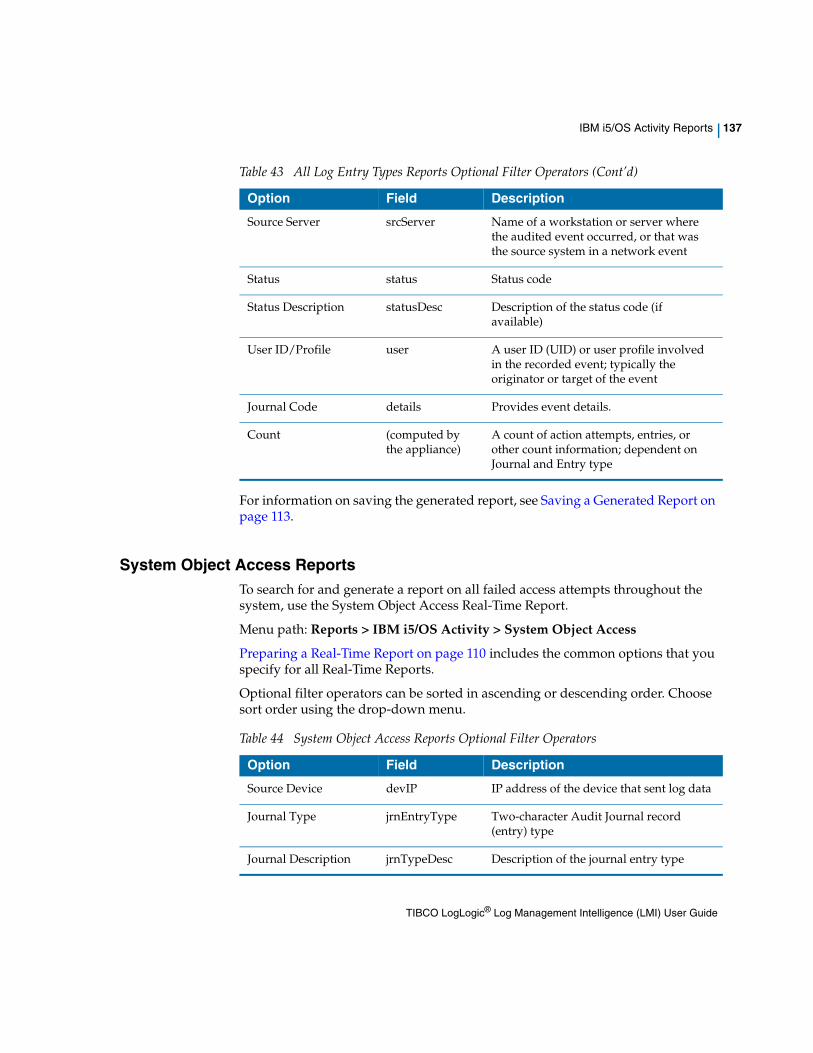
IBM i5/OS Activity Reports | 137
For information on saving the generated report, see Saving a Generated Report on page 113.
System Object Access ReportsTo search for and generate a report on all failed access attempts throughout the system, use the System Object Access Real-Time Report.
Menu path: Reports > IBM i5/OS Activity > System Object Access
Preparing a Real-Time Report on page 110 includes the common options that you specify for all Real-Time Reports.
Optional filter operators can be sorted in ascending or descending order. Choose sort order using the drop-down menu.
Source Server srcServer Name of a workstation or server where the audited event occurred, or that was the source system in a network event
Status status Status code
Status Description statusDesc Description of the status code (if available)
User ID/Profile user A user ID (UID) or user profile involved in the recorded event; typically the originator or target of the event
Journal Code details Provides event details.
Count (computed by the appliance)
A count of action attempts, entries, or other count information; dependent on Journal and Entry type
Table 43 All Log Entry Types Reports Optional Filter Operators (Cont’d)
Option Field Description
Table 44 System Object Access Reports Optional Filter Operators
Option Field Description
Source Device devIP IP address of the device that sent log data
Journal Type jrnEntryType Two-character Audit Journal record (entry) type
Journal Description jrnTypeDesc Description of the journal entry type
TIBCO LogLogic® Log Management Intelligence (LMI) User Guide
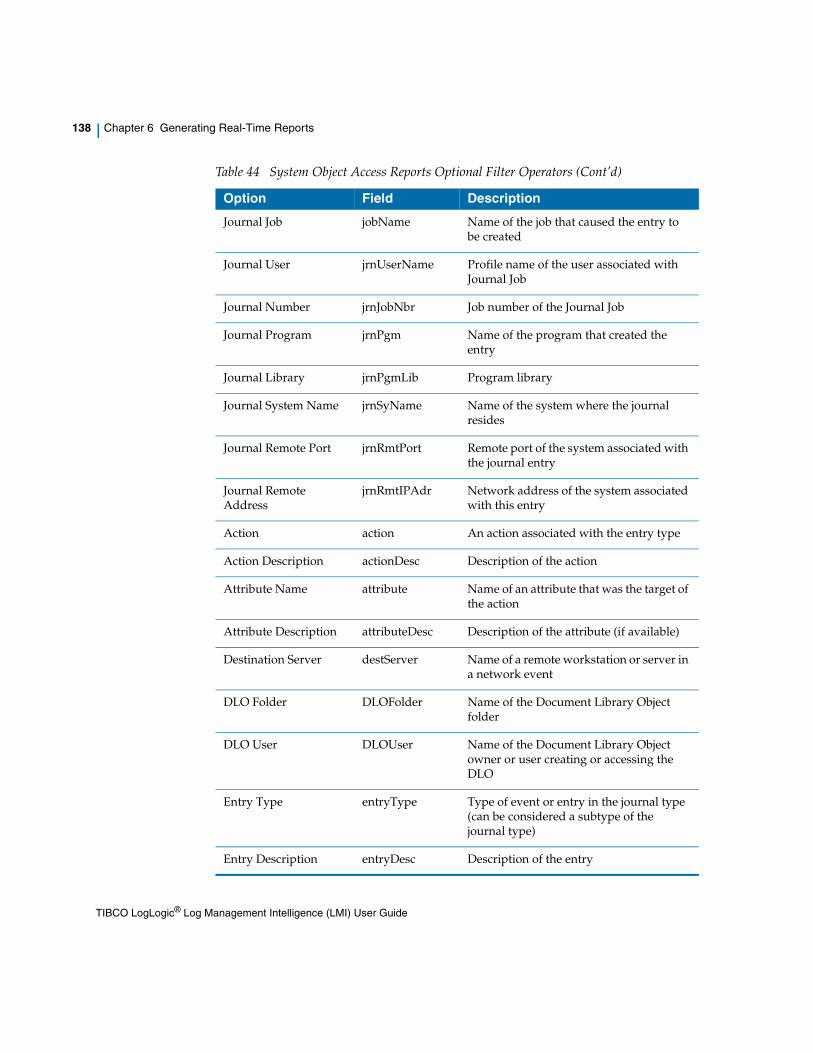
138 | Chapter 6 Generating Real-Time Reports
Journal Job jobName Name of the job that caused the entry to be created
Journal User jrnUserName Profile name of the user associated with Journal Job
Journal Number jrnJobNbr Job number of the Journal Job
Journal Program jrnPgm Name of the program that created the entry
Journal Library jrnPgmLib Program library
Journal System Name jrnSyName Name of the system where the journal resides
Journal Remote Port jrnRmtPort Remote port of the system associated with the journal entry
Journal Remote Address
jrnRmtIPAdr Network address of the system associated with this entry
Action action An action associated with the entry type
Action Description actionDesc Description of the action
Attribute Name attribute Name of an attribute that was the target of the action
Attribute Description attributeDesc Description of the attribute (if available)
Destination Server destServer Name of a remote workstation or server in a network event
DLO Folder DLOFolder Name of the Document Library Object folder
DLO User DLOUser Name of the Document Library Object owner or user creating or accessing the DLO
Entry Type entryType Type of event or entry in the journal type (can be considered a subtype of the journal type)
Entry Description entryDesc Description of the entry
Table 44 System Object Access Reports Optional Filter Operators (Cont’d)
Option Field Description
TIBCO LogLogic® Log Management Intelligence (LMI) User Guide
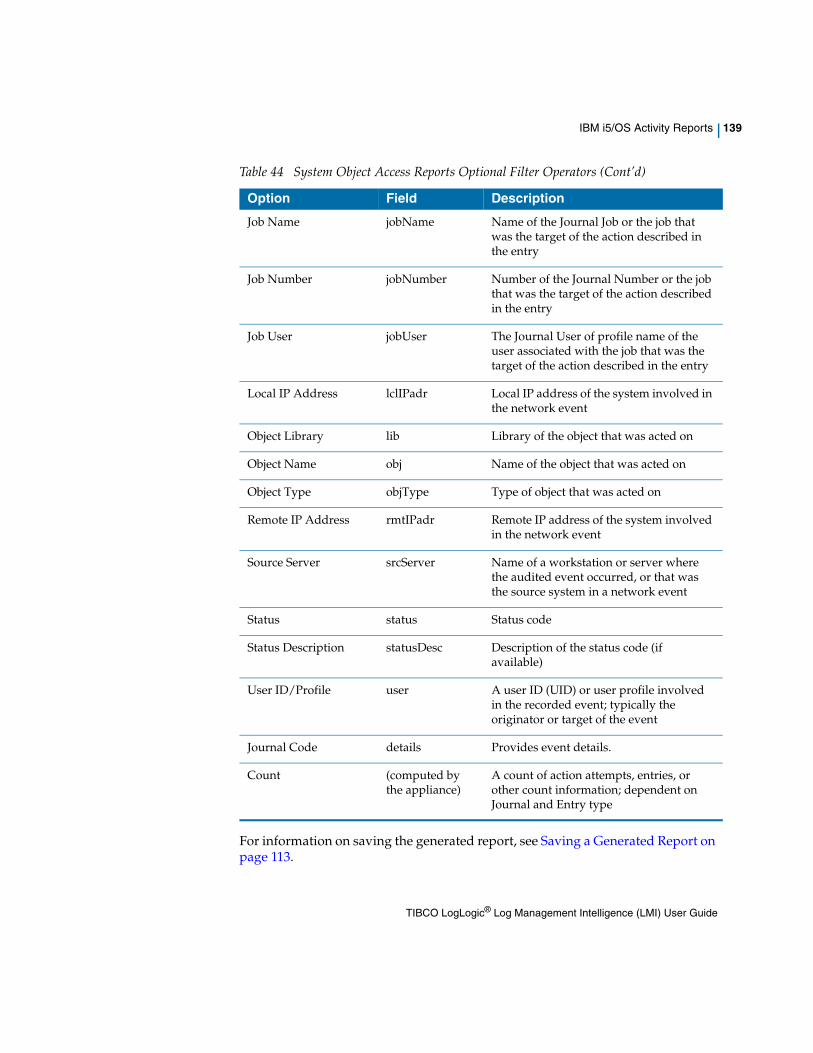
IBM i5/OS Activity Reports | 139
For information on saving the generated report, see Saving a Generated Report on page 113.
Job Name jobName Name of the Journal Job or the job that was the target of the action described in the entry
Job Number jobNumber Number of the Journal Number or the job that was the target of the action described in the entry
Job User jobUser The Journal User of profile name of the user associated with the job that was the target of the action described in the entry
Local IP Address lclIPadr Local IP address of the system involved in the network event
Object Library lib Library of the object that was acted on
Object Name obj Name of the object that was acted on
Object Type objType Type of object that was acted on
Remote IP Address rmtIPadr Remote IP address of the system involved in the network event
Source Server srcServer Name of a workstation or server where the audited event occurred, or that was the source system in a network event
Status status Status code
Status Description statusDesc Description of the status code (if available)
User ID/Profile user A user ID (UID) or user profile involved in the recorded event; typically the originator or target of the event
Journal Code details Provides event details.
Count (computed by the appliance)
A count of action attempts, entries, or other count information; dependent on Journal and Entry type
Table 44 System Object Access Reports Optional Filter Operators (Cont’d)
Option Field Description
TIBCO LogLogic® Log Management Intelligence (LMI) User Guide
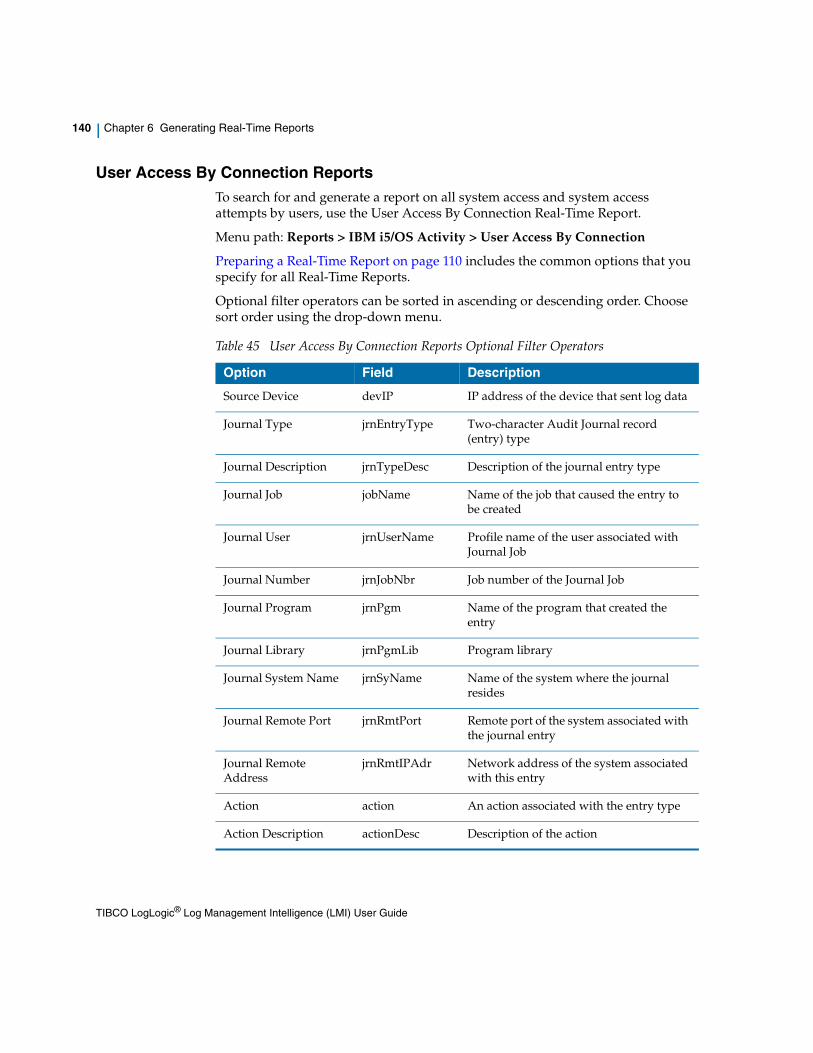
140 | Chapter 6 Generating Real-Time Reports
User Access By Connection ReportsTo search for and generate a report on all system access and system access attempts by users, use the User Access By Connection Real-Time Report.
Menu path: Reports > IBM i5/OS Activity > User Access By Connection
Preparing a Real-Time Report on page 110 includes the common options that you specify for all Real-Time Reports.
Optional filter operators can be sorted in ascending or descending order. Choose sort order using the drop-down menu.
Table 45 User Access By Connection Reports Optional Filter Operators
Option Field Description
Source Device devIP IP address of the device that sent log data
Journal Type jrnEntryType Two-character Audit Journal record (entry) type
Journal Description jrnTypeDesc Description of the journal entry type
Journal Job jobName Name of the job that caused the entry to be created
Journal User jrnUserName Profile name of the user associated with Journal Job
Journal Number jrnJobNbr Job number of the Journal Job
Journal Program jrnPgm Name of the program that created the entry
Journal Library jrnPgmLib Program library
Journal System Name jrnSyName Name of the system where the journal resides
Journal Remote Port jrnRmtPort Remote port of the system associated with the journal entry
Journal Remote Address
jrnRmtIPAdr Network address of the system associated with this entry
Action action An action associated with the entry type
Action Description actionDesc Description of the action
TIBCO LogLogic® Log Management Intelligence (LMI) User Guide
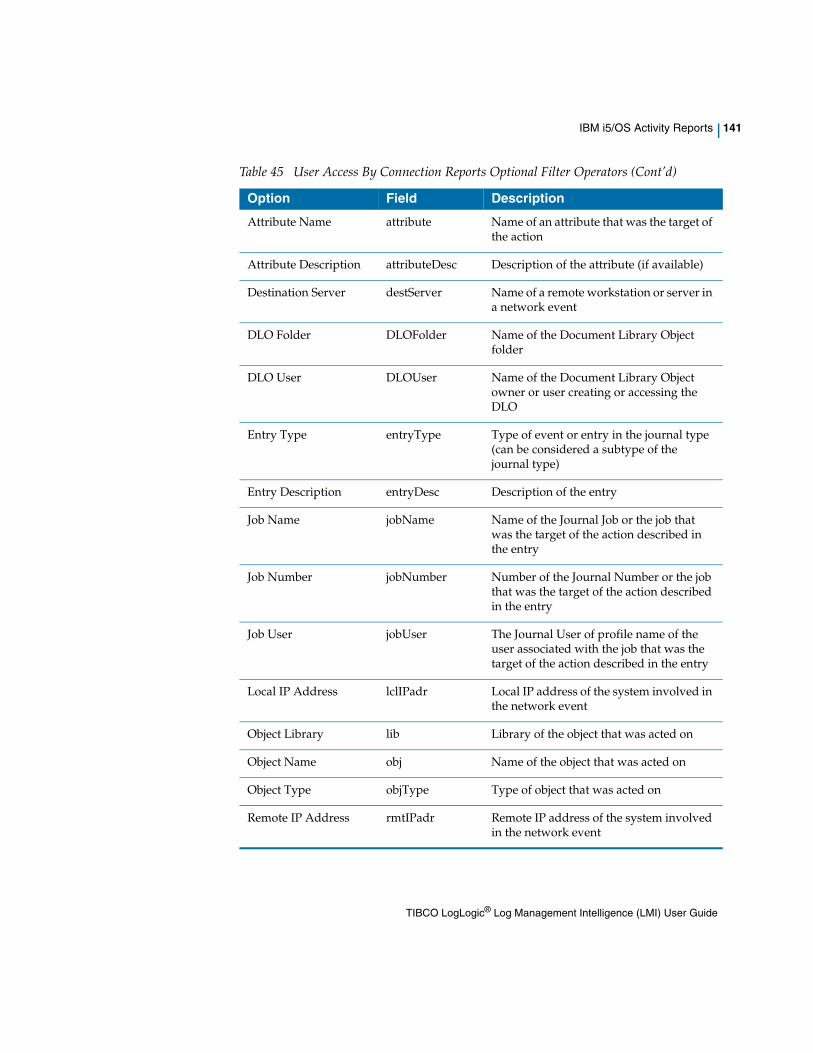
IBM i5/OS Activity Reports | 141
Attribute Name attribute Name of an attribute that was the target of the action
Attribute Description attributeDesc Description of the attribute (if available)
Destination Server destServer Name of a remote workstation or server in a network event
DLO Folder DLOFolder Name of the Document Library Object folder
DLO User DLOUser Name of the Document Library Object owner or user creating or accessing the DLO
Entry Type entryType Type of event or entry in the journal type (can be considered a subtype of the journal type)
Entry Description entryDesc Description of the entry
Job Name jobName Name of the Journal Job or the job that was the target of the action described in the entry
Job Number jobNumber Number of the Journal Number or the job that was the target of the action described in the entry
Job User jobUser The Journal User of profile name of the user associated with the job that was the target of the action described in the entry
Local IP Address lclIPadr Local IP address of the system involved in the network event
Object Library lib Library of the object that was acted on
Object Name obj Name of the object that was acted on
Object Type objType Type of object that was acted on
Remote IP Address rmtIPadr Remote IP address of the system involved in the network event
Table 45 User Access By Connection Reports Optional Filter Operators (Cont’d)
Option Field Description
TIBCO LogLogic® Log Management Intelligence (LMI) User Guide
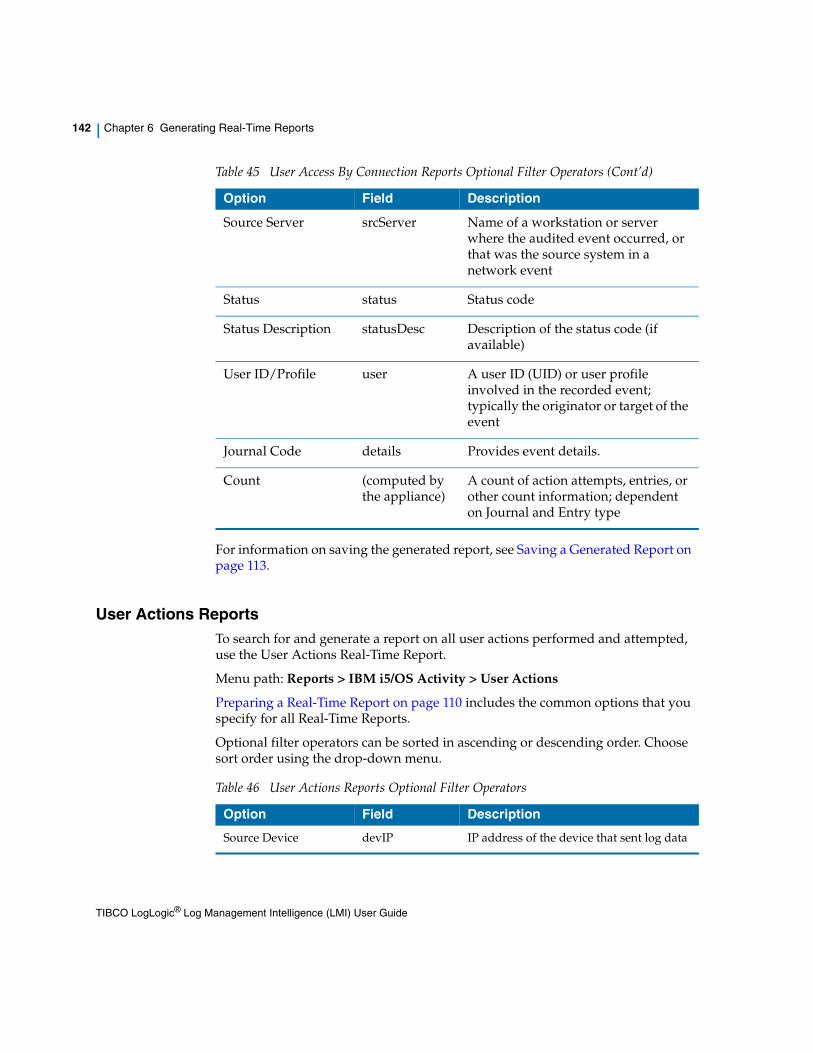
142 | Chapter 6 Generating Real-Time Reports
For information on saving the generated report, see Saving a Generated Report on page 113.
User Actions ReportsTo search for and generate a report on all user actions performed and attempted, use the User Actions Real-Time Report.
Menu path: Reports > IBM i5/OS Activity > User Actions
Preparing a Real-Time Report on page 110 includes the common options that you specify for all Real-Time Reports.
Optional filter operators can be sorted in ascending or descending order. Choose sort order using the drop-down menu.
Source Server srcServer Name of a workstation or server where the audited event occurred, or that was the source system in a network event
Status status Status code
Status Description statusDesc Description of the status code (if available)
User ID/Profile user A user ID (UID) or user profile involved in the recorded event; typically the originator or target of the event
Journal Code details Provides event details.
Count (computed by the appliance)
A count of action attempts, entries, or other count information; dependent on Journal and Entry type
Table 45 User Access By Connection Reports Optional Filter Operators (Cont’d)
Option Field Description
Table 46 User Actions Reports Optional Filter Operators
Option Field Description
Source Device devIP IP address of the device that sent log data
TIBCO LogLogic® Log Management Intelligence (LMI) User Guide
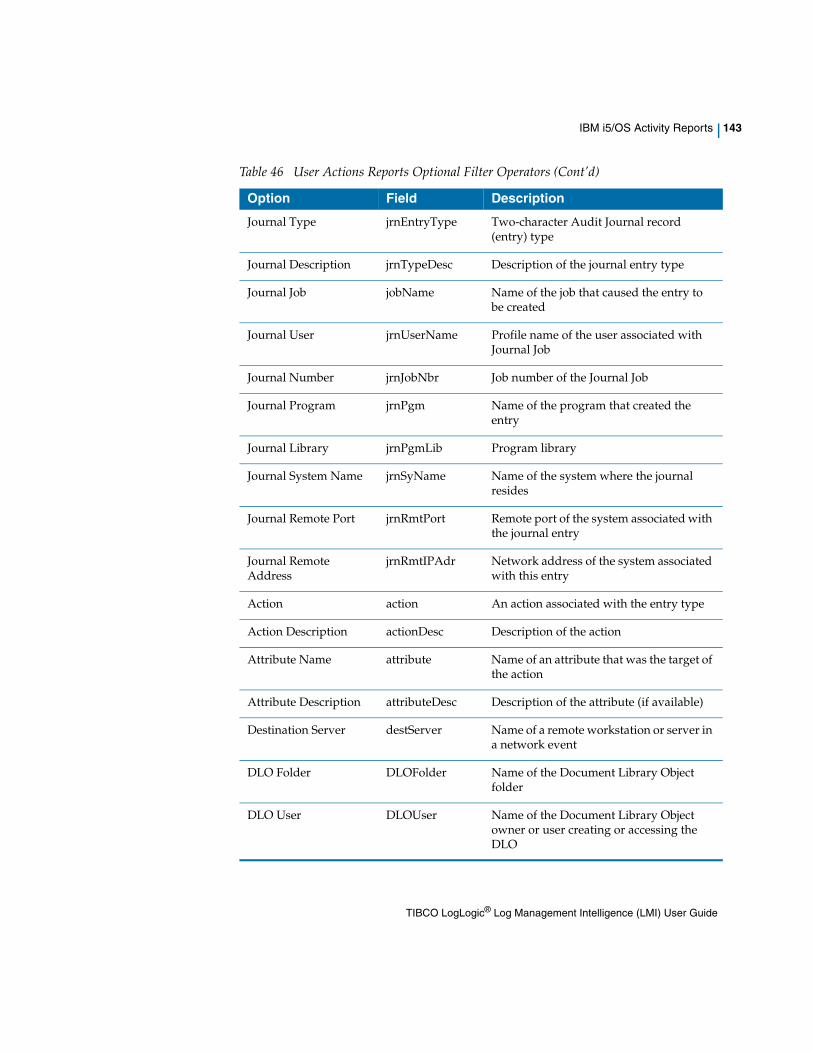
IBM i5/OS Activity Reports | 143
Journal Type jrnEntryType Two-character Audit Journal record (entry) type
Journal Description jrnTypeDesc Description of the journal entry type
Journal Job jobName Name of the job that caused the entry to be created
Journal User jrnUserName Profile name of the user associated with Journal Job
Journal Number jrnJobNbr Job number of the Journal Job
Journal Program jrnPgm Name of the program that created the entry
Journal Library jrnPgmLib Program library
Journal System Name jrnSyName Name of the system where the journal resides
Journal Remote Port jrnRmtPort Remote port of the system associated with the journal entry
Journal Remote Address
jrnRmtIPAdr Network address of the system associated with this entry
Action action An action associated with the entry type
Action Description actionDesc Description of the action
Attribute Name attribute Name of an attribute that was the target of the action
Attribute Description attributeDesc Description of the attribute (if available)
Destination Server destServer Name of a remote workstation or server in a network event
DLO Folder DLOFolder Name of the Document Library Object folder
DLO User DLOUser Name of the Document Library Object owner or user creating or accessing the DLO
Table 46 User Actions Reports Optional Filter Operators (Cont’d)
Option Field Description
TIBCO LogLogic® Log Management Intelligence (LMI) User Guide
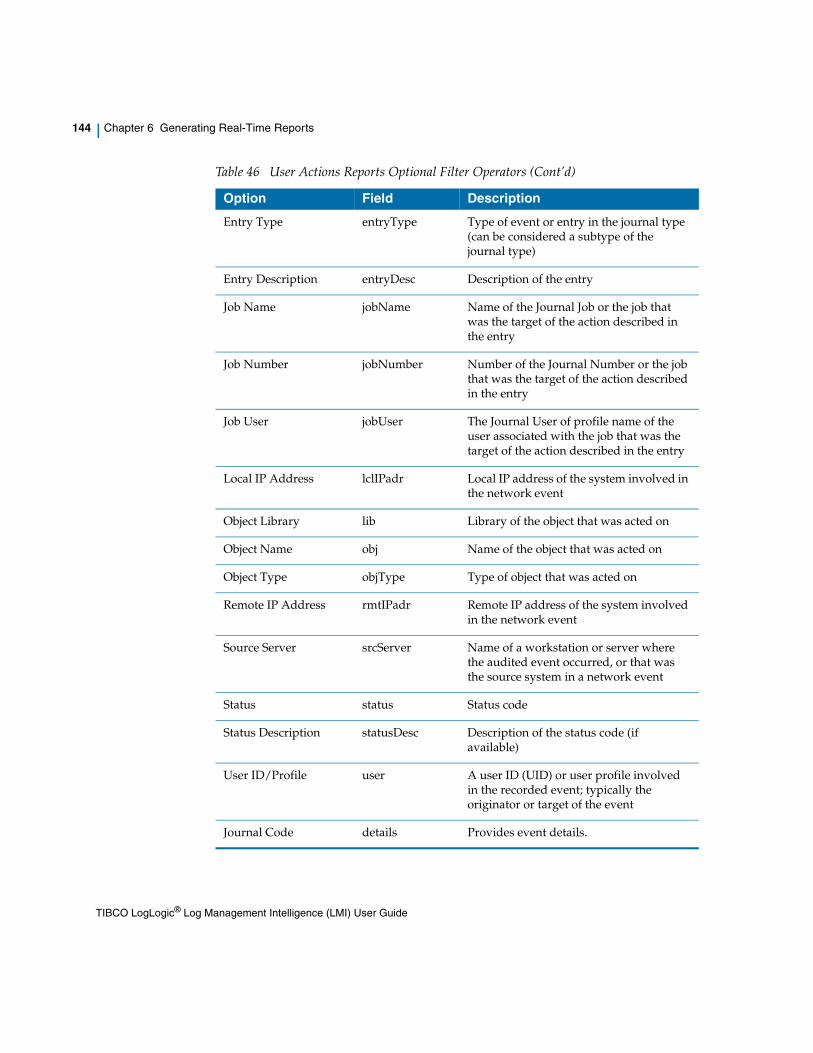
144 | Chapter 6 Generating Real-Time Reports
Entry Type entryType Type of event or entry in the journal type (can be considered a subtype of the journal type)
Entry Description entryDesc Description of the entry
Job Name jobName Name of the Journal Job or the job that was the target of the action described in the entry
Job Number jobNumber Number of the Journal Number or the job that was the target of the action described in the entry
Job User jobUser The Journal User of profile name of the user associated with the job that was the target of the action described in the entry
Local IP Address lclIPadr Local IP address of the system involved in the network event
Object Library lib Library of the object that was acted on
Object Name obj Name of the object that was acted on
Object Type objType Type of object that was acted on
Remote IP Address rmtIPadr Remote IP address of the system involved in the network event
Source Server srcServer Name of a workstation or server where the audited event occurred, or that was the source system in a network event
Status status Status code
Status Description statusDesc Description of the status code (if available)
User ID/Profile user A user ID (UID) or user profile involved in the recorded event; typically the originator or target of the event
Journal Code details Provides event details.
Table 46 User Actions Reports Optional Filter Operators (Cont’d)
Option Field Description
TIBCO LogLogic® Log Management Intelligence (LMI) User Guide
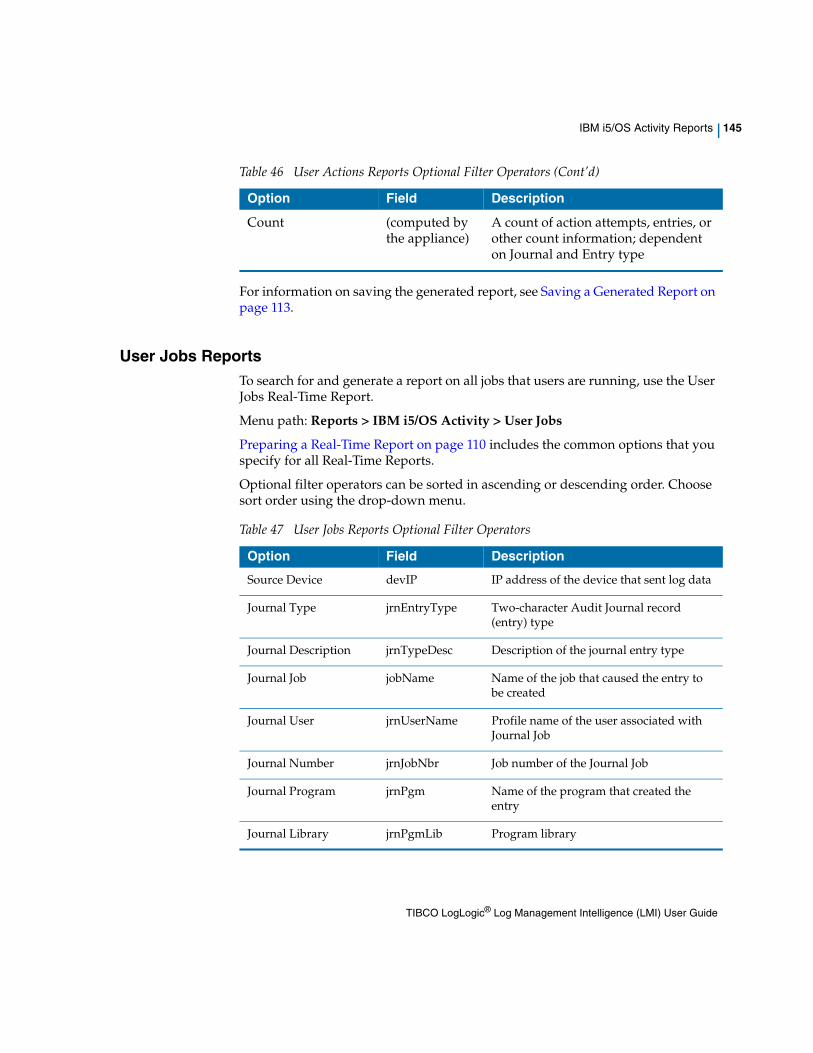
IBM i5/OS Activity Reports | 145
For information on saving the generated report, see Saving a Generated Report on page 113.
User Jobs ReportsTo search for and generate a report on all jobs that users are running, use the User Jobs Real-Time Report.
Menu path: Reports > IBM i5/OS Activity > User Jobs
Preparing a Real-Time Report on page 110 includes the common options that you specify for all Real-Time Reports.
Optional filter operators can be sorted in ascending or descending order. Choose sort order using the drop-down menu.
Count (computed by the appliance)
A count of action attempts, entries, or other count information; dependent on Journal and Entry type
Table 46 User Actions Reports Optional Filter Operators (Cont’d)
Option Field Description
Table 47 User Jobs Reports Optional Filter Operators
Option Field Description
Source Device devIP IP address of the device that sent log data
Journal Type jrnEntryType Two-character Audit Journal record (entry) type
Journal Description jrnTypeDesc Description of the journal entry type
Journal Job jobName Name of the job that caused the entry to be created
Journal User jrnUserName Profile name of the user associated with Journal Job
Journal Number jrnJobNbr Job number of the Journal Job
Journal Program jrnPgm Name of the program that created the entry
Journal Library jrnPgmLib Program library
TIBCO LogLogic® Log Management Intelligence (LMI) User Guide
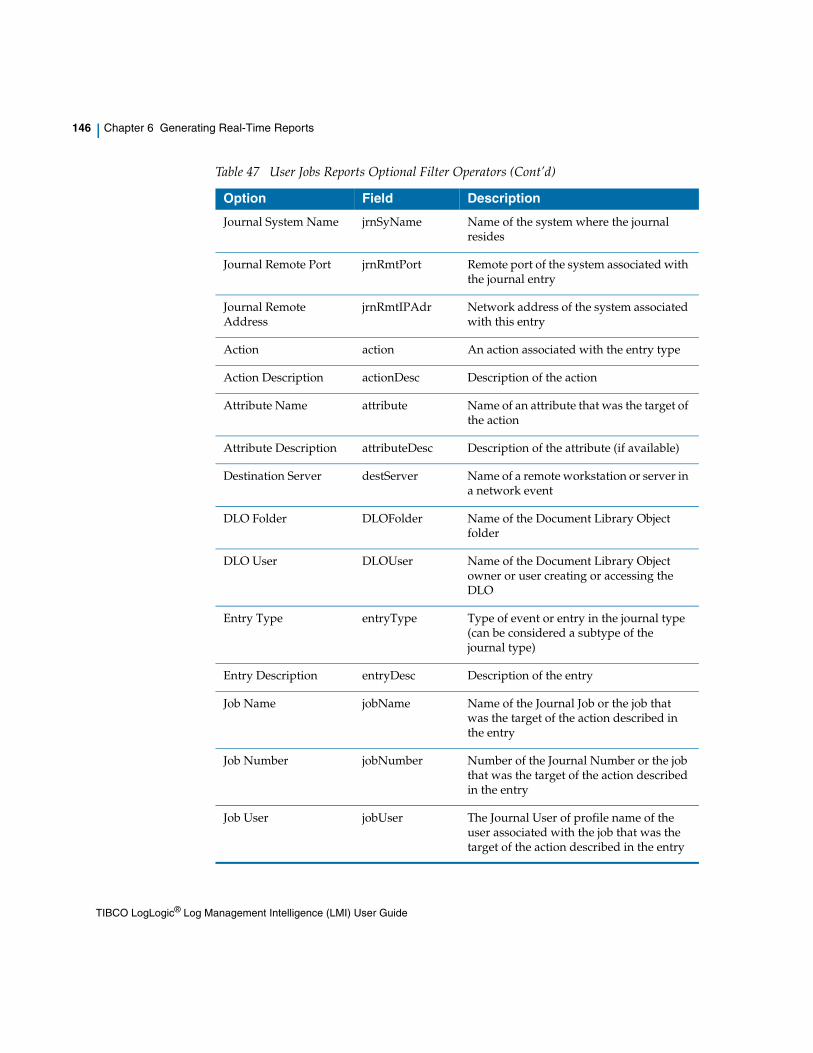
146 | Chapter 6 Generating Real-Time Reports
Journal System Name jrnSyName Name of the system where the journal resides
Journal Remote Port jrnRmtPort Remote port of the system associated with the journal entry
Journal Remote Address
jrnRmtIPAdr Network address of the system associated with this entry
Action action An action associated with the entry type
Action Description actionDesc Description of the action
Attribute Name attribute Name of an attribute that was the target of the action
Attribute Description attributeDesc Description of the attribute (if available)
Destination Server destServer Name of a remote workstation or server in a network event
DLO Folder DLOFolder Name of the Document Library Object folder
DLO User DLOUser Name of the Document Library Object owner or user creating or accessing the DLO
Entry Type entryType Type of event or entry in the journal type (can be considered a subtype of the journal type)
Entry Description entryDesc Description of the entry
Job Name jobName Name of the Journal Job or the job that was the target of the action described in the entry
Job Number jobNumber Number of the Journal Number or the job that was the target of the action described in the entry
Job User jobUser The Journal User of profile name of the user associated with the job that was the target of the action described in the entry
Table 47 User Jobs Reports Optional Filter Operators (Cont’d)
Option Field Description
TIBCO LogLogic® Log Management Intelligence (LMI) User Guide
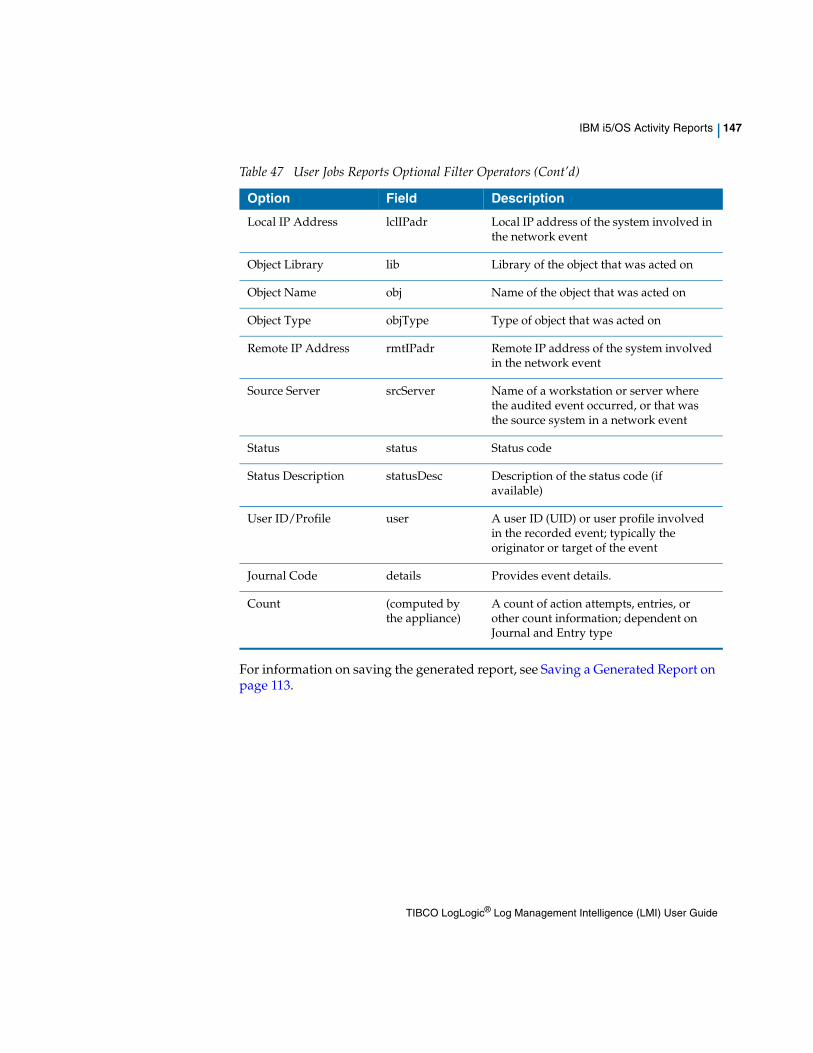
IBM i5/OS Activity Reports | 147
For information on saving the generated report, see Saving a Generated Report on page 113.
Local IP Address lclIPadr Local IP address of the system involved in the network event
Object Library lib Library of the object that was acted on
Object Name obj Name of the object that was acted on
Object Type objType Type of object that was acted on
Remote IP Address rmtIPadr Remote IP address of the system involved in the network event
Source Server srcServer Name of a workstation or server where the audited event occurred, or that was the source system in a network event
Status status Status code
Status Description statusDesc Description of the status code (if available)
User ID/Profile user A user ID (UID) or user profile involved in the recorded event; typically the originator or target of the event
Journal Code details Provides event details.
Count (computed by the appliance)
A count of action attempts, entries, or other count information; dependent on Journal and Entry type
Table 47 User Jobs Reports Optional Filter Operators (Cont’d)
Option Field Description
TIBCO LogLogic® Log Management Intelligence (LMI) User Guide
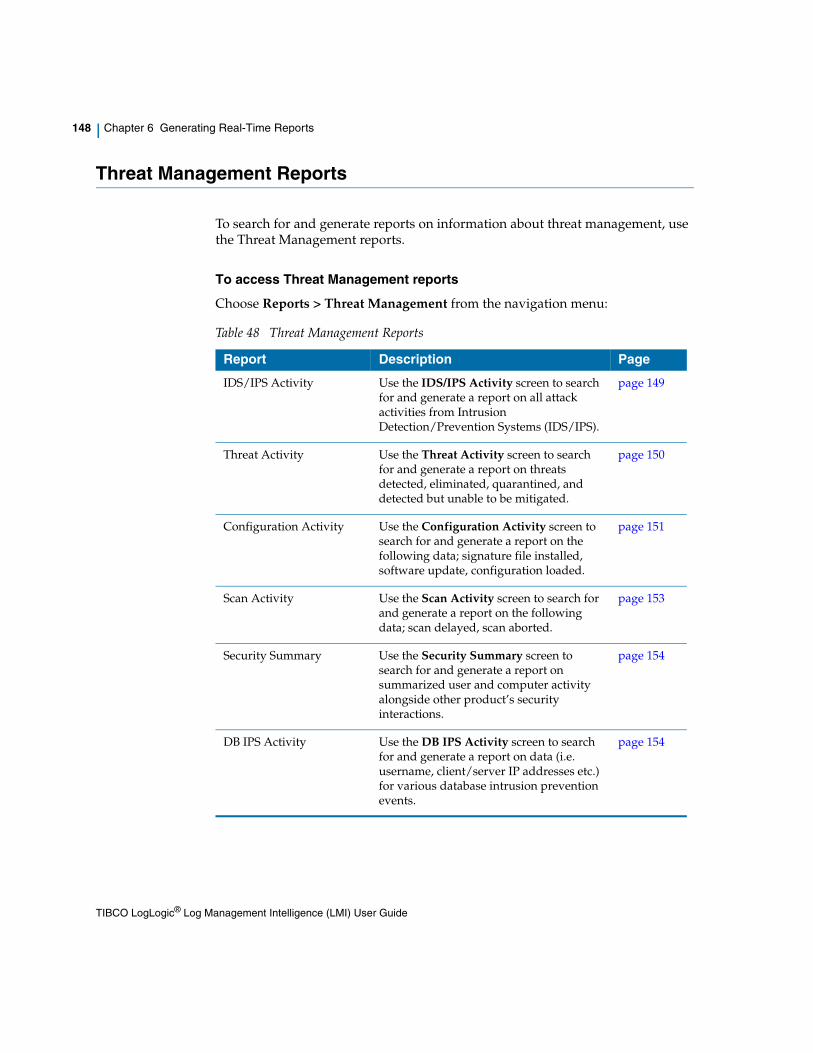
148 | Chapter 6 Generating Real-Time Reports
Threat Management Reports
To search for and generate reports on information about threat management, use the Threat Management reports.
To access Threat Management reports
Choose Reports > Threat Management from the navigation menu:
Table 48 Threat Management Reports
Report Description Page
IDS/IPS Activity Use the IDS/IPS Activity screen to search for and generate a report on all attack activities from Intrusion Detection/Prevention Systems (IDS/IPS).
page 149
Threat Activity Use the Threat Activity screen to search for and generate a report on threats detected, eliminated, quarantined, and detected but unable to be mitigated.
page 150
Configuration Activity Use the Configuration Activity screen to search for and generate a report on the following data; signature file installed, software update, configuration loaded.
page 151
Scan Activity Use the Scan Activity screen to search for and generate a report on the following data; scan delayed, scan aborted.
page 153
Security Summary Use the Security Summary screen to search for and generate a report on summarized user and computer activity alongside other product’s security interactions.
page 154
DB IPS Activity Use the DB IPS Activity screen to search for and generate a report on data (i.e. username, client/server IP addresses etc.) for various database intrusion prevention events.
page 154
TIBCO LogLogic® Log Management Intelligence (LMI) User Guide
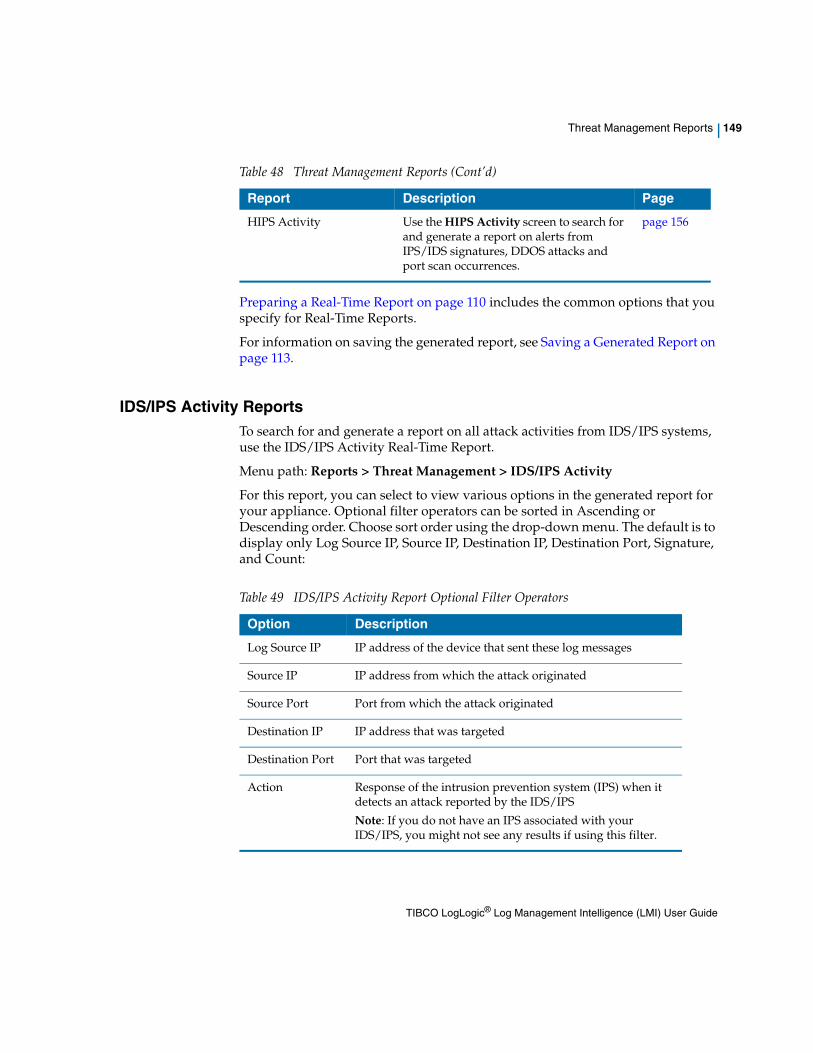
Threat Management Reports | 149
Preparing a Real-Time Report on page 110 includes the common options that you specify for Real-Time Reports.
For information on saving the generated report, see Saving a Generated Report on page 113.
IDS/IPS Activity ReportsTo search for and generate a report on all attack activities from IDS/IPS systems, use the IDS/IPS Activity Real-Time Report.
Menu path: Reports > Threat Management > IDS/IPS Activity
For this report, you can select to view various options in the generated report for your appliance. Optional filter operators can be sorted in Ascending or Descending order. Choose sort order using the drop-down menu. The default is to display only Log Source IP, Source IP, Destination IP, Destination Port, Signature, and Count:
HIPS Activity Use the HIPS Activity screen to search for and generate a report on alerts from IPS/IDS signatures, DDOS attacks and port scan occurrences.
page 156
Table 48 Threat Management Reports (Cont’d)
Report Description Page
Table 49 IDS/IPS Activity Report Optional Filter Operators
Option Description
Log Source IP IP address of the device that sent these log messages
Source IP IP address from which the attack originated
Source Port Port from which the attack originated
Destination IP IP address that was targeted
Destination Port Port that was targeted
Action Response of the intrusion prevention system (IPS) when it detects an attack reported by the IDS/IPS
Note: If you do not have an IPS associated with your IDS/IPS, you might not see any results if using this filter.
TIBCO LogLogic® Log Management Intelligence (LMI) User Guide
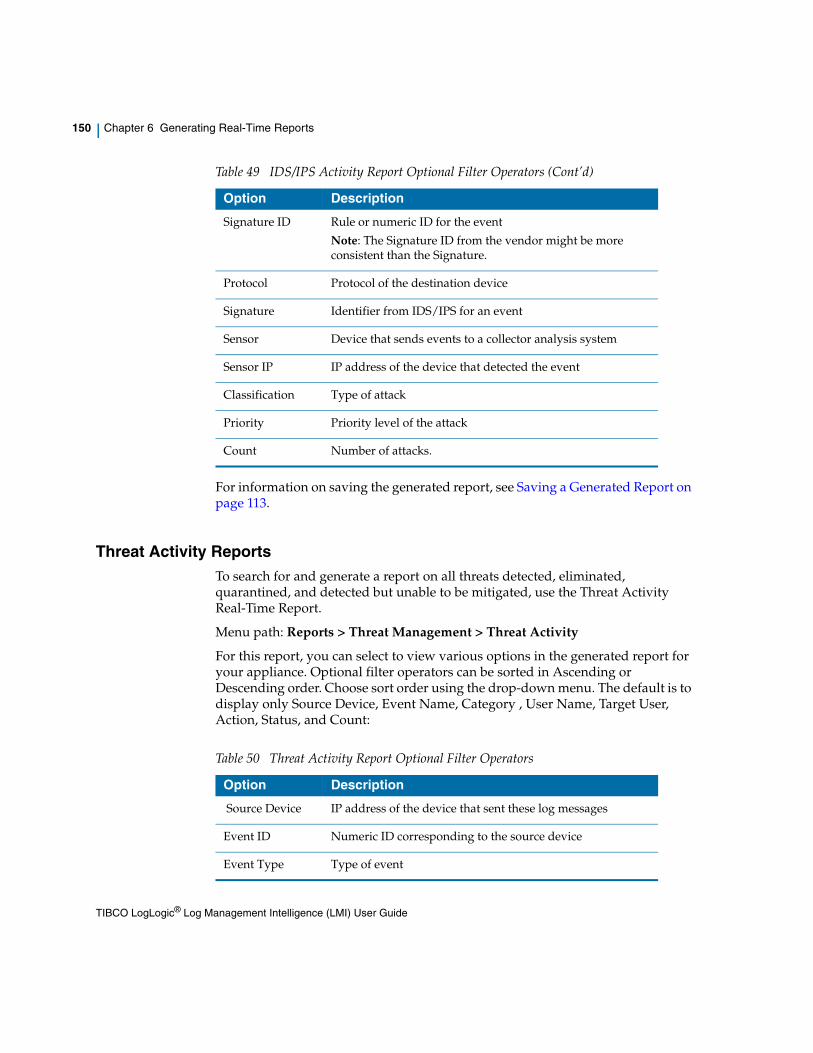
150 | Chapter 6 Generating Real-Time Reports
For information on saving the generated report, see Saving a Generated Report on page 113.
Threat Activity ReportsTo search for and generate a report on all threats detected, eliminated, quarantined, and detected but unable to be mitigated, use the Threat Activity Real-Time Report.
Menu path: Reports > Threat Management > Threat Activity
For this report, you can select to view various options in the generated report for your appliance. Optional filter operators can be sorted in Ascending or Descending order. Choose sort order using the drop-down menu. The default is to display only Source Device, Event Name, Category , User Name, Target User, Action, Status, and Count:
Signature ID Rule or numeric ID for the event
Note: The Signature ID from the vendor might be more consistent than the Signature.
Protocol Protocol of the destination device
Signature Identifier from IDS/IPS for an event
Sensor Device that sends events to a collector analysis system
Sensor IP IP address of the device that detected the event
Classification Type of attack
Priority Priority level of the attack
Count Number of attacks.
Table 49 IDS/IPS Activity Report Optional Filter Operators (Cont’d)
Option Description
Table 50 Threat Activity Report Optional Filter Operators
Option Description
Source Device IP address of the device that sent these log messages
Event ID Numeric ID corresponding to the source device
Event Type Type of event
TIBCO LogLogic® Log Management Intelligence (LMI) User Guide
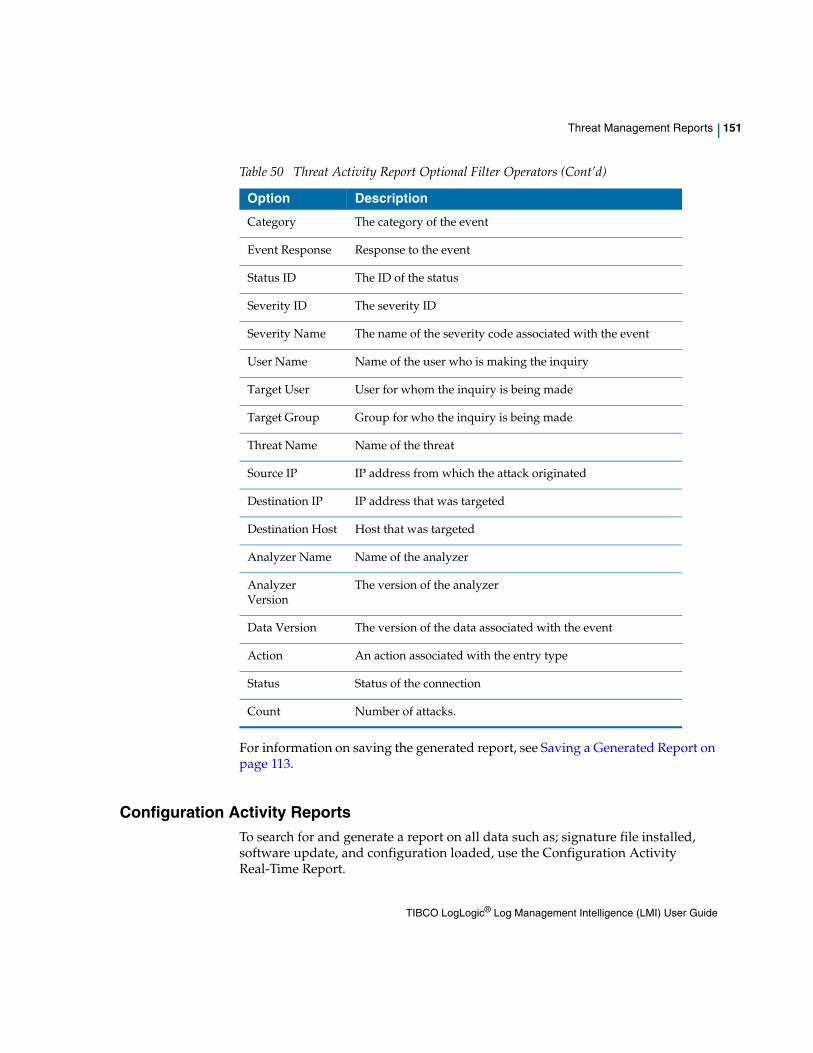
Threat Management Reports | 151
For information on saving the generated report, see Saving a Generated Report on page 113.
Configuration Activity ReportsTo search for and generate a report on all data such as; signature file installed, software update, and configuration loaded, use the Configuration Activity Real-Time Report.
Category The category of the event
Event Response Response to the event
Status ID The ID of the status
Severity ID The severity ID
Severity Name The name of the severity code associated with the event
User Name Name of the user who is making the inquiry
Target User User for whom the inquiry is being made
Target Group Group for who the inquiry is being made
Threat Name Name of the threat
Source IP IP address from which the attack originated
Destination IP IP address that was targeted
Destination Host Host that was targeted
Analyzer Name Name of the analyzer
Analyzer Version
The version of the analyzer
Data Version The version of the data associated with the event
Action An action associated with the entry type
Status Status of the connection
Count Number of attacks.
Table 50 Threat Activity Report Optional Filter Operators (Cont’d)
Option Description
TIBCO LogLogic® Log Management Intelligence (LMI) User Guide
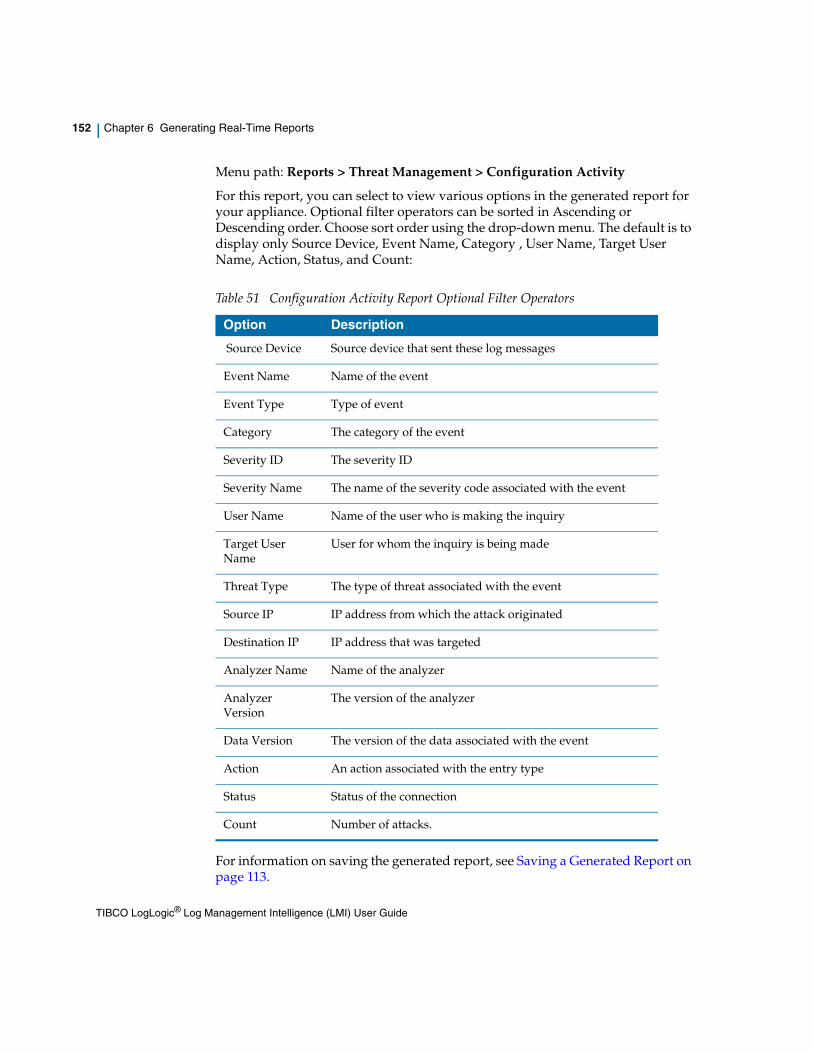
152 | Chapter 6 Generating Real-Time Reports
Menu path: Reports > Threat Management > Configuration Activity
For this report, you can select to view various options in the generated report for your appliance. Optional filter operators can be sorted in Ascending or Descending order. Choose sort order using the drop-down menu. The default is to display only Source Device, Event Name, Category , User Name, Target User Name, Action, Status, and Count:
For information on saving the generated report, see Saving a Generated Report on page 113.
Table 51 Configuration Activity Report Optional Filter Operators
Option Description
Source Device Source device that sent these log messages
Event Name Name of the event
Event Type Type of event
Category The category of the event
Severity ID The severity ID
Severity Name The name of the severity code associated with the event
User Name Name of the user who is making the inquiry
Target User Name
User for whom the inquiry is being made
Threat Type The type of threat associated with the event
Source IP IP address from which the attack originated
Destination IP IP address that was targeted
Analyzer Name Name of the analyzer
Analyzer Version
The version of the analyzer
Data Version The version of the data associated with the event
Action An action associated with the entry type
Status Status of the connection
Count Number of attacks.
TIBCO LogLogic® Log Management Intelligence (LMI) User Guide
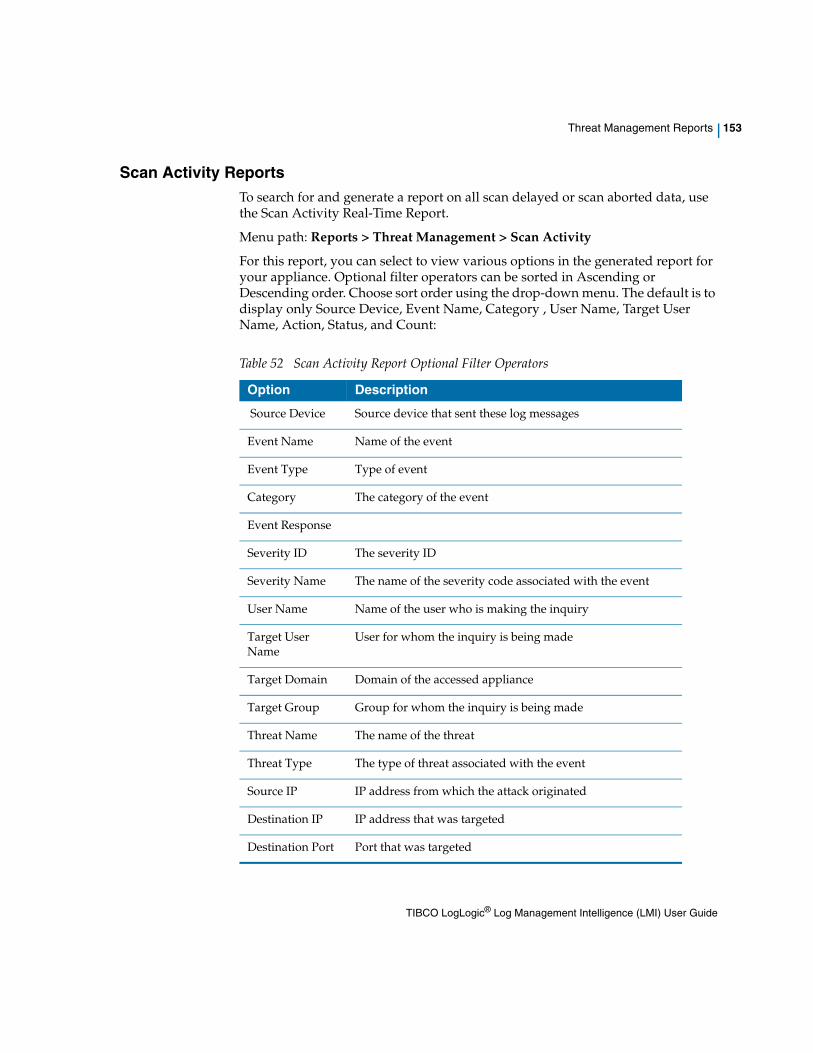
Threat Management Reports | 153
Scan Activity ReportsTo search for and generate a report on all scan delayed or scan aborted data, use the Scan Activity Real-Time Report.
Menu path: Reports > Threat Management > Scan Activity
For this report, you can select to view various options in the generated report for your appliance. Optional filter operators can be sorted in Ascending or Descending order. Choose sort order using the drop-down menu. The default is to display only Source Device, Event Name, Category , User Name, Target User Name, Action, Status, and Count:
Table 52 Scan Activity Report Optional Filter Operators
Option Description
Source Device Source device that sent these log messages
Event Name Name of the event
Event Type Type of event
Category The category of the event
Event Response
Severity ID The severity ID
Severity Name The name of the severity code associated with the event
User Name Name of the user who is making the inquiry
Target User Name
User for whom the inquiry is being made
Target Domain Domain of the accessed appliance
Target Group Group for whom the inquiry is being made
Threat Name The name of the threat
Threat Type The type of threat associated with the event
Source IP IP address from which the attack originated
Destination IP IP address that was targeted
Destination Port Port that was targeted
TIBCO LogLogic® Log Management Intelligence (LMI) User Guide
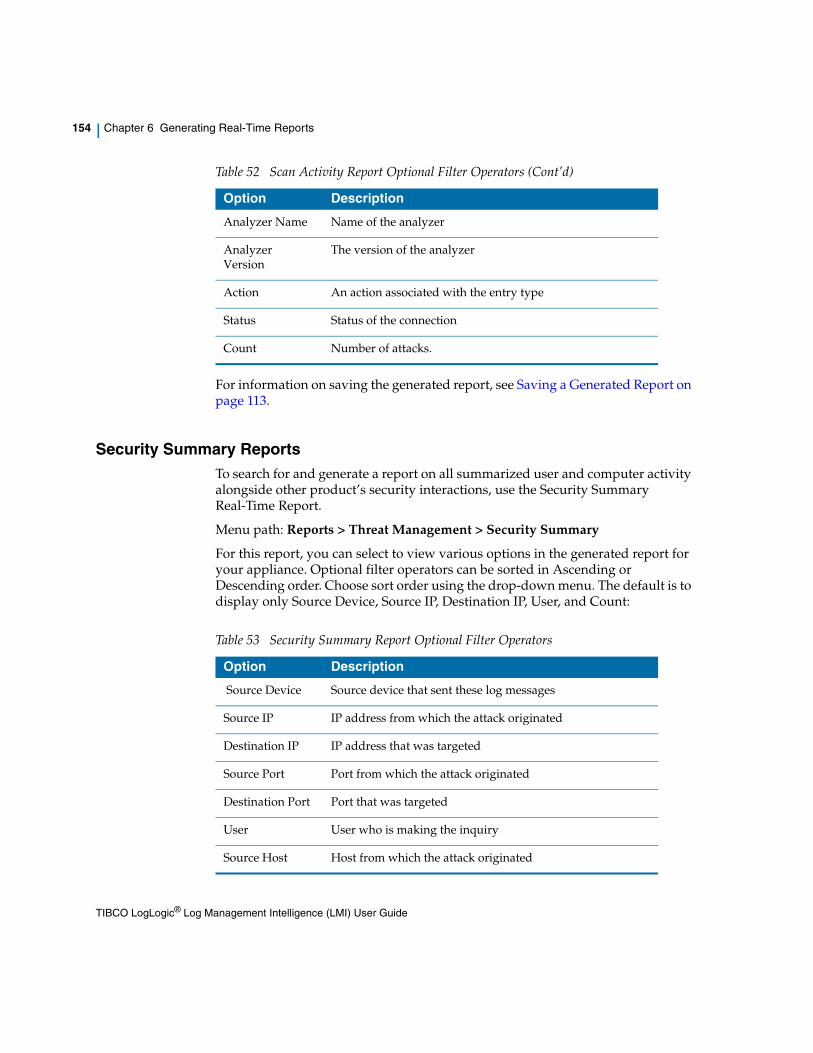
154 | Chapter 6 Generating Real-Time Reports
For information on saving the generated report, see Saving a Generated Report on page 113.
Security Summary ReportsTo search for and generate a report on all summarized user and computer activity alongside other product’s security interactions, use the Security Summary Real-Time Report.
Menu path: Reports > Threat Management > Security Summary
For this report, you can select to view various options in the generated report for your appliance. Optional filter operators can be sorted in Ascending or Descending order. Choose sort order using the drop-down menu. The default is to display only Source Device, Source IP, Destination IP, User, and Count:
Analyzer Name Name of the analyzer
Analyzer Version
The version of the analyzer
Action An action associated with the entry type
Status Status of the connection
Count Number of attacks.
Table 52 Scan Activity Report Optional Filter Operators (Cont’d)
Option Description
Table 53 Security Summary Report Optional Filter Operators
Option Description
Source Device Source device that sent these log messages
Source IP IP address from which the attack originated
Destination IP IP address that was targeted
Source Port Port from which the attack originated
Destination Port Port that was targeted
User User who is making the inquiry
Source Host Host from which the attack originated
TIBCO LogLogic® Log Management Intelligence (LMI) User Guide
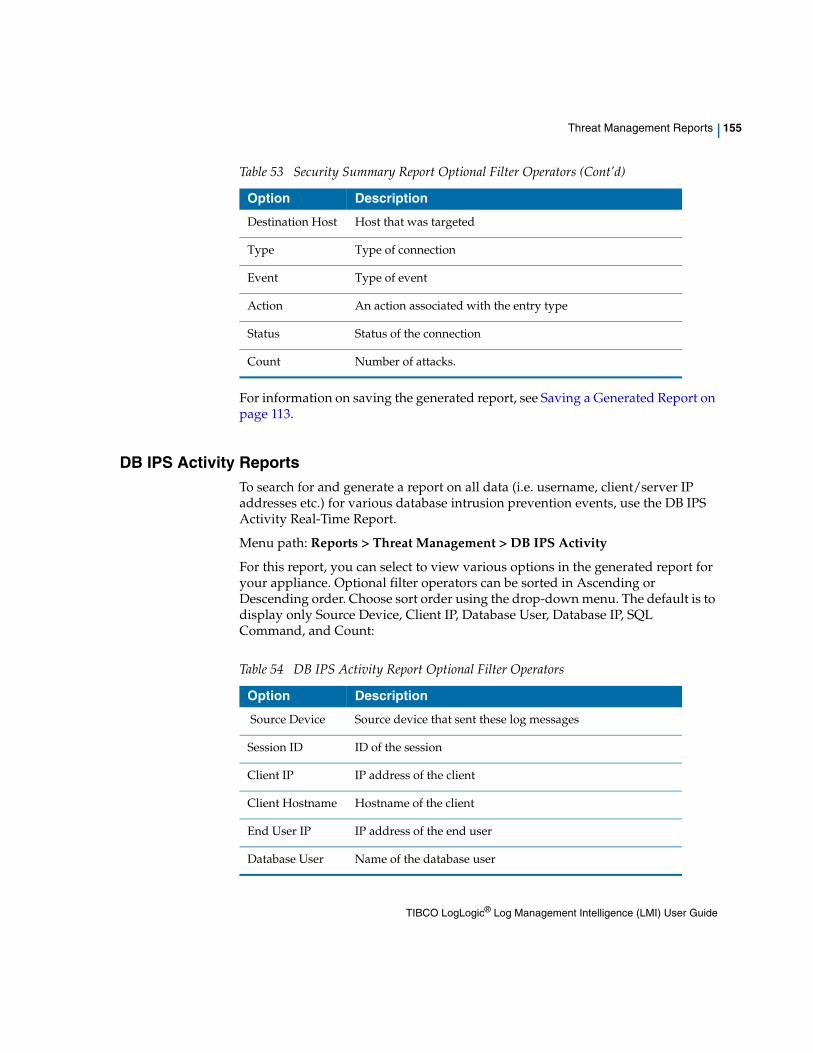
Threat Management Reports | 155
For information on saving the generated report, see Saving a Generated Report on page 113.
DB IPS Activity ReportsTo search for and generate a report on all data (i.e. username, client/server IP addresses etc.) for various database intrusion prevention events, use the DB IPS Activity Real-Time Report.
Menu path: Reports > Threat Management > DB IPS Activity
For this report, you can select to view various options in the generated report for your appliance. Optional filter operators can be sorted in Ascending or Descending order. Choose sort order using the drop-down menu. The default is to display only Source Device, Client IP, Database User, Database IP, SQL Command, and Count:
Destination Host Host that was targeted
Type Type of connection
Event Type of event
Action An action associated with the entry type
Status Status of the connection
Count Number of attacks.
Table 53 Security Summary Report Optional Filter Operators (Cont’d)
Option Description
Table 54 DB IPS Activity Report Optional Filter Operators
Option Description
Source Device Source device that sent these log messages
Session ID ID of the session
Client IP IP address of the client
Client Hostname Hostname of the client
End User IP IP address of the end user
Database User Name of the database user
TIBCO LogLogic® Log Management Intelligence (LMI) User Guide
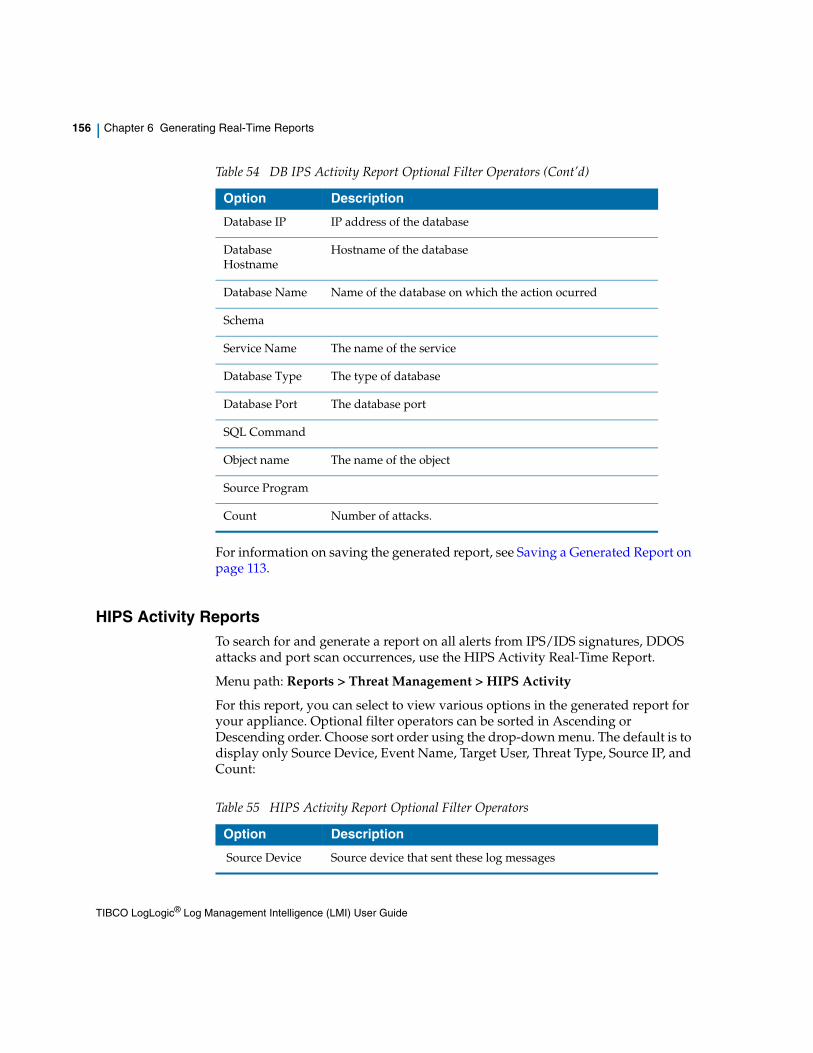
156 | Chapter 6 Generating Real-Time Reports
For information on saving the generated report, see Saving a Generated Report on page 113.
HIPS Activity ReportsTo search for and generate a report on all alerts from IPS/IDS signatures, DDOS attacks and port scan occurrences, use the HIPS Activity Real-Time Report.
Menu path: Reports > Threat Management > HIPS Activity
For this report, you can select to view various options in the generated report for your appliance. Optional filter operators can be sorted in Ascending or Descending order. Choose sort order using the drop-down menu. The default is to display only Source Device, Event Name, Target User, Threat Type, Source IP, and Count:
Database IP IP address of the database
Database Hostname
Hostname of the database
Database Name Name of the database on which the action ocurred
Schema
Service Name The name of the service
Database Type The type of database
Database Port The database port
SQL Command
Object name The name of the object
Source Program
Count Number of attacks.
Table 54 DB IPS Activity Report Optional Filter Operators (Cont’d)
Option Description
Table 55 HIPS Activity Report Optional Filter Operators
Option Description
Source Device Source device that sent these log messages
TIBCO LogLogic® Log Management Intelligence (LMI) User Guide
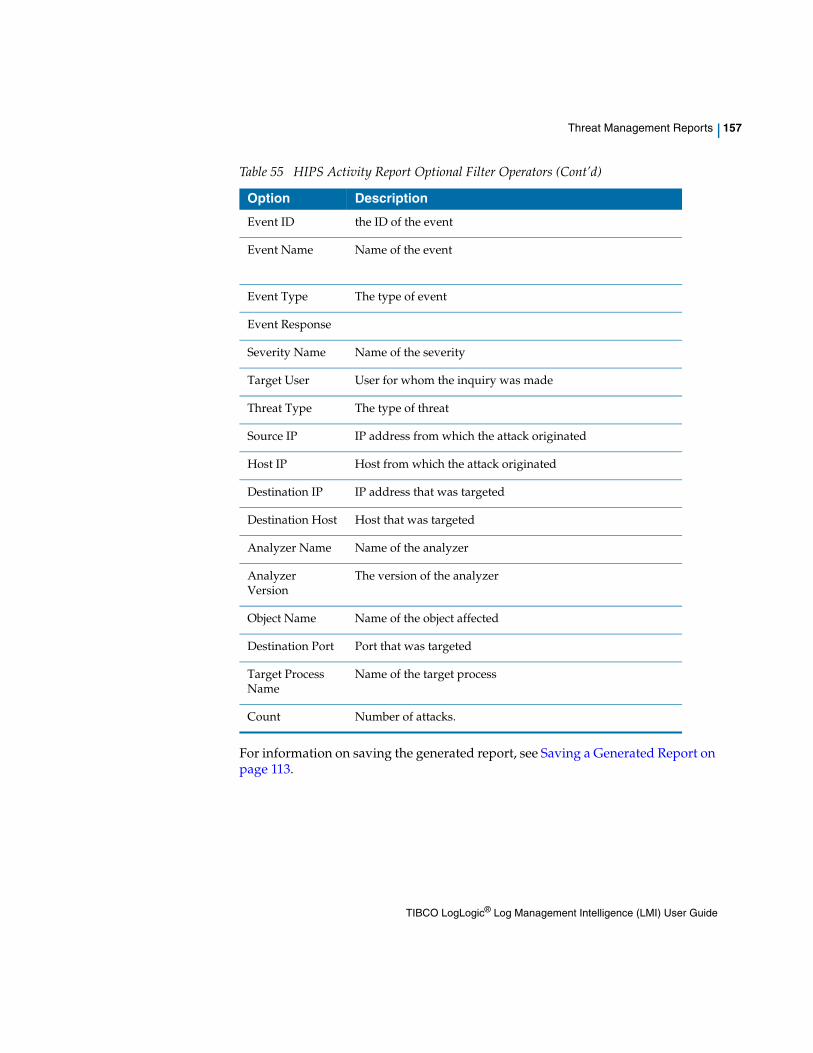
Threat Management Reports | 157
For information on saving the generated report, see Saving a Generated Report on page 113.
Event ID the ID of the event
Event Name Name of the event
Event Type The type of event
Event Response
Severity Name Name of the severity
Target User User for whom the inquiry was made
Threat Type The type of threat
Source IP IP address from which the attack originated
Host IP Host from which the attack originated
Destination IP IP address that was targeted
Destination Host Host that was targeted
Analyzer Name Name of the analyzer
Analyzer Version
The version of the analyzer
Object Name Name of the object affected
Destination Port Port that was targeted
Target Process Name
Name of the target process
Count Number of attacks.
Table 55 HIPS Activity Report Optional Filter Operators (Cont’d)
Option Description
TIBCO LogLogic® Log Management Intelligence (LMI) User Guide
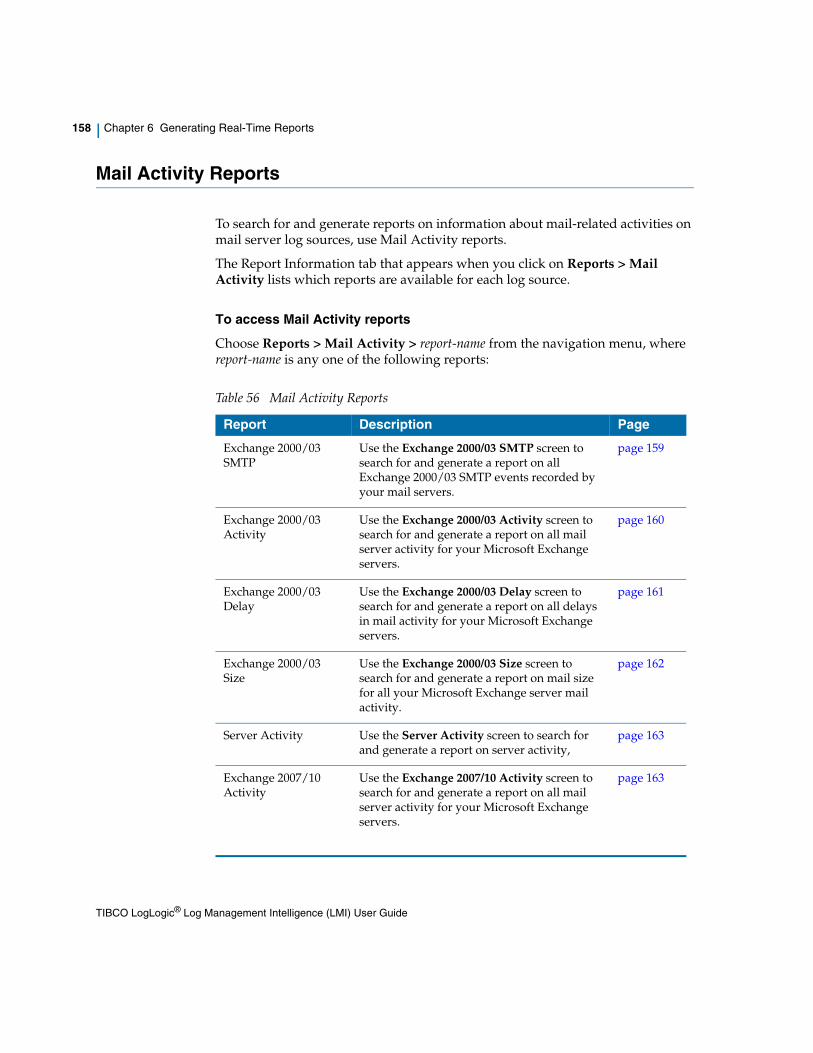
158 | Chapter 6 Generating Real-Time Reports
Mail Activity Reports
To search for and generate reports on information about mail-related activities on mail server log sources, use Mail Activity reports.
The Report Information tab that appears when you click on Reports > Mail Activity lists which reports are available for each log source.
To access Mail Activity reports
Choose Reports > Mail Activity > report-name from the navigation menu, where report-name is any one of the following reports:
Table 56 Mail Activity Reports
Report Description Page
Exchange 2000/03 SMTP
Use the Exchange 2000/03 SMTP screen to search for and generate a report on all Exchange 2000/03 SMTP events recorded by your mail servers.
page 159
Exchange 2000/03 Activity
Use the Exchange 2000/03 Activity screen to search for and generate a report on all mail server activity for your Microsoft Exchange servers.
page 160
Exchange 2000/03 Delay
Use the Exchange 2000/03 Delay screen to search for and generate a report on all delays in mail activity for your Microsoft Exchange servers.
page 161
Exchange 2000/03 Size
Use the Exchange 2000/03 Size screen to search for and generate a report on mail size for all your Microsoft Exchange server mail activity.
page 162
Server Activity Use the Server Activity screen to search for and generate a report on server activity,
page 163
Exchange 2007/10 Activity
Use the Exchange 2007/10 Activity screen to search for and generate a report on all mail server activity for your Microsoft Exchange servers.
page 163
TIBCO LogLogic® Log Management Intelligence (LMI) User Guide
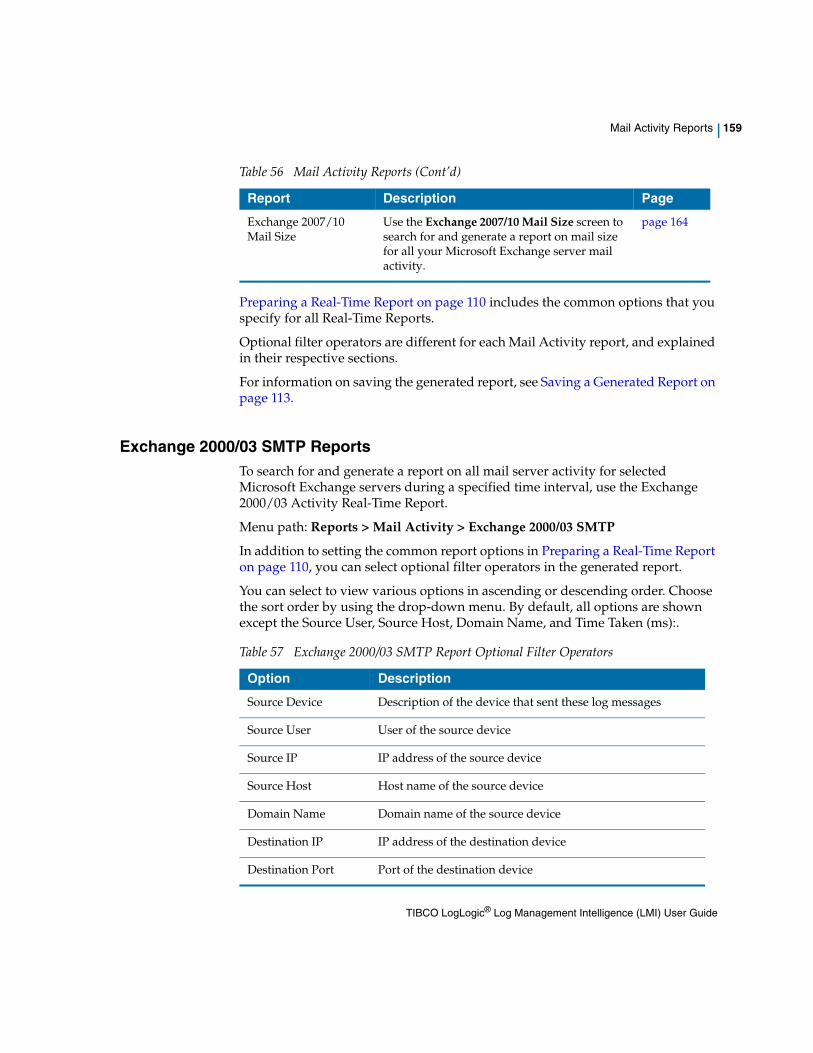
Mail Activity Reports | 159
Preparing a Real-Time Report on page 110 includes the common options that you specify for all Real-Time Reports.
Optional filter operators are different for each Mail Activity report, and explained in their respective sections.
For information on saving the generated report, see Saving a Generated Report on page 113.
Exchange 2000/03 SMTP ReportsTo search for and generate a report on all mail server activity for selected Microsoft Exchange servers during a specified time interval, use the Exchange 2000/03 Activity Real-Time Report.
Menu path: Reports > Mail Activity > Exchange 2000/03 SMTP
In addition to setting the common report options in Preparing a Real-Time Report on page 110, you can select optional filter operators in the generated report.
You can select to view various options in ascending or descending order. Choose the sort order by using the drop-down menu. By default, all options are shown except the Source User, Source Host, Domain Name, and Time Taken (ms):.
Exchange 2007/10 Mail Size
Use the Exchange 2007/10 Mail Size screen to search for and generate a report on mail size for all your Microsoft Exchange server mail activity.
page 164
Table 56 Mail Activity Reports (Cont’d)
Report Description Page
Table 57 Exchange 2000/03 SMTP Report Optional Filter Operators
Option Description
Source Device Description of the device that sent these log messages
Source User User of the source device
Source IP IP address of the source device
Source Host Host name of the source device
Domain Name Domain name of the source device
Destination IP IP address of the destination device
Destination Port Port of the destination device
TIBCO LogLogic® Log Management Intelligence (LMI) User Guide
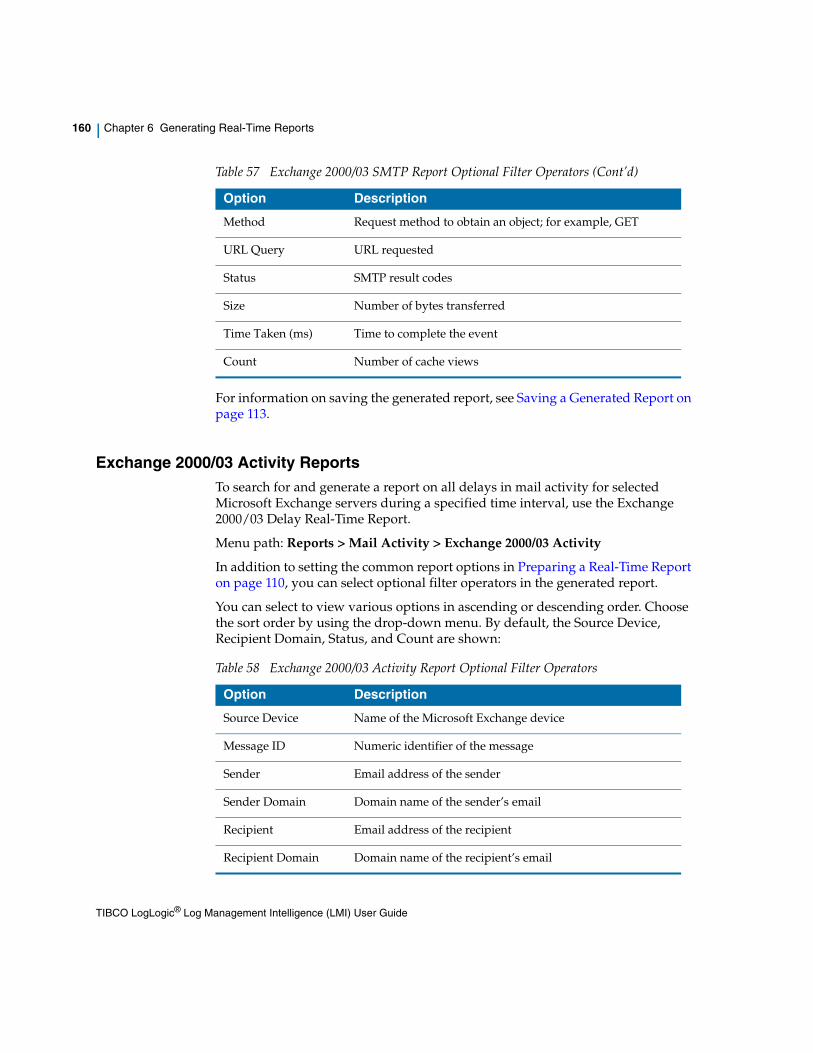
160 | Chapter 6 Generating Real-Time Reports
For information on saving the generated report, see Saving a Generated Report on page 113.
Exchange 2000/03 Activity ReportsTo search for and generate a report on all delays in mail activity for selected Microsoft Exchange servers during a specified time interval, use the Exchange 2000/03 Delay Real-Time Report.
Menu path: Reports > Mail Activity > Exchange 2000/03 Activity
In addition to setting the common report options in Preparing a Real-Time Report on page 110, you can select optional filter operators in the generated report.
You can select to view various options in ascending or descending order. Choose the sort order by using the drop-down menu. By default, the Source Device, Recipient Domain, Status, and Count are shown:
Method Request method to obtain an object; for example, GET
URL Query URL requested
Status SMTP result codes
Size Number of bytes transferred
Time Taken (ms) Time to complete the event
Count Number of cache views
Table 57 Exchange 2000/03 SMTP Report Optional Filter Operators (Cont’d)
Option Description
Table 58 Exchange 2000/03 Activity Report Optional Filter Operators
Option Description
Source Device Name of the Microsoft Exchange device
Message ID Numeric identifier of the message
Sender Email address of the sender
Sender Domain Domain name of the sender’s email
Recipient Email address of the recipient
Recipient Domain Domain name of the recipient’s email
TIBCO LogLogic® Log Management Intelligence (LMI) User Guide
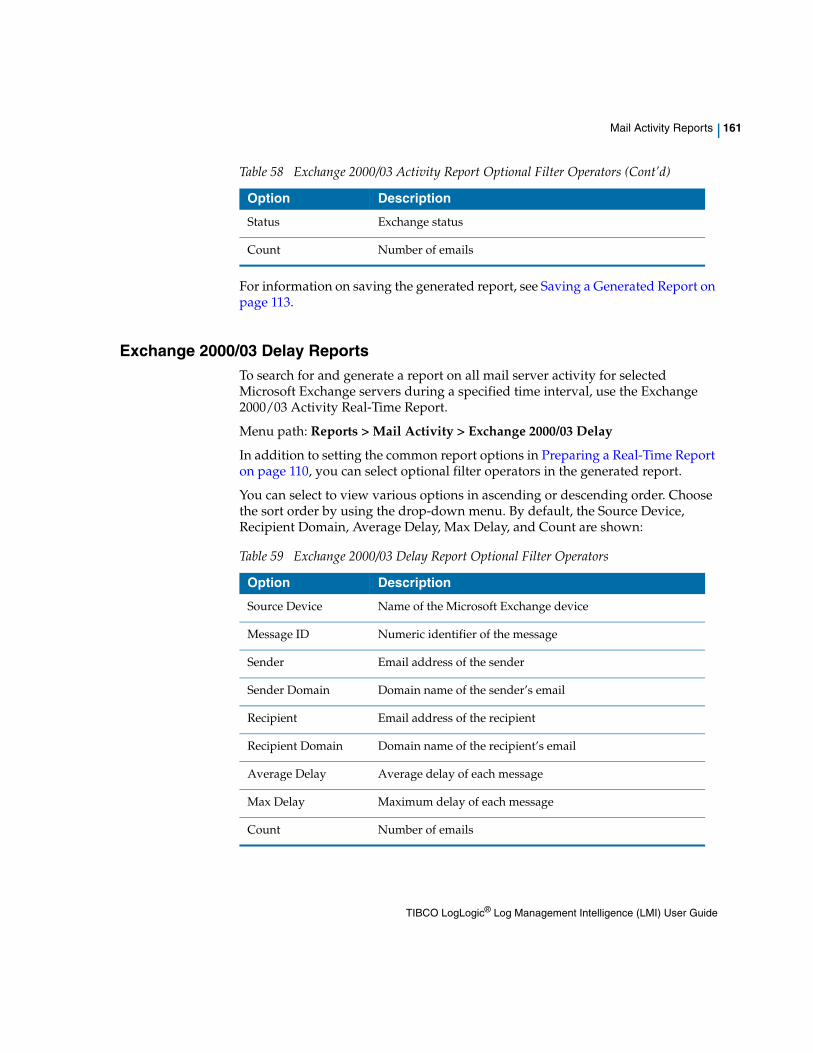
Mail Activity Reports | 161
For information on saving the generated report, see Saving a Generated Report on page 113.
Exchange 2000/03 Delay ReportsTo search for and generate a report on all mail server activity for selected Microsoft Exchange servers during a specified time interval, use the Exchange 2000/03 Activity Real-Time Report.
Menu path: Reports > Mail Activity > Exchange 2000/03 Delay
In addition to setting the common report options in Preparing a Real-Time Report on page 110, you can select optional filter operators in the generated report.
You can select to view various options in ascending or descending order. Choose the sort order by using the drop-down menu. By default, the Source Device, Recipient Domain, Average Delay, Max Delay, and Count are shown:
Status Exchange status
Count Number of emails
Table 58 Exchange 2000/03 Activity Report Optional Filter Operators (Cont’d)
Option Description
Table 59 Exchange 2000/03 Delay Report Optional Filter Operators
Option Description
Source Device Name of the Microsoft Exchange device
Message ID Numeric identifier of the message
Sender Email address of the sender
Sender Domain Domain name of the sender’s email
Recipient Email address of the recipient
Recipient Domain Domain name of the recipient’s email
Average Delay Average delay of each message
Max Delay Maximum delay of each message
Count Number of emails
TIBCO LogLogic® Log Management Intelligence (LMI) User Guide
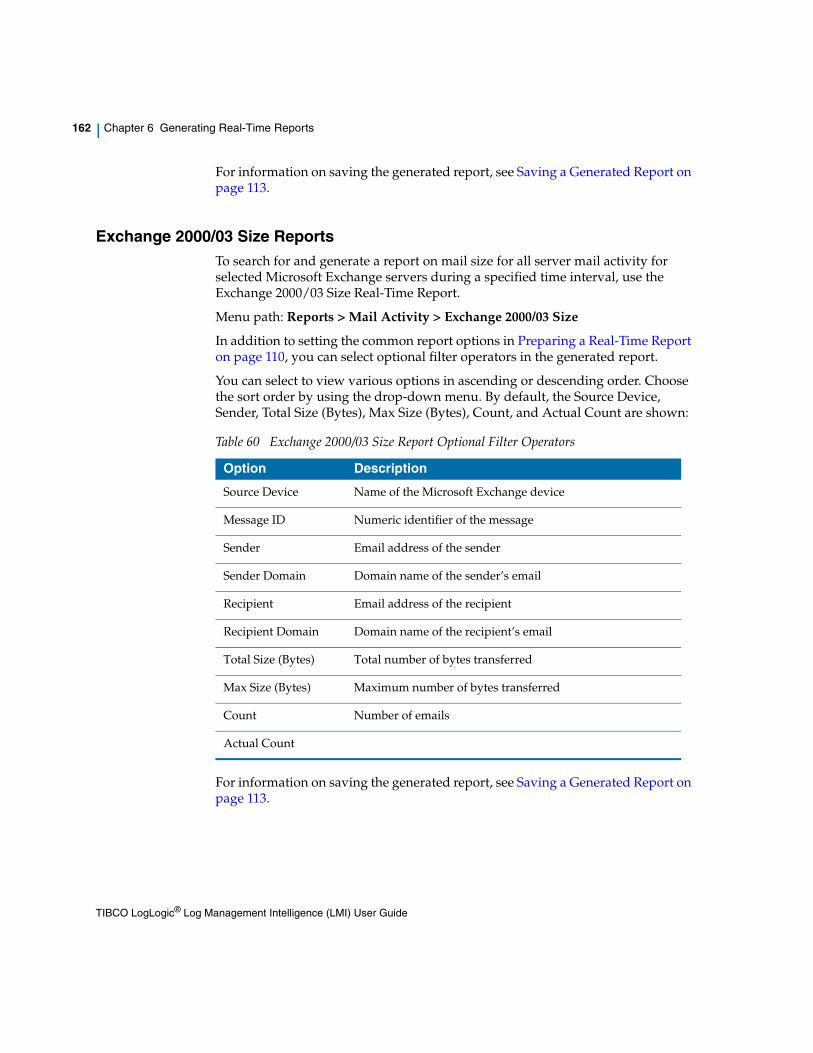
162 | Chapter 6 Generating Real-Time Reports
For information on saving the generated report, see Saving a Generated Report on page 113.
Exchange 2000/03 Size ReportsTo search for and generate a report on mail size for all server mail activity for selected Microsoft Exchange servers during a specified time interval, use the Exchange 2000/03 Size Real-Time Report.
Menu path: Reports > Mail Activity > Exchange 2000/03 Size
In addition to setting the common report options in Preparing a Real-Time Report on page 110, you can select optional filter operators in the generated report.
You can select to view various options in ascending or descending order. Choose the sort order by using the drop-down menu. By default, the Source Device, Sender, Total Size (Bytes), Max Size (Bytes), Count, and Actual Count are shown:
For information on saving the generated report, see Saving a Generated Report on page 113.
Table 60 Exchange 2000/03 Size Report Optional Filter Operators
Option Description
Source Device Name of the Microsoft Exchange device
Message ID Numeric identifier of the message
Sender Email address of the sender
Sender Domain Domain name of the sender’s email
Recipient Email address of the recipient
Recipient Domain Domain name of the recipient’s email
Total Size (Bytes) Total number of bytes transferred
Max Size (Bytes) Maximum number of bytes transferred
Count Number of emails
Actual Count
TIBCO LogLogic® Log Management Intelligence (LMI) User Guide
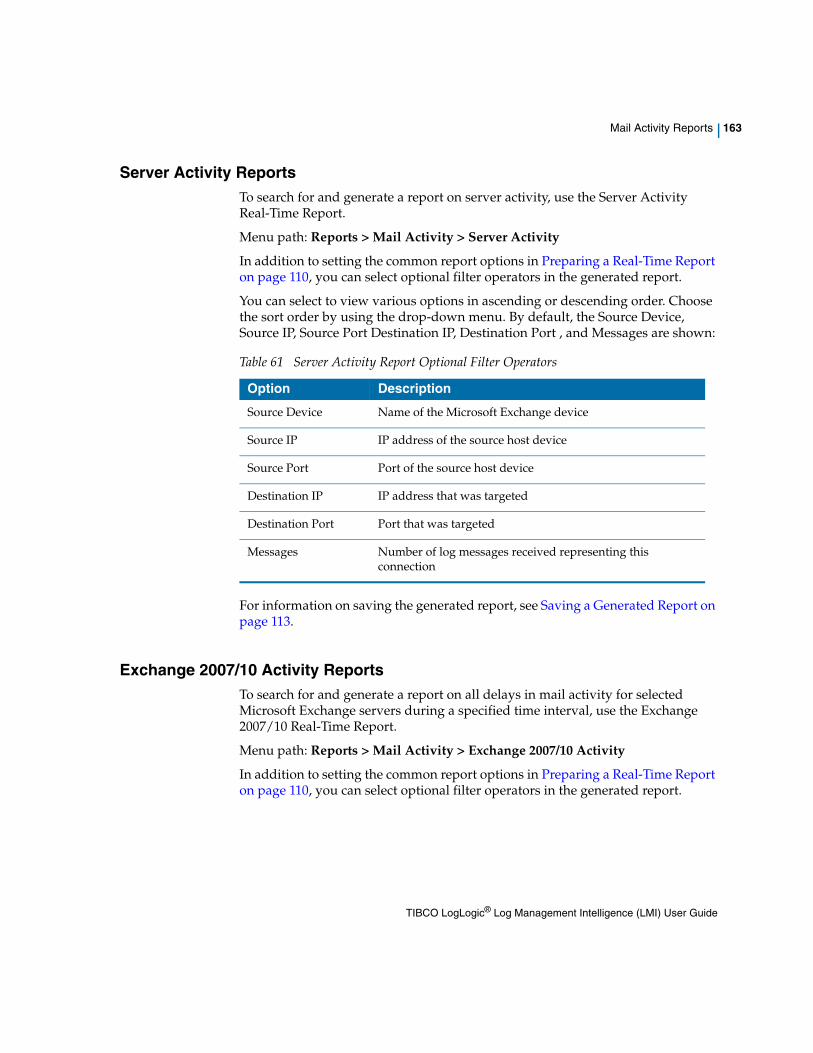
Mail Activity Reports | 163
Server Activity ReportsTo search for and generate a report on server activity, use the Server Activity Real-Time Report.
Menu path: Reports > Mail Activity > Server Activity
In addition to setting the common report options in Preparing a Real-Time Report on page 110, you can select optional filter operators in the generated report.
You can select to view various options in ascending or descending order. Choose the sort order by using the drop-down menu. By default, the Source Device, Source IP, Source Port Destination IP, Destination Port , and Messages are shown:
For information on saving the generated report, see Saving a Generated Report on page 113.
Exchange 2007/10 Activity ReportsTo search for and generate a report on all delays in mail activity for selected Microsoft Exchange servers during a specified time interval, use the Exchange 2007/10 Real-Time Report.
Menu path: Reports > Mail Activity > Exchange 2007/10 Activity
In addition to setting the common report options in Preparing a Real-Time Report on page 110, you can select optional filter operators in the generated report.
Table 61 Server Activity Report Optional Filter Operators
Option Description
Source Device Name of the Microsoft Exchange device
Source IP IP address of the source host device
Source Port Port of the source host device
Destination IP IP address that was targeted
Destination Port Port that was targeted
Messages Number of log messages received representing this connection
TIBCO LogLogic® Log Management Intelligence (LMI) User Guide
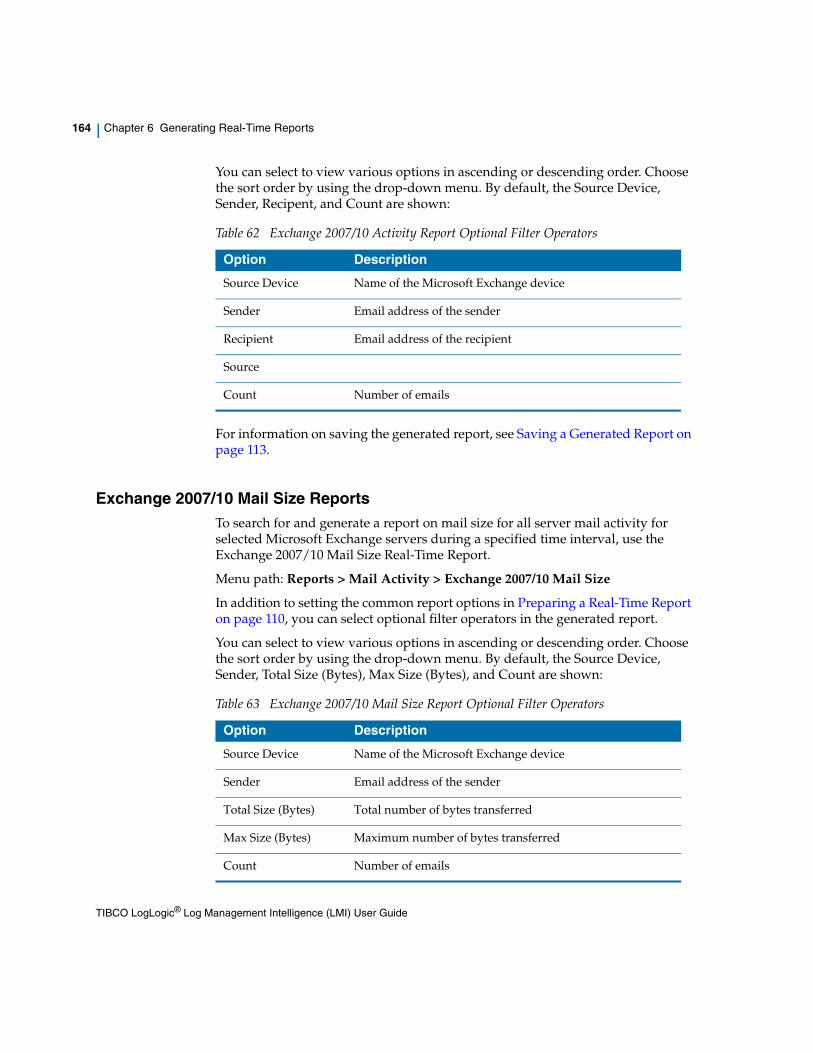
164 | Chapter 6 Generating Real-Time Reports
You can select to view various options in ascending or descending order. Choose the sort order by using the drop-down menu. By default, the Source Device, Sender, Recipent, and Count are shown:
For information on saving the generated report, see Saving a Generated Report on page 113.
Exchange 2007/10 Mail Size ReportsTo search for and generate a report on mail size for all server mail activity for selected Microsoft Exchange servers during a specified time interval, use the Exchange 2007/10 Mail Size Real-Time Report.
Menu path: Reports > Mail Activity > Exchange 2007/10 Mail Size
In addition to setting the common report options in Preparing a Real-Time Report on page 110, you can select optional filter operators in the generated report.
You can select to view various options in ascending or descending order. Choose the sort order by using the drop-down menu. By default, the Source Device, Sender, Total Size (Bytes), Max Size (Bytes), and Count are shown:
Table 62 Exchange 2007/10 Activity Report Optional Filter Operators
Option Description
Source Device Name of the Microsoft Exchange device
Sender Email address of the sender
Recipient Email address of the recipient
Source
Count Number of emails
Table 63 Exchange 2007/10 Mail Size Report Optional Filter Operators
Option Description
Source Device Name of the Microsoft Exchange device
Sender Email address of the sender
Total Size (Bytes) Total number of bytes transferred
Max Size (Bytes) Maximum number of bytes transferred
Count Number of emails
TIBCO LogLogic® Log Management Intelligence (LMI) User Guide

Mail Activity Reports | 165
For information on saving the generated report, see Saving a Generated Report on page 113
TIBCO LogLogic® Log Management Intelligence (LMI) User Guide
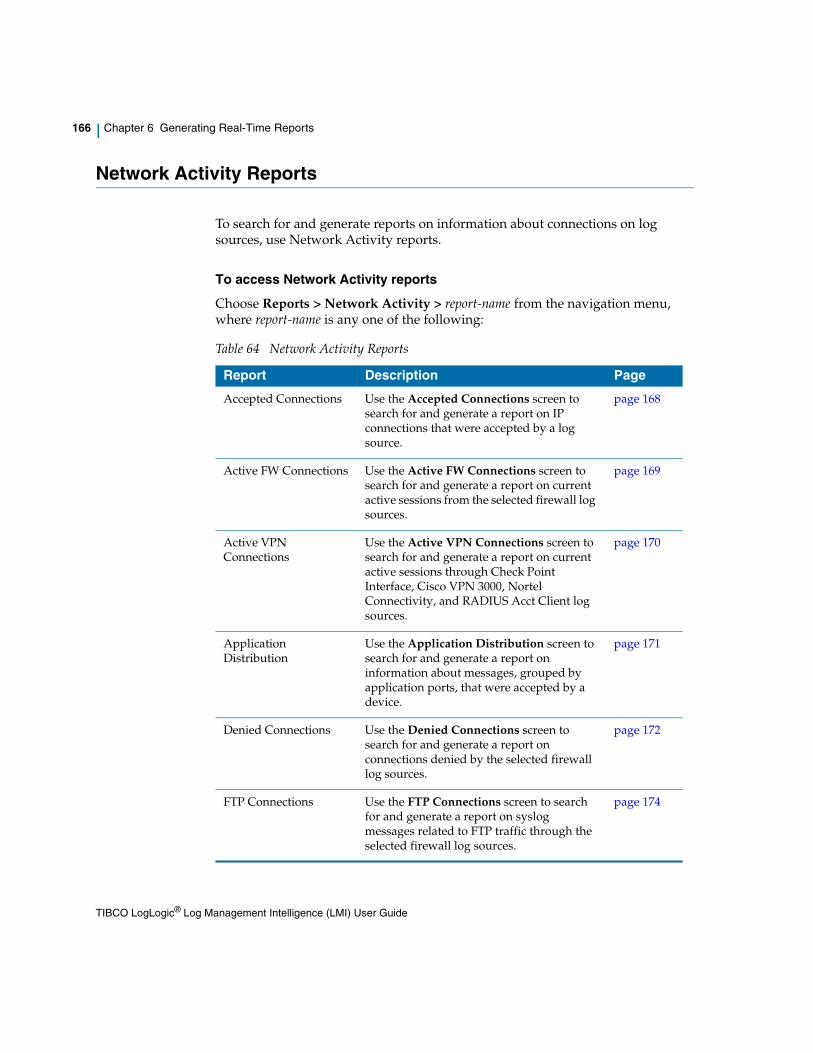
166 | Chapter 6 Generating Real-Time Reports
Network Activity Reports
To search for and generate reports on information about connections on log sources, use Network Activity reports.
To access Network Activity reports
Choose Reports > Network Activity > report-name from the navigation menu, where report-name is any one of the following:
Table 64 Network Activity Reports
Report Description Page
Accepted Connections Use the Accepted Connections screen to search for and generate a report on IP connections that were accepted by a log source.
page 168
Active FW Connections Use the Active FW Connections screen to search for and generate a report on current active sessions from the selected firewall log sources.
page 169
Active VPN Connections
Use the Active VPN Connections screen to search for and generate a report on current active sessions through Check Point Interface, Cisco VPN 3000, Nortel Connectivity, and RADIUS Acct Client log sources.
page 170
Application Distribution
Use the Application Distribution screen to search for and generate a report on information about messages, grouped by application ports, that were accepted by a device.
page 171
Denied Connections Use the Denied Connections screen to search for and generate a report on connections denied by the selected firewall log sources.
page 172
FTP Connections Use the FTP Connections screen to search for and generate a report on syslog messages related to FTP traffic through the selected firewall log sources.
page 174
TIBCO LogLogic® Log Management Intelligence (LMI) User Guide
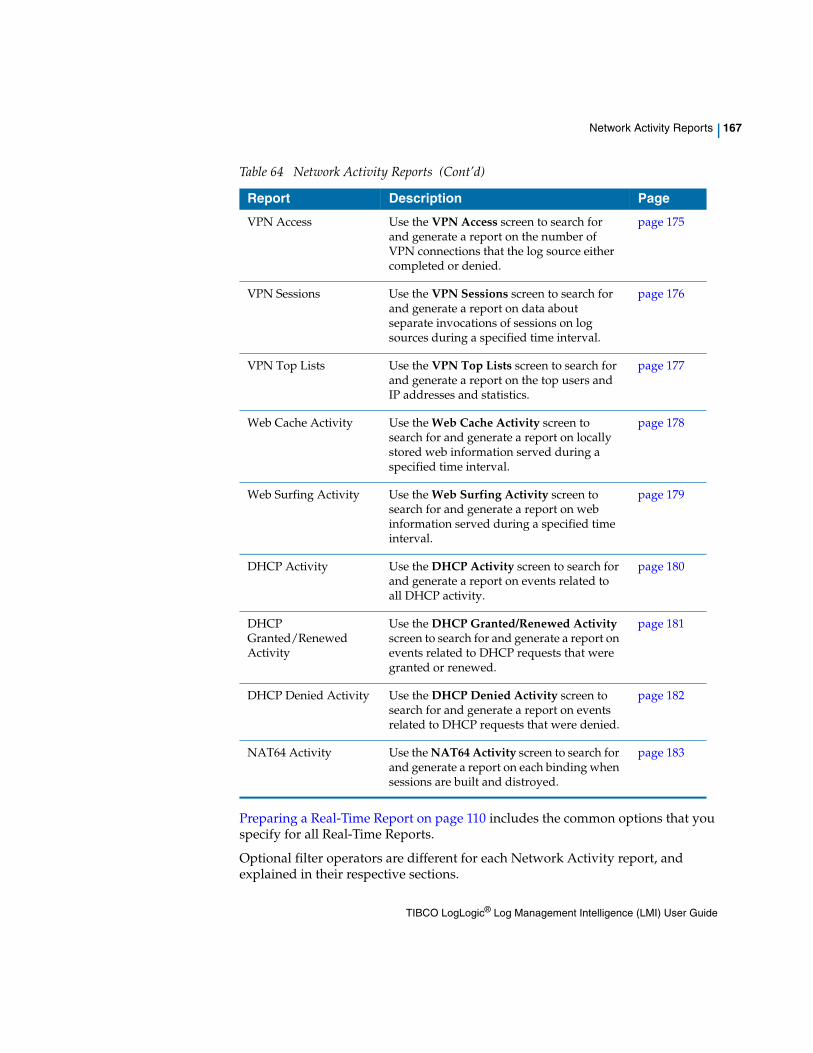
Network Activity Reports | 167
Preparing a Real-Time Report on page 110 includes the common options that you specify for all Real-Time Reports.
Optional filter operators are different for each Network Activity report, and explained in their respective sections.
VPN Access Use the VPN Access screen to search for and generate a report on the number of VPN connections that the log source either completed or denied.
page 175
VPN Sessions Use the VPN Sessions screen to search for and generate a report on data about separate invocations of sessions on log sources during a specified time interval.
page 176
VPN Top Lists Use the VPN Top Lists screen to search for and generate a report on the top users and IP addresses and statistics.
page 177
Web Cache Activity Use the Web Cache Activity screen to search for and generate a report on locally stored web information served during a specified time interval.
page 178
Web Surfing Activity Use the Web Surfing Activity screen to search for and generate a report on web information served during a specified time interval.
page 179
DHCP Activity Use the DHCP Activity screen to search for and generate a report on events related to all DHCP activity.
page 180
DHCP Granted/Renewed Activity
Use the DHCP Granted/Renewed Activity screen to search for and generate a report on events related to DHCP requests that were granted or renewed.
page 181
DHCP Denied Activity Use the DHCP Denied Activity screen to search for and generate a report on events related to DHCP requests that were denied.
page 182
NAT64 Activity Use the NAT64 Activity screen to search for and generate a report on each binding when sessions are built and distroyed.
page 183
Table 64 Network Activity Reports (Cont’d)
Report Description Page
TIBCO LogLogic® Log Management Intelligence (LMI) User Guide
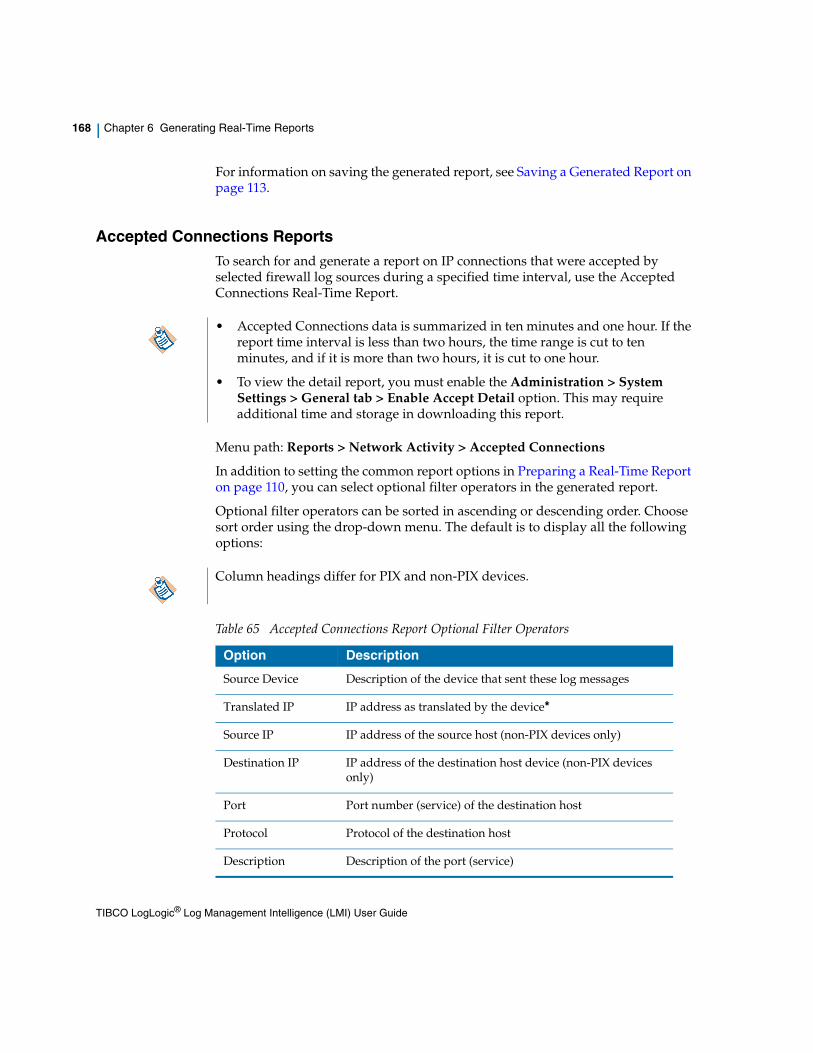
168 | Chapter 6 Generating Real-Time Reports
For information on saving the generated report, see Saving a Generated Report on page 113.
Accepted Connections ReportsTo search for and generate a report on IP connections that were accepted by selected firewall log sources during a specified time interval, use the Accepted Connections Real-Time Report.
Menu path: Reports > Network Activity > Accepted Connections
In addition to setting the common report options in Preparing a Real-Time Report on page 110, you can select optional filter operators in the generated report.
Optional filter operators can be sorted in ascending or descending order. Choose sort order using the drop-down menu. The default is to display all the following options:
• Accepted Connections data is summarized in ten minutes and one hour. If the report time interval is less than two hours, the time range is cut to ten minutes, and if it is more than two hours, it is cut to one hour.
• To view the detail report, you must enable the Administration > System Settings > General tab > Enable Accept Detail option. This may require additional time and storage in downloading this report.
Column headings differ for PIX and non-PIX devices.
Table 65 Accepted Connections Report Optional Filter Operators
Option Description
Source Device Description of the device that sent these log messages
Translated IP IP address as translated by the device*
Source IP IP address of the source host (non-PIX devices only)
Destination IP IP address of the destination host device (non-PIX devices only)
Port Port number (service) of the destination host
Protocol Protocol of the destination host
Description Description of the port (service)
TIBCO LogLogic® Log Management Intelligence (LMI) User Guide
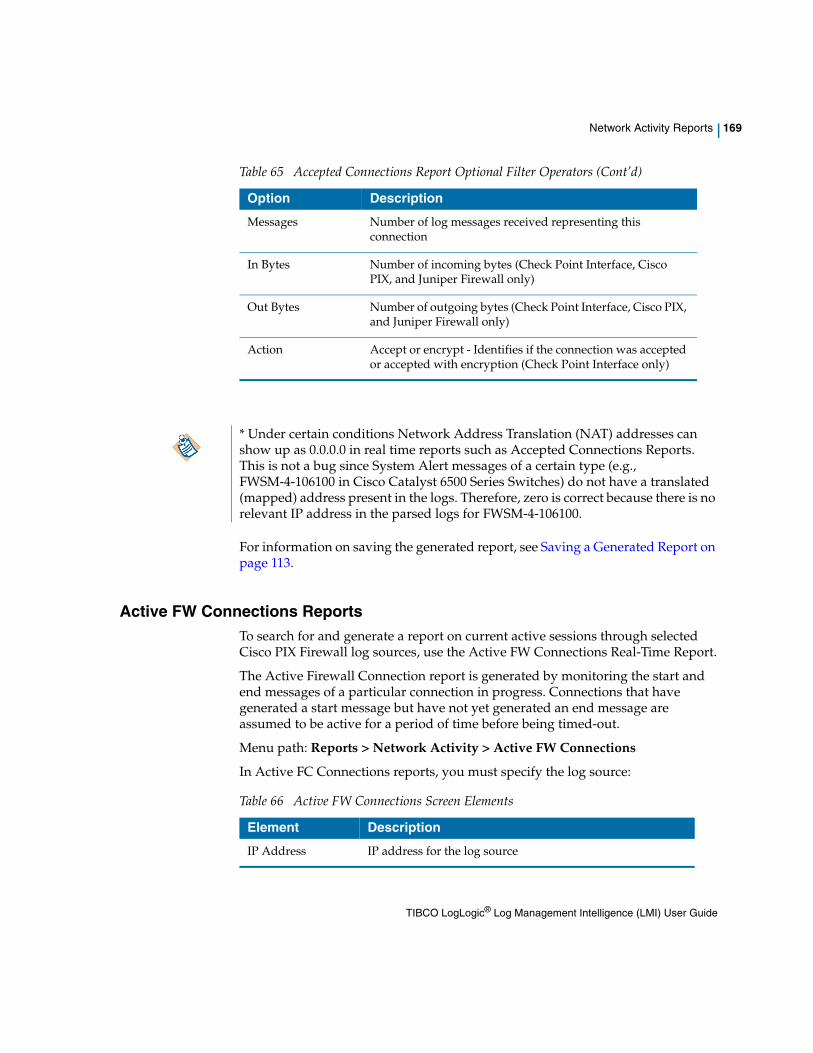
Network Activity Reports | 169
For information on saving the generated report, see Saving a Generated Report on page 113.
Active FW Connections ReportsTo search for and generate a report on current active sessions through selected Cisco PIX Firewall log sources, use the Active FW Connections Real-Time Report.
The Active Firewall Connection report is generated by monitoring the start and end messages of a particular connection in progress. Connections that have generated a start message but have not yet generated an end message are assumed to be active for a period of time before being timed-out.
Menu path: Reports > Network Activity > Active FW Connections
In Active FC Connections reports, you must specify the log source:
Messages Number of log messages received representing this connection
In Bytes Number of incoming bytes (Check Point Interface, Cisco PIX, and Juniper Firewall only)
Out Bytes Number of outgoing bytes (Check Point Interface, Cisco PIX, and Juniper Firewall only)
Action Accept or encrypt - Identifies if the connection was accepted or accepted with encryption (Check Point Interface only)
Table 65 Accepted Connections Report Optional Filter Operators (Cont’d)
Option Description
* Under certain conditions Network Address Translation (NAT) addresses can show up as 0.0.0.0 in real time reports such as Accepted Connections Reports. This is not a bug since System Alert messages of a certain type (e.g., FWSM-4-106100 in Cisco Catalyst 6500 Series Switches) do not have a translated (mapped) address present in the logs. Therefore, zero is correct because there is no relevant IP address in the parsed logs for FWSM-4-106100.
Table 66 Active FW Connections Screen Elements
Element Description
IP Address IP address for the log source
TIBCO LogLogic® Log Management Intelligence (LMI) User Guide
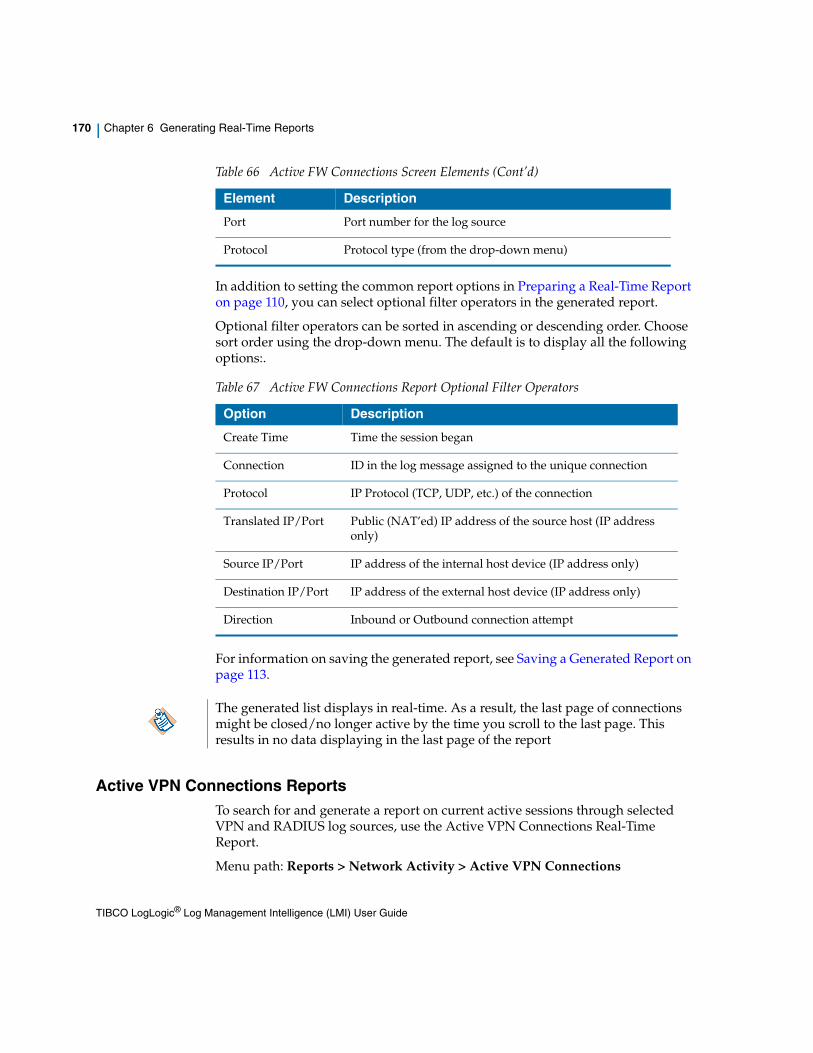
170 | Chapter 6 Generating Real-Time Reports
In addition to setting the common report options in Preparing a Real-Time Report on page 110, you can select optional filter operators in the generated report.
Optional filter operators can be sorted in ascending or descending order. Choose sort order using the drop-down menu. The default is to display all the following options:.
For information on saving the generated report, see Saving a Generated Report on page 113.
Active VPN Connections ReportsTo search for and generate a report on current active sessions through selected VPN and RADIUS log sources, use the Active VPN Connections Real-Time Report.
Menu path: Reports > Network Activity > Active VPN Connections
Port Port number for the log source
Protocol Protocol type (from the drop-down menu)
Table 67 Active FW Connections Report Optional Filter Operators
Option Description
Create Time Time the session began
Connection ID in the log message assigned to the unique connection
Protocol IP Protocol (TCP, UDP, etc.) of the connection
Translated IP/Port Public (NAT’ed) IP address of the source host (IP address only)
Source IP/Port IP address of the internal host device (IP address only)
Destination IP/Port IP address of the external host device (IP address only)
Direction Inbound or Outbound connection attempt
Table 66 Active FW Connections Screen Elements (Cont’d)
Element Description
The generated list displays in real-time. As a result, the last page of connections might be closed/no longer active by the time you scroll to the last page. This results in no data displaying in the last page of the report
TIBCO LogLogic® Log Management Intelligence (LMI) User Guide
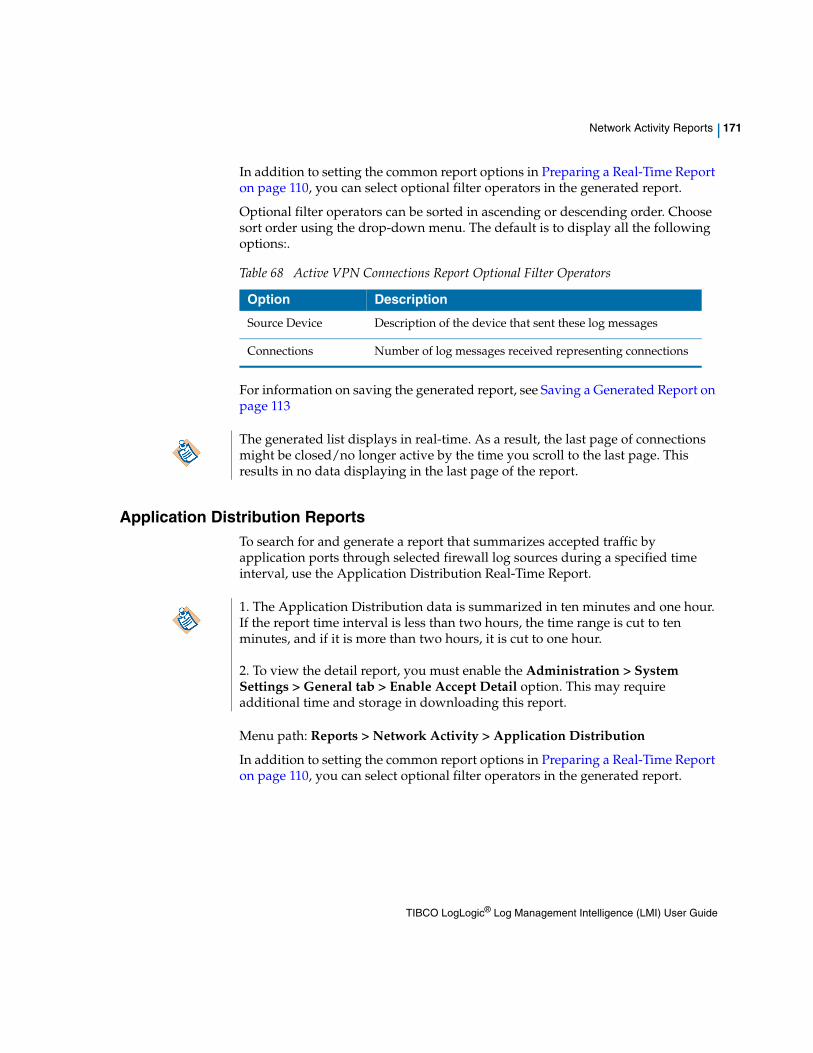
Network Activity Reports | 171
In addition to setting the common report options in Preparing a Real-Time Report on page 110, you can select optional filter operators in the generated report.
Optional filter operators can be sorted in ascending or descending order. Choose sort order using the drop-down menu. The default is to display all the following options:.
For information on saving the generated report, see Saving a Generated Report on page 113
Application Distribution ReportsTo search for and generate a report that summarizes accepted traffic by application ports through selected firewall log sources during a specified time interval, use the Application Distribution Real-Time Report.
Menu path: Reports > Network Activity > Application Distribution
In addition to setting the common report options in Preparing a Real-Time Report on page 110, you can select optional filter operators in the generated report.
Table 68 Active VPN Connections Report Optional Filter Operators
Option Description
Source Device Description of the device that sent these log messages
Connections Number of log messages received representing connections
The generated list displays in real-time. As a result, the last page of connections might be closed/no longer active by the time you scroll to the last page. This results in no data displaying in the last page of the report.
1. The Application Distribution data is summarized in ten minutes and one hour. If the report time interval is less than two hours, the time range is cut to ten minutes, and if it is more than two hours, it is cut to one hour.
2. To view the detail report, you must enable the Administration > System Settings > General tab > Enable Accept Detail option. This may require additional time and storage in downloading this report.
TIBCO LogLogic® Log Management Intelligence (LMI) User Guide
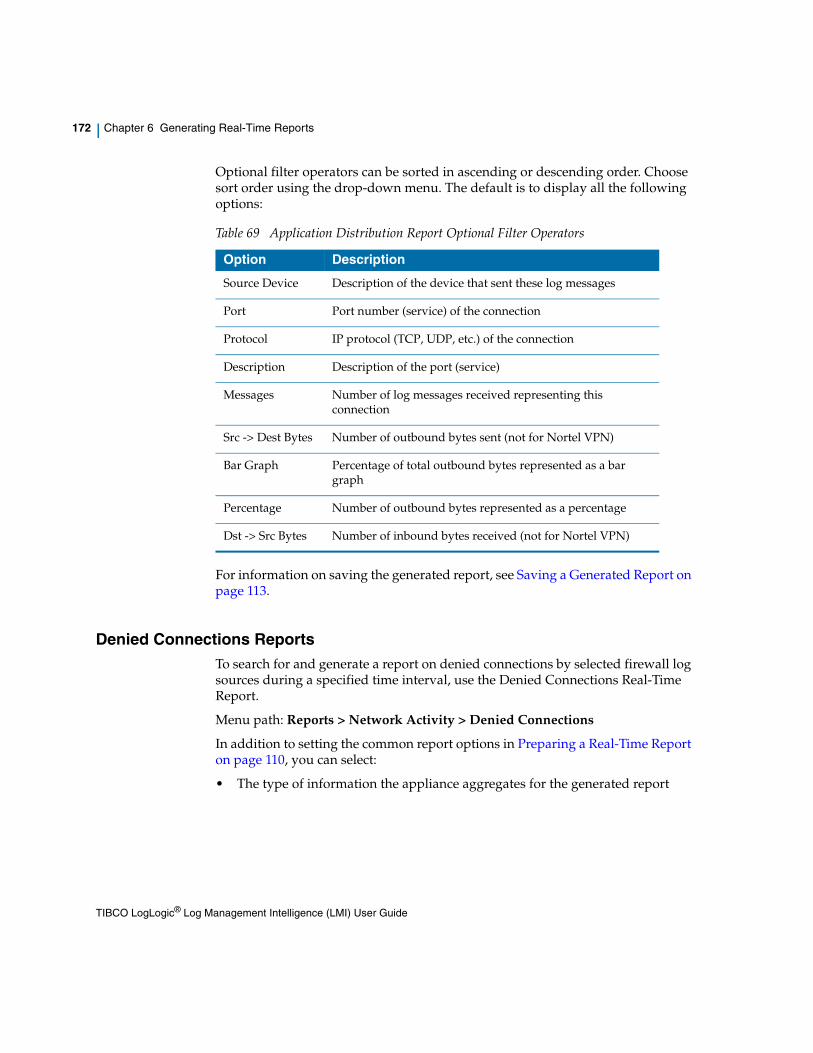
172 | Chapter 6 Generating Real-Time Reports
Optional filter operators can be sorted in ascending or descending order. Choose sort order using the drop-down menu. The default is to display all the following options:
For information on saving the generated report, see Saving a Generated Report on page 113.
Denied Connections ReportsTo search for and generate a report on denied connections by selected firewall log sources during a specified time interval, use the Denied Connections Real-Time Report.
Menu path: Reports > Network Activity > Denied Connections
In addition to setting the common report options in Preparing a Real-Time Report on page 110, you can select:
• The type of information the appliance aggregates for the generated report
Table 69 Application Distribution Report Optional Filter Operators
Option Description
Source Device Description of the device that sent these log messages
Port Port number (service) of the connection
Protocol IP protocol (TCP, UDP, etc.) of the connection
Description Description of the port (service)
Messages Number of log messages received representing this connection
Src -> Dest Bytes Number of outbound bytes sent (not for Nortel VPN)
Bar Graph Percentage of total outbound bytes represented as a bar graph
Percentage Number of outbound bytes represented as a percentage
Dst -> Src Bytes Number of inbound bytes received (not for Nortel VPN)
TIBCO LogLogic® Log Management Intelligence (LMI) User Guide
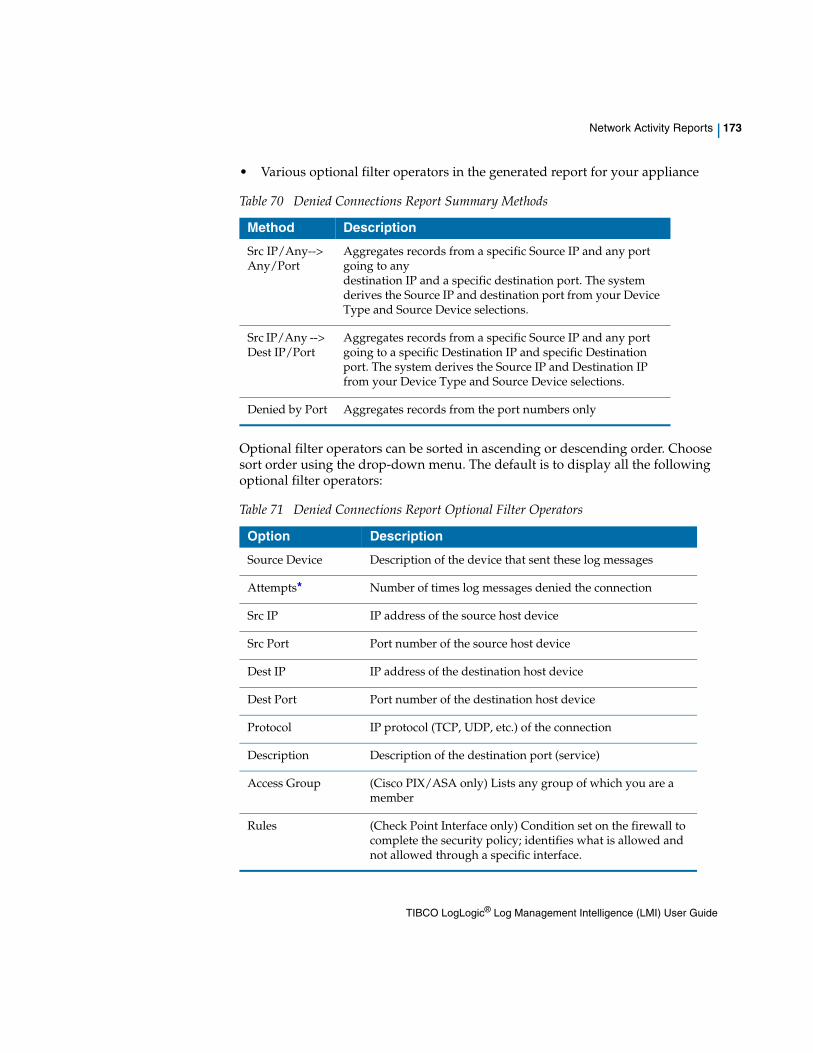
Network Activity Reports | 173
• Various optional filter operators in the generated report for your appliance
Optional filter operators can be sorted in ascending or descending order. Choose sort order using the drop-down menu. The default is to display all the following optional filter operators:
Table 70 Denied Connections Report Summary Methods
Method Description
Src IP/Any--> Any/Port
Aggregates records from a specific Source IP and any port going to any destination IP and a specific destination port. The system derives the Source IP and destination port from your Device Type and Source Device selections.
Src IP/Any --> Dest IP/Port
Aggregates records from a specific Source IP and any port going to a specific Destination IP and specific Destination port. The system derives the Source IP and Destination IP from your Device Type and Source Device selections.
Denied by Port Aggregates records from the port numbers only
Table 71 Denied Connections Report Optional Filter Operators
Option Description
Source Device Description of the device that sent these log messages
Attempts* Number of times log messages denied the connection
Src IP IP address of the source host device
Src Port Port number of the source host device
Dest IP IP address of the destination host device
Dest Port Port number of the destination host device
Protocol IP protocol (TCP, UDP, etc.) of the connection
Description Description of the destination port (service)
Access Group (Cisco PIX/ASA only) Lists any group of which you are a member
Rules (Check Point Interface only) Condition set on the firewall to complete the security policy; identifies what is allowed and not allowed through a specific interface.
TIBCO LogLogic® Log Management Intelligence (LMI) User Guide
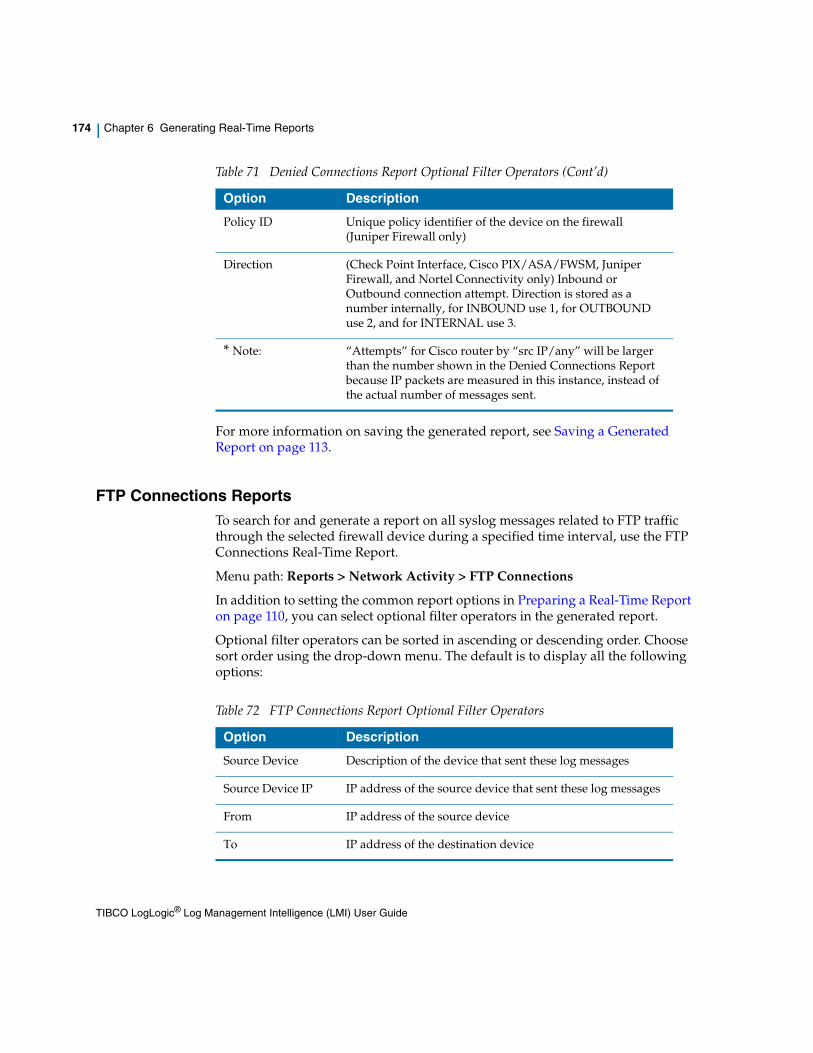
174 | Chapter 6 Generating Real-Time Reports
For more information on saving the generated report, see Saving a Generated Report on page 113.
FTP Connections ReportsTo search for and generate a report on all syslog messages related to FTP traffic through the selected firewall device during a specified time interval, use the FTP Connections Real-Time Report.
Menu path: Reports > Network Activity > FTP Connections
In addition to setting the common report options in Preparing a Real-Time Report on page 110, you can select optional filter operators in the generated report.
Optional filter operators can be sorted in ascending or descending order. Choose sort order using the drop-down menu. The default is to display all the following options:
Policy ID Unique policy identifier of the device on the firewall (Juniper Firewall only)
Direction (Check Point Interface, Cisco PIX/ASA/FWSM, Juniper Firewall, and Nortel Connectivity only) Inbound or Outbound connection attempt. Direction is stored as a number internally, for INBOUND use 1, for OUTBOUND use 2, and for INTERNAL use 3.
* Note: “Attempts” for Cisco router by “src IP/any” will be larger than the number shown in the Denied Connections Report because IP packets are measured in this instance, instead of the actual number of messages sent.
Table 71 Denied Connections Report Optional Filter Operators (Cont’d)
Option Description
Table 72 FTP Connections Report Optional Filter Operators
Option Description
Source Device Description of the device that sent these log messages
Source Device IP IP address of the source device that sent these log messages
From IP address of the source device
To IP address of the destination device
TIBCO LogLogic® Log Management Intelligence (LMI) User Guide
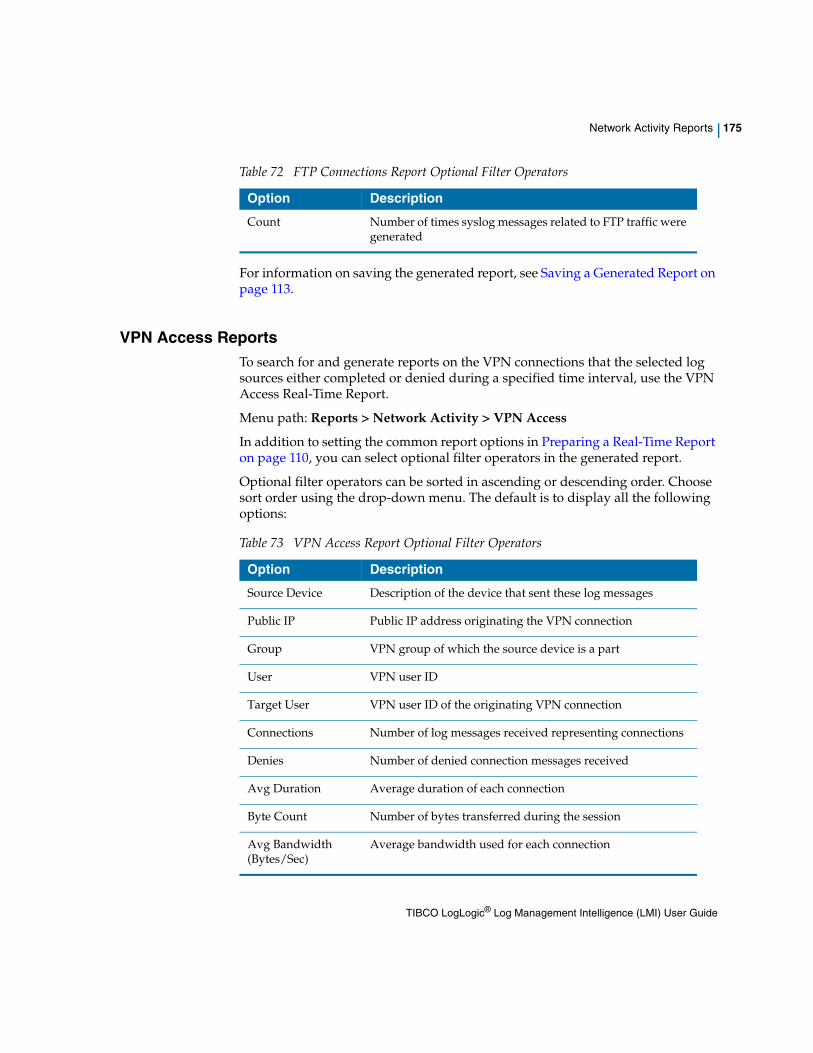
Network Activity Reports | 175
For information on saving the generated report, see Saving a Generated Report on page 113.
VPN Access ReportsTo search for and generate reports on the VPN connections that the selected log sources either completed or denied during a specified time interval, use the VPN Access Real-Time Report.
Menu path: Reports > Network Activity > VPN Access
In addition to setting the common report options in Preparing a Real-Time Report on page 110, you can select optional filter operators in the generated report.
Optional filter operators can be sorted in ascending or descending order. Choose sort order using the drop-down menu. The default is to display all the following options:
Count Number of times syslog messages related to FTP traffic were generated
Table 72 FTP Connections Report Optional Filter Operators
Option Description
Table 73 VPN Access Report Optional Filter Operators
Option Description
Source Device Description of the device that sent these log messages
Public IP Public IP address originating the VPN connection
Group VPN group of which the source device is a part
User VPN user ID
Target User VPN user ID of the originating VPN connection
Connections Number of log messages received representing connections
Denies Number of denied connection messages received
Avg Duration Average duration of each connection
Byte Count Number of bytes transferred during the session
Avg Bandwidth (Bytes/Sec)
Average bandwidth used for each connection
TIBCO LogLogic® Log Management Intelligence (LMI) User Guide
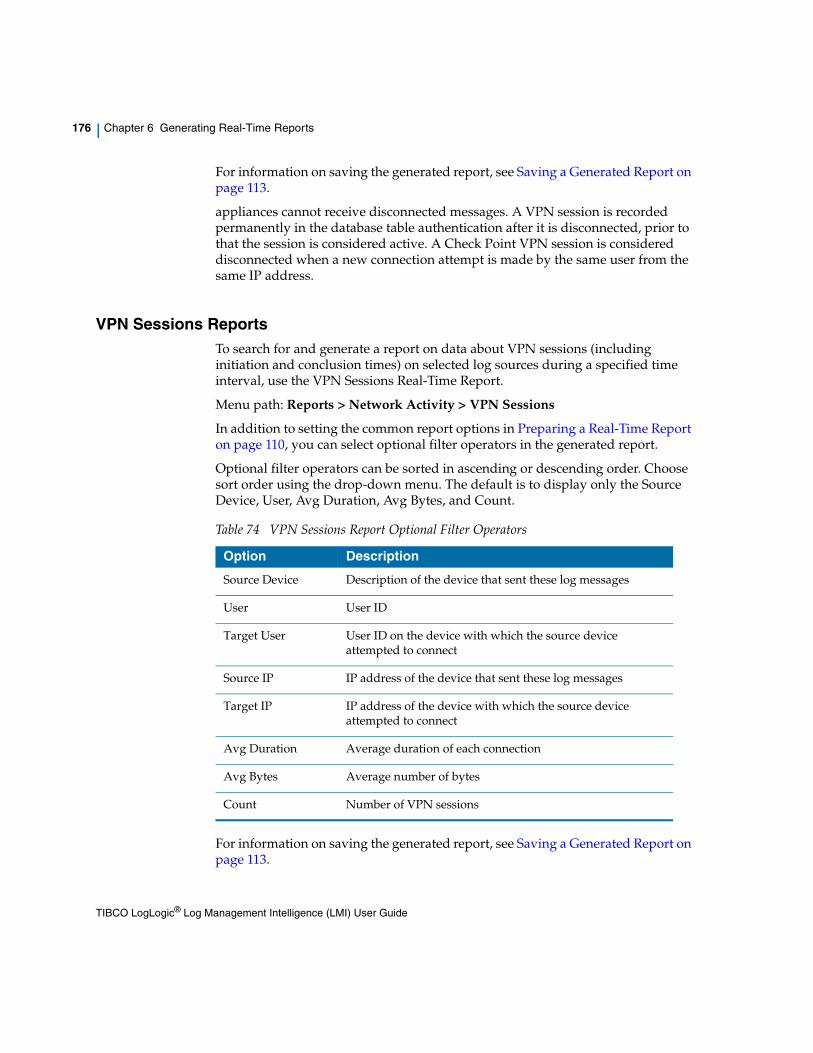
176 | Chapter 6 Generating Real-Time Reports
For information on saving the generated report, see Saving a Generated Report on page 113.
appliances cannot receive disconnected messages. A VPN session is recorded permanently in the database table authentication after it is disconnected, prior to that the session is considered active. A Check Point VPN session is considered disconnected when a new connection attempt is made by the same user from the same IP address.
VPN Sessions ReportsTo search for and generate a report on data about VPN sessions (including initiation and conclusion times) on selected log sources during a specified time interval, use the VPN Sessions Real-Time Report.
Menu path: Reports > Network Activity > VPN Sessions
In addition to setting the common report options in Preparing a Real-Time Report on page 110, you can select optional filter operators in the generated report.
Optional filter operators can be sorted in ascending or descending order. Choose sort order using the drop-down menu. The default is to display only the Source Device, User, Avg Duration, Avg Bytes, and Count.
For information on saving the generated report, see Saving a Generated Report on page 113.
Table 74 VPN Sessions Report Optional Filter Operators
Option Description
Source Device Description of the device that sent these log messages
User User ID
Target User User ID on the device with which the source device attempted to connect
Source IP IP address of the device that sent these log messages
Target IP IP address of the device with which the source device attempted to connect
Avg Duration Average duration of each connection
Avg Bytes Average number of bytes
Count Number of VPN sessions
TIBCO LogLogic® Log Management Intelligence (LMI) User Guide
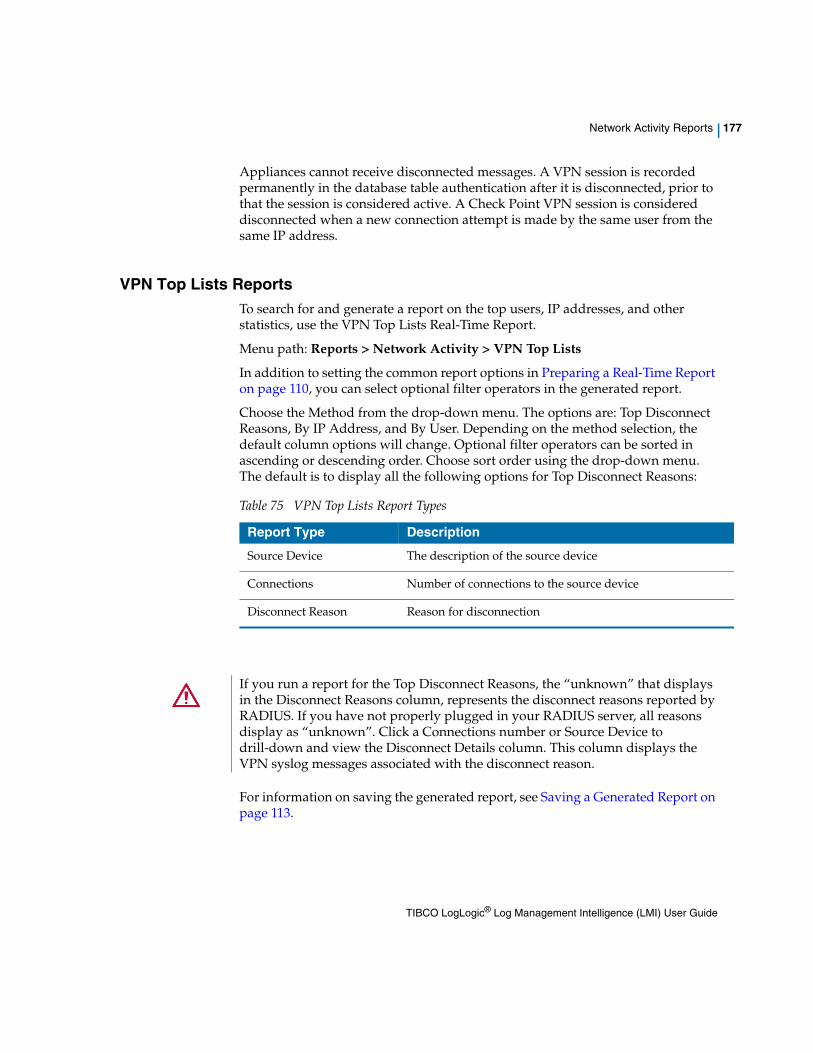
Network Activity Reports | 177
Appliances cannot receive disconnected messages. A VPN session is recorded permanently in the database table authentication after it is disconnected, prior to that the session is considered active. A Check Point VPN session is considered disconnected when a new connection attempt is made by the same user from the same IP address.
VPN Top Lists ReportsTo search for and generate a report on the top users, IP addresses, and other statistics, use the VPN Top Lists Real-Time Report.
Menu path: Reports > Network Activity > VPN Top Lists
In addition to setting the common report options in Preparing a Real-Time Report on page 110, you can select optional filter operators in the generated report.
Choose the Method from the drop-down menu. The options are: Top Disconnect Reasons, By IP Address, and By User. Depending on the method selection, the default column options will change. Optional filter operators can be sorted in ascending or descending order. Choose sort order using the drop-down menu. The default is to display all the following options for Top Disconnect Reasons:
For information on saving the generated report, see Saving a Generated Report on page 113.
Table 75 VPN Top Lists Report Types
Report Type Description
Source Device The description of the source device
Connections Number of connections to the source device
Disconnect Reason Reason for disconnection
If you run a report for the Top Disconnect Reasons, the “unknown” that displays in the Disconnect Reasons column, represents the disconnect reasons reported by RADIUS. If you have not properly plugged in your RADIUS server, all reasons display as “unknown”. Click a Connections number or Source Device to drill-down and view the Disconnect Details column. This column displays the VPN syslog messages associated with the disconnect reason.
TIBCO LogLogic® Log Management Intelligence (LMI) User Guide
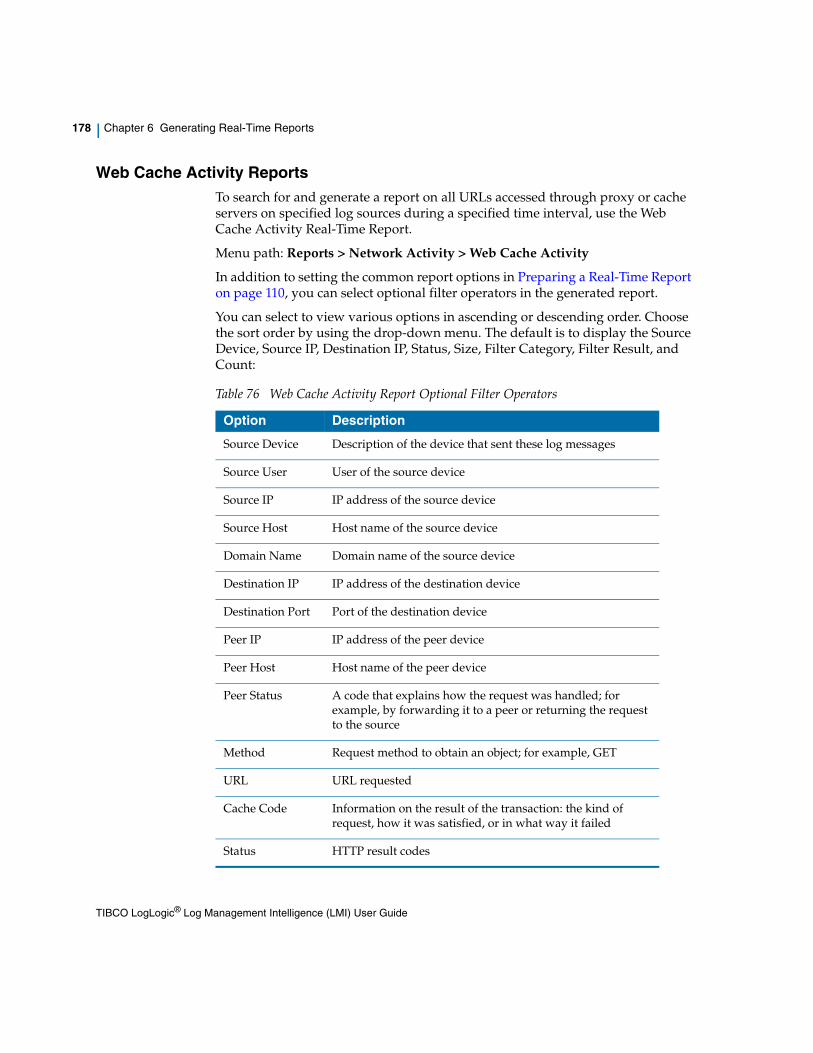
178 | Chapter 6 Generating Real-Time Reports
Web Cache Activity ReportsTo search for and generate a report on all URLs accessed through proxy or cache servers on specified log sources during a specified time interval, use the Web Cache Activity Real-Time Report.
Menu path: Reports > Network Activity > Web Cache Activity
In addition to setting the common report options in Preparing a Real-Time Report on page 110, you can select optional filter operators in the generated report.
You can select to view various options in ascending or descending order. Choose the sort order by using the drop-down menu. The default is to display the Source Device, Source IP, Destination IP, Status, Size, Filter Category, Filter Result, and Count:
Table 76 Web Cache Activity Report Optional Filter Operators
Option Description
Source Device Description of the device that sent these log messages
Source User User of the source device
Source IP IP address of the source device
Source Host Host name of the source device
Domain Name Domain name of the source device
Destination IP IP address of the destination device
Destination Port Port of the destination device
Peer IP IP address of the peer device
Peer Host Host name of the peer device
Peer Status A code that explains how the request was handled; for example, by forwarding it to a peer or returning the request to the source
Method Request method to obtain an object; for example, GET
URL URL requested
Cache Code Information on the result of the transaction: the kind of request, how it was satisfied, or in what way it failed
Status HTTP result codes
TIBCO LogLogic® Log Management Intelligence (LMI) User Guide
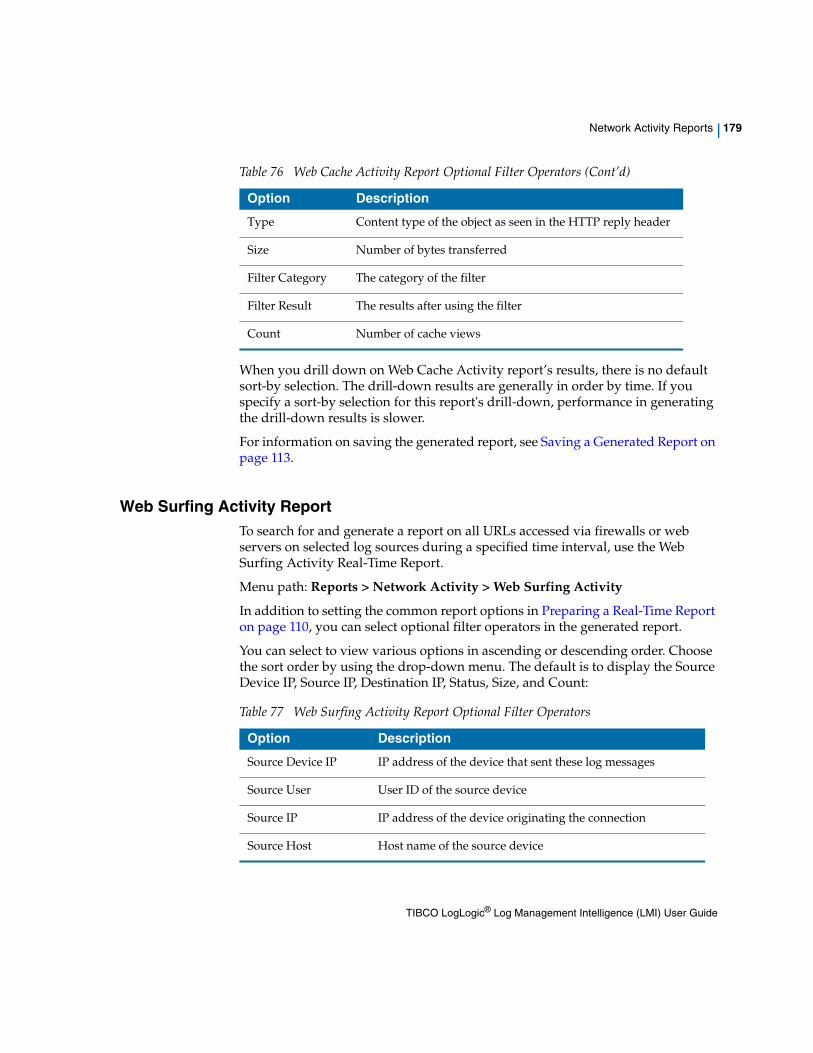
Network Activity Reports | 179
When you drill down on Web Cache Activity report’s results, there is no default sort-by selection. The drill-down results are generally in order by time. If you specify a sort-by selection for this report's drill-down, performance in generating the drill-down results is slower.
For information on saving the generated report, see Saving a Generated Report on page 113.
Web Surfing Activity ReportTo search for and generate a report on all URLs accessed via firewalls or web servers on selected log sources during a specified time interval, use the Web Surfing Activity Real-Time Report.
Menu path: Reports > Network Activity > Web Surfing Activity
In addition to setting the common report options in Preparing a Real-Time Report on page 110, you can select optional filter operators in the generated report.
You can select to view various options in ascending or descending order. Choose the sort order by using the drop-down menu. The default is to display the Source Device IP, Source IP, Destination IP, Status, Size, and Count:
Type Content type of the object as seen in the HTTP reply header
Size Number of bytes transferred
Filter Category The category of the filter
Filter Result The results after using the filter
Count Number of cache views
Table 76 Web Cache Activity Report Optional Filter Operators (Cont’d)
Option Description
Table 77 Web Surfing Activity Report Optional Filter Operators
Option Description
Source Device IP IP address of the device that sent these log messages
Source User User ID of the source device
Source IP IP address of the device originating the connection
Source Host Host name of the source device
TIBCO LogLogic® Log Management Intelligence (LMI) User Guide
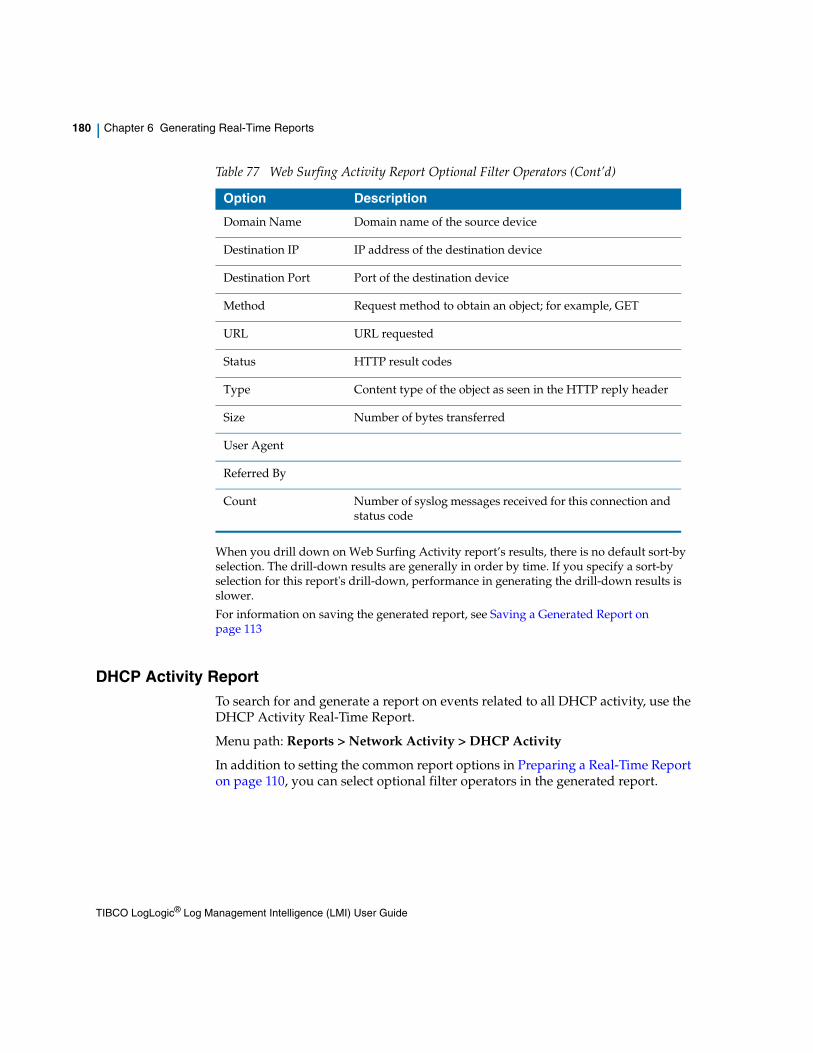
180 | Chapter 6 Generating Real-Time Reports
When you drill down on Web Surfing Activity report’s results, there is no default sort-by selection. The drill-down results are generally in order by time. If you specify a sort-by selection for this report's drill-down, performance in generating the drill-down results is slower.
For information on saving the generated report, see Saving a Generated Report on page 113
DHCP Activity ReportTo search for and generate a report on events related to all DHCP activity, use the DHCP Activity Real-Time Report.
Menu path: Reports > Network Activity > DHCP Activity
In addition to setting the common report options in Preparing a Real-Time Report on page 110, you can select optional filter operators in the generated report.
Domain Name Domain name of the source device
Destination IP IP address of the destination device
Destination Port Port of the destination device
Method Request method to obtain an object; for example, GET
URL URL requested
Status HTTP result codes
Type Content type of the object as seen in the HTTP reply header
Size Number of bytes transferred
User Agent
Referred By
Count Number of syslog messages received for this connection and status code
Table 77 Web Surfing Activity Report Optional Filter Operators (Cont’d)
Option Description
TIBCO LogLogic® Log Management Intelligence (LMI) User Guide
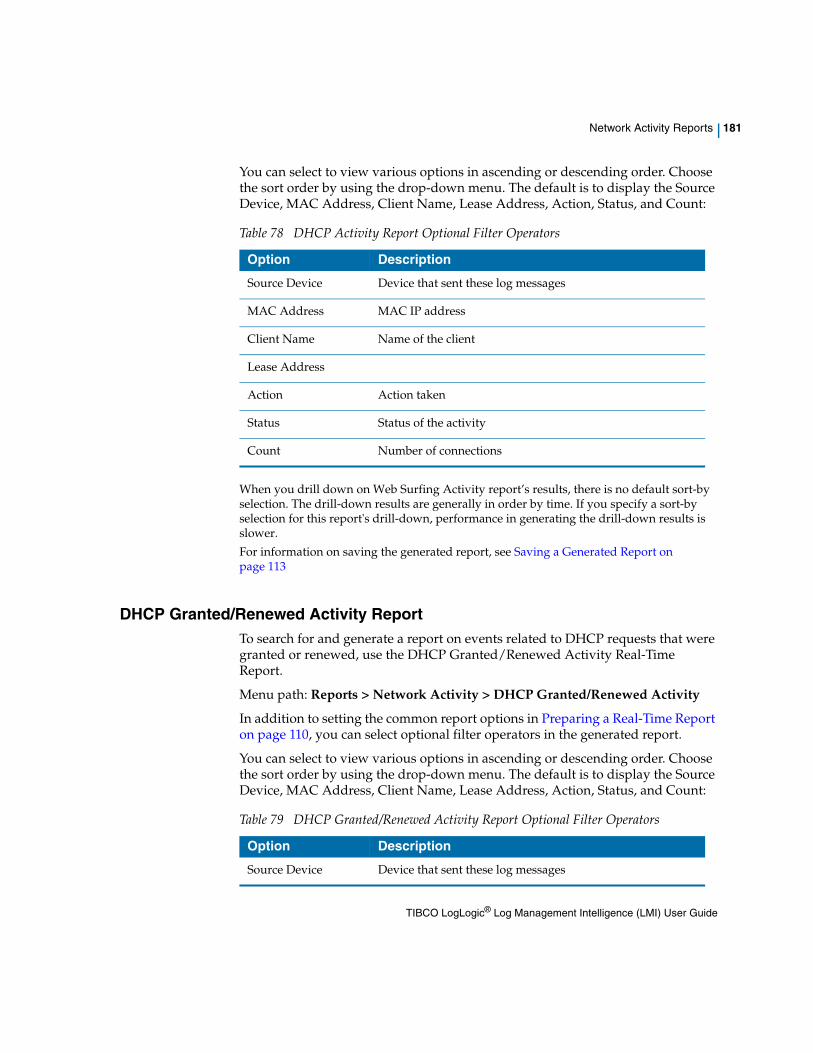
Network Activity Reports | 181
You can select to view various options in ascending or descending order. Choose the sort order by using the drop-down menu. The default is to display the Source Device, MAC Address, Client Name, Lease Address, Action, Status, and Count:
When you drill down on Web Surfing Activity report’s results, there is no default sort-by selection. The drill-down results are generally in order by time. If you specify a sort-by selection for this report's drill-down, performance in generating the drill-down results is slower.
For information on saving the generated report, see Saving a Generated Report on page 113
DHCP Granted/Renewed Activity ReportTo search for and generate a report on events related to DHCP requests that were granted or renewed, use the DHCP Granted/Renewed Activity Real-Time Report.
Menu path: Reports > Network Activity > DHCP Granted/Renewed Activity
In addition to setting the common report options in Preparing a Real-Time Report on page 110, you can select optional filter operators in the generated report.
You can select to view various options in ascending or descending order. Choose the sort order by using the drop-down menu. The default is to display the Source Device, MAC Address, Client Name, Lease Address, Action, Status, and Count:
Table 78 DHCP Activity Report Optional Filter Operators
Option Description
Source Device Device that sent these log messages
MAC Address MAC IP address
Client Name Name of the client
Lease Address
Action Action taken
Status Status of the activity
Count Number of connections
Table 79 DHCP Granted/Renewed Activity Report Optional Filter Operators
Option Description
Source Device Device that sent these log messages
TIBCO LogLogic® Log Management Intelligence (LMI) User Guide
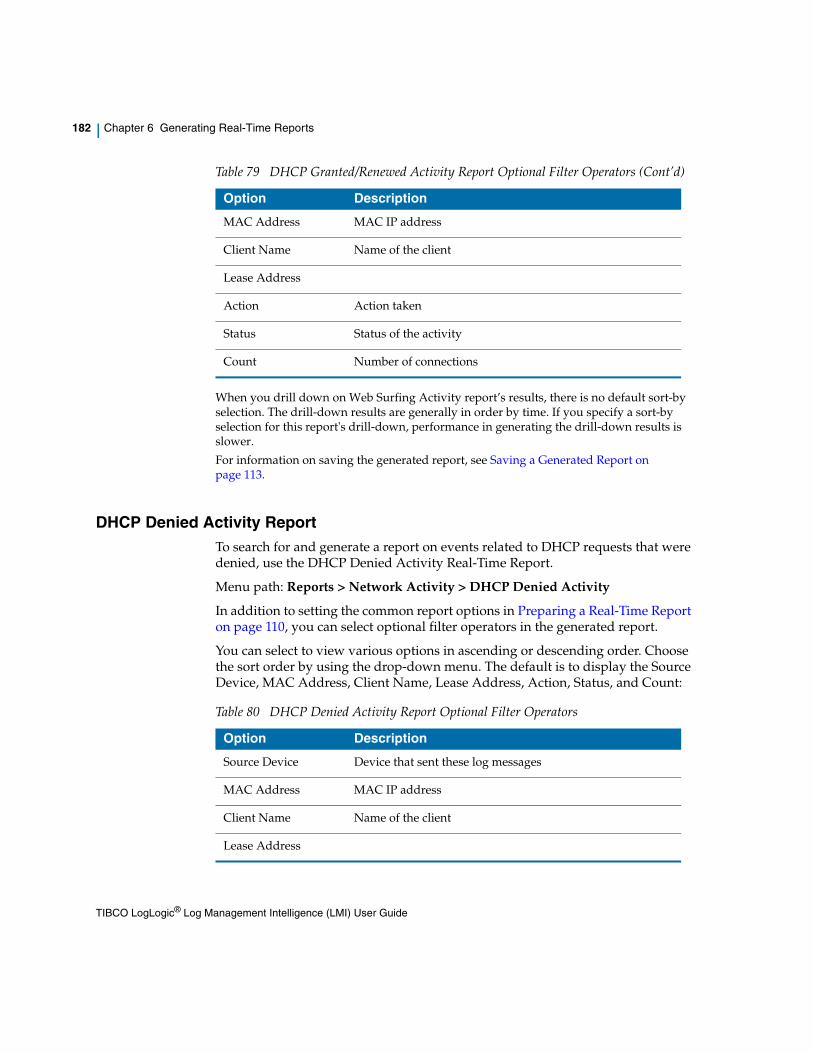
182 | Chapter 6 Generating Real-Time Reports
When you drill down on Web Surfing Activity report’s results, there is no default sort-by selection. The drill-down results are generally in order by time. If you specify a sort-by selection for this report's drill-down, performance in generating the drill-down results is slower.
For information on saving the generated report, see Saving a Generated Report on page 113.
DHCP Denied Activity ReportTo search for and generate a report on events related to DHCP requests that were denied, use the DHCP Denied Activity Real-Time Report.
Menu path: Reports > Network Activity > DHCP Denied Activity
In addition to setting the common report options in Preparing a Real-Time Report on page 110, you can select optional filter operators in the generated report.
You can select to view various options in ascending or descending order. Choose the sort order by using the drop-down menu. The default is to display the Source Device, MAC Address, Client Name, Lease Address, Action, Status, and Count:
MAC Address MAC IP address
Client Name Name of the client
Lease Address
Action Action taken
Status Status of the activity
Count Number of connections
Table 79 DHCP Granted/Renewed Activity Report Optional Filter Operators (Cont’d)
Option Description
Table 80 DHCP Denied Activity Report Optional Filter Operators
Option Description
Source Device Device that sent these log messages
MAC Address MAC IP address
Client Name Name of the client
Lease Address
TIBCO LogLogic® Log Management Intelligence (LMI) User Guide
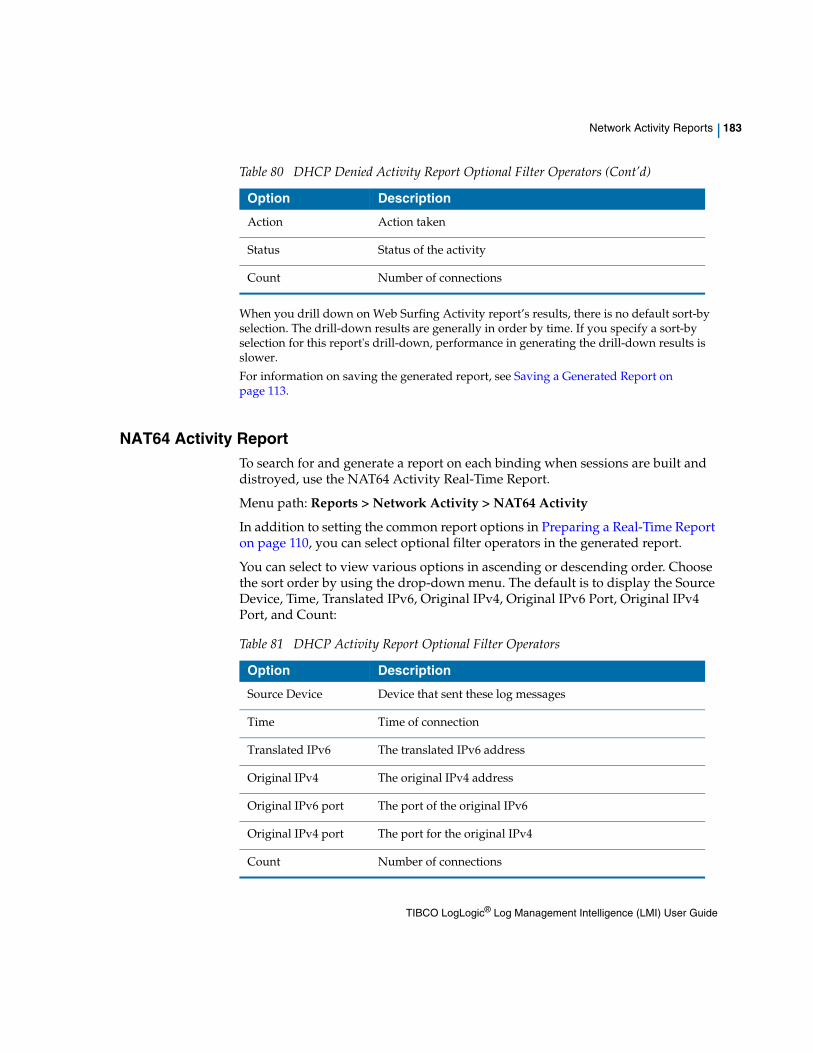
Network Activity Reports | 183
When you drill down on Web Surfing Activity report’s results, there is no default sort-by selection. The drill-down results are generally in order by time. If you specify a sort-by selection for this report's drill-down, performance in generating the drill-down results is slower.
For information on saving the generated report, see Saving a Generated Report on page 113.
NAT64 Activity ReportTo search for and generate a report on each binding when sessions are built and distroyed, use the NAT64 Activity Real-Time Report.
Menu path: Reports > Network Activity > NAT64 Activity
In addition to setting the common report options in Preparing a Real-Time Report on page 110, you can select optional filter operators in the generated report.
You can select to view various options in ascending or descending order. Choose the sort order by using the drop-down menu. The default is to display the Source Device, Time, Translated IPv6, Original IPv4, Original IPv6 Port, Original IPv4 Port, and Count:
Action Action taken
Status Status of the activity
Count Number of connections
Table 80 DHCP Denied Activity Report Optional Filter Operators (Cont’d)
Option Description
Table 81 DHCP Activity Report Optional Filter Operators
Option Description
Source Device Device that sent these log messages
Time Time of connection
Translated IPv6 The translated IPv6 address
Original IPv4 The original IPv4 address
Original IPv6 port The port of the original IPv6
Original IPv4 port The port for the original IPv4
Count Number of connections
TIBCO LogLogic® Log Management Intelligence (LMI) User Guide
184 | Chapter 6 Generating Real-Time Reports
When you drill down on Web Surfing Activity report’s results, there is no default sort-by selection. The drill-down results are generally in order by time. If you specify a sort-by selection for this report's drill-down, performance in generating the drill-down results is slower.
For information on saving the generated report, see Saving a Generated Report on page 113
TIBCO LogLogic® Log Management Intelligence (LMI) User Guide
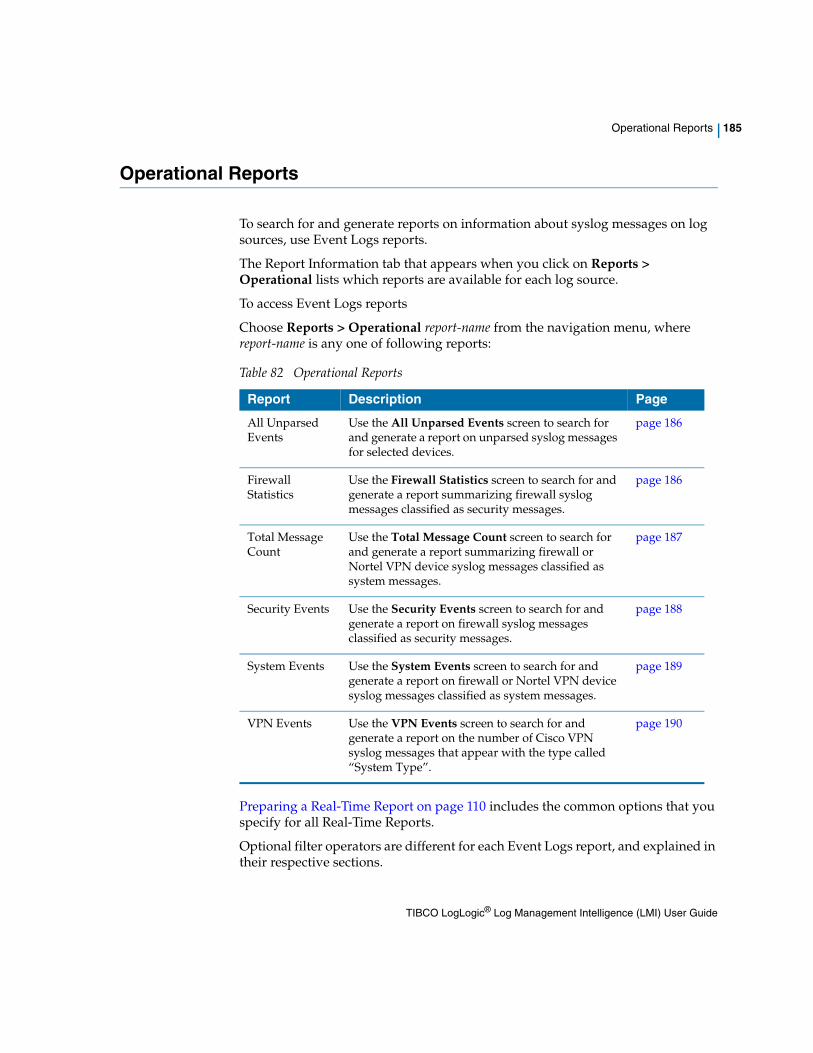
Operational Reports | 185
Operational Reports
To search for and generate reports on information about syslog messages on log sources, use Event Logs reports.
The Report Information tab that appears when you click on Reports > Operational lists which reports are available for each log source.
To access Event Logs reports
Choose Reports > Operational report-name from the navigation menu, where report-name is any one of following reports:
Preparing a Real-Time Report on page 110 includes the common options that you specify for all Real-Time Reports.
Optional filter operators are different for each Event Logs report, and explained in their respective sections.
Table 82 Operational Reports
Report Description Page
All Unparsed Events
Use the All Unparsed Events screen to search for and generate a report on unparsed syslog messages for selected devices.
page 186
Firewall Statistics
Use the Firewall Statistics screen to search for and generate a report summarizing firewall syslog messages classified as security messages.
page 186
Total Message Count
Use the Total Message Count screen to search for and generate a report summarizing firewall or Nortel VPN device syslog messages classified as system messages.
page 187
Security Events Use the Security Events screen to search for and generate a report on firewall syslog messages classified as security messages.
page 188
System Events Use the System Events screen to search for and generate a report on firewall or Nortel VPN device syslog messages classified as system messages.
page 189
VPN Events Use the VPN Events screen to search for and generate a report on the number of Cisco VPN syslog messages that appear with the type called “System Type”.
page 190
TIBCO LogLogic® Log Management Intelligence (LMI) User Guide
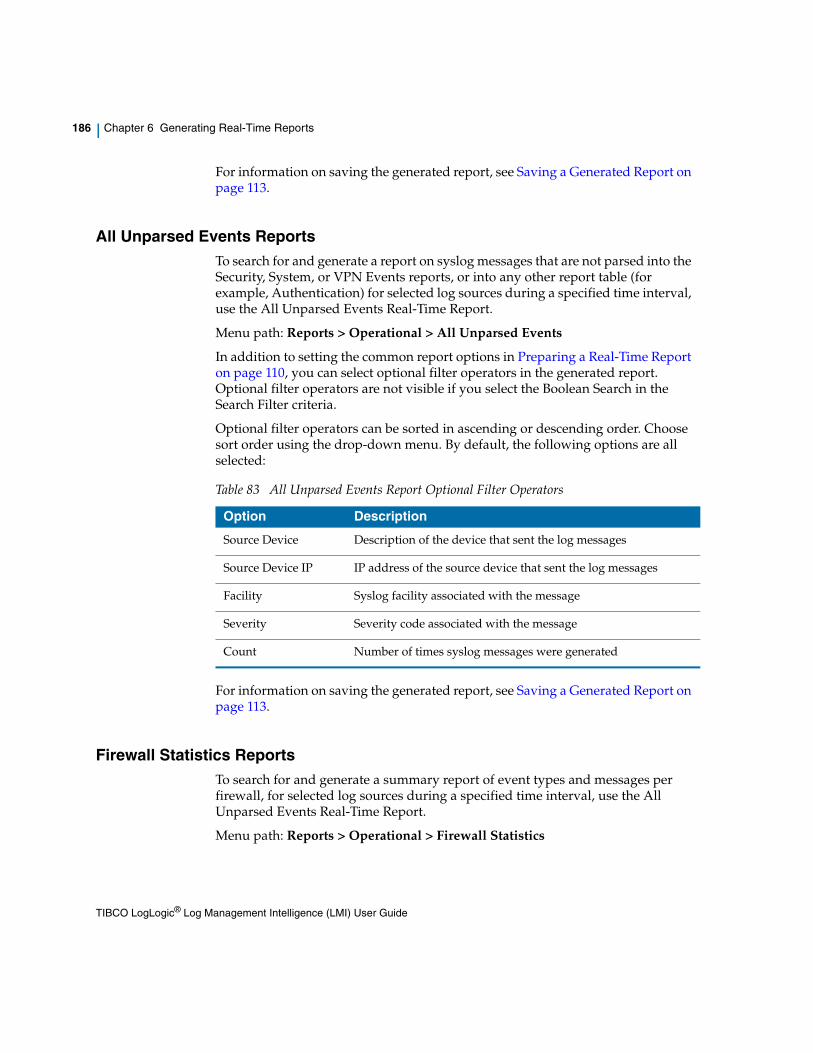
186 | Chapter 6 Generating Real-Time Reports
For information on saving the generated report, see Saving a Generated Report on page 113.
All Unparsed Events ReportsTo search for and generate a report on syslog messages that are not parsed into the Security, System, or VPN Events reports, or into any other report table (for example, Authentication) for selected log sources during a specified time interval, use the All Unparsed Events Real-Time Report.
Menu path: Reports > Operational > All Unparsed Events
In addition to setting the common report options in Preparing a Real-Time Report on page 110, you can select optional filter operators in the generated report. Optional filter operators are not visible if you select the Boolean Search in the Search Filter criteria.
Optional filter operators can be sorted in ascending or descending order. Choose sort order using the drop-down menu. By default, the following options are all selected:
For information on saving the generated report, see Saving a Generated Report on page 113.
Firewall Statistics ReportsTo search for and generate a summary report of event types and messages per firewall, for selected log sources during a specified time interval, use the All Unparsed Events Real-Time Report.
Menu path: Reports > Operational > Firewall Statistics
Table 83 All Unparsed Events Report Optional Filter Operators
Option Description
Source Device Description of the device that sent the log messages
Source Device IP IP address of the source device that sent the log messages
Facility Syslog facility associated with the message
Severity Severity code associated with the message
Count Number of times syslog messages were generated
TIBCO LogLogic® Log Management Intelligence (LMI) User Guide
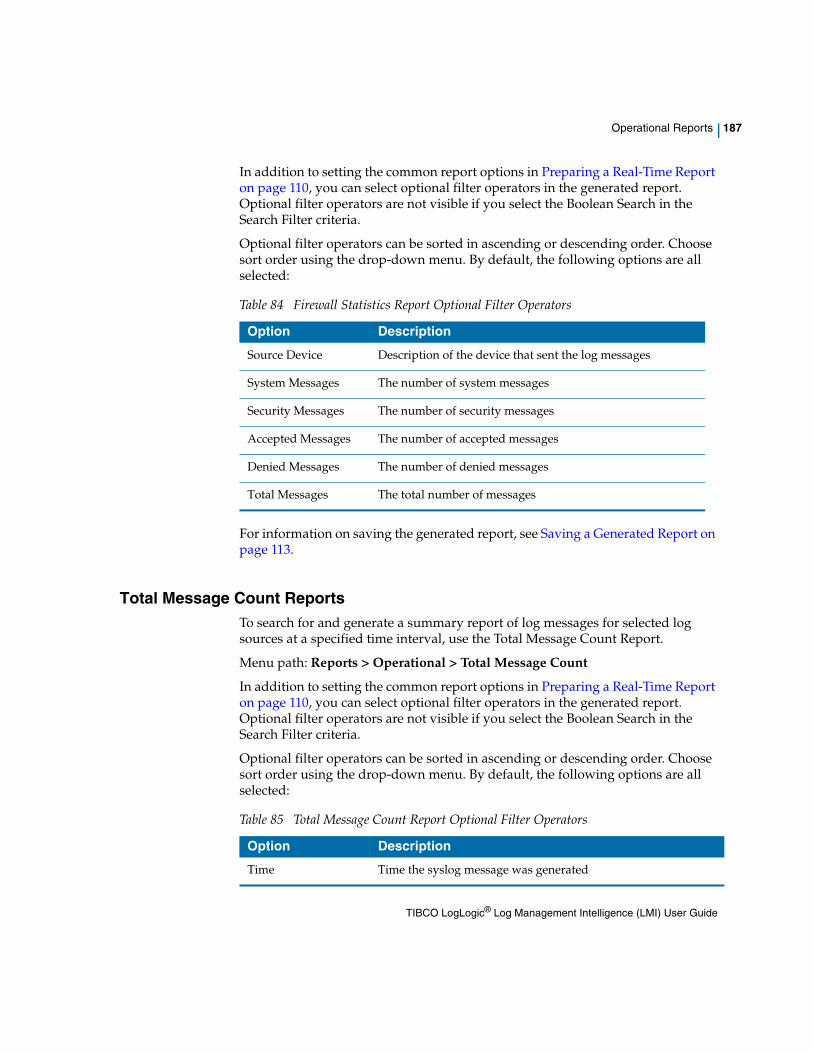
Operational Reports | 187
In addition to setting the common report options in Preparing a Real-Time Report on page 110, you can select optional filter operators in the generated report. Optional filter operators are not visible if you select the Boolean Search in the Search Filter criteria.
Optional filter operators can be sorted in ascending or descending order. Choose sort order using the drop-down menu. By default, the following options are all selected:
For information on saving the generated report, see Saving a Generated Report on page 113.
Total Message Count ReportsTo search for and generate a summary report of log messages for selected log sources at a specified time interval, use the Total Message Count Report.
Menu path: Reports > Operational > Total Message Count
In addition to setting the common report options in Preparing a Real-Time Report on page 110, you can select optional filter operators in the generated report. Optional filter operators are not visible if you select the Boolean Search in the Search Filter criteria.
Optional filter operators can be sorted in ascending or descending order. Choose sort order using the drop-down menu. By default, the following options are all selected:
Table 84 Firewall Statistics Report Optional Filter Operators
Option Description
Source Device Description of the device that sent the log messages
System Messages The number of system messages
Security Messages The number of security messages
Accepted Messages The number of accepted messages
Denied Messages The number of denied messages
Total Messages The total number of messages
Table 85 Total Message Count Report Optional Filter Operators
Option Description
Time Time the syslog message was generated
TIBCO LogLogic® Log Management Intelligence (LMI) User Guide
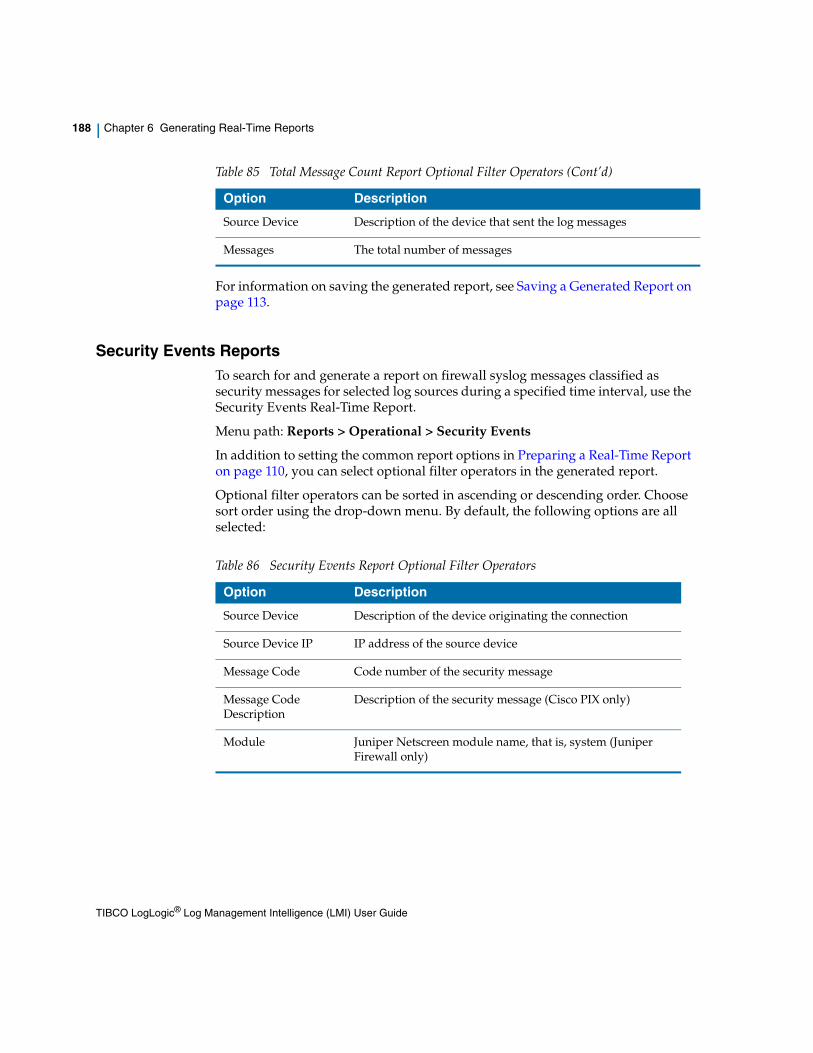
188 | Chapter 6 Generating Real-Time Reports
For information on saving the generated report, see Saving a Generated Report on page 113.
Security Events ReportsTo search for and generate a report on firewall syslog messages classified as security messages for selected log sources during a specified time interval, use the Security Events Real-Time Report.
Menu path: Reports > Operational > Security Events
In addition to setting the common report options in Preparing a Real-Time Report on page 110, you can select optional filter operators in the generated report.
Optional filter operators can be sorted in ascending or descending order. Choose sort order using the drop-down menu. By default, the following options are all selected:
Source Device Description of the device that sent the log messages
Messages The total number of messages
Table 85 Total Message Count Report Optional Filter Operators (Cont’d)
Option Description
Table 86 Security Events Report Optional Filter Operators
Option Description
Source Device Description of the device originating the connection
Source Device IP IP address of the source device
Message Code Code number of the security message
Message Code Description
Description of the security message (Cisco PIX only)
Module Juniper Netscreen module name, that is, system (Juniper Firewall only)
TIBCO LogLogic® Log Management Intelligence (LMI) User Guide
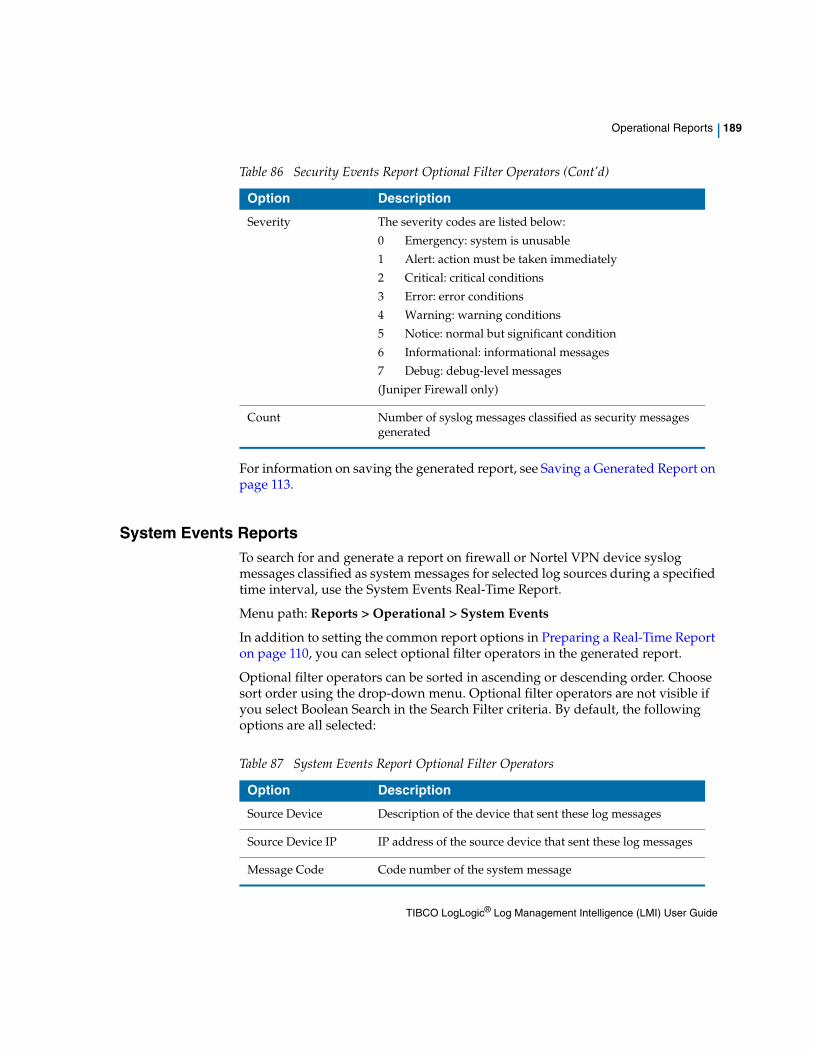
Operational Reports | 189
For information on saving the generated report, see Saving a Generated Report on page 113.
System Events ReportsTo search for and generate a report on firewall or Nortel VPN device syslog messages classified as system messages for selected log sources during a specified time interval, use the System Events Real-Time Report.
Menu path: Reports > Operational > System Events
In addition to setting the common report options in Preparing a Real-Time Report on page 110, you can select optional filter operators in the generated report.
Optional filter operators can be sorted in ascending or descending order. Choose sort order using the drop-down menu. Optional filter operators are not visible if you select Boolean Search in the Search Filter criteria. By default, the following options are all selected:
Severity The severity codes are listed below:
0 Emergency: system is unusable
1 Alert: action must be taken immediately
2 Critical: critical conditions
3 Error: error conditions
4 Warning: warning conditions
5 Notice: normal but significant condition
6 Informational: informational messages
7 Debug: debug-level messages
(Juniper Firewall only)
Count Number of syslog messages classified as security messages generated
Table 86 Security Events Report Optional Filter Operators (Cont’d)
Option Description
Table 87 System Events Report Optional Filter Operators
Option Description
Source Device Description of the device that sent these log messages
Source Device IP IP address of the source device that sent these log messages
Message Code Code number of the system message
TIBCO LogLogic® Log Management Intelligence (LMI) User Guide
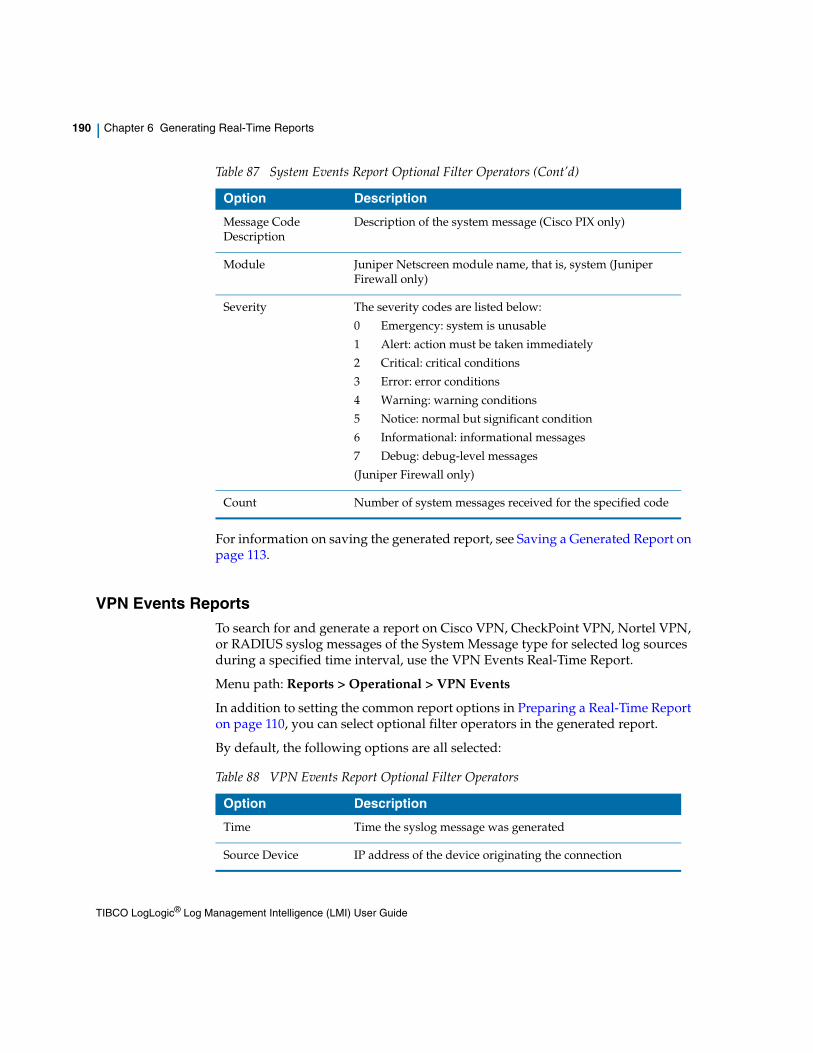
190 | Chapter 6 Generating Real-Time Reports
For information on saving the generated report, see Saving a Generated Report on page 113.
VPN Events ReportsTo search for and generate a report on Cisco VPN, CheckPoint VPN, Nortel VPN, or RADIUS syslog messages of the System Message type for selected log sources during a specified time interval, use the VPN Events Real-Time Report.
Menu path: Reports > Operational > VPN Events
In addition to setting the common report options in Preparing a Real-Time Report on page 110, you can select optional filter operators in the generated report.
By default, the following options are all selected:
Message Code Description
Description of the system message (Cisco PIX only)
Module Juniper Netscreen module name, that is, system (Juniper Firewall only)
Severity The severity codes are listed below:
0 Emergency: system is unusable
1 Alert: action must be taken immediately
2 Critical: critical conditions
3 Error: error conditions
4 Warning: warning conditions
5 Notice: normal but significant condition
6 Informational: informational messages
7 Debug: debug-level messages
(Juniper Firewall only)
Count Number of system messages received for the specified code
Table 87 System Events Report Optional Filter Operators (Cont’d)
Option Description
Table 88 VPN Events Report Optional Filter Operators
Option Description
Time Time the syslog message was generated
Source Device IP address of the device originating the connection
TIBCO LogLogic® Log Management Intelligence (LMI) User Guide
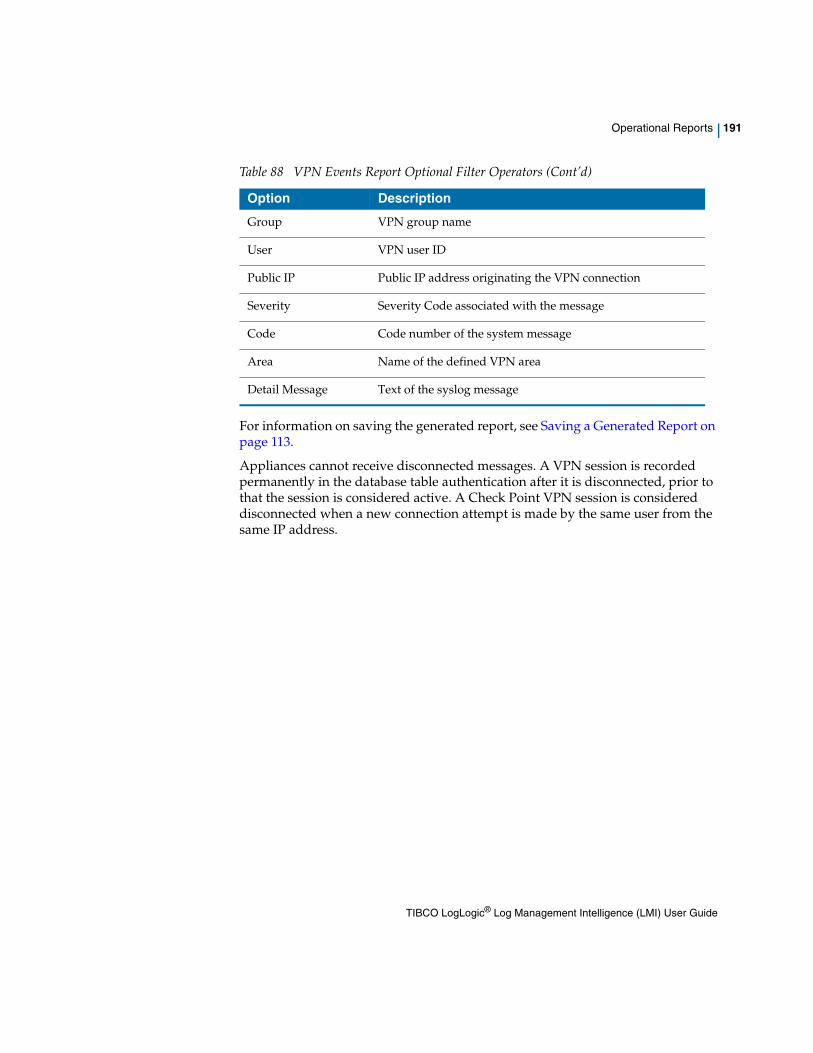
Operational Reports | 191
For information on saving the generated report, see Saving a Generated Report on page 113.
Appliances cannot receive disconnected messages. A VPN session is recorded permanently in the database table authentication after it is disconnected, prior to that the session is considered active. A Check Point VPN session is considered disconnected when a new connection attempt is made by the same user from the same IP address.
Group VPN group name
User VPN user ID
Public IP Public IP address originating the VPN connection
Severity Severity Code associated with the message
Code Code number of the system message
Area Name of the defined VPN area
Detail Message Text of the syslog message
Table 88 VPN Events Report Optional Filter Operators (Cont’d)
Option Description
TIBCO LogLogic® Log Management Intelligence (LMI) User Guide
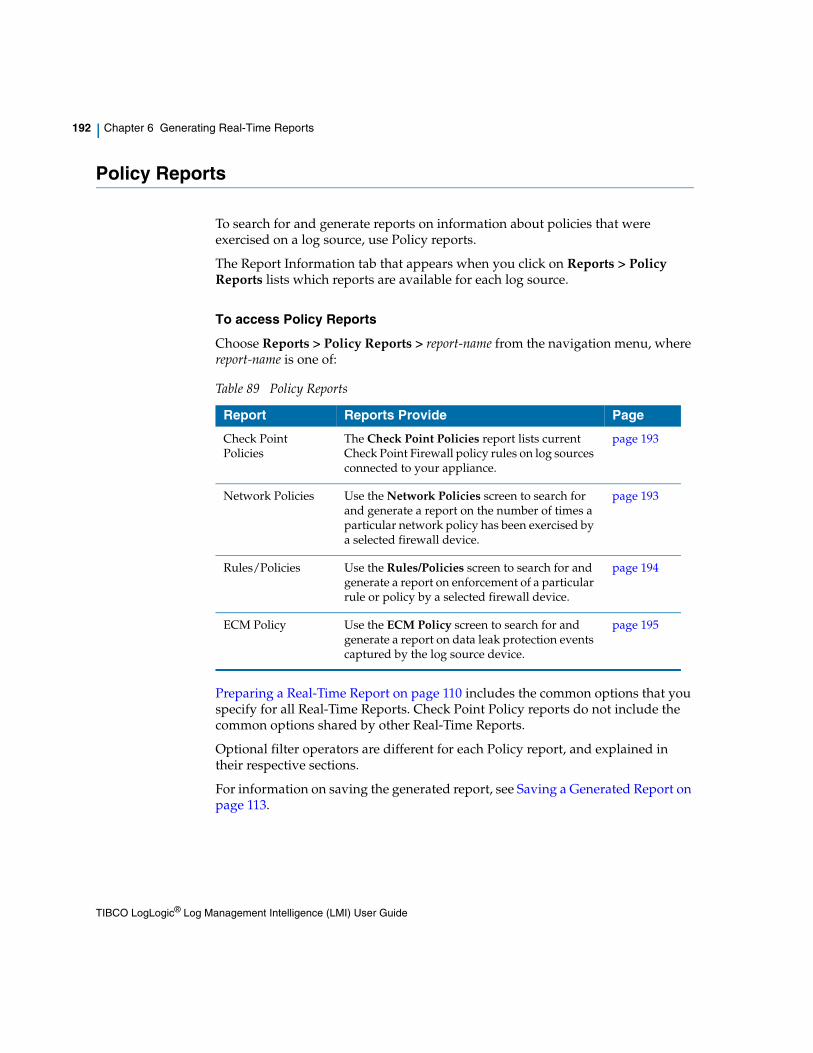
192 | Chapter 6 Generating Real-Time Reports
Policy Reports
To search for and generate reports on information about policies that were exercised on a log source, use Policy reports.
The Report Information tab that appears when you click on Reports > Policy Reports lists which reports are available for each log source.
To access Policy Reports
Choose Reports > Policy Reports > report-name from the navigation menu, where report-name is one of:
Preparing a Real-Time Report on page 110 includes the common options that you specify for all Real-Time Reports. Check Point Policy reports do not include the common options shared by other Real-Time Reports.
Optional filter operators are different for each Policy report, and explained in their respective sections.
For information on saving the generated report, see Saving a Generated Report on page 113.
Table 89 Policy Reports
Report Reports Provide Page
Check Point Policies
The Check Point Policies report lists current Check Point Firewall policy rules on log sources connected to your appliance.
page 193
Network Policies Use the Network Policies screen to search for and generate a report on the number of times a particular network policy has been exercised by a selected firewall device.
page 193
Rules/Policies Use the Rules/Policies screen to search for and generate a report on enforcement of a particular rule or policy by a selected firewall device.
page 194
ECM Policy Use the ECM Policy screen to search for and generate a report on data leak protection events captured by the log source device.
page 195
TIBCO LogLogic® Log Management Intelligence (LMI) User Guide
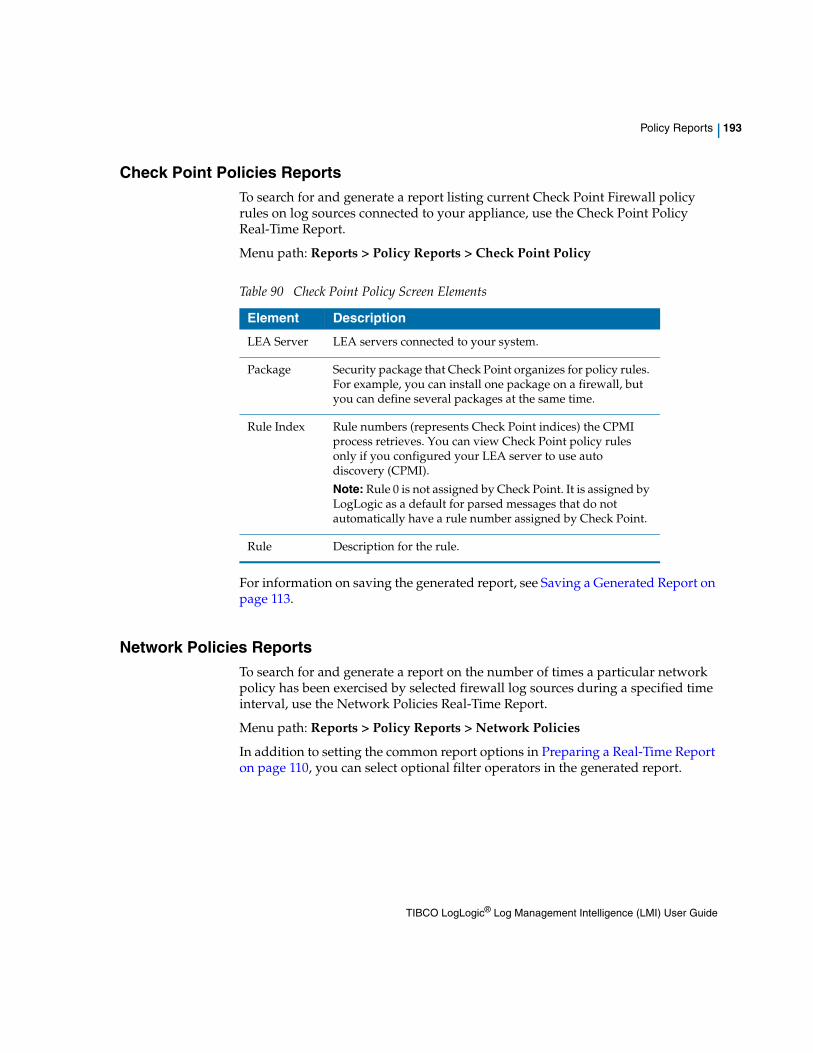
Policy Reports | 193
Check Point Policies ReportsTo search for and generate a report listing current Check Point Firewall policy rules on log sources connected to your appliance, use the Check Point Policy Real-Time Report.
Menu path: Reports > Policy Reports > Check Point Policy
For information on saving the generated report, see Saving a Generated Report on page 113.
Network Policies ReportsTo search for and generate a report on the number of times a particular network policy has been exercised by selected firewall log sources during a specified time interval, use the Network Policies Real-Time Report.
Menu path: Reports > Policy Reports > Network Policies
In addition to setting the common report options in Preparing a Real-Time Report on page 110, you can select optional filter operators in the generated report.
Table 90 Check Point Policy Screen Elements
Element Description
LEA Server LEA servers connected to your system.
Package Security package that Check Point organizes for policy rules. For example, you can install one package on a firewall, but you can define several packages at the same time.
Rule Index Rule numbers (represents Check Point indices) the CPMI process retrieves. You can view Check Point policy rules only if you configured your LEA server to use auto discovery (CPMI).
Note: Rule 0 is not assigned by Check Point. It is assigned by LogLogic as a default for parsed messages that do not automatically have a rule number assigned by Check Point.
Rule Description for the rule.
TIBCO LogLogic® Log Management Intelligence (LMI) User Guide
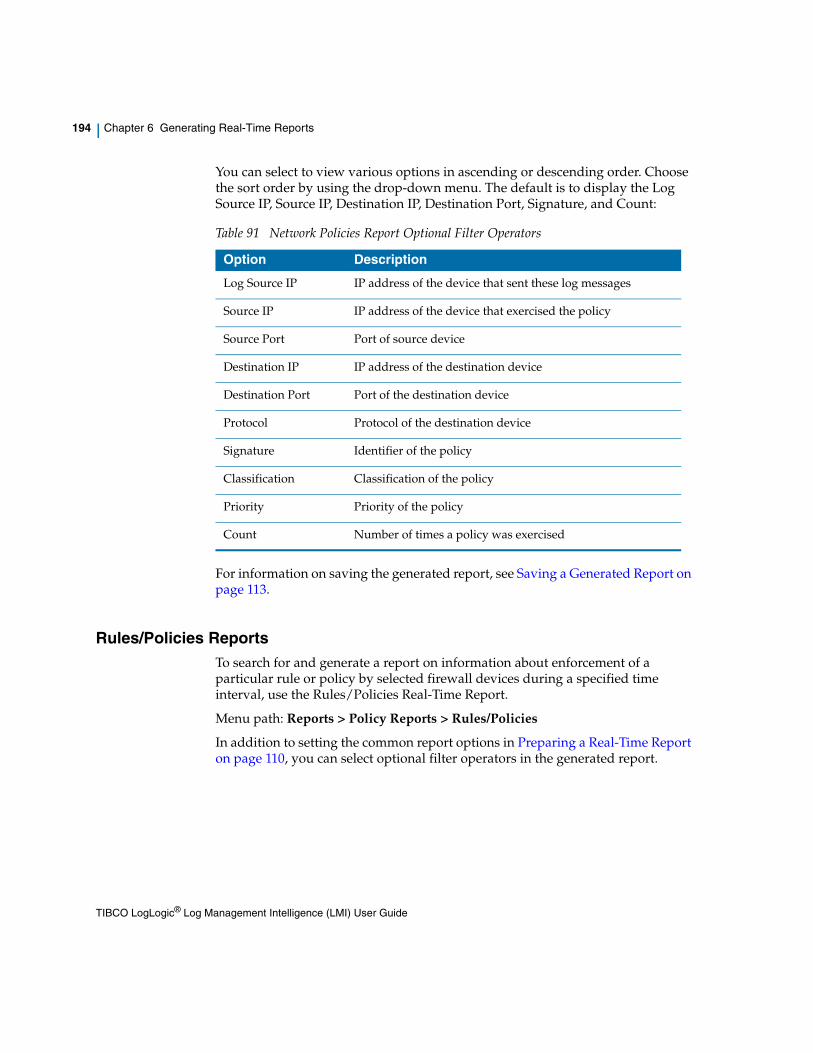
194 | Chapter 6 Generating Real-Time Reports
You can select to view various options in ascending or descending order. Choose the sort order by using the drop-down menu. The default is to display the Log Source IP, Source IP, Destination IP, Destination Port, Signature, and Count:
For information on saving the generated report, see Saving a Generated Report on page 113.
Rules/Policies ReportsTo search for and generate a report on information about enforcement of a particular rule or policy by selected firewall devices during a specified time interval, use the Rules/Policies Real-Time Report.
Menu path: Reports > Policy Reports > Rules/Policies
In addition to setting the common report options in Preparing a Real-Time Report on page 110, you can select optional filter operators in the generated report.
Table 91 Network Policies Report Optional Filter Operators
Option Description
Log Source IP IP address of the device that sent these log messages
Source IP IP address of the device that exercised the policy
Source Port Port of source device
Destination IP IP address of the destination device
Destination Port Port of the destination device
Protocol Protocol of the destination device
Signature Identifier of the policy
Classification Classification of the policy
Priority Priority of the policy
Count Number of times a policy was exercised
TIBCO LogLogic® Log Management Intelligence (LMI) User Guide
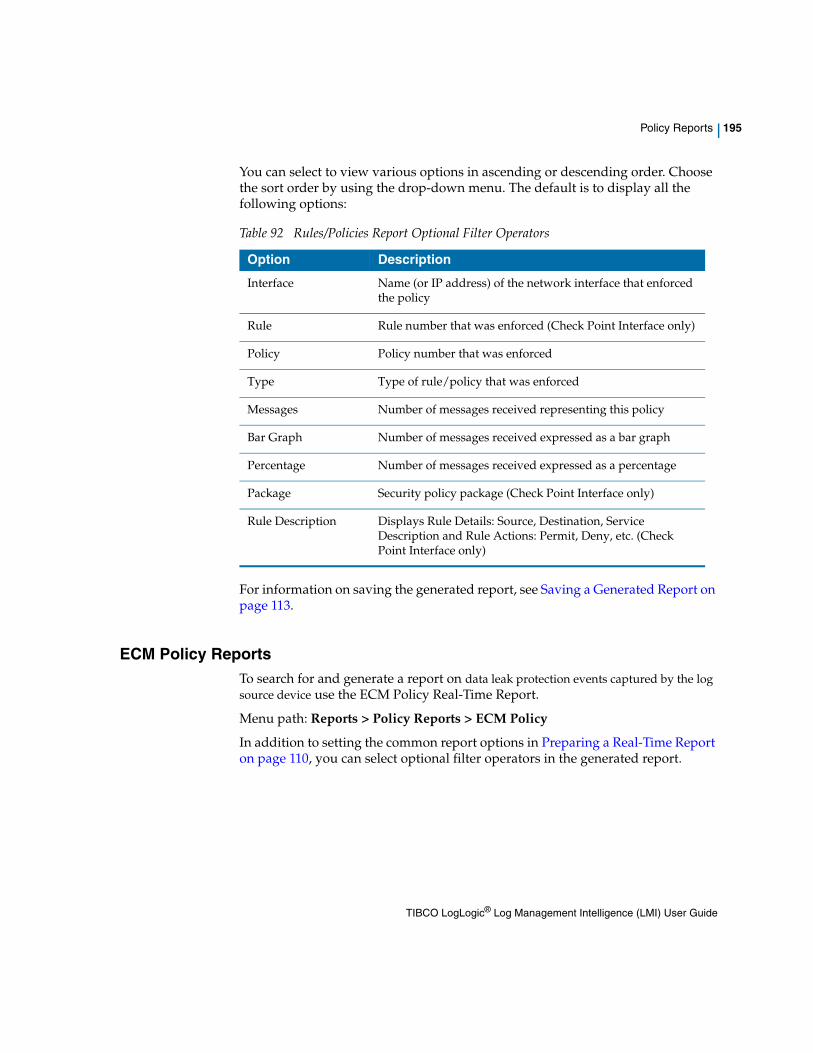
Policy Reports | 195
You can select to view various options in ascending or descending order. Choose the sort order by using the drop-down menu. The default is to display all the following options:
For information on saving the generated report, see Saving a Generated Report on page 113.
ECM Policy ReportsTo search for and generate a report on data leak protection events captured by the log source device use the ECM Policy Real-Time Report.
Menu path: Reports > Policy Reports > ECM Policy
In addition to setting the common report options in Preparing a Real-Time Report on page 110, you can select optional filter operators in the generated report.
Table 92 Rules/Policies Report Optional Filter Operators
Option Description
Interface Name (or IP address) of the network interface that enforced the policy
Rule Rule number that was enforced (Check Point Interface only)
Policy Policy number that was enforced
Type Type of rule/policy that was enforced
Messages Number of messages received representing this policy
Bar Graph Number of messages received expressed as a bar graph
Percentage Number of messages received expressed as a percentage
Package Security policy package (Check Point Interface only)
Rule Description Displays Rule Details: Source, Destination, Service Description and Rule Actions: Permit, Deny, etc. (Check Point Interface only)
TIBCO LogLogic® Log Management Intelligence (LMI) User Guide
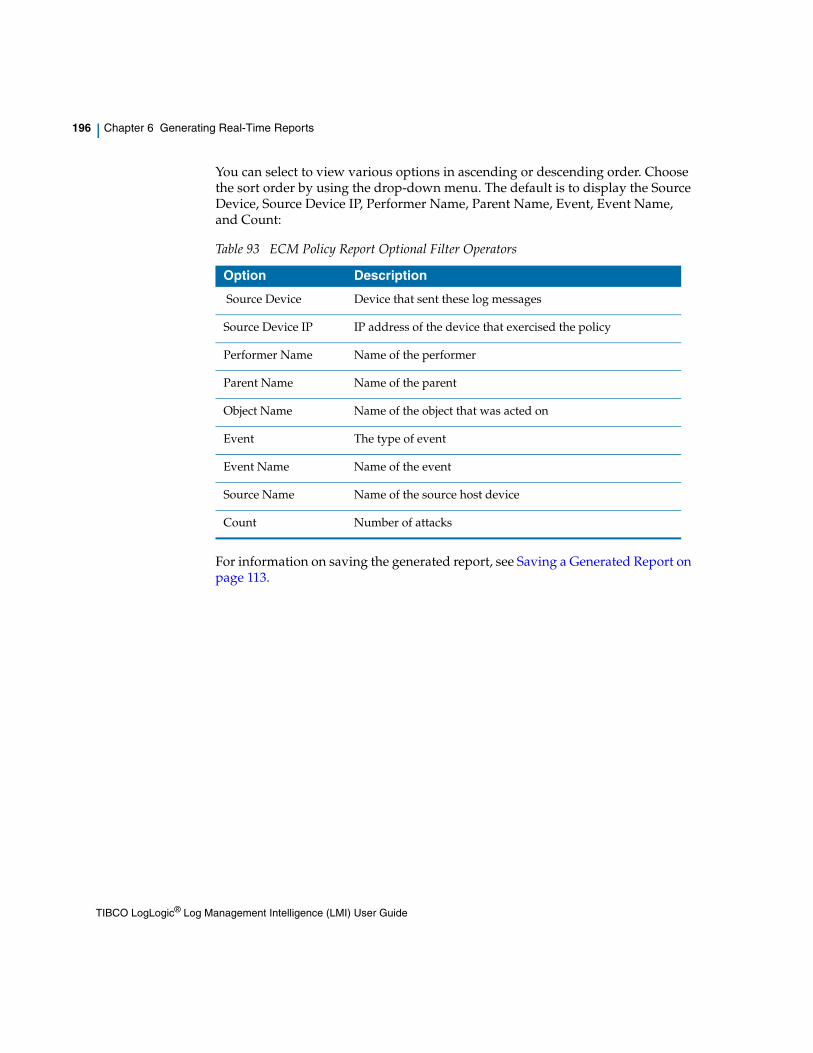
196 | Chapter 6 Generating Real-Time Reports
You can select to view various options in ascending or descending order. Choose the sort order by using the drop-down menu. The default is to display the Source Device, Source Device IP, Performer Name, Parent Name, Event, Event Name, and Count:
For information on saving the generated report, see Saving a Generated Report on page 113.
Table 93 ECM Policy Report Optional Filter Operators
Option Description
Source Device Device that sent these log messages
Source Device IP IP address of the device that exercised the policy
Performer Name Name of the performer
Parent Name Name of the parent
Object Name Name of the object that was acted on
Event The type of event
Event Name Name of the event
Source Name Name of the source host device
Count Number of attacks
TIBCO LogLogic® Log Management Intelligence (LMI) User Guide
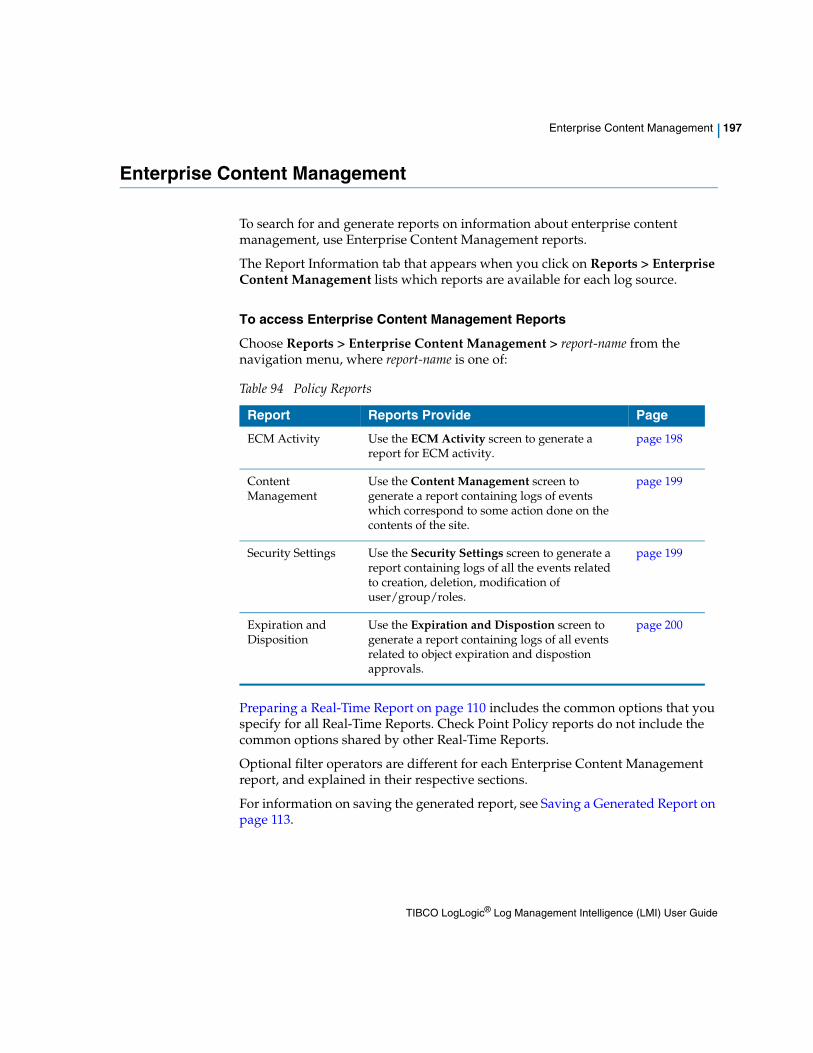
Enterprise Content Management | 197
Enterprise Content Management
To search for and generate reports on information about enterprise content management, use Enterprise Content Management reports.
The Report Information tab that appears when you click on Reports > Enterprise Content Management lists which reports are available for each log source.
To access Enterprise Content Management Reports
Choose Reports > Enterprise Content Management > report-name from the navigation menu, where report-name is one of:
Preparing a Real-Time Report on page 110 includes the common options that you specify for all Real-Time Reports. Check Point Policy reports do not include the common options shared by other Real-Time Reports.
Optional filter operators are different for each Enterprise Content Management report, and explained in their respective sections.
For information on saving the generated report, see Saving a Generated Report on page 113.
Table 94 Policy Reports
Report Reports Provide Page
ECM Activity Use the ECM Activity screen to generate a report for ECM activity.
page 198
Content Management
Use the Content Management screen to generate a report containing logs of events which correspond to some action done on the contents of the site.
page 199
Security Settings Use the Security Settings screen to generate a report containing logs of all the events related to creation, deletion, modification of user/group/roles.
page 199
Expiration and Disposition
Use the Expiration and Dispostion screen to generate a report containing logs of all events related to object expiration and dispostion approvals.
page 200
TIBCO LogLogic® Log Management Intelligence (LMI) User Guide
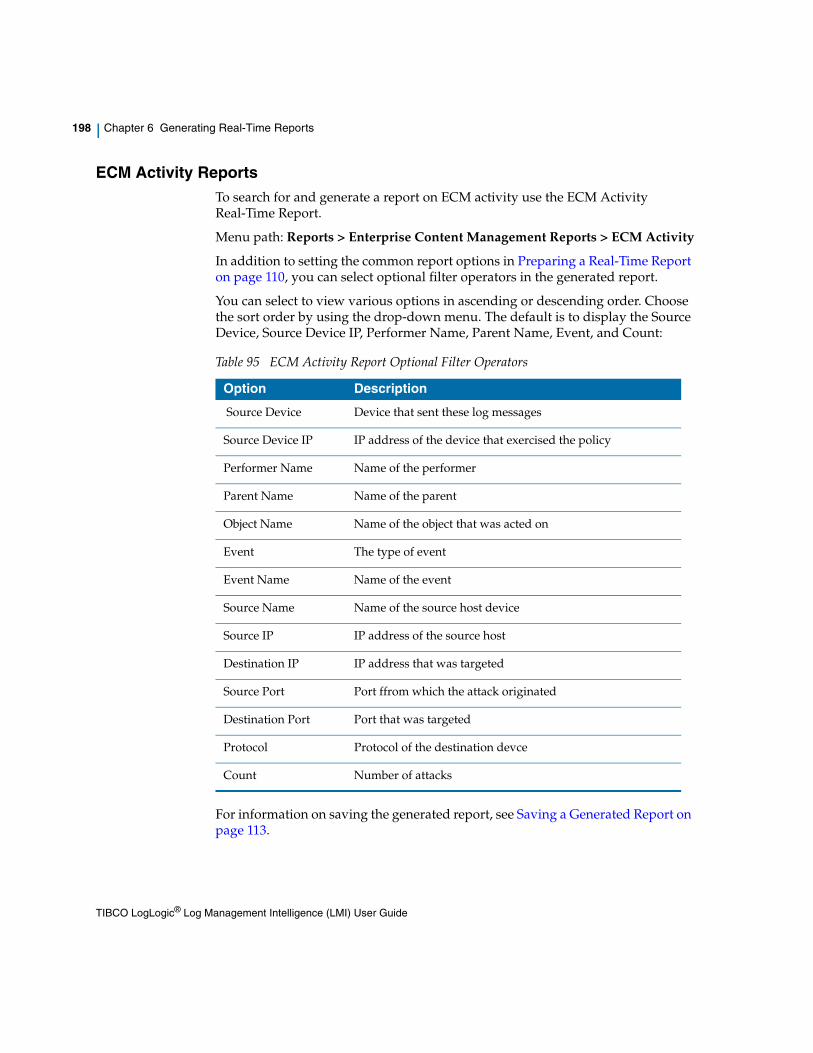
198 | Chapter 6 Generating Real-Time Reports
ECM Activity ReportsTo search for and generate a report on ECM activity use the ECM Activity Real-Time Report.
Menu path: Reports > Enterprise Content Management Reports > ECM Activity
In addition to setting the common report options in Preparing a Real-Time Report on page 110, you can select optional filter operators in the generated report.
You can select to view various options in ascending or descending order. Choose the sort order by using the drop-down menu. The default is to display the Source Device, Source Device IP, Performer Name, Parent Name, Event, and Count:
For information on saving the generated report, see Saving a Generated Report on page 113.
Table 95 ECM Activity Report Optional Filter Operators
Option Description
Source Device Device that sent these log messages
Source Device IP IP address of the device that exercised the policy
Performer Name Name of the performer
Parent Name Name of the parent
Object Name Name of the object that was acted on
Event The type of event
Event Name Name of the event
Source Name Name of the source host device
Source IP IP address of the source host
Destination IP IP address that was targeted
Source Port Port ffrom which the attack originated
Destination Port Port that was targeted
Protocol Protocol of the destination devce
Count Number of attacks
TIBCO LogLogic® Log Management Intelligence (LMI) User Guide
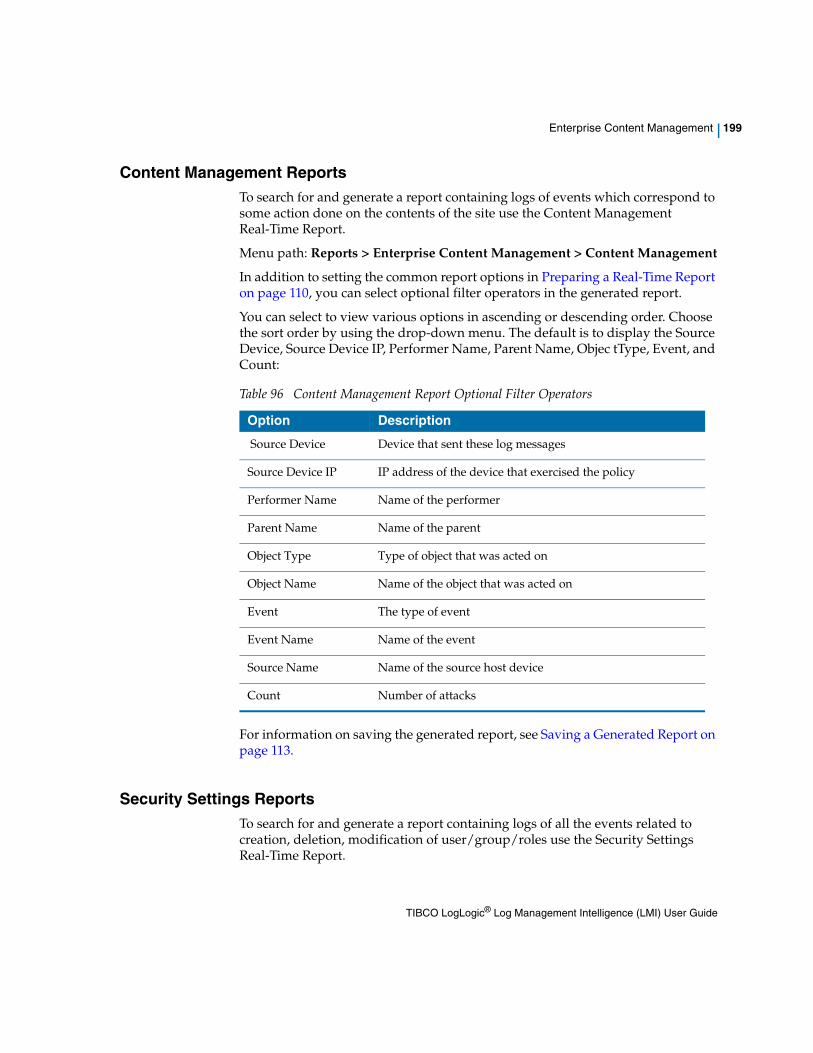
Enterprise Content Management | 199
Content Management ReportsTo search for and generate a report containing logs of events which correspond to some action done on the contents of the site use the Content Management Real-Time Report.
Menu path: Reports > Enterprise Content Management > Content Management
In addition to setting the common report options in Preparing a Real-Time Report on page 110, you can select optional filter operators in the generated report.
You can select to view various options in ascending or descending order. Choose the sort order by using the drop-down menu. The default is to display the Source Device, Source Device IP, Performer Name, Parent Name, Objec tType, Event, and Count:
For information on saving the generated report, see Saving a Generated Report on page 113.
Security Settings ReportsTo search for and generate a report containing logs of all the events related to creation, deletion, modification of user/group/roles use the Security Settings Real-Time Report.
Table 96 Content Management Report Optional Filter Operators
Option Description
Source Device Device that sent these log messages
Source Device IP IP address of the device that exercised the policy
Performer Name Name of the performer
Parent Name Name of the parent
Object Type Type of object that was acted on
Object Name Name of the object that was acted on
Event The type of event
Event Name Name of the event
Source Name Name of the source host device
Count Number of attacks
TIBCO LogLogic® Log Management Intelligence (LMI) User Guide
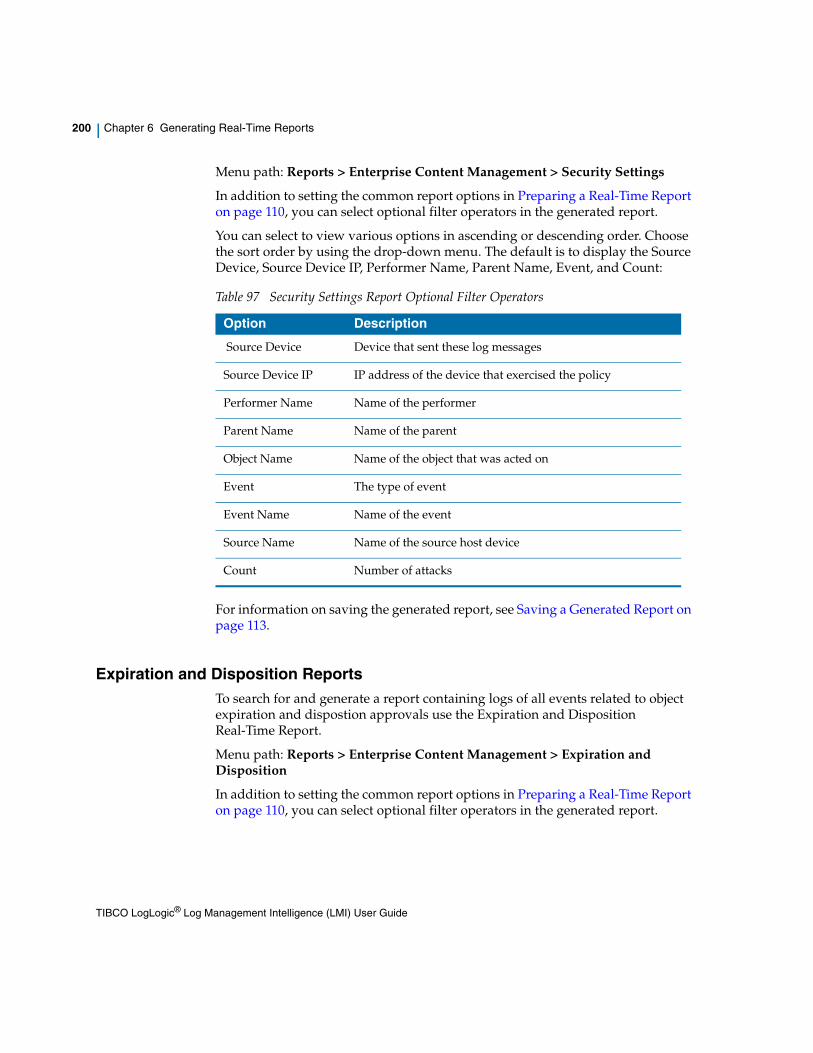
200 | Chapter 6 Generating Real-Time Reports
Menu path: Reports > Enterprise Content Management > Security Settings
In addition to setting the common report options in Preparing a Real-Time Report on page 110, you can select optional filter operators in the generated report.
You can select to view various options in ascending or descending order. Choose the sort order by using the drop-down menu. The default is to display the Source Device, Source Device IP, Performer Name, Parent Name, Event, and Count:
For information on saving the generated report, see Saving a Generated Report on page 113.
Expiration and Disposition ReportsTo search for and generate a report containing logs of all events related to object expiration and dispostion approvals use the Expiration and Disposition Real-Time Report.
Menu path: Reports > Enterprise Content Management > Expiration and Disposition
In addition to setting the common report options in Preparing a Real-Time Report on page 110, you can select optional filter operators in the generated report.
Table 97 Security Settings Report Optional Filter Operators
Option Description
Source Device Device that sent these log messages
Source Device IP IP address of the device that exercised the policy
Performer Name Name of the performer
Parent Name Name of the parent
Object Name Name of the object that was acted on
Event The type of event
Event Name Name of the event
Source Name Name of the source host device
Count Number of attacks
TIBCO LogLogic® Log Management Intelligence (LMI) User Guide
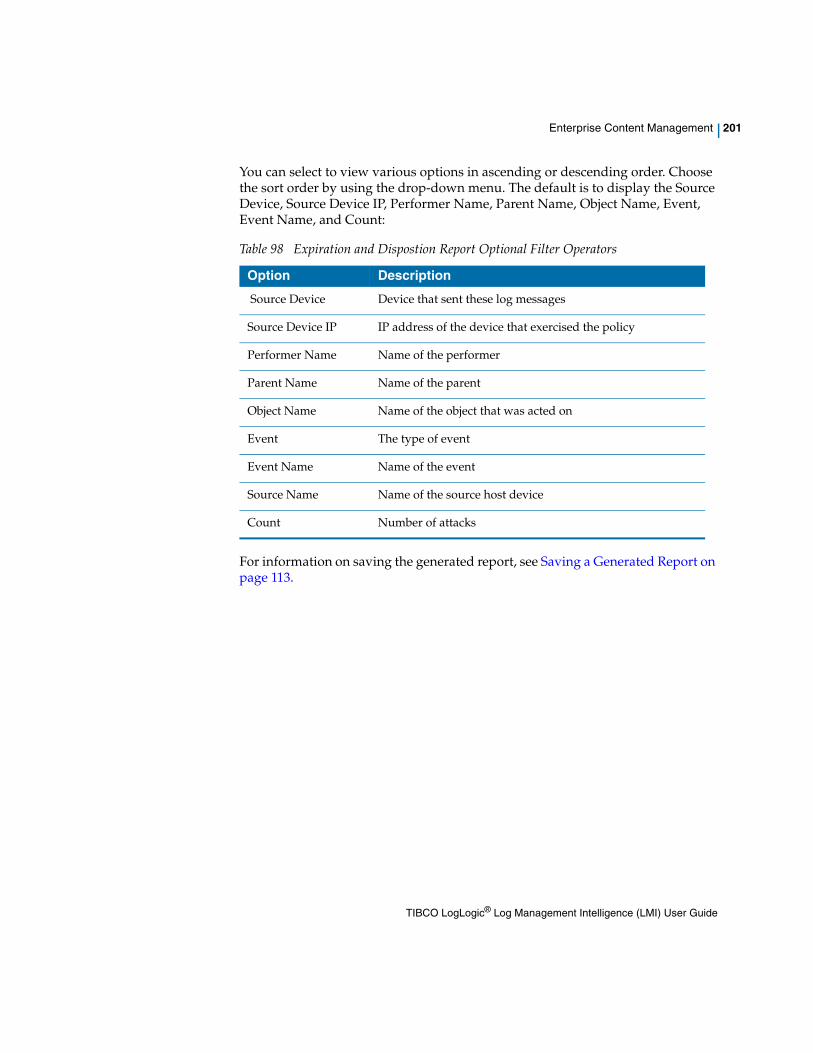
Enterprise Content Management | 201
You can select to view various options in ascending or descending order. Choose the sort order by using the drop-down menu. The default is to display the Source Device, Source Device IP, Performer Name, Parent Name, Object Name, Event, Event Name, and Count:
For information on saving the generated report, see Saving a Generated Report on page 113.
Table 98 Expiration and Dispostion Report Optional Filter Operators
Option Description
Source Device Device that sent these log messages
Source Device IP IP address of the device that exercised the policy
Performer Name Name of the performer
Parent Name Name of the parent
Object Name Name of the object that was acted on
Event The type of event
Event Name Name of the event
Source Name Name of the source host device
Count Number of attacks
TIBCO LogLogic® Log Management Intelligence (LMI) User Guide
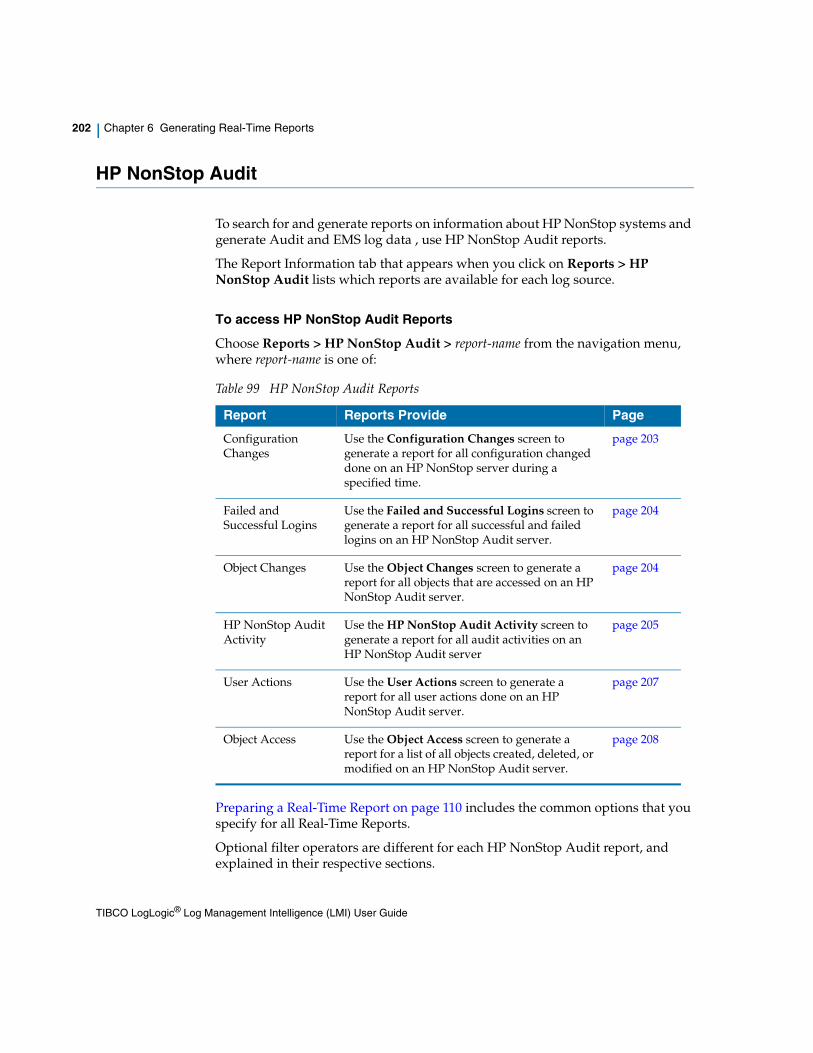
202 | Chapter 6 Generating Real-Time Reports
HP NonStop Audit
To search for and generate reports on information about HP NonStop systems and generate Audit and EMS log data , use HP NonStop Audit reports.
The Report Information tab that appears when you click on Reports > HP NonStop Audit lists which reports are available for each log source.
To access HP NonStop Audit Reports
Choose Reports > HP NonStop Audit > report-name from the navigation menu, where report-name is one of:
Preparing a Real-Time Report on page 110 includes the common options that you specify for all Real-Time Reports.
Optional filter operators are different for each HP NonStop Audit report, and explained in their respective sections.
Table 99 HP NonStop Audit Reports
Report Reports Provide Page
Configuration Changes
Use the Configuration Changes screen to generate a report for all configuration changed done on an HP NonStop server during a specified time.
page 203
Failed and Successful Logins
Use the Failed and Successful Logins screen to generate a report for all successful and failed logins on an HP NonStop Audit server.
page 204
Object Changes Use the Object Changes screen to generate a report for all objects that are accessed on an HP NonStop Audit server.
page 204
HP NonStop Audit Activity
Use the HP NonStop Audit Activity screen to generate a report for all audit activities on an HP NonStop Audit server
page 205
User Actions Use the User Actions screen to generate a report for all user actions done on an HP NonStop Audit server.
page 207
Object Access Use the Object Access screen to generate a report for a list of all objects created, deleted, or modified on an HP NonStop Audit server.
page 208
TIBCO LogLogic® Log Management Intelligence (LMI) User Guide
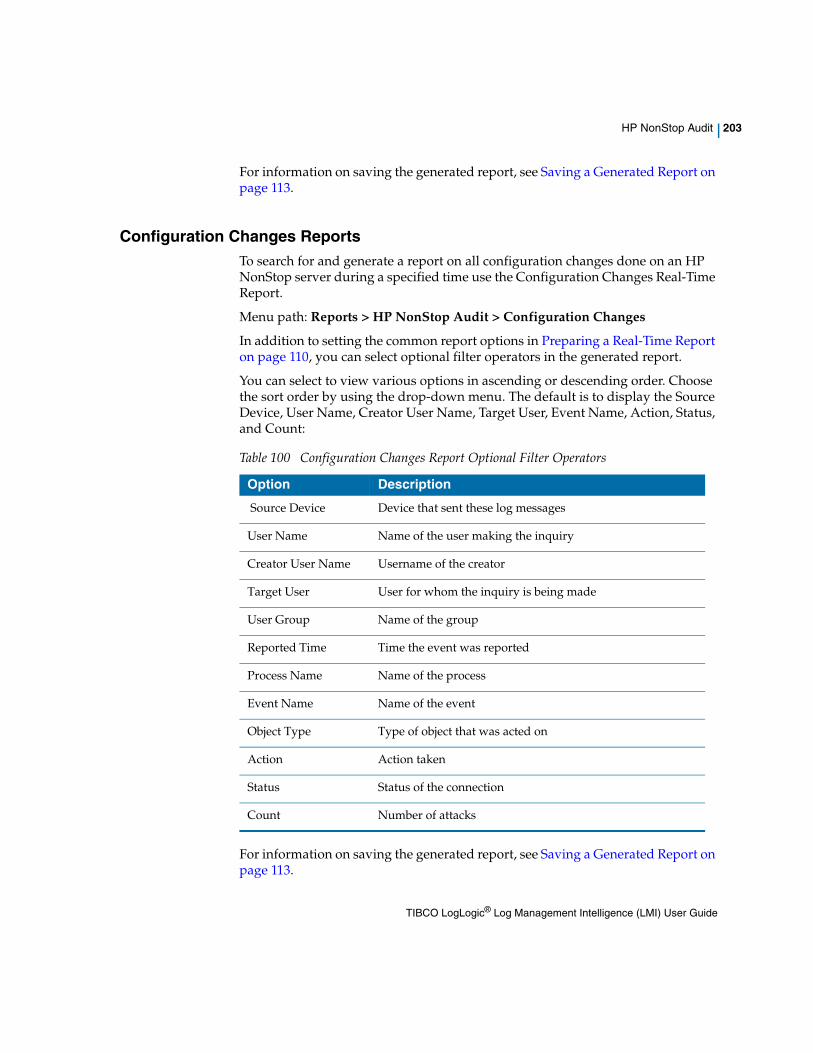
HP NonStop Audit | 203
For information on saving the generated report, see Saving a Generated Report on page 113.
Configuration Changes ReportsTo search for and generate a report on all configuration changes done on an HP NonStop server during a specified time use the Configuration Changes Real-Time Report.
Menu path: Reports > HP NonStop Audit > Configuration Changes
In addition to setting the common report options in Preparing a Real-Time Report on page 110, you can select optional filter operators in the generated report.
You can select to view various options in ascending or descending order. Choose the sort order by using the drop-down menu. The default is to display the Source Device, User Name, Creator User Name, Target User, Event Name, Action, Status, and Count:
For information on saving the generated report, see Saving a Generated Report on page 113.
Table 100 Configuration Changes Report Optional Filter Operators
Option Description
Source Device Device that sent these log messages
User Name Name of the user making the inquiry
Creator User Name Username of the creator
Target User User for whom the inquiry is being made
User Group Name of the group
Reported Time Time the event was reported
Process Name Name of the process
Event Name Name of the event
Object Type Type of object that was acted on
Action Action taken
Status Status of the connection
Count Number of attacks
TIBCO LogLogic® Log Management Intelligence (LMI) User Guide

204 | Chapter 6 Generating Real-Time Reports
Failed and Successful Logins ReportsTo search for and generate a report for all successful and failed logins on an HP NonStop Audit server use the Failed and Successful Logins Real-Time Report.
Menu path: Reports > HP NonStop Audit > Failed and Successful Logins
In addition to setting the common report options in Preparing a Real-Time Report on page 110, you can select optional filter operators in the generated report.
You can select to view various options in ascending or descending order. Choose the sort order by using the drop-down menu. The default is to display the Source Device, User Name, Creator User Name, Target User, Event Name, Action, Status, and Count:
For information on saving the generated report, see Saving a Generated Report on page 113.
Table 101 Failed and Successful Logins Report Optional Filter Operators
Option Description
Source Device Device that sent these log messages
User Name Name of the user making the inquiry
Creator User Name Username of the creator
Target User User for whom the inquiry is being made
User Group Name of the group
Reported Time Time the event was reported
Process Name Name of the process
Event Name Name of the event
Object Type Type of object that was acted on
Action Action taken
Status Status of the connection
Count Number of attacks
TIBCO LogLogic® Log Management Intelligence (LMI) User Guide
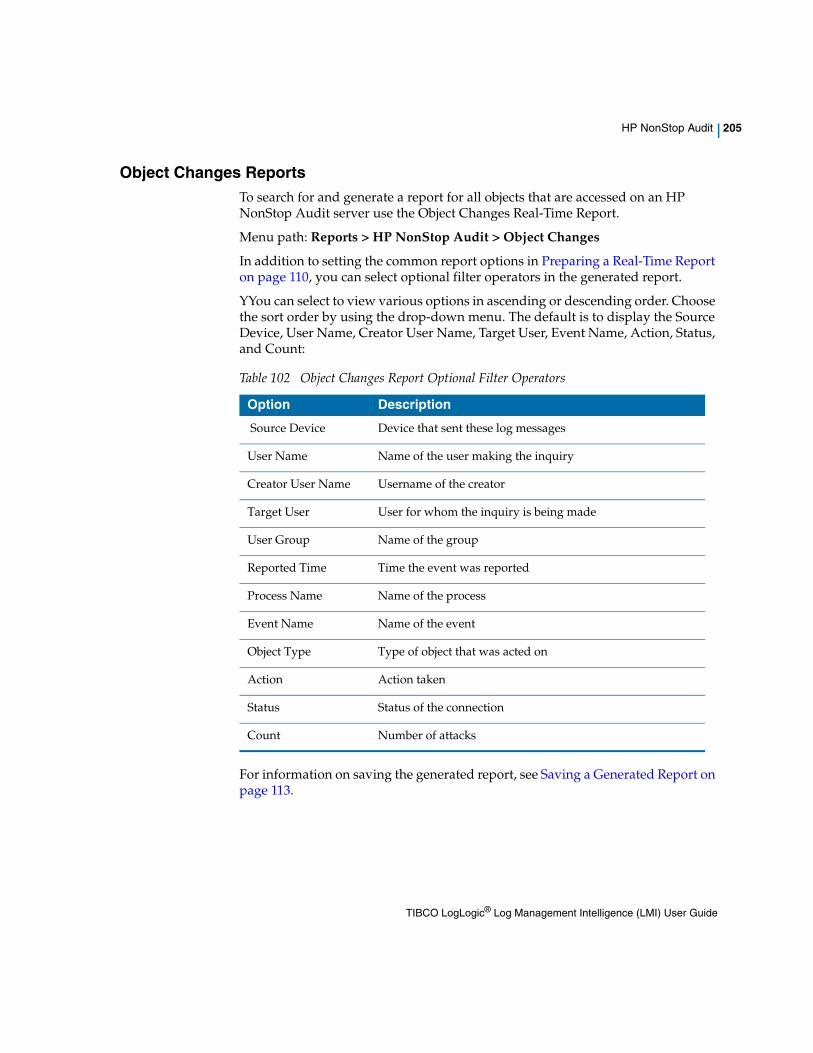
HP NonStop Audit | 205
Object Changes ReportsTo search for and generate a report for all objects that are accessed on an HP NonStop Audit server use the Object Changes Real-Time Report.
Menu path: Reports > HP NonStop Audit > Object Changes
In addition to setting the common report options in Preparing a Real-Time Report on page 110, you can select optional filter operators in the generated report.
YYou can select to view various options in ascending or descending order. Choose the sort order by using the drop-down menu. The default is to display the Source Device, User Name, Creator User Name, Target User, Event Name, Action, Status, and Count:
For information on saving the generated report, see Saving a Generated Report on page 113.
Table 102 Object Changes Report Optional Filter Operators
Option Description
Source Device Device that sent these log messages
User Name Name of the user making the inquiry
Creator User Name Username of the creator
Target User User for whom the inquiry is being made
User Group Name of the group
Reported Time Time the event was reported
Process Name Name of the process
Event Name Name of the event
Object Type Type of object that was acted on
Action Action taken
Status Status of the connection
Count Number of attacks
TIBCO LogLogic® Log Management Intelligence (LMI) User Guide
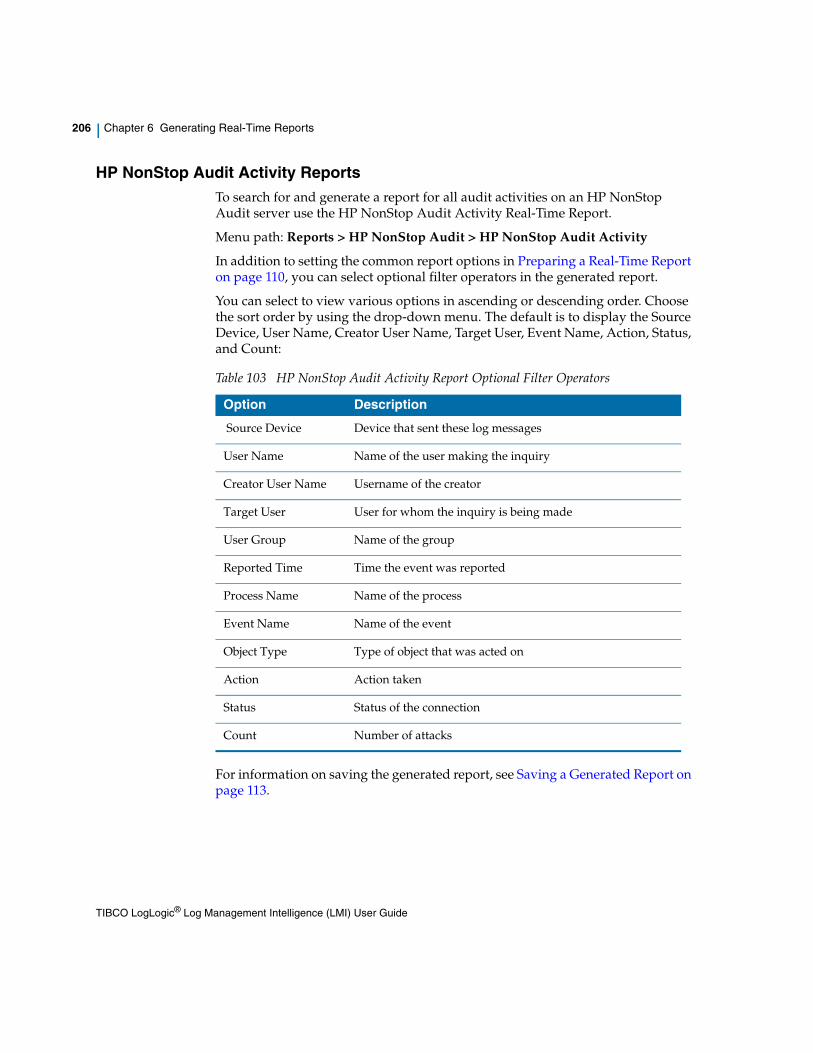
206 | Chapter 6 Generating Real-Time Reports
HP NonStop Audit Activity ReportsTo search for and generate a report for all audit activities on an HP NonStop Audit server use the HP NonStop Audit Activity Real-Time Report.
Menu path: Reports > HP NonStop Audit > HP NonStop Audit Activity
In addition to setting the common report options in Preparing a Real-Time Report on page 110, you can select optional filter operators in the generated report.
You can select to view various options in ascending or descending order. Choose the sort order by using the drop-down menu. The default is to display the Source Device, User Name, Creator User Name, Target User, Event Name, Action, Status, and Count:
For information on saving the generated report, see Saving a Generated Report on page 113.
Table 103 HP NonStop Audit Activity Report Optional Filter Operators
Option Description
Source Device Device that sent these log messages
User Name Name of the user making the inquiry
Creator User Name Username of the creator
Target User User for whom the inquiry is being made
User Group Name of the group
Reported Time Time the event was reported
Process Name Name of the process
Event Name Name of the event
Object Type Type of object that was acted on
Action Action taken
Status Status of the connection
Count Number of attacks
TIBCO LogLogic® Log Management Intelligence (LMI) User Guide
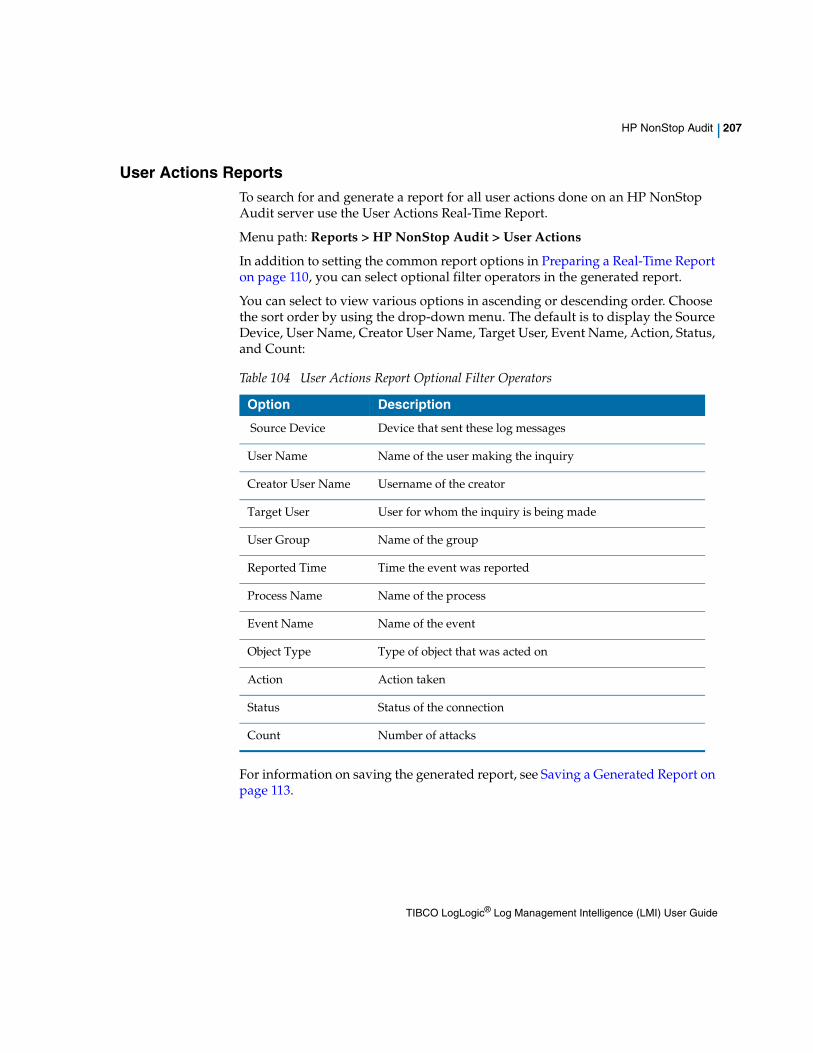
HP NonStop Audit | 207
User Actions ReportsTo search for and generate a report for all user actions done on an HP NonStop Audit server use the User Actions Real-Time Report.
Menu path: Reports > HP NonStop Audit > User Actions
In addition to setting the common report options in Preparing a Real-Time Report on page 110, you can select optional filter operators in the generated report.
You can select to view various options in ascending or descending order. Choose the sort order by using the drop-down menu. The default is to display the Source Device, User Name, Creator User Name, Target User, Event Name, Action, Status, and Count:
For information on saving the generated report, see Saving a Generated Report on page 113.
Table 104 User Actions Report Optional Filter Operators
Option Description
Source Device Device that sent these log messages
User Name Name of the user making the inquiry
Creator User Name Username of the creator
Target User User for whom the inquiry is being made
User Group Name of the group
Reported Time Time the event was reported
Process Name Name of the process
Event Name Name of the event
Object Type Type of object that was acted on
Action Action taken
Status Status of the connection
Count Number of attacks
TIBCO LogLogic® Log Management Intelligence (LMI) User Guide
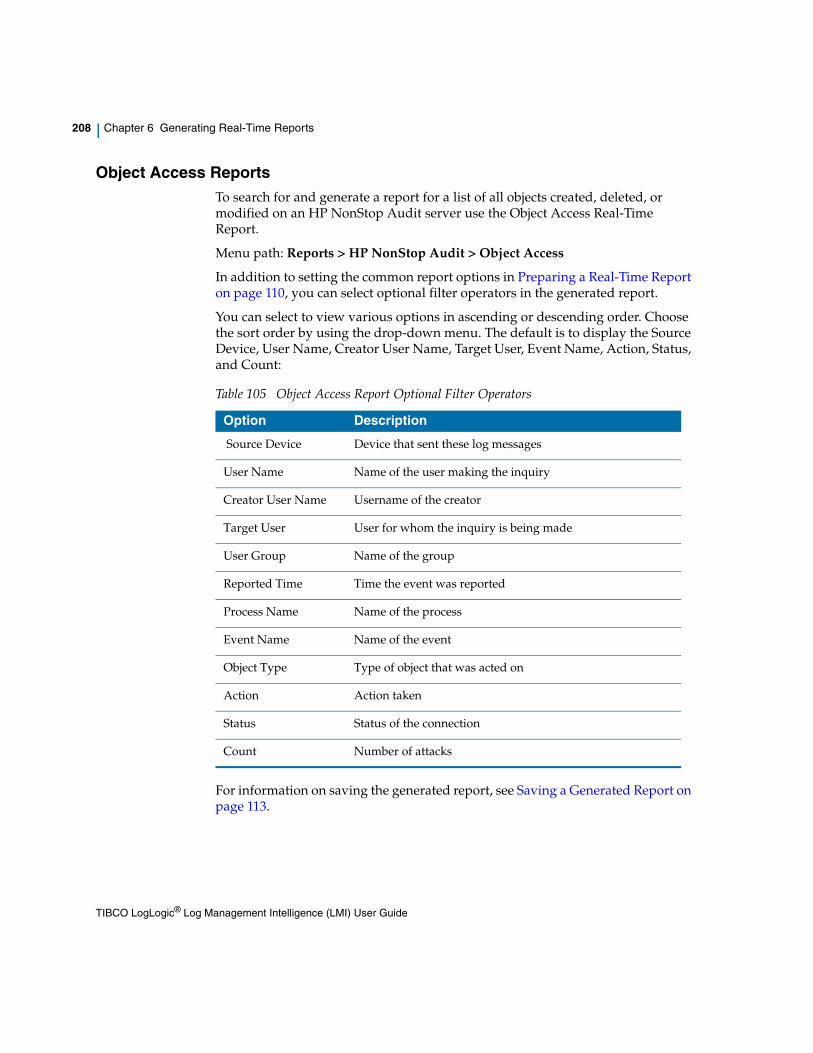
208 | Chapter 6 Generating Real-Time Reports
Object Access ReportsTo search for and generate a report for a list of all objects created, deleted, or modified on an HP NonStop Audit server use the Object Access Real-Time Report.
Menu path: Reports > HP NonStop Audit > Object Access
In addition to setting the common report options in Preparing a Real-Time Report on page 110, you can select optional filter operators in the generated report.
You can select to view various options in ascending or descending order. Choose the sort order by using the drop-down menu. The default is to display the Source Device, User Name, Creator User Name, Target User, Event Name, Action, Status, and Count:
For information on saving the generated report, see Saving a Generated Report on page 113.
Table 105 Object Access Report Optional Filter Operators
Option Description
Source Device Device that sent these log messages
User Name Name of the user making the inquiry
Creator User Name Username of the creator
Target User User for whom the inquiry is being made
User Group Name of the group
Reported Time Time the event was reported
Process Name Name of the process
Event Name Name of the event
Object Type Type of object that was acted on
Action Action taken
Status Status of the connection
Count Number of attacks
TIBCO LogLogic® Log Management Intelligence (LMI) User Guide
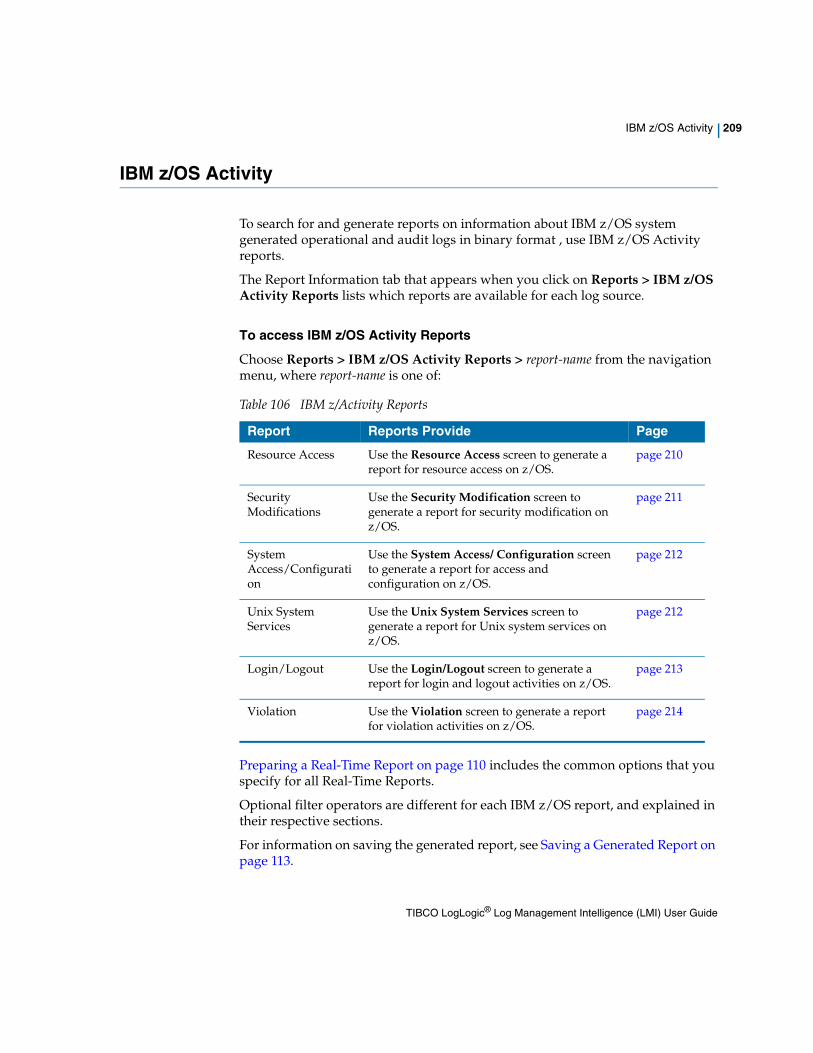
IBM z/OS Activity | 209
IBM z/OS Activity
To search for and generate reports on information about IBM z/OS system generated operational and audit logs in binary format , use IBM z/OS Activity reports.
The Report Information tab that appears when you click on Reports > IBM z/OS Activity Reports lists which reports are available for each log source.
To access IBM z/OS Activity Reports
Choose Reports > IBM z/OS Activity Reports > report-name from the navigation menu, where report-name is one of:
Preparing a Real-Time Report on page 110 includes the common options that you specify for all Real-Time Reports.
Optional filter operators are different for each IBM z/OS report, and explained in their respective sections.
For information on saving the generated report, see Saving a Generated Report on page 113.
Table 106 IBM z/Activity Reports
Report Reports Provide Page
Resource Access Use the Resource Access screen to generate a report for resource access on z/OS.
page 210
Security Modifications
Use the Security Modification screen to generate a report for security modification on z/OS.
page 211
System Access/Configuration
Use the System Access/ Configuration screen to generate a report for access and configuration on z/OS.
page 212
Unix System Services
Use the Unix System Services screen to generate a report for Unix system services on z/OS.
page 212
Login/Logout Use the Login/Logout screen to generate a report for login and logout activities on z/OS.
page 213
Violation Use the Violation screen to generate a report for violation activities on z/OS.
page 214
TIBCO LogLogic® Log Management Intelligence (LMI) User Guide
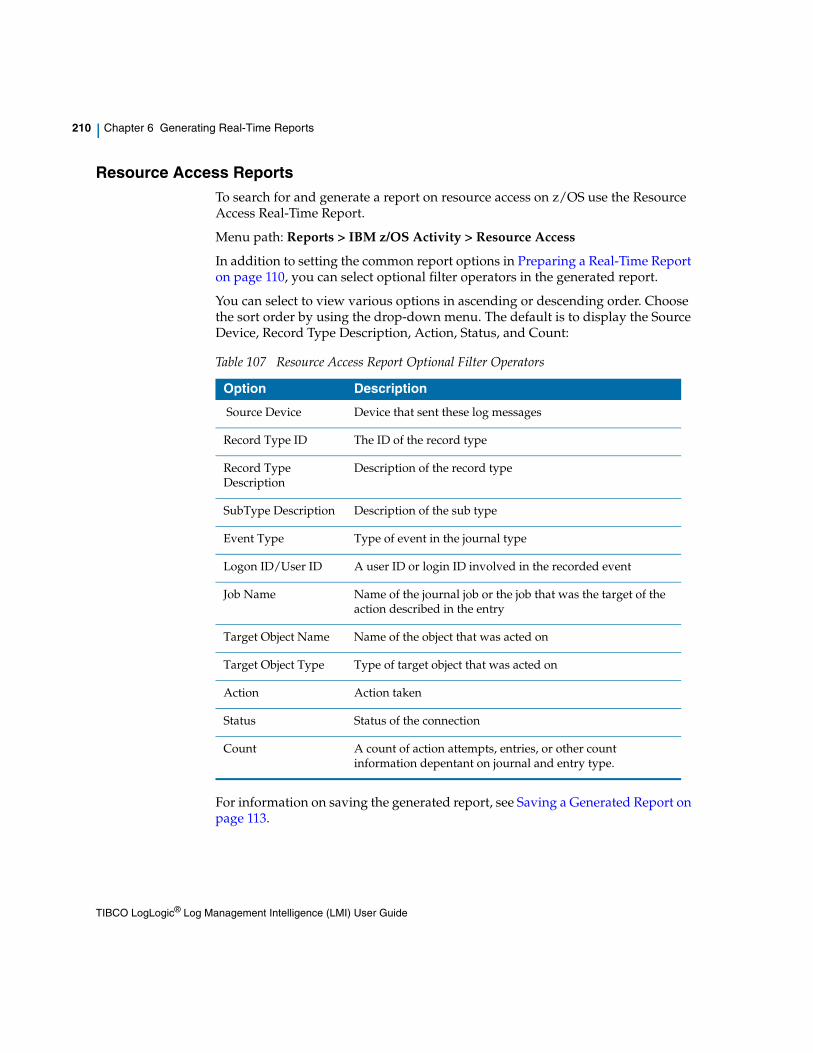
210 | Chapter 6 Generating Real-Time Reports
Resource Access ReportsTo search for and generate a report on resource access on z/OS use the Resource Access Real-Time Report.
Menu path: Reports > IBM z/OS Activity > Resource Access
In addition to setting the common report options in Preparing a Real-Time Report on page 110, you can select optional filter operators in the generated report.
You can select to view various options in ascending or descending order. Choose the sort order by using the drop-down menu. The default is to display the Source Device, Record Type Description, Action, Status, and Count:
For information on saving the generated report, see Saving a Generated Report on page 113.
Table 107 Resource Access Report Optional Filter Operators
Option Description
Source Device Device that sent these log messages
Record Type ID The ID of the record type
Record Type Description
Description of the record type
SubType Description Description of the sub type
Event Type Type of event in the journal type
Logon ID/User ID A user ID or login ID involved in the recorded event
Job Name Name of the journal job or the job that was the target of the action described in the entry
Target Object Name Name of the object that was acted on
Target Object Type Type of target object that was acted on
Action Action taken
Status Status of the connection
Count A count of action attempts, entries, or other count information depentant on journal and entry type.
TIBCO LogLogic® Log Management Intelligence (LMI) User Guide
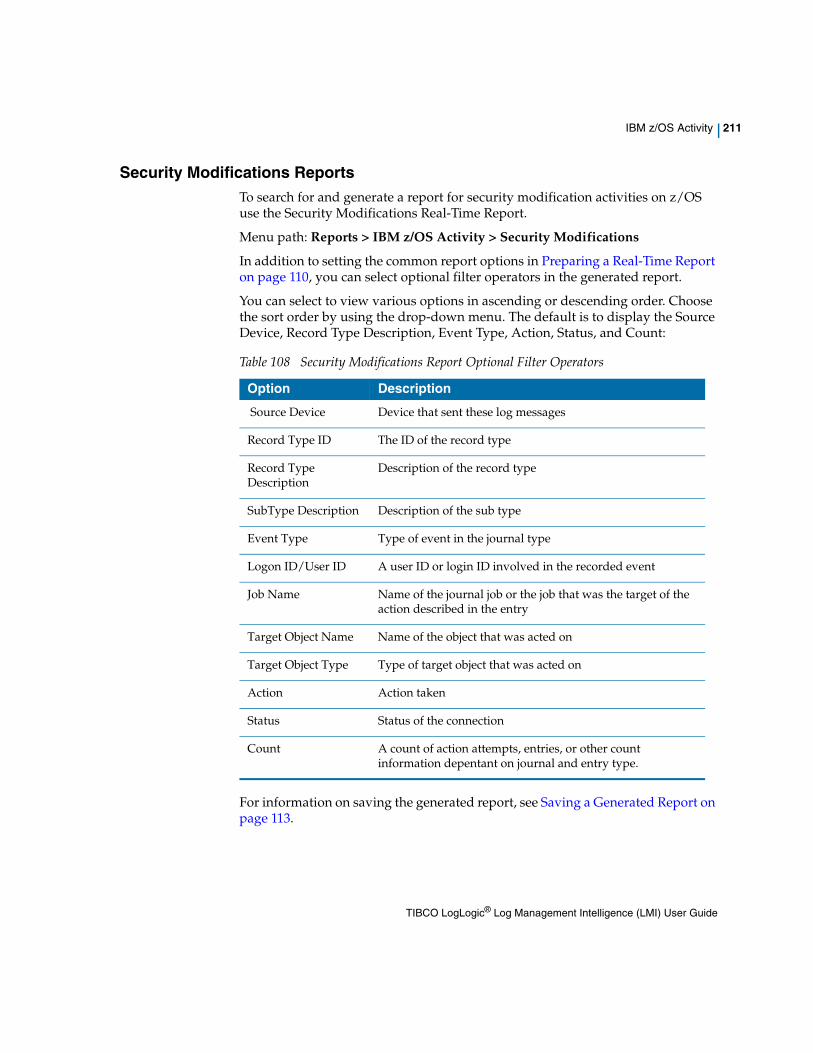
IBM z/OS Activity | 211
Security Modifications ReportsTo search for and generate a report for security modification activities on z/OS use the Security Modifications Real-Time Report.
Menu path: Reports > IBM z/OS Activity > Security Modifications
In addition to setting the common report options in Preparing a Real-Time Report on page 110, you can select optional filter operators in the generated report.
You can select to view various options in ascending or descending order. Choose the sort order by using the drop-down menu. The default is to display the Source Device, Record Type Description, Event Type, Action, Status, and Count:
For information on saving the generated report, see Saving a Generated Report on page 113.
Table 108 Security Modifications Report Optional Filter Operators
Option Description
Source Device Device that sent these log messages
Record Type ID The ID of the record type
Record Type Description
Description of the record type
SubType Description Description of the sub type
Event Type Type of event in the journal type
Logon ID/User ID A user ID or login ID involved in the recorded event
Job Name Name of the journal job or the job that was the target of the action described in the entry
Target Object Name Name of the object that was acted on
Target Object Type Type of target object that was acted on
Action Action taken
Status Status of the connection
Count A count of action attempts, entries, or other count information depentant on journal and entry type.
TIBCO LogLogic® Log Management Intelligence (LMI) User Guide
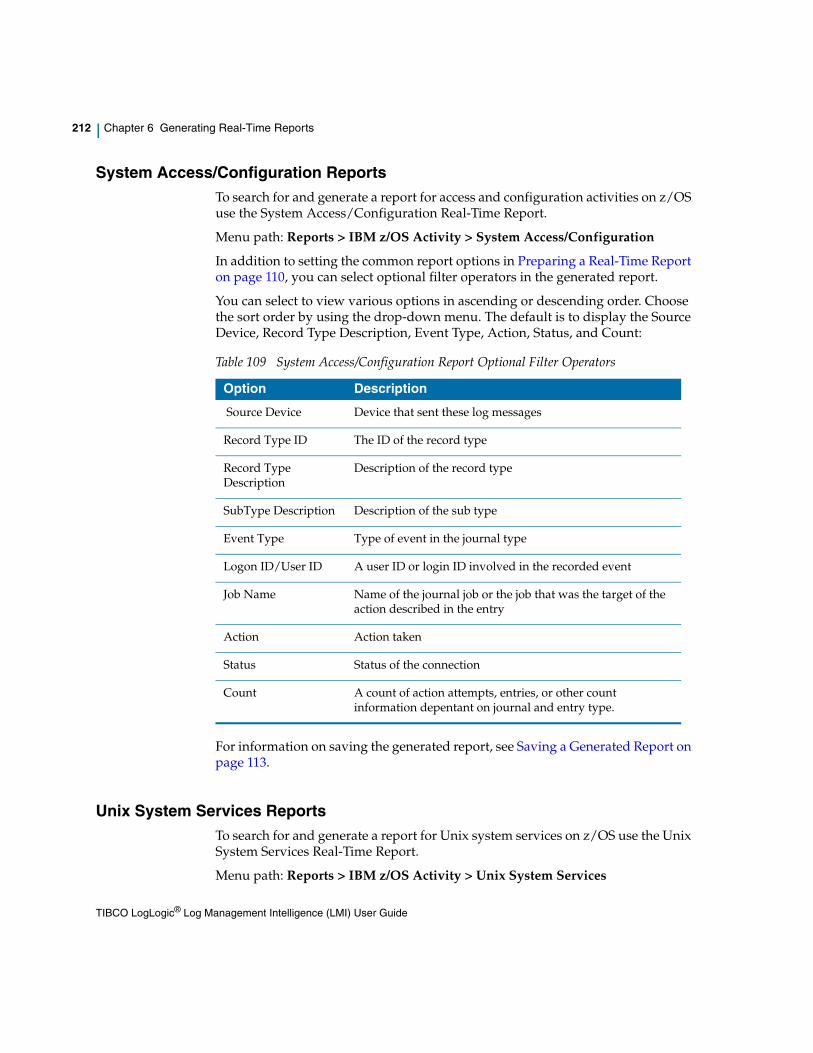
212 | Chapter 6 Generating Real-Time Reports
System Access/Configuration ReportsTo search for and generate a report for access and configuration activities on z/OS use the System Access/Configuration Real-Time Report.
Menu path: Reports > IBM z/OS Activity > System Access/Configuration
In addition to setting the common report options in Preparing a Real-Time Report on page 110, you can select optional filter operators in the generated report.
You can select to view various options in ascending or descending order. Choose the sort order by using the drop-down menu. The default is to display the Source Device, Record Type Description, Event Type, Action, Status, and Count:
For information on saving the generated report, see Saving a Generated Report on page 113.
Unix System Services ReportsTo search for and generate a report for Unix system services on z/OS use the Unix System Services Real-Time Report.
Menu path: Reports > IBM z/OS Activity > Unix System Services
Table 109 System Access/Configuration Report Optional Filter Operators
Option Description
Source Device Device that sent these log messages
Record Type ID The ID of the record type
Record Type Description
Description of the record type
SubType Description Description of the sub type
Event Type Type of event in the journal type
Logon ID/User ID A user ID or login ID involved in the recorded event
Job Name Name of the journal job or the job that was the target of the action described in the entry
Action Action taken
Status Status of the connection
Count A count of action attempts, entries, or other count information depentant on journal and entry type.
TIBCO LogLogic® Log Management Intelligence (LMI) User Guide
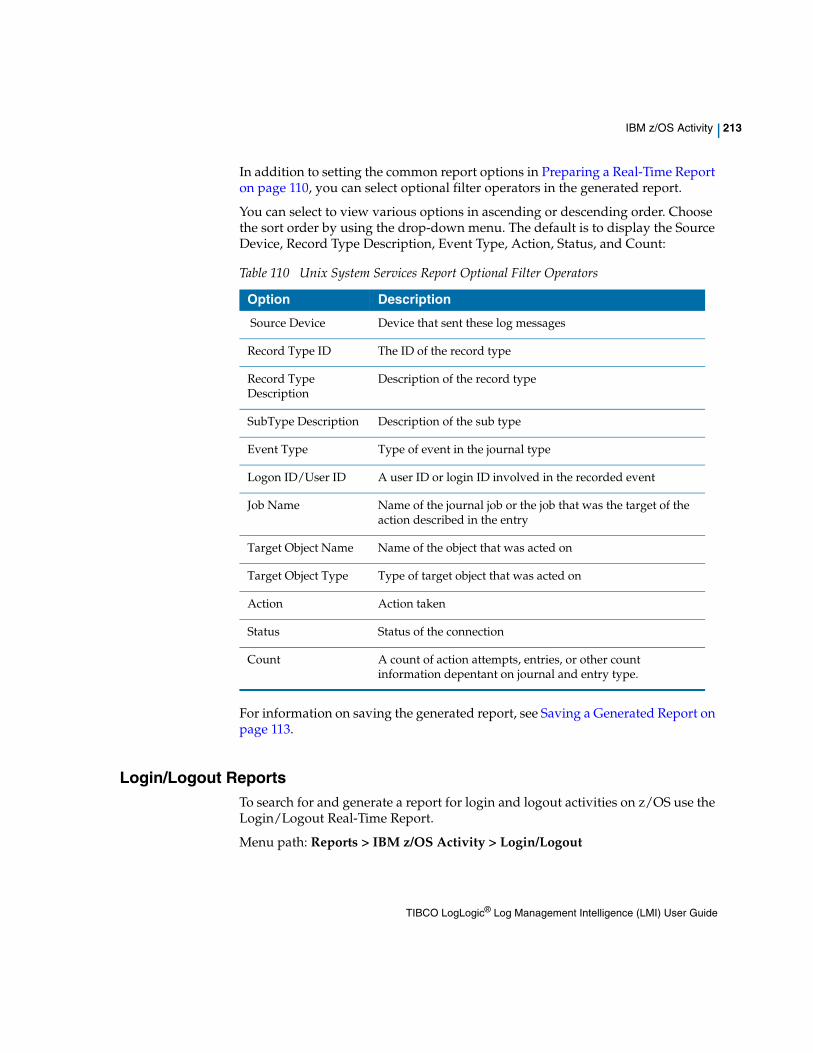
IBM z/OS Activity | 213
In addition to setting the common report options in Preparing a Real-Time Report on page 110, you can select optional filter operators in the generated report.
You can select to view various options in ascending or descending order. Choose the sort order by using the drop-down menu. The default is to display the Source Device, Record Type Description, Event Type, Action, Status, and Count:
For information on saving the generated report, see Saving a Generated Report on page 113.
Login/Logout ReportsTo search for and generate a report for login and logout activities on z/OS use the Login/Logout Real-Time Report.
Menu path: Reports > IBM z/OS Activity > Login/Logout
Table 110 Unix System Services Report Optional Filter Operators
Option Description
Source Device Device that sent these log messages
Record Type ID The ID of the record type
Record Type Description
Description of the record type
SubType Description Description of the sub type
Event Type Type of event in the journal type
Logon ID/User ID A user ID or login ID involved in the recorded event
Job Name Name of the journal job or the job that was the target of the action described in the entry
Target Object Name Name of the object that was acted on
Target Object Type Type of target object that was acted on
Action Action taken
Status Status of the connection
Count A count of action attempts, entries, or other count information depentant on journal and entry type.
TIBCO LogLogic® Log Management Intelligence (LMI) User Guide
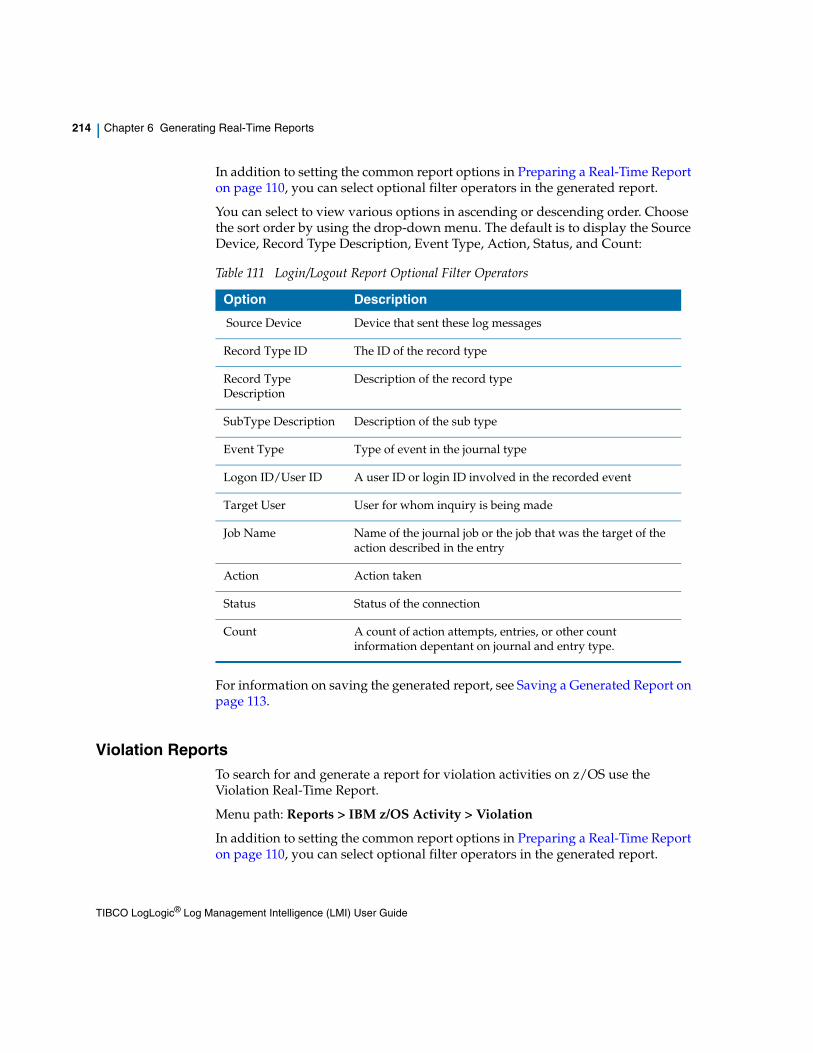
214 | Chapter 6 Generating Real-Time Reports
In addition to setting the common report options in Preparing a Real-Time Report on page 110, you can select optional filter operators in the generated report.
You can select to view various options in ascending or descending order. Choose the sort order by using the drop-down menu. The default is to display the Source Device, Record Type Description, Event Type, Action, Status, and Count:
For information on saving the generated report, see Saving a Generated Report on page 113.
Violation ReportsTo search for and generate a report for violation activities on z/OS use the Violation Real-Time Report.
Menu path: Reports > IBM z/OS Activity > Violation
In addition to setting the common report options in Preparing a Real-Time Report on page 110, you can select optional filter operators in the generated report.
Table 111 Login/Logout Report Optional Filter Operators
Option Description
Source Device Device that sent these log messages
Record Type ID The ID of the record type
Record Type Description
Description of the record type
SubType Description Description of the sub type
Event Type Type of event in the journal type
Logon ID/User ID A user ID or login ID involved in the recorded event
Target User User for whom inquiry is being made
Job Name Name of the journal job or the job that was the target of the action described in the entry
Action Action taken
Status Status of the connection
Count A count of action attempts, entries, or other count information depentant on journal and entry type.
TIBCO LogLogic® Log Management Intelligence (LMI) User Guide
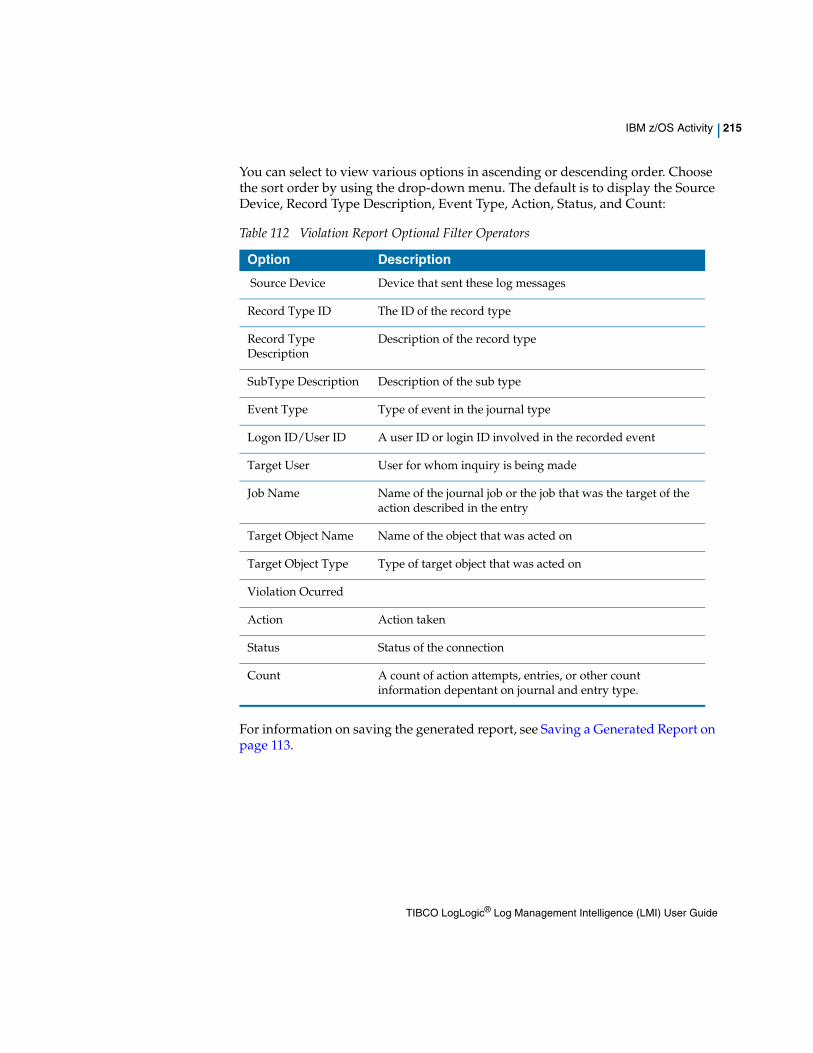
IBM z/OS Activity | 215
You can select to view various options in ascending or descending order. Choose the sort order by using the drop-down menu. The default is to display the Source Device, Record Type Description, Event Type, Action, Status, and Count:
For information on saving the generated report, see Saving a Generated Report on page 113.
Table 112 Violation Report Optional Filter Operators
Option Description
Source Device Device that sent these log messages
Record Type ID The ID of the record type
Record Type Description
Description of the record type
SubType Description Description of the sub type
Event Type Type of event in the journal type
Logon ID/User ID A user ID or login ID involved in the recorded event
Target User User for whom inquiry is being made
Job Name Name of the journal job or the job that was the target of the action described in the entry
Target Object Name Name of the object that was acted on
Target Object Type Type of target object that was acted on
Violation Ocurred
Action Action taken
Status Status of the connection
Count A count of action attempts, entries, or other count information depentant on journal and entry type.
TIBCO LogLogic® Log Management Intelligence (LMI) User Guide
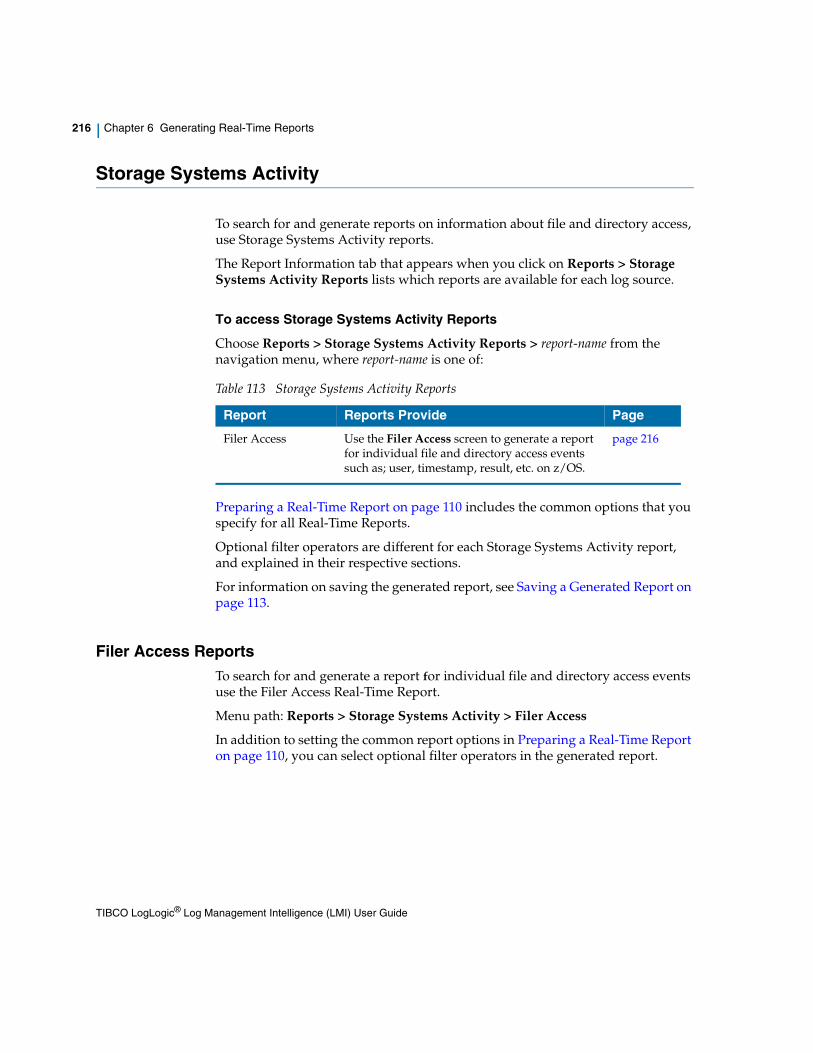
216 | Chapter 6 Generating Real-Time Reports
Storage Systems Activity
To search for and generate reports on information about file and directory access, use Storage Systems Activity reports.
The Report Information tab that appears when you click on Reports > Storage Systems Activity Reports lists which reports are available for each log source.
To access Storage Systems Activity Reports
Choose Reports > Storage Systems Activity Reports > report-name from the navigation menu, where report-name is one of:
Preparing a Real-Time Report on page 110 includes the common options that you specify for all Real-Time Reports.
Optional filter operators are different for each Storage Systems Activity report, and explained in their respective sections.
For information on saving the generated report, see Saving a Generated Report on page 113.
Filer Access ReportsTo search for and generate a report for individual file and directory access events use the Filer Access Real-Time Report.
Menu path: Reports > Storage Systems Activity > Filer Access
In addition to setting the common report options in Preparing a Real-Time Report on page 110, you can select optional filter operators in the generated report.
Table 113 Storage Systems Activity Reports
Report Reports Provide Page
Filer Access Use the Filer Access screen to generate a report for individual file and directory access events such as; user, timestamp, result, etc. on z/OS.
page 216
TIBCO LogLogic® Log Management Intelligence (LMI) User Guide
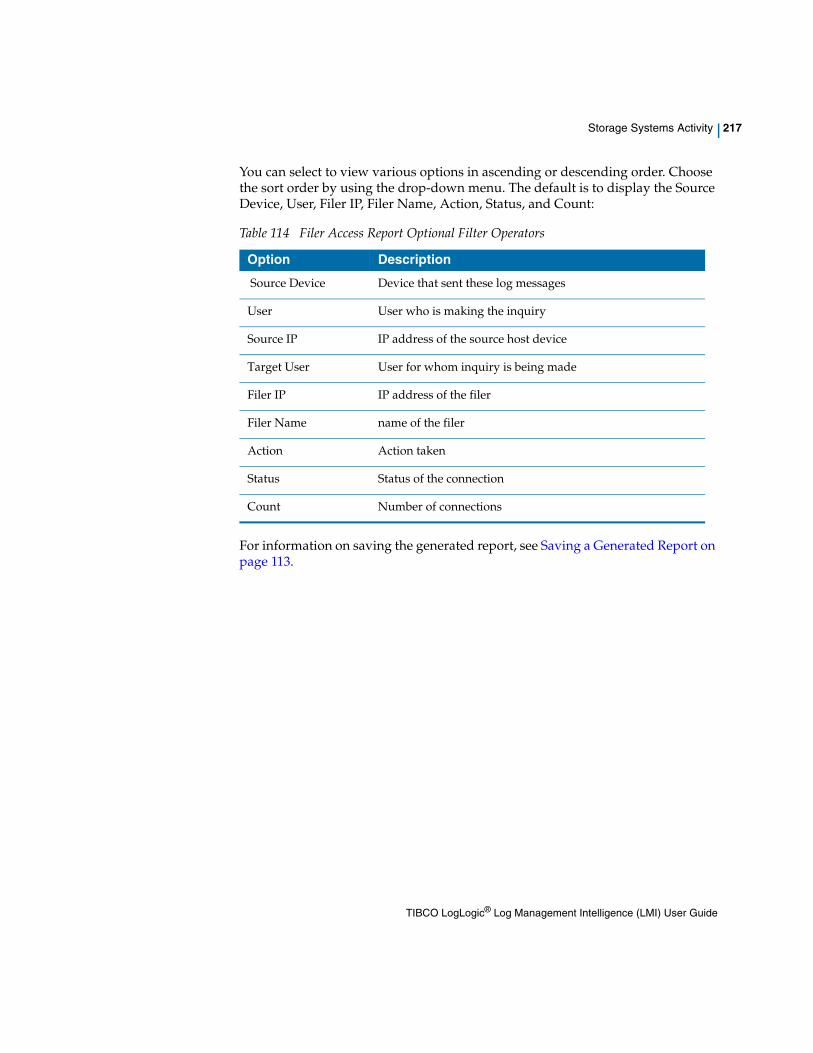
Storage Systems Activity | 217
You can select to view various options in ascending or descending order. Choose the sort order by using the drop-down menu. The default is to display the Source Device, User, Filer IP, Filer Name, Action, Status, and Count:
For information on saving the generated report, see Saving a Generated Report on page 113.
Table 114 Filer Access Report Optional Filter Operators
Option Description
Source Device Device that sent these log messages
User User who is making the inquiry
Source IP IP address of the source host device
Target User User for whom inquiry is being made
Filer IP IP address of the filer
Filer Name name of the filer
Action Action taken
Status Status of the connection
Count Number of connections
TIBCO LogLogic® Log Management Intelligence (LMI) User Guide
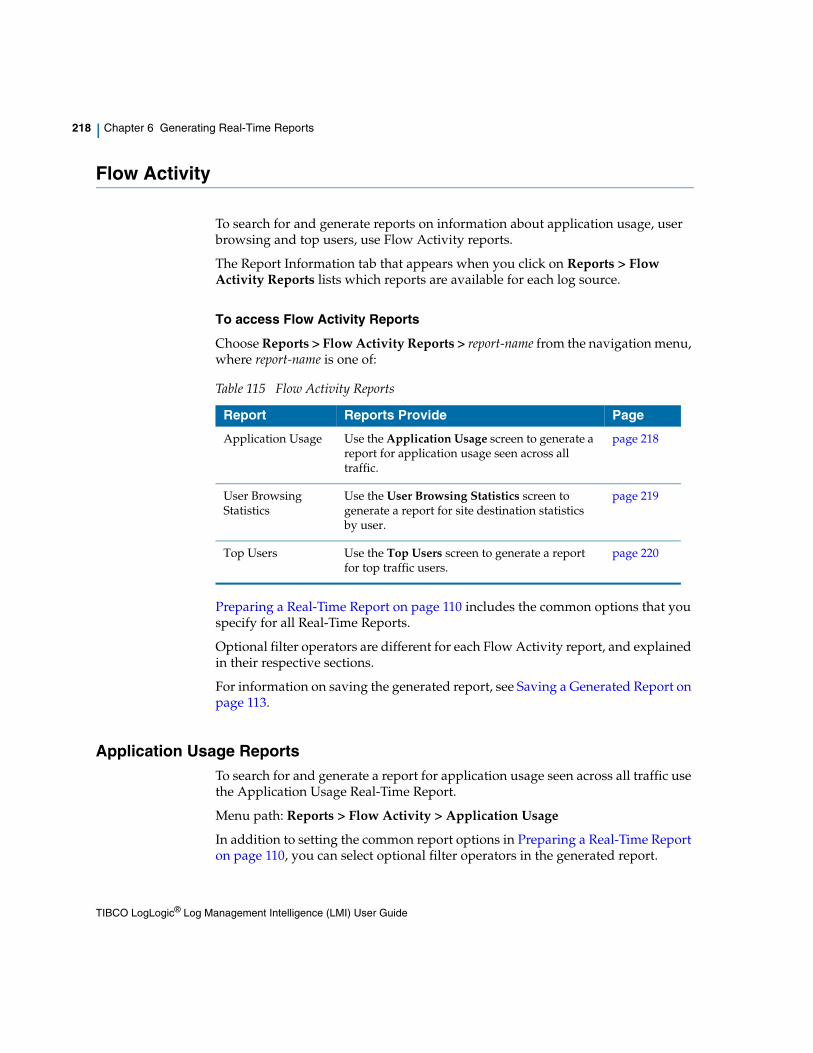
218 | Chapter 6 Generating Real-Time Reports
Flow Activity
To search for and generate reports on information about application usage, user browsing and top users, use Flow Activity reports.
The Report Information tab that appears when you click on Reports > Flow Activity Reports lists which reports are available for each log source.
To access Flow Activity Reports
Choose Reports > Flow Activity Reports > report-name from the navigation menu, where report-name is one of:
Preparing a Real-Time Report on page 110 includes the common options that you specify for all Real-Time Reports.
Optional filter operators are different for each Flow Activity report, and explained in their respective sections.
For information on saving the generated report, see Saving a Generated Report on page 113.
Application Usage ReportsTo search for and generate a report for application usage seen across all traffic use the Application Usage Real-Time Report.
Menu path: Reports > Flow Activity > Application Usage
In addition to setting the common report options in Preparing a Real-Time Report on page 110, you can select optional filter operators in the generated report.
Table 115 Flow Activity Reports
Report Reports Provide Page
Application Usage Use the Application Usage screen to generate a report for application usage seen across all traffic.
page 218
User Browsing Statistics
Use the User Browsing Statistics screen to generate a report for site destination statistics by user.
page 219
Top Users Use the Top Users screen to generate a report for top traffic users.
page 220
TIBCO LogLogic® Log Management Intelligence (LMI) User Guide
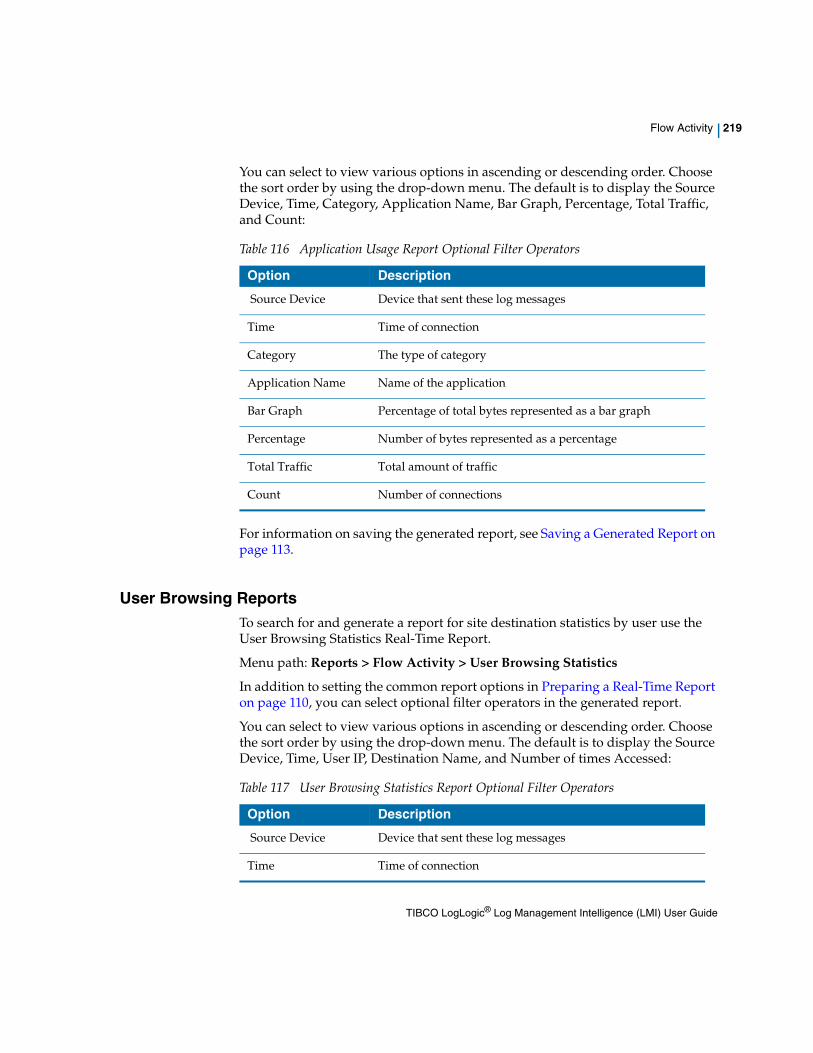
Flow Activity | 219
You can select to view various options in ascending or descending order. Choose the sort order by using the drop-down menu. The default is to display the Source Device, Time, Category, Application Name, Bar Graph, Percentage, Total Traffic, and Count:
For information on saving the generated report, see Saving a Generated Report on page 113.
User Browsing ReportsTo search for and generate a report for site destination statistics by user use the User Browsing Statistics Real-Time Report.
Menu path: Reports > Flow Activity > User Browsing Statistics
In addition to setting the common report options in Preparing a Real-Time Report on page 110, you can select optional filter operators in the generated report.
You can select to view various options in ascending or descending order. Choose the sort order by using the drop-down menu. The default is to display the Source Device, Time, User IP, Destination Name, and Number of times Accessed:
Table 116 Application Usage Report Optional Filter Operators
Option Description
Source Device Device that sent these log messages
Time Time of connection
Category The type of category
Application Name Name of the application
Bar Graph Percentage of total bytes represented as a bar graph
Percentage Number of bytes represented as a percentage
Total Traffic Total amount of traffic
Count Number of connections
Table 117 User Browsing Statistics Report Optional Filter Operators
Option Description
Source Device Device that sent these log messages
Time Time of connection
TIBCO LogLogic® Log Management Intelligence (LMI) User Guide
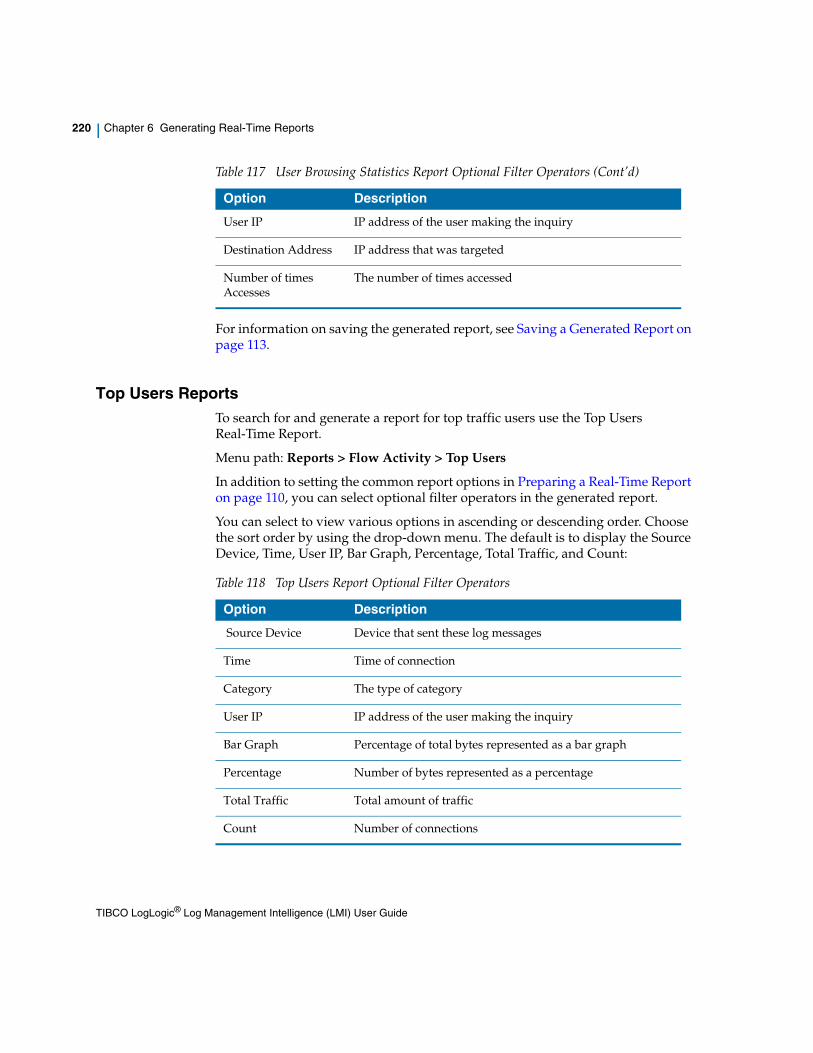
220 | Chapter 6 Generating Real-Time Reports
For information on saving the generated report, see Saving a Generated Report on page 113.
Top Users ReportsTo search for and generate a report for top traffic users use the Top Users Real-Time Report.
Menu path: Reports > Flow Activity > Top Users
In addition to setting the common report options in Preparing a Real-Time Report on page 110, you can select optional filter operators in the generated report.
You can select to view various options in ascending or descending order. Choose the sort order by using the drop-down menu. The default is to display the Source Device, Time, User IP, Bar Graph, Percentage, Total Traffic, and Count:
User IP IP address of the user making the inquiry
Destination Address IP address that was targeted
Number of times Accesses
The number of times accessed
Table 117 User Browsing Statistics Report Optional Filter Operators (Cont’d)
Option Description
Table 118 Top Users Report Optional Filter Operators
Option Description
Source Device Device that sent these log messages
Time Time of connection
Category The type of category
User IP IP address of the user making the inquiry
Bar Graph Percentage of total bytes represented as a bar graph
Percentage Number of bytes represented as a percentage
Total Traffic Total amount of traffic
Count Number of connections
TIBCO LogLogic® Log Management Intelligence (LMI) User Guide

Flow Activity | 221
For information on saving the generated report, see Saving a Generated Report on page 113
TIBCO LogLogic® Log Management Intelligence (LMI) User Guide
222 | Chapter 6 Generating Real-Time Reports
All Saved Reports
The All Saved Reports screen displays a list of all saved reports for specific types of data based on search expressions and time intervals you have defined and saved in the past. All saved searches and types, such as Index Search, RegEx Search, Index Report, etc., that are stored in the system are visible on this page as shown below.
You may click the Run icon and regenerate the report with a different time range, or click the Edit icon and change the saved report parameters before rerunning the report. All options are available, not just the ones originally selected. You may customize the new report using new filters and wildcards. You can also filter the list of saved reports displayed by title or by typing a key word from the report title in the Find field and pressing Enter. The key word or words will be highlighted in the resulting list. To restore the full list of saved reports, clear the Find field and press Enter again.
For more information on saving the generated report, see Saving a Generated Report on page 113.
TIBCO LogLogic® Log Management Intelligence (LMI) User Guide
Setting User Preferences | 223
Chapter 7 Setting User Preferences
The admin icon on the home page allows you to set values for your Account Information, System Preferences, and to Change Password.
Topics
• Viewing Your LogApp Account on page 224
• Changing Login Landing Page on page 225
• Changing the Account Password on page 226
TIBCO LogLogic® Log Management Intelligence (LMI) User Guide
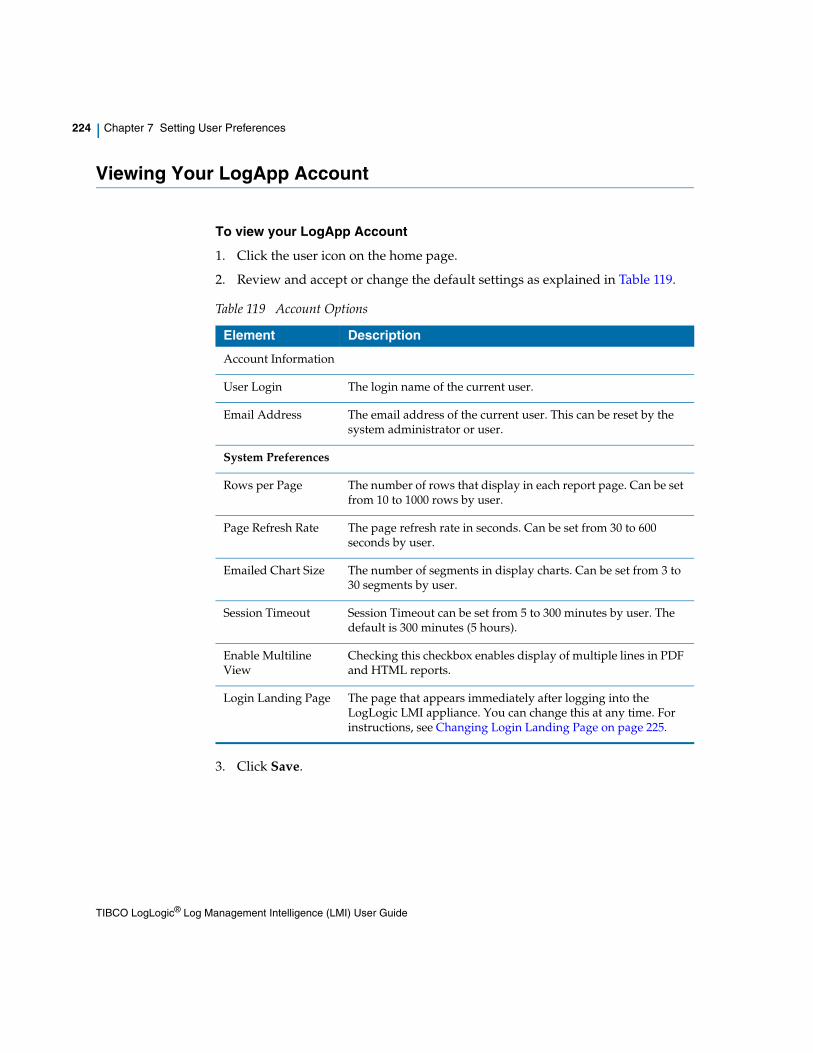
224 | Chapter 7 Setting User Preferences
Viewing Your LogApp Account
To view your LogApp Account
1. Click the user icon on the home page.
2. Review and accept or change the default settings as explained in Table 119.
3. Click Save.
Table 119 Account Options
Element Description
Account Information
User Login The login name of the current user.
Email Address The email address of the current user. This can be reset by the system administrator or user.
System Preferences
Rows per Page The number of rows that display in each report page. Can be set from 10 to 1000 rows by user.
Page Refresh Rate The page refresh rate in seconds. Can be set from 30 to 600 seconds by user.
Emailed Chart Size The number of segments in display charts. Can be set from 3 to 30 segments by user.
Session Timeout Session Timeout can be set from 5 to 300 minutes by user. The default is 300 minutes (5 hours).
Enable Multiline View
Checking this checkbox enables display of multiple lines in PDF and HTML reports.
Login Landing Page The page that appears immediately after logging into the LogLogic LMI appliance. You can change this at any time. For instructions, see Changing Login Landing Page on page 225.
TIBCO LogLogic® Log Management Intelligence (LMI) User Guide
Changing Login Landing Page | 225
Changing Login Landing Page
The Login Landing Page (Home) appears immediately upon logging in to the LogLogic LMI appliance. By default the LogLogic Overview Welcome screen is displayed. However, you can change your landing page at anytime.
To change your login landing page
1. Click the user icon on the home page.
2. Click the down arrow next to Login landing page and select the page among these other landing page options: My Dashboard, System Status, Triggered Alerts, Index Search, All Saved Reports, and All Saved Searches.
3. Click Save.
The next time you login to the appliance, the alternate home page that you selected in this step will be displayed. You can change this destination at anytime.
TIBCO LogLogic® Log Management Intelligence (LMI) User Guide
226 | Chapter 7 Setting User Preferences
Changing the Account Password
You can change your password at any time.
To change your password
1. Click the user icon on the home page.
2. Click the Change Password button.
3. The Change Password dialog box appears. It displays date of last password update.
4. In the Current Password field, enter your current password.
5. In the New Password field, enter your new password. Note the password requirements specified on the window.
6. In the Confirm New Password field, enter your new password again for verification.
TIBCO LogLogic® Log Management Intelligence (LMI) User Guide
Advanced Features | 227
Chapter 8 Advanced Features
This section describes advanced features in LogLogic Log Management Intelligence (LMI):
• Advanced Search
• Bloks
• Advanced Dashboards
• Advanced Data Models
• REST API support for Advanced Search
• Exporting and Importing Configurations
Only an administrator with CLI access using root can use this feature. For more information on exporting and importing configurations, see the TIBCO LogLogic® Log Management Intelligence (LMI) Administration Guide.
• Smart Lists for Advanced Search
• Monthly index
By default, these features are disabled. A user with administrator privileges can enable the advanced features. For more information on enabling the features, see the TIBCO LogLogic® Log Management Intelligence (LMI) Administration Guide.
Topics
• Advanced Search Overview on page 229
• The advanced features are not supported on:
— A high availability setup
— 825/1025/3025 models
— Management Station
• Use caution when enabling advanced features on LX1025R1 models, as the memory requirements of these features when in use may cause performance issues.
TIBCO LogLogic® Log Management Intelligence (LMI) User Guide
228 | Chapter 8 Advanced Features
• Search Results on page 234
• About Bloks on page 254
• Manage Dashboard on page 261
• Managing Data Models on page 277
• Using the REST API on page 296
• REST API Support for Advanced Search on page 299
TIBCO LogLogic® Log Management Intelligence (LMI) User Guide
Advanced Search Overview | 229
Advanced Search Overview
From Advanced Search, you can easily interact with your data. You can run simple and complex searches, save search elements and time ranges in the form of Bloks, and retrieve results to analyze failures or other anomalies.
The basic search retrieves all events that match the search terms. Advanced searches are retrieved by a "pipeline" concept, where expressions are separated by pipes ("|"). LogLogic LMI search query language Event Query Language (EQL), is intuitive and efficient. The search query mainly supports EQL, using which you can search large data and view results in seconds. A Structured Query Language (SQL) dialect is also supported.
For more information on how to form a search query and sample queries with explanation, see Appendix C, Search Syntax Reference.
The following Search and Time fields can be combined (AND-ed) or used alone as described:
• If you define the time in either the Search or Time field, the results are retrieved for the specified time period.
• If you define the time in the Search field and Time field both, the results are retrieved for the intersection of the time periods.
You must specify time either in the Search or Time field.
For complex queries, you can create different types of Bloks that can be reused in future searches. Bloks are query fragments that can be easily referenced from queries. For detailed information about how to build and use Bloks, see About Bloks.
For sample search examples, see Search Examples.
Click to add multiple search tabs. You can run multiple searches using different search elements on the same data to analyze any anomalies.
All dates and time are defined in the local time zone of the machine where the system is installed. They are not based on the browser’s time zone.
TIBCO LogLogic® Log Management Intelligence (LMI) User Guide
230 | Chapter 8 Advanced Features
Infrastructure QueriesQueries can also retrieve information about LogLogic LMI itself, for example, its configuration. These queries are referred as infrastructure queries. With infrastructure queries you can find things like the amount of data that has been ingested and indexed over time, in one-hour buckets. These queries work in the same way as other queries, except where indicated.
Infrastructure queries are not necessarily related to log events and do not contain an event time-stamp column, which other data models do. As a result, a Time value need not be specified within infrastructure queries. If you use the time value in the Time field rather than embedding the time span explicitly in the query, then you must delete the value from the time blok field to successfully execute an infrastructure query.
Query Name:
LogLogic_System_Ingest_And_Index_Stats
The following fields are returned in the search results:
• lls_time: time period to be queried.
• lls_ingestBytes: number of data bytes ingested during the specified time period
• lls_indexBytes: number of bytes indexed during the specified time period
Description:
The data ingest count represents when the files get collected by the system, whereas the index count represents when those files (or, in the case of large pulled files, parts of those files) are actually indexed.
If a large amount of data is ingested in one hour, most of it might get indexed in the following hour, resulting in a higher index count than the ingest count for that hour.
In a relatively quiet system, the data ingest count is only updated periodically, whereas the index count is updated when a file is indexed. Therefore, the index count might get updated before the data ingest count. As a result, the index count might be more than the data ingest count for the most recent hour.
Therefore, for up-to-date values, check the count shortly after the end of any particular hour.
Examples1. USE LogLogic_System_Ingest_And_Index_Stats
returns the results in one-hour buckets.
TIBCO LogLogic® Log Management Intelligence (LMI) User Guide
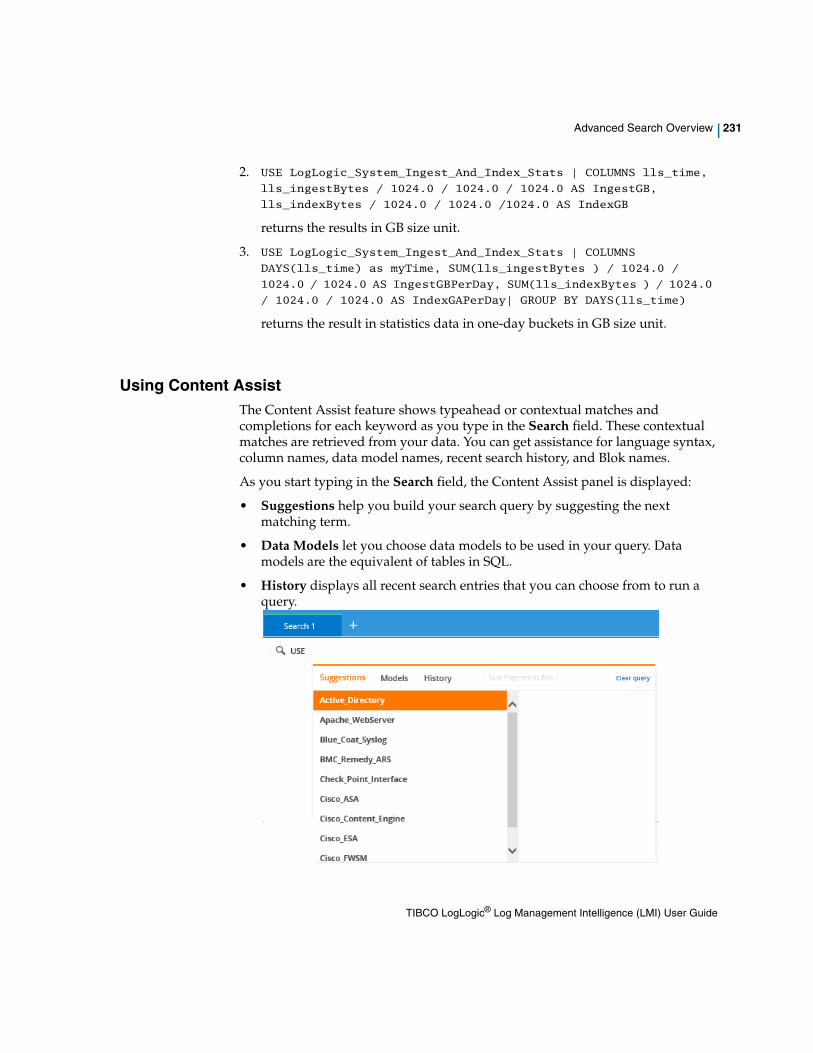
Advanced Search Overview | 231
2. USE LogLogic_System_Ingest_And_Index_Stats | COLUMNS lls_time,
lls_ingestBytes / 1024.0 / 1024.0 / 1024.0 AS IngestGB,
lls_indexBytes / 1024.0 / 1024.0 /1024.0 AS IndexGB
returns the results in GB size unit.
3. USE LogLogic_System_Ingest_And_Index_Stats | COLUMNS
DAYS(lls_time) as myTime, SUM(lls_ingestBytes ) / 1024.0 /
1024.0 / 1024.0 AS IngestGBPerDay, SUM(lls_indexBytes ) / 1024.0
/ 1024.0 / 1024.0 AS IndexGAPerDay| GROUP BY DAYS(lls_time)
returns the result in statistics data in one-day buckets in GB size unit.
Using Content AssistThe Content Assist feature shows typeahead or contextual matches and completions for each keyword as you type in the Search field. These contextual matches are retrieved from your data. You can get assistance for language syntax, column names, data model names, recent search history, and Blok names.
As you start typing in the Search field, the Content Assist panel is displayed:
• Suggestions help you build your search query by suggesting the next matching term.
• Data Models let you choose data models to be used in your query. Data models are the equivalent of tables in SQL.
• History displays all recent search entries that you can choose from to run a query.
TIBCO LogLogic® Log Management Intelligence (LMI) User Guide
232 | Chapter 8 Advanced Features
Click on the term to select and add it in the Search field.
Using the Search FieldYou can enter queries in any of the supported languages (SQL or EQL), retrieving data from data models, with filters of any kind such as LIKE, regular expressions, comparison operators, math, functions, and so on. You can use single or multiple terms.
Enter USE to start an EQL statement and enter SELECT to start an SQL statement. You can search data based on Bloks. For details on how to add a new Blok or use the existing Bloks, see About Bloks.
As you start typing, the Content Assist feature shows contextual matches and completions for each keyword into the Search field. Click to view results.
For example, enter the following query in the Search field to retrieve events from the system data model within the last hour:
use system | sys_eventTime in -1h:NOW
The system data model refers to all the data in the system.
Using the Time FieldYou can enter absolute and relative time ranges. You can search based on Bloks.
From the Search tab, enter the time period in the Time field and click . For details on how to add a new time Blok or use the existing Blok, see Time Bloks.
When copying a query from another rich text format application, such as Microsoft Word, into LogLogic LMI can interfere with processing of the query. For example, extraneous characters can be added to the query or straight quotation marks (") can be replaced with curly quotation marks (”) , like “ and ”, which are not part of a correct query string. Therefore, when copying from a rich format source, review the search query syntax and correct any errors before proceeding.
All dates and times are defined in the local time zone of the machine where the system is installed and it is not based on the browser time zone.
TIBCO LogLogic® Log Management Intelligence (LMI) User Guide
Advanced Search Overview | 233
For example, enter -5h to retrieve all events that occur in the last 5 hours.
Using Smart ListsIf the data you want to search is more dynamic by nature and changes often, it might be difficult to create a query that would collect the right information. In such cases, you can use a Smart List and reference the list in any query to achieve accurate results.
To create a Smart List, contact your administrator.
From the Search tab, you can use a smart list in your query.
For example, if there is a Smart List of blacklisted IP addresses, you can interact with your data by running a query such as:use <Advanced data model> | $ipBlackList(ll_sourceIP)='blackList'
Using Monthly IndexWhen enabled, the monthly index feature increases the performance of the searches spanning monthly time ranges. The monthly index adds a month-based index on top of the existing hourly indexes and enables searches to quickly locate the search terms within a given month.
The Time field must be empty when entering an infrastructure search queries.
An example of invalid infrastructure search query is:use LogLogic_Config_Bloks | sys_eventTime in -5d
• Only the advanced search uses monthly indexing.
• Monthly indexing can be enabled only if the Advanced Search features are enabled. To enable the advanced features and the monthly index feature, contact your administrator.
TIBCO LogLogic® Log Management Intelligence (LMI) User Guide
234 | Chapter 8 Advanced Features
Search Results
After running a search query, you can view search results in the Result tab.
You can visualize results using Charts or Data panel. After running a query, if you retrieve lots of results, you can group the results without having to issue a new query, and then drill-down into the information. You can see both aggregated counts as well as create visualization elements to better isolate trends and issues. You can include multiple filters to narrow your results. Create a filter in the context of an event, and view results based on a specific filter.
After running the search query, a progress bar is displayed above the Result tab showing the progress of the query. Based on your data, it might take a few minutes to retrieve results into all three panels. By default, results are returned in ascending order.
Add multiple result tabs to view the same data in different forms. Click to add multiple result tabs. When results are grouped together, a new Result tab is displayed showing the grouped results for the selected value.
The Result tab is divided into three panels:
• Charts display the distribution of events in time using a line chart in the top panel.
• Columns provide all available columns and their associated values based on each search query in the left bottom panel.
By default, a maximum of 10,000 results will be displayed in the Result tab. To increase the limit, use the LIMIT clause in your query. See the LIMIT Statement for details.
Querying a large data set using Advanced Search might display an error or an exception if the result contains more than a few million records.
If you are using multiple search tabs, make sure you close a tab that is no longer required, to save on the memory used for displaying search results.
TIBCO LogLogic® Log Management Intelligence (LMI) User Guide
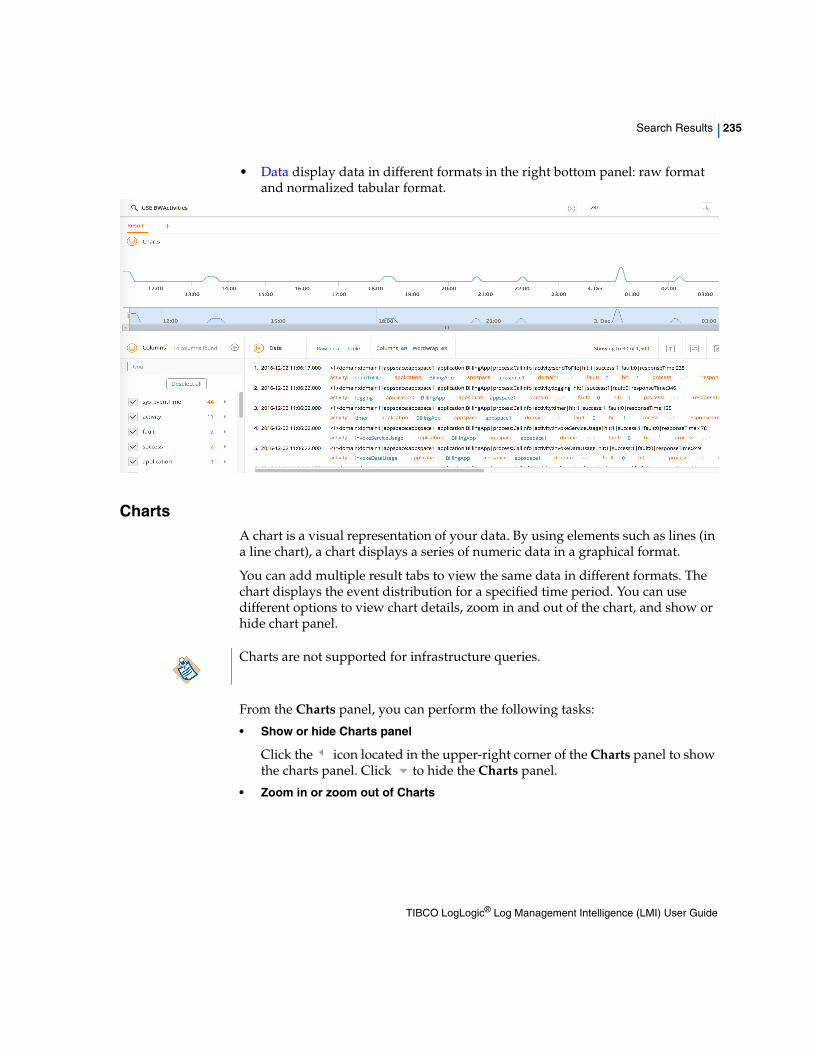
Search Results | 235
• Data display data in different formats in the right bottom panel: raw format and normalized tabular format.
ChartsA chart is a visual representation of your data. By using elements such as lines (in a line chart), a chart displays a series of numeric data in a graphical format.
You can add multiple result tabs to view the same data in different formats. The chart displays the event distribution for a specified time period. You can use different options to view chart details, zoom in and out of the chart, and show or hide chart panel.
From the Charts panel, you can perform the following tasks:
• Show or hide Charts panel
Click the icon located in the upper-right corner of the Charts panel to show the charts panel. Click to hide the Charts panel.
• Zoom in or zoom out of Charts
Charts are not supported for infrastructure queries.
TIBCO LogLogic® Log Management Intelligence (LMI) User Guide
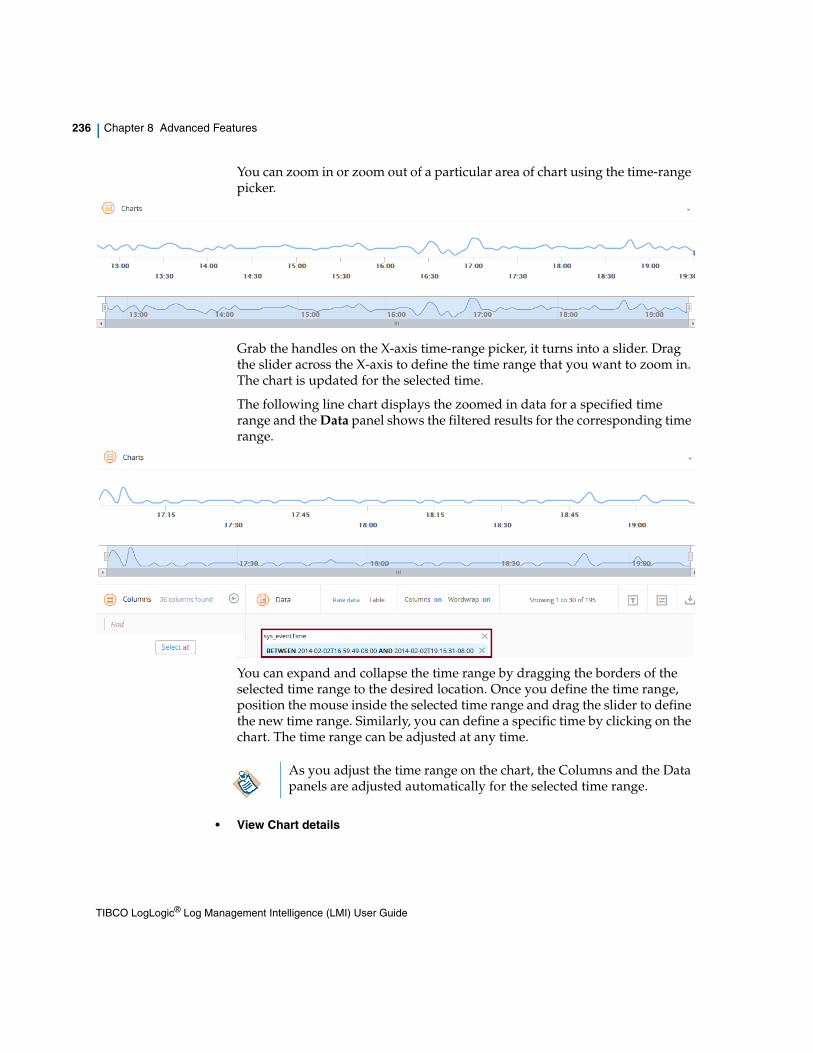
236 | Chapter 8 Advanced Features
You can zoom in or zoom out of a particular area of chart using the time-range picker.
Grab the handles on the X-axis time-range picker, it turns into a slider. Drag the slider across the X-axis to define the time range that you want to zoom in. The chart is updated for the selected time.
The following line chart displays the zoomed in data for a specified time range and the Data panel shows the filtered results for the corresponding time range.
You can expand and collapse the time range by dragging the borders of the selected time range to the desired location. Once you define the time range, position the mouse inside the selected time range and drag the slider to define the new time range. Similarly, you can define a specific time by clicking on the chart. The time range can be adjusted at any time.
• View Chart details
As you adjust the time range on the chart, the Columns and the Data panels are adjusted automatically for the selected time range.
TIBCO LogLogic® Log Management Intelligence (LMI) User Guide
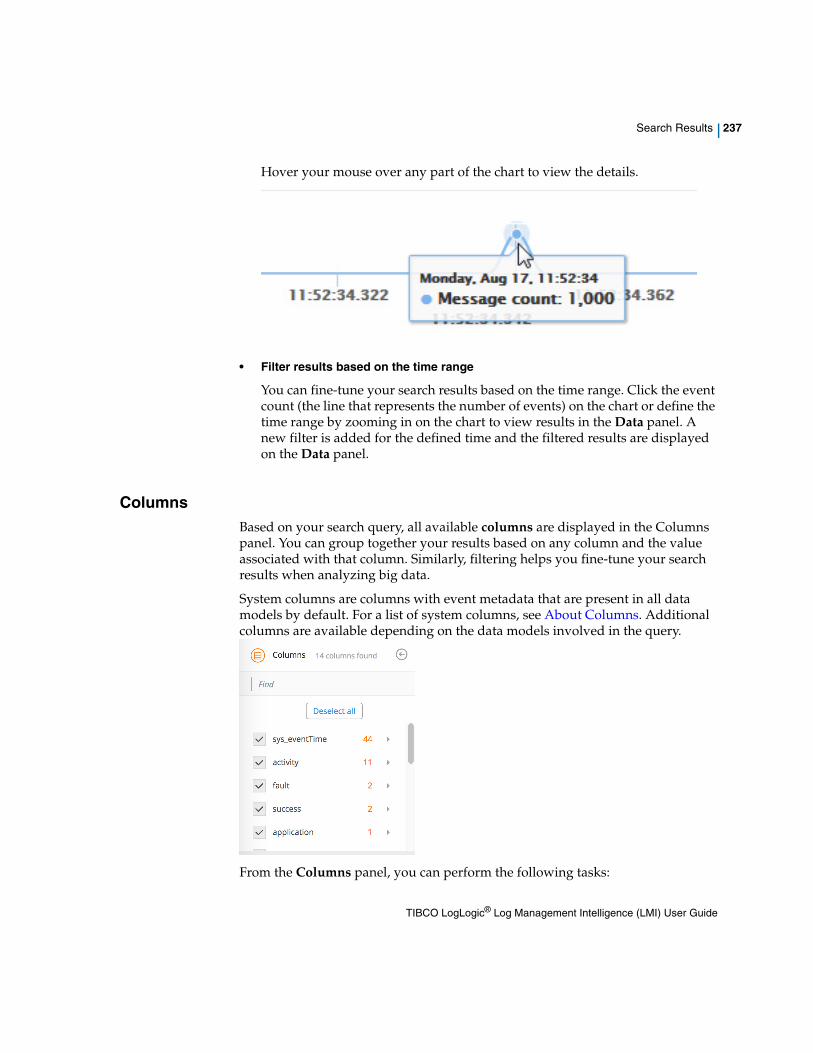
Search Results | 237
Hover your mouse over any part of the chart to view the details.
• Filter results based on the time range
You can fine-tune your search results based on the time range. Click the event count (the line that represents the number of events) on the chart or define the time range by zooming in on the chart to view results in the Data panel. A new filter is added for the defined time and the filtered results are displayed on the Data panel.
ColumnsBased on your search query, all available columns are displayed in the Columns panel. You can group together your results based on any column and the value associated with that column. Similarly, filtering helps you fine-tune your search results when analyzing big data.
System columns are columns with event metadata that are present in all data models by default. For a list of system columns, see About Columns. Additional columns are available depending on the data models involved in the query.
From the Columns panel, you can perform the following tasks:
TIBCO LogLogic® Log Management Intelligence (LMI) User Guide
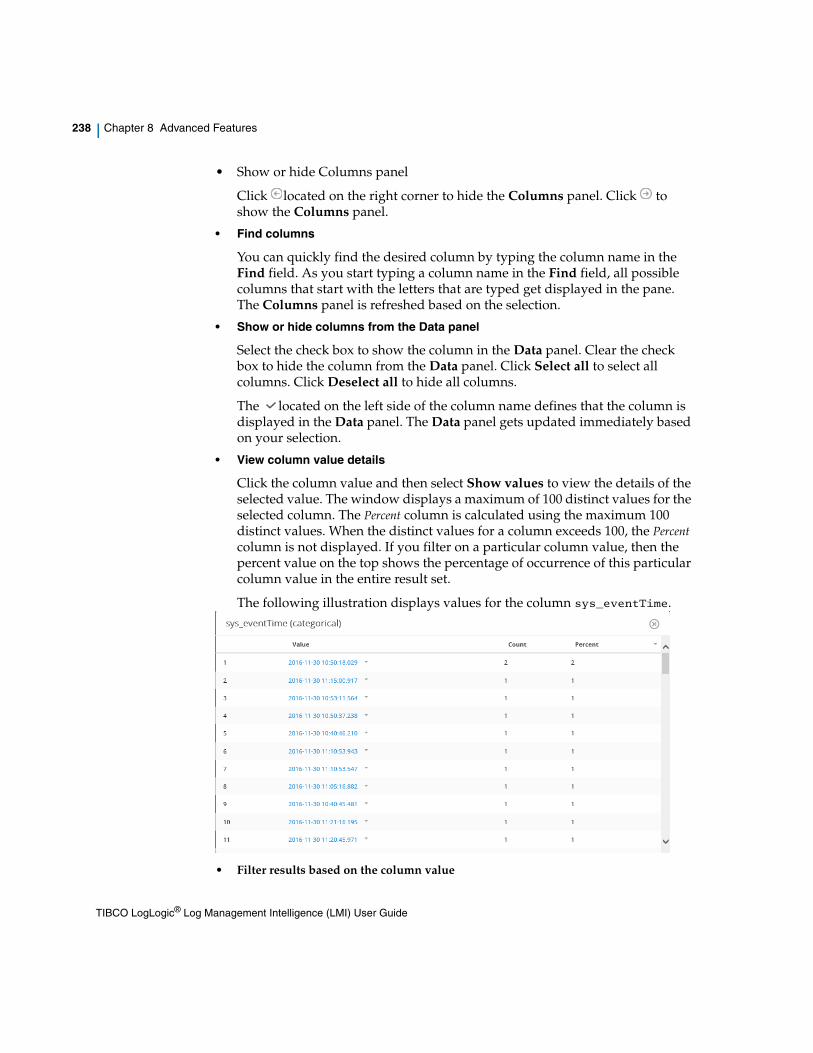
238 | Chapter 8 Advanced Features
• Show or hide Columns panel
Click located on the right corner to hide the Columns panel. Click to show the Columns panel.
• Find columns
You can quickly find the desired column by typing the column name in the Find field. As you start typing a column name in the Find field, all possible columns that start with the letters that are typed get displayed in the pane. The Columns panel is refreshed based on the selection.
• Show or hide columns from the Data panel
Select the check box to show the column in the Data panel. Clear the check box to hide the column from the Data panel. Click Select all to select all columns. Click Deselect all to hide all columns.
The located on the left side of the column name defines that the column is displayed in the Data panel. The Data panel gets updated immediately based on your selection.
• View column value details
Click the column value and then select Show values to view the details of the selected value. The window displays a maximum of 100 distinct values for the selected column. The Percent column is calculated using the maximum 100 distinct values. When the distinct values for a column exceeds 100, the Percent column is not displayed. If you filter on a particular column value, then the percent value on the top shows the percentage of occurrence of this particular column value in the entire result set.
The following illustration displays values for the column sys_eventTime.
• Filter results based on the column value
TIBCO LogLogic® Log Management Intelligence (LMI) User Guide
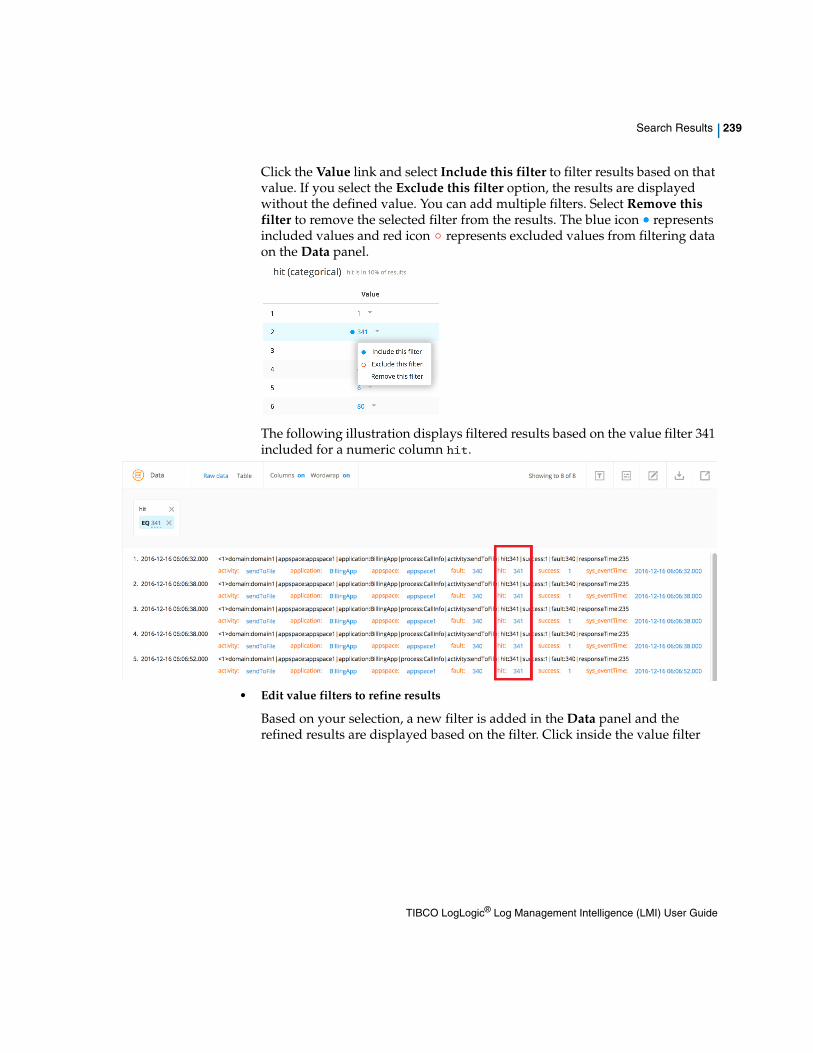
Search Results | 239
Click the Value link and select Include this filter to filter results based on that value. If you select the Exclude this filter option, the results are displayed without the defined value. You can add multiple filters. Select Remove this filter to remove the selected filter from the results. The blue icon represents included values and red icon represents excluded values from filtering data on the Data panel.
The following illustration displays filtered results based on the value filter 341 included for a numeric column hit.
• Edit value filters to refine results
Based on your selection, a new filter is added in the Data panel and the refined results are displayed based on the filter. Click inside the value filter
TIBCO LogLogic® Log Management Intelligence (LMI) User Guide
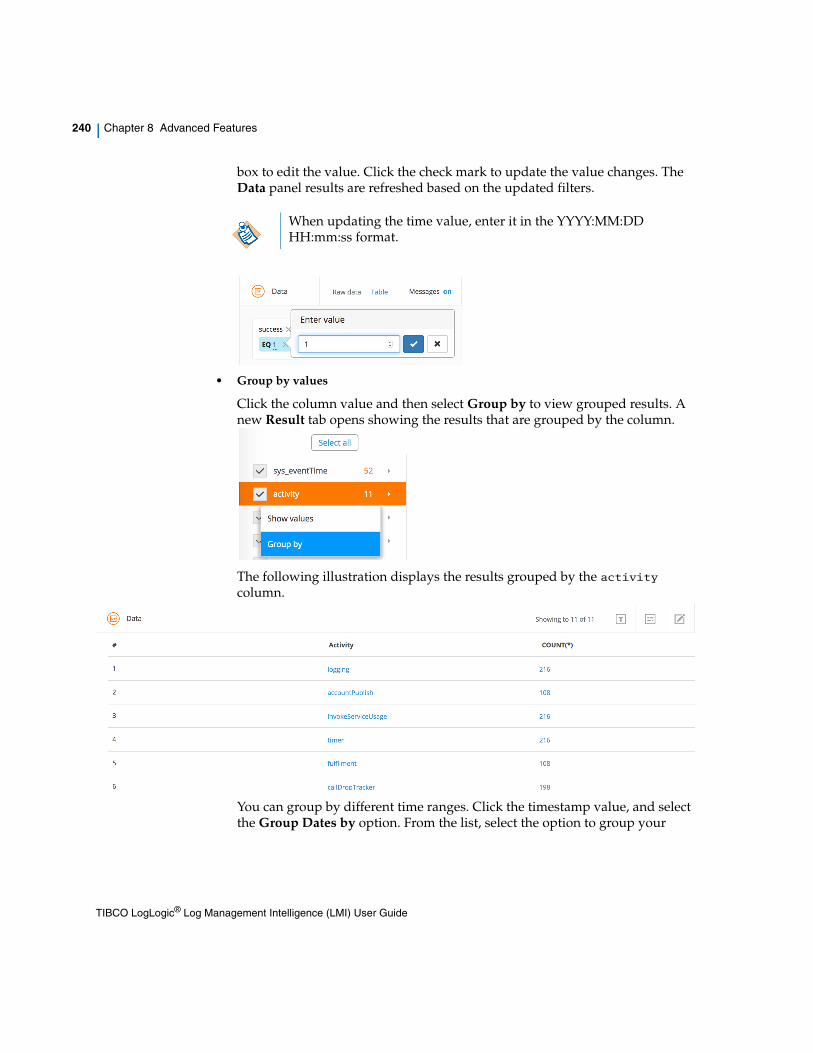
240 | Chapter 8 Advanced Features
box to edit the value. Click the check mark to update the value changes. The Data panel results are refreshed based on the updated filters.
• Group by values
Click the column value and then select Group by to view grouped results. A new Result tab opens showing the results that are grouped by the column.
The following illustration displays the results grouped by the activity column.
You can group by different time ranges. Click the timestamp value, and select the Group Dates by option. From the list, select the option to group your
When updating the time value, enter it in the YYYY:MM:DD HH:mm:ss format.
TIBCO LogLogic® Log Management Intelligence (LMI) User Guide
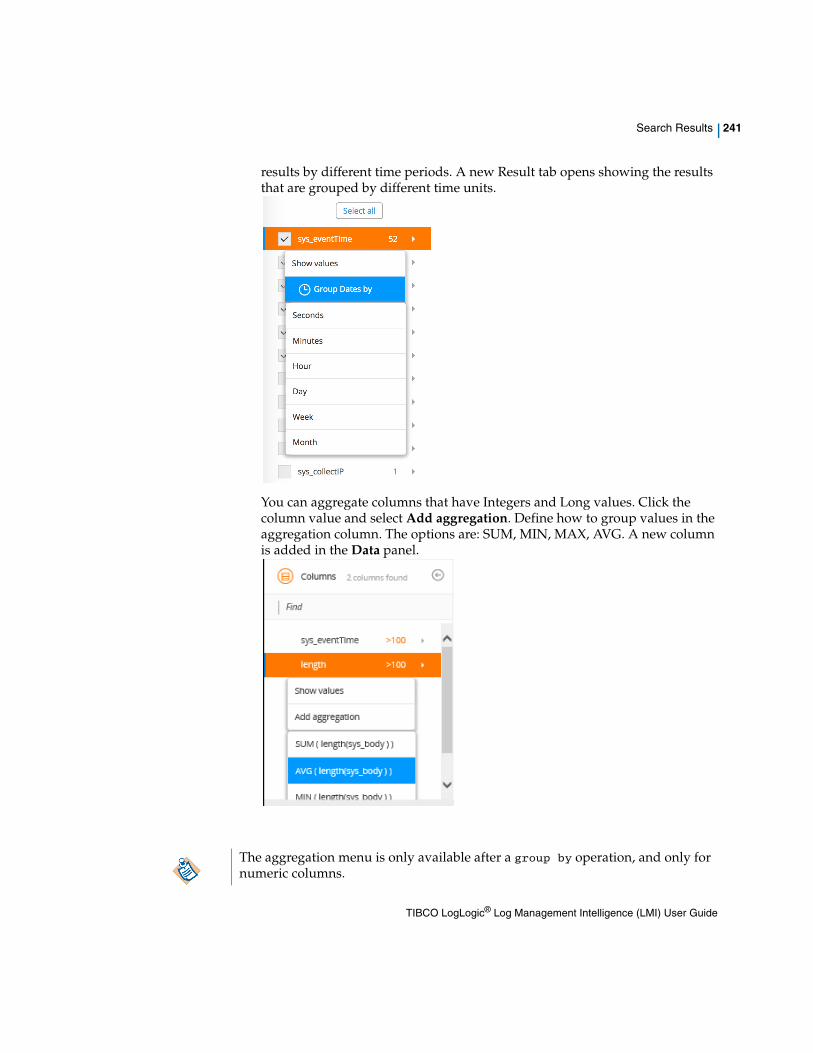
Search Results | 241
results by different time periods. A new Result tab opens showing the results that are grouped by different time units.
You can aggregate columns that have Integers and Long values. Click the column value and select Add aggregation. Define how to group values in the aggregation column. The options are: SUM, MIN, MAX, AVG. A new column is added in the Data panel.
The aggregation menu is only available after a group by operation, and only for numeric columns.
TIBCO LogLogic® Log Management Intelligence (LMI) User Guide
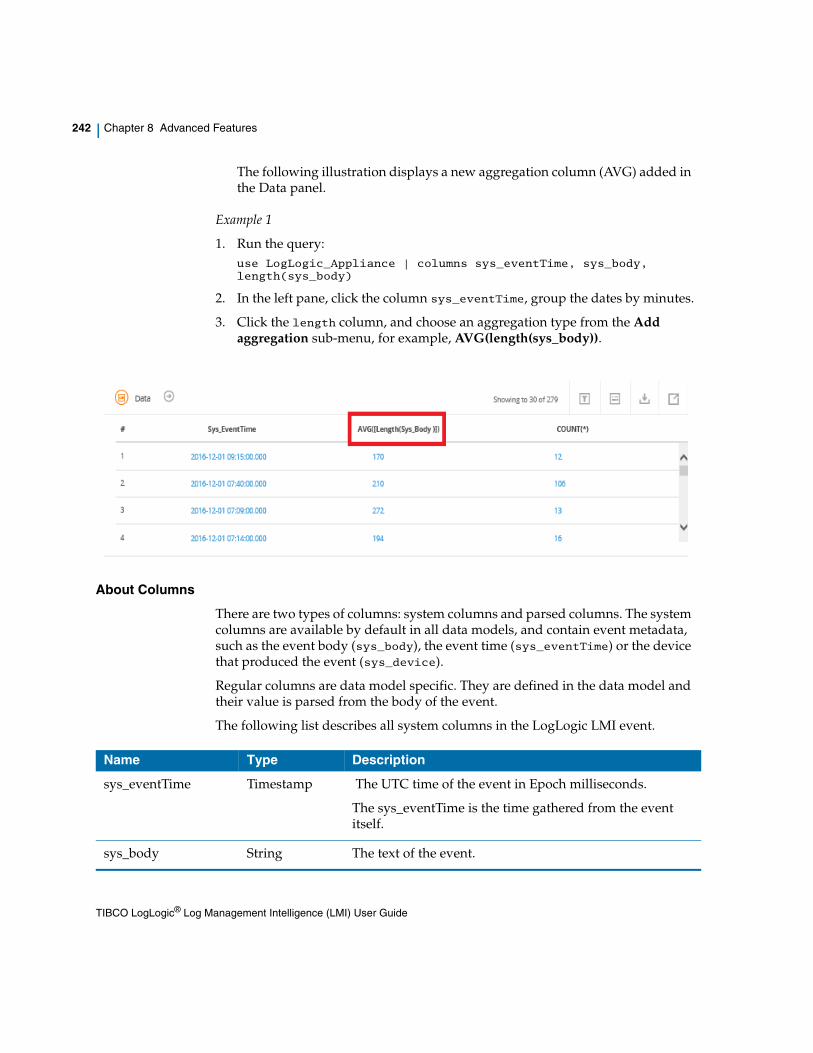
242 | Chapter 8 Advanced Features
The following illustration displays a new aggregation column (AVG) added in the Data panel.
Example 1
1. Run the query:use LogLogic_Appliance | columns sys_eventTime, sys_body, length(sys_body)
2. In the left pane, click the column sys_eventTime, group the dates by minutes.
3. Click the length column, and choose an aggregation type from the Add aggregation sub-menu, for example, AVG(length(sys_body)).
About Columns
There are two types of columns: system columns and parsed columns. The system columns are available by default in all data models, and contain event metadata, such as the event body (sys_body), the event time (sys_eventTime) or the device that produced the event (sys_device).
Regular columns are data model specific. They are defined in the data model and their value is parsed from the body of the event.
The following list describes all system columns in the LogLogic LMI event.
Name Type Description
sys_eventTime Timestamp The UTC time of the event in Epoch milliseconds.
The sys_eventTime is the time gathered from the event itself.
sys_body String The text of the event.
TIBCO LogLogic® Log Management Intelligence (LMI) User Guide
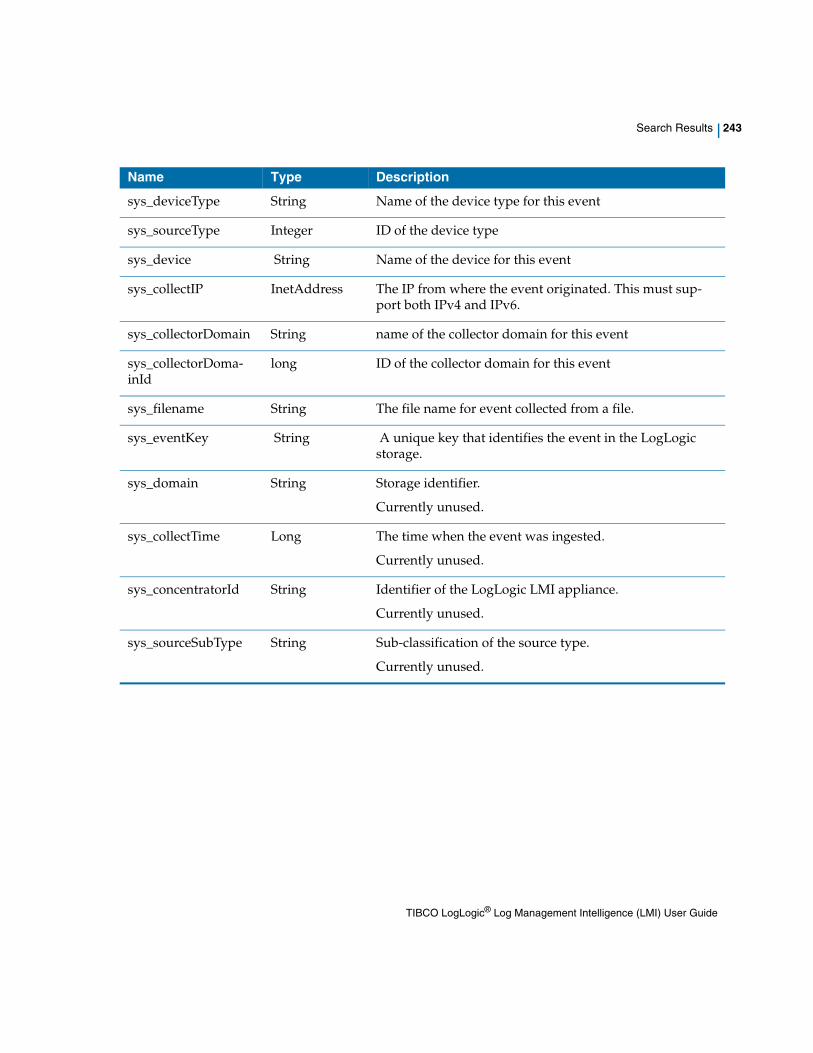
Search Results | 243
sys_deviceType String Name of the device type for this event
sys_sourceType Integer ID of the device type
sys_device String Name of the device for this event
sys_collectIP InetAddress The IP from where the event originated. This must sup-port both IPv4 and IPv6.
sys_collectorDomain String name of the collector domain for this event
sys_collectorDoma-inId
long ID of the collector domain for this event
sys_filename String The file name for event collected from a file.
sys_eventKey String A unique key that identifies the event in the LogLogic storage.
sys_domain String Storage identifier.
Currently unused.
sys_collectTime Long The time when the event was ingested.
Currently unused.
sys_concentratorId String Identifier of the LogLogic LMI appliance.
Currently unused.
sys_sourceSubType String Sub-classification of the source type.
Currently unused.
Name Type Description
TIBCO LogLogic® Log Management Intelligence (LMI) User Guide
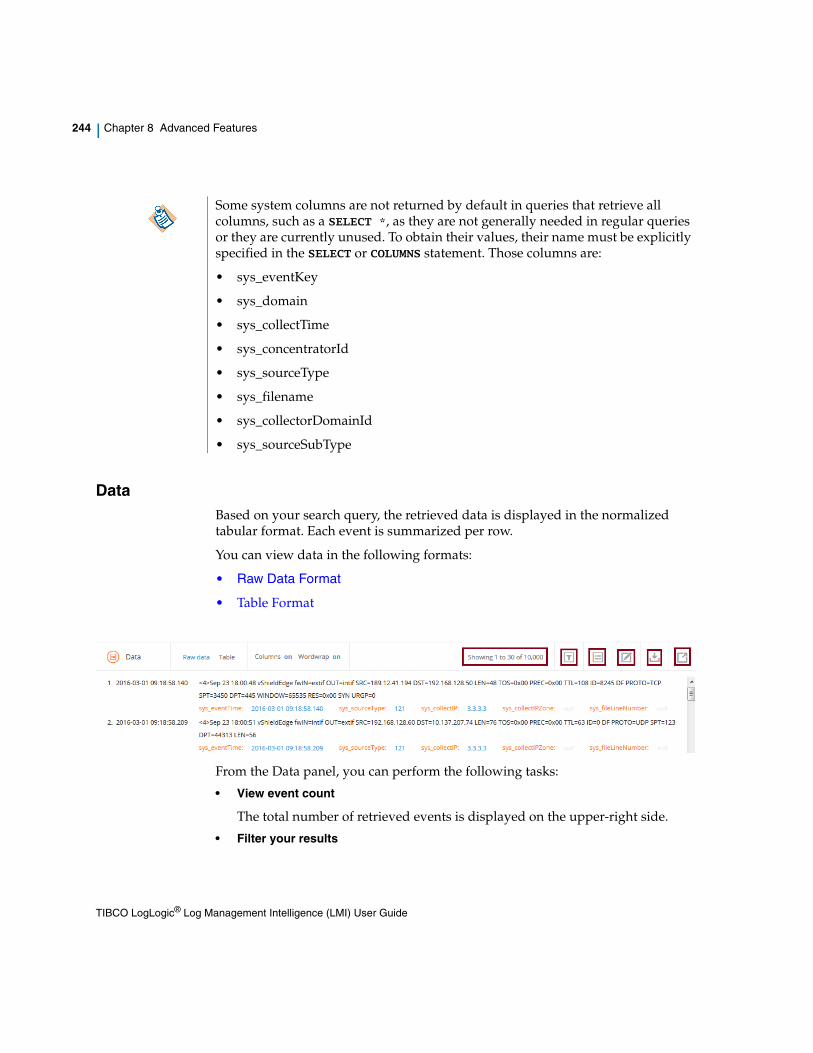
244 | Chapter 8 Advanced Features
DataBased on your search query, the retrieved data is displayed in the normalized tabular format. Each event is summarized per row.
You can view data in the following formats:
• Raw Data Format
• Table Format
From the Data panel, you can perform the following tasks:
• View event count
The total number of retrieved events is displayed on the upper-right side.
• Filter your results
Some system columns are not returned by default in queries that retrieve all columns, such as a SELECT *, as they are not generally needed in regular queries or they are currently unused. To obtain their values, their name must be explicitly specified in the SELECT or COLUMNS statement. Those columns are:
• sys_eventKey
• sys_domain
• sys_collectTime
• sys_concentratorId
• sys_sourceType
• sys_filename
• sys_collectorDomainId
• sys_sourceSubType
TIBCO LogLogic® Log Management Intelligence (LMI) User Guide
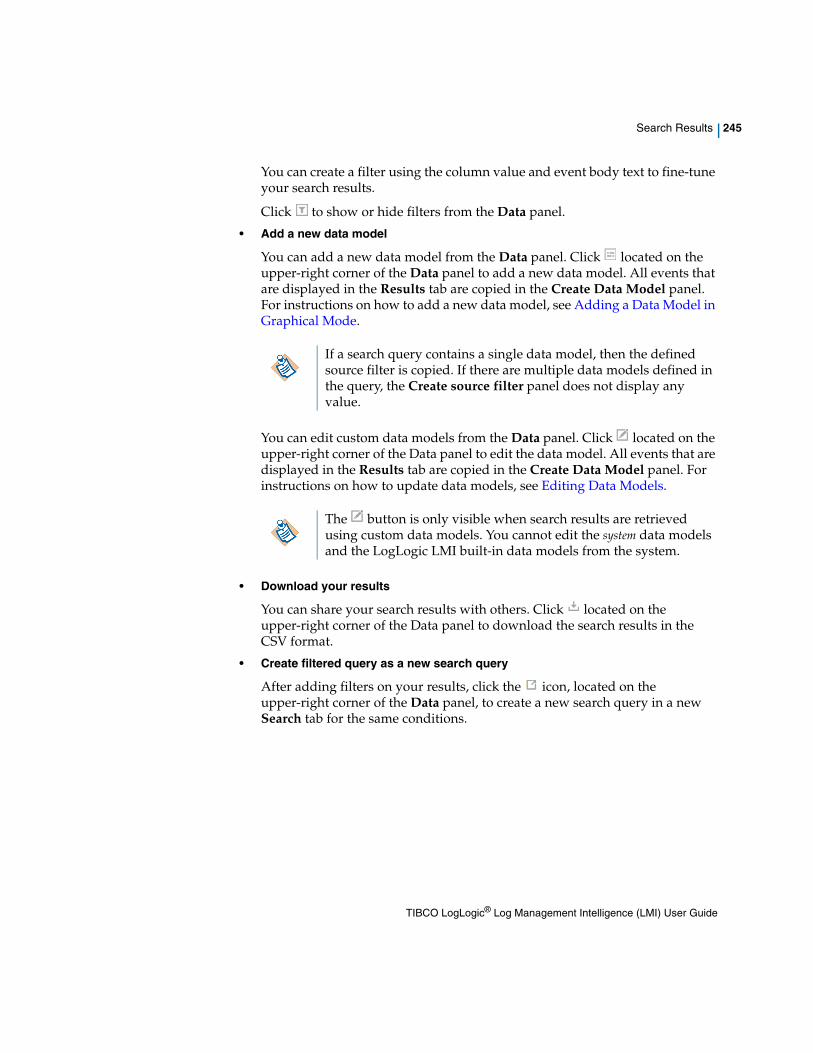
Search Results | 245
You can create a filter using the column value and event body text to fine-tune your search results.
Click to show or hide filters from the Data panel.
• Add a new data model
You can add a new data model from the Data panel. Click located on the upper-right corner of the Data panel to add a new data model. All events that are displayed in the Results tab are copied in the Create Data Model panel. For instructions on how to add a new data model, see Adding a Data Model in Graphical Mode.
You can edit custom data models from the Data panel. Click located on the upper-right corner of the Data panel to edit the data model. All events that are displayed in the Results tab are copied in the Create Data Model panel. For instructions on how to update data models, see Editing Data Models.
• Download your results
You can share your search results with others. Click located on the upper-right corner of the Data panel to download the search results in the CSV format.
• Create filtered query as a new search query
After adding filters on your results, click the icon, located on the upper-right corner of the Data panel, to create a new search query in a new Search tab for the same conditions.
If a search query contains a single data model, then the defined source filter is copied. If there are multiple data models defined in the query, the Create source filter panel does not display any value.
The button is only visible when search results are retrieved using custom data models. You cannot edit the system data models and the LogLogic LMI built-in data models from the system.
TIBCO LogLogic® Log Management Intelligence (LMI) User Guide
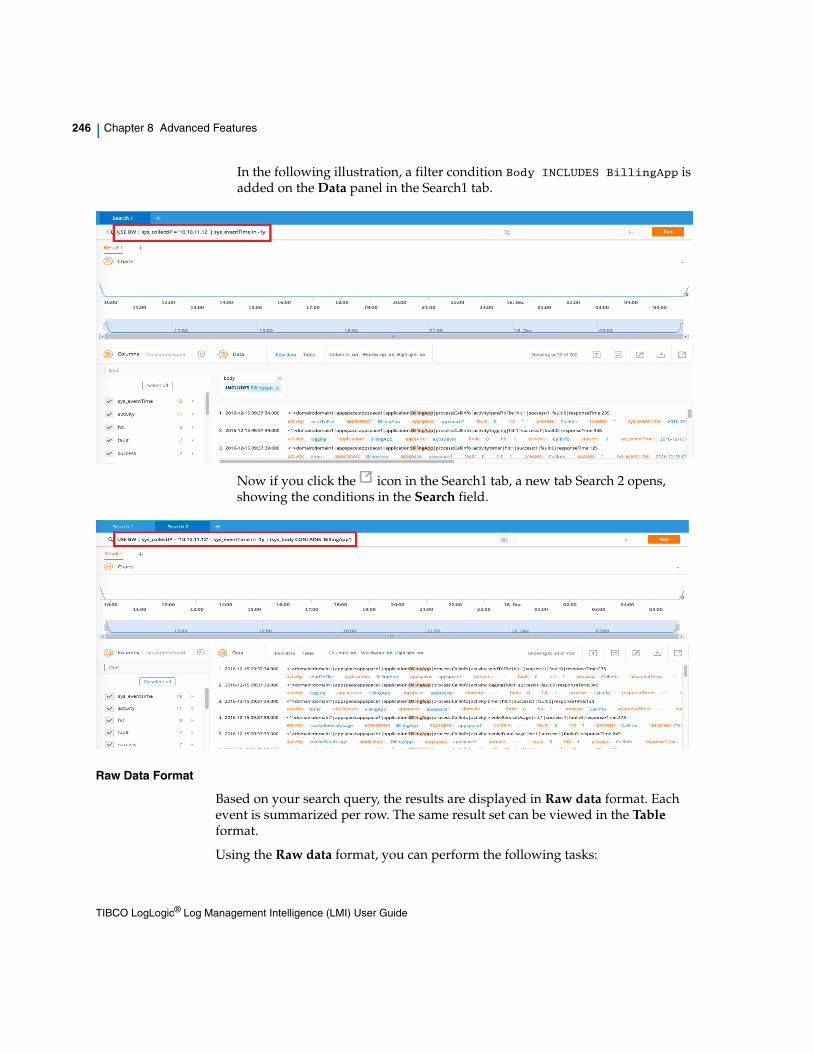
246 | Chapter 8 Advanced Features
In the following illustration, a filter condition Body INCLUDES BillingApp is added on the Data panel in the Search1 tab.
Now if you click the icon in the Search1 tab, a new tab Search 2 opens, showing the conditions in the Search field.
Raw Data Format
Based on your search query, the results are displayed in Raw data format. Each event is summarized per row. The same result set can be viewed in the Table format.
Using the Raw data format, you can perform the following tasks:
TIBCO LogLogic® Log Management Intelligence (LMI) User Guide
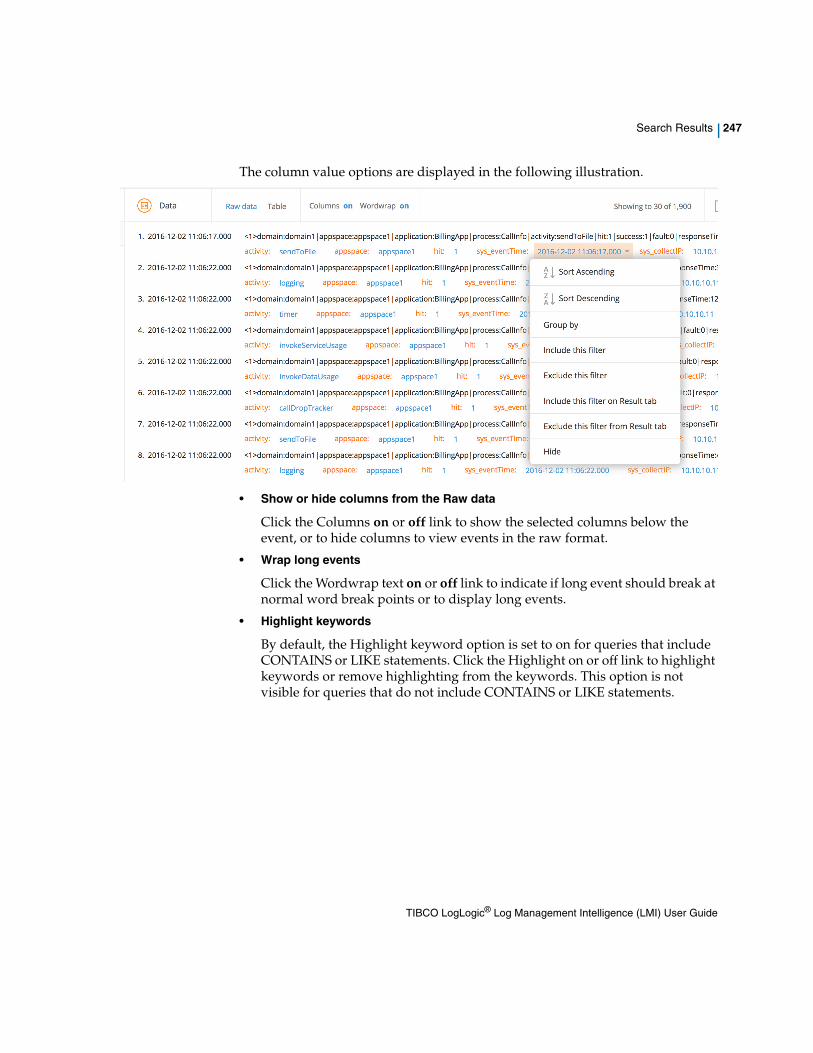
Search Results | 247
The column value options are displayed in the following illustration.
• Show or hide columns from the Raw data
Click the Columns on or off link to show the selected columns below the event, or to hide columns to view events in the raw format.
• Wrap long events
Click the Wordwrap text on or off link to indicate if long event should break at normal word break points or to display long events.
• Highlight keywords
By default, the Highlight keyword option is set to on for queries that include CONTAINS or LIKE statements. Click the Highlight on or off link to highlight keywords or remove highlighting from the keywords. This option is not visible for queries that do not include CONTAINS or LIKE statements.
TIBCO LogLogic® Log Management Intelligence (LMI) User Guide
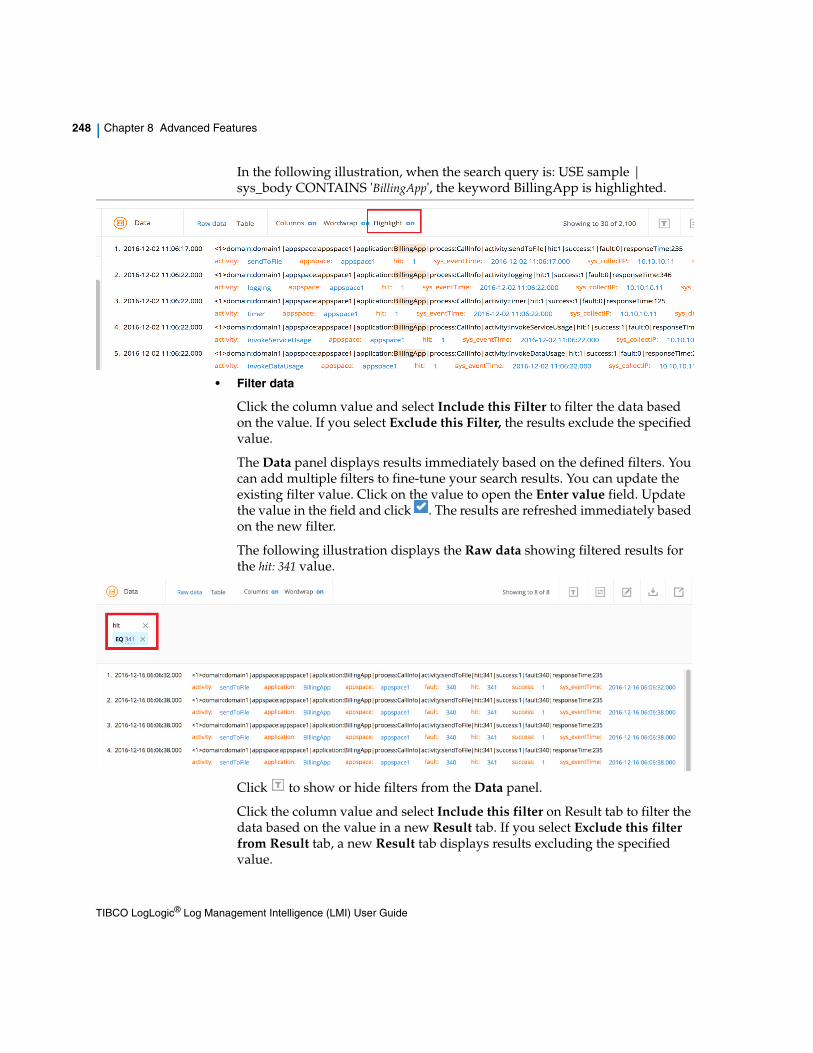
248 | Chapter 8 Advanced Features
In the following illustration, when the search query is: USE sample | sys_body CONTAINS 'BillingApp', the keyword BillingApp is highlighted.
• Filter data
Click the column value and select Include this Filter to filter the data based on the value. If you select Exclude this Filter, the results exclude the specified value.
The Data panel displays results immediately based on the defined filters. You can add multiple filters to fine-tune your search results. You can update the existing filter value. Click on the value to open the Enter value field. Update the value in the field and click . The results are refreshed immediately based on the new filter.
The following illustration displays the Raw data showing filtered results for the hit: 341 value.
Click to show or hide filters from the Data panel.
Click the column value and select Include this filter on Result tab to filter the data based on the value in a new Result tab. If you select Exclude this filter from Result tab, a new Result tab displays results excluding the specified value.
TIBCO LogLogic® Log Management Intelligence (LMI) User Guide
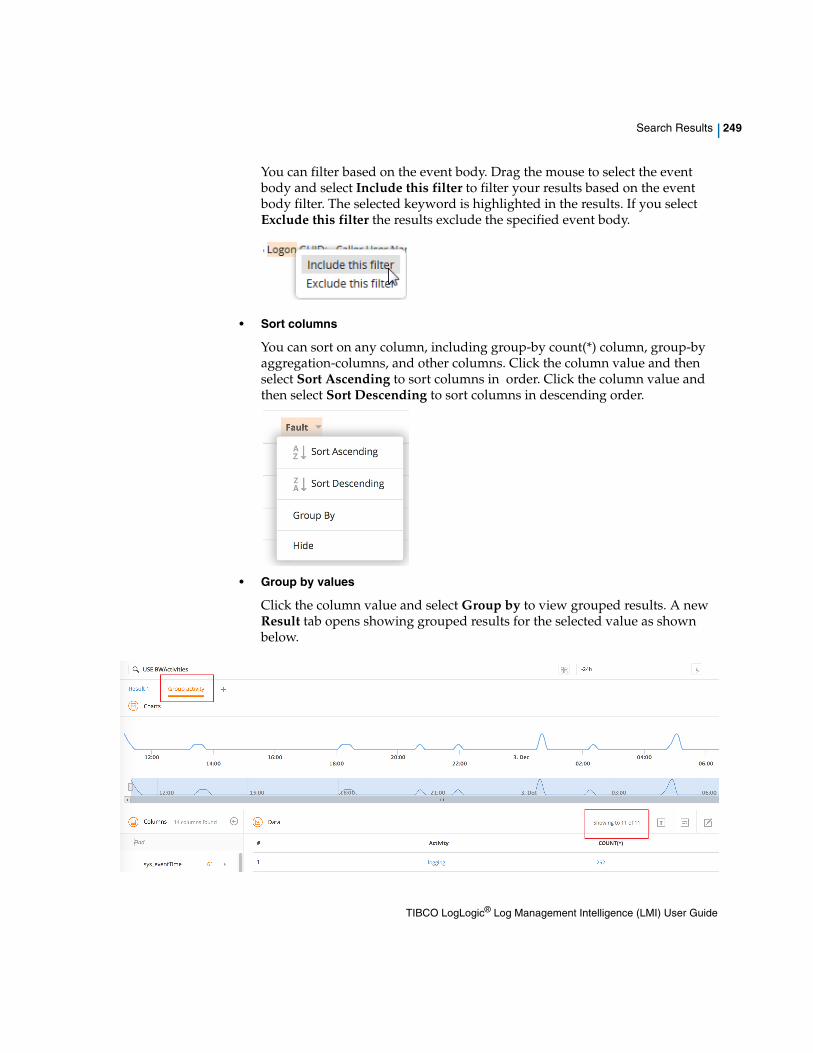
Search Results | 249
You can filter based on the event body. Drag the mouse to select the event body and select Include this filter to filter your results based on the event body filter. The selected keyword is highlighted in the results. If you select Exclude this filter the results exclude the specified event body.
• Sort columns
You can sort on any column, including group-by count(*) column, group-by aggregation-columns, and other columns. Click the column value and then select Sort Ascending to sort columns in order. Click the column value and then select Sort Descending to sort columns in descending order.
• Group by values
Click the column value and select Group by to view grouped results. A new Result tab opens showing grouped results for the selected value as shown below.
TIBCO LogLogic® Log Management Intelligence (LMI) User Guide
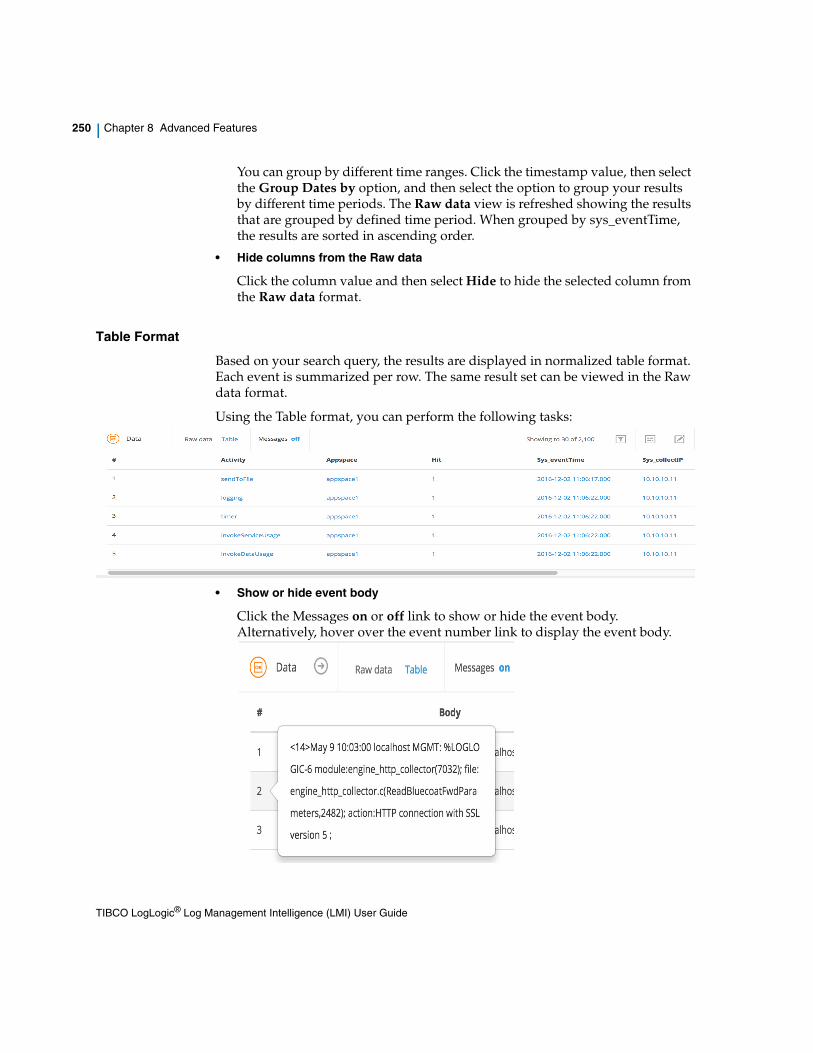
250 | Chapter 8 Advanced Features
You can group by different time ranges. Click the timestamp value, then select the Group Dates by option, and then select the option to group your results by different time periods. The Raw data view is refreshed showing the results that are grouped by defined time period. When grouped by sys_eventTime, the results are sorted in ascending order.
• Hide columns from the Raw data
Click the column value and then select Hide to hide the selected column from the Raw data format.
Table Format
Based on your search query, the results are displayed in normalized table format. Each event is summarized per row. The same result set can be viewed in the Raw data format.
Using the Table format, you can perform the following tasks:
• Show or hide event body
Click the Messages on or off link to show or hide the event body. Alternatively, hover over the event number link to display the event body.
TIBCO LogLogic® Log Management Intelligence (LMI) User Guide
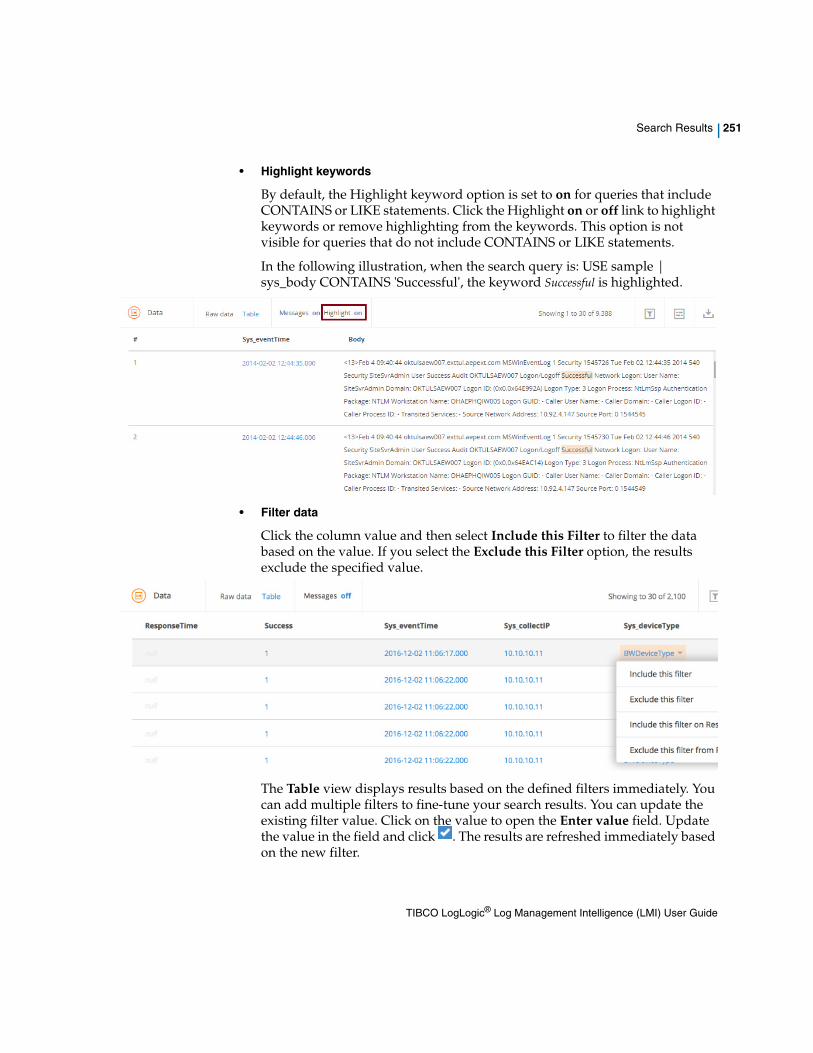
Search Results | 251
• Highlight keywords
By default, the Highlight keyword option is set to on for queries that include CONTAINS or LIKE statements. Click the Highlight on or off link to highlight keywords or remove highlighting from the keywords. This option is not visible for queries that do not include CONTAINS or LIKE statements.
In the following illustration, when the search query is: USE sample | sys_body CONTAINS 'Successful', the keyword Successful is highlighted.
• Filter data
Click the column value and then select Include this Filter to filter the data based on the value. If you select the Exclude this Filter option, the results exclude the specified value.
The Table view displays results based on the defined filters immediately. You can add multiple filters to fine-tune your search results. You can update the existing filter value. Click on the value to open the Enter value field. Update the value in the field and click . The results are refreshed immediately based on the new filter.
TIBCO LogLogic® Log Management Intelligence (LMI) User Guide
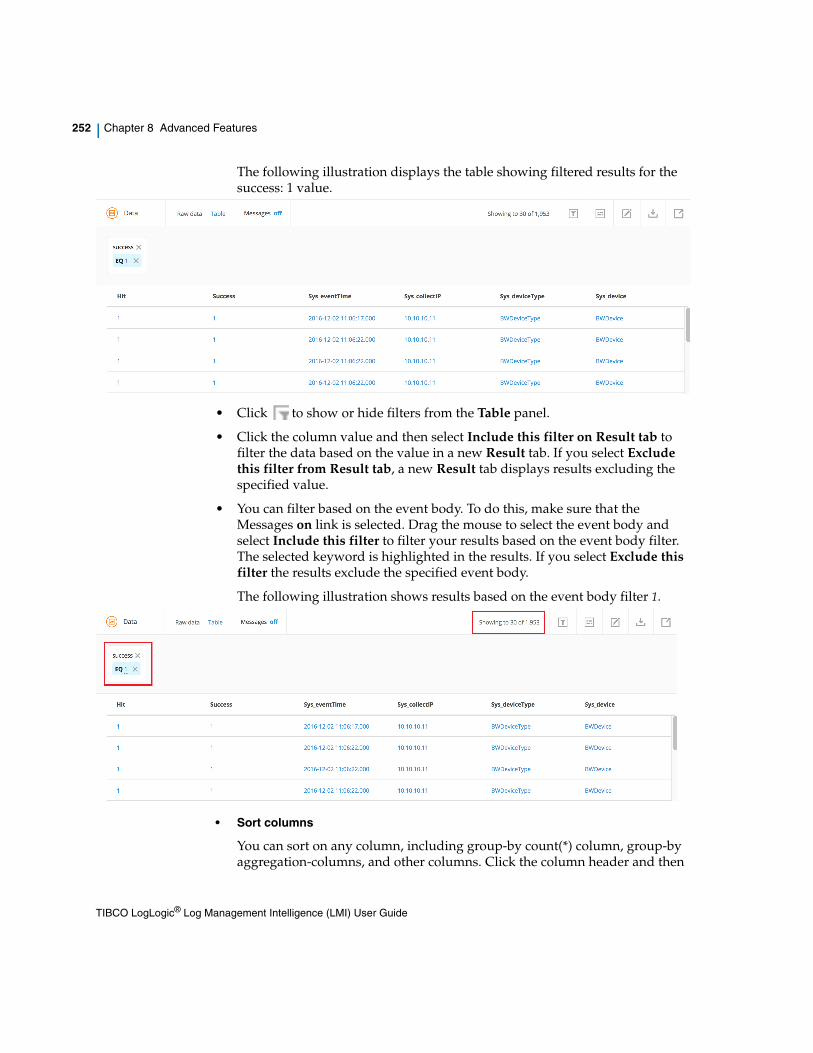
252 | Chapter 8 Advanced Features
The following illustration displays the table showing filtered results for the success: 1 value.
• Click to show or hide filters from the Table panel.
• Click the column value and then select Include this filter on Result tab to filter the data based on the value in a new Result tab. If you select Exclude this filter from Result tab, a new Result tab displays results excluding the specified value.
• You can filter based on the event body. To do this, make sure that the Messages on link is selected. Drag the mouse to select the event body and select Include this filter to filter your results based on the event body filter. The selected keyword is highlighted in the results. If you select Exclude this filter the results exclude the specified event body.
The following illustration shows results based on the event body filter 1.
• Sort columns
You can sort on any column, including group-by count(*) column, group-by aggregation-columns, and other columns. Click the column header and then
TIBCO LogLogic® Log Management Intelligence (LMI) User Guide
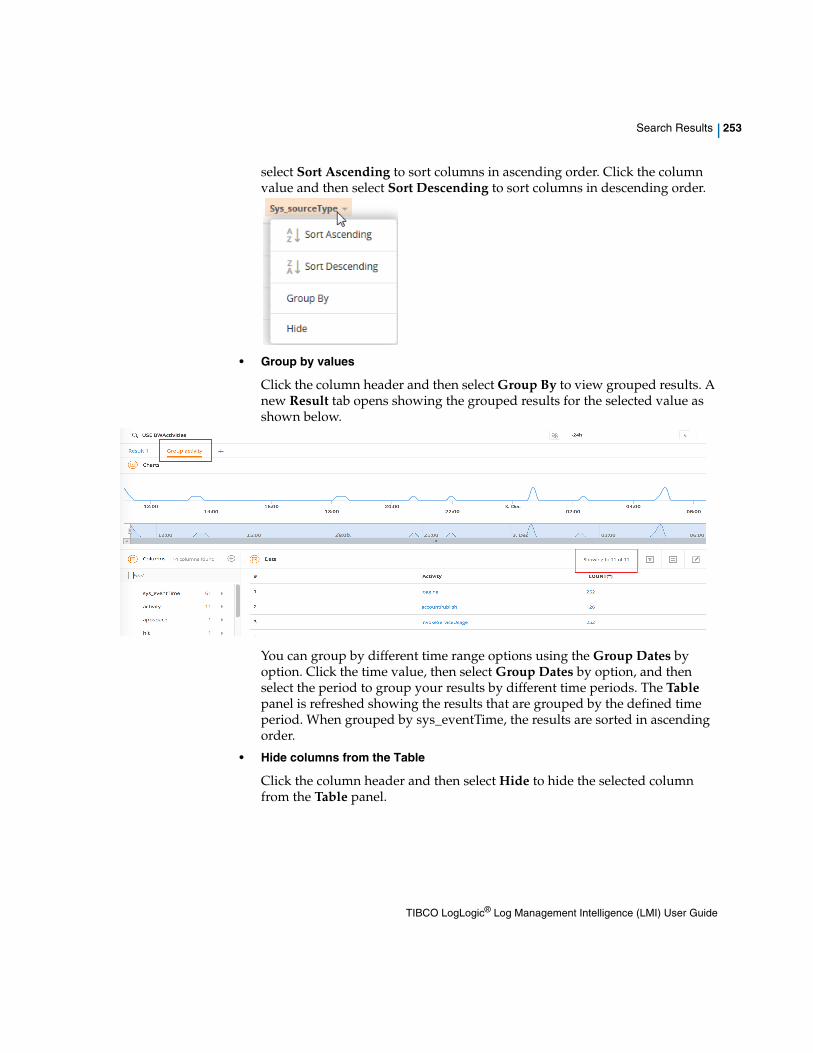
Search Results | 253
select Sort Ascending to sort columns in ascending order. Click the column value and then select Sort Descending to sort columns in descending order.
• Group by values
Click the column header and then select Group By to view grouped results. A new Result tab opens showing the grouped results for the selected value as shown below.
You can group by different time range options using the Group Dates by option. Click the time value, then select Group Dates by option, and then select the period to group your results by different time periods. The Table panel is refreshed showing the results that are grouped by the defined time period. When grouped by sys_eventTime, the results are sorted in ascending order.
• Hide columns from the Table
Click the column header and then select Hide to hide the selected column from the Table panel.
TIBCO LogLogic® Log Management Intelligence (LMI) User Guide
254 | Chapter 8 Advanced Features
About Bloks
To analyze your data faster, you can create different types of Bloks in LogLogic LMI to help you accelerate your search process.
A Blok is a contextual element or filter that fits with other elements to form a search query. Build and save different Bloks that can be used in future searches rather than searching every time with the same filter. Bloks are reusable elements of a query. You can combine any types of Bloks together to create complex queries.
LogLogic LMI supports the following types of Bloks:
• Filter Bloks: contain filter statements, aggregation rules
• Time Bloks: contain absolute and relative time ranges
You can have one or more filters in a Blok. If you realize that you need to add another filter to the existing Blok, you can add more filters and build another Blok.
You can add new Bloks and modify existing Bloks from the Search tab. Similarly, you can manage all types of Bloks. On the toolbar, click the Management > Bloks menu.
When entering a Blok name in the Search field, start with the prefix defined for each type of Blok as listed below. Content assist can help you by showing all possible values for that type of Blok.
• time.Blok name
• filter.Blok name
For example, create a Blok and use it in a search query:
• Create and save a filter Blok that has user='joe' AND body like '%security%'. Now when you run a query using this Blok, only events with "joe and security" will be retrieved.
• Use this filter Blok and add another element or filter to it, for example, type user='John' to the same query to create a more complex query. For example, filter Blok AND user='John'. Now when you run a query using this Blok, events with "joe and security and john" will be retrieved.
Filter BloksYou can create filter Bloks that contain one or more filters. Each filter comprises one or more terms. A filter Blok supports valid EQL or SQL statements.
TIBCO LogLogic® Log Management Intelligence (LMI) User Guide
About Bloks | 255
You can have one or more filters in a Blok. If you realize that you need to add another filter to the existing Blok, you can add more filters and build another Blok. Multiple Bloks of different types can be used in a single search query. For detailed information on how to create a Blok, see Adding a Blok.
When entering the Blok name in the Search field, start with the prefix filter for any existing filter Blok. Content assist can help you by showing all possible values for that type of Blok. For detailed information about valid filters, see FILTER Statement.
Viewing All BloksThe default or existing Bloks can be easily used to quickly search your data. The default Bloks have preset values. You cannot modify or delete the default Bloks. However, you can update or delete any custom Bloks.
Procedure
1. From the Search page, click located next to the Search field, and select Choose Blok.
2. Select the type of Blok from the list. The options are All, Filter, and Time Bloks.
3. In the Find field, type the Blok name to quickly find the desired Blok.
4. Select the Blok name from the list of Bloks. The Description and Source statement fields are auto-populated based on the selected Blok.
5. Click OK to add the Blok in the Search field. If you select a time Blok, it is displayed in the Time field.
6. Click to view results for the defined Blok.
Adding a BlokIf you usually search for events that provide you with specific information such as user name or severity, you can create a custom Blok for that criteria and save it for later use.
Procedure
1. From the Search page, click located next to the Search field, and select next to the Search field, and select New Blok.
2. Select the Blok type from the list.
TIBCO LogLogic® Log Management Intelligence (LMI) User Guide
256 | Chapter 8 Advanced Features
3. Enter the name of the Blok in the Name field. It must be a unique name that consists of a single word with no special characters. This is a mandatory field.
4. Enter the description of the Blok in the Description field.
5. Enter the statement of the source in the Source statement field. Make sure to enter a valid syntax. Filter and Time Bloks support EQL and SQL syntax. For syntax information, see Search Syntax Reference.
6. Click Save to save the new Blok. The new Blok is added in the Choose Blok list and is displayed in the Search field.
Modifying BloksYou can modify the user-defined custom Bloks at any time. You cannot modify default Bloks. Similarly, you cannot update system generated filter Bloks that have aggregation rule associated.
Procedure
1. From the Search page, update the statement in the Search field. Content assist shows you contextual matches and completions for each keyword as you type into the Search field. For syntax information, see Search Syntax Reference.
2. Click located next to the Search field and select Save as Blok.
3. Update the information. For information about each field, see Adding a Blok.
4. Click Save to save the Blok as a new Blok. The new Blok is added in the Choose Blok list and is displayed in the Search field.
Deleting BloksYou can delete the user-defined custom Bloks at any time. You cannot delete default Bloks. Once the Blok is deleted, active queries are not affected, but you cannot start a new query with a deleted Blok. Queries in the Search > History tab that use the selected Blok cannot be started again..
Procedure
1. On the toolbar, click the Management > Bloks menu.
2. On the Blok management page, select the check box located next to the Blok name that you want to delete and click . You can select one or more Bloks.
3. In the confirmation window, click Ok to delete the selected Blok. The Blok management page is updated immediately.
TIBCO LogLogic® Log Management Intelligence (LMI) User Guide
About Bloks | 257
Time BloksAnalyzing events based on a certain time range can help correlate results and find the root cause faster. You can narrow your search results to a specific time range using the Time Blok. You can use the preset time Blok or create your custom time Blok that you can use any time.
Each time Blok is translated in a statement before executing the query. When entering the time Blok name in the Search field, start with the prefix time for any existing time Blok. You can use Content Assist to see all possible values for that type of Blok. For detailed information on how to create a time Blok, see Adding a Time Blok.
By default, the time range is set to last hour. You can define the absolute or relative time. For valid time ranges, see Time Range Expressions.
Viewing All Time Bloks
The default or existing time Bloks can be easily used to quickly search your data. The default time Bloks have preset time ranges. You cannot modify or delete the default time Bloks. However, you can update or delete user-defined time Bloks.
Procedure
1. From the Search page, click located next to the Time field, and select Choose Blok.
2. In the Find field, type the Blok name to quickly find the desired time Blok.
3. Select the Blok name from the list of Bloks. The Description and Source statement fields will be auto-populated based on the selected Blok.
4. Click Save to add the Blok in the Time field.The selected time Blok is displayed in the Time field.
5. Click to view results for the defined time range.
Adding a Time Blok
If you usually search for events that are in the specific time range, you can create a custom time Blok for that time range and save it for later use.
Procedure
1. From the Search page, click located next to the Time field and click Select a date range to open a window.
2. Specify the date and time in the From and To fields. Time must be in Hours and Minutes and click OK. The selected date and time range is displayed in the Time field. Alternatively, type in the time expression in the Time field.
TIBCO LogLogic® Log Management Intelligence (LMI) User Guide
258 | Chapter 8 Advanced Features
Content Assist shows you typeahead or contextual matches and completions for each keyword as you type it into the search field. To define a valid time statement, see Time Range Expressions.
3. To save a new time Blok, click next to the Time field and select Save as Blok. Alternatively, to add a new Blok, select New Blok.
4. In the Add new Blok window, enter the information in the following fields:
a. Name: Enter the name of the Blok. It must be a unique name that consists of a single word with no special characters. This is a mandatory field.
b. Description: Enter the description of the Blok.
c. Source Statement: The statement of the source (time expression).
5. Click Save to save the new time Blok. The new time Blok is added in the Choose Blok list.
Modifying Time Bloks
You can modify the custom time Bloks at any time. You cannot modify default time Bloks.
Procedure
1. From the Search tab, update the time range expression in the Time field. For detailed information about valid time statements, see Time Range Expressions.
2. To save a new time Blok or update the existing Blok, click next to the Time field and select Save as Blok.
3. Update the information. For information about each field, see Adding a Time Blok.
4. Click Save to save the new time Blok. The new time Blok is added in the Choose Blok list.
Manage BloksA Blok is a contextual element or filter that fits with other elements to form a search query. Build and save different Bloks that can be used in future searches rather than searching every time with the same filter.
For detailed information on how to search using Bloks, see About Bloks.
You can manage all types of Bloks using the Blok management page.
On the toolbar, click the Management > Bloks. From the Blok management page, you can perform the following tasks:
TIBCO LogLogic® Log Management Intelligence (LMI) User Guide
About Bloks | 259
• Find Bloks
You can quickly find the desired Blok by typing the Blok name in the Find field. As you start typing the Blok name in the Find field, the Blok management page is automatically refreshed showing your selection.
• View Bloks based on filters
You can use filters to easily find Bloks. Click the View list to view all Bloks in the system.
• Sort Bloks
You can sort any column in ascending or descending order. Click on the column name or click the arrow (that is displayed on the right side of the column name when you click in the column) to sort the column.
• Add a new Blok
Click to add a new Blok. For instructions, see Adding a Blok.
• Edit existing Bloks
Select the Blok name that you want to update. The Details panel opens on the right side of the page. Click the Edit link to update. For instructions, see Modifying Bloks.
You must update the aggregation rule to update the corresponding filter Blok.
• Duplicate existing Bloks
Select the Blok name that you want to copy by selecting the check box located next to the Name column and click to copy the Blok. Enter the new name in the Name field and click OK. You can now modify the Blok as per your need.
• Delete Bloks
You can delete single or multiple Bloks. For instructions, see Deleting Bloks.
• Show or hide columns
You can show or hide columns, except the mandatory column, from the table . Click to view all available columns in the table. Select the check box to show the column. Clear the check box to hide the column from the table. The Blok management page is updated immediately.
You cannot update system generated filter Bloks that have aggregation rule associated.
The Duplicate button is enabled after you select a Blok from the list.
TIBCO LogLogic® Log Management Intelligence (LMI) User Guide
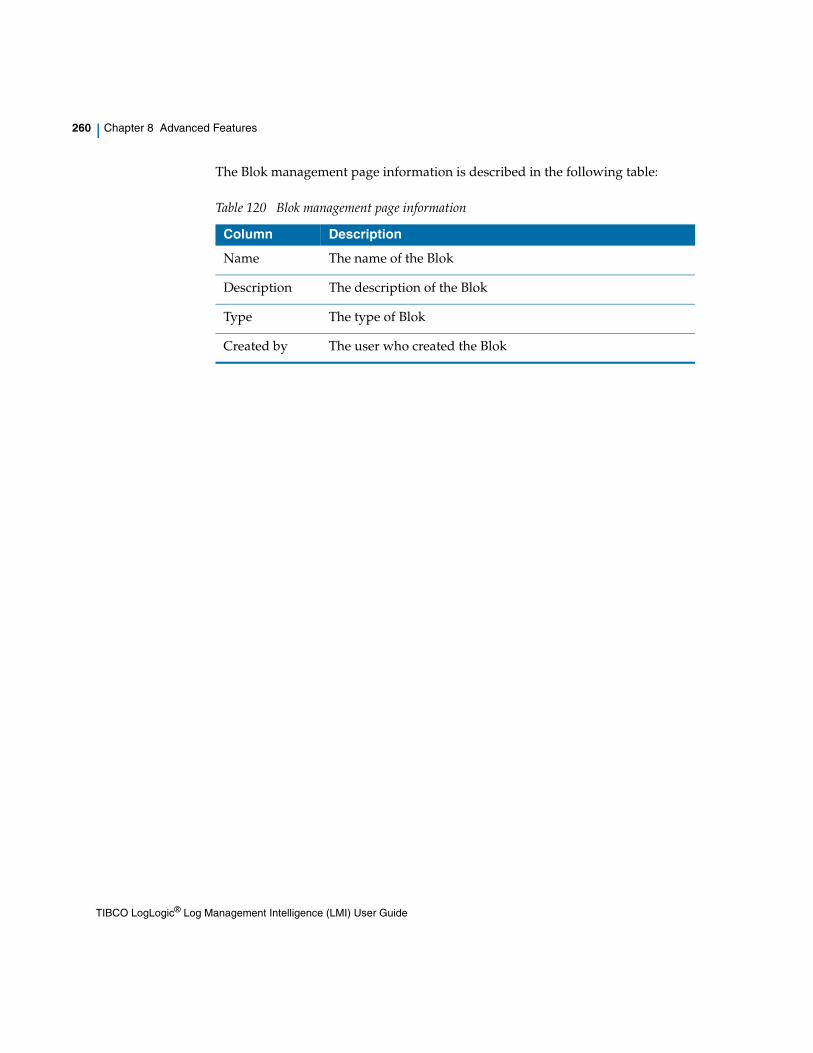
260 | Chapter 8 Advanced Features
The Blok management page information is described in the following table:
Table 120 Blok management page information
Column Description
Name The name of the Blok
Description The description of the Blok
Type The type of Blok
Created by The user who created the Blok
TIBCO LogLogic® Log Management Intelligence (LMI) User Guide
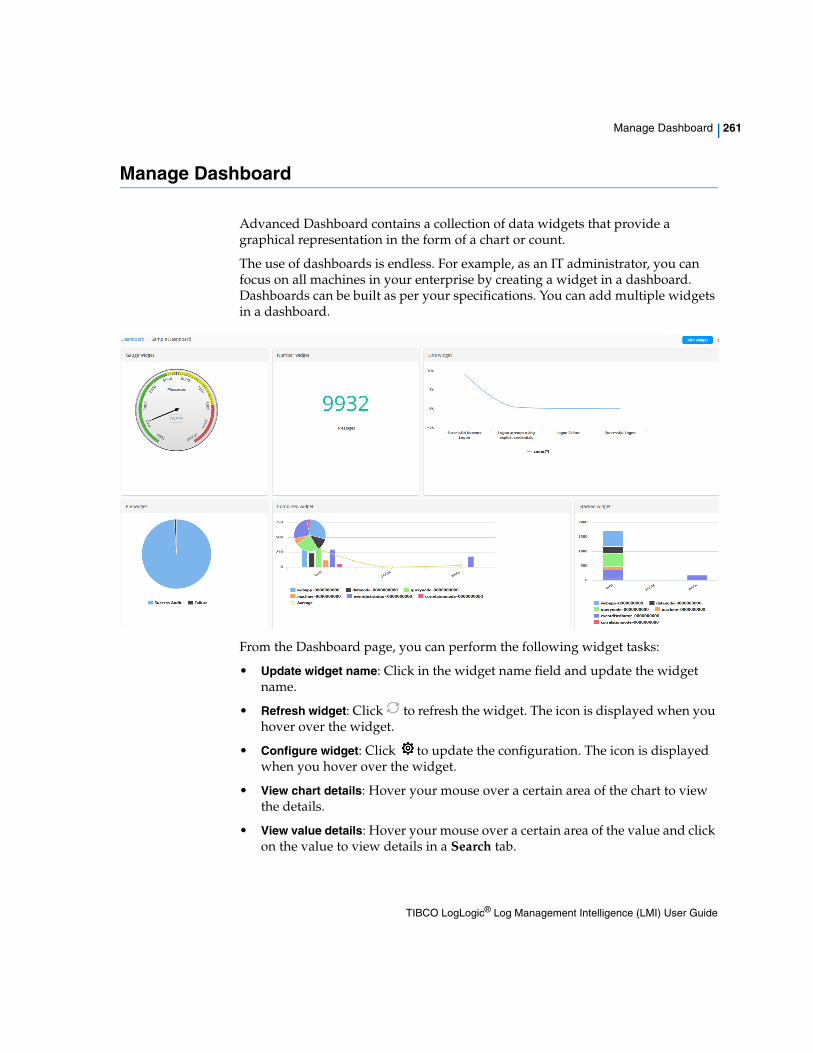
Manage Dashboard | 261
Manage Dashboard
Advanced Dashboard contains a collection of data widgets that provide a graphical representation in the form of a chart or count.
The use of dashboards is endless. For example, as an IT administrator, you can focus on all machines in your enterprise by creating a widget in a dashboard. Dashboards can be built as per your specifications. You can add multiple widgets in a dashboard.
From the Dashboard page, you can perform the following widget tasks:
• Update widget name: Click in the widget name field and update the widget name.
• Refresh widget: Click to refresh the widget. The icon is displayed when you hover over the widget.
• Configure widget: Click to update the configuration. The icon is displayed when you hover over the widget.
• View chart details: Hover your mouse over a certain area of the chart to view the details.
• View value details: Hover your mouse over a certain area of the value and click on the value to view details in a Search tab.
TIBCO LogLogic® Log Management Intelligence (LMI) User Guide
262 | Chapter 8 Advanced Features
• Remove widget: Click to delete widget from the dashboard. The icon is displayed when you hover over the widget.
• Add new widget: Click to add a new widget. For instructions, see Adding Widgets to a Dashboard.
• Mark as a favorite dashboard: Click to mark as a favorite dashboard. A icon indicates that the dashboard is marked as favorite.
Viewing DashboardsYou can view all dashboards, add a new dashboard, copy an existing dashboard, or delete any dashboard in the system.
On the toolbar, click the Dashboard link located on the upper-right corner on the main header. The Dashboard page displays all existing dashboards in the system. From the Dashboard page, you can perform the following tasks:
• Filter dashboards
You can quickly find the desired dashboard by typing the dashboard name in the Find field. As you start typing a dashboard name in the Find field, the Dashboard page is automatically refreshed showing your selection.
• View dashboard based on filters
You can use filters to easily find dashboards in the system. Click the View list to view different filters.
• Sort dashboards
You can sort the Name column in ascending or descending order on the Dashboard page. Click the column name or click the arrow (that is displayed on the right side of the column name when you click in that column) to sort the column.
• Show or hide columns
You can show or hide columns, except the mandatory column, from the table . Click to view all available columns in the table. Select the check box to show the column. Clear the check box to hide the column from the table. The Dashboard page is updated immediately.
TIBCO LogLogic® Log Management Intelligence (LMI) User Guide
Manage Dashboard | 263
The Dashboard page information is described in the following table:
Adding Widgets to a DashboardYou can create a new dashboard with multiple widgets based on your specifications.
Procedure
1. On the main header, click the Dashboard link to display the Dashboard landing page.
2. From the Dashboard page, click to add a new dashboard.
3. To define the dashboard name, click on the Untitled dashboard link to open a field and enter the name of the dashboard in the field.
4. From the Widget type panel, click on a type of widget that you want to add on the dashboard. The following widget types are available:
— Line: provides results in the form of a line chart
— Bar: provides results in the form of a bar chart
— Pie: provides results in the form of a pie chart
— Number: provides a total count of the results
— Gauge: provides a total count of the results
— Stacked Column: provides comparison in the form of a column chart
— Combined: provides combination results in the form of pie, column, and line chart
Table 121 Dashboard page information
Column Description
Name The name of the dashboard.
Click on the icon to mark as favorite. A icon indicates that the dashboard is marked as favorite.
Created by The name of the user who created the dashboard.
Date created The date and time when the dashboard was first created.
Last edited The date and time when the dashboard was last updated.
TIBCO LogLogic® Log Management Intelligence (LMI) User Guide
264 | Chapter 8 Advanced Features
5. To define the widget name, click on the Untitled widget link to open a field and enter the name of the widget in the field.
6. To configure each type of widget, click the Configure link or click . The Settings icon is displayed on the upper-right corner when you hover over the widget panel. The configuration options are different for each type of widget.
For more information about each widget type, see:
— Line Widget
— Bar Widget
— Pie Widget
— Number Widget
— Gauge Widget
— Stacked Column Widget
— Combined Widget
7. Click Save to save the widget.
The widget is added and the retrieved results are displayed on the dashboard.
Line Widget
This widget is used to show the distribution of the total count of one selected column over its distinct values.
By using the columns with large content, the content can become unreadable on a widget, for example, using sys_body on the X-axis while using a Bar Chart widget.
Field Description
Query Enter a search query. Enter USE to start an EQL statement and SELECT to start an SQL statement. You can search based on filter and time Bloks as well.
Time You can enter absolute and relative time ranges. Click to open a window that allows you to define a time range. For example, enter -5h to display results that occur in the last 5 hours.
X-axis Define the column name. If the column names are already defined in the search query, the X-axis column is auto-populated. Otherwise, as you start typing in the field, the available matching column names are displayed. Choose the column name to define the X-axis of the line chart.
TIBCO LogLogic® Log Management Intelligence (LMI) User Guide
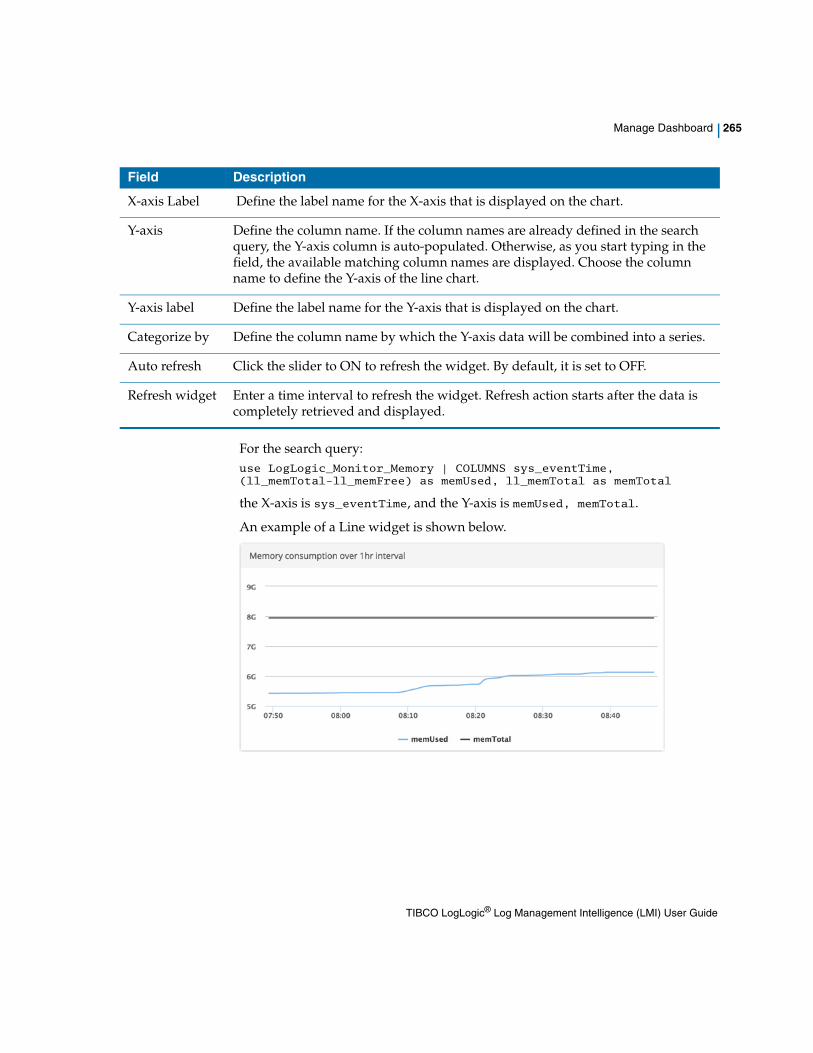
Manage Dashboard | 265
For the search query: use LogLogic_Monitor_Memory | COLUMNS sys_eventTime, (ll_memTotal-ll_memFree) as memUsed, ll_memTotal as memTotal
the X-axis is sys_eventTime, and the Y-axis is memUsed, memTotal.
An example of a Line widget is shown below.
X-axis Label Define the label name for the X-axis that is displayed on the chart.
Y-axis Define the column name. If the column names are already defined in the search query, the Y-axis column is auto-populated. Otherwise, as you start typing in the field, the available matching column names are displayed. Choose the column name to define the Y-axis of the line chart.
Y-axis label Define the label name for the Y-axis that is displayed on the chart.
Categorize by Define the column name by which the Y-axis data will be combined into a series.
Auto refresh Click the slider to ON to refresh the widget. By default, it is set to OFF.
Refresh widget Enter a time interval to refresh the widget. Refresh action starts after the data is completely retrieved and displayed.
Field Description
TIBCO LogLogic® Log Management Intelligence (LMI) User Guide
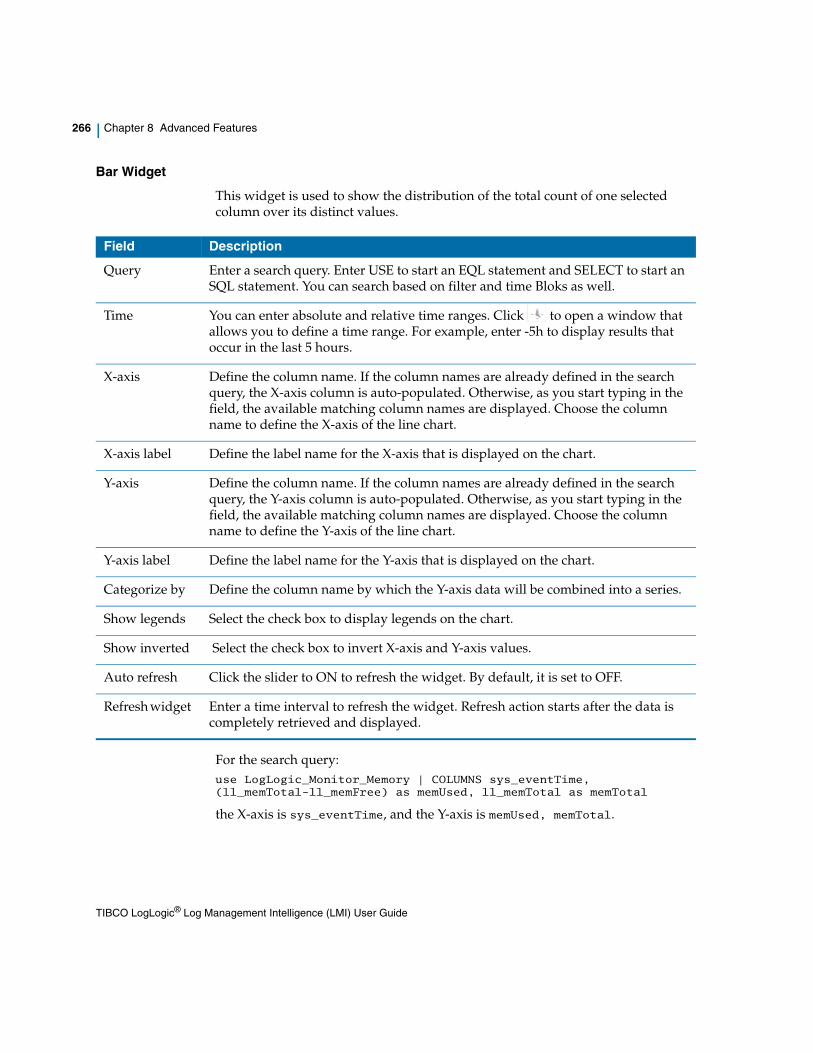
266 | Chapter 8 Advanced Features
Bar Widget
This widget is used to show the distribution of the total count of one selected column over its distinct values.
For the search query: use LogLogic_Monitor_Memory | COLUMNS sys_eventTime, (ll_memTotal-ll_memFree) as memUsed, ll_memTotal as memTotal
the X-axis is sys_eventTime, and the Y-axis is memUsed, memTotal.
Field Description
Query Enter a search query. Enter USE to start an EQL statement and SELECT to start an SQL statement. You can search based on filter and time Bloks as well.
Time You can enter absolute and relative time ranges. Click to open a window that allows you to define a time range. For example, enter -5h to display results that occur in the last 5 hours.
X-axis Define the column name. If the column names are already defined in the search query, the X-axis column is auto-populated. Otherwise, as you start typing in the field, the available matching column names are displayed. Choose the column name to define the X-axis of the line chart.
X-axis label Define the label name for the X-axis that is displayed on the chart.
Y-axis Define the column name. If the column names are already defined in the search query, the Y-axis column is auto-populated. Otherwise, as you start typing in the field, the available matching column names are displayed. Choose the column name to define the Y-axis of the line chart.
Y-axis label Define the label name for the Y-axis that is displayed on the chart.
Categorize by Define the column name by which the Y-axis data will be combined into a series.
Show legends Select the check box to display legends on the chart.
Show inverted Select the check box to invert X-axis and Y-axis values.
Auto refresh Click the slider to ON to refresh the widget. By default, it is set to OFF.
Refresh widget Enter a time interval to refresh the widget. Refresh action starts after the data is completely retrieved and displayed.
TIBCO LogLogic® Log Management Intelligence (LMI) User Guide
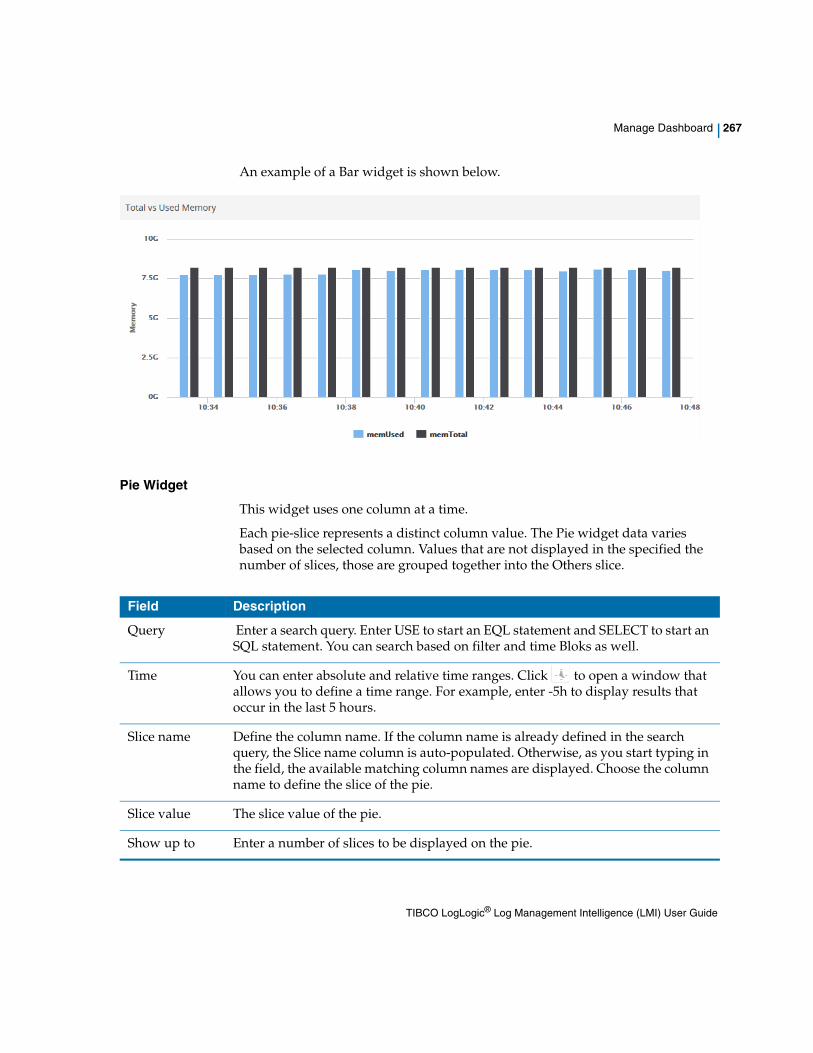
Manage Dashboard | 267
An example of a Bar widget is shown below.
Pie Widget
This widget uses one column at a time.
Each pie-slice represents a distinct column value. The Pie widget data varies based on the selected column. Values that are not displayed in the specified the number of slices, those are grouped together into the Others slice.
Field Description
Query Enter a search query. Enter USE to start an EQL statement and SELECT to start an SQL statement. You can search based on filter and time Bloks as well.
Time You can enter absolute and relative time ranges. Click to open a window that allows you to define a time range. For example, enter -5h to display results that occur in the last 5 hours.
Slice name Define the column name. If the column name is already defined in the search query, the Slice name column is auto-populated. Otherwise, as you start typing in the field, the available matching column names are displayed. Choose the column name to define the slice of the pie.
Slice value The slice value of the pie.
Show up to Enter a number of slices to be displayed on the pie.
TIBCO LogLogic® Log Management Intelligence (LMI) User Guide
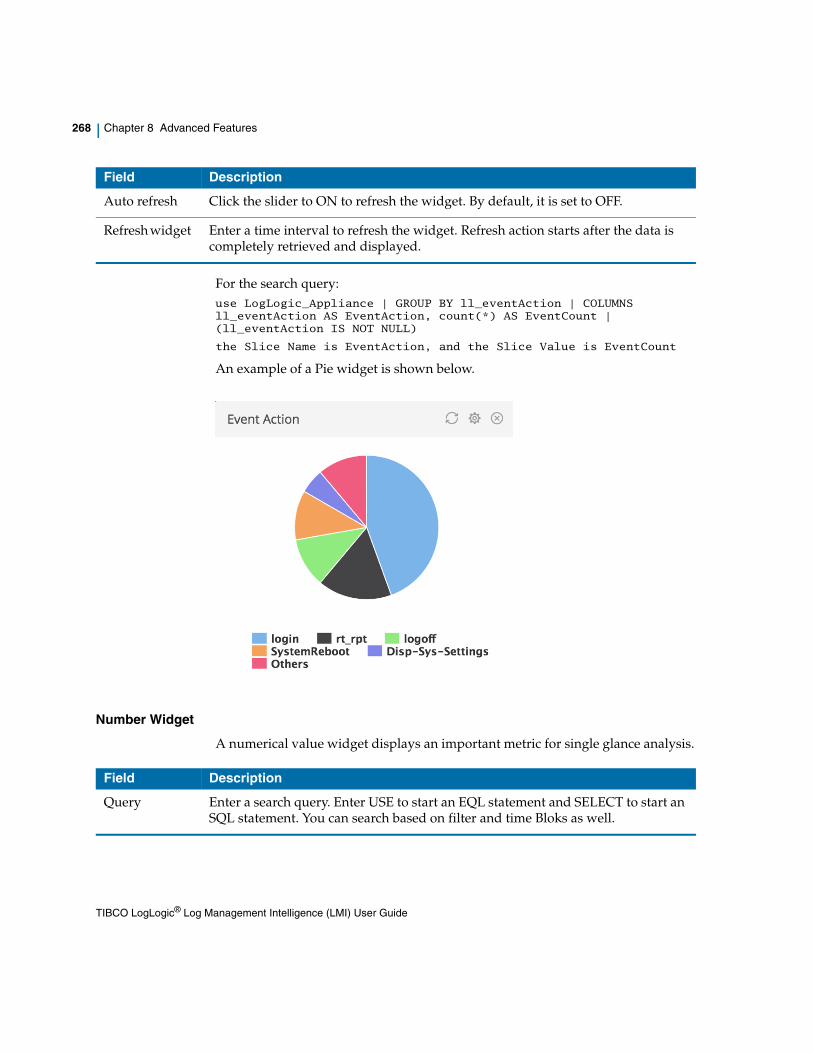
268 | Chapter 8 Advanced Features
For the search query: use LogLogic_Appliance | GROUP BY ll_eventAction | COLUMNS ll_eventAction AS EventAction, count(*) AS EventCount | (ll_eventAction IS NOT NULL)
the Slice Name is EventAction, and the Slice Value is EventCount
An example of a Pie widget is shown below.
Number Widget
A numerical value widget displays an important metric for single glance analysis.
Auto refresh Click the slider to ON to refresh the widget. By default, it is set to OFF.
Refresh widget Enter a time interval to refresh the widget. Refresh action starts after the data is completely retrieved and displayed.
Field Description
Field Description
Query Enter a search query. Enter USE to start an EQL statement and SELECT to start an SQL statement. You can search based on filter and time Bloks as well.
TIBCO LogLogic® Log Management Intelligence (LMI) User Guide
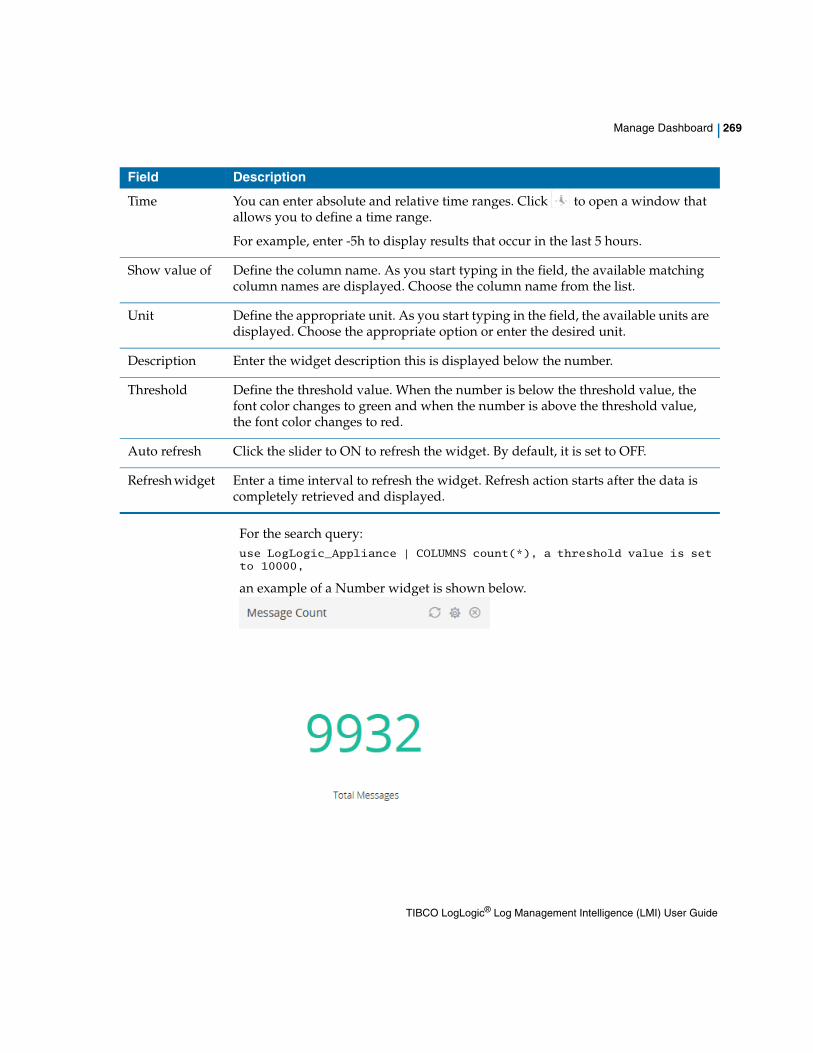
Manage Dashboard | 269
For the search query: use LogLogic_Appliance | COLUMNS count(*), a threshold value is set to 10000,
an example of a Number widget is shown below.
Time You can enter absolute and relative time ranges. Click to open a window that allows you to define a time range.
For example, enter -5h to display results that occur in the last 5 hours.
Show value of Define the column name. As you start typing in the field, the available matching column names are displayed. Choose the column name from the list.
Unit Define the appropriate unit. As you start typing in the field, the available units are displayed. Choose the appropriate option or enter the desired unit.
Description Enter the widget description this is displayed below the number.
Threshold Define the threshold value. When the number is below the threshold value, the font color changes to green and when the number is above the threshold value, the font color changes to red.
Auto refresh Click the slider to ON to refresh the widget. By default, it is set to OFF.
Refresh widget Enter a time interval to refresh the widget. Refresh action starts after the data is completely retrieved and displayed.
Field Description
TIBCO LogLogic® Log Management Intelligence (LMI) User Guide
270 | Chapter 8 Advanced Features
Gauge Widget
This widget uses value of a column.
For the search query:
use LogLogic_appliance | COLUMNS count(*), the Show value is count(*) and the Unit is Messages,
Field Description
Query Enter a search query. Enter USE to start an EQL statement and SELECT to start an SQL statement. You can search based on filter and time Bloks as well.
Time You can enter absolute and relative time ranges. Click to open a window that allows you to define a time range.
For example, enter -5h to display results that occur in the last 5 hours.
Show value of Define the column name. As you start typing in the field, the available matching column names are displayed. Choose the column name from the list.
Unit Define the appropriate unit. As you start typing in the field, the available units are displayed. Choose the appropriate option or enter the desired unit.
Range Define the range.
Threshold Define the threshold range.
Auto refresh Click the slider to ON to refresh the widget. By default, it is set to OFF.
Refresh widget Enter a time interval to refresh the widget. Refresh action starts after the data is completely retrieved and displayed.
TIBCO LogLogic® Log Management Intelligence (LMI) User Guide
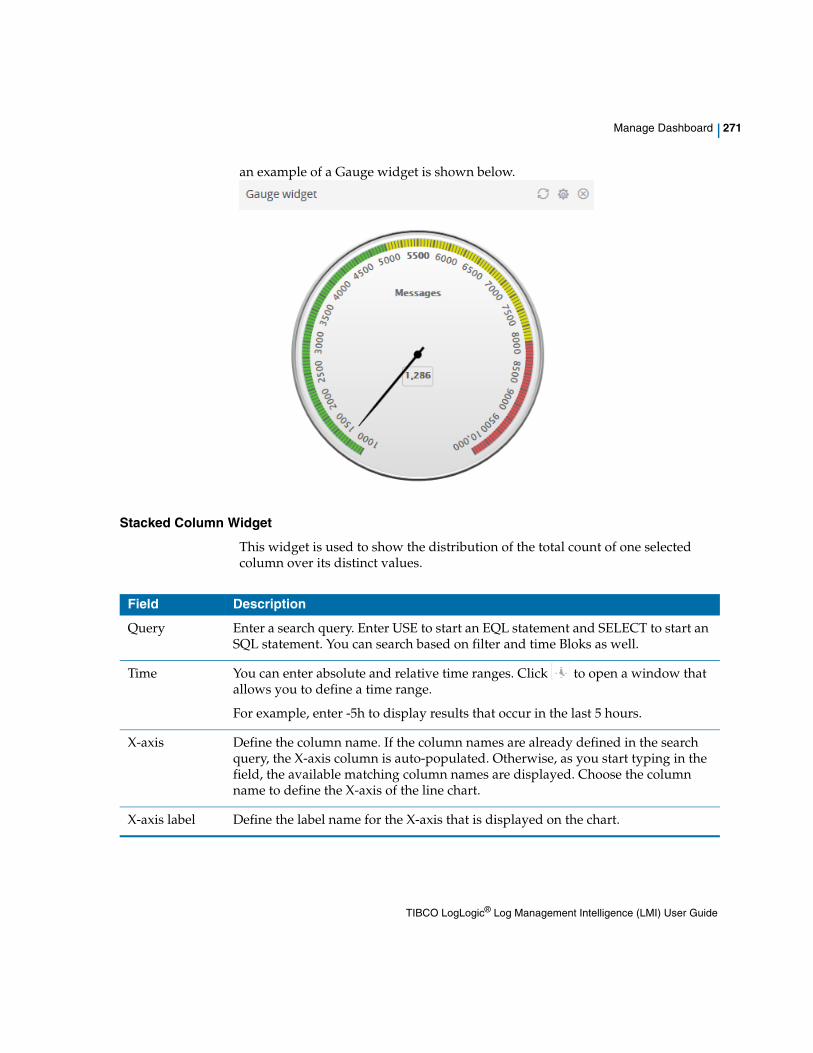
Manage Dashboard | 271
an example of a Gauge widget is shown below.
Stacked Column Widget
This widget is used to show the distribution of the total count of one selected column over its distinct values.
Field Description
Query Enter a search query. Enter USE to start an EQL statement and SELECT to start an SQL statement. You can search based on filter and time Bloks as well.
Time You can enter absolute and relative time ranges. Click to open a window that allows you to define a time range.
For example, enter -5h to display results that occur in the last 5 hours.
X-axis Define the column name. If the column names are already defined in the search query, the X-axis column is auto-populated. Otherwise, as you start typing in the field, the available matching column names are displayed. Choose the column name to define the X-axis of the line chart.
X-axis label Define the label name for the X-axis that is displayed on the chart.
TIBCO LogLogic® Log Management Intelligence (LMI) User Guide
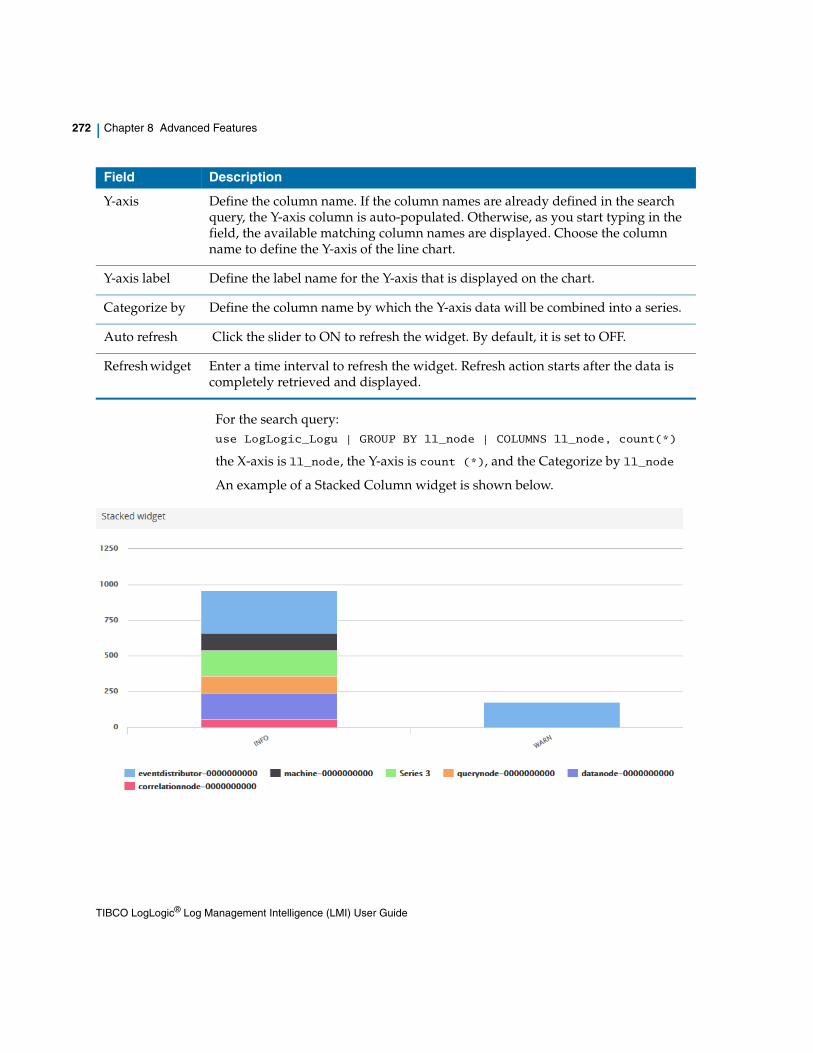
272 | Chapter 8 Advanced Features
For the search query: use LogLogic_Logu | GROUP BY ll_node | COLUMNS ll_node, count(*)
the X-axis is ll_node, the Y-axis is count (*), and the Categorize by ll_node
An example of a Stacked Column widget is shown below.
Y-axis Define the column name. If the column names are already defined in the search query, the Y-axis column is auto-populated. Otherwise, as you start typing in the field, the available matching column names are displayed. Choose the column name to define the Y-axis of the line chart.
Y-axis label Define the label name for the Y-axis that is displayed on the chart.
Categorize by Define the column name by which the Y-axis data will be combined into a series.
Auto refresh Click the slider to ON to refresh the widget. By default, it is set to OFF.
Refresh widget Enter a time interval to refresh the widget. Refresh action starts after the data is completely retrieved and displayed.
Field Description
TIBCO LogLogic® Log Management Intelligence (LMI) User Guide
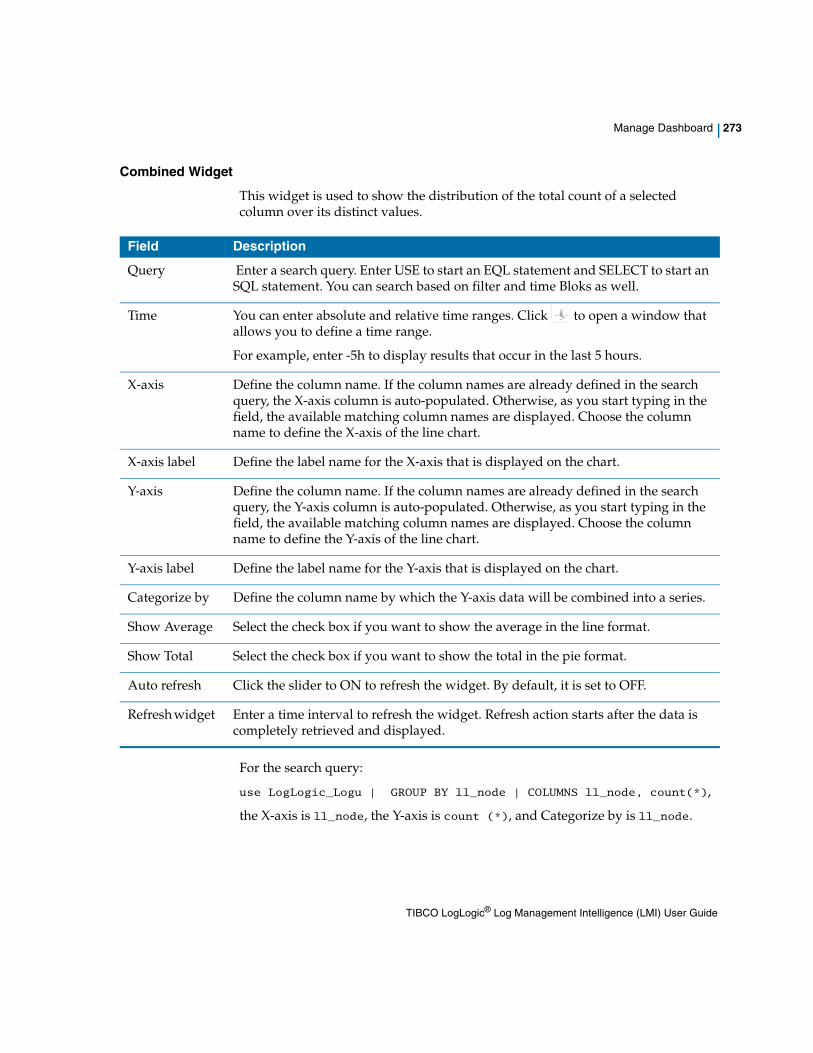
Manage Dashboard | 273
Combined Widget
This widget is used to show the distribution of the total count of a selected column over its distinct values.
For the search query:
use LogLogic_Logu | GROUP BY ll_node | COLUMNS ll_node, count(*),
the X-axis is ll_node, the Y-axis is count (*), and Categorize by is ll_node.
Field Description
Query Enter a search query. Enter USE to start an EQL statement and SELECT to start an SQL statement. You can search based on filter and time Bloks as well.
Time You can enter absolute and relative time ranges. Click to open a window that allows you to define a time range.
For example, enter -5h to display results that occur in the last 5 hours.
X-axis Define the column name. If the column names are already defined in the search query, the X-axis column is auto-populated. Otherwise, as you start typing in the field, the available matching column names are displayed. Choose the column name to define the X-axis of the line chart.
X-axis label Define the label name for the X-axis that is displayed on the chart.
Y-axis Define the column name. If the column names are already defined in the search query, the Y-axis column is auto-populated. Otherwise, as you start typing in the field, the available matching column names are displayed. Choose the column name to define the Y-axis of the line chart.
Y-axis label Define the label name for the Y-axis that is displayed on the chart.
Categorize by Define the column name by which the Y-axis data will be combined into a series.
Show Average Select the check box if you want to show the average in the line format.
Show Total Select the check box if you want to show the total in the pie format.
Auto refresh Click the slider to ON to refresh the widget. By default, it is set to OFF.
Refresh widget Enter a time interval to refresh the widget. Refresh action starts after the data is completely retrieved and displayed.
TIBCO LogLogic® Log Management Intelligence (LMI) User Guide
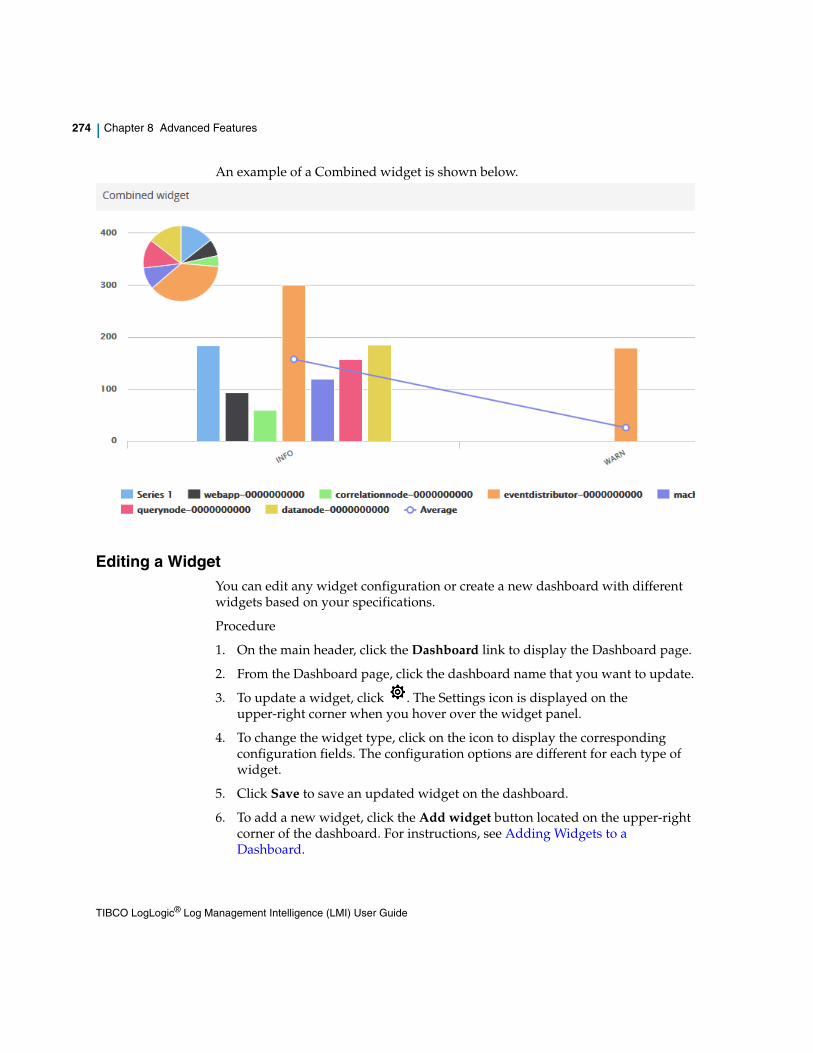
274 | Chapter 8 Advanced Features
An example of a Combined widget is shown below.
Editing a WidgetYou can edit any widget configuration or create a new dashboard with different widgets based on your specifications.
Procedure
1. On the main header, click the Dashboard link to display the Dashboard page.
2. From the Dashboard page, click the dashboard name that you want to update.
3. To update a widget, click . The Settings icon is displayed on the upper-right corner when you hover over the widget panel.
4. To change the widget type, click on the icon to display the corresponding configuration fields. The configuration options are different for each type of widget.
5. Click Save to save an updated widget on the dashboard.
6. To add a new widget, click the Add widget button located on the upper-right corner of the dashboard. For instructions, see Adding Widgets to a Dashboard.
TIBCO LogLogic® Log Management Intelligence (LMI) User Guide
Manage Dashboard | 275
7. To resize a widget, grab any corner of the widget and resize as per your specifications.
Deleting a WidgetYou can delete any widget from a dashboard at any time.
Procedure
1. On the main header, click the Dashboard link to display the Dashboard page.
2. From the Dashboard page, click the dashboard name.
3. To delete a widget, click . The Delete icon is displayed when you hover over the widget panel. The dashboard is saved automatically.
Duplicating a DashboardYou can copy the same dashboard as a new dashboard that you allows you to modify as per your need.
Procedure
1. On the main header, click the Dashboard link to display the Dashboard page.
2. From the Dashboard page, select the dashboard that you want to copy by selecting the check box located next to the Name column and click to copy the same dashboard.
3. Enter the new name in the Name field and click OK.
The newly added dashboard is displayed on the Dashboard page immediately.
Deleting a DashboardYou can delete a dashboard at any time.
Procedure
1. On the main header, click the Dashboard link to display the Dashboard page.
The Duplicate button is enabled after you select a dashboard from the list.
TIBCO LogLogic® Log Management Intelligence (LMI) User Guide
276 | Chapter 8 Advanced Features
2. From the Dashboard page, select the dashboard that you want to delete by selecting the check box located next to the Name column and click . To select all dashboards in the system, select the check box located next to the Name column header.
In the confirmation window, click OK to delete the dashboard and all of its content from the system. The Dashboard page is updated immediately.
The Delete button is enabled after you select one or more dashboards.
TIBCO LogLogic® Log Management Intelligence (LMI) User Guide
Managing Data Models | 277
Managing Data Models
LogLogic LMI parses log data into a structured format to enhance search and analysis. Based on the log source type, you can define how to parse your data and which columns to extract.
Data models:
• define parsing rules that extract columns from your data
• define a schema for an event
• allow you to name and specify data type for extracted columns
A data model can define multiple parsing rules. Sometimes within the same source, some logs are completely different to others, and it is not practical, or even possible, to match them all with a single rule. You need a different way of parsing for each kind of log, and you can do that by defining several rules, each targeting one type of log.
If a data model has more than one parsing rule defined, then the extracted column set is the union of the column sets of all parsing rules and the additional system-defined columns. For example, create a data model and define a parsing rule, Rule1 to extract four defined columns and Rule2 to extract eight different defined columns. Now, when you run a search query on this data model, the 12 columns are displayed.
Parsing rules are applied top to bottom in the order they are defined in a data model. For example, if Rule1 matches some of your data then it will be used to extract column values. If Rule1 fails to match with your data, then only Rule2 is applied, and so on. You can change the order of parsing rules.
Using Advanced Data Models, you can add data models using two different modes:
• Graphical mode: This is a default mode. A wizard helps you add data model and the associated rules. For details, see Adding a Data Model in Graphical Mode.
• Raw mode: This is for advanced users who understand the JSON syntax. Use JSON syntax to add a data model and associated rules. For details, see Adding a Data Model in Raw Mode.
You can switch between the modes at any time. All information associated with a data model is preserved when you switch from graphical to raw mode.
TIBCO LogLogic® Log Management Intelligence (LMI) User Guide
278 | Chapter 8 Advanced Features
You can create a data model that defines which log source to use for parsing based on the data relevance. For multiple log sources, the order of precedence can be defined in a specified query. The system columns are event metadata. All system columns are displayed with the prefix sys_ and all columns from built-in parsers are displayed with the prefix ll_ in the Columns panel.
LogLogic LMI provides built-in data models. For a detailed list, see the Supported Log Sources list in the TIBCO LogLogic® Log Source Packages Release Notes.
LogLogic LMI supports the following types of parsers:
• Key-value Parser: This parser uses simple key-value pair parsing rules to extract keys and values. The parser recognizes patterns like k1=v1, k2=v2, k3=v3. You can use key-value pair separators, for example, space, comma (,), or semi-colon (;), and key and value separators, for example, equal sign (=) or colon (:). Separators can be either one or more characters that have to be matched exactly or they can be regular expressions.
When referring to a value in a column expression, it is referred to as $<key name>. So for a key with name ‘user’ the value is referred to as $user.
Regular expressions can also be used to parse data from the beginning and ending of the event. This can be useful when parsing events that either start with or end with data that is not in the key-value pair format. If these regular expressions contain named groups, then those groups are extracted and can be used to populate columns.
It is also possible to specify the name of the last key in the data. Any data after that last key is treated as the value of that last key. This can be useful in situations where the last value in the data contains characters that might be interpreted as separators.
• Columnar Parser: The data is extracted into different columns. This parser operates on data that is separated by a character or a sequence of characters, for example, comma, or tab. There is no keyvalue, just the value. The data from different log sources extract different columns depending on keys identified in the data. When referring to a column in a column expression, it is referred to as $<column number>. So the first column is referred to as $1, the second column is $2 and so on.
• Regex Parser: Regular expressions (Regex) are a sequence of characters that form a search pattern, mainly for use in pattern matching with strings or string matching. LogLogic LMI can use regular expressions for extracting columns from matched events.
A working knowledge of regular expressions is a prerequisite.
TIBCO LogLogic® Log Management Intelligence (LMI) User Guide
Managing Data Models | 279
Each character in a regular expression is either a meta character with its special meaning, or a regular character with its literal meaning. Together, they can be used to identify textual material of a given pattern, or process a number of instances of it that can vary from a precise equality to a very general similarity of the pattern.
LogLogic LMI supports the regular expression meta characters, based on Java regular expressions. For details, see Appendix B, Supported Regular Expression Characters.
Columns are extracted using either the capturing group pattern (simple parenthesis), the named capturing group pattern (?<name>), or a combination of both. When referring to a column in a column expression, when using named capturing groups the column name will be that specified by the group name, preceded by “$”. When using unnamed capturing groups, the name will be “$” followed by the group index. So the first unnamed group column is referred as $1, the second as $2, and so on, while a group named “user” is referred as $user. When using a combination of named and unnamed capturing groups, the named capturing group columns must be referred to by their given names rather than by "$" followed by their index.
• CEF Parser: HP ArcSight Common Event Format (CEF) is an open log management standard. CEF defines a syntax that comprises a standard header and a variable extension, formatted as keyvalue pairs. Based on the ArcSight Extension Dictionary, the CEF header columns Version, Device Vendor, Device Product, Device Version, Signature ID, Name, and Severity are extracted into columns with their names, and expressions set to $cefVersion, $cefDeviceVendor, $cefDeviceProduct, $cefDeviceVersion, $cefSignatureID, $cefName, and $cefSeverity respectively.
The name of a column for an extension listed in the ArcSight Extension Dictionary is the full name of the extension. The name of a column for an extension that is not listed in the ArcSight Extension Dictionary is the key name as it is displayed in the data preceded with “$”.
The expressions of the non-timestamp extension columns are the CEF Key Names as defined in the ArcSight Extension Dictionary. The expressions of the timestamp extension columns are of the form ToTimestamp(<$CEF Key Name>, <proposed format>) where <proposed format> is a suggestion for the correct format to use when parsing the data.
Some extensions in the ArcSight Extension Dictionary have names that start with the asterisk (*). Since LogLogic LMI does not allow column names to start with asterisk (*), an asterisk (*) is omitted from the column name. For example, the *sourceProcessId extension is extracted into a column named sourceProcessId.
TIBCO LogLogic® Log Management Intelligence (LMI) User Guide
280 | Chapter 8 Advanced Features
When the event was written, the pipe (|), equal sign (=), and backslash (\) characters might have been escaped by inserting a backslash (\) in front of them. The CEF parser removes the backslash (\) character, returning the data to its original form. For example, if the value of the Name header in the event is "detected a \| in message", the value of the cefName column will be "detected a | in message".
• Syslog Parser: Data conforming to the Syslog standard defined in RFC-5424 (https://tools.ietf.org/html/rfc5424) can be parsed using the Syslog Parser.
All the header fields defined in the format are extracted as is the Message component. If the log data contains Structured Data elements, those are extracted as well with the names of the resulting columns being composed of <element-name>.<key name> as shown in the following example:
<165>1 2003-10-11T22:14:15.003Z mymachine.example.com evntslog - ID47 [exampleSDID@32473 iut="3" eventSource="Application" eventID="1011"] An application event log entry
The following columns are extracted:
facility = local4; severity = notice; version = 1; timestamp = 2003-10-11 15:14:15 (if LogLogic LMI is running in the PDT time zone); hostname = mymachine.example.com; appname = evntslog; procid = <null>; msgid = ID47; [email protected] = 3; [email protected] = Application; [email protected] = 1011; msg = An application event log entry
Viewing Data ModelsYou can view all defined data models, add new models, edit existing models, enable and disable models, and delete models.
From the Management > Advanced Data Models menu, you can perform the following tasks:
• Filter configurations
You can quickly find the desired model by typing the model name in the Find field. As you start typing a model name in the Find field, the Data Model page is automatically refreshed showing your selection.
• View models based on filters
You can use filters to easily find models. Click the View list to view different filters.
The older, obsolete format described in RFC-3164 is not supported.
TIBCO LogLogic® Log Management Intelligence (LMI) User Guide
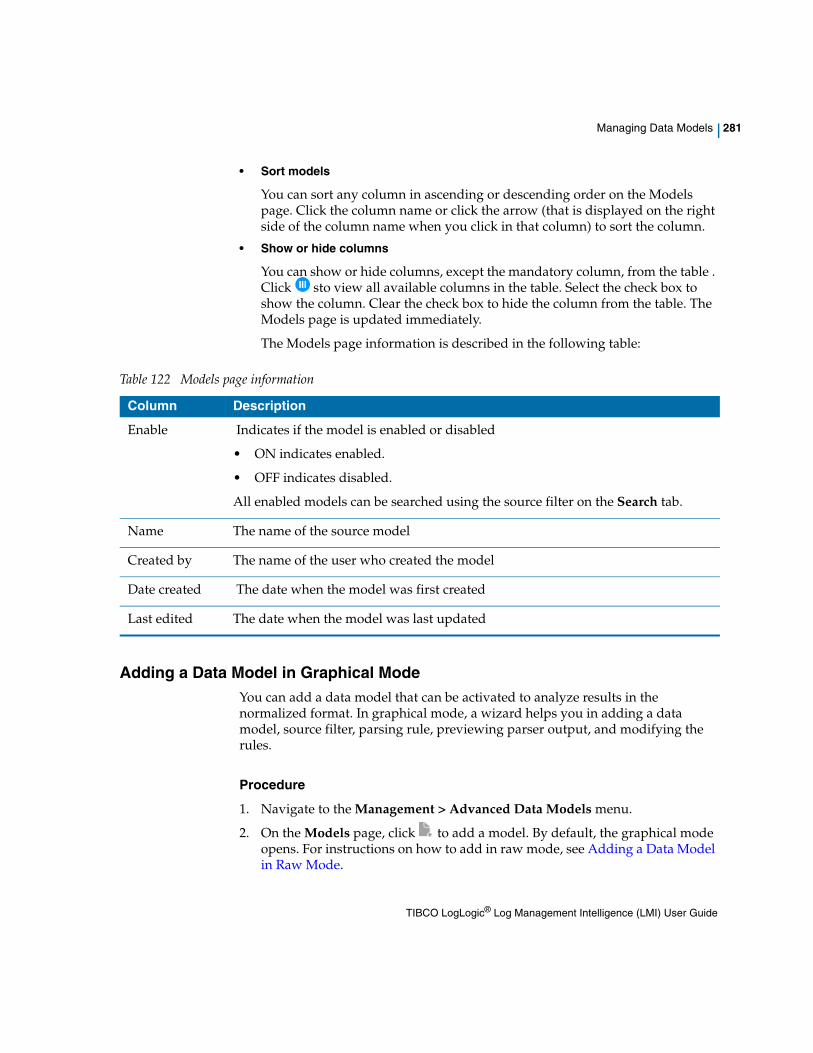
Managing Data Models | 281
• Sort models
You can sort any column in ascending or descending order on the Models page. Click the column name or click the arrow (that is displayed on the right side of the column name when you click in that column) to sort the column.
• Show or hide columns
You can show or hide columns, except the mandatory column, from the table . Click sto view all available columns in the table. Select the check box to show the column. Clear the check box to hide the column from the table. The Models page is updated immediately.
The Models page information is described in the following table:
Adding a Data Model in Graphical ModeYou can add a data model that can be activated to analyze results in the normalized format. In graphical mode, a wizard helps you in adding a data model, source filter, parsing rule, previewing parser output, and modifying the rules.
Procedure
1. Navigate to the Management > Advanced Data Models menu.
2. On the Models page, click to add a model. By default, the graphical mode opens. For instructions on how to add in raw mode, see Adding a Data Model in Raw Mode.
Table 122 Models page information
Column Description
Enable Indicates if the model is enabled or disabled
• ON indicates enabled.
• OFF indicates disabled.
All enabled models can be searched using the source filter on the Search tab.
Name The name of the source model
Created by The name of the user who created the model
Date created The date when the model was first created
Last edited The date when the model was last updated
TIBCO LogLogic® Log Management Intelligence (LMI) User Guide
282 | Chapter 8 Advanced Features
3. By default, the slider is set to ON to enable the model. Click the slider to OFF to disable the model.
4. Enter the name of the data model in the Name field. The name must contain an alphanumeric character. It can also contain space, dollar ($), underscore (_), and hyphen (-).
5. Optional: Enter the description in the Description field.
6. Add a new source filter, for instructions see Defining a Source Filter.
7. Define a parsing rule, for instructions see Adding a Parsing Rule.
8. Manage your custom columns, for instructions see Managing Columns.
9. Click Save to add a new data model.
The Models page is updated with the newly added model.
Defining a Source Filter
You can add a new source filter that is assigned to the data model. The source filters bind multiple data models to a log source.
Procedure
1. In the Source filter field, enter the source filter statement that is assigned for this data model. Source filters can only be used on one or more system columns. All filter statements as described in the FILTER Statement section are supported, except that if a full text search is desired, it must be specified explicitly, for example, sys_body CONTAINS '<searchstring>'.
For example, sys_sourceType=165 (device type ID that is retrieved from LogLogic LMI) AND sys_body CONTAINS '<searchstring>'
2. Click Validate to validate the filter statement.
3. To add a new parsing rule, click 2. Add sample events and parsing rules or click located on the right side of the page. or, To add only the source filter, click Save.
If the data model name contains non-alphabetic or non-digit characters, it needs to be enclosed in brackets ([ ]) when used in a search query.
If you specify multiple data models, the first model whose filter matches with the event is used to parse that event, extracting all columns specified by that model.
TIBCO LogLogic® Log Management Intelligence (LMI) User Guide
Managing Data Models | 283
Adding a Parsing Rule
You can add one or more parsing rules that define how to parse log events.
Procedure
1. Paste the sample log data in the Sample events panel.
This data can be helpful in defining the parsing rule based on the log source. Once you save the data model, the sample data is always available when editing the same data model or associated parsing rules.
2. In the Parsing rules panel, click Add new rule to add a new parsing rule. You can add multiple rules for the same data model.
3. Enter the name of the rule in the Name field.
The name must contain an alphanumeric character. It can also contain an underscore (_) and hyphen (-).
4. Make sure that the slider is set to ON to enable the parsing rule. Click the slider to OFF to disable the parsing rule.
5. Enter the filter that is assigned to the parsing rule in the Filter field. All regular expression patterns are supported.
You can paste maximum of 100 KB sample data.
If you do not define the filter, all events are matched with this rule. If there are additional rules after such parsing rule, then the additional rules are ignored.
TIBCO LogLogic® Log Management Intelligence (LMI) User Guide
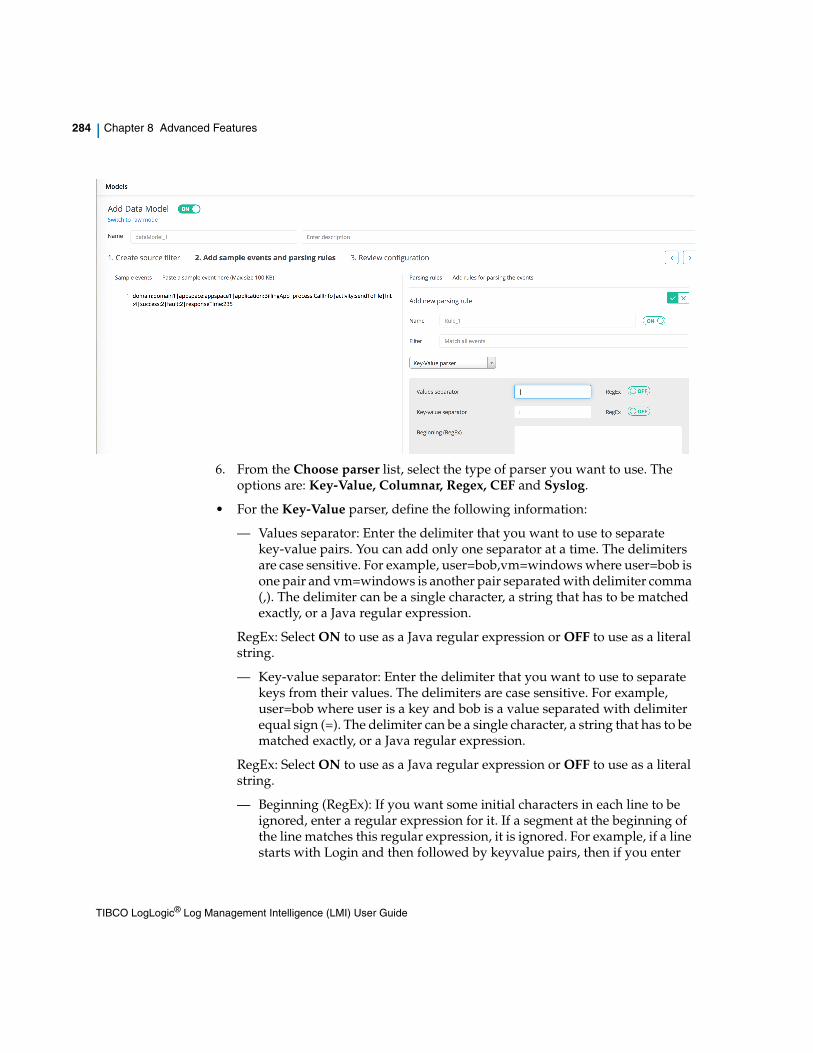
284 | Chapter 8 Advanced Features
6. From the Choose parser list, select the type of parser you want to use. The options are: Key-Value, Columnar, Regex, CEF and Syslog.
• For the Key-Value parser, define the following information:
— Values separator: Enter the delimiter that you want to use to separate key-value pairs. You can add only one separator at a time. The delimiters are case sensitive. For example, user=bob,vm=windows where user=bob is one pair and vm=windows is another pair separated with delimiter comma (,). The delimiter can be a single character, a string that has to be matched exactly, or a Java regular expression.
RegEx: Select ON to use as a Java regular expression or OFF to use as a literal string.
— Key-value separator: Enter the delimiter that you want to use to separate keys from their values. The delimiters are case sensitive. For example, user=bob where user is a key and bob is a value separated with delimiter equal sign (=). The delimiter can be a single character, a string that has to be matched exactly, or a Java regular expression.
RegEx: Select ON to use as a Java regular expression or OFF to use as a literal string.
— Beginning (RegEx): If you want some initial characters in each line to be ignored, enter a regular expression for it. If a segment at the beginning of the line matches this regular expression, it is ignored. For example, if a line starts with Login and then followed by keyvalue pairs, then if you enter
TIBCO LogLogic® Log Management Intelligence (LMI) User Guide
Managing Data Models | 285
Login in this field, the first word Login is ignored when extracting columns. Named groups in the regular expression are extracted as columns.
— Ending (RegEx): If you want some characters at the end of each line to be ignored, enter a regular expression for it. If a segment at the end of the line matches this regular expression, it is ignored. Named groups in the regular expression are extracted as columns.
— Last key: Enter a key name. Whenever that key is found in a line, the parser stops searching for more key-value pairs in that line and the value for that key is the remaining content of the line. For example, if the line ends:
Severity="high",EventSubClass="1",ObjectID="389576426"
then if you specify Severity as the last key, then the value for severity is:"",EventSubClass="1",ObjectID="389576426".
• For the Columnar parser, define the following information:
— Separator: Enter the delimiter that you want to use as a column separator. The separator can be a string of one or more characters, or a Java regular expression. The delimiters are case sensitive. For example, bob,windows where comma (,) is a character used to separate two columns.
— RegEx: Use this option to define how the separator should be interpreted. Select ON to use as a Java regular expression or OFF to use as a literal string.
— Escape character: Define a character that is actually used to escape the character used as a column delimiter. The delimiters are case sensitive. For example, if you use a comma as a column separator and your column value has a comma in it, then that value has to be escaped so that a parser does not think that the instance of the comma is the start of a new column.
— Max columns: Enter the maximum number of columns to be extracted. If more columns than maxColumns are found, then the content of the additional columns is included in the last column. For example, if the
For sending logs through UDP, when you create a new data model, enter .?.?.? in the Beginning (RegEx) field so that LogLogic LMI can parse the logs correctly.
To specify a <space>, enter \s (backslash followed by s).
For a <tab>, enter \t (backslash followed by t).
TIBCO LogLogic® Log Management Intelligence (LMI) User Guide
286 | Chapter 8 Advanced Features
separator is <space> and the maxColumns value is 3 for a message like “a b c d”, then there are 3 columns with values “a”, “b” and “c <space> d”.
— Trim values: If defined ON, then the extra (white) space that is generated at the beginning and end of the column is removed. If defined OFF, the extra space is not removed.
• For the Regex parser, define the following information:
— Regex pattern: Make sure to enter a valid PCRE regular expression that contains the groups (named or unnamed) to extracted into column values from the log event. Also, it is good practice to use one or more sample events to validate your regular expression and make sure that the correct values are extracted from the event. For a list of supported regular expression meta characters, based on Java regular expressions, see Appendix B, Supported Regular Expression Characters.
For example,(?<Sequence>\d+).*(?<ACL>\%\w+ \-\d\-\w+)\:\s(?<Name>\w+)\s(? <Version>\w+) \s(?<Status>\w+)\ s(?<Protocol>\w+)\s(?< SourceIP>\d{1,3}\.\d{1,3}\.\d{ 1,3}\. \d{1,3}).*(?< DestinationIP>\d{1,3}\.\d{1,3} \.\d{1,3}\.\d{1,3}).*
This extracts 8 fields: Sequence, ACL, Name, Version, Status, Protocol, SourceIP, and DestinationIP.
7. Click Auto generate columns to extract columns based on the parser type. All custom columns are extracted in the Manage columns for this rule panel. You can add, edit, and delete custom columns. Click to add a column. Click inside the Column and Expression fields to edit any values. Hover over the row, and the Delete button is displayed on the right side of the row for you to delete the column.
• Column: The name of the column that is displayed in the results. Click in the row to add or update any column name. The content assist shows contextual matches of the existing custom column names for you to select.
• Expression: Define how to map values extracted by parser into defined columns. You can use arithmetic operators and conversion functions when defining an expression. The conversion functions are typically used when you need to define new columns where the expressions for new columns can use conversion functions to convert between data types and combine them using various operators. For details about the arithmetic operators, see FILTER
Two columns cannot have the same name. When defining column names, follow the guidelines described in the COLUMNS Statement section.
TIBCO LogLogic® Log Management Intelligence (LMI) User Guide
Managing Data Models | 287
Statement section and for conversion functions, see Predefined Functions. The type of expression depends on the parser type:
— For Key value parser, the expression uses a key name preceded with “$” to extract the value for the column. For example, $user is the value of the key "user" in the log line or null if the key is not present.
— For Columnar parser, the expression uses the $<n> identifier where n is the column number for the value of column n. For example, $2 is the value of the column "2".
— For Regex parser, the columns are extracted using the capturing group pattern the named capturing group pattern or a combination of both. If you select the parser and the column list is empty, the parser tries to guess columns from the sample data.
— For CEF parser, based on the ArcSight Extension Dictionary, the CEF header columns are extracted and the remaining data is formatted as key-value pairs. For example, Sep 19 08:26:10 host CEF:0|Security|threatmanager|1.0|100|worm successfully stopped|10| src=10.0.0.1 dst=2.1.2.2 spt=1232
This extracts these columns and their values: $cefVersion=0, $cefDeviceVendor=Security, $cefDeviceProduct=threatmanager, $cefDeviceVersion=1.0, $cefSignatureID=100, $cefName=worm successfully stopped, $cefSeverity=10, $sourceAddress=10.0.0.1, $destinationAddress=2.1.2.2, $sourcePort=1232
8. Click to refresh the Parser preview panel to view all extracted columns and their data types that are matched by the corresponding parsing rule. Each event that matches with the corresponding rule is identified in the same color for easy readability. For custom columns, click in the Type field to change the supported data type. Select the data type from the list.
This option is available only when the data is pasted in the Sample events panel and at least one parsing rule is enabled.
TIBCO LogLogic® Log Management Intelligence (LMI) User Guide
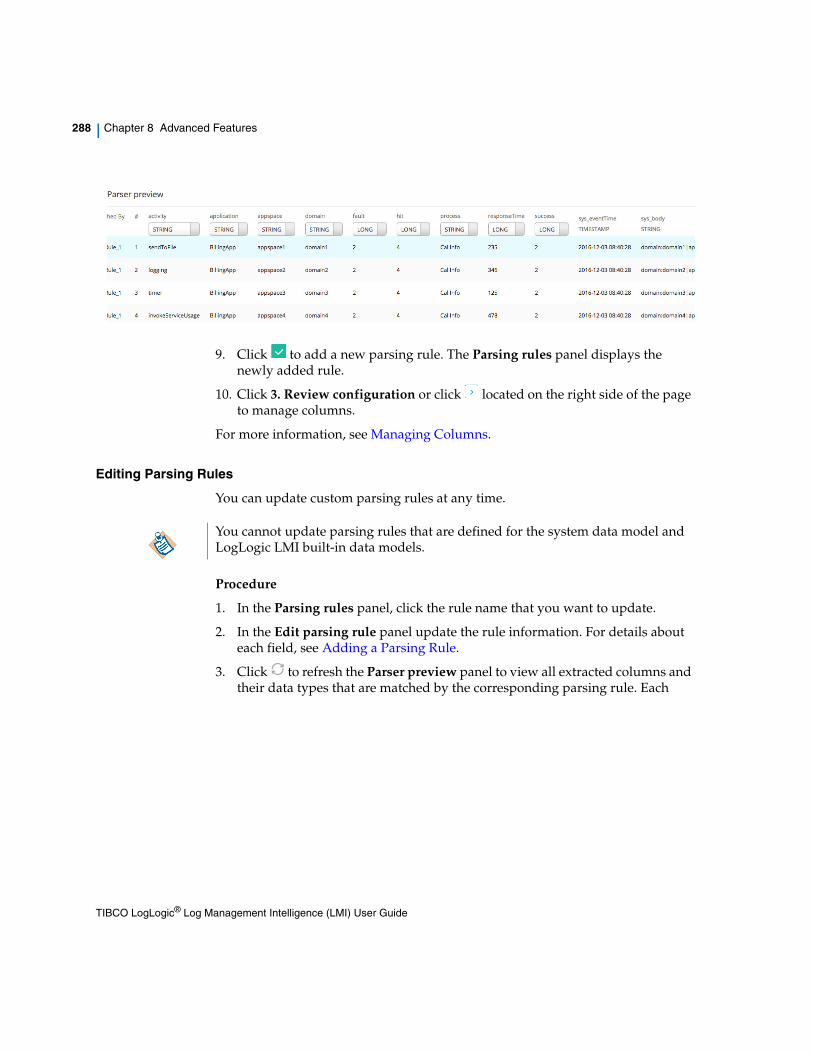
288 | Chapter 8 Advanced Features
9. Click to add a new parsing rule. The Parsing rules panel displays the newly added rule.
10. Click 3. Review configuration or click located on the right side of the page to manage columns.
For more information, see Managing Columns.
Editing Parsing Rules
You can update custom parsing rules at any time.
Procedure
1. In the Parsing rules panel, click the rule name that you want to update.
2. In the Edit parsing rule panel update the rule information. For details about each field, see Adding a Parsing Rule.
3. Click to refresh the Parser preview panel to view all extracted columns and their data types that are matched by the corresponding parsing rule. Each
You cannot update parsing rules that are defined for the system data model and LogLogic LMI built-in data models.
TIBCO LogLogic® Log Management Intelligence (LMI) User Guide
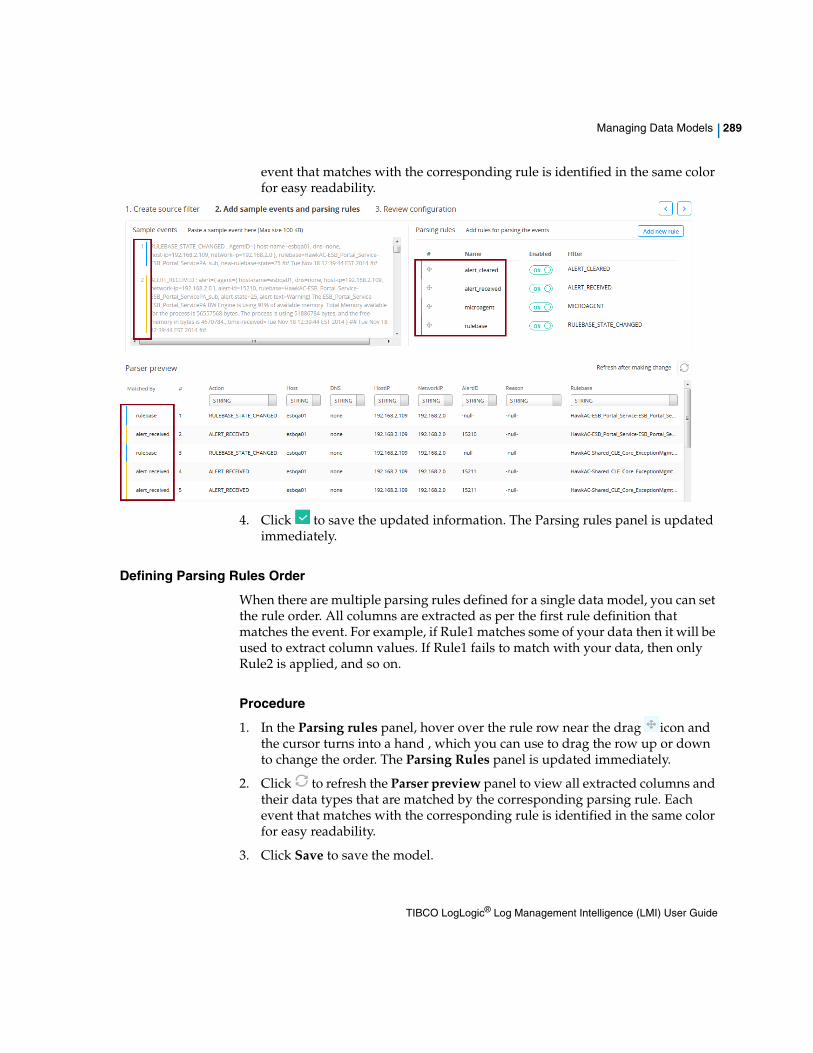
Managing Data Models | 289
event that matches with the corresponding rule is identified in the same color for easy readability.
4. Click to save the updated information. The Parsing rules panel is updated immediately.
Defining Parsing Rules Order
When there are multiple parsing rules defined for a single data model, you can set the rule order. All columns are extracted as per the first rule definition that matches the event. For example, if Rule1 matches some of your data then it will be used to extract column values. If Rule1 fails to match with your data, then only Rule2 is applied, and so on.
Procedure
1. In the Parsing rules panel, hover over the rule row near the drag icon and the cursor turns into a hand , which you can use to drag the row up or down to change the order. The Parsing Rules panel is updated immediately.
2. Click to refresh the Parser preview panel to view all extracted columns and their data types that are matched by the corresponding parsing rule. Each event that matches with the corresponding rule is identified in the same color for easy readability.
3. Click Save to save the model.
TIBCO LogLogic® Log Management Intelligence (LMI) User Guide
290 | Chapter 8 Advanced Features
Copying Parsing Rules
You can copy the same parsing rule as a new rule.
Procedure
1. In the Parsing rules panel, hover over the rule row and the Copy button is displayed on the right side of the row. Click to save the same rule. The Parsing rules panel is updated immediately showing a newly added rule, for example, copy_rulename.
2. Click Save.
Deleting Parsing Rules
You can delete parsing rules from the system.
Procedure
1. In the Parsing rules panel, hover over the rule row and the Delete button is displayed on the right side of the row. Click to delete the parsing rule.
The Parsing rules panel is updated immediately.
2. Click Save to save the model.
Managing Columns
From the Review model page, you can update columns and data types for the associated data model. You can also review column statistics for each defined parsing rule.
Procedure
1. In the Columns panel all system and custom columns are displayed . You can add or remove columns by selecting the check box that is next to the column name. You can update any column name and type.
• Name: The name of the column that is displayed in the results. Click in the row to add or update any column name. There are no restrictions on the characters used in column names, but if the column name contains
You cannot delete parsing rules that are defined for the system data model and LogLogic LMI built-in data models.
TIBCO LogLogic® Log Management Intelligence (LMI) User Guide
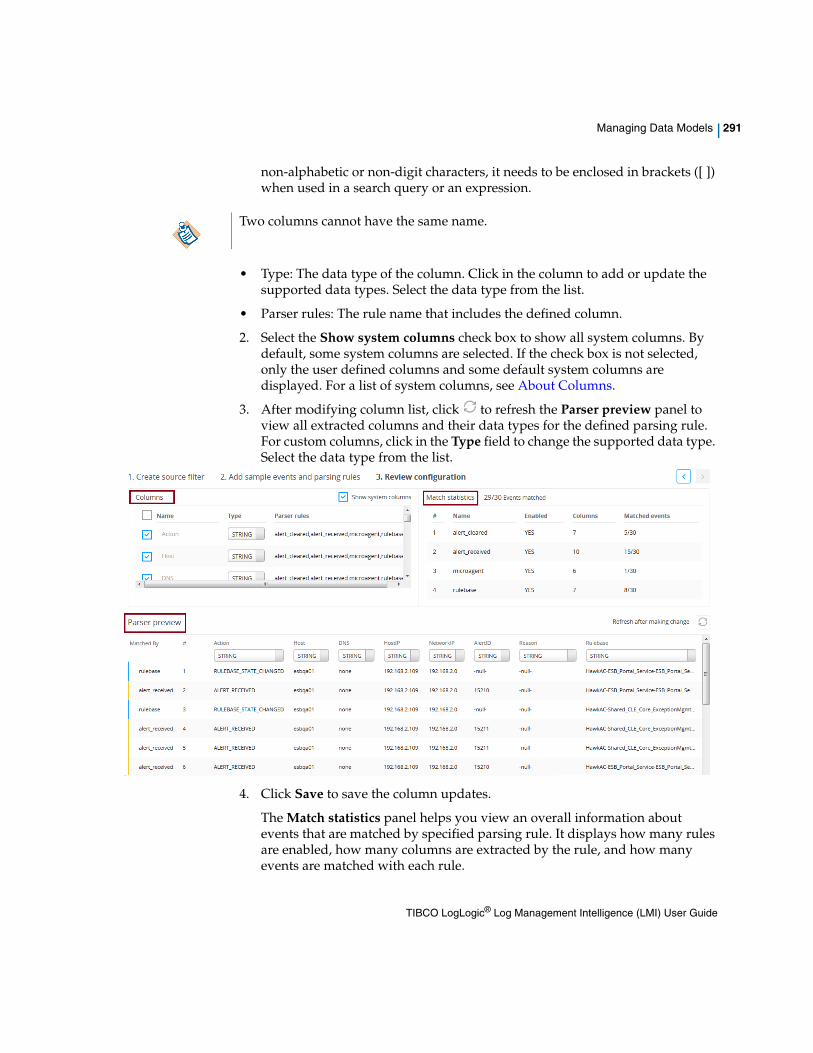
Managing Data Models | 291
non-alphabetic or non-digit characters, it needs to be enclosed in brackets ([ ]) when used in a search query or an expression.
• Type: The data type of the column. Click in the column to add or update the supported data types. Select the data type from the list.
• Parser rules: The rule name that includes the defined column.
2. Select the Show system columns check box to show all system columns. By default, some system columns are selected. If the check box is not selected, only the user defined columns and some default system columns are displayed. For a list of system columns, see About Columns.
3. After modifying column list, click to refresh the Parser preview panel to view all extracted columns and their data types for the defined parsing rule. For custom columns, click in the Type field to change the supported data type. Select the data type from the list.
4. Click Save to save the column updates.
The Match statistics panel helps you view an overall information about events that are matched by specified parsing rule. It displays how many rules are enabled, how many columns are extracted by the rule, and how many events are matched with each rule.
Two columns cannot have the same name.
TIBCO LogLogic® Log Management Intelligence (LMI) User Guide
292 | Chapter 8 Advanced Features
Adding a Data Model in Raw ModeYou can add a new data model that can be activated to analyze results in the normalized format. All enabled models can be searched using the source filter from the Search tab.
Prerequisites
This option is for advanced users who understand JSON syntax to create a new parsing rule. If not, use the graphical mode to create new data model. For details, see Adding a Data Model in Graphical Mode.
Procedure
1. Navigate to the Management > Advanced Data Models menu.
2. From the Models page, click to add a new data model.
3. Click Switch to raw mode to add a new model in raw mode.
4. In the Sample events panel, paste the sample events to analyze data in normalized format. This data can be helpful in defining the parsing rule based on the log source. Once you add the data model, the sample data is always available when editing the same data model or associated parsing rules.
5. In the Raw configuration mode panel, enter the parsing rule. Make sure to define source filter, parsing rule, and parser properties in a valid JSON syntax, as shown below:
{"sourceConfig": {"name": "SourceConfiguration_1","active": "true","sourceFilter": "","parsingRules": [],"columns": [{"name": "sys_domain","type": "STRING"},{"name": "sys_eventTime","type": "TIMESTAMP"},{"name": "sys_body","type": "STRING"},{"name": "sys_bodySize",
You can paste maximum of 100 KB sample data.
TIBCO LogLogic® Log Management Intelligence (LMI) User Guide
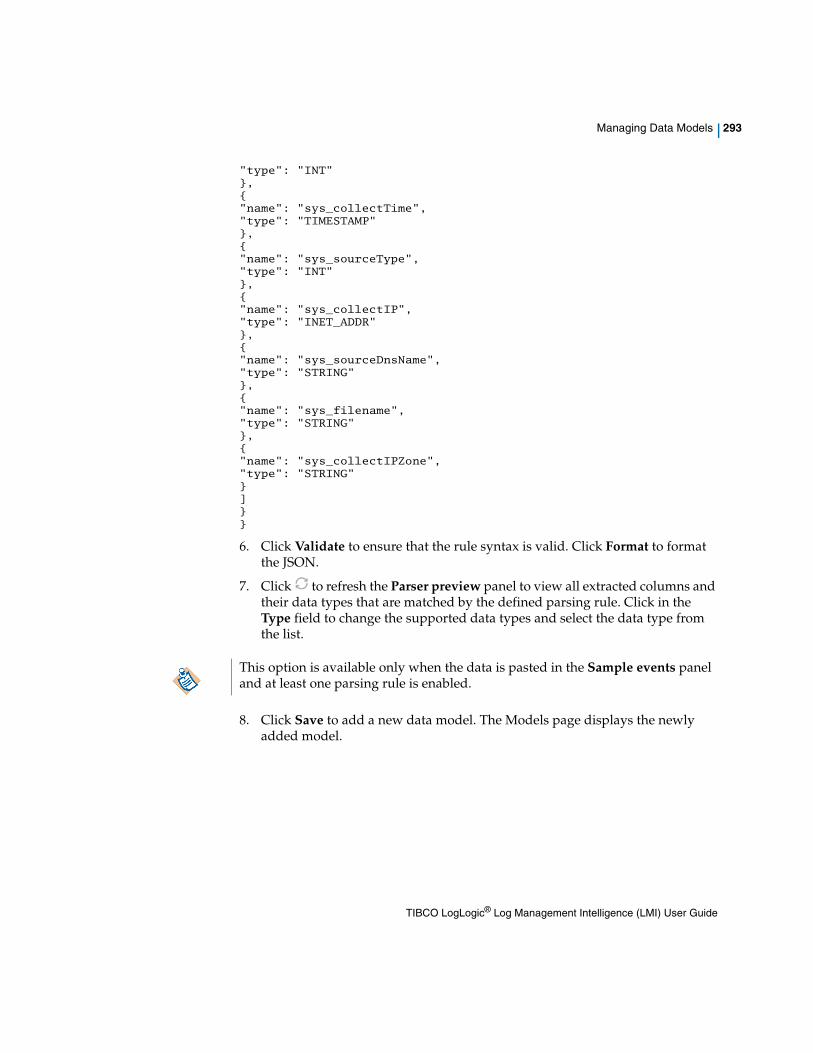
Managing Data Models | 293
"type": "INT"},{"name": "sys_collectTime","type": "TIMESTAMP"},{"name": "sys_sourceType","type": "INT"},{"name": "sys_collectIP","type": "INET_ADDR"},{"name": "sys_sourceDnsName","type": "STRING"},{"name": "sys_filename","type": "STRING"},{"name": "sys_collectIPZone","type": "STRING"}]}}
6. Click Validate to ensure that the rule syntax is valid. Click Format to format the JSON.
7. Click to refresh the Parser preview panel to view all extracted columns and their data types that are matched by the defined parsing rule. Click in the Type field to change the supported data types and select the data type from the list.
8. Click Save to add a new data model. The Models page displays the newly added model.
This option is available only when the data is pasted in the Sample events panel and at least one parsing rule is enabled.
TIBCO LogLogic® Log Management Intelligence (LMI) User Guide
294 | Chapter 8 Advanced Features
Enabling or Disabling Data ModelsData models can be enabled or disabled at any time. All enabled models can be searched using the source filter on the Search tab.
Procedure
1. Navigate to the Management > Advanced Data Models menu.
2. From the Model page, click the slider in the Enable column to ON to enable the data model.
3. From the Model page, click the slider in the Enable column to OFF to disable the data model.
Editing Data ModelsYou can update existing data models at any time. You can save the same model as a new one.
Procedure
1. Navigate to the Management > Advanced Data Models menu.
2. From the Models page, click the model name that you want to update.
The Details panel opens on the right side of the page.
3. Click the Edit link to update the model.
For detailed information, see Adding a Data Model in Graphical Mode.
4. Click to refresh the Parser preview panel to view all extracted columns and their data types that are matched by the corresponding parsing rule. Each event that matches with the corresponding rule are identified in the same color for easy readability.
5. Click Save to save the updated information.
The models page is updated immediately.
6. Click Save As to save the same model as a new one. Enter the new data model name in the Name field and click Ok.
By default, the system data model is enabled. You cannot disable the system data model.
You cannot update the system data model and LogLogic LMI built-in data models from the system. For details, see the Supported Log Sources list in the TIBCO LogLogic® Log Source Packages Release Notes.
TIBCO LogLogic® Log Management Intelligence (LMI) User Guide
Managing Data Models | 295
The Models page is updated immediately showing the newly added data model.
Duplicating Data ModelsYou can copy the imported and system generated data models, except the LogLogic LMI built-in data models, as a new data models that allows you to modify according to your need.
Procedure
1. Navigate to the Management > Advanced Data Models menu.
2. From the Models page, select the data model that you want to copy by selecting the check box located next to the Enable column and click to copy the data model.
3. Enter the new name in the Name field and click OK.
The newly added data model is displayed on the Models page immediately.
Deleting Data ModelsYou can delete one or more custom models from the system. Once you delete a model, it cannot be recovered.
Procedure
1. Navigate to the Management > Advanced Data Models menu.
2. From the Models page, select the check box located next to the model name that you want to delete and click .
3. In the confirmation window, click Ok to delete the model from the system. The Models page is updated immediately.
The Duplicate button is enabled after you select a data model from the list.
You cannot delete the system data model and LogLogic built-in data models from the system. For details, see the Supported Log Sources list in the TIBCO LogLogic® Log Source Packages Release Notes.
TIBCO LogLogic® Log Management Intelligence (LMI) User Guide
296 | Chapter 8 Advanced Features
Using the REST API
You can use the Representational State Transfer (REST) API to develop a custom client application.
LogLogic provides REST APIs that a client application can use to invoke services using simple HTTP methods. A catalogue of available REST resources and requests, organized by functions, is provided. Starting LogLogic LMI 6.1.1, queries via REST APIs are encrypted.
LogLogic API online documentation can be accessed using the following URL:• https://<hostname>:9681/docs
To demonstrate the usage of REST API, some sample scripts are provided in the REST/Samples/ directory in the supplemental package. For more information, see the samples.txt file.
Constructing REST RequestsREST API requests must be submitted in a specific format.
The format of a LogLogic REST API request is:<METHOD> <baseurl>/<basePath>?<query_parameters>
where:
• <METHOD> is the HTTP method to be used on the resource (GET, POST, PUT, or DELETE)
• <baseurl> is the REST API Endpoint ( baseurl ).
• <basePath> is the part of the path that identifies the required LogLogic resource. It consists of:
— a fixed part - for example, /api/v2/query when starting a query.
— followed by (if required) path parameters - for example, id when starting a query
• <query_parameters> identifies any parameters to be passed as part of the request. Unless otherwise specified for a specific parameter, all query parameters are always optional. Multiple query parameters should be separated by ampersand (&) characters.
This assumes that the default ports are used. If you change the default ports, update the URL accordingly.
TIBCO LogLogic® Log Management Intelligence (LMI) User Guide
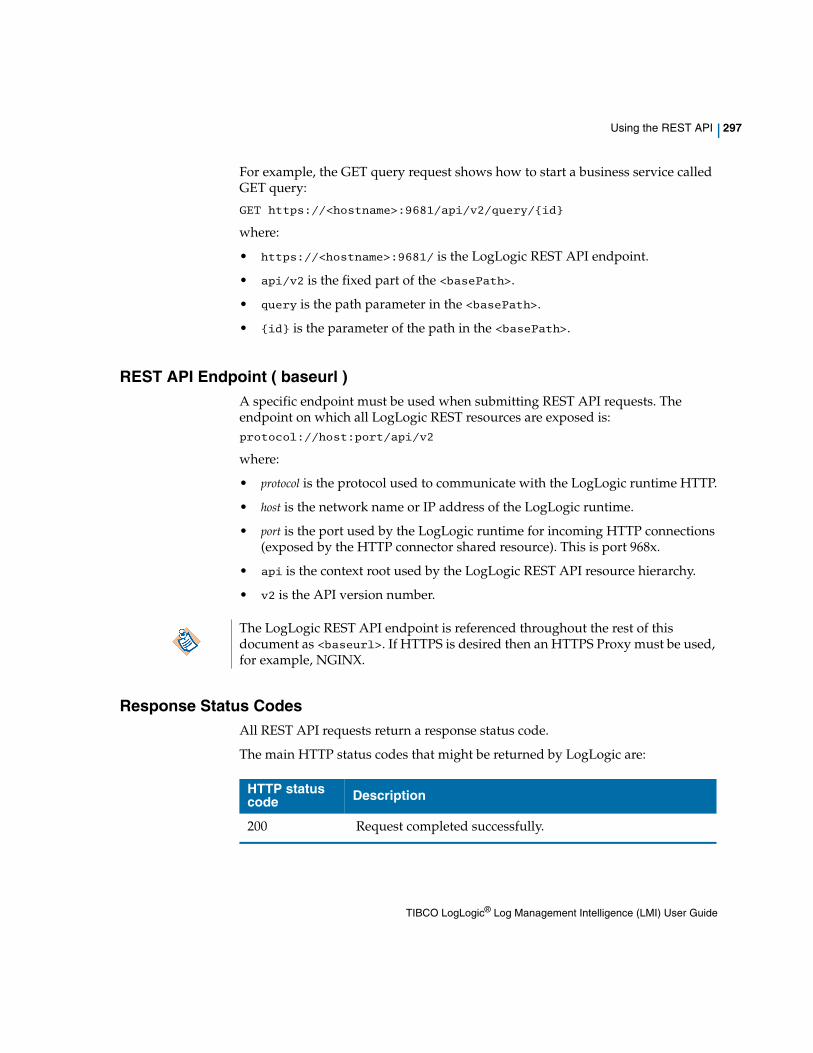
Using the REST API | 297
For example, the GET query request shows how to start a business service called GET query:
GET https://<hostname>:9681/api/v2/query/{id}
where:
• https://<hostname>:9681/ is the LogLogic REST API endpoint.
• api/v2 is the fixed part of the <basePath>.
• query is the path parameter in the <basePath>.
• {id} is the parameter of the path in the <basePath>.
REST API Endpoint ( baseurl )A specific endpoint must be used when submitting REST API requests. The endpoint on which all LogLogic REST resources are exposed is:protocol://host:port/api/v2
where:
• protocol is the protocol used to communicate with the LogLogic runtime HTTP.
• host is the network name or IP address of the LogLogic runtime.
• port is the port used by the LogLogic runtime for incoming HTTP connections (exposed by the HTTP connector shared resource). This is port 968x.
• api is the context root used by the LogLogic REST API resource hierarchy.
• v2 is the API version number.
Response Status CodesAll REST API requests return a response status code.
The main HTTP status codes that might be returned by LogLogic are:
The LogLogic REST API endpoint is referenced throughout the rest of this document as <baseurl>. If HTTPS is desired then an HTTPS Proxy must be used, for example, NGINX.
HTTP status code Description
200 Request completed successfully.
TIBCO LogLogic® Log Management Intelligence (LMI) User Guide
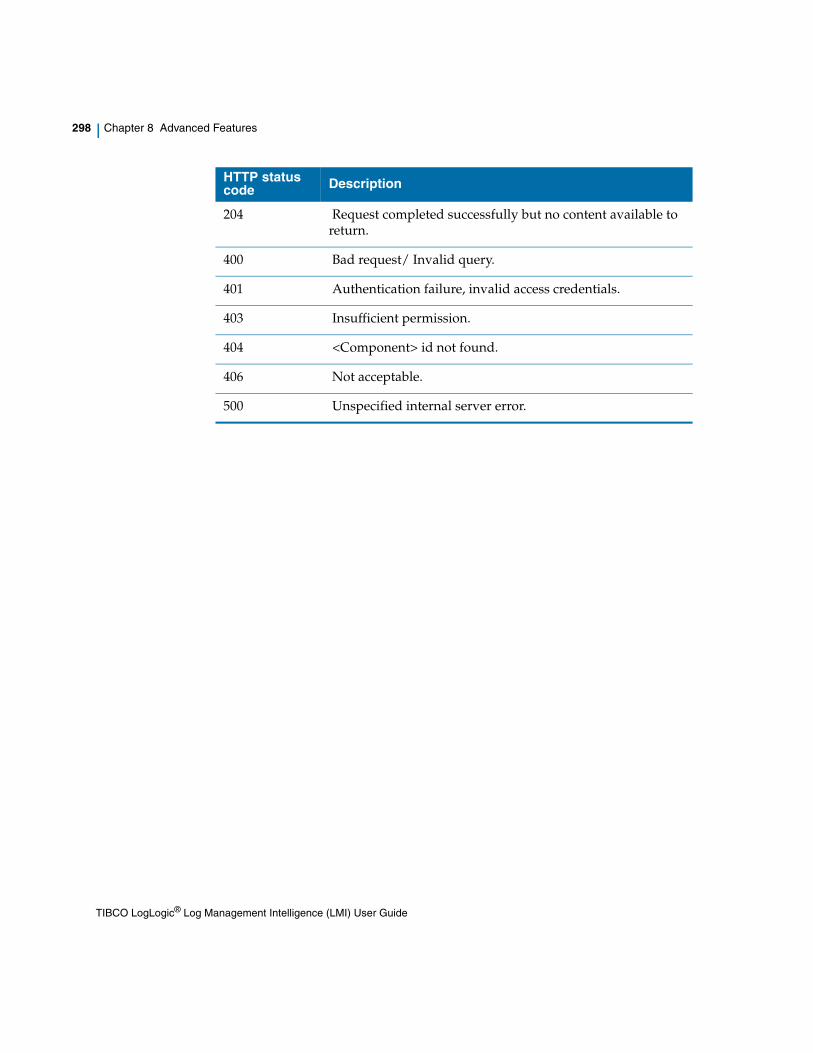
298 | Chapter 8 Advanced Features
204 Request completed successfully but no content available to return.
400 Bad request/ Invalid query.
401 Authentication failure, invalid access credentials.
403 Insufficient permission.
404 <Component> id not found.
406 Not acceptable.
500 Unspecified internal server error.
HTTP status code Description
TIBCO LogLogic® Log Management Intelligence (LMI) User Guide
REST API Support for Advanced Search | 299
REST API Support for Advanced Search
Querying LogLogic using the REST API is composed of three steps:
1. Create a query and obtain its ID.
2. Get status, results, or details from the query (in multiple invocations).
3. Delete the query after all the data has been obtained.
You can omit deleting the query if you create the query with a timeToLive parameter, in which case the query is automatically deleted after some time of inactivity.
Creating a Query This is a single synchronous call where the results are returned immediately after specifying the query:POST <baseurl>/api/v2/query
The result can be any of the following:
• Success. The query returns information about the query, including the ID number of the query and the schema of the results. When the query creation succeeds, although the call returns immediately, LogLogic starts the process of generating results in the background.
• Failure The result is a failure if the query is invalid, for example, if there are syntax errors. In such case, the error details are returned.
Two more parameters can be specified in addition to the query itself:
• cached: Using this parameter, the results are cached temporarily. This allows you to retrieve any window of results from the total results, effectively allowing you to scroll the results up and down. It also allows you to run sub-queries, which is allowed only if the query is cached.
• time-To-Live: The time of inactivity in seconds, after which the query is automatically deleted. The default is 0, which indicates never auto-deleting the query.
The query returns:
• The query ID
Cached queries have a performance penalty and should be only used if needed.
TIBCO LogLogic® Log Management Intelligence (LMI) User Guide
300 | Chapter 8 Advanced Features
• The schema: an array of column descriptors, where each column descriptor contains the name and the type of the column. Similar to a header in a table, the column descriptor allows you to identify the values in each column. You use the column descriptor to interpret the results, as each row in the results is represented by a raw array.
Retrieving ResultsAfter creating the query and obtaining its ID, you can check its status, obtain details about the query, and retrieve results:• GET <baseurl>/api/v2/query/{id}/status
• GET <baseurl>/api/v2/query/{id}/details
• GET <baseurl>/api/v2/query/{id}/results
The API to retrieve results takes the following parameters:
• id: The id of the query to get results from
• offset (optional): The offset of the results to be retrieved. Only available for cached queries. For non-cached queries, you cannot choose the offset; the results must be retrieved sequentially using multiple calls to this API.
• size (optional): The number of rows to return in this call. The API might return fewer or no rows, depending on the number of rows available.
• longPollTimoeut (optional): The time in milliseconds to wait before returning results, if the result rows are not available. Only available for non-cached queries.
This API returns:
• rows: The array of rows. In most cases, it is a subset of the result rows. However, it could be all the results if there are only a few. Whether you need to fetch more reults or not is indicated by the hasMore parameter. To fetch more rows, you must call this method again.
• offset: The offset of the subset of the rows returned.
• errorsOrWarnings: The details of error or warnings, if any.
• hasMore: A boolean value. It is true if more rows are available to fetch, and false if there are no more rows to fetch.
Typically this API is repeatedly invoked to fetch the rows, until hasMore is false. After all the results have been fetched, you can delete the query.
TIBCO LogLogic® Log Management Intelligence (LMI) User Guide
REST API Support for Advanced Search | 301
Deleting a QueryAfter using a query, you must delete it from the system; otherwise it continues using valuable resources. Deleting a query requires only the ID of the query:DELETE <baseurl>/api/v2/query/{id}
Alternatively, you can set the timeToLive parameter while creating the query, so that the query is deleted automatically after the specified time of inactivity.
Creating Sub-QueriesIf a query returns too many rows, you can further refine the results by creating a sub-query. Similar to a filter, a sub-query adds modification to the original query, for example, sorting or grouping.POST <baseurl>/api/v2/query/{id}/subquery/
This is especially useful for user interfaces that allow exploratory querying, where the user is not sure of what exactly to search.
Creating a sub-query requires only the modification parameter. This parameter is an EQL fragment including the operations that must be applied. EQL and SQL both are supported.
After a sub-query is created, the APIs to retrieve results or status, delete, are equivalent to the APIs for the regular queries. The parameters and results are identical.
Examples of modifications:
Use sub-queries only when needed, as they are supported only for cached queries and have a performance penalty compared to regular queries.
Query Description
SORT BY ll_sourceUser Sort by the column ll_sourceUser
GROUP BY ll_eventAction | COLUMNS ll_eventAction, COUNT(*)
Get the count of events per ll_eventAction
ll_device = 'MyDevice’ Get only the events for device MyDevice
TIBCO LogLogic® Log Management Intelligence (LMI) User Guide

302 | Chapter 8 Advanced Features
TIBCO LogLogic® Log Management Intelligence (LMI) User Guide
Syslog Host Field Character Sets | 303
Appendix A Syslog Host Field Character Sets
This appendix describes the acceptable character sets in an ASCII syslog header.
Topics
• Syslog Header Character Sets on page 304
• Exceptions on page 305
TIBCO LogLogic® Log Management Intelligence (LMI) User Guide
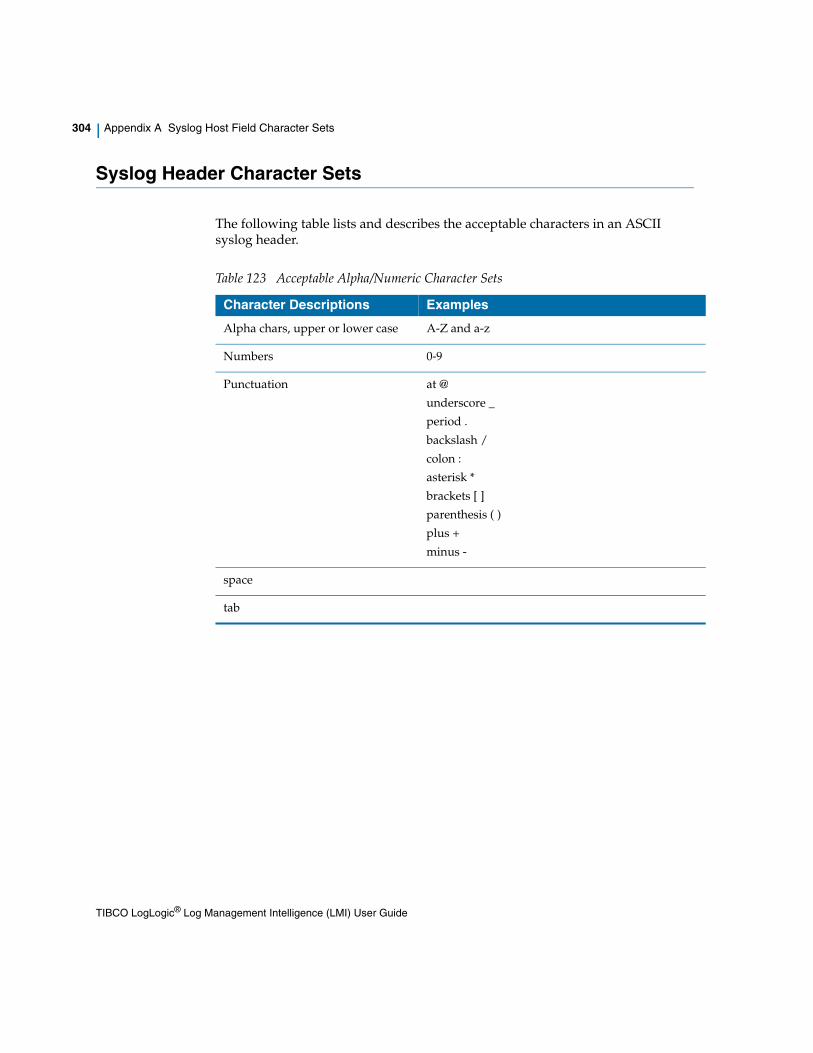
304 | Appendix A Syslog Host Field Character Sets
Syslog Header Character Sets
The following table lists and describes the acceptable characters in an ASCII syslog header.
Table 123 Acceptable Alpha/Numeric Character Sets
Character Descriptions Examples
Alpha chars, upper or lower case A-Z and a-z
Numbers 0-9
Punctuation at @
underscore _
period .
backslash /
colon :
asterisk *
brackets [ ]
parenthesis ( )
plus +
minus -
space
tab
TIBCO LogLogic® Log Management Intelligence (LMI) User Guide
Exceptions | 305
Exceptions
The following exceptions are noted for ASCII syslog headers:
• Some Unix/Linux syslog messages have a path in the process name. That is taken care of by looking for a leading backslash (/) and any number of the following characters:
— Alpha characters, upper or lower case
A-Z
a-z
— The numbers 0-9
— Punctuation including:
underscore _
period .
dash -
• Space and tab use depends on the log source. Some log sources have spaces at the point right before the log source target string is found. Others have only a tab. Specifically:
— Windows messages require a space before the target string.
— Cisco VPN3000 requires a tab.
TIBCO LogLogic® Log Management Intelligence (LMI) User Guide

306 | Appendix A Syslog Host Field Character Sets
TIBCO LogLogic® Log Management Intelligence (LMI) User Guide
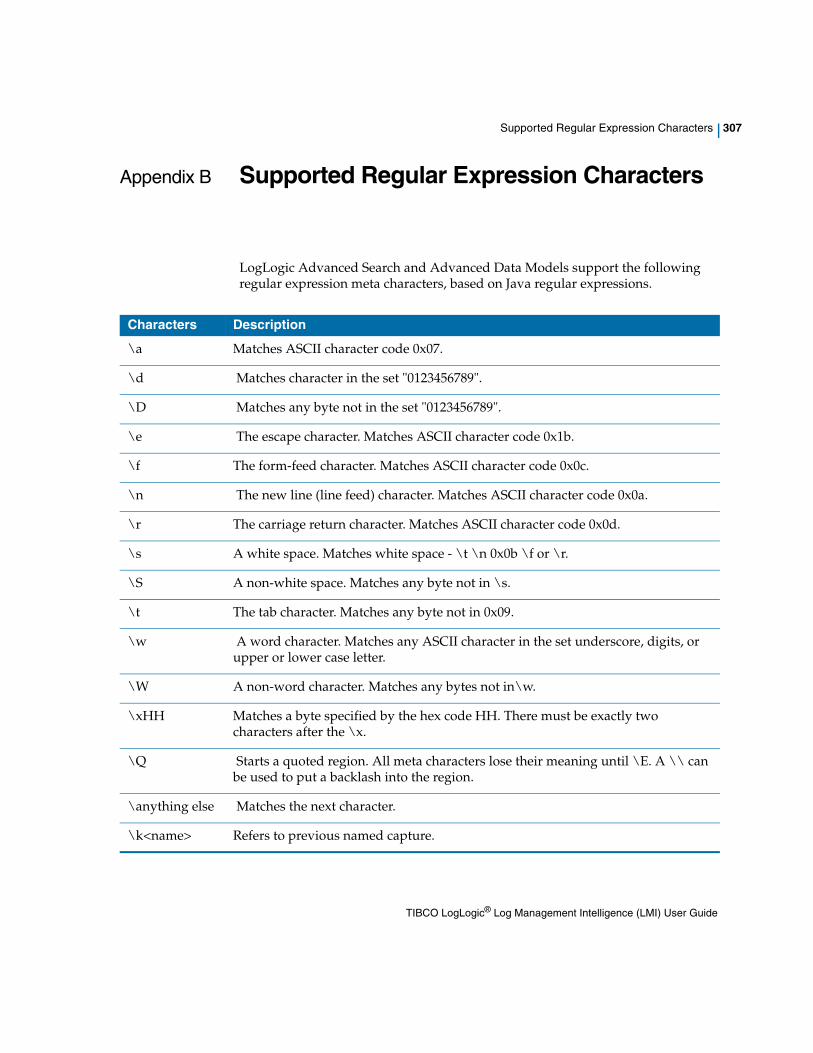
Supported Regular Expression Characters | 307
Appendix B Supported Regular Expression Characters
LogLogic Advanced Search and Advanced Data Models support the following regular expression meta characters, based on Java regular expressions.
Characters Description
\a Matches ASCII character code 0x07.
\d Matches character in the set "0123456789".
\D Matches any byte not in the set "0123456789".
\e The escape character. Matches ASCII character code 0x1b.
\f The form-feed character. Matches ASCII character code 0x0c.
\n The new line (line feed) character. Matches ASCII character code 0x0a.
\r The carriage return character. Matches ASCII character code 0x0d.
\s A white space. Matches white space - \t \n 0x0b \f or \r.
\S A non-white space. Matches any byte not in \s.
\t The tab character. Matches any byte not in 0x09.
\w A word character. Matches any ASCII character in the set underscore, digits, or upper or lower case letter.
\W A non-word character. Matches any bytes not in\w.
\xHH Matches a byte specified by the hex code HH. There must be exactly two characters after the \x.
\Q Starts a quoted region. All meta characters lose their meaning until \E. A \\ can be used to put a backlash into the region.
\anything else Matches the next character.
\k<name> Refers to previous named capture.
TIBCO LogLogic® Log Management Intelligence (LMI) User Guide
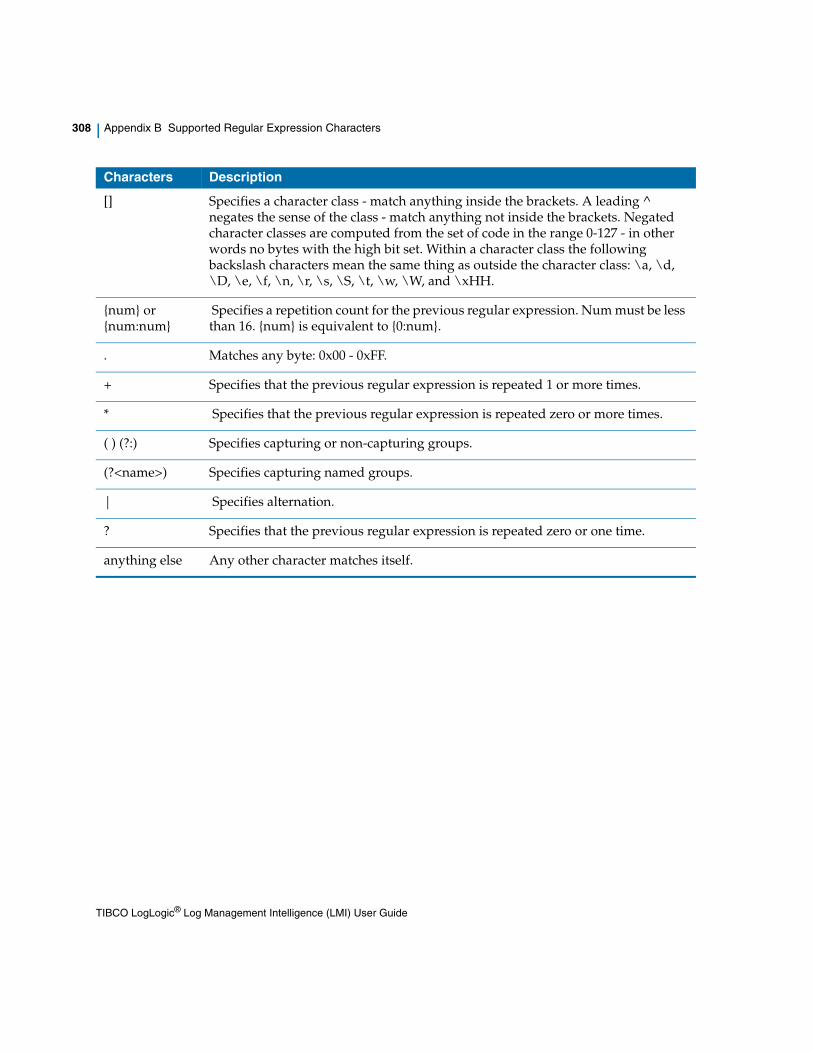
308 | Appendix B Supported Regular Expression Characters
[] Specifies a character class - match anything inside the brackets. A leading ^ negates the sense of the class - match anything not inside the brackets. Negated character classes are computed from the set of code in the range 0-127 - in other words no bytes with the high bit set. Within a character class the following backslash characters mean the same thing as outside the character class: \a, \d, \D, \e, \f, \n, \r, \s, \S, \t, \w, \W, and \xHH.
{num} or {num:num}
Specifies a repetition count for the previous regular expression. Num must be less than 16. {num} is equivalent to {0:num}.
. Matches any byte: 0x00 - 0xFF.
+ Specifies that the previous regular expression is repeated 1 or more times.
* Specifies that the previous regular expression is repeated zero or more times.
( ) (?:) Specifies capturing or non-capturing groups.
(?<name>) Specifies capturing named groups.
| Specifies alternation.
? Specifies that the previous regular expression is repeated zero or one time.
anything else Any other character matches itself.
Characters Description
TIBCO LogLogic® Log Management Intelligence (LMI) User Guide
Search Syntax Reference | 309
Appendix C Search Syntax Reference
LogLogic Advanced Search query language is intuitive and efficient, you can search large data and view results in seconds. The search query mainly supports the following types of languages:
• Event Query Language (EQL)
• Structured Query Language (SQL) dialect
Both EQL and SQL are equally capable for searching, but the syntaxes are different in some cases. For example, simply providing a string in EQL is understood as a full text search, but it will give a syntax error in SQL. So the translation is not always literal. EQL is easy to use, however, SQL is more familiar and scripting is easy using existing SQL tools.
Using EQL, you can define filters, regular expressions, sources, time ranges.
Topics
• Event Query Language Reference on page 310
TIBCO LogLogic® Log Management Intelligence (LMI) User Guide
310 | Appendix C Search Syntax Reference
Event Query Language Reference
The search query supports two types of query languages: Event Query Language (EQL) and LogLogic LMI Structured Query Language (SQL) dialect.
The EQL query is composed of different parts separated by pipe ( | ) character. The pipe delimiter is used to separate the expression and each subsequent expression. Each pipe-delimited expression further processes search results from the preceding expression. For more structured queries, a subset of SQL is supported that is mainly focused on the SELECT statement. Both languages can be used interchangeably; all that is available in EQL can be achieved via SQL and vice versa except the following two differences:
• EQL supports the full text search statement, but SQL does not support this statement. For details, see FILTER Statement.
• Multiple EQL filter expression statements, separated by a pipe, get automatically combined using the AND operator into a single filter expression. SQL does not support this feature.
The EQL and SQL language rules are based on a Backus-Naur Form (BNF)-like notation as shown below:<symbol> ::= <expression> ;
where:
• non-terminal symbols in syntax rules have angle brackets (< >). For example, in the rule <expression> ::= <expression> "+" <integer>; the <expression> is a non-terminal symbol and the rule specifies that as an expression is the addition of any number of integers.
• terminal symbols are shown in double quotes (" "). For example, the "+" in the previous example.
• as an additional shortcut notation to BNF, optional symbols (that can occur zero or one times) are followed by a question mark (?). For example, in the rule <colNameForSort> ::= <colname> (ASC| DESC)?; a column name used for sort is a column name optionally followed by the keywords ASC or DESC.
• optional symbols that can occur zero or any number of times are followed by an asterisk (*). For example, in the rule <itemList> ::= <item> ("," <item>)*; an itemList can contain one or more comma separated items.
• multiple symbols are grouped together using parenthesis ( ) when some common operation is applied, for example, the selection of one member of the group, or to indicate that the entire group can be repeated zero or more times. An example is shown in the previous bullet item.
TIBCO LogLogic® Log Management Intelligence (LMI) User Guide
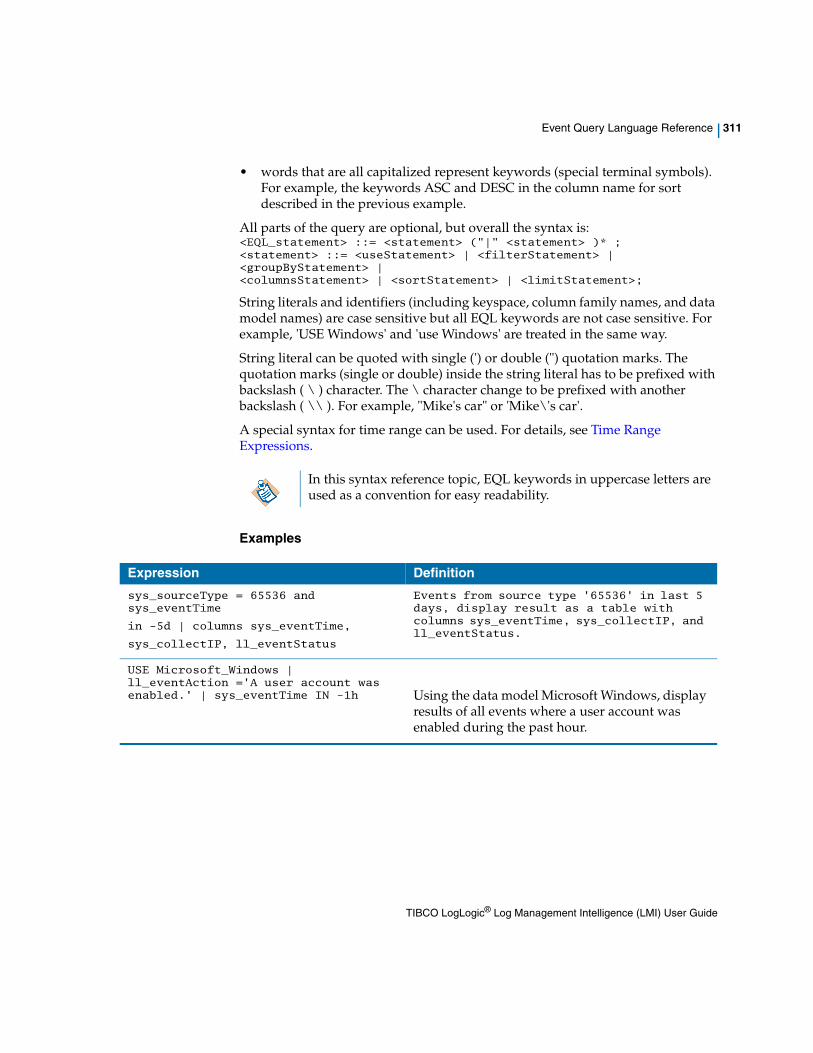
Event Query Language Reference | 311
• words that are all capitalized represent keywords (special terminal symbols). For example, the keywords ASC and DESC in the column name for sort described in the previous example.
All parts of the query are optional, but overall the syntax is:<EQL_statement> ::= <statement> ("|" <statement> )* ;<statement> ::= <useStatement> | <filterStatement> | <groupByStatement> |<columnsStatement> | <sortStatement> | <limitStatement>;
String literals and identifiers (including keyspace, column family names, and data model names) are case sensitive but all EQL keywords are not case sensitive. For example, 'USE Windows' and 'use Windows' are treated in the same way.
String literal can be quoted with single (') or double (") quotation marks. The quotation marks (single or double) inside the string literal has to be prefixed with backslash ( \ ) character. The \ character change to be prefixed with another backslash ( \\ ). For example, "Mike's car" or 'Mike\'s car'.
A special syntax for time range can be used. For details, see Time Range Expressions.
Examples
In this syntax reference topic, EQL keywords in uppercase letters are used as a convention for easy readability.
Expression Definition
sys_sourceType = 65536 and sys_eventTime
in -5d | columns sys_eventTime,
sys_collectIP, ll_eventStatus
Events from source type '65536' in last 5 days, display result as a table with columns sys_eventTime, sys_collectIP, and ll_eventStatus.
USE Microsoft_Windows | ll_eventAction ='A user account was enabled.' | sys_eventTime IN -1h Using the data model Microsoft Windows, display
results of all events where a user account was enabled during the past hour.
TIBCO LogLogic® Log Management Intelligence (LMI) User Guide
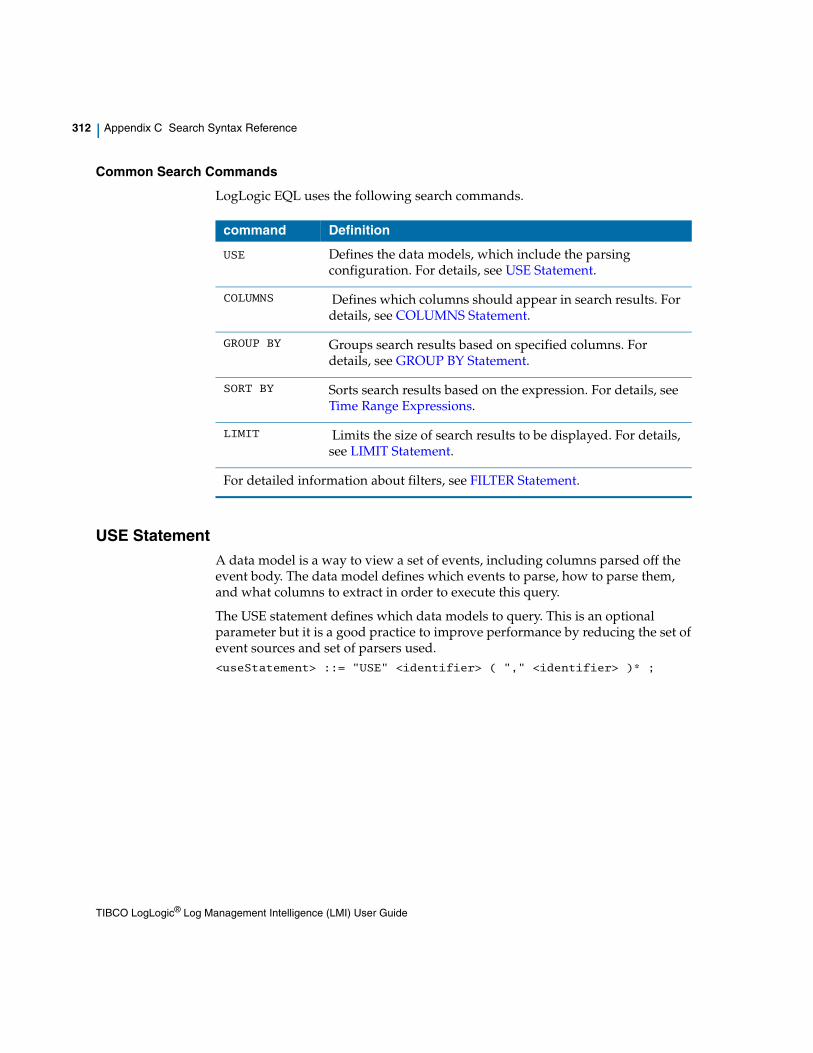
312 | Appendix C Search Syntax Reference
Common Search Commands
LogLogic EQL uses the following search commands.
USE StatementA data model is a way to view a set of events, including columns parsed off the event body. The data model defines which events to parse, how to parse them, and what columns to extract in order to execute this query.
The USE statement defines which data models to query. This is an optional parameter but it is a good practice to improve performance by reducing the set of event sources and set of parsers used.<useStatement> ::= "USE" <identifier> ( "," <identifier> )* ;
command Definition
USE Defines the data models, which include the parsing configuration. For details, see USE Statement.
COLUMNS Defines which columns should appear in search results. For details, see COLUMNS Statement.
GROUP BY Groups search results based on specified columns. For details, see GROUP BY Statement.
SORT BY Sorts search results based on the expression. For details, see Time Range Expressions.
LIMIT Limits the size of search results to be displayed. For details, see LIMIT Statement.
For detailed information about filters, see FILTER Statement.
TIBCO LogLogic® Log Management Intelligence (LMI) User Guide
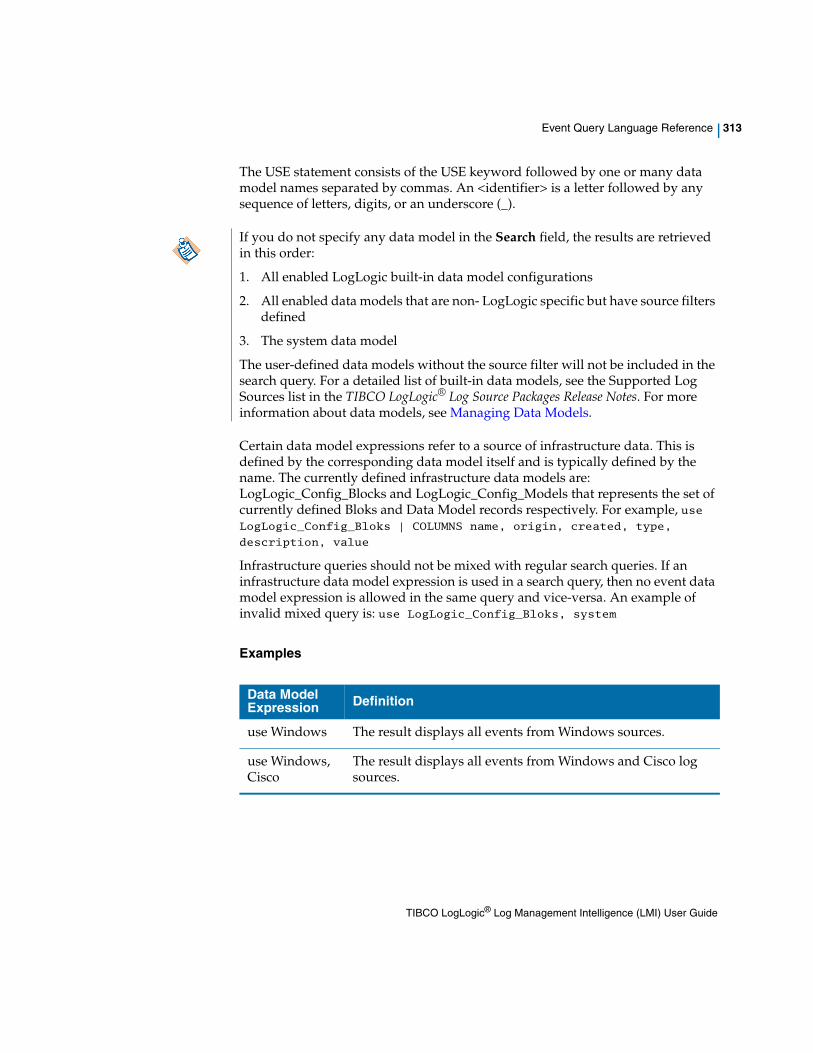
Event Query Language Reference | 313
The USE statement consists of the USE keyword followed by one or many data model names separated by commas. An <identifier> is a letter followed by any sequence of letters, digits, or an underscore (_).
Certain data model expressions refer to a source of infrastructure data. This is defined by the corresponding data model itself and is typically defined by the name. The currently defined infrastructure data models are: LogLogic_Config_Blocks and LogLogic_Config_Models that represents the set of currently defined Bloks and Data Model records respectively. For example, use LogLogic_Config_Bloks | COLUMNS name, origin, created, type,
description, value
Infrastructure queries should not be mixed with regular search queries. If an infrastructure data model expression is used in a search query, then no event data model expression is allowed in the same query and vice-versa. An example of invalid mixed query is: use LogLogic_Config_Bloks, system
Examples
If you do not specify any data model in the Search field, the results are retrieved in this order:
1. All enabled LogLogic built-in data model configurations
2. All enabled data models that are non- LogLogic specific but have source filters defined
3. The system data model
The user-defined data models without the source filter will not be included in the search query. For a detailed list of built-in data models, see the Supported Log Sources list in the TIBCO LogLogic® Log Source Packages Release Notes. For more information about data models, see Managing Data Models.
Data Model Expression Definition
use Windows The result displays all events from Windows sources.
use Windows, Cisco
The result displays all events from Windows and Cisco log sources.
TIBCO LogLogic® Log Management Intelligence (LMI) User Guide
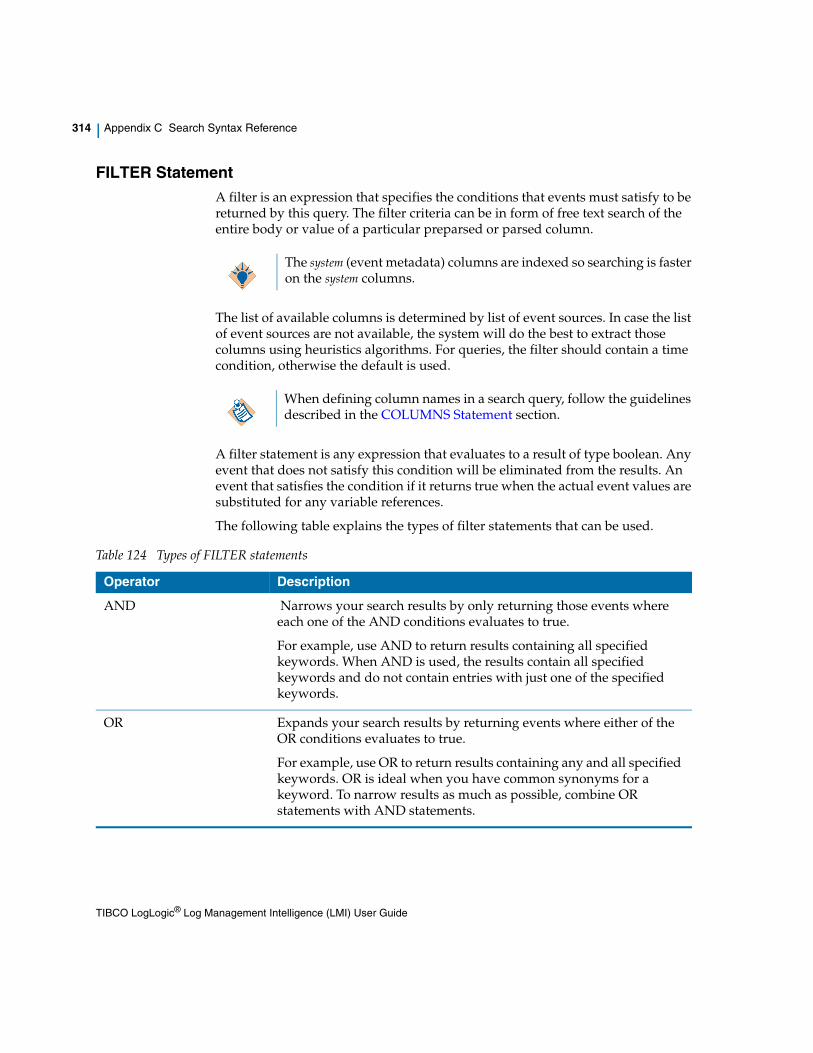
314 | Appendix C Search Syntax Reference
FILTER StatementA filter is an expression that specifies the conditions that events must satisfy to be returned by this query. The filter criteria can be in form of free text search of the entire body or value of a particular preparsed or parsed column.
The list of available columns is determined by list of event sources. In case the list of event sources are not available, the system will do the best to extract those columns using heuristics algorithms. For queries, the filter should contain a time condition, otherwise the default is used.
A filter statement is any expression that evaluates to a result of type boolean. Any event that does not satisfy this condition will be eliminated from the results. An event that satisfies the condition if it returns true when the actual event values are substituted for any variable references.
The following table explains the types of filter statements that can be used.
The system (event metadata) columns are indexed so searching is faster on the system columns.
When defining column names in a search query, follow the guidelines described in the COLUMNS Statement section.
Table 124 Types of FILTER statements
Operator Description
AND Narrows your search results by only returning those events where each one of the AND conditions evaluates to true.
For example, use AND to return results containing all specified keywords. When AND is used, the results contain all specified keywords and do not contain entries with just one of the specified keywords.
OR Expands your search results by returning events where either of the OR conditions evaluates to true.
For example, use OR to return results containing any and all specified keywords. OR is ideal when you have common synonyms for a keyword. To narrow results as much as possible, combine OR statements with AND statements.
TIBCO LogLogic® Log Management Intelligence (LMI) User Guide
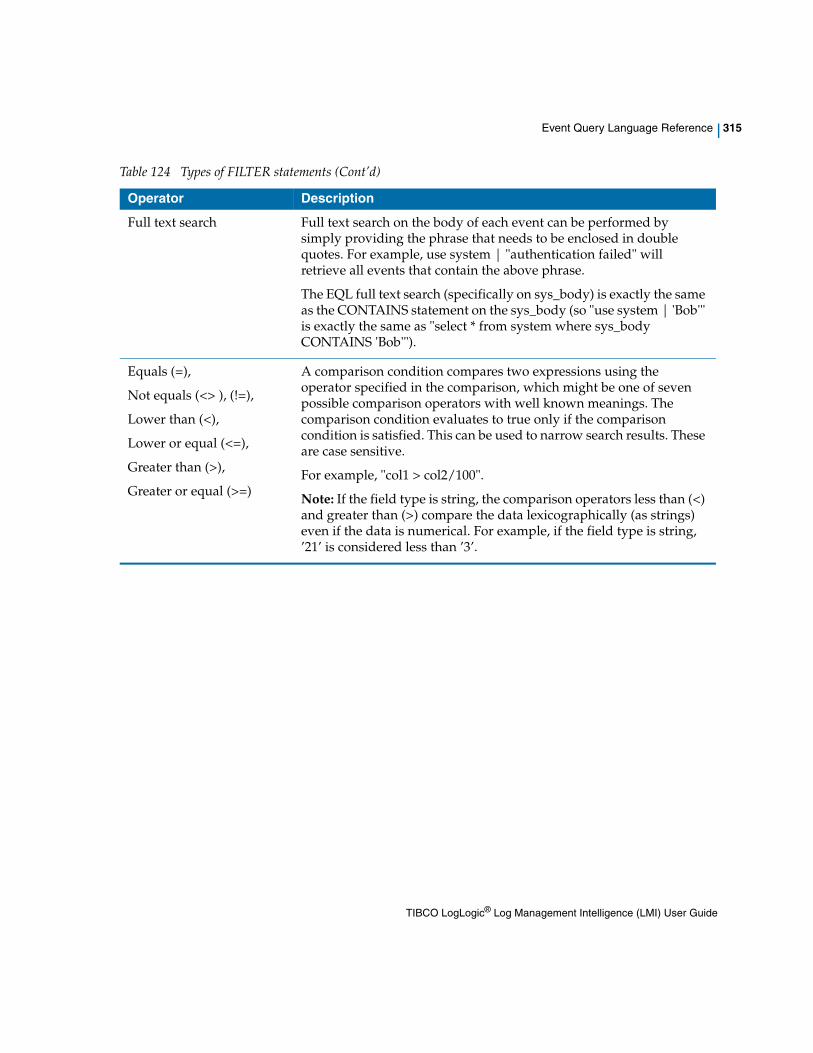
Event Query Language Reference | 315
Full text search Full text search on the body of each event can be performed by simply providing the phrase that needs to be enclosed in double quotes. For example, use system | "authentication failed" will retrieve all events that contain the above phrase.
The EQL full text search (specifically on sys_body) is exactly the same as the CONTAINS statement on the sys_body (so "use system | 'Bob'" is exactly the same as "select * from system where sys_body CONTAINS 'Bob'").
Equals (=),
Not equals (<> ), (!=),
Lower than (<),
Lower or equal (<=),
Greater than (>),
Greater or equal (>=)
A comparison condition compares two expressions using the operator specified in the comparison, which might be one of seven possible comparison operators with well known meanings. The comparison condition evaluates to true only if the comparison condition is satisfied. This can be used to narrow search results. These are case sensitive.
For example, "col1 > col2/100".
Note: If the field type is string, the comparison operators less than (<) and greater than (>) compare the data lexicographically (as strings) even if the data is numerical. For example, if the field type is string, ’21’ is considered less than ’3’.
Table 124 Types of FILTER statements (Cont’d)
Operator Description
TIBCO LogLogic® Log Management Intelligence (LMI) User Guide
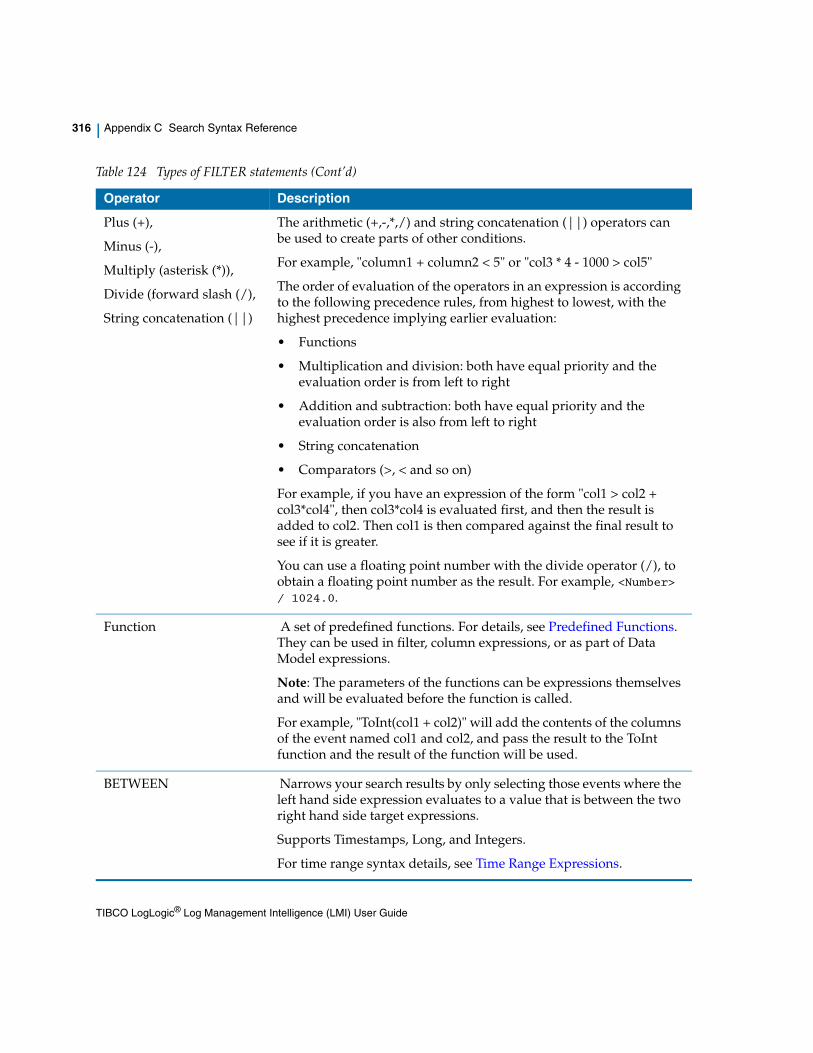
316 | Appendix C Search Syntax Reference
Plus (+),
Minus (-),
Multiply (asterisk (*)),
Divide (forward slash (/),
String concatenation (||)
The arithmetic (+,-,*,/) and string concatenation (||) operators can be used to create parts of other conditions.
For example, "column1 + column2 < 5" or "col3 * 4 - 1000 > col5"
The order of evaluation of the operators in an expression is according to the following precedence rules, from highest to lowest, with the highest precedence implying earlier evaluation:
• Functions
• Multiplication and division: both have equal priority and the evaluation order is from left to right
• Addition and subtraction: both have equal priority and the evaluation order is also from left to right
• String concatenation
• Comparators (>, < and so on)
For example, if you have an expression of the form "col1 > col2 + col3*col4", then col3*col4 is evaluated first, and then the result is added to col2. Then col1 is then compared against the final result to see if it is greater.
You can use a floating point number with the divide operator (/), to obtain a floating point number as the result. For example, <Number> / 1024.0.
Function A set of predefined functions. For details, see Predefined Functions. They can be used in filter, column expressions, or as part of Data Model expressions.
Note: The parameters of the functions can be expressions themselves and will be evaluated before the function is called.
For example, "ToInt(col1 + col2)" will add the contents of the columns of the event named col1 and col2, and pass the result to the ToInt function and the result of the function will be used.
BETWEEN Narrows your search results by only selecting those events where the left hand side expression evaluates to a value that is between the two right hand side target expressions.
Supports Timestamps, Long, and Integers.
For time range syntax details, see Time Range Expressions.
Table 124 Types of FILTER statements (Cont’d)
Operator Description
TIBCO LogLogic® Log Management Intelligence (LMI) User Guide
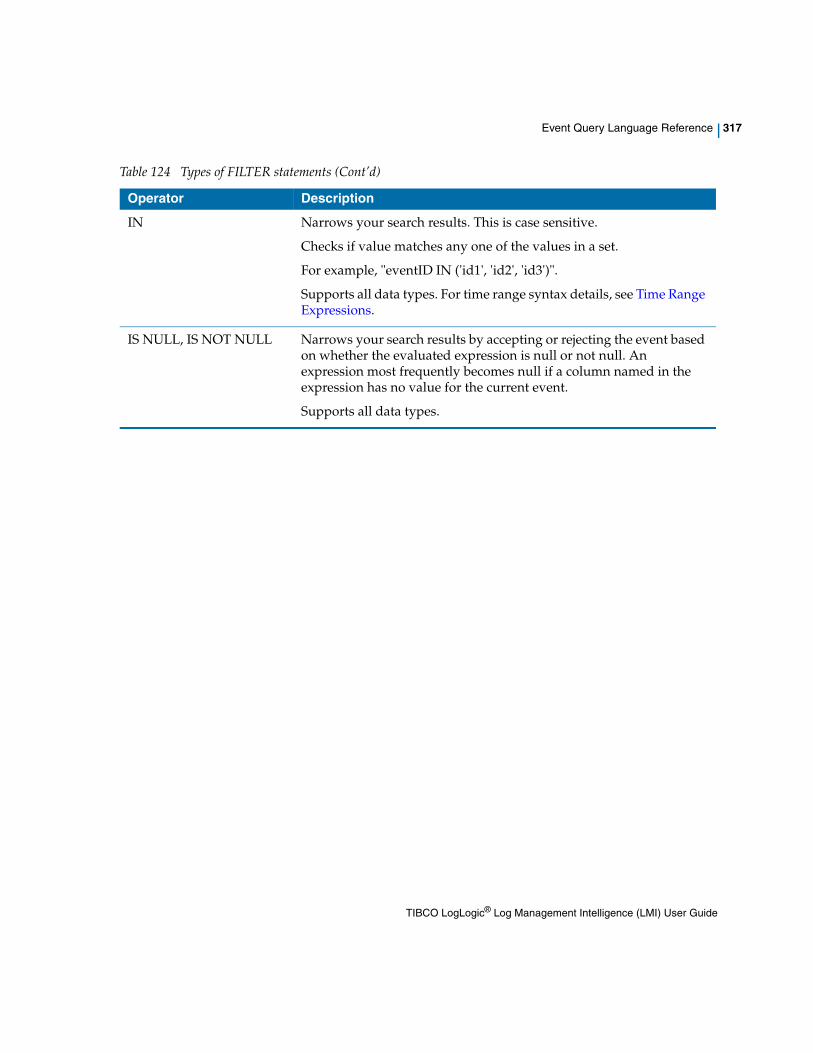
Event Query Language Reference | 317
IN Narrows your search results. This is case sensitive.
Checks if value matches any one of the values in a set.
For example, "eventID IN ('id1', 'id2', 'id3')".
Supports all data types. For time range syntax details, see Time Range Expressions.
IS NULL, IS NOT NULL Narrows your search results by accepting or rejecting the event based on whether the evaluated expression is null or not null. An expression most frequently becomes null if a column named in the expression has no value for the current event.
Supports all data types.
Table 124 Types of FILTER statements (Cont’d)
Operator Description
TIBCO LogLogic® Log Management Intelligence (LMI) User Guide
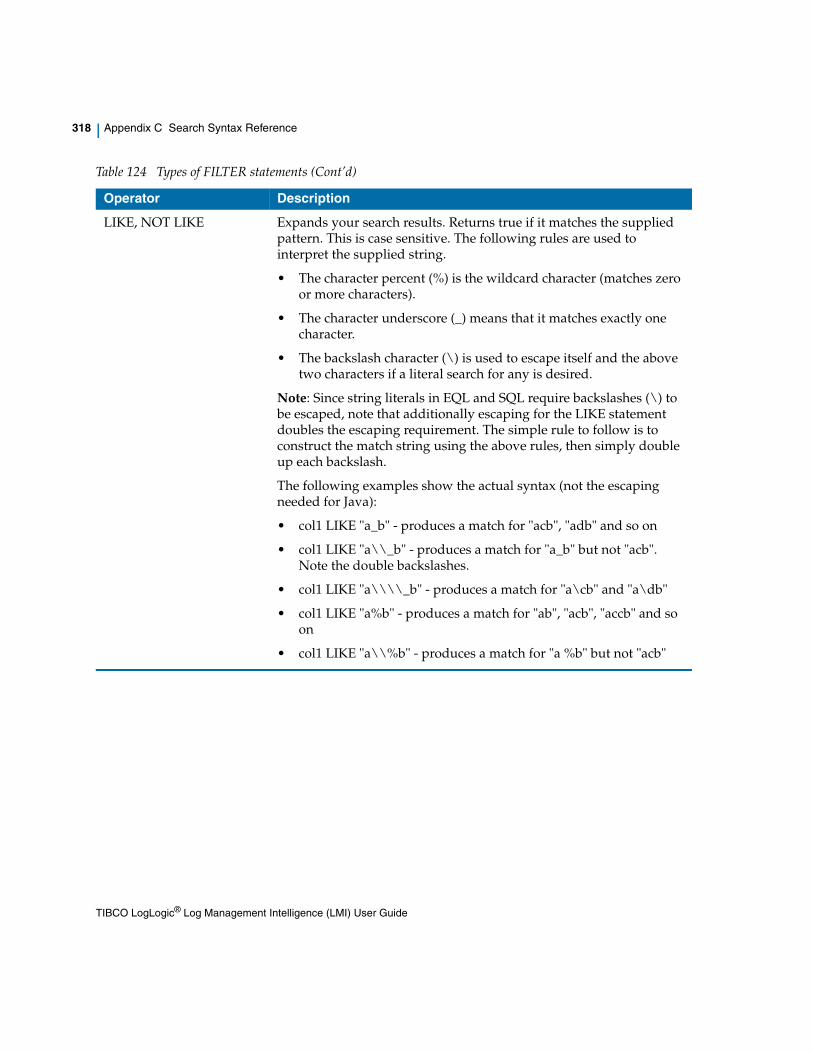
318 | Appendix C Search Syntax Reference
LIKE, NOT LIKE Expands your search results. Returns true if it matches the supplied pattern. This is case sensitive. The following rules are used to interpret the supplied string.
• The character percent (%) is the wildcard character (matches zero or more characters).
• The character underscore (_) means that it matches exactly one character.
• The backslash character (\) is used to escape itself and the above two characters if a literal search for any is desired.
Note: Since string literals in EQL and SQL require backslashes (\) to be escaped, note that additionally escaping for the LIKE statement doubles the escaping requirement. The simple rule to follow is to construct the match string using the above rules, then simply double up each backslash.
The following examples show the actual syntax (not the escaping needed for Java):
• col1 LIKE "a_b" - produces a match for "acb", "adb" and so on
• col1 LIKE "a\\_b" - produces a match for "a_b" but not "acb". Note the double backslashes.
• col1 LIKE "a\\\\_b" - produces a match for "a\cb" and "a\db"
• col1 LIKE "a%b" - produces a match for "ab", "acb", "accb" and so on
• col1 LIKE "a\\%b" - produces a match for "a %b" but not "acb"
Table 124 Types of FILTER statements (Cont’d)
Operator Description
TIBCO LogLogic® Log Management Intelligence (LMI) User Guide
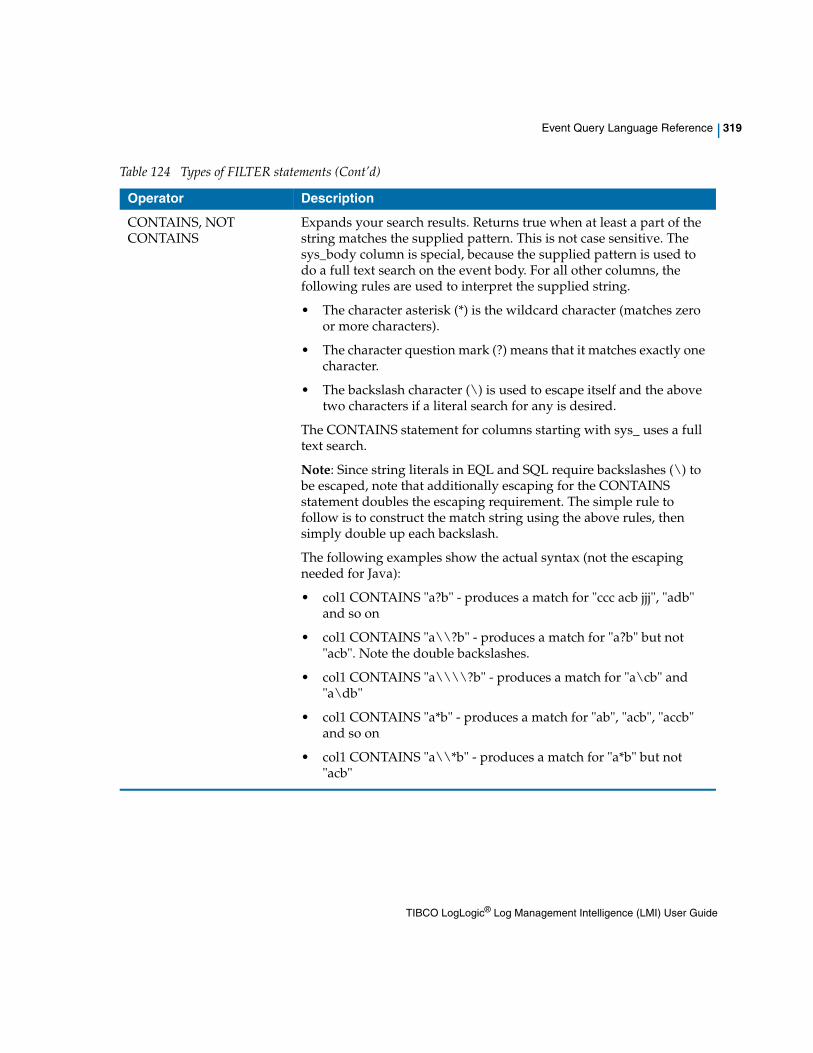
Event Query Language Reference | 319
CONTAINS, NOT CONTAINS
Expands your search results. Returns true when at least a part of the string matches the supplied pattern. This is not case sensitive. The sys_body column is special, because the supplied pattern is used to do a full text search on the event body. For all other columns, the following rules are used to interpret the supplied string.
• The character asterisk (*) is the wildcard character (matches zero or more characters).
• The character question mark (?) means that it matches exactly one character.
• The backslash character (\) is used to escape itself and the above two characters if a literal search for any is desired.
The CONTAINS statement for columns starting with sys_ uses a full text search.
Note: Since string literals in EQL and SQL require backslashes (\) to be escaped, note that additionally escaping for the CONTAINS statement doubles the escaping requirement. The simple rule to follow is to construct the match string using the above rules, then simply double up each backslash.
The following examples show the actual syntax (not the escaping needed for Java):
• col1 CONTAINS "a?b" - produces a match for "ccc acb jjj", "adb" and so on
• col1 CONTAINS "a\\?b" - produces a match for "a?b" but not "acb". Note the double backslashes.
• col1 CONTAINS "a\\\\?b" - produces a match for "a\cb" and "a\db"
• col1 CONTAINS "a*b" - produces a match for "ab", "acb", "accb" and so on
• col1 CONTAINS "a\\*b" - produces a match for "a*b" but not "acb"
Table 124 Types of FILTER statements (Cont’d)
Operator Description
TIBCO LogLogic® Log Management Intelligence (LMI) User Guide
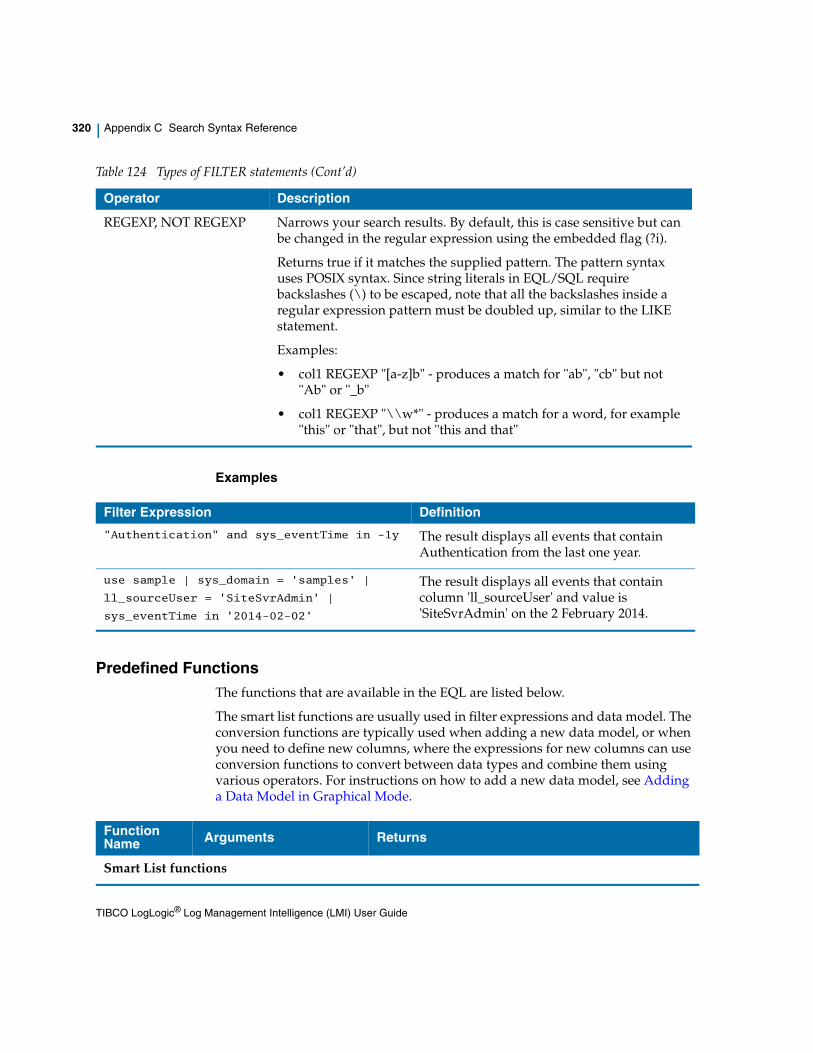
320 | Appendix C Search Syntax Reference
Examples
Predefined FunctionsThe functions that are available in the EQL are listed below.
The smart list functions are usually used in filter expressions and data model. The conversion functions are typically used when adding a new data model, or when you need to define new columns, where the expressions for new columns can use conversion functions to convert between data types and combine them using various operators. For instructions on how to add a new data model, see Adding a Data Model in Graphical Mode.
REGEXP, NOT REGEXP Narrows your search results. By default, this is case sensitive but can be changed in the regular expression using the embedded flag (?i).
Returns true if it matches the supplied pattern. The pattern syntax uses POSIX syntax. Since string literals in EQL/SQL require backslashes (\) to be escaped, note that all the backslashes inside a regular expression pattern must be doubled up, similar to the LIKE statement.
Examples:
• col1 REGEXP "[a-z]b" - produces a match for "ab", "cb" but not "Ab" or "_b"
• col1 REGEXP "\\w*" - produces a match for a word, for example "this" or "that", but not "this and that"
Table 124 Types of FILTER statements (Cont’d)
Operator Description
Filter Expression Definition
"Authentication" and sys_eventTime in -1y The result displays all events that contain Authentication from the last one year.
use sample | sys_domain = 'samples' |
ll_sourceUser = 'SiteSvrAdmin' |
sys_eventTime in '2014-02-02'
The result displays all events that contain column 'll_sourceUser' and value is 'SiteSvrAdmin' on the 2 February 2014.
Function Name Arguments Returns
Smart List functions
TIBCO LogLogic® Log Management Intelligence (LMI) User Guide
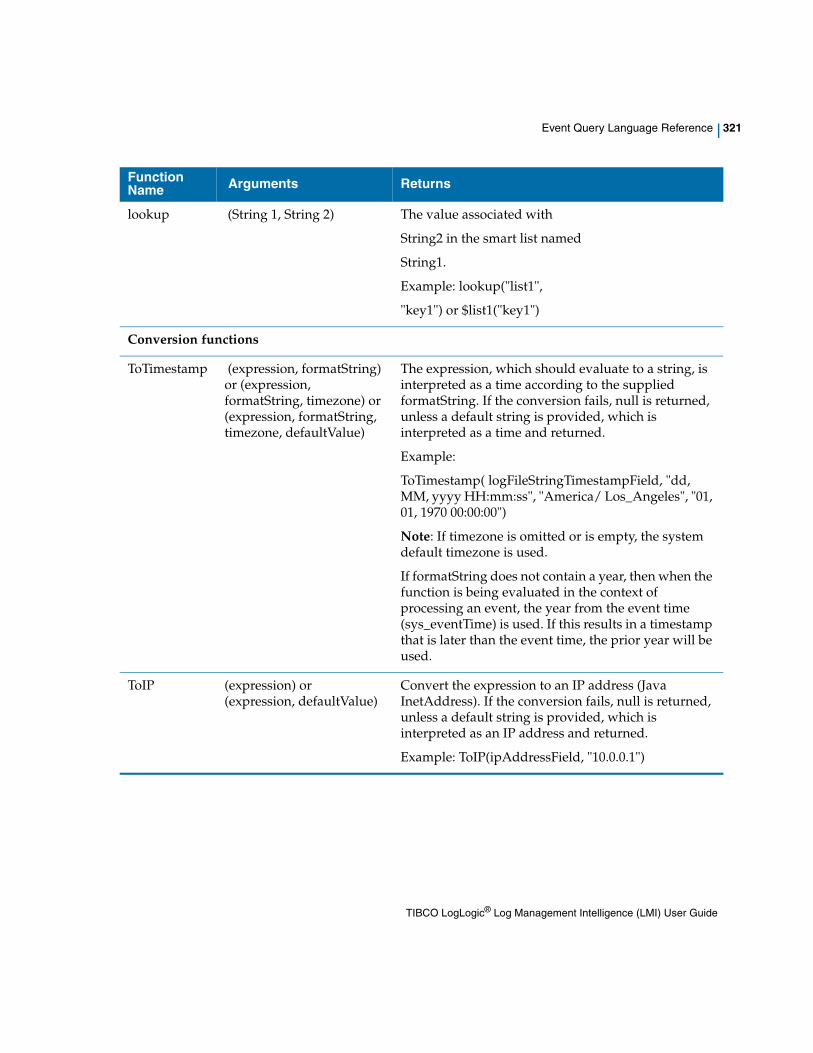
Event Query Language Reference | 321
lookup (String 1, String 2) The value associated with
String2 in the smart list named
String1.
Example: lookup("list1",
"key1") or $list1("key1")
Conversion functions
ToTimestamp (expression, formatString) or (expression, formatString, timezone) or (expression, formatString, timezone, defaultValue)
The expression, which should evaluate to a string, is interpreted as a time according to the supplied formatString. If the conversion fails, null is returned, unless a default string is provided, which is interpreted as a time and returned.
Example:
ToTimestamp( logFileStringTimestampField, "dd, MM, yyyy HH:mm:ss", "America/ Los_Angeles", "01, 01, 1970 00:00:00")
Note: If timezone is omitted or is empty, the system default timezone is used.
If formatString does not contain a year, then when the function is being evaluated in the context of processing an event, the year from the event time (sys_eventTime) is used. If this results in a timestamp that is later than the event time, the prior year will be used.
ToIP (expression) or (expression, defaultValue)
Convert the expression to an IP address (Java InetAddress). If the conversion fails, null is returned, unless a default string is provided, which is interpreted as an IP address and returned.
Example: ToIP(ipAddressField, "10.0.0.1")
Function Name Arguments Returns
TIBCO LogLogic® Log Management Intelligence (LMI) User Guide
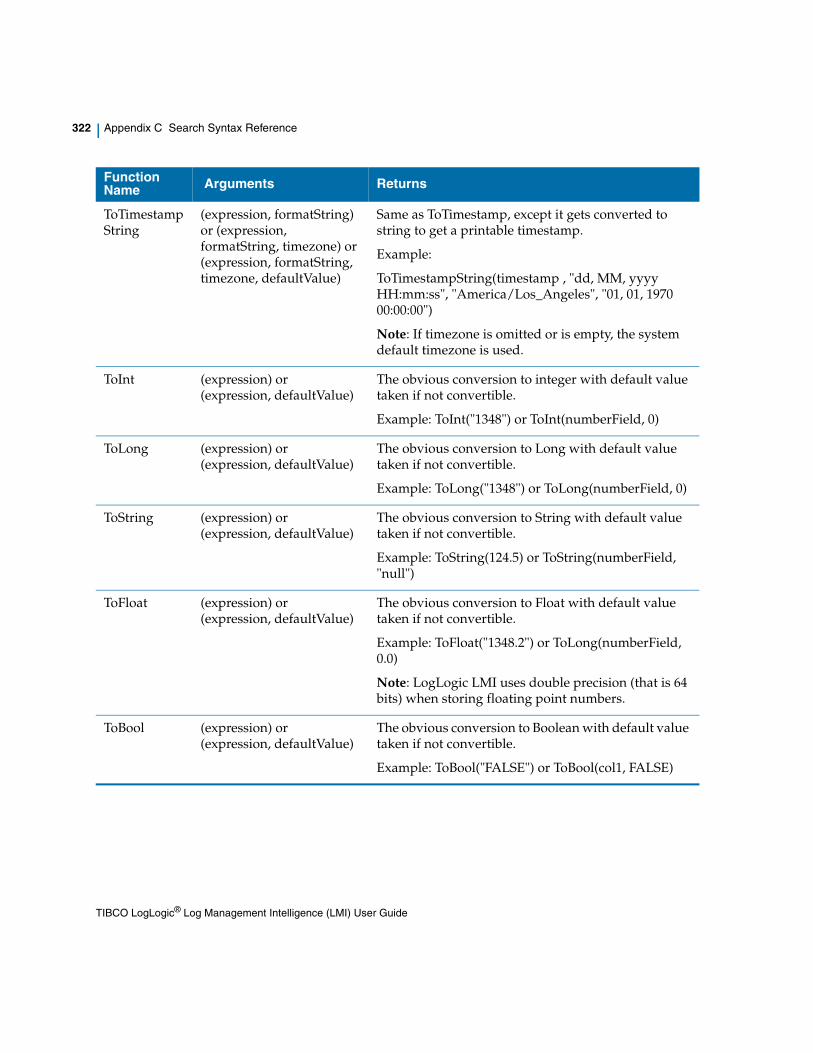
322 | Appendix C Search Syntax Reference
ToTimestampString
(expression, formatString) or (expression, formatString, timezone) or (expression, formatString, timezone, defaultValue)
Same as ToTimestamp, except it gets converted to string to get a printable timestamp.
Example:
ToTimestampString(timestamp , "dd, MM, yyyy HH:mm:ss", "America/Los_Angeles", "01, 01, 1970 00:00:00")
Note: If timezone is omitted or is empty, the system default timezone is used.
ToInt (expression) or (expression, defaultValue)
The obvious conversion to integer with default value taken if not convertible.
Example: ToInt("1348") or ToInt(numberField, 0)
ToLong (expression) or (expression, defaultValue)
The obvious conversion to Long with default value taken if not convertible.
Example: ToLong("1348") or ToLong(numberField, 0)
ToString (expression) or (expression, defaultValue)
The obvious conversion to String with default value taken if not convertible.
Example: ToString(124.5) or ToString(numberField, "null")
ToFloat (expression) or (expression, defaultValue)
The obvious conversion to Float with default value taken if not convertible.
Example: ToFloat("1348.2") or ToLong(numberField, 0.0)
Note: LogLogic LMI uses double precision (that is 64 bits) when storing floating point numbers.
ToBool (expression) or (expression, defaultValue)
The obvious conversion to Boolean with default value taken if not convertible.
Example: ToBool("FALSE") or ToBool(col1, FALSE)
Function Name Arguments Returns
TIBCO LogLogic® Log Management Intelligence (LMI) User Guide
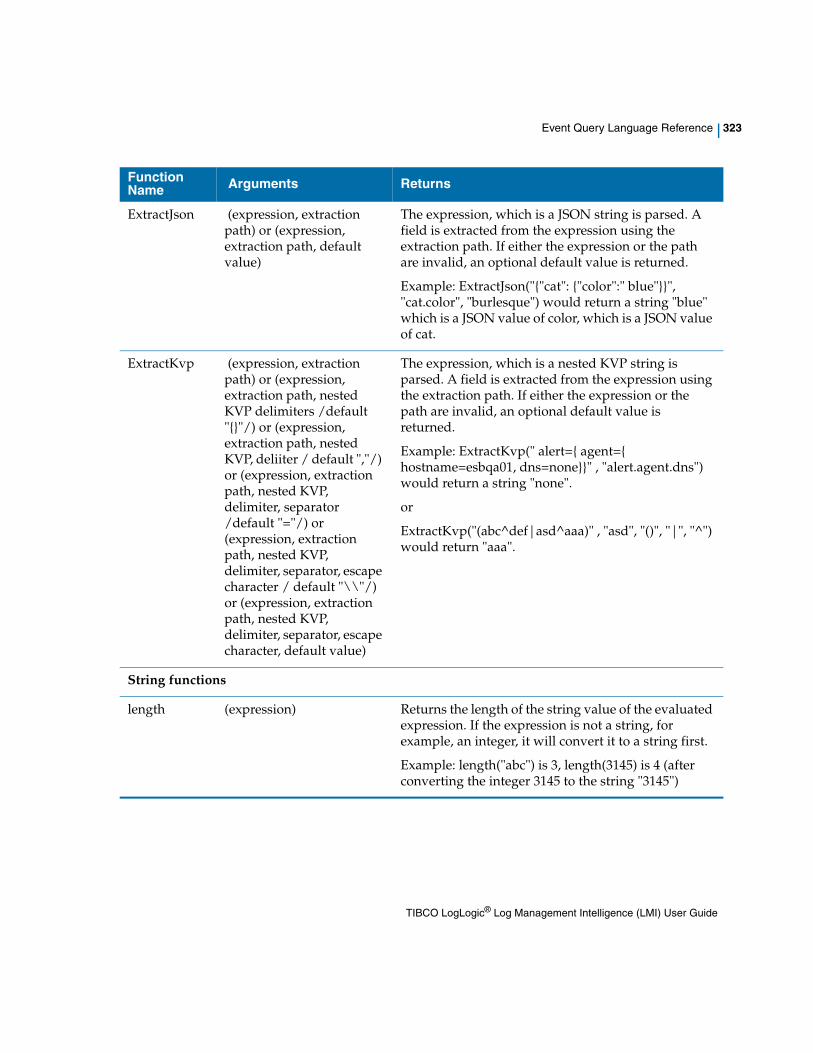
Event Query Language Reference | 323
ExtractJson (expression, extraction path) or (expression, extraction path, default value)
The expression, which is a JSON string is parsed. A field is extracted from the expression using the extraction path. If either the expression or the path are invalid, an optional default value is returned.
Example: ExtractJson("{"cat": {"color":" blue"}}", "cat.color", "burlesque") would return a string "blue" which is a JSON value of color, which is a JSON value of cat.
ExtractKvp (expression, extraction path) or (expression, extraction path, nested KVP delimiters /default "{}"/) or (expression, extraction path, nested KVP, deliiter / default ","/) or (expression, extraction path, nested KVP, delimiter, separator /default "="/) or (expression, extraction path, nested KVP, delimiter, separator, escape character / default "\\"/) or (expression, extraction path, nested KVP, delimiter, separator, escape character, default value)
The expression, which is a nested KVP string is parsed. A field is extracted from the expression using the extraction path. If either the expression or the path are invalid, an optional default value is returned.
Example: ExtractKvp(" alert={ agent={ hostname=esbqa01, dns=none}}" , "alert.agent.dns") would return a string "none".
or
ExtractKvp("(abc^def|asd^aaa)" , "asd", "()", "|", "^") would return "aaa".
String functions
length (expression) Returns the length of the string value of the evaluated expression. If the expression is not a string, for example, an integer, it will convert it to a string first.
Example: length("abc") is 3, length(3145) is 4 (after converting the integer 3145 to the string "3145")
Function Name Arguments Returns
TIBCO LogLogic® Log Management Intelligence (LMI) User Guide
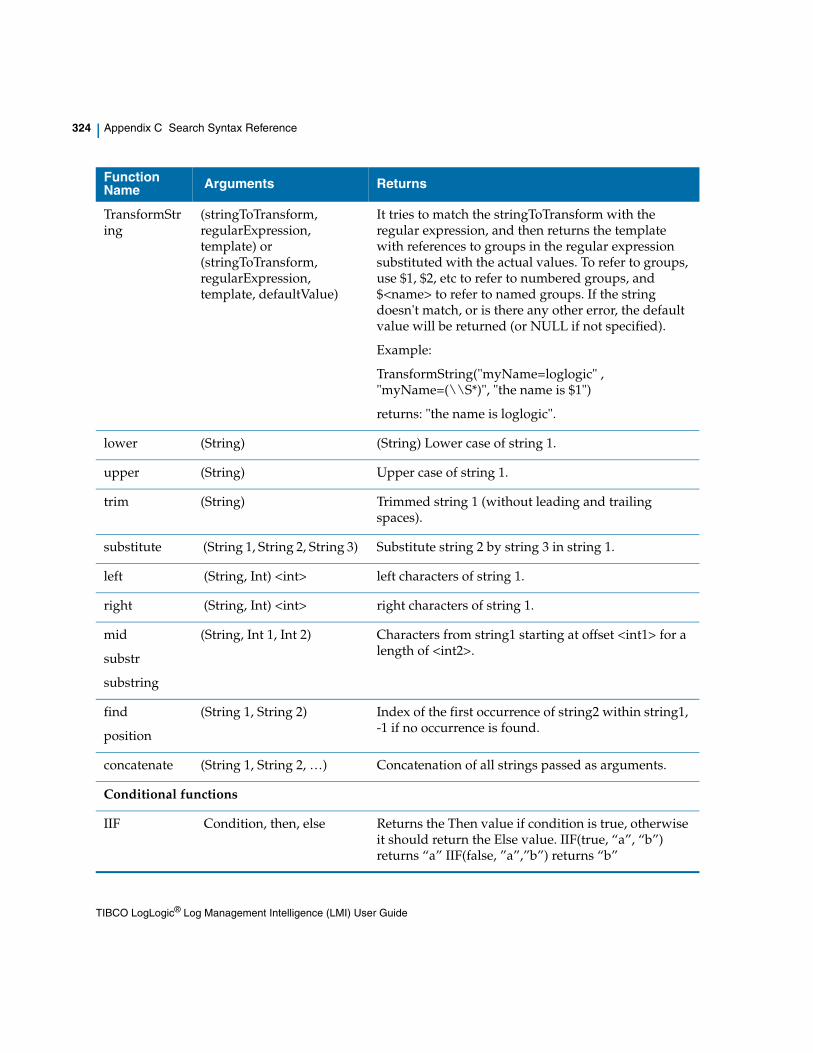
324 | Appendix C Search Syntax Reference
TransformString
(stringToTransform, regularExpression, template) or (stringToTransform, regularExpression, template, defaultValue)
It tries to match the stringToTransform with the regular expression, and then returns the template with references to groups in the regular expression substituted with the actual values. To refer to groups, use $1, $2, etc to refer to numbered groups, and $<name> to refer to named groups. If the string doesn't match, or is there any other error, the default value will be returned (or NULL if not specified).
Example:
TransformString("myName=loglogic" , "myName=(\\S*)", "the name is $1")
returns: "the name is loglogic".
lower (String) (String) Lower case of string 1.
upper (String) Upper case of string 1.
trim (String) Trimmed string 1 (without leading and trailing spaces).
substitute (String 1, String 2, String 3) Substitute string 2 by string 3 in string 1.
left (String, Int) <int> left characters of string 1.
right (String, Int) <int> right characters of string 1.
mid
substr
substring
(String, Int 1, Int 2) Characters from string1 starting at offset <int1> for a length of <int2>.
find
position
(String 1, String 2) Index of the first occurrence of string2 within string1, -1 if no occurrence is found.
concatenate (String 1, String 2, …) Concatenation of all strings passed as arguments.
Conditional functions
IIF Condition, then, else Returns the Then value if condition is true, otherwise it should return the Else value. IIF(true, “a”, “b”) returns “a” IIF(false, ”a”,”b”) returns “b”
Function Name Arguments Returns
TIBCO LogLogic® Log Management Intelligence (LMI) User Guide
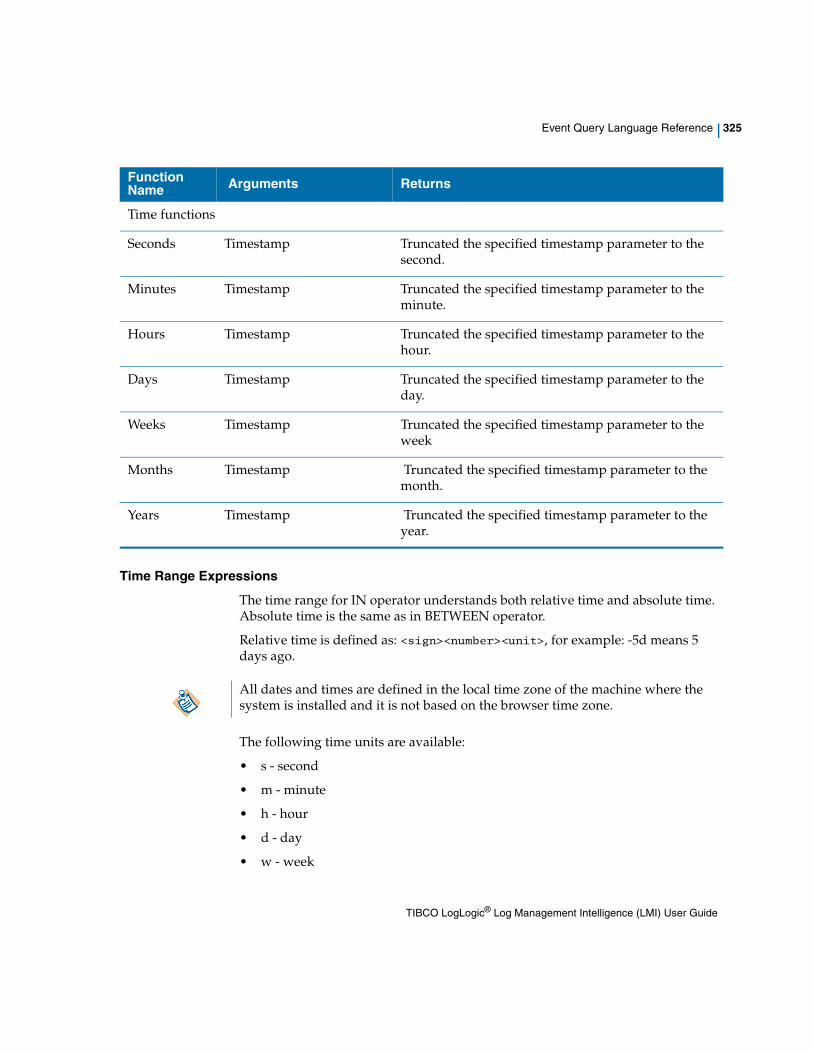
Event Query Language Reference | 325
Time Range Expressions
The time range for IN operator understands both relative time and absolute time. Absolute time is the same as in BETWEEN operator.
Relative time is defined as: <sign><number><unit>, for example: -5d means 5 days ago.
The following time units are available:
• s - second
• m - minute
• h - hour
• d - day
• w - week
Time functions
Seconds Timestamp Truncated the specified timestamp parameter to the second.
Minutes Timestamp Truncated the specified timestamp parameter to the minute.
Hours Timestamp Truncated the specified timestamp parameter to the hour.
Days Timestamp Truncated the specified timestamp parameter to the day.
Weeks Timestamp Truncated the specified timestamp parameter to the week
Months Timestamp Truncated the specified timestamp parameter to the month.
Years Timestamp Truncated the specified timestamp parameter to the year.
Function Name Arguments Returns
All dates and times are defined in the local time zone of the machine where the system is installed and it is not based on the browser time zone.
TIBCO LogLogic® Log Management Intelligence (LMI) User Guide
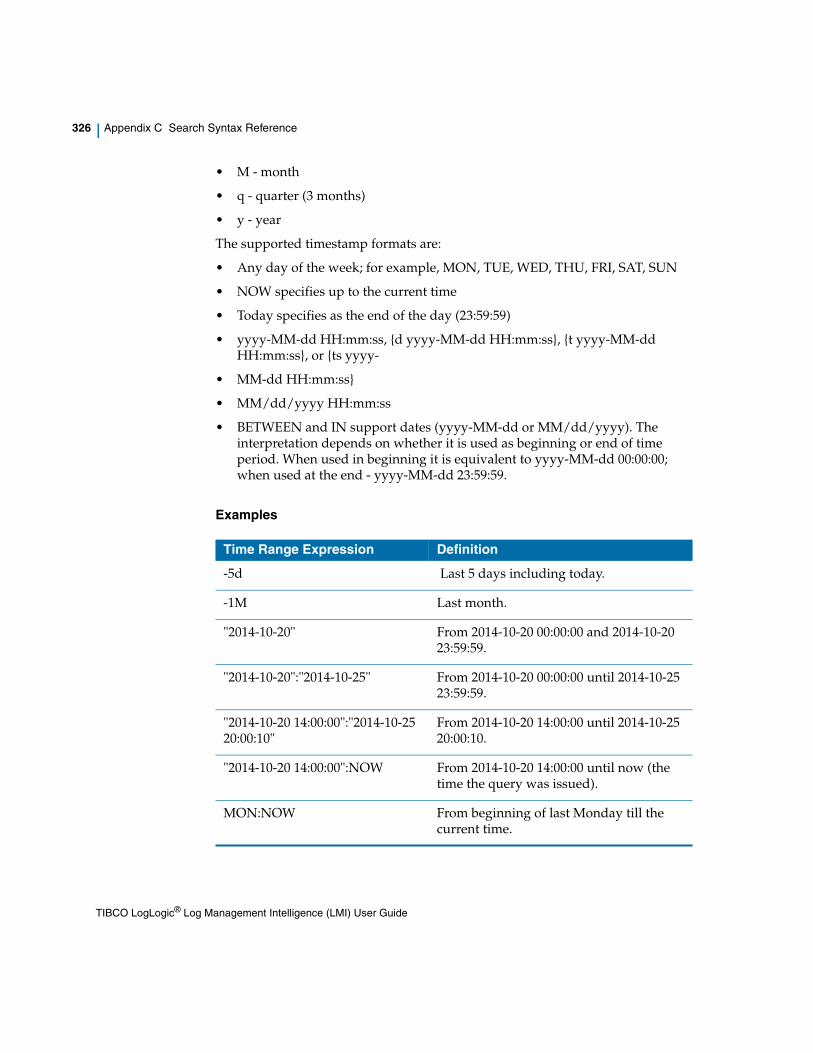
326 | Appendix C Search Syntax Reference
• M - month
• q - quarter (3 months)
• y - year
The supported timestamp formats are:
• Any day of the week; for example, MON, TUE, WED, THU, FRI, SAT, SUN
• NOW specifies up to the current time
• Today specifies as the end of the day (23:59:59)
• yyyy-MM-dd HH:mm:ss, {d yyyy-MM-dd HH:mm:ss}, {t yyyy-MM-dd HH:mm:ss}, or {ts yyyy-
• MM-dd HH:mm:ss}
• MM/dd/yyyy HH:mm:ss
• BETWEEN and IN support dates (yyyy-MM-dd or MM/dd/yyyy). The interpretation depends on whether it is used as beginning or end of time period. When used in beginning it is equivalent to yyyy-MM-dd 00:00:00; when used at the end - yyyy-MM-dd 23:59:59.
Examples
Time Range Expression Definition
-5d Last 5 days including today.
-1M Last month.
"2014-10-20" From 2014-10-20 00:00:00 and 2014-10-20 23:59:59.
"2014-10-20":"2014-10-25" From 2014-10-20 00:00:00 until 2014-10-25 23:59:59.
"2014-10-20 14:00:00":"2014-10-25 20:00:10"
From 2014-10-20 14:00:00 until 2014-10-25 20:00:10.
"2014-10-20 14:00:00":NOW From 2014-10-20 14:00:00 until now (the time the query was issued).
MON:NOW From beginning of last Monday till the current time.
TIBCO LogLogic® Log Management Intelligence (LMI) User Guide
Event Query Language Reference | 327
COLUMNS StatementCOLUMNS is used to define which columns should appear in the results and how they should be computed.<columnsStatement> ::= "COLUMNS" <columnsList> | <aggregationList> ;<columnList> ::= <columnExpression> ( "," <columnExpression> )* ;<aggregationList> ::= <aggregationExpression> ( "," <aggregationExpression> )* ;
A COLUMNS statement can be a column based expression or an aggregate expression. A column based expression is any expression supporting mathematical and logical operators, functions, and other operators. For details, see FILTER Statement. An aggregate expression is a similar expression that contains an aggregationFunction. If all columns use aggregation functions, the result will contain only one row with results of the aggregation. For details, see GROUP BY Statement.
When defining a column name in a search query, it must be enclosed in square brackets ([]) in the following scenarios:
• If a column name is also an EQL or SQL keyword, for example, "use MyEventSourceConfiguration |[IN] >5" .
• If a column name has a space, for example, "use Hawk_getProcess | COLUMNS Status, [Virtual KBytes] | sys_eventTime in -10y".
• If a column name contains non-alphabetic or non-digit characters such as dash (-), for example, "[ab]", to distinguish it from the subtraction expression "a-b".
The following data types for columns are supported:
• String
• Integer
• Long
• Double
• Boolean
• Timestamp
• IP address
TIBCO LogLogic® Log Management Intelligence (LMI) User Guide
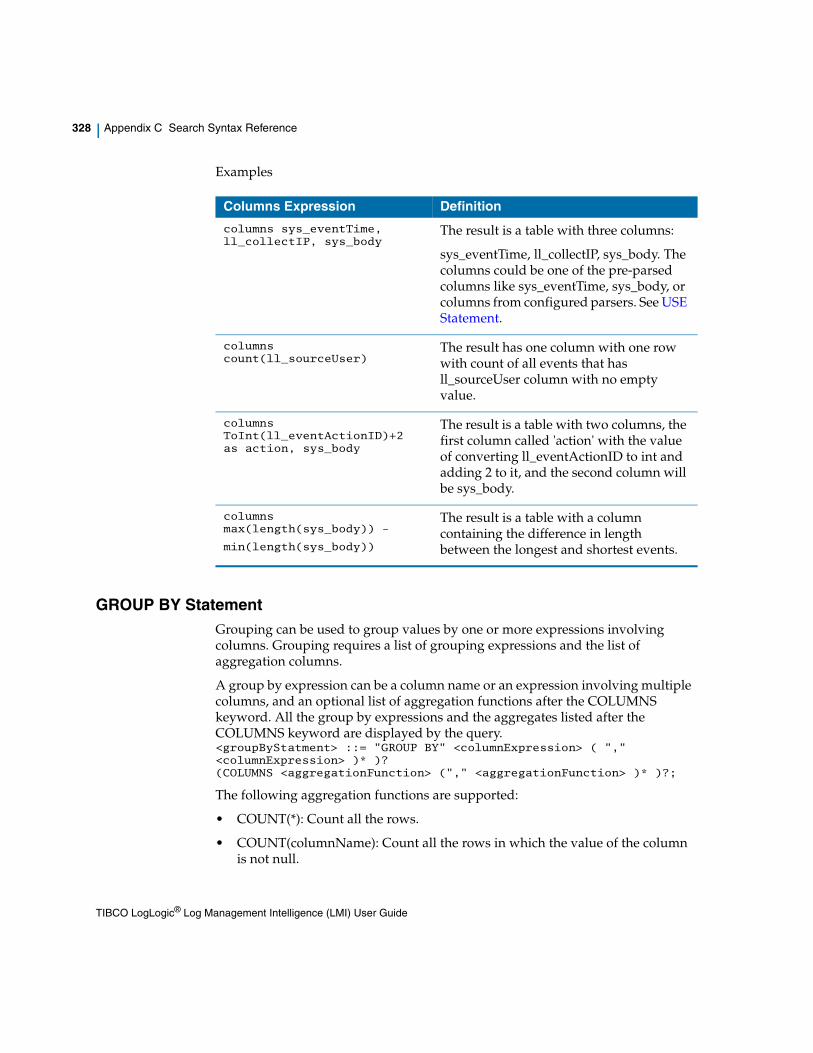
328 | Appendix C Search Syntax Reference
Examples
GROUP BY StatementGrouping can be used to group values by one or more expressions involving columns. Grouping requires a list of grouping expressions and the list of aggregation columns.
A group by expression can be a column name or an expression involving multiple columns, and an optional list of aggregation functions after the COLUMNS keyword. All the group by expressions and the aggregates listed after the COLUMNS keyword are displayed by the query.<groupByStatment> ::= "GROUP BY" <columnExpression> ( "," <columnExpression> )* )?(COLUMNS <aggregationFunction> ("," <aggregationFunction> )* )?;
The following aggregation functions are supported:
• COUNT(*): Count all the rows.
• COUNT(columnName): Count all the rows in which the value of the column is not null.
Columns Expression Definition
columns sys_eventTime, ll_collectIP, sys_body
The result is a table with three columns:
sys_eventTime, ll_collectIP, sys_body. The columns could be one of the pre-parsed columns like sys_eventTime, sys_body, or columns from configured parsers. See USE Statement.
columns count(ll_sourceUser)
The result has one column with one row with count of all events that has ll_sourceUser column with no empty value.
columns ToInt(ll_eventActionID)+2 as action, sys_body
The result is a table with two columns, the first column called 'action' with the value of converting ll_eventActionID to int and adding 2 to it, and the second column will be sys_body.
columns max(length(sys_body)) -
min(length(sys_body))
The result is a table with a column containing the difference in length between the longest and shortest events.
TIBCO LogLogic® Log Management Intelligence (LMI) User Guide
Event Query Language Reference | 329
• COUNT(DISTINCT columnName): Count all distinct values from the column.
• SUM(column): Sum of all values from the column. Supports numerical types (Integer, Long, Double).
• AVG(column): Provide average value for the column. Supports numerical types (Integer, Long, Double).
• MIN(column): Smallest value of the column. Supports all data types that can be ordered (Integer, Long, Double, Timestamp, String).
• MAX(column): Largest value of the column. Supports all data types that can be ordered (Integer, Long, Double, Timestamp, String).
• DURATION(timestamp): Returns the difference (in milliseconds) between the latest and the earliest time. Supports Timestamp only.
• Time functions: Groups events by time. Supports time functions (Seconds, Minutes, Hours, Days, Weeks, Months, Years).
TIBCO LogLogic® Log Management Intelligence (LMI) User Guide
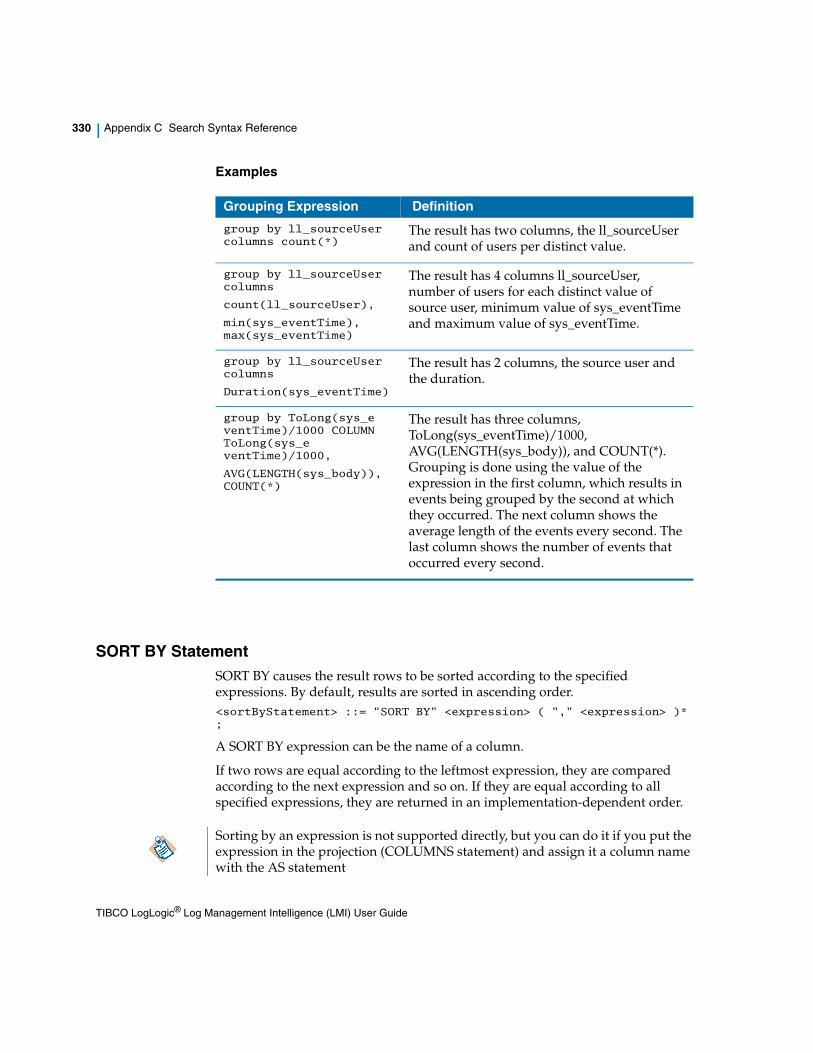
330 | Appendix C Search Syntax Reference
Examples
SORT BY StatementSORT BY causes the result rows to be sorted according to the specified expressions. By default, results are sorted in ascending order.<sortByStatement> ::= "SORT BY" <expression> ( "," <expression> )* ;
A SORT BY expression can be the name of a column.
If two rows are equal according to the leftmost expression, they are compared according to the next expression and so on. If they are equal according to all specified expressions, they are returned in an implementation-dependent order.
Grouping Expression Definition
group by ll_sourceUser columns count(*)
The result has two columns, the ll_sourceUser and count of users per distinct value.
group by ll_sourceUser columns
count(ll_sourceUser),
min(sys_eventTime), max(sys_eventTime)
The result has 4 columns ll_sourceUser, number of users for each distinct value of source user, minimum value of sys_eventTime and maximum value of sys_eventTime.
group by ll_sourceUser columns
Duration(sys_eventTime)
The result has 2 columns, the source user and the duration.
group by ToLong(sys_e ventTime)/1000 COLUMN ToLong(sys_e ventTime)/1000,
AVG(LENGTH(sys_body)), COUNT(*)
The result has three columns, ToLong(sys_eventTime)/1000, AVG(LENGTH(sys_body)), and COUNT(*). Grouping is done using the value of the expression in the first column, which results in events being grouped by the second at which they occurred. The next column shows the average length of the events every second. The last column shows the number of events that occurred every second.
Sorting by an expression is not supported directly, but you can do it if you put the expression in the projection (COLUMNS statement) and assign it a column name with the AS statement
TIBCO LogLogic® Log Management Intelligence (LMI) User Guide
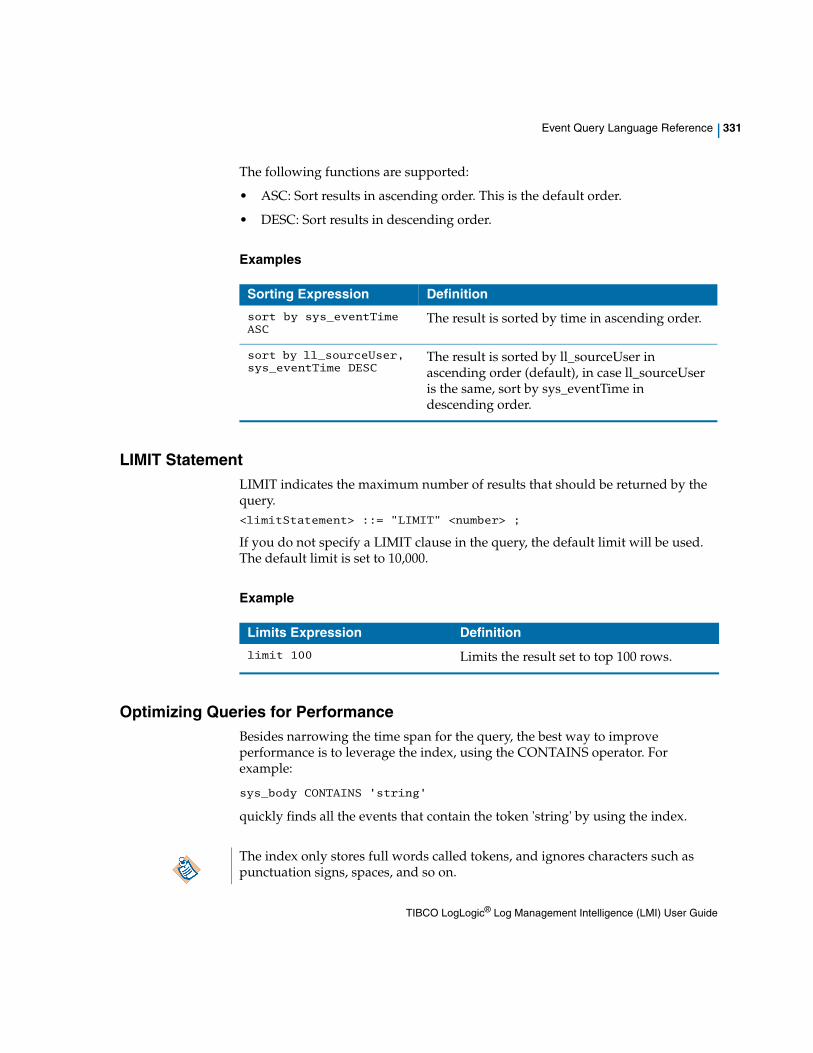
Event Query Language Reference | 331
The following functions are supported:
• ASC: Sort results in ascending order. This is the default order.
• DESC: Sort results in descending order.
Examples
LIMIT StatementLIMIT indicates the maximum number of results that should be returned by the query.<limitStatement> ::= "LIMIT" <number> ;
If you do not specify a LIMIT clause in the query, the default limit will be used. The default limit is set to 10,000.
Example
Optimizing Queries for PerformanceBesides narrowing the time span for the query, the best way to improve performance is to leverage the index, using the CONTAINS operator. For example:
sys_body CONTAINS 'string'
quickly finds all the events that contain the token 'string' by using the index.
Sorting Expression Definition
sort by sys_eventTime ASC
The result is sorted by time in ascending order.
sort by ll_sourceUser, sys_eventTime DESC
The result is sorted by ll_sourceUser in ascending order (default), in case ll_sourceUser is the same, sort by sys_eventTime in descending order.
Limits Expression Definition
limit 100 Limits the result set to top 100 rows.
The index only stores full words called tokens, and ignores characters such as punctuation signs, spaces, and so on.
TIBCO LogLogic® Log Management Intelligence (LMI) User Guide
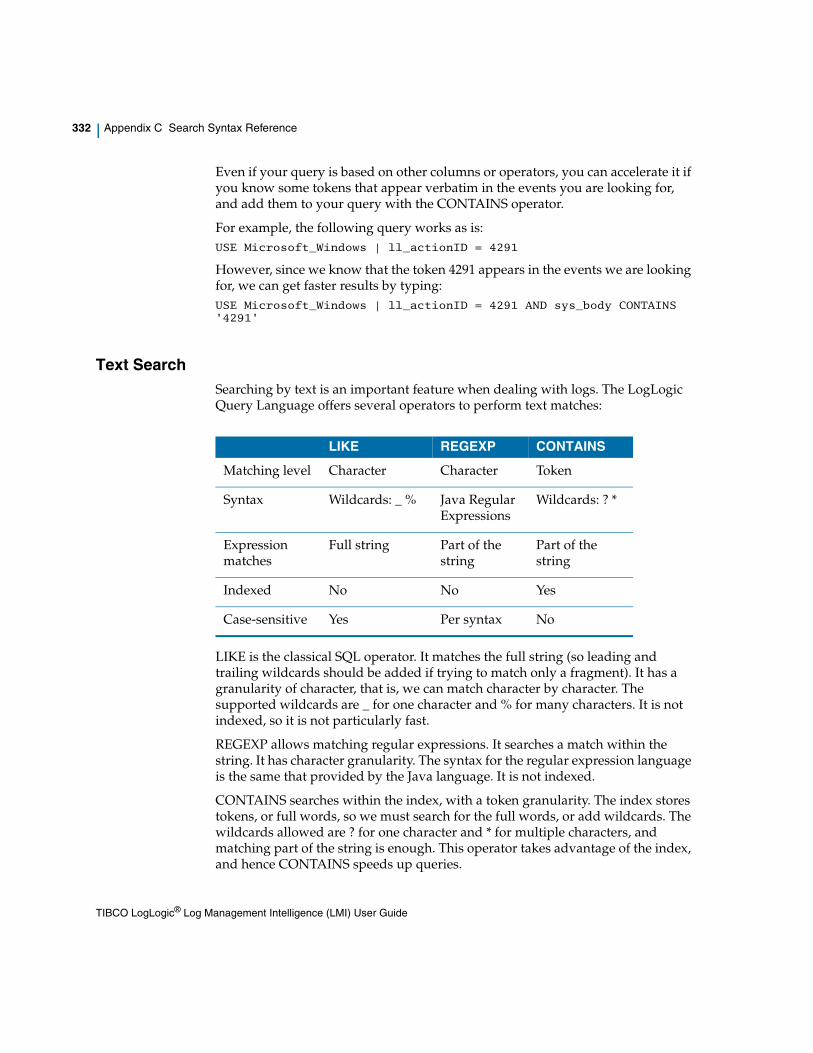
332 | Appendix C Search Syntax Reference
Even if your query is based on other columns or operators, you can accelerate it if you know some tokens that appear verbatim in the events you are looking for, and add them to your query with the CONTAINS operator.
For example, the following query works as is:USE Microsoft_Windows | ll_actionID = 4291
However, since we know that the token 4291 appears in the events we are looking for, we can get faster results by typing:USE Microsoft_Windows | ll_actionID = 4291 AND sys_body CONTAINS '4291'
Text SearchSearching by text is an important feature when dealing with logs. The LogLogic Query Language offers several operators to perform text matches:
LIKE is the classical SQL operator. It matches the full string (so leading and trailing wildcards should be added if trying to match only a fragment). It has a granularity of character, that is, we can match character by character. The supported wildcards are _ for one character and % for many characters. It is not indexed, so it is not particularly fast.
REGEXP allows matching regular expressions. It searches a match within the string. It has character granularity. The syntax for the regular expression language is the same that provided by the Java language. It is not indexed.
CONTAINS searches within the index, with a token granularity. The index stores tokens, or full words, so we must search for the full words, or add wildcards. The wildcards allowed are ? for one character and * for multiple characters, and matching part of the string is enough. This operator takes advantage of the index, and hence CONTAINS speeds up queries.
LIKE REGEXP CONTAINS
Matching level Character Character Token
Syntax Wildcards: _ % Java Regular Expressions
Wildcards: ? *
Expression matches
Full string Part of the string
Part of the string
Indexed No No Yes
Case-sensitive Yes Per syntax No
TIBCO LogLogic® Log Management Intelligence (LMI) User Guide
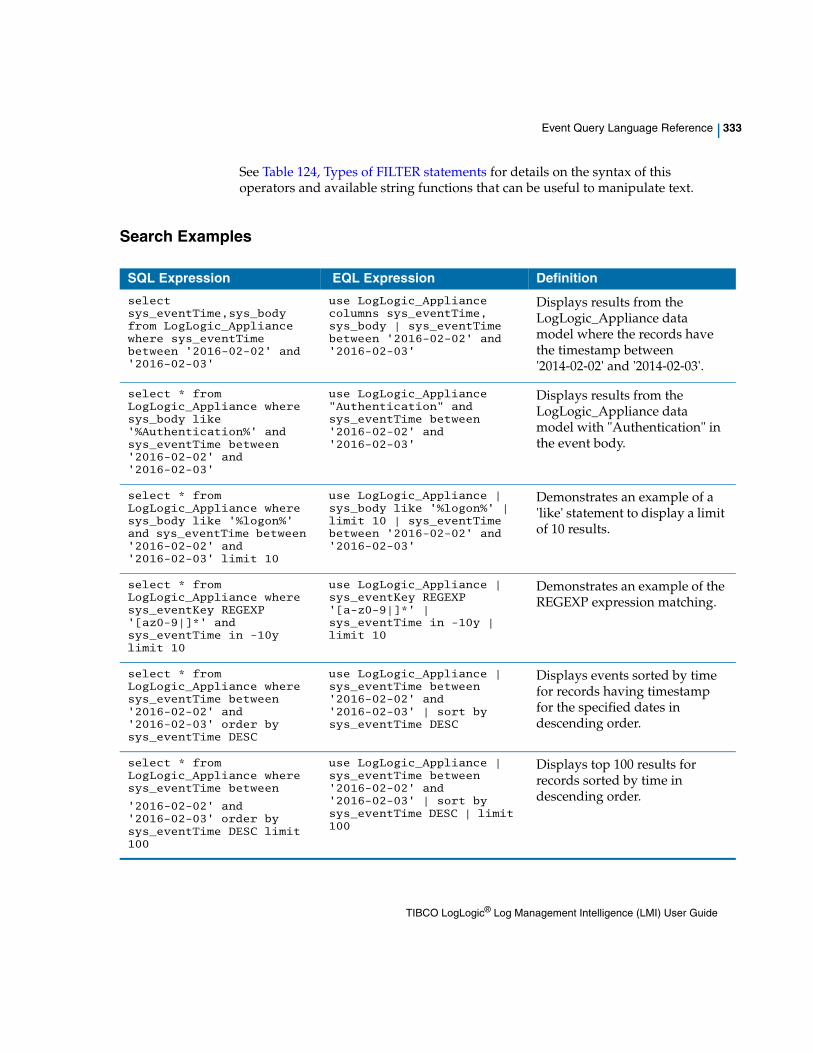
Event Query Language Reference | 333
See Table 124, Types of FILTER statements for details on the syntax of this operators and available string functions that can be useful to manipulate text.
Search Examples
SQL Expression EQL Expression Definition
select sys_eventTime,sys_body from LogLogic_Appliance where sys_eventTime between '2016-02-02' and '2016-02-03'
use LogLogic_Appliance columns sys_eventTime, sys_body | sys_eventTime between '2016-02-02' and '2016-02-03'
Displays results from the LogLogic_Appliance data model where the records have the timestamp between '2014-02-02' and '2014-02-03'.
select * from LogLogic_Appliance where sys_body like '%Authentication%' and sys_eventTime between '2016-02-02' and '2016-02-03'
use LogLogic_Appliance "Authentication" and sys_eventTime between '2016-02-02' and '2016-02-03'
Displays results from the LogLogic_Appliance data model with "Authentication" in the event body.
select * from LogLogic_Appliance where sys_body like '%logon%' and sys_eventTime between '2016-02-02' and '2016-02-03' limit 10
use LogLogic_Appliance | sys_body like '%logon%' | limit 10 | sys_eventTime between '2016-02-02' and '2016-02-03'
Demonstrates an example of a 'like' statement to display a limit of 10 results.
select * from LogLogic_Appliance where sys_eventKey REGEXP '[az0-9|]*' and sys_eventTime in -10y limit 10
use LogLogic_Appliance | sys_eventKey REGEXP '[a-z0-9|]*' | sys_eventTime in -10y | limit 10
Demonstrates an example of the REGEXP expression matching.
select * from LogLogic_Appliance where sys_eventTime between '2016-02-02' and '2016-02-03' order by sys_eventTime DESC
use LogLogic_Appliance | sys_eventTime between '2016-02-02' and '2016-02-03' | sort by sys_eventTime DESC
Displays events sorted by time for records having timestamp for the specified dates in descending order.
select * from LogLogic_Appliance where sys_eventTime between
'2016-02-02' and '2016-02-03' order by sys_eventTime DESC limit 100
use LogLogic_Appliance | sys_eventTime between '2016-02-02' and '2016-02-03' | sort by sys_eventTime DESC | limit 100
Displays top 100 results for records sorted by time in descending order.
TIBCO LogLogic® Log Management Intelligence (LMI) User Guide
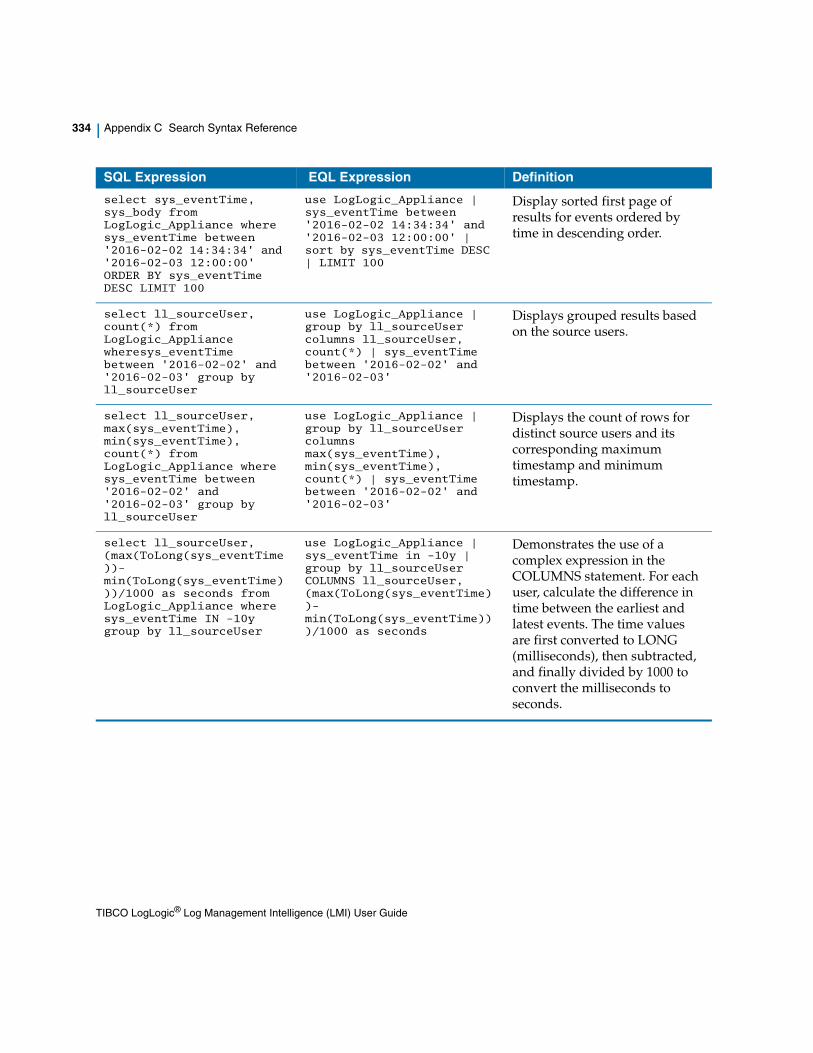
334 | Appendix C Search Syntax Reference
select sys_eventTime, sys_body from LogLogic_Appliance where sys_eventTime between '2016-02-02 14:34:34' and '2016-02-03 12:00:00' ORDER BY sys_eventTime DESC LIMIT 100
use LogLogic_Appliance | sys_eventTime between '2016-02-02 14:34:34' and '2016-02-03 12:00:00' | sort by sys_eventTime DESC | LIMIT 100
Display sorted first page of results for events ordered by time in descending order.
select ll_sourceUser, count(*) from LogLogic_Appliance wheresys_eventTime between '2016-02-02' and '2016-02-03' group by ll_sourceUser
use LogLogic_Appliance | group by ll_sourceUser columns ll_sourceUser, count(*) | sys_eventTime between '2016-02-02' and '2016-02-03'
Displays grouped results based on the source users.
select ll_sourceUser, max(sys_eventTime), min(sys_eventTime), count(*) from LogLogic_Appliance where sys_eventTime between '2016-02-02' and '2016-02-03' group by ll_sourceUser
use LogLogic_Appliance | group by ll_sourceUser columns max(sys_eventTime), min(sys_eventTime), count(*) | sys_eventTime between '2016-02-02' and '2016-02-03'
Displays the count of rows for distinct source users and its corresponding maximum timestamp and minimum timestamp.
select ll_sourceUser, (max(ToLong(sys_eventTime ))- min(ToLong(sys_eventTime) ))/1000 as seconds from LogLogic_Appliance where sys_eventTime IN -10y group by ll_sourceUser
use LogLogic_Appliance | sys_eventTime in -10y | group by ll_sourceUser COLUMNS ll_sourceUser, (max(ToLong(sys_eventTime) )- min(ToLong(sys_eventTime)) )/1000 as seconds
Demonstrates the use of a complex expression in the COLUMNS statement. For each user, calculate the difference in time between the earliest and latest events. The time values are first converted to LONG (milliseconds), then subtracted, and finally divided by 1000 to convert the milliseconds to seconds.
SQL Expression EQL Expression Definition
TIBCO LogLogic® Log Management Intelligence (LMI) User Guide
| 335
Index
A
Accepted ConnectionsReal-Time report 168
Access ControlReal-Time report 119
Active FW ConnectionsReal-Time report 169
Active VPN ConnectionsReal-Time report 170
alert receiversdefining alert 105
Alert Viewerusing 90viewing alerts 90
Alert Widgets 36alerts
about 89add new alert rule 101add new template format 93adding 93, 97, 98, 101delete template 98manage alert templates 93managing 99modifying alert rules 107parsed data alert 106removing alert rules 107tab description 99view and modify templates 97
All Database EventsReal-Time report 129, 135
All Unparsed EventsReal-Time report 186, 186, 187
appliancesintroducing 2system status 10
Application DistributionReal-Time report 171
B
Boolean expression, entering 52
C
change LogApp account password 226change Login Landing Page 225Check Point Policy
Real-Time report 193tab description 193using 193
clipboardadding a new 66index search 66
configuring result settings 57Connectivity
Real-Time report 166CPU Usage
tab description 19viewing 18
customer support xiv
D
Dashboard 28Dashboard settings 39Database Access
Real-Time report 130Database Activity
Real-Time report 128Database Data Access report 131Database Privilege Modifications
Real-Time report 132
TIBCO LogLogic® Log Management Intelligence (LMI) User Guide
336 | Index
Database System ModificationsReal-Time report 133
Denied ConnectionsReal-Time report 172
devicesdefining alert 104
Distributed RegEx Search 72
E
Event LogsReal-Time reports 185
examplesindex search 52
exceptionssyslog header 305
Exchange 2000/03 SMTP Activity 158Exchange 2000/03 SMTP Activity Report 159expressions
index search, entering 52
F
filterssaving index search 66
Finished Searchtab description 76using 76
FTP ConnectionsReal-Time report 174
G
groupsglobal, in regex search 70
I
IBM i5/OS Activity ReportsReal-Time report 134
IDSReal-Time report 148, 149, 150, 151, 153, 154, 155, 156
IDS ActivityReal-Time report 149
index report 87Index Search
saving as a filter 65index search 52, 86
adding a new clipboard for 66clipboard 66Clipboard tab 66configure results settings 57examples 52filter, reusing 66filters 66manage results 59results 56results, viewing in context 60running 53Search Filters tab 66Search History tab 64Search Results tab 56using 52using history 64viewing trends 62
index search expression rules 52index search filters 66
L
log messagesdeleting clipped 68viewing or editing 67
Log Source Statustab description 20viewing 20
Login Landing Page 225LogLogic product families 5LX appliances 5
TIBCO LogLogic® Log Management Intelligence (LMI) User Guide
Index | 337
M
Mail ActivityReal-Time report 158, 159, 161
Mail DelayReal-Time report 160, 163, 163
Mail SizeReal-Time report 162, 164
Manage Widgets 28Alerts 36Summary 29System 38Trend 32
management stationviewing system status 15
managing search results 59message rate
viewing 17MX appliances 6My Dashboard 27
N
network infrastructure 7Network Policies
Real-Time report 193, 195, 198, 199, 199, 200, 203, 204, 205, 206, 207, 208, 210, 211, 212, 212
P
Parameterized Pre-defined Regular Expression Search Filters 82
parsed data alerts 106Pending Search
tab description 74, 74, 75using 75
Permission ModificationReal-Time report 120
Policy reportsReal-Time report 192
product families 5
R
Real-Time reportsabout 109Access Control reports 119common options 110Connectivity reports 166Database Activity reports 128event logs 185generating 110IBM i5/OS activity reports 134IDS reports 148Mail Activity reports 158Policy reports 192
Real-Time Viewercreating reports 42Log Messages screen 46saving reports 42using 42
Recent Messagestab description 24viewing 24
regular expression (RegEx) search 70regular expression (regex) search
view pending searches 75view running searches 74
related documents xresults
index search, index searchIn Context tab 60
rules, index search expression 52Rules/Policies
Real-Time report 194Running Search
using 74, 74
TIBCO LogLogic® Log Management Intelligence (LMI) User Guide
338 | Index
S
searchabout 49all index searches 86Distributed RegEx Search 72features overview 50index report 87index search 52index, running 53regular expression (RegEx) 70
Search Filtersadding new 77modifying 84overview 77tab description 77
Search IP Addresssaving a report 71
Security EventsReal-Time report 188
ST appliances 6Summary Widgets 29support, contacting xivSyslog Header character sets 304System Events
Real-Time report 189System Object Access
Real-Time report 137system status
viewing 10viewing (management station) 15
System Widgets 38
T
technical support xivtemplates
defining alert 105Trend Widgets 32trends
viewing 62
U
Unapproved Messagestab description 24viewing 24
User AccessReal-Time report 121
User Access By ConnectionReal-Time report 140
User ActionsReal-Time report 142
User AuthenticationReal-Time report 122
User JobsReal-Time report 145
User Last ActivityReal-Time report 124
user roles 3users
defining alert 105Users Created/Denied
Real-Time report 123
V
view LogApp account 224viewing
clipped log messages 67viewing in context 60viewing search results 56VPN Access
Real-Time reports 175VPN Events
Real-Time report 190VPN Sessions
Real-Time report 176VPN/RADIUS Top Lists
Real-Time report 177
TIBCO LogLogic® Log Management Intelligence (LMI) User Guide
Index | 339
W
Web CacheReal-Time report 178
Web SurfingReal-Time report 179, 180, 181, 182, 183
Widgets 27Window Events
Real-Time report 126
TIBCO LogLogic® Log Management Intelligence (LMI) User Guide
Related Documents