Procedia - Social and Behavioral Sciences 111 (2014) 213 – 223 1877-0428 © 2013 The Authors. Published by Elsevier Ltd. Selection and/or peer-review under responsibility of Scientific Committee doi:10.1016/j.sbspro.2014.01.054 ScienceDirect EWGT2013 – 16 th Meeting of the EURO Working Group on Transportation Logistics process improvement using simulation and stochastic multiple criteria decision aiding Piotr Sawicki a *, Hanna Sawicka a a Logistics Division, Poznan University of Technology, 3 Piotrowo str., 60-965 PoznaĔ, Poland Abstract The paper is concentrated on improvement of a delivery process of parts and components for a vehicle production company based on just-in-time system. The authors have proposed a four-stage solution procedure. In the first stage the logistics process has been analysed and modelled using EPC notation in ARIS Business Architect. The major activities in the process, cause and effect relationships, key resources (personal and technical) and their assignment to the activities have been identified. In the second stage, multicriteria mathematical model has been constructed to evaluate the process performance. In the third stage, the simulation model has been built with an application of simulation tool ARIS Business Simulator, and the computational experiments have been carried out. Next, in the fourth stage the set of variants representing changes in the current logistics process have been created, equivalent changes have been introduced to the simulation model and computational experiments have been carried out. Based on the nondeterministic simulation results, in the next stage the variants have been ranked with an application of stochastic decision aiding method – stochastic ELECTRE III. Finally, the compromise variant of the logistics process improvement has been recommended. Keywords: Process improvement; Process modelling; Multiple criteria stochastic modelling; Simulation; Stochastic decision making 1. Introduction 1.1. Process definition and improvement Business process improvement is one of the key area of the competitive advantage in the market. Process quality and its efficiency is therefore a field of interest for many researchers dealing with business process management - BPM. Business process is defined in the literature in a very different way. Davenport and Short * Corresponding author. Tel.: +48-61-665-2249; fax: +48-61-665-2736. E-mail address: [email protected] Available online at www.sciencedirect.com © 2013 The Authors. Published by Elsevier Ltd. Selection and/or peer-review under responsibility of Scientific Committee

Welcome message from author
This document is posted to help you gain knowledge. Please leave a comment to let me know what you think about it! Share it to your friends and learn new things together.
Transcript
Procedia - Social and Behavioral Sciences 111 ( 2014 ) 213 – 223
1877-0428 © 2013 The Authors. Published by Elsevier Ltd. Selection and/or peer-review under responsibility of Scientific Committeedoi: 10.1016/j.sbspro.2014.01.054
ScienceDirect
EWGT2013 – 16th Meeting of the EURO Working Group on Transportation
Logistics process improvement using simulation and stochastic multiple criteria decision aiding
Piotr Sawickia*, Hanna Sawickaa
a Logistics Division, Poznan University of Technology, 3 Piotrowo str., 60-965 Pozna , Poland
Abstract
The paper is concentrated on improvement of a delivery process of parts and components for a vehicle production company based on just-in-time system. The authors have proposed a four-stage solution procedure. In the first stage the logistics process has been analysed and modelled using EPC notation in ARIS Business Architect. The major activities in the process, cause and effect relationships, key resources (personal and technical) and their assignment to the activities have been identified. In the second stage, multicriteria mathematical model has been constructed to evaluate the process performance. In the third stage, the simulation model has been built with an application of simulation tool ARIS Business Simulator, and the computational experiments have been carried out. Next, in the fourth stage the set of variants representing changes in the current logistics process have been created, equivalent changes have been introduced to the simulation model and computational experiments have been carried out. Based on the nondeterministic simulation results, in the next stage the variants have been ranked with an application of stochastic decision aiding method – stochastic ELECTRE III. Finally, the compromise variant of the logistics process improvement has been recommended.
© 2013 The Authors. Published by Elsevier Ltd. Selection and/or peer-review under responsibility of Scientific Committee.
Keywords: Process improvement; Process modelling; Multiple criteria stochastic modelling; Simulation; Stochastic decision making
1. Introduction
1.1. Process definition and improvement
Business process improvement is one of the key area of the competitive advantage in the market. Process quality and its efficiency is therefore a field of interest for many researchers dealing with business process management - BPM. Business process is defined in the literature in a very different way. Davenport and Short
* Corresponding author. Tel.: +48-61-665-2249; fax: +48-61-665-2736. E-mail address: [email protected]
Available online at www.sciencedirect.com
© 2013 The Authors. Published by Elsevier Ltd. Selection and/or peer-review under responsibility of Scientific Committee
214 Piotr Sawicki and Hanna Sawicka / Procedia - Social and Behavioral Sciences 111 ( 2014 ) 213 – 223
(1990) state that it is a set of logically related tasks performed to achieve a defined business outcome. Tiwari et al., (2010), Vergidis and Tiwari (2008) define process as a set of actions or activities which, if properly connected and organized, allow to achieve business goals.
Many works divide business processes due to their role in the organization into the following groups: the main - operational (or primary), secondary (support) and managerial (e.g. Arlbjørn and Haug, 2010; van der Aalst and van Hee, 2004). Based on the concept of value chain developed in the 90s by Porter, Leymann and Roller (2000) present 3 criteria of the process classification, i.e.: business value of the final result, the frequency of process repetition and level of process automation.
One of the key business process in almost every market oriented organization is a logistics process. In a common sense, it is a sequence of activities and different resources (incl. technological, informational, financial and personal) involved in the implementation of these activities in order to achieve the defined objectives, i.e. efficient placement and movement of goods. Most of logistics processes are classified as operational one, creating value for customers, with high rate of repetition and with a relatively high degree of automation (mainly in the warehousing processes). Having such a perception of the logistics processes it is very crucial to guarantee the highest efficiency of all the activities as well as appropriate utilization of all resources.
1.2. Related works
There are many research devoted to quantitative improvement, redesign or optimisation of business processes. Those methods are mostly based on complex and interdependent methods or calculation procedures and there are very little research related to individual and independent methods. In the latter, the evolutionary algorithms are very often applied to this end (e.g. Vergidis et al., 2005; Tiwari et al., 2007). In the former, several different approaches exists, including:
• process modelling using graph combined with mathematical modelling and solving the model using approximate methods, including: genetic algorithms (e.g. Hofacker and Vetschera, 2001; Huang et al., 2012; Zhou and Chen, 2002; Salomie et al., 2012) and evolutionary algorithms (Vergidis and Tiwari, 2008; Vergidis et al., 2012; Tiwari et al., 2007; 2010) or alternatively using exact methods, including: branch and bound (e.g. Hofacker and Vetschera, 2001) or PERT method (Dewan et al., 1998);
• process modelling using BPMN language combined with problem modelling and solving by genetic algorithms (Stelling et al., 2009) or a combination of specialised heuristics, Hungarian algorithm and simulation (Kamrani et al., 2012);
• construction of alternative redesign scenarios based on decision rules combined with a choice of the most desirable scenario (e.g. Aghdasi and Malihi, 2010);
• multicriteria mathematical modelling combined with multicriteria decision making method AHP (Kwak and Lee, 2002).
1.3. Objective and content of the research
Due to the fact that duration of the most of activities in any process is based on non-deterministic phenomena, i.e. based on stochastic distribution, it is necessary to take it into account in process evaluation, its improvement or redesign. In practice, most of the research assume that considered phenomena are deterministic type, which leads to significant simplifications. Thus, the authors have proposed the procedure of process improvement based on sequence of related steps, including identification and modeling of process activities and utilized resources (both technical and personal), multiple criteria stochastic modeling of the evaluation criteria, process simulation of its different variants (scenarios) and selection of the most favorable scenario of process redesign, using multiple criteria stochastic decision making. The authors verify a proposed procedure and its efficiency on the example of logistics process of supply of parts and components to the production line.
215 Piotr Sawicki and Hanna Sawicka / Procedia - Social and Behavioral Sciences 111 ( 2014 ) 213 – 223
This paper is composed of 5 sections. In the first section the main definition of logistics process and its improvement are presented, followed by literature review and definition of research objective. In the second section the considered decision problem of process improvement is defined. In the third section, the concept of four-stage logistics process improvement procedure is characterized, and its implementation is presented in the fourth section. The last section of this paper is devoted to the summary and conclusions and bibliography is attached to the paper.
2. Problem definition
The logistics process improvement presented in this paper is discussed as an example of the supply of vehicle’s parts to the factory. Two companies cooperating with each other are considered. One of them focuses exclusively on vehicles’ production, with the outsourced supply and storage processes. The second one specializes in the supply of parts and components to designated areas in the vicinity of the production line. This company has a warehouse complex, forklifts, containers for the carriage of modular components and homogeneous fleet of vehicles. Deliveries of parts and components are realized in a just-in-time i.e. based on advanced and precise timetable constructed by a production company.
The distance between these companies is 5,4 km. The route is located on one of the main access roads to the city center where the factory is located, which is a serious risk of supply disruption. Thus, to overcome these potential delays the producer provides some short-term caching of delivered parts and components while planning the timetable. This approach allows him to maintain the continuity of the production process. The set of operations linking both companies is as follows: loading containers of parts and components to the vehicle supplier, transporting from supplier to producer, unloading parts and components, loading empty containers to the vehicle, transporting from producer to supplier and unloading of empty containers. Both too early and too late deliveries are undesirable, which in any case destabilize production process. However, in reality are observed frequent delays in delivery, resulting from the random nature of duration of each process activity. Based on the producer’s experience the expected total time of all activities should equal 125 minutes with the range of variations between 113 and 144,5 minutes.
In order to meet these requirements, the logistics service provider should provide sufficient resources and to use them properly. The decision problem is formulated as the determination of the best configuration of the actions of logistics process leading to improvement of its current state, and evaluation of the final solution by a comprehensive set of criteria.
3. Key stages of the logistics process improvement
3.1. First stage – Process modeling
In the first stage of the logistics process improvement proposed by the authors of this paper, the process is identified and modeled. It helps to recognize the activities the process is composed of and to understand the relations between them. Many authors (e.g. Aguilar-Savén, 2004; Weske, 2012; Stelling et al., 2009) emphasize that one of the most important aspect of modeling is the selection of an appropriate modeling notation or language. Thus, it is necessary to consider the aim of the modeling and the role the model should play.
There are four following objectives of modeling a considered process, such as:
• identification of all important activities in the process, • graphical representation of cause-effect relationships between the process activities, • identification of human and technical resources in the process, • the pattern of resources assignment to each activity in the process.
216 Piotr Sawicki and Hanna Sawicka / Procedia - Social and Behavioral Sciences 111 ( 2014 ) 213 – 223
Business process can be modeled with an application of different techniques i.e. methods and languages, such as: EPC (Scheer, 1999), BPMN (White, 2006), UML (Fowlers, 2000), Perti nets (Lawrence, 1997), IDEF (Menzel and Mayer, 2006) and many others. The criterion for selection of the appropriate technique is the detailed description of the process and the purpose of the model of the process.
3.2. Second stage – Mathematical modeling of the process evaluation criteria
The second stage of the logistics process improvement is based on mathematical modeling of the process evaluation criteria. Hofacker and Vetcher (2001), Vergidis et al., (2007, 2012) state that the aim of mathematical modeling within analyzed processes is to ensure proper recording and consistency of the analysis. The main purpose of modeling in the procedure proposed by the authors of this paper is to develop a comprehensive set of criteria of the analyzed process. These criteria should encompass the design and configuration of the process, the effectiveness of resources utilization and final results of the process, as well. Due to the random phenomena of many logistics activities, the authors of this paper suggest to formulate some of the criteria with an application of stochastic mathematical modeling. Due to the fact that several aspects of the considered process has to be taken into account it is proposed to apply a multiple criteria approach for modeling purpose.
3.3. Third stage – Simulation modeling and construction of redesign scenarios
In the third stage, the simulation model is constructed. It allows showing the performance of the analyzed process in accordance with established parameters. The main reason for applying simulation with respect to the business process is the possibility of mapping non-deterministic nature of phenomena that occur in this process. In the proposed logistics process improvement procedure ARIS Business Simulator is utilized.
Next, the redesign scenarios of the existing logistics process are designed and modeled with an application of simulation tool. Based on the results of the simulation experiments different values of criteria evaluating existing logistics process and its redesign scenarios are generated.
3.4. Fourth stage – Multiple criteria evaluation of stochastic redesign scenarios
The fourth stage is devoted to rank all the redesign scenarios, from the best to the worst. In fact, in the literature there are many multiple criteria decision aiding methods applied in ranking problems. They are based on different methodological streams, including: multiattribute utility theory, e.g. AHP (Saaty, 1980), SMART (Edwards, 1999) or UTA (Jacquet-Lagreze and Siskos, 1982), outranking relation, e.g. ELECTRE (Roy, 1985, Vincke 1992), ORESTE (Roubens, 1982) or PROMETHEE (Brans, 1986), or combination of these two approaches, e.g. MAPPAC (Matarazzo, 1991). These methods, however, do not reflect the stochastic nature of the data that is both information related to the criteria values, here the results of simulation, and preferences of the decision maker. Examples of their modifications to stochastic methods, which include the non-deterministic information, are presented in the literature, e.g. SMAA-III (Tervonen and Figueira, 2008), stochastic ELECTRE III (Sawicka, 2012), PROMETHEE/GIS (Marinioni, 2005), stochastic AHP (Stam and Duarte Silva, 1997) or stochastic UTA (Siskos, 1982).
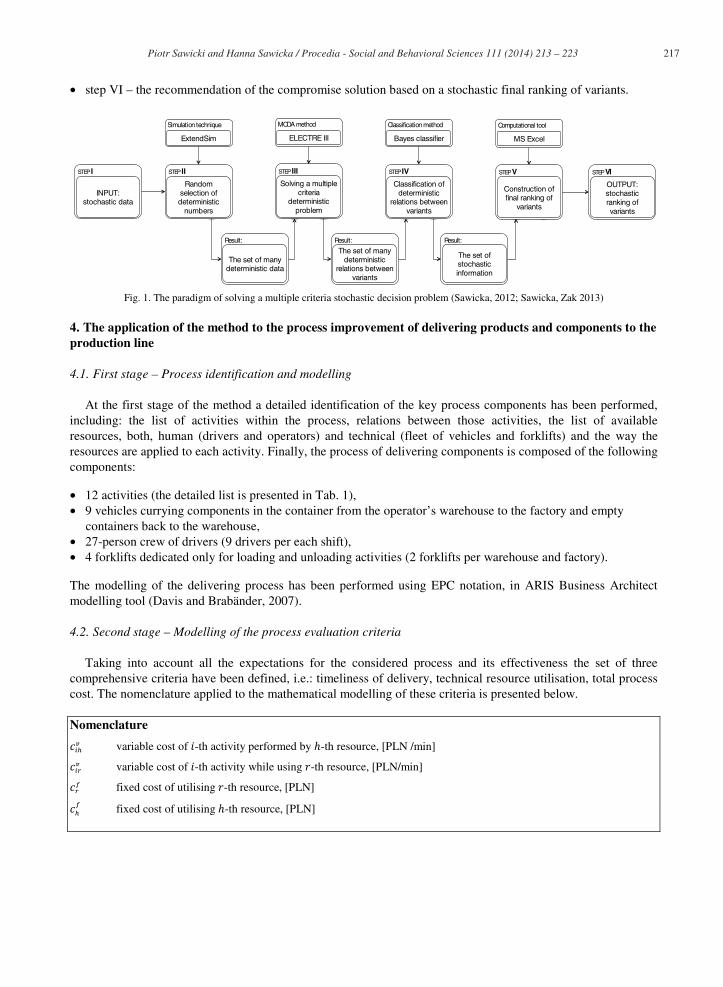
The authors of this paper apply stochastic method based on ELECTRE III, proposed by Sawicka (2012). The algorithm is composed of six following steps (see Fig. 1):
• step I – collection of the stochastic data, • step II – random selection of deterministic numbers using simulation tool, • step III – solving a multiple criteria deterministic problem with an application of ELECTRE III method, • step IV – classification of deterministic relations between variants using classification method, • step V – construction of final ranking of variants with an application of computational tool,
217 Piotr Sawicki and Hanna Sawicka / Procedia - Social and Behavioral Sciences 111 ( 2014 ) 213 – 223
• step VI – the recommendation of the compromise solution based on a stochastic final ranking of variants.
Fig. 1. The paradigm of solving a multiple criteria stochastic decision problem (Sawicka, 2012; Sawicka, Zak 2013)
4. The application of the method to the process improvement of delivering products and components to the production line
4.1. First stage – Process identification and modelling
At the first stage of the method a detailed identification of the key process components has been performed, including: the list of activities within the process, relations between those activities, the list of available resources, both, human (drivers and operators) and technical (fleet of vehicles and forklifts) and the way the resources are applied to each activity. Finally, the process of delivering components is composed of the following components:
• 12 activities (the detailed list is presented in Tab. 1), • 9 vehicles currying components in the container from the operator’s warehouse to the factory and empty
containers back to the warehouse, • 27-person crew of drivers (9 drivers per each shift), • 4 forklifts dedicated only for loading and unloading activities (2 forklifts per warehouse and factory).
The modelling of the delivering process has been performed using EPC notation, in ARIS Business Architect modelling tool (Davis and Brabänder, 2007).
4.2. Second stage – Modelling of the process evaluation criteria
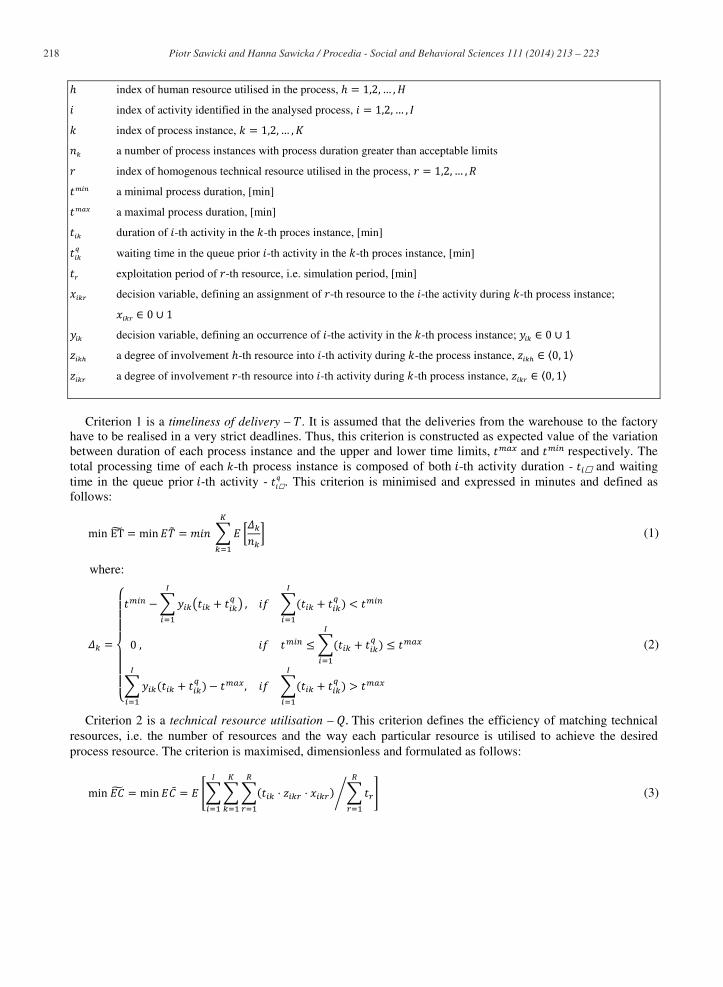
Taking into account all the expectations for the considered process and its effectiveness the set of three comprehensive criteria have been defined, i.e.: timeliness of delivery, technical resource utilisation, total process cost. The nomenclature applied to the mathematical modelling of these criteria is presented below.
Nomenclature
variable cost of -th activity performed by -th resource, [PLN /min]
variable cost of -th activity while using -th resource, [PLN/min]
fixed cost of utilising -th resource, [PLN]
fixed cost of utilising -th resource, [PLN]
STEP II
Random selection of deterministic
numbers
STEP III
Solving a multiple criteria
deterministic problem
Simulation technique
ExtendSim
MCDA method
ELECTRE III
Result:
The set of many deterministic data
STEP IV
Classification of deterministic
relations between variants
Classification method
Bayes classifier
Result:
The set of many deterministic
relations between variants
Result:
The set of stochastic information
STEP V
Construction of final ranking of
variants
Computational tool
MS Excel
STEP I
INPUT: stochastic data
STEP VI
OUTPUT: stochastic ranking of variants
218 Piotr Sawicki and Hanna Sawicka / Procedia - Social and Behavioral Sciences 111 ( 2014 ) 213 – 223
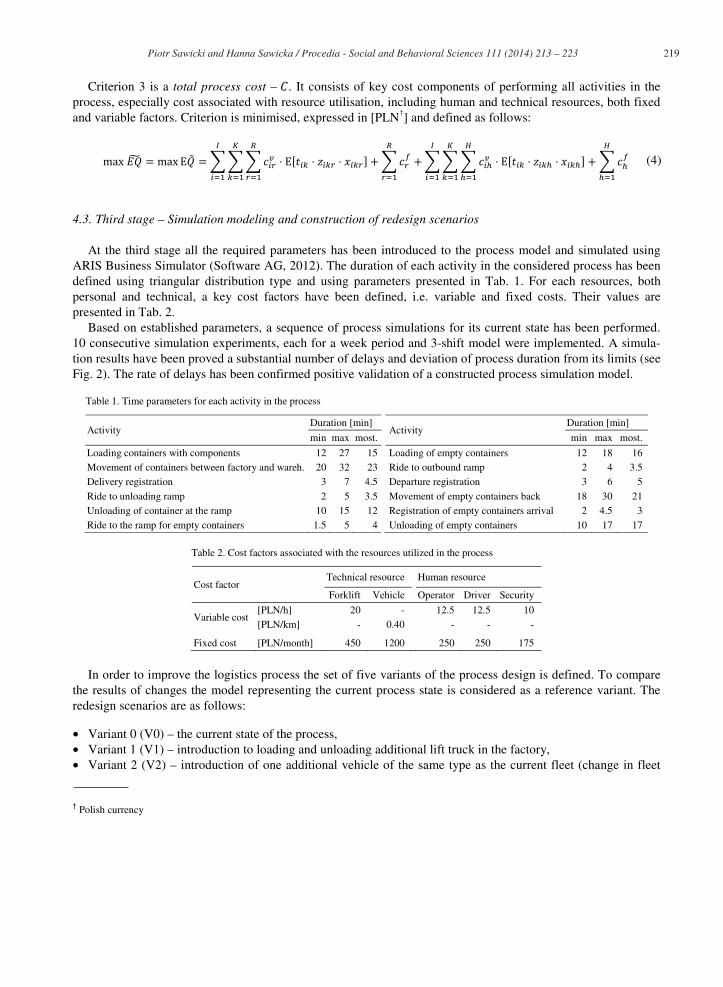
index of human resource utilised in the process,
index of activity identified in the analysed process,
index of process instance,
a number of process instances with process duration greater than acceptable limits
index of homogenous technical resource utilised in the process,
a minimal process duration, [min]
a maximal process duration, [min]
duration of -th activity in the -th proces instance, [min]
waiting time in the queue prior -th activity in the -th proces instance, [min]
exploitation period of -th resource, i.e. simulation period, [min]
decision variable, defining an assignment of -th resource to the -the activity during -th process instance;
decision variable, defining an occurrence of -the activity in the -th process instance;
a degree of involvement -th resource into -th activity during -the process instance,
a degree of involvement -th resource into -th activity during -th process instance,
Criterion 1 is a timeliness of delivery – . It is assumed that the deliveries from the warehouse to the factory have to be realised in a very strict deadlines. Thus, this criterion is constructed as expected value of the variation between duration of each process instance and the upper and lower time limits, and respectively. The total processing time of each -th process instance is composed of both -th activity duration - and waiting time in the queue prior -th activity - . This criterion is minimised and expressed in minutes and defined as follows:
(1)
where:
(2)
Criterion 2 is a technical resource utilisation – This criterion defines the efficiency of matching technical resources, i.e. the number of resources and the way each particular resource is utilised to achieve the desired process resource. The criterion is maximised, dimensionless and formulated as follows:
(3)
219 Piotr Sawicki and Hanna Sawicka / Procedia - Social and Behavioral Sciences 111 ( 2014 ) 213 – 223
Criterion 3 is a total process cost – . It consists of key cost components of performing all activities in the process, especially cost associated with resource utilisation, including human and technical resources, both fixed and variable factors. Criterion is minimised, expressed in [PLN†] and defined as follows:
(4)
4.3. Third stage – Simulation modeling and construction of redesign scenarios
At the third stage all the required parameters has been introduced to the process model and simulated using ARIS Business Simulator (Software AG, 2012). The duration of each activity in the considered process has been defined using triangular distribution type and using parameters presented in Tab. 1. For each resources, both personal and technical, a key cost factors have been defined, i.e. variable and fixed costs. Their values are presented in Tab. 2.
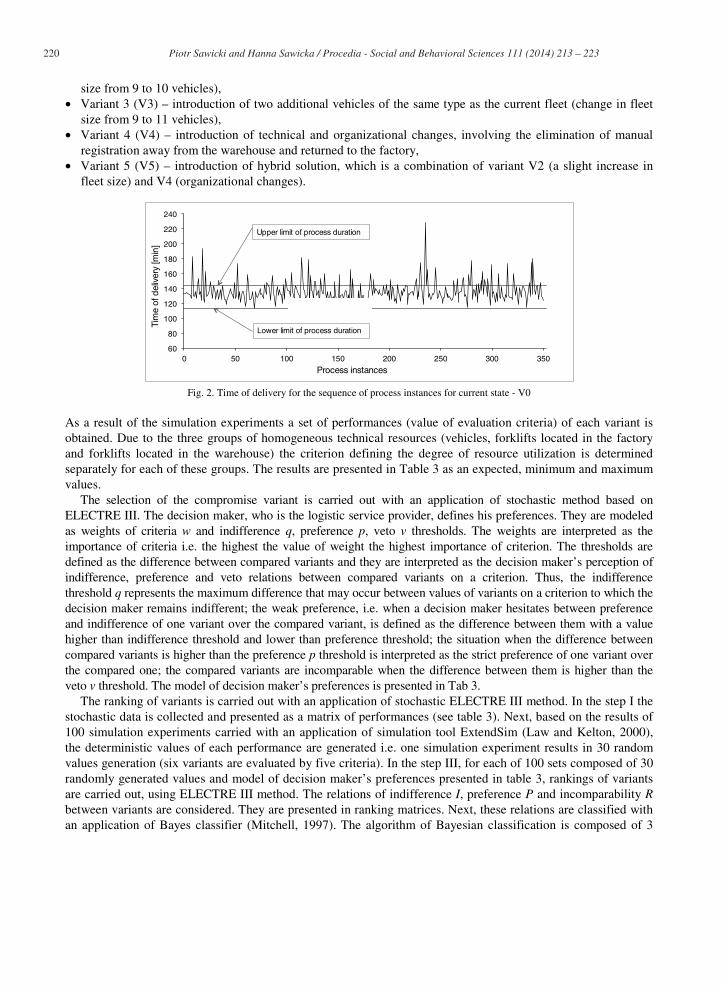
Based on established parameters, a sequence of process simulations for its current state has been performed. 10 consecutive simulation experiments, each for a week period and 3-shift model were implemented. A simula-tion results have been proved a substantial number of delays and deviation of process duration from its limits (see Fig. 2). The rate of delays has been confirmed positive validation of a constructed process simulation model.
Table 1. Time parameters for each activity in the process
Activity Duration [min]
Activity Duration [min]
min max most. min max most.
Loading containers with components 12 27 15 Loading of empty containers 12 18 16 Movement of containers between factory and wareh. 20 32 23 Ride to outbound ramp 2 4 3.5 Delivery registration 3 7 4.5 Departure registration 3 6 5
Ride to unloading ramp 2 5 3.5 Movement of empty containers back 18 30 21 Unloading of container at the ramp 10 15 12 Registration of empty containers arrival 2 4.5 3 Ride to the ramp for empty containers 1.5 5 4 Unloading of empty containers 10 17 17
Table 2. Cost factors associated with the resources utilized in the process
Cost factor Technical resource Human resource
Forklift Vehicle Operator Driver Security
Variable cost [PLN/h] 20 - 12.5 12.5 10 [PLN/km] - 0.40 - - -
Fixed cost [PLN/month] 450 1200 250 250 175
In order to improve the logistics process the set of five variants of the process design is defined. To compare the results of changes the model representing the current process state is considered as a reference variant. The redesign scenarios are as follows:
• Variant 0 (V0) – the current state of the process, • Variant 1 (V1) – introduction to loading and unloading additional lift truck in the factory, • Variant 2 (V2) – introduction of one additional vehicle of the same type as the current fleet (change in fleet
† Polish currency
220 Piotr Sawicki and Hanna Sawicka / Procedia - Social and Behavioral Sciences 111 ( 2014 ) 213 – 223
size from 9 to 10 vehicles), • Variant 3 (V3) – introduction of two additional vehicles of the same type as the current fleet (change in fleet
size from 9 to 11 vehicles), • Variant 4 (V4) – introduction of technical and organizational changes, involving the elimination of manual
registration away from the warehouse and returned to the factory, • Variant 5 (V5) – introduction of hybrid solution, which is a combination of variant V2 (a slight increase in
fleet size) and V4 (organizational changes).
Fig. 2. Time of delivery for the sequence of process instances for current state - V0
As a result of the simulation experiments a set of performances (value of evaluation criteria) of each variant is obtained. Due to the three groups of homogeneous technical resources (vehicles, forklifts located in the factory and forklifts located in the warehouse) the criterion defining the degree of resource utilization is determined separately for each of these groups. The results are presented in Table 3 as an expected, minimum and maximum values.
The selection of the compromise variant is carried out with an application of stochastic method based on ELECTRE III. The decision maker, who is the logistic service provider, defines his preferences. They are modeled as weights of criteria w and indifference q, preference p, veto v thresholds. The weights are interpreted as the importance of criteria i.e. the highest the value of weight the highest importance of criterion. The thresholds are defined as the difference between compared variants and they are interpreted as the decision maker’s perception of indifference, preference and veto relations between compared variants on a criterion. Thus, the indifference threshold q represents the maximum difference that may occur between values of variants on a criterion to which the decision maker remains indifferent; the weak preference, i.e. when a decision maker hesitates between preference and indifference of one variant over the compared variant, is defined as the difference between them with a value higher than indifference threshold and lower than preference threshold; the situation when the difference between compared variants is higher than the preference p threshold is interpreted as the strict preference of one variant over the compared one; the compared variants are incomparable when the difference between them is higher than the veto v threshold. The model of decision maker’s preferences is presented in Tab 3.
The ranking of variants is carried out with an application of stochastic ELECTRE III method. In the step I the stochastic data is collected and presented as a matrix of performances (see table 3). Next, based on the results of 100 simulation experiments carried with an application of simulation tool ExtendSim (Law and Kelton, 2000), the deterministic values of each performance are generated i.e. one simulation experiment results in 30 random values generation (six variants are evaluated by five criteria). In the step III, for each of 100 sets composed of 30 randomly generated values and model of decision maker’s preferences presented in table 3, rankings of variants are carried out, using ELECTRE III method. The relations of indifference I, preference P and incomparability Rbetween variants are considered. They are presented in ranking matrices. Next, these relations are classified with an application of Bayes classifier (Mitchell, 1997). The algorithm of Bayesian classification is composed of 3
60
80
100
120
140
160
180
200
220
240
0 50 100 150 200 250 300 350
Tim
e of
del
iver
y [m
in]
Process instances
Lower limit of process duration
Upper limit of process duration
221 Piotr Sawicki and Hanna Sawicka / Procedia - Social and Behavioral Sciences 111 ( 2014 ) 213 – 223
phases, such as (Mitchell, 1997):
• phase 1 – the construction of training set, i.e. classifier, • phase 2 – testing of the training set, • phase 3 – classification of the vector of observations to predefined classes (decision attributes).
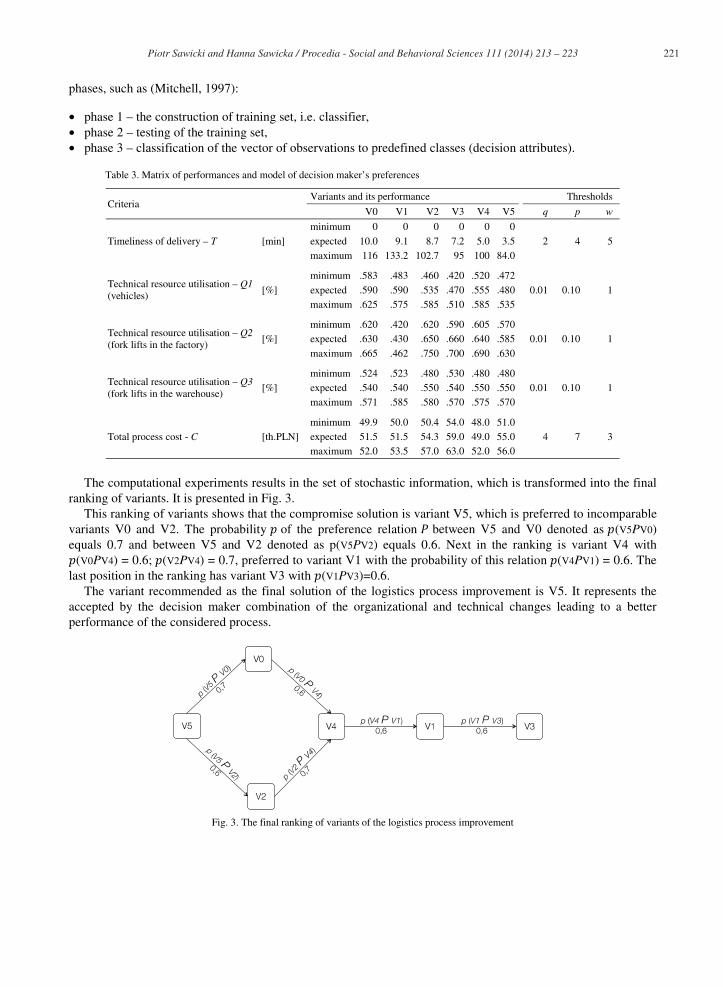
Table 3. Matrix of performances and model of decision maker’s preferences
Criteria Variants and its performance Thresholds
V0 V1 V2 V3 V4 V5 q p w
Timeliness of delivery – T [min]
minimum 0 0 0 0 0 0
2 4 5 expected 10.0 9.1 8.7 7.2 5.0 3.5maximum 116 133.2 102.7 95 100 84.0
Technical resource utilisation – Q1(vehicles) [%]
minimum .583 .483 .460 .420 .520 .472
0.01 0.10 1 expected .590 .590 .535 .470 .555 .480maximum .625 .575 .585 .510 .585 .535
Technical resource utilisation – Q2 (fork lifts in the factory)
[%] minimum .620 .420 .620 .590 .605 .570
0.01 0.10 1 expected .630 .430 .650 .660 .640 .585
maximum .665 .462 .750 .700 .690 .630
Technical resource utilisation – Q3(fork lifts in the warehouse)
[%] minimum .524 .523 .480 .530 .480 .480
0.01 0.10 1 expected .540 .540 .550 .540 .550 .550maximum .571 .585 .580 .570 .575 .570
Total process cost - C [th.PLN]minimum 49.9 50.0 50.4 54.0 48.0 51.0
4 7 3 expected 51.5 51.5 54.3 59.0 49.0 55.0maximum 52.0 53.5 57.0 63.0 52.0 56.0
The computational experiments results in the set of stochastic information, which is transformed into the final ranking of variants. It is presented in Fig. 3.
This ranking of variants shows that the compromise solution is variant V5, which is preferred to incomparable variants V0 and V2. The probability of the preference relation between V5 and V0 denoted as (V5PV0) equals 0.7 and between V5 and V2 denoted as p(V5PV2) equals 0.6. Next in the ranking is variant V4 with
(V0PV4) = 0.6; (V2PV4) = 0.7, preferred to variant V1 with the probability of this relation (V4PV1) = 0.6. The last position in the ranking has variant V3 with (V1PV3)=0.6.
The variant recommended as the final solution of the logistics process improvement is V5. It represents the accepted by the decision maker combination of the organizational and technical changes leading to a better performance of the considered process.
Fig. 3. The final ranking of variants of the logistics process improvement
222 Piotr Sawicki and Hanna Sawicka / Procedia - Social and Behavioral Sciences 111 ( 2014 ) 213 – 223
5. Conclusions
This article presents four-stage procedure of business process improvement, including: process modelling (first stage), mathematical modelling of process evaluation criteria (second stage), simulation model construction of the existing process, its variants design and simulation modelling (third stage), selection of the compromise redesign scenario with an application of stochastic multicriteria decision aid method (fourth stage).
In the first stage, the process analysis is carried out. The major activities, the cause-effect relationships between them, the number and type of resources in the process and their utilization are identified using ARIS Business Architect tool. In the second stage, the process is formalized; the evaluation criteria of the existing process and its improvement redesign scenarios are formulated. In the analysed process three evaluation criteria are defined i.e. timeliness of delivery, technical resource utilisation (separately for each resource) and total process cost. In the third stage, the simulation model of the analysed logistics process is constructed using ARIS Business Simulator. It ensures the calculation of the evaluation criteria values based on mathematical formulas presented in the previous stage. Finally, in the last stage the ranking of variants is calculated with an application of stochastic ELECTRE III method, constructed by one of the author of this paper.
The results demonstrate the practicality of the proposed and applied business process improvement procedure. It enables to carry out work in which the modeling of the process need not be averaged, but the natural variability in the time is possible to be taken into account in the analysis and reasoning.
The next steps of the research should involve: • verification of the wider set of the improvement redesign scenarios, • extension of the set of criteria taken into account, • conduct simulation experiments with a longer duration of the simulation, • assess the impact of changes in input parameters (e.g. type of distribution of activity duration) to select the
final variant, • construction of optimization models based on simulation models including evolutionary algorithms, and
compare the results.
Acknowledgements
Part of the research presented by co-author Piotr Sawicki, has been implemented in the framework of a research grant 7909/B/T02/2011/40.
References
Aghdasi, M., & Malihi, S.E. (2010). Rule based business process optimization. IEEE International Conference on Industrial Engineering and Engineering Management (IEEM 2010), 305-309. Aguilar-Savén,R.S. (2004). Business process modelling: Review and framework. International Journal of Production Economics,90,129-149. Arlbjørn, J.S., & Haug, A. (2010). Business process optimization. Academica, Aarhus. Brans, J.P., Vincke, P., & Mareschal, B. (1986). How to select and how to rank projects: The PROMETHEE method. European Journal of Operational Research, 24, 228-238. Davenport, T.H., & Short, J.E., (1990). The new industrial engineering: Information technology and business process redesign. Sloan Management Review, Summer, 11-27. Davis, R., & Brabänder, E., (2007). ARIS Design Platform. Getting started with BPM. Springer-Verlag, London. Dewan, R., Seidmann, A., & Walter, W., (1998). Workflow optimization through task redesign in business information processes, Proceedings of the 31st Hawaii International Conference on System Sciences, 1, 240-252. Edwards, W. (1999). How to use multiattribute utility measurement for social decision making. IEEE Transactions on Systems, Man and Cybernetics, 7 (5), 326-340. Fowler, M.S. (2000). UML distilled: A brief guide to the standard object modelling language. Addison-Wesley. Hofacker, I., Vetschera, R. (2001). Algorithmical approaches to business process design. Computers & Operations Research, 28, 1253-1275. Huang, Z., Lu, X., & Duan, H., (2012). A task operation model for resource allocation optimization in business process management. IEEE

223 Piotr Sawicki and Hanna Sawicka / Procedia - Social and Behavioral Sciences 111 ( 2014 ) 213 – 223
Transation on Systems, Man & Cybernetics. Part A - Systems & Humans, 42 (5), 1256-1270. Jacquet-Lagreze, E., & Siskos, J. (1982). Assessing a set of additive utility functions for multicriteria decision-making, the UTA Method.European Journal of Operational Research, 10, 151-164. Kamrani, F, Ayani, R., & Moradi, F., (2012). A framework for simulation-based optimisation of business process models. Simulation: Transactions of the Society for Modelling and Simulation International, 88 (7), 852-869. Kwak, N.K., & Lee, Ch.W. (2002). Business process reengineering for health-care system using multicriteria mathematical programming. European Journal of Operational Research, 140, 447-458. Lahdelma, R., Hokkanen, J., & Salminen, P. (1998). SMAA - stochastic multiobjective acceptability analysis. European Journal of Operational Research, 106 (1), 137-143. Law A.M., & Kelton W.D. (2000). Simulation, Modelling and Analysis. McGraw Hill, New York Lawrence, P. (1997). Workflow Handbook. John Wiley & Sons, Chichester. Leymann, F., & Roller, D. (2000). Production workflow: concept and techniques. Prentice Hall. Marinoni, O. (2005). A stochastic spatial decision support system based on PROMETHEE. International Journal of Geographical Information Science, 19 (1), 51-68. Matarazzo, B. (1991). MAPPAC as a compromise between outranking methods and MAUT. European Journal of Operational Research, 54 (1), 48-65. Menzel, C., & Mayer, R.J. (2006). The IDEF family of languages. In: P. Bernus, K. Mertins, and G. Schmidt (Eds.) Handbook on architectures of information systems. Springer, Berlin, Heidelberg, 215-249. Mitchell, T. (1997). Machine Learning. McGraw-Hill, New York. Roubens, M. (1982). Preference relations on actions and criteria in multicriteria decision making. European Journal of Operational Research, 10, 51-55. Roy, B. (1985). Methodologie Multicritere d’Aide a la Decision. Economica, Paris. Saaty, T.L. (1980). The Analytic Hierarchy Process: planning, priority setting, resource allocation. McGraw Hill, New York. Salomie, I., Chifu, V.R., Pop, C.B., & Suciu, R., (2012). Firefly-based business process optimization. IEEE International Conference on Intelligent Computer Communication and Processing, (ICCP 2012), 49-56. Sawicka, H. (2012). The redesign method of the distribution system of goods. Warsaw University of Technology, Warszawa, 2012 (Ph.D. Thesis, in Polish). Sawicka, H., and Zak, J., (2013). Multiple criteria stochastic ranking of variants of the distribution system. Proceedings of the 13th WCTR, July 15-18, Rio de Janeiro, Brazil, 20 pages. Scheer, A.W. (1990). ARIS - Business process frameworks. Springer-Verlag, Berlin. Siskos, J. (1982). A way to deal with fuzzy preferences in multicriteria decision problems. European Journal of Operational Research, 10 (3), 314-324. Software AG. (2012). ARIS Business Simulator. Available on-line [June, 2013] at: http://www.softwareag.com/corporate/images/SAG_ ARIS_BusSim_FS_Apr12_WEB_tcm16-78560.pdf Stam, A., & Duarte Silva, A.P. (1997). Stochastic judgments in the AHP: The measurement of rank reversal probabilities. Decision Sciences, 28 (3), 655-688. Stelling, M., Roy, R., & Tiwari, A. (2009). A novel modelling and optimisation technique for business processes: An evolutionary computing based approach. In: E. Avineri et al., (Ed.). Applications of Soft Computing, 52, 75-85. Tervonen, T., & Figueira, J. (2008). A survey on stochastic multicriteria acceptability analysis methods. Journal of Multi-Criteria Decision Analysis, 15 (1-2), 1-14. Tiwari, A., Turner, Ch., Ball, P., & Vergidis, K., (2010). Multi-objective optimisation of web business processes. In:. K. Deb, et al., (eds.): SEAL 2010. Lecture Notes in Computing Science, 6457, 537-577. Tiwari, A., Vergidis, K., & Roy, R. (2007). Evolutionary optimization of business process designs. In: D. Keshav, K.C. Tan, P.I. Cowling (eds.) Evolutionary Scheduling, Studies in Computational Intelligence, 49, 513-541. Tiwari, A., Vergidis, K., & Turner, Ch. (2010). Evolutionary multi-objective optimisation of business processes. In: X.-Z. Gao, A. Gaspar-Cunha, M. Köppen, G. Schaefer, J. Wang (eds.). Soft Computing in Industrial Applications, Advances in Intelligent and Soft Computing, 75, 293-301. Van der Aalst, W.M.P., & van Hee, K. (2004). Workflow management: models, methods, and systems. MIT Press. Vergidis, K., and Tiwari, A. (2008). Business process design and attribute optimisation within an evolutionary framework. Conference Proceedings of 2008 IEEE Congress on Evolutionary Computation - CEC 2008, 668-675. Vergidis, K., Saxena, D., & Tiwari, A. (2012). An evolutionary multi-objective framework for business process optimisation. Application of Soft Computing, 12, 2638-2653. Vergidis, K., Tiwari, A., Majeed, B., & Roy, R. (2007). Optimisation of business process designs: An algorithmic approach with multiple objectives. International Journal of Production Economics, 109, 105-121. Vincke, P. (1992). Multicriteria Decision-Aid. John Wiley & Sons, Chichester. White, S.A. (2006). Business process modelling notation - OMG final adopted specification. Needham, MA, USA, http://www.bpmn.org Zhou, Y., & Chen, Y. (2002). Business process assignment optimization. Proceedings of the IEEE International Conference on Systems, Man and Cybernetics, Hammamet.
Related Documents