Logistics of empty marine containers March, 2007 S.J. Mol Master Thesis: TIL 5060 Transport, Infrastructure and Logistics, TU Delft

Welcome message from author
This document is posted to help you gain knowledge. Please leave a comment to let me know what you think about it! Share it to your friends and learn new things together.
Transcript
Logistics of empty marine containers
March, 2007
S.J. Mol
Master Thesis: TIL 5060
Transport, Infrastructure and Logistics, TU Delft

Logistics of empty marine containers
A research on strategies for port planning, concerning the storage and flow of empty marine containers in
the port of Rotterdam
Final report
March, 2007
By: S.J. Mol
Stud.nr.: 9576648
E-mail: [email protected]
Master Thesis: TIL 5060
Transport, Infrastructure and Logistics, TU Delft
Graduation Committee:
Daily supervisors:
Chairman:
External supervisor:
Company:
J. C. van Ham M A (TPM faculty)
J. C. Rijsenbrij M Sc (3ME faculty)
G. P. van Wee M A PhD (TPM faculty)
C. Klaver M Sc (representative: A. Clijncke M Sc)
Witteveen+Bos, Rotterdam
'U Delft
Witteveen

Preface
The port of Rotterdam is one of the vital parts of the Dutch economy. Progressively more goods are transported in
marine containers. This large seaport supports the import, export and transhipment of containers (loaded and empty).
The transport, handling and storage of especially empty containers are the topic of this research.
Maasvlakte 2, a 1000 ha port expansion to be built in the North Sea starting in 2008, is being developed. The Rotterdam
Port Authority has the complicated task to determine a feasible strategy, regarding the spatial planning of empty depots,
towards 2040, when Maasvlakte 2 will be fully operational. Therefore, the characteristics of the logistics of empty marine
containers, their storage and their flow between the Maasvlakte 2, Port of Rotterdam and its hinterland, are of great
importance. The logistics of empty containers is an uncultivated topic. For that reason, getting insight in the effects of
possible strategies, proved to be a major challenge. In this report, I would like to share with you the knowledge of
empty containers logistics, as well as the process towards this understanding, which proved to be very complex. Since
this process sometimes was a struggle, I am very grateful to everybody, who helped to structure and depicts the
complex system. An introduction on this issue is presented in the first chapter, the methods of research and the further
structure of this report are explained in the second chapter.
This research has been executed as the Master Thesis Project of the master Transport Infrastructure and Logistics (TIL
Master) at the faculty of Technology, Policy and Management (TPM), of Civil Engineering and Geosciences (CITG) and of
Mechanical, Maritime and Materials Engineering (3ME), all part of Technical University Delft. Witteveen+Bos consulting
engineers commissioned the project. Similar to the background of the study program, the supervision was
multidisciplinary. The two daily supervisors Hans van Ham and Joan Rijsenbrij, both have their own expertise in the field
of port policies and economics respective container handling and logistic businesses. Their useful suggestions proved of
equal importance for this research and I thank them for their constructive discussions and comments. Also I would like
to thank Witteveen+Bos for their hospitality and for the guidance of course, by A. Clijncke and C. Klaver. In addition
many other experts have contributed to this research. Amongst them where Tom Dekker (Rotterdam Port Authority,
Business Developer depots and hinterland). Joop Mijland (APL, Director Network and Operations Europe) and Bert van
Wee (TUDelft, director TIL). And last but not least, I would like to thank my brother Joost and my friend Diana for their
support.
Rotterdam, January 2007
Fieke Mol

Executive summary
The aim of this research is to give insight in the effects of port planning strategies of the Rotterdam Port Authority
(RPA), regarding storage facilities for empty containers (empty depots) at the Port of Rotterdam (PoR).
Empty depots generate transport of empty containers (often by truck), and increasingly require port terrain. Given the
expected growth of trade volumes, the environmental regulations and the quality of the accessibiliy of the PoR requires
a planning strategy for empty depots.
In the allocation of storage areas for empty containers the RPA needs to decide upon the location, the quantity, the
dimensions of the required area, the related infrastructure (which impacts the accessibility of the port) and the lease
price of empty depot terrain.
There are conflicting interests of the RPA and the shipping companies regarding the aimed land use of the PoR for depot
terrain. A multi-actor approach is used to incorporate the different viewpoints. Storage facilities for empty containers are
of strategic importance to their direct clients; lease companies and shipping companies, the latter being the main user.
Transport operators are the indirect users of empty depots. The location and infrastructural connection of empty depots
affect their routing and fleet management.
The potential economic saving involved in the efficiency of empty container logistics by a larger use of inland storage (in
stead of storage at the port) is investigated. The need for storage facilities of empty containers in the port area is
derived from an analysis of the logistics of empty containers on different levels of scope. This is done by means of
literature study, interviews and application of the list extension method. This causal method indentifies the most
important influences on the demand for port depot terrain.
The imbalance in world trade causes a surplus of containers in North West Europe. Due to higher storage costs in the
Far East not all "match back" containers, are directly repositioned to the Far East. Another reason for storage in Europe
is the strong secondary container market. This gears the demand for empty depots in Europe and especially in the PoR,
since this is major transport node.
The organisational structure of the supply chain Is of great influence on the use of port depots. Shipping companies,
using merchant haulage, prefer to have the containers returned to the port for financial and organisational reasons.
Efficiency of hinterland transportation Is also important for transport operators, who try to maximize the occupation rate
of their vehicle fleet. Empty depots near ports enable more combinations trips.
The key determinants for quantification of future depot utilisation are ICT developments, type of haulage, empty deep-
sea transhipment and scale enlargements. An increase in ICT applications will reduce the demand for storage. A shift
towards merchant haulage would increases the need for storage in the port area. The empty throughput in the PoR is
growing slower than the throughput of full containers. Economies of scale positively influence the chance of matching a
container with cargo. The future number of depot arrivals are estimated on 2.1 to 2.4 million TEU in 2020 and on 2.7 to
3.2 million TEU in 2040. A higher price for depot services is an incentive for improvement of empty logistics, which
allows the dimensions of depots in the port area to be less than the demand resulting from an extrapolation of the
present situation.
This research offers a complete framework of the determinants of empty depots. Different strategy concepts regarding
empty depots are assessed on their performance in 2020 and 2040 regarding the criteria of the main parties involved, by
means of a multi criteria analysis.
It is recommended to allocate a substantial amount of empty depots behind the terminal as this supports a modal shift
and is logistically efficient. A limited part of the storage can be crowded out to inland terminals. Nevertheless, it is not
lucrative for the RPA to locate all empty depots behind the terminals at Maasvlakte 2 (MV2). The RPA should also
facilitate empty depots with a barge connection (to support modal shift) in the Waal-/Eemhaven area.
Logistics of empty containers
The RPA should use an adaptive, flexible policy to adjust the supply of depot terrain, as it complies with the need.
Regarding the planning process, it is favourable to plan depot terrain ahead. The RPA should reserve future depot
terrains at MV2 to avoid planning difficulties in later stages. During the starting phase of MV2 the RPA should find
temporary destinations for terrain that cannot be leased to depot operators yet. By restricting the duration of lease
contracts with depot operators (about five years) flexibility will be achieved in later phases.
Furthermore, it is advantageous to increase the depot prices, since this will stimulate the crowding out effect. Regarding
the prices of competing ports there is enough room for price increase.
Under conditions that the current average dwell time and the terrain productivity remain unchanged in the future, the
required space for empty depots varies from 100 to 113 ha in 2020 and 127 to 149 ha in 2040, for the entire PoR.
Currently there are 85 ha of depot terrain. If the current area remains available, there is a demand for an additional 15
to 28 ha empty depot terrain in 2020 and 42 to 64 ha for 2040 for the PoR.
Summary
Introduction Due to mismatches in time and place, temporary storage of empty marine containers is inevitable. Imbalances and
fluctuations in trade cause an accumulation of empty containers at (amongst others) port areas. The inequity in cargo
flows has great impact on the Port of Rotterdam (PoR), as major European port. The flow of empty containers to and
from the PoR will increase, supported by the development of Maasvlakte 2 (MV2), a 1000 ha port expansion to be built
in the North Sea starting in 2008.
The aim of this research is to give insight in the effects of port planning strategies of the Rotterdam Port Authority
(RPA), regarding storage facilities for empty containers (empty depots) at the Port of Rotterdam (PoR).
In formulating the port planning strategy towards the spatial planning of empty depots, four points of interests can be
distinguished:
• Conflicting interests between RPA and shipping lines as container owners;
• Efficiency of empty container logistics;
• Environmental constraints
• Accessibility of the PoR;
Conflicting interests
The RPA prefers to use the available space in the port for commercial activities other than storing empty containers,
because this is more lucrative. Nevertheless, many empty containers are stored in empty depots located at the PoR.
Shipping companies as container owners prefer to have available empty containers in a buffer in port depots in order
to supply these when required to exporting companies.
Efficiency of empty container iogistics
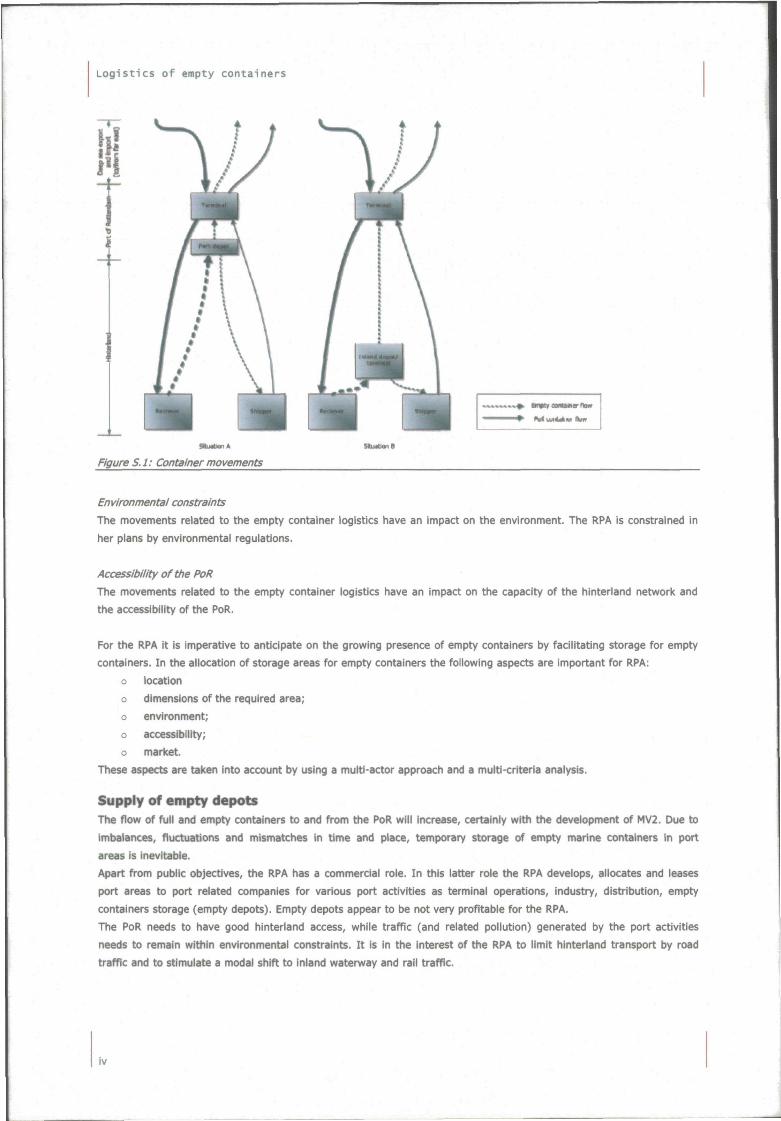
Economic savings can be reached with efficient empty container logistics. There seems to be an inefficiency regarding
the movements of empty containers. In case an inland depot is used for the storage of empty containers near the
market of receivers/shippers in the hinterland (see figure S.l, situation B), the travelling distance can be reduced.
Logistics of empty containers
T
Figure S.l: Container movements
Environmental constraints
The movements related to the empty container logistics have an impact on the environment. The RPA is constrained in
her plans by environmental regulations.
Accessibility of the PoR
The movements related to the empty container logistics have an impact on the capacity of the hinterland network and
the accessibility of the PoR.
For the RPA it is imperative to anticipate on the growing presence of empty containers by facilitating storage for empty
containers. In the allocation of storage areas for empty containers the following aspects are important for RPA:
o location
o dimensions of the required area; o environment;
o accessibility;
o market.
These aspects are taken into account by using a multi-actor approach and a multi-criteria analysis.
Supply of empty depots The flow of full and empty containers to and from the PoR will increase, certainly with the development of MV2. Due to
imbalances, fluctuations and mismatches in time and place, temporary storage of empty marine containers in port
areas is inevitable.
Apart from public objectives, the RPA has a commercial role. In this latter role the RPA develops, allocates and leases
port areas to port related companies for various port activities as terminal operations, industry, distribution, empty
containers storage (empty depots). Empty depots appear to be not very profitable for the RPA.
The PoR needs to have good hinterland access, while traffic (and related pollution) generated by the port activities
needs to remain within environmental constraints. It is in the interest of the RPA to limit hinterland transport by road
traffic and to stimulate a modal shift to inland waterway and rail traffic.
tv
Summary
The concepts are assessed on their performance in 2020 and 2040 regarding the criteria of the main parties involved,
by means of a multi criteria analysis. In first instance, the four concepts are assessed by the values of the RPA. Next,
the concepts are assessed to the criteria of the shipping companies.
The current policy can be corrected in order to create a better balance between supply and demand. Although it seems
advantageous to eliminate empty depots from the Waal-/Eemhaven area, it may have a negative effect on the trip
combinations. A depot behind the terminal is valuable, but can be kept minimal. Furthermore, there is a need for a
certain amount of depot terrain in the remaining part of the port, which is also in the interest of the RPA to supply.
It is feasible to allocate a substantial amount of empty depots behind the terminal and to offer storage at the Waal-
/Eemhaven. A limited part of the storage can be crowded out to inland terminals.
Conclusions The research results in the recommendation to facilitate empty depots with a barge connection In the Waal-/Eemhaven
area, to plan depot terrain ahead and to increase lease prices for depot areas. There is opportunity for improvement of
empty logistics, which allows the dimensions of depots in the port area to be less than the demand resulting from an
extrapolation of the present situation.
A modal shift in empty container transport can be achieved by locating empty depots behind terminals or by assigning
depots to land with a water connection. A connection of a depot with the terminal is logistically efficient. Nevertheless,
it is not lucrative for the RPA to locate all empty depots behind the terminals at MV2.
The analysis of the different allocations of depot terrains, confirmed that it is advantageous to allocate terrain in a
masterplan in order to prevent planning difficulties in later stages. This strategy results in lots, that are suitable for
empty container storage, due to their accessibility by different modalities and to logistical efficient location. Until the
empty depot volumes reach the maximal level of occupancy, there will be terrain that the RPA cannot lease to depot
operators yet, because the market for depot operators is insufficient at that moment. Therefore, it is lucrative and
recommendable for the RPA to find temporary destinations for terrain that will be used for empty depot in a later
stage.
It is advantageous to increase the depot prices, since this will stimulate the crowding out effect. Regarding the prices
of competing ports there is enough room for price increase.
Under conditions that the current average dwell time and the terrain productivity remain unchanged in the future, the
required space for empty depots varies from 100 to 113 ha in 2020 and 127 to 149 ha in 2040, for the entire PoR.
Currently there are 85 ha of depot terrain. If it is assumed that the current area remains available, the demand is for
an additional 15 to 28 ha empty depot terrain in 2020 and 42 to 64 ha for 2040 for the PoR.
The gradual growth of the future container flow, complicate the planning task of the RPA. Empty containers are in the
starting phase of a new terminal stored at the terminal. This retreats the moment at which a critical mass is reached
for depots behind future container terminals. Depot operators need a certain amount of depot arrivals to profitable
exploit a depot in highly competitive environment. Therefore, leasing terrain behind a new terminal to depot operators
in the starting phase is not achievable.
The RPA should use an adaptive, flexible policy to adjust the supply of depot terrain, as it complies with the need.
By restricting the duration of lease contracts with depot operators (about five years) flexibility will be achieved.
An interesting issue in this research is the identification of possibilities to relatively decrease the area for empty depots
at the PoR. It is likely that the storage of empty containers shifts towards inland depots. The tight supply of terrain
however may result in the following effects.
A reduction in supply may lead to less service to port users. The throughput of the port will decrease, as shipping
companies take refuge in other ports for their storage of empty containers.
Tight supply might be an incentive to further increase matchability, to a shift from merchant towards carrier haulage,
or to less dwell time by avoiding maintenance and repair in the port depots. Due to the complicated logistic market. It
is difficult to predict the future developments.
vii
Logistics of empty containers
To protect the competitive strength of the port, in case of tight supply, mitigating measures are needed to keep the
same level of service to the clients. Potential mitigating measures can compensate for the decrease in supply of depot
terrain. This new approach requires a commercially innovative attitude of the PoR towards empty container services.
The possibilities for mitigating measures were investigated, but both the RPA and the shipping companies are of the
opinion that those extra container services should originate independently as result of market dynamics.
Discussion The demand and supply of empty depots should be balanced in the future. Because of the dynamic environment,
monitoring is important.
Developments around the mega depot Maersk is planning to create should be followed. Maersk creates large
transhipment volumes in the PoR and is consequently responsible for a large part of the need for empty container
storage. When Maersk (in stead of depot operators) takes care of depot services at its terminal, there is less need for
depots elsewhere in the PoR.
The following aspects of the depot moves are of importance to refine the estimates of the future demand:
Type of container (distinction in reefer or standard and TEU or FEU)
Type of modality
Direction (towards MV or hinterland)
Dwell time
Price level of depot services
It is recommended that the RPA monitors the above-mentioned aspects, since an objective and multimodal approach Is
required.
VIII
Table of contents
PREFACE i
SUMMARY i i i
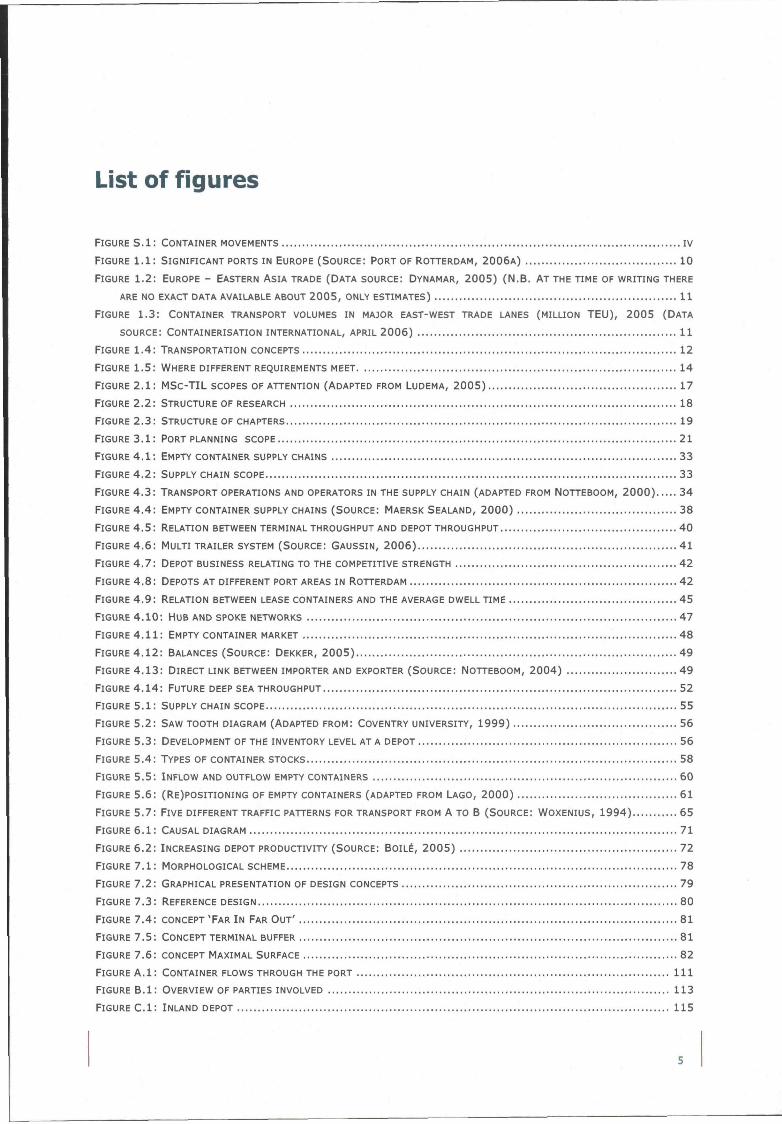
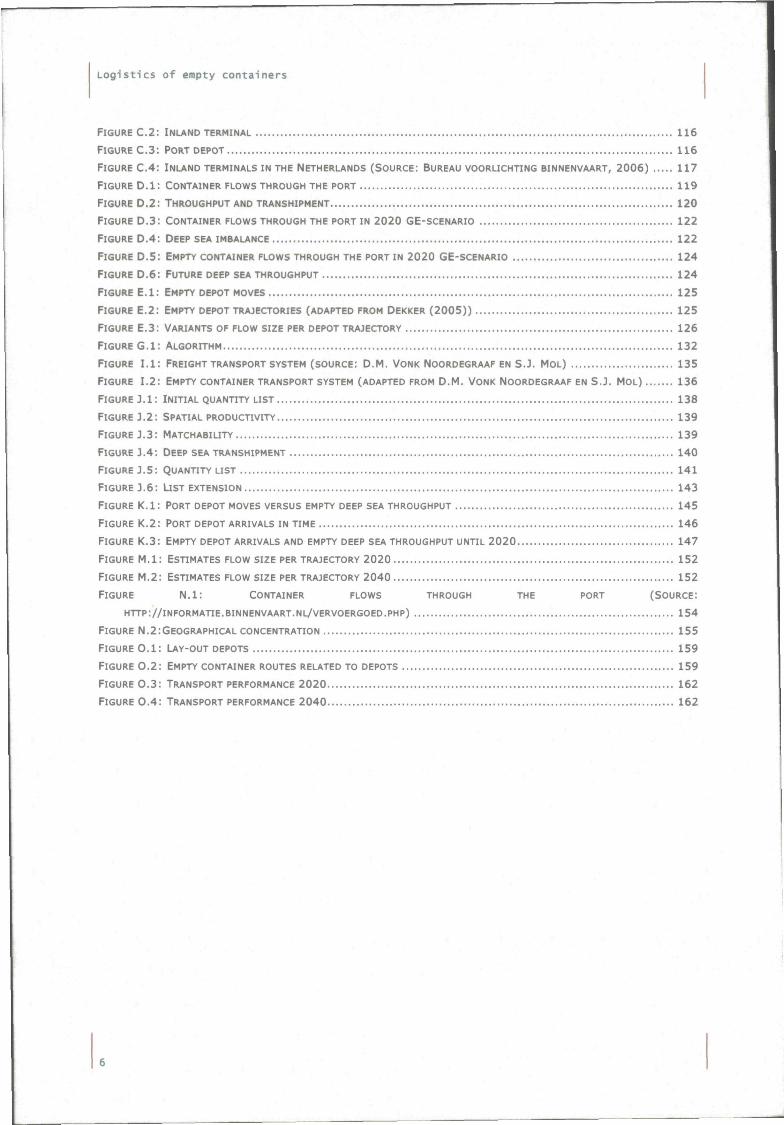
L I S T OF FIGURES 5
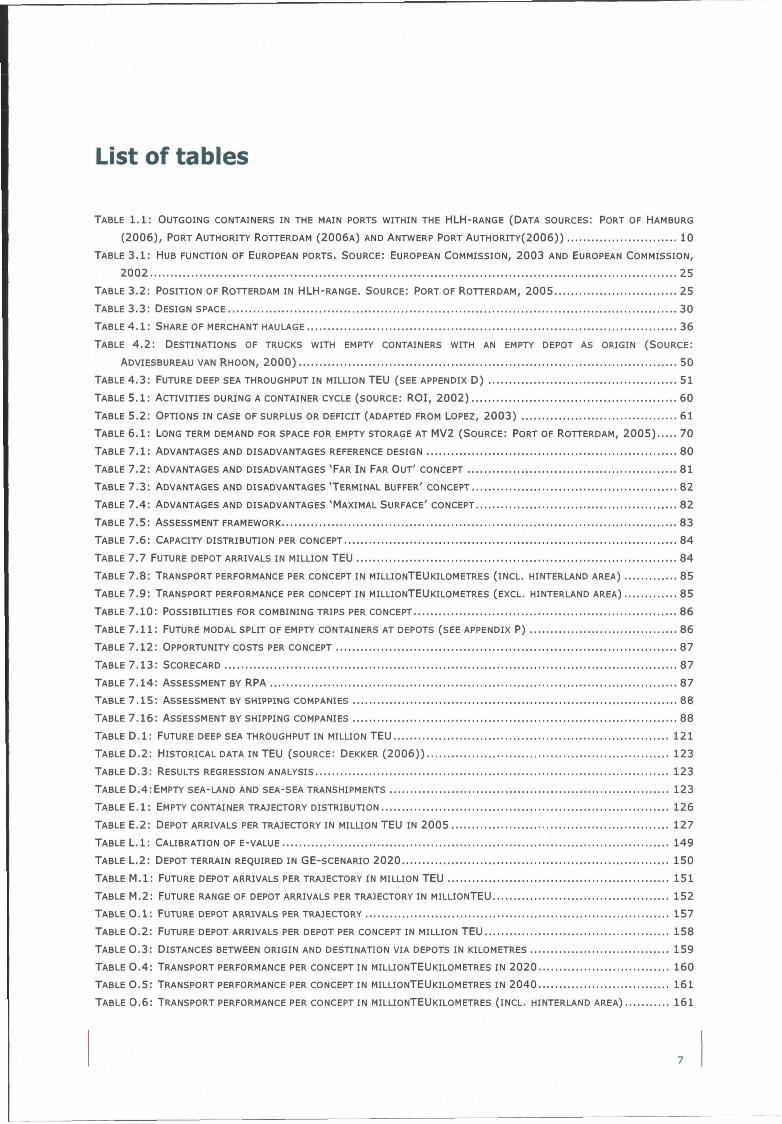
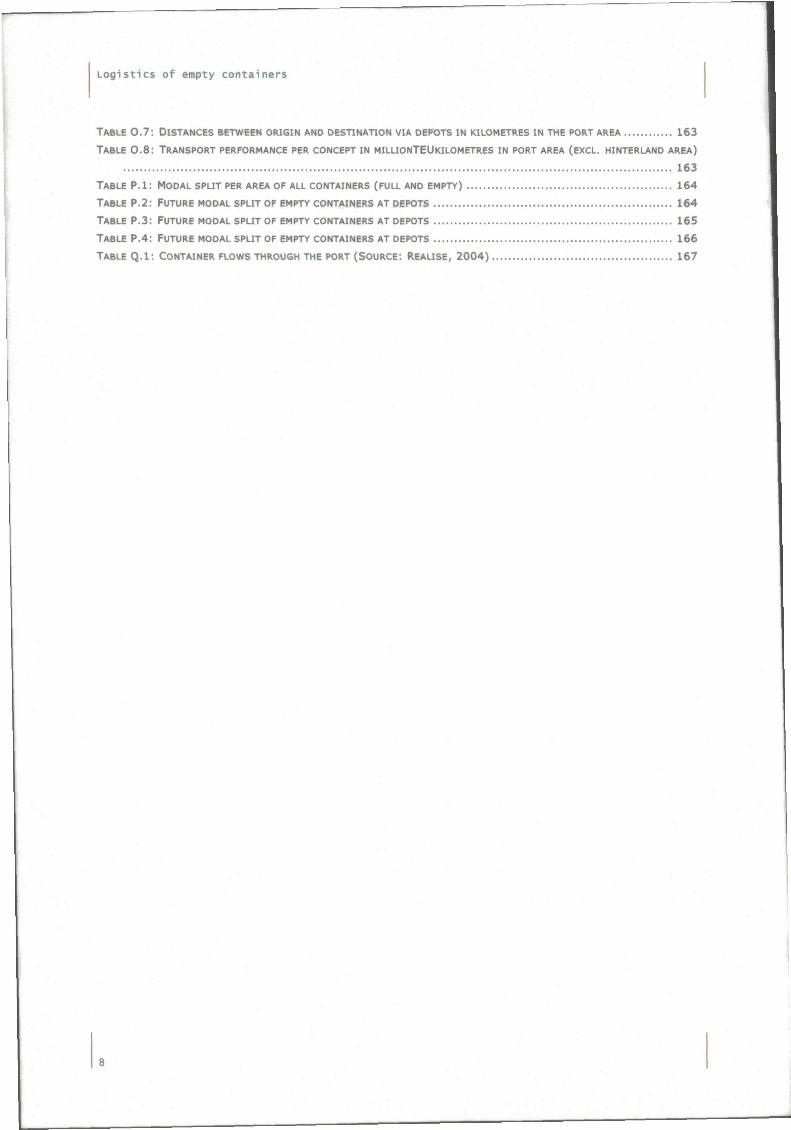
L I S T OF TABLES 7
1 | I N T R O D U C T I O N ON EMPTY CONTAINER LOGISTICS 9
1.11 IMBALANCES I N TRADE LANES 10
1.21 CONTAINER TRANSPORT AND STORAGE 12
1.3| ALLOCATION OF DEPOTS IN THE PORT 13
1.4| PORT DEPOT REQUIREMENTS 13
2 | RESEARCH FRAMEWORK 15
2.11 LITERATURE 15
2.2| SCOPE 16
2.3| RESEARCH QUESTIONS 17
2.4| RESEARCH METHODS 18
2.51 BOOKMARK 19
3 | PORT PLANNING AND EMPTY DEPOTS. . . . 2 1
3.11 PORT DEVELOPMENT 22
3.21 COMPETITIVE STRENGTH 23
3.31 ENVIRONMENTAL IMPACT AND ACCESSIBILITY 25
3.41 PLANNING POLICY 27
3.51 DESIGN SPACE 28
3.61 ALLOCATING EMPTY DEPOTS 30
4 | EMPTY CONTAINERS AS PART OF THE CONTAINER SUPPLY C H A I N 33
4.11 OPERATORS I N THE CONTAINER SUPPLY CHAIN 33
4.1.11 Merchant versus Carrier Haulage 35
4.1.21 Collaboration 36
4.21 EMPTY CONTAINERS AT SEA PORT CONTAINER TERMINAL 39
4.2.11 Storage at the terminal 40
4.2.21 Connection terminal with depot 40
4.31 EMPTY CONTAINERS AT PORT DEPOTS 41
4.3.11 Port depot function 42
4.3.21 Depot business 44
4.3.31 Lease depots 44
4.41 EMPTY CONTAINERS AT INLAND TERMINALS 46
4.4.11 Inland terminal function 46
4.4.21 Substitute for port depots 46
4.51 CONTAINER IMPORT AND EXPORT FLOWS 48
4.5.11 Commodity and origin and destination of empties 49
Logistics of empty containers
4.5.21 Size of empty container flow 51
4.61 ROLE OF EMPTY PORT DEPOTS IN THE SUPPLY CHAIN 52
S| EMPTY CONTAINER MANAGEMENT 55
5.11 STOCK MANAGEMENT 55
5.21 FORECASTING OF EMPTY CONTAINER DEMAND 58
5.31 REPOSITIONING 59
5.3.11 International repositioning 62
5.3.21 Port of Rotterdam as empty container hub 63
5.3.3! Repositioning strategies 63
5.4| TRANSPORT OPERATIONS 63
5.4.11 Matchability 64
5.4.21 Hinterland routing 64
5.51 CONTAINER MANAGEMENT AND EMPTY DEPOTS 66
61 EMPTY DEPOTS: THE BALANCE BETWEEN PORT PLANNING AND CONTAINER MANAGEMENT 69
6.1| PRELIMINARY LAND USE ESTIMATES 69
6.2| DETERMINANTS OF DEPOT DEMAND 70
6.3| FUTURE CONDITIONS AND DEMAND 71
6.4| EFFECTS OF TIGHT SUPPLY 72
6.51 BALANCING 74
71 EVALUATION OP EMPTY DEPOT DESIGN CONCEPTS 77
7.11 CONSTRAINTS AND POINTS OF DEPARTURE 77
7.2| DESIGN SPACE OF EMPTY DEPOTS AT THE PORT OF ROTTERDAM 78
7.31 ASSESSMENT FRAMEWORK FOR EMPTY DEPOT DESIGNS 83
7.41 COMPARISON OF CONCEPTS 83
7.4.11 Availability 83
7.4.21 Transport performance 84
7.4.3! Trip combinations 85
7.4.41 Modal shift 86
7.4.5! Pricing 86
7.5! EVALUATION RESULTS 87
81 CONCLUSIONS AND RECOMMENDATIONS 89
EPILOGUE 93
REFERENCES 95
GLOSSARY 103
APPENDICES 109
APPENDIX A | OBJECTIVES OF ROTTERDAM PORT AUTHORITY I l l
APPENDIX B! ACTORS IN THE SUPPLY CHAIN 113
APPENDIX C! COMBINATION OF TRIPS 115
APPENDIX D! FUTURE EMPTY DEEP SEA THROUGHPUT 119
APPENDIX E| DEPOT ARRIVALS PER TRAJECTORY 125
APPENDIX F| ACTIVITIES OF A SHIPPING COMPANY 129
APPENDIX G! POSITIONING ALGORITHM 131
2
Table pf contents
APPENDIX H | REPOSITIONING STRATEGIES 133
APPENDIX I! TRANSPORT AND LOGISTICS TERMINOLOGY 135
APPENDIX J! LIST EXTENSION 137
APPENDIX K| FUTURE EMPTY DEPOT ARRIVALS 145
APPENDIX L| LAND REQUIRED FOR EMPTY DEPOTS 149
APPENDIX M! FUTURE DEPOT ARRIVALS PER TRAJECTORY 151
APPENDIX N| TRENDS 153
APPENDIX 0 | TRANSPORT PERFORMANCE PER CONCEPT 157
APPENDIX P! MODAL SPLIT PER CONCEPT 164
APPENDIX Q! TRANSPORTATION COSTS 167
3

Logistics of empty containers
List of figures
FIGURE S . l : CONTAINER MOVEMENTS iv
FIGURE l . l : SIGNIFICANT PORTS I N EUROPE (SOURCE: PORT OF ROTTERDAM, 2 0 0 6 A ) 10
FIGURE 1.2: EUROPE - EASTERN A S I A TRADE (DATA SOURCE: DYNAMAR, 2005) (N.B. AT THE TIME OF WRITING THERE
ARE NO EXACT DATA AVAILABLE ABOUT 2005, ONLY ESTIMATES) 11
FIGURE 1.3: CONTAINER TRANSPORT VOLUMES I N MAJOR EAST-WEST TRADE LANES (MILLION TEU), 2005 (DATA
SOURCE: CONTAINERISATION INTERNATIONAL, APRIL 2006) 11
FIGURE 1,4: TRANSPORTATION CONCEPTS 12
FIGURE 1.5: WHERE DIFFERENT REQUIREMENTS MEET 14
FIGURE 2 . 1 : MSc-TIL SCOPES OF ATTENTION (ADAPTED FROM LUDEMA, 2005) 17
FIGURE 2.2: STRUCTURE OF RESEARCH 18
FIGURE 2 .3 : STRUCTURE OF CHAPTERS 19
FIGURE 3 . 1 : PORT PLANNING SCOPE 21
FIGURE 4 . 1 : EMPTY CONTAINER SUPPLY CHAINS 33
FIGURE 4 .2 : SUPPLY CHAIN SCOPE 33
FIGURE 4 .3 : TRANSPORT OPERATIONS AND OPERATORS I N THE SUPPLY CHAIN (ADAPTED FROM NOTTEBOOM, 2000) 34
FIGURE 4 .4 : EMPTY CONTAINER SUPPLY CHAINS (SOURCE: MAERSK SEALAND, 2000) 38
FIGURE 4 .5 : RELATION BETWEEN TERMINAL THROUGHPUT AND DEPOT THROUGHPUT 40
FIGURE 4 .6 : MULTI TRAILER SYSTEM (SOURCE: GAUSSIN, 2006) 41
FIGURE 4 .7 : DEPOT BUSINESS RELATING TO THE COMPETITIVE STRENGTH 42
FIGURE 4 .8 : DEPOTS AT DIFFERENT PORT AREAS I N ROTTERDAM 42
FIGURE 4 .9 : RELATION BETWEEN LEASE CONTAINERS AND THE AVERAGE DWELL TIME 45
FIGURE 4 .10 : HUB AND SPOKE NETWORKS 47
FIGURE 4 . 1 1 : EMPTY CONTAINER MARKET 48
FIGURE 4 .12: BALANCES (SOURCE; DEKKER, 2005) 49
FIGURE 4 .13: DIRECT LINK BETWEEN IMPORTER AND EXPORTER (SOURCE; NOTTEBOOM, 2004) 49
FIGURE 4 .14 : FUTURE DEEP SEA THROUGHPUT 52
FIGURE 5 . 1 : SUPPLY CHAIN SCOPE 55
FIGURE 5.2; SAW TOOTH DIAGRAM (ADAPTED FROM: COVENTRY UNIVERSITY, 1999) 56
FIGURE 5.3: DEVELOPMENT OF THE INVENTORY LEVEL AT A DEPOT 56
FIGURE 5.4: TYPES OF CONTAINER STOCKS 58
FIGURE 5.5; INFLOW AND OUTFLOW EMPTY CONTAINERS 60
FIGURE 5.6: (RE)POSITIONING OF EMPTY CONTAINERS (ADAPTED FROM LAGO, 2000) 61
FIGURE 5.7: FIVE DIFFERENT TRAFFIC PATTERNS FOR TRANSPORT FROM A TO B (SOURCE: WOXENIUS, 1994) 65
FIGURE 6 . 1 : CAUSAL DIAGRAM 71
FIGURE 6.2: INCREASING DEPOT PRODUCTIVITY (SOURCE: BOILÉ, 2005) 72
FIGURE 7 . 1 : MORPHOLOGICAL SCHEME 78
FIGURE 7.2: GRAPHICAL PRESENTATION OF DESIGN CONCEPTS 79
FIGURE 7.3: REFERENCE DESIGN 80
FIGURE 7.4: CONCEPT'FAR I N FAR OUT' 81
FIGURE 7.5: CONCEPT TERMINAL BUFFER 81
FIGURE 7.6: CONCEPT MAXIMAL SURFACE 82
FIGURE A . l : CONTAINER FLOWS THROUGH THE PORT i l l
FIGURE B . l : OVERVIEW OF PARTIES INVOLVED 113
FIGURE C . l ; INLAND DEPOT 115
5
L o g i s t i c s o f empty c o n t a i n e r s
FIGURE C.2: INLAND TERMINAL 116
FIGURE c . 3 : PORT DEPOT 116
FIGURE C . 4 : INLAND TERMINALS I N THE NETHERLANDS (SOURCE: BUREAU VOORLICHTING BINNENVAART, 2006) 117
FIGURE D . l ; CONTAINER FLOWS THROUGH THE PORT 119
FIGURE D.2: THROUGHPUT AND TRANSHIPMENT 120
FIGURE D.3: CONTAINER FLOWS THROUGH THE P O R T I N 2020 GE-SCENARIO 122
FIGURE D . 4 : DEEP SEA IMBAUNCE 122
FIGURE D . 5 : EMPTY CONTAINER FLOWS THROUGH THE PORT I N 2020 GE-SCENARIO 124
FIGURE D . 6 : FUTURE DEEP SEA THROUGHPUT 124
FIGURE E . l : EMPTY DEPOT MOVES 125
FIGURE E . 2 : EMPTY DEPOT TRAJECTORIES (ADAPTED FROM DEKKER (2005)) 125
FIGURE E . 3 : VARIANTS OF FLOW SIZE PER DEPOT TRAJECTORY 126
FIGURE G . l : ALGORITHM 132
FIGURE l . l : FREIGHT TRANSPORT SYSTEM (SOURCE: D.M. VONK NOORDEGRAAF EN S . J . MOL) 135
FIGURE 1.2: EMPTY CONTAINER TRANSPORT SYSTEM (ADAPTED FROM D.M. VONK NOORDEGRAAF EN S.J. MOL) 136
FIGURE J . l : INITIAL QUANTITY LIST 138
FIGURE J.2: SPATIAL PRODUCTIVITY 139
FIGURE J.3: MATCHABIUTY 139
FIGURE J.4: DEEP SEA TRANSHIPMENT 140
FIGURE J.5: QUANTITY LIST 141
FIGURE J.6: U S T EXTENSION 143
FIGURE K . l : PORT DEPOT MOVES VERSUS EMPTY DEEP SEA THROUGHPUT 145
FIGURE K . 2 ; PORT DEPOT ARRIVALS I N TIME 146
FIGURE K . 3 : EMPTY DEPOT ARRIVALS AND EMPTY DEEP SEA THROUGHPUT UNTIL 2020 147
FIGURE M . l : ESTIMATES FLOW SIZE PER TRAJECTORY 2020 152
FIGURE M . 2 ; ESTIMATES FLOW SIZE PER TRAJECTORY 2040 152
FIGURE N . I : CONTAINER FLOWS THROUGH THE PORT (SOURCE:
HTTP://INFORMATIE.BINNENVAART.NL/VERVOERGOED.PHP) 154
FIGURE N.2:GEOGRAPHICAL CONCENTRATION 155
FIGURE 0 . 1 : LAY-OUT DEPOTS 159
FIGURE 0 . 2 : EMPTY CONTAINER ROUTES RELATED TO DEPOTS 159
FIGURE 0 . 3 : TRANSPORT PERFORMANCE 2020 162
FIGURE 0 . 4 : TRANSPORT PERFORMANCE 2040 162
6
List of tables
TABLE 1 .1 : OUTGOING CONTAINERS I N THE MAIN PORTS WITHIN THE HLH-RANGE (DATA SOURCES: PORT OF HAMBURG
(2006), PORT AUTHORITY ROTTERDAM ( 2 0 0 6 A ) AND ANTWERP PORT A U T H O R I T Y ( 2 0 0 6 ) ) 10
TABLE 3 . 1 : HUB FUNCTION OF EUROPEAN PORTS. SOURCE: EUROPEAN COMMISSION, 2003 AND EUROPEAN COMMISSION,
2002 25
TABLE 3.2: POSITION OF ROTTERDAM I N HLH-RANGE. SOURCE: PORT OF ROTTERDAM, 2005 25
TABLE 3.3: DESIGN SPACE 30
TABLE 4 . 1 : SHARE OF MERCHANT HAULAGE 36
TABLE 4 .2 : DESTINATIONS OF TRUCKS WITH EMPTY CONTAINERS WITH AN EMPTY DEPOT AS ORIGIN (SOURCE:
ADVIESBUREAU VAN RHOON, 2000) 50
TABLE 4 .3 : FUTURE DEEP SEA THROUGHPUT I N MILLION TEU (SEE APPENDIX D ) 51
TABLE 5 . 1 : ACTIVITIES DURING A CONTAINER CYCLE (SOURCE: R O I , 2002) 60
TABLE 5.2: OPTIONS IN CASE OF SURPLUS OR DEFICIT (ADAPTED FROM LOPEZ, 2003) 61
TABLE 6 . 1 : LONG TERM DEMAND FOR SPACE FOR EMPTY STORAGE AT M V 2 (SOURCE; PORT OF ROTTERDAM, 2005) 70
TABLE 7 . 1 : ADVANTAGES AND DISADVANTAGES REFERENCE DESIGN 80
TABLE 7.2; ADVANTAGES AND DISADVANTAGES 'FAR I N FAR OUT' CONCEPT 81
TABLE 7.3: ADVANTAGES AND DISADVANTAGES TERMINAL BUFFER' CONCEPT 82
TABLE 7.4: ADVANTAGES AND DISADVANTAGES 'MAXIMAL SURFACE' CONCEPT 82
TABLE 7.5: ASSESSMENT FRAMEWORK 83
TABLE 7.6: CAPACITY DISTRIBUTION PER CONCEPT 84
TABLE 7.7 FUTURE DEPOT ARRIVALS I N MILLION TEU 84
TABLE 7.8: TRANSPORT PERFORMANCE PER CONCEPT I N MILLIONTEUKILOMETRES ( INCL. HINTERLAND AREA) 85
TABLE 7.9: TRANSPORT PERFORMANCE PER CONCEPT I N MILLIONTEUKILOMETRES (EXCL. HINTERLAND AREA) 85
TABLE 7.10: POSSIBIUTIES FOR COMBINING TRIPS PER CONCEPT 86
TABLE 7 . 1 1 : FUTURE MODAL SPLIT OF EMPTY CONTAINERS AT DEPOTS (SEE APPENDIX P) 86
TABLE 7.12: OPPORTUNITY COSTS PER CONCEPT 87
TABLE 7.13: SCORECARD 87
TABLE 7.14: ASSESSMENT BY RPA 87
TABLE 7.15: ASSESSMENT BY SHIPPING COMPANIES 88
TABLE 7.16; ASSESSMENT BY SHIPPING COMPANIES 88
TABLE D . l : FUTURE DEEP SEA THROUGHPUT I N MILLION TEU 121
T A B L E D . 2 : HISTORICAL DATA I N TEU (SOURCE: DEKKER (2006)) 123
TABLE D . 3 : RESULTS REGRESSION ANALYSIS 123
TABLE D.4 :EMPTY SEA-LAND AND SEA-SEA TRANSHIPMENTS 123
TABLE E . l ; EMPTY CONTAINER TRAJECTORY DISTRIBUTION 126
TABLE E.2: DEPOT ARRIVALS PER TRAJECTORY I N MILLION TEU I N 2005 127
TABLE L . l : CALIBRATION OF E-VALUE 149
TABLE L.2; DEPOT TERRAIN REQUIRED I N GE-SCENARIO 2020 150
TABLE M . l : FUTURE DEPOT ARRIVALS PER TRAJECTORY I N MILLION TEU 151
TABLE M . 2 : FUTURE RANGE OF DEPOT ARRIVALS PER TRAJECTORY I N MILLIONTEU 152
TABLE O . l : FUTURE DEPOT ARRIVALS PER TRAJECTORY 157
TABLE 0 .2 : FUTURE DEPOT ARRIVALS PER DEPOT PER CONCEPT I N MILLION TEU 158
TABLE 0 .3 : DISTANCES BETWEEN ORIGIN AND DESTINATION VIA DEPOTS I N KILOMETRES 159
TABLE 0 . 4 : TRANSPORT PERFORMANCE PER CONCEPT I N MILLIONTEUKILOMETRES I N 2020 160
TABLE 0 .5 : TRANSPORT PERFORMANCE PER CONCEPT I N MILLIONTEUKILOMETRES I N 2040 161
TABLE 0 .6 : TRANSPORT PERFORMANCE PER CONCEPT I N MILLIONTEUKILOMETRES ( INCL. HINTERLAND AREA) 161
7
L o g i s t i c s o f empty c o n t a i n e r s
TABLE 0 . 7 : DISTANCES BETWEEN ORIGIN AND DESTINATION VIA DEPOTS I N KILOMETRES I N THE PORT AREA 163
TABLE 0 .8 : TRANSPORT PERFORMANCE PER CONCEPT I N MILUONTEUKILOMETRES I N PORT AREA (EXCL. HINTERLAND AREA)
163
TABLE P . l : MODAL SPLIT PER AREA OF ALL CONTAINERS (FULL AND EMPTY) 164
TABLE P.2: FUTURE MODAL SPLIT OF EMPTY CONTAINERS AT DEPOTS 164
TABLE P.3: FUTURE MODAL SPLIT OF EMPTY CONTAINERS AT DEPOTS 165
TABLE P.4: FUTURE MODAL SPLIT OF EMPTY CONTAINERS AT DEPOTS 166
TABLE Q . l : CONTAINER FLOWS THROUGH THE PORT (SOURCE: REAUSE, 2004) 167
8
11 Introduction on empty container logistics
This research will focus on the strategy of the Rotterdam Port Authority for allocating empty depots in the Port of
Rotterdam a long time scale. The strategy will be on a conceptual level and will not contain design specifications on
terrain details (such as quay wall dimensions), but focusses on the size of the total depot terrain at various areas of
the Port of Rotterdam and its general characteristics, which can be determined by the Rotterdam Port Authority.
Therefore the issue of empty container and its economic and social context will be introduced first. Subsequently
several points of interest regarding the spatial planning of empty depots, will be brought up, with the purpose of
formulating the fundamental research objective, which underlies this thesis.
More than fifty years ago a trucker from rural North Carolina ran an experiment that forever altered international trade
and the global economy (ITS library, 2006). The trucker, named Malcom McLean, developed the first metal loading
unit, now better known as the marine container. Based on the current worldwide use of containers for cargo transport,
it can be concluded that the marine container has proved its efficiency.
A marine container (as from here container) is a re-usable packaging for cargo, that is being transported overseas.
Cargo flows vary in time and in space, due to fluctuations in trade. A structural inequity in cargo flows between two
points, where the flow in one direction is exceeding the flow in the opposite direction, is known as an imbalance of
tradelanes. Hence cargo has to be matched with empty containers in a dynamic market. Due to uncertainty, this
process often results in a certain mismatch between containers and cargo, which leaves containers empty at e.g. port
areas.
Carriers cannot afford a large build-up of idle containers, as the 'dead' handling costs and storage costs progressively
cut into their profitability. Moreover the empty containers occupy valuable port space. The question then rises: "What
to do with empty containers?"
The presence of many empty containers in the Rotterdam area Is part of the background for this research. Empty
containers are stored at so called empty depots. Motives for storing an empty container concern the time involved in
making a decision about the need to transport the empty container to a certain region with a cargo surplus and the
time needed for organising the operations involved.
A more specific issue of this research is the storage space, which empty marine containers will use at Maasvlakte 2 at
the Port of Rotterdam (from here the port of
Rotterdam itself, i.e. not the Authority, will be
referred to as PoR) in the future. Maasvlakte 2 is
the new port and industrial zone that is to be built
in the North Sea as part the PoR (see Box 1).
The difficulty within port planning is to allocate
empty depots at Maasvlakte 2. The spatial planning
of empty depots has a strong relation with the
number and type of transport movements with
empty containers. The environmental and
accessibility effects of these movements are of
societal relevance.
Due to the increase in scale, supported by the development of Maasvlakte 2, the flow of containers to and from the
PoR will increase. This, in combination with an imbalance in trade flows, which causes a significant surplus of empty
containers in North-West Europe, increases the number of empty containers handled at the PoR. Although it is likely
that there will be an increase in the demand for depot terrain, the effects of the growing number of empty containers
on the demand for storage and the accompanying transportation movements need thorough investigation,
9
"Rotterdam is creating
European location for port activities and
industries in the North Sea, linking
directly to the current port and
industrial zone. Maasvlakte 2 encompasses
some 1,000 hectares of industrial sites,
immediately adjacent to deep waters.
container transshipment, distribution and
the chemical industry will all find ample
Box 1: Maasvlakte 2. (Source: Maasvlakte 2 Project
Organization, 2006)
Logistics of empty containers
Estimations about future savings illustrate the importance of attention for empty containers. In relation to the zero
alternative, 10% of the transportation costs (representing 15 million euro), and 55% of the valuable space in the PoR
(representing 98 million euro) can theoretically be saved in 2040 (see appendix Q). This is only achievable under
conditions of perfect information and maximal co-operation between parties Involved. In the remainder of this report,
the feasibility of these conditions will emerge.
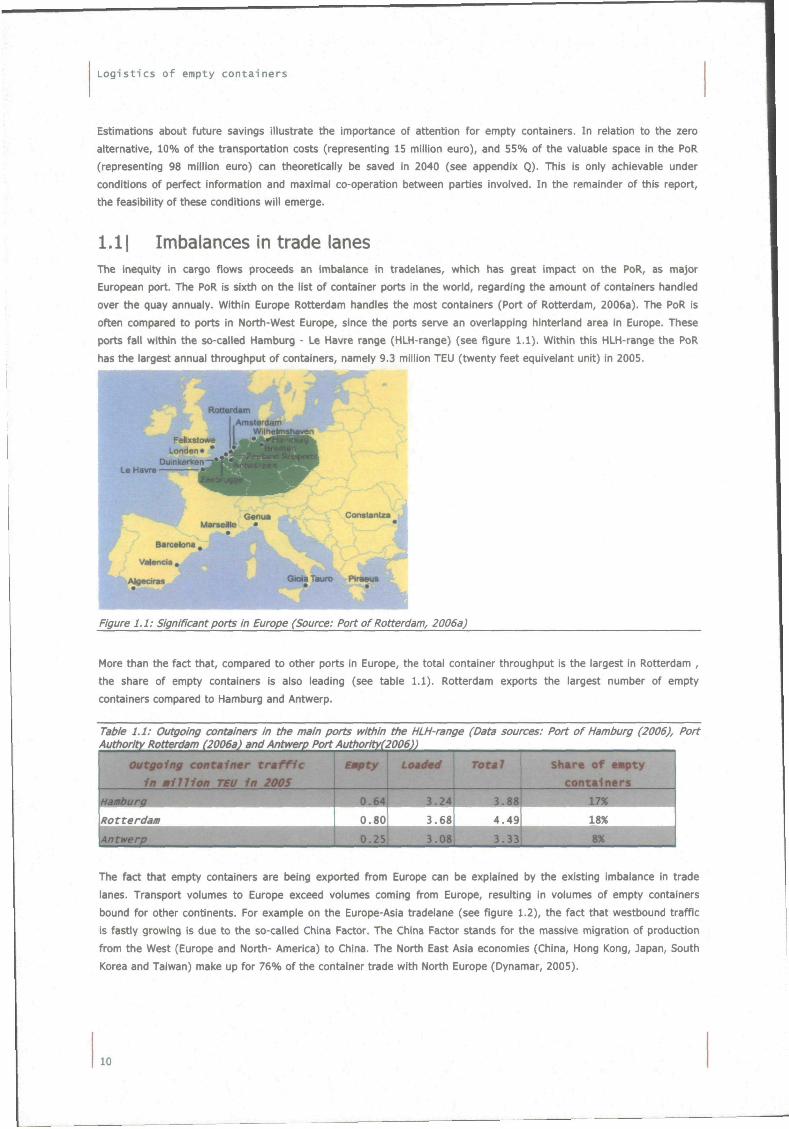
1.11 Imbalances in trade lanes The inequity in cargo flows proceeds an imbalance in tradelanes, which has great impact on the PoR, as major
European port. The PoR is sixth on the list of container ports in the world, regarding the amount of containers handled
over the quay annualy. Within Europe Rotterdam handles the most containers (Port of Rotterdam, 2006a). The PoR Is
often compared to ports in North-West Europe, since the ports serve an overlapping hinterland area in Europe. These
ports fall within the so-called Hamburg - Le Havre range (HLH-range) (see figure 1.1). Within this HLH-range the PoR
has the largest annual throughput of containers, namely 9.3 million TEU (twenty feet equlvelant unit) in 2005.
Figure 1.1: Significant ports in Europe (Source: Port of Rotterdam, 2006a)
More than the fact that, compared to other ports In Europe, the total container throughput is the largest in Rotterdam ,
the share of empty containers is also leading (see table 1.1). Rotterdam exports the largest number of empty
containers compared to Hamburg and Antwerp.
Table 1.1: Outgoing containers in the main ports within the HLH-range (Data sources: Port of Hamburg (2006), Port Authority Rotterdam (2006a) and Antwerp Port Authority(2006))
outgoing container traffic
in million TEU In 2005
^^^^m. ^ ^ H Rotterdam
Aattne^^^^^^^^^^^^^^^^M
emty
imi_ o.so • •
Loaded
nm^ 3.68
HHB
Total
m^gg 4.49
Shmre of eiipty
containers
^ f t 17% ^ H 18X 1
^^^^^^HM The fact that empty containers are being exported from Europe can be explained by the existing imbalance in trade
lanes. Transport volumes to Europe exceed volumes coming from Europe, resulting in volumes of empty containers
bound for other continents. For example on the Europe-Asia tradelane (see figure 1.2), the fact that westbound traffic
is fastly growing is due to the so-called China Factor. The China Factor stands for the massive migration of production
from the West (Europe and North- America) to China. The North East Asia economies (China, Hong Kong, Japan, South
Korea and Taiwan) make up for 76% of the container trade with North Europe (Dynamar, 2005).
10
In t roduct ion on empty container l o g i s t i c s
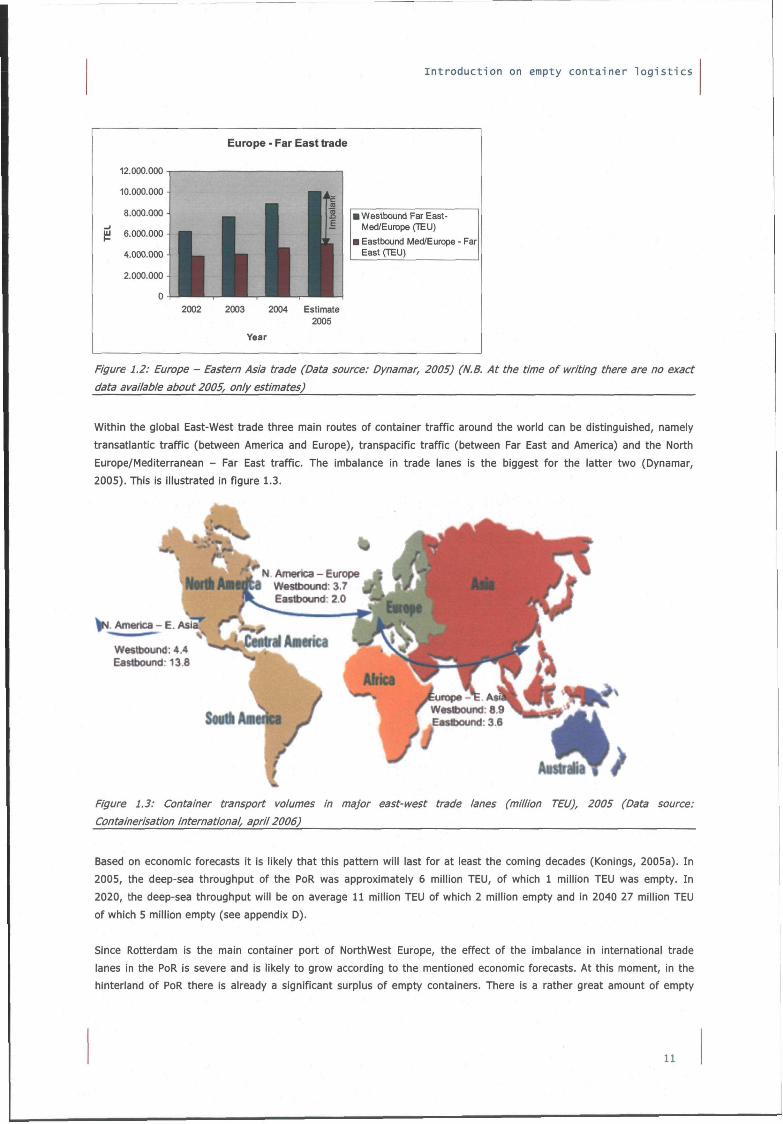
Europe - Far East trade
12.000.000
10.000.000
8.000.000
^ 6.000.000
4.000.000
2.000.000
0
I Westbound Far East-Med/Europe (TEU)
I Eastbound Med/Europe - Far East (TEU)
Year
Figure 1.2: Europe - Eastern Asia trade (Data source: Dynamar, 2005) (N.B. At the time of writing there are no exact
data available about 2005, only estimates)
Within the global East-West trade three main routes of container traffic around the world can be distinguished, namely
transatlantic traffic (between America and Europe), transpacific traffic (between Far East and America) and the North
Europe/Mediterranean - Far East traffic. The imbalance in trade lanes is the biggest for the latter two (Dynamar,
2005). This is illustrated in figure 1.3.
\i. America - E. Asi
Figure 1.3: Container transport volumes in major east-west trade lanes (million TEU), 2005 (Data source:
Containerisation international, april 2006)
Based on economic forecasts it is likely that this pattern will last for at least the coming decades (Konings, 2005a). In
2005, the deep-sea throughput of the PoR was approximately 6 million TEU, of which 1 million TEU was empty. In
2020, the deep-sea throughput will be on average 11 million TEU of which 2 million empty and in 2040 27 million TEU
of which 5 million empty (see appendix D).
Since Rotterdam is the main container port of Northwest Europe, the effect of the imbalance in international trade
lanes in the PoR is severe and is likely to grow according to the mentioned economic forecasts. At this moment, in the
hinterland of PoR there is already a significant surplus of empty containers. There is a rather great amount of empty
11
Logistics of empty containers
containers that leave the PoR. This flow of empty outbound containers is not direclty heading for a deep sea vessel,
but needs storage at the PoR first.
1.21 Container transport and storage The presence of empty containers in Northwest Europe contributes to the hinterland transportation, especially the
displacements between storage facilities and shippers/receivers. In 2002, 75% of the empty container movements in
the Rotterdam area where performed by road, which resulted In 10,608 trips per day with empty containers
(Kijzerwaard, 2003). The total of container movements (empty and full) by road at Maasvlakte (MV) 1 and 2 at the PoR
will be 26,400,000 in the year 2020 (Connekt, 2003).
These hinterland movements cause two negative side effects. The first is that the displacements cause a traffic moves
and thereby negatively influence the accessibility of the PoR. The second is that the distances driven by truck
significantly contribute to the pollution in the area of Rotterdam. Through environmental regulations, imposed by the
Dutch government, there is a maximum in allowable air pollution. Therefore it is in the interest of the PoR Authority to
diminish these effects.
A description of possible routes of containers gives insight in the displacements. When a container arrives at the PoR It
is picked up, mostly by a truck, and transported to the receiver (consignee) to be stripped. In some cases the truck
drives directly to a shipper (consigner) to pick up cargo. This Is not always possible, because the container may need
to be cleaned or repaired. Moreover, in most cases it is not yet known if and where the container has to be stuffed
again. Therefore empty containers are frequently mismatched regarding the demand and supply and moreover in time
and geography, which leads to a need for temporary storage of the empty containers (Dekker e.a., 2005). In general
the truck with empty container is driven back to a depot.
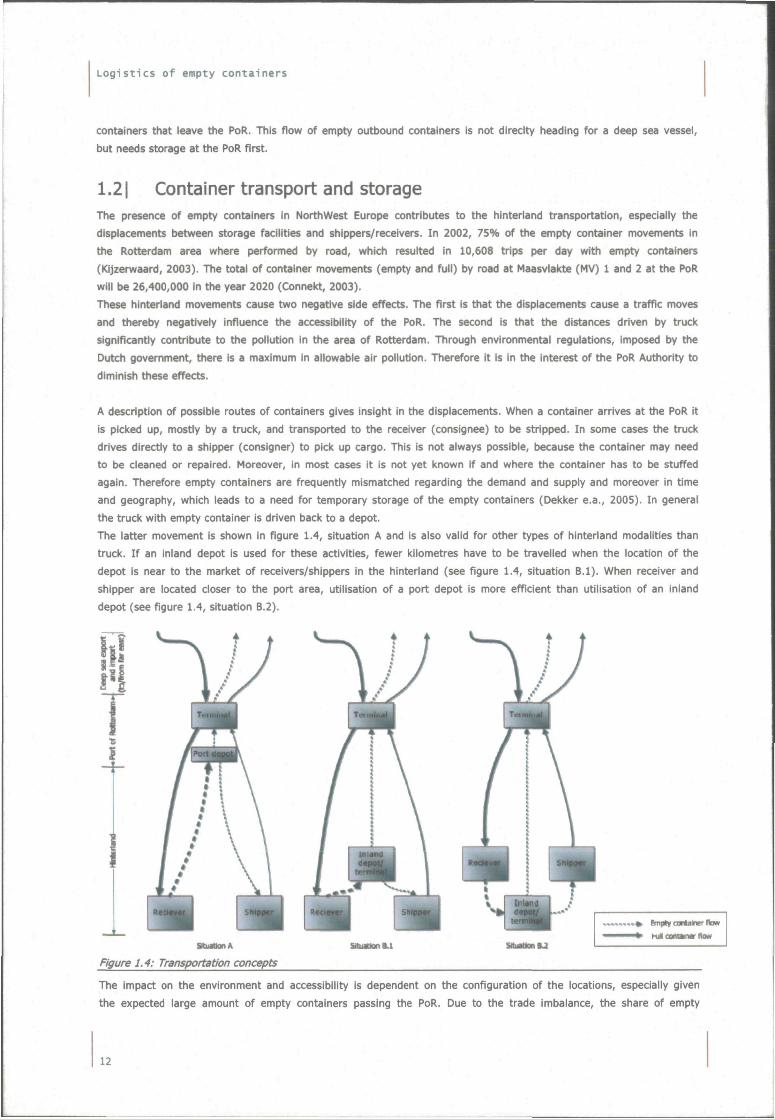
The latter movement is shown in figure 1.4, situation A and is also valid for other types of hinterland modalities than
truck. If an inland depot is used for these activities, fewer kilometres have to be travelled when the location of the
depot is near to the market of receivers/shippers in the hinterland (see figure 1.4, situation B.l). When receiver and
shipper are located closer to the port area, utilisation of a port depot is more efficient than utilisation of an inland
depot (see figure 1.4, situation B.2).
f (
SltuattanA
Figure 1.4: Transportation concepts
Silu«kinB.l SttuMicnU
The impact on the environment and accessibility is dependent on the configuration of the locations, especially given
the expected large amount of empty containers passing the PoR. Due to the trade imbalance, the share of empty
12
introduction on empty container logistics
containers is significant; 18% of the total throughput 803,628 empty outgoing containers in 2005 (Port Authority
Rotterdam, 2006a). This means that more than eight hundred thousend empty containers needed storage at the port.
In fact, there were one million depot arrivals in 2005, including the movements origining from the inefficient
movements.
There are a few exceptions on the above-sketched situations, because figure 1.4 represents the main container flows.
One exception, as already mentioned, is the direct link from receiver to shipper. Not every container, that arrives from
sea at the PoR, leaves the continent via the PoR. Furthermore, it is possible that empty containers are transported
directly from the inland facility to the terminal at the port. Finally, there are a few shippers with their own depot.
Although the use of inland terminals seems very efficient from a transportation point of view and regarding the
potential savings of valuable port space, a substantial amount of containers is being transported according to situation
A. Reasons for this can be derived from factors such as organisational structure, efficient combination of trips,
accessibility, number of depots, spatial spreading of receivers and shippers, differences in activities and price
differences between port depots and inland depots. Further insight in these factors and their importance is needed to
develop an adequate design for depot facilities in the port.
1.31 Allocation of depots in the port Knowledge about the number and size of port depots needed at the PoR is required for a well planned allocation of
empty depots. At the PoR freight is transhipped and often undertakes value adding activities. The port is a collection of
facilities for numerous activities, which makes port planning a creative and interactive process. The terrain of
Maasvlakte 2 is to be divided in lots with various destinations. The Rotterdam Port Authority, as from now on RPA, is in
charge of the planning task of assigning and leasing port lots to operators.
The spatial use of the new port area entails a trade-off between activities. Since margins in depot business are not
very high, the yield of leasing land to depot operators is significantly less attractive for the RPA than profits made by
leasing land to (other) industries. Consequently, industries are competing with depot operators.
Currently empty containers are located at an assortment of relatively small lots. Therefore these locations have not yet
attracted the RPA's principal attention and as a consequence the empty depots have not yet been a main concern in
port planning. With the increasing throughput and imbalance, the future role of empty depots becomes more
important.
The RPA is constrained in her plans by regulations of environmental impact and by the capacity of the hinteriand
network. The objective of the authority is to maximize the profit (see Appendix A), but at the same time to confine
land transport movements. In conclusion, for the RPA there are three aspects of importance in relation to the problem
of allocating empty containers;
o the surface that needs to be destined for storage of empty containers,
o the environmental and accessibility impact of empty containers movements,
o the preservation of the competitive strength.
1.41 Port depot requirements From the previous paragraphs it has become clear that a decreasing utilisation of port depots can have positive societal
effects. The new port area Maasvlakte 2 needs to be arranged with various lots with different functions. On the issue
of the supply and demand for depot facilities at Maasvlakte 2, two actors have a central role.
The RPA has to make a trade off between different services when planning the port. It is attractive to plan the port in
such a way that the revenue is maximal. Within container services, terminal operations bring the highest yield. But as
the RPA is aiming to offer a high quality service, attention needs to be paid to the needs and requirements of depot
clients.
Shipping companies aim to make efficient use of their container fleet. Flexibility in supply of empty containers is
required to offer a high service level to their clients. Shipping companies make a location choice for their empty
13
Logistics of empty containers
containers based on their requirements regarding depot services. The depot services themselves are being excecuted
by the depot operator, which is not a main but a facilitating task. Shipping companies use a forecasting system for the
demand for empty containers by their clients, the containers are repositioned at an interregional level. By creating a
safety stock, the inventory levels can be controlled. Through their empty positioning strategy, shipping companies have
the biggest Influence on the utilisation of empty depots at the port amongst other parties, which are involved In the
supply chain. Indirect clients of the port depots are the transport operators, who aim at efficient use of their vehicle
fleet.
The RPA prefers to use the available space in the port for other port related commercial activities than depots, because
this is more lucrative for the authority. Requirements for port depots are a small part of the total port planning
activities. The logistics of empty containers, requires storage at various places, amongst which port depots. In the
current situation shipping companies prefer to have containers in a buffer located at port depots. Empty containers
need to be within reasonable reach in order to be able to supply exporting companies. An inadequate facility of storage
possibilities could be a threat to the competitive position of the PoR.
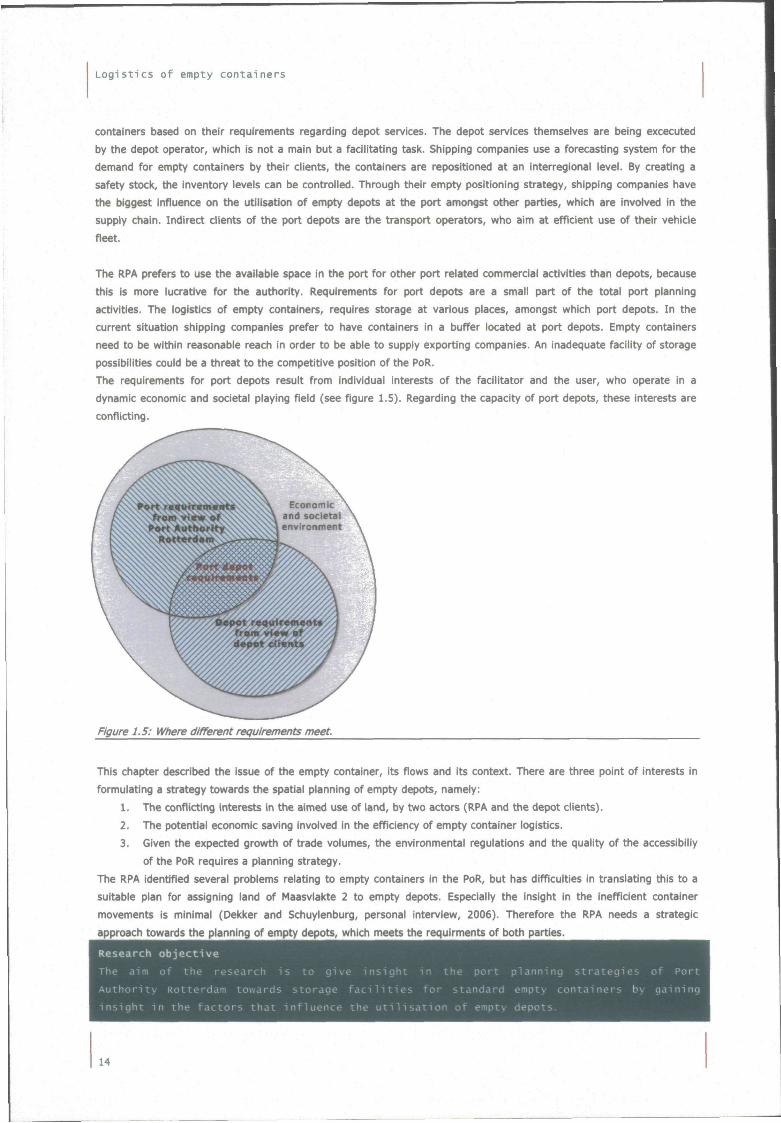
The requirements for port depots result from individual interests of the facilitator and the user, who operate in a
dynamic economic and societal playing field (see figure 1.5). Regarding the capacity of port depots, these interests are
conflicting.
Figure 1.5: Where different requirements meet.
This chapter described the issue of the empty container. Its flows and Its context. There are three point of Interests in
formulating a strategy towards the spatial planning of empty depots, namely:
1. The conflicting interests in the aimed use of land, by two actors (RPA and the depot clients).
2. The potential economic saving involved in the efficiency of empty container logistics.
3. Given the expected growth of trade volumes, the environmental regulations and the quality of the accessibiliy
of the PoR requires a planning strategy.
The RPA identified several problems relating to empty containers in the PoR, but has difficulties in translating this to a
suitable plan for assigning land of Maasvlakte 2 to empty depots. Especially the insight in the inefficient container
movements is minimal (Dekker and Schuylenburg, personal Interview, 2006). Therefore the RPA needs a strategic
approach towards the planning of empty depots, which meets the requirments of both parties.
Research objective
The aim of the research is to give insight in the port planning strategies of Por-:
Authority Rotterdam towards storage facilities for standard empty containers by gaininq Authority Rotterdam towards storage facilities for sta
insight in the factors that influence the utilisation of
14
21 Research frameworic
Justifications for methodological choices will be given in this chapter. First other studies within the field of empty
container logistics will be discussed. Next the scope of this research will be discussed. Followed by the research
questions, methods and a bookmark.
2.11 Literature Several studies have elaborated the logistics of containers. Most studies are concerned with loaded containers because
of their valuable contents.
Empty containers are often perceived as a side product of less importance. For example, De Hengst Bruggeling (1999)
elaborates in the coordination of information between organisations, but demarcates the problem to loaded containers.
But, as clarified in the previous chapter, since their expected increase the logistics of empty containers will involve
more and more costs, a bigger burden on port accessibility and in this case exceed limiting governmental regulations.
Therefore, there is a need to understand and thereby be able to steer logistics of empty containers.
Although literature about empty container logistics exists, their relation with port planning strategies has not yet been
thoroughly investigated. In this respect, the work of Vasiliauskas and Bazaras (2006) forms a good illustration. They do
mention the inefficiency of empty containers transport, but do not discuss its relation to port planning strategies. Their
work analyses the current state of the world container market, describes problems related to empty container trips and
gives an overview of the latest technological developments of the containers in the EU.
In literature there are few studies, which discuss empty container management, by (mathematical) logistic
optimization. Those studies are written from the point of view of shipping companies, since they are the parties who
manage the empty containers.
There are studies concentrating on the decision-making problem of optimal routing and minimal idle time of empty
containers from an algorithmic viewpoint (e.g. Lago (2003), Erera e.a. (2006), Coong e.a. (2002)).
Powell e.a. (2003) introduce the information aspects involved in the decision-making problem. Tioga (2002) continues
this line of thinking by designing an internet-based information system, which has a significant potential to ameliorate
the serious empty container problem Southern California is facing.
Debrito and Konings (2006) discuss other ways to diminish empty container transport and their need for storage by
applying the reverse logistics theory. This theory elaborates on drivers and possibilities for recovery of (empty)
containers.
The effects of the storage and movements of empty containers on the port accessibility have not been investigated
thoroughly before. Connekt (2003), Davies (2006) and van der Rakt (2003) investigated the truck handling for
Maasvlakte 2; these are unimodal approaches where movements to depots and distribution parks are handled as one
category. Notteboom (2004) uses a multimodal approach and focuses on functional roles of ports, but just briefly
brings up the specific empty container problem.
Furthermore there are studies elaborating on the empty container problem in specific regions, especially North
America, where the imbalance in trade lanes is also significant.
The research of Boilé (2006) analyzes the empty marine container accumulation problem, specific to the region of New
York and New Jersey and emphasizes on the complex relationships between players and stakeholders involved.
The situation in the USA differs from Europe, because of the difference in collaboration between parties and the
extensive use of rail (Van Driel, personal interview, 2006). The empty container problem in Europe cannot directly be
compared to the situation in the USA.
15
Logistics of empty containers
The RPA made an estimate of 625 hectare for the surface needed for transfer and storage of empty and full containers
on the Maasvlakte (Maasvlakte 2 Project Organization, 2006). The role of the PoR is to facilitate the logistics of
containers. The total surface needed for transfer and storage consists of different components, namely terminals,
distriparks and empty depots. According to T. Dekker (2006), research expert of the PoR, this is a rough estimate,
especially for part of the storage capacity at empty depots. While making this estimate, little attention was paid to the
functionality of empty depots relating to empty container logistics.
There has not been found a research with a multimodal approach, which elaborates on the effects of available storage
space at ports, and especially the PoR.
Many technical approaches involve merely the sub optimisation of container handling. For example within the field of
mechanical engineering, container logistics comprehends efficient container handling at terminals. A more integral and
a more broad approach are needed to optimise the complete supply chain of containers without displacements of
bottlenecks.
An integral approach is needed in order to balance the supply and demand for empty container storage in a feasible
manner. Therefore attention needs to be paid to the boundary conditions and the objectives of the two main actors at
the PoR. The emphasis will be on the storage of empty containers and their multimodal transport. The logistical system
and the economical and institutional environment will be taken into account, to map the factors affecting accumulation
of empty containers at the PoR. The following paragraph elaborates on this approach.
2.21 Scope Since there are different actors with minor consensus on the problem and because the context is dynamic, the issue
can be characterized as an ill-structured problem. A suitable way to approach this problem to give insight in the
background of the different interests and to use this in search for a feasible solution between the conflicting interests.
So a multiactor approach of the problem is needed. Furthermore a demarcation of the issue is necessary to focus on
the important aspects of the problem.
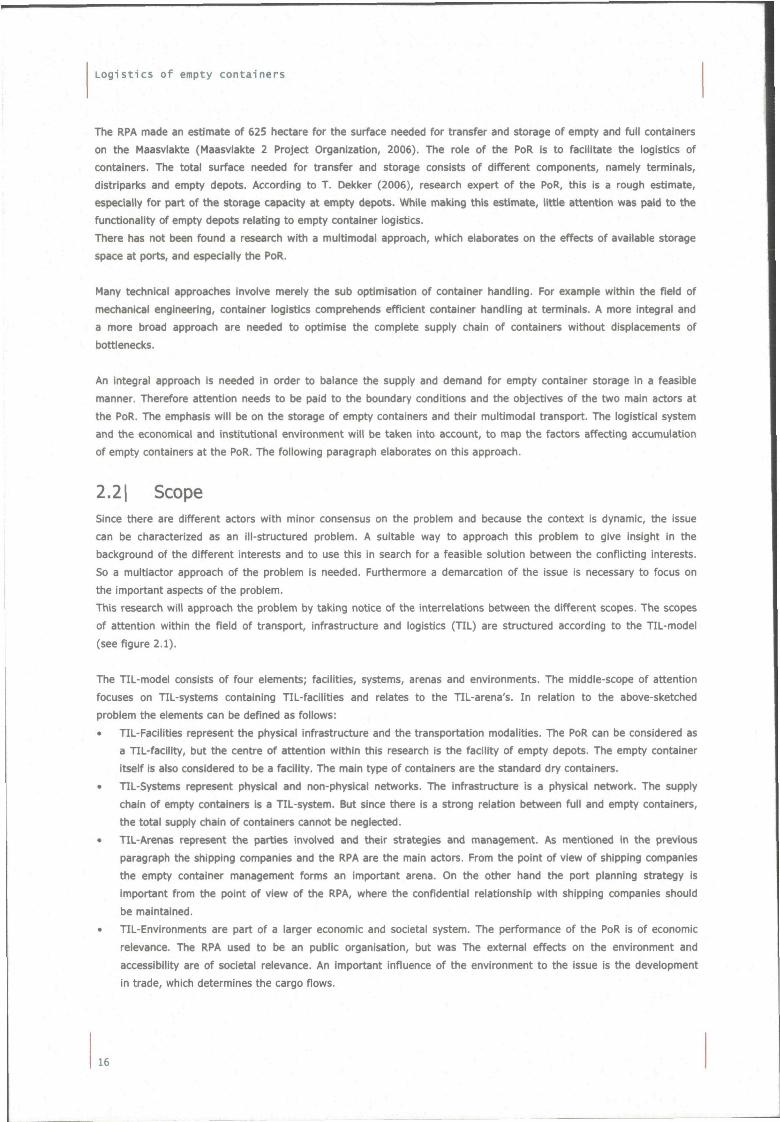
This research will approach the problem by taking notice of the interrelations between the different scopes. The scopes
of attention within the field of transport, infrastructure and logistics (TIL) are structured according to the TIL-model
(see figure 2.1).
The TIL-model consists of four elements; facilities, systems, arenas and environments. The middle-scope of attention
focuses on TIL-systems containing TIL-facilities and relates to the TIL-arena's. In relation to the above-sketched
problem the elements can be defined as follows:
• TIL-Facilities represent the physical infrastructure and the transportation modalities. The PoR can be considered as
a TIL-facillty, but the centre of attention within this research is the facility of empty depots. The empty container
itself is also considered to be a facility. The main type of containers are the standard dry containers.
• TIL-Systems represent physical and non-physical networks. The infrastructure is a physical network. The supply
chain of empty containers is a TIL-system. But since there is a strong relation between full and empty containers,
the total supply chain of containers cannot be neglected.
• TIL-Arenas represent the parties involved and their strategies and management. As mentioned in the previous
paragraph the shipping companies and the RPA are the main actors. From the point of view of shipping companies
the empty container management forms an important arena. On the other hand the port planning strategy is
important from the point of view of the RPA, where the confidential relationship with shipping companies should
be maintained.
• TIL-Environments are part of a larger economic and societal system. The performance of the PoR is of economic
relevance. The RPA used to be an public organisation, but was The external effects on the environment and
accessibility are of societal relevance. An important influence of the environment to the issue is the development
in trade, which determines the cargo flows.
16
Research framework
TIL-Environments Technological developinents
J Economical developments I
Port planning
Empty equipment management
Operators in the supply chain
Terminal
Empty depot*
Inland depots
Hinterland modalities
Supply chain ot empty containers
Supply chain of goods
Inter-smpe relationships
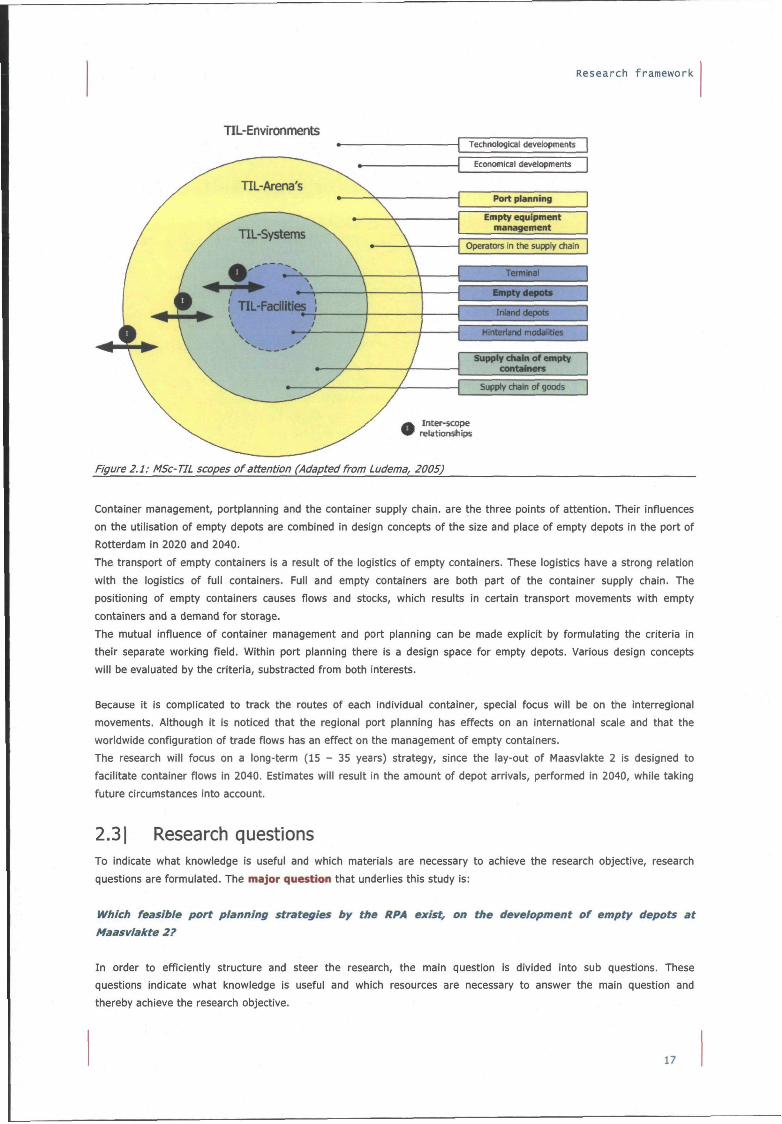
Figure 2.1: MSc-TIL scopes of attention (Adapted from Ludema, 2005)
Container management, portplanning and the container supply chain, are the three points of attention. Their influences
on the utilisation of empty depots are combined in design concepts of the size and place of empty depots in the port of
Rotterdam in 2020 and 2040.
The transport of empty containers is a result of the logistics of empty containers. These logistics have a strong relation
with the logistics of full containers. Full and empty containers are both part of the container supply chain. The
positioning of empty containers causes flows and stocks, which results in certain transport movements with empty
containers and a demand for storage.
The mutual influence of container management and port planning can be made explicit by formulating the criteria In
their separate working field. Within port planning there is a design space for empty depots. Various design concepts
will be evaluated by the criteria, substracted from both interests.
Because it is complicated to track the routes of each individual container, special focus will be on the interregional
movements. Although it is noticed that the regional port planning has effects on an international scale and that the
woridwjde configuration of trade flows has an effect on the management of empty containers.
The research will focus on a long-term (15 - 35 years) strategy, since the lay-out of Maasvlakte 2 is designed to
facilitate container flows in 2040. Estimates will result In the amount of depot arrivals, performed in 2040, while taking
future circumstances into account.
2.31 Research questions To indicate what knowledge is useful and which materials are necessary to achieve the research objective, research
questions are formulated. The major question that underlies this study is:
Which feasible port planning strategies by the RPA exist, on the development of empty depots at
Maasvlakte 2?
In order to efficiently structure and steer the research, the main question is divided into sub questions. These
questions indicate what knowledge is useful and which resources are necessary to answer the main question and
thereby achieve the research objective.
17
Logistics of empty containers
1. Which locations in the region of Rotterdam are appropriate for the storage of empty depots, on a large
timescale?
(What is the position of the RPA regarding the facilities of empty container storage?) (Chapter 3: Port planning)
a. What are the interests and the constraints of the RPA?
b. What is the decision-making ability of the RPA?
(What is the role of empty containers in the container supply chain?) (Chapter 4: Empty container supply chain)
c. What is the function of an empty depot?
d. What is the configuration of the container supply chain?
(What is the position of depot clients towards the storage of empty containers?) (Chapter 5: Empty container
management)
e. Which parties are depot clients?
f. What are the requirements and interests of the depot clients towards empty depots at the PoR?
2. How much empty depot terrain is needed in 2020 and 2040, at the PoR and especially at Maasvlakte 2?
(Chapter 6: Balance between port planning and empty container logistics)
a. Which estimations of depot terrain exist and how valuable are the estimates?
b. What are the causal factors of the utilisation of port depots?
c. What are the developments of these factors in the future?
d. What overall picture does this generate, regarding the future demand for depot terrain in the
Rotterdam region?
3. What are the interaction effects of the different design elements within the decision space? (Chapter 7:
Evaluation of design concepts)
a. Which concepts are representative within the boundaries of the decision-making space?
b. To what extend do those concepts comply with the interests of the users and the facilitator?
c. On which aspects should the Rotterdam Port Authority focus?
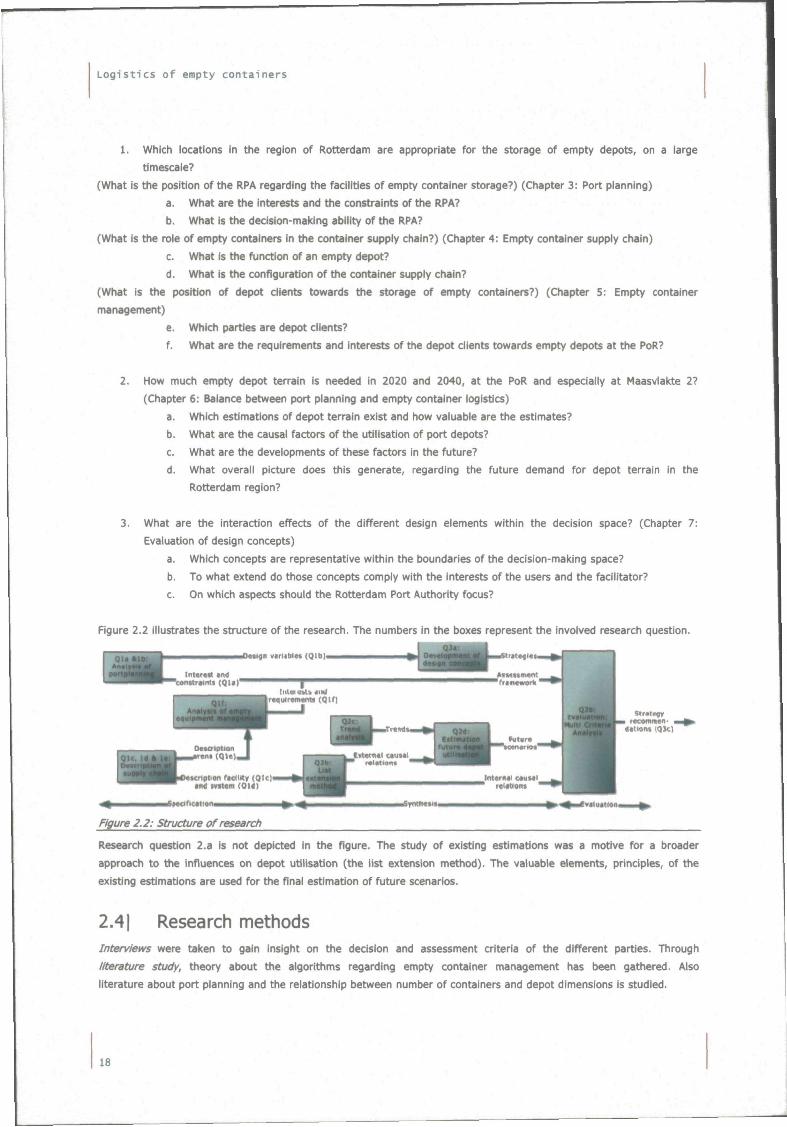
Figure 2.2 illustrates the structure of the research. The numbers in the boxes represent the involved research question.
Figure 2.2: Structure of research
Research question 2.a is not depicted in the figure. The study of existing estimations was a motive for a broader
approach to the influences on depot utilisation (the list extension method). The valuable elements, principles, of the
existing estimations are used for the final estimation of future scenarios.
2.41 Research methods Interviews were taken to gain insight on the decision and assessment criteria of the different parties. Through
literature study, theory about the algorithms regarding empty container management has been gathered. Also
literature about port planning and the relationship between number of containers and depot dimensions is studied.
18
Research framework
Based on the Information about port planning and the interviews different design concepts for the allocation of empty
depots in the PoR were set up, based on a morphological method. Furthermore a Ust extension method is applied to
identify the influencing factors on the utilisation of empty depots. The causal relations are used for identification of the
effects of design variables. Trend analysis is applied for revealing the development of external causal factors. Based on
the future conditions, the future depot arrivals is estimated. The combination of trend analysis and causality in
forecasting is also referred to as causal regression.
A suitable method to gain insight in different strategies is by evaluating different concepts with a multi criteria
analysis. This analysis fits a multi actor approach, since it has the possibility to asses solutions on various criteria from
several actors. A multi criteria decision-making (MCDM) method takes different criteria into account in a scientifically
justified way, while pointing out the final 'best' solution (Germis e.a., 2002). The steps in the process are the
following:
1. Which are reasonable solutions to the problem?
2. Which criteria are of importance on the position of the PoR?
3. Which weights can be assigned to the different criteria/what is the relative importance?
4. How do the different alternatives score on the various criteria?
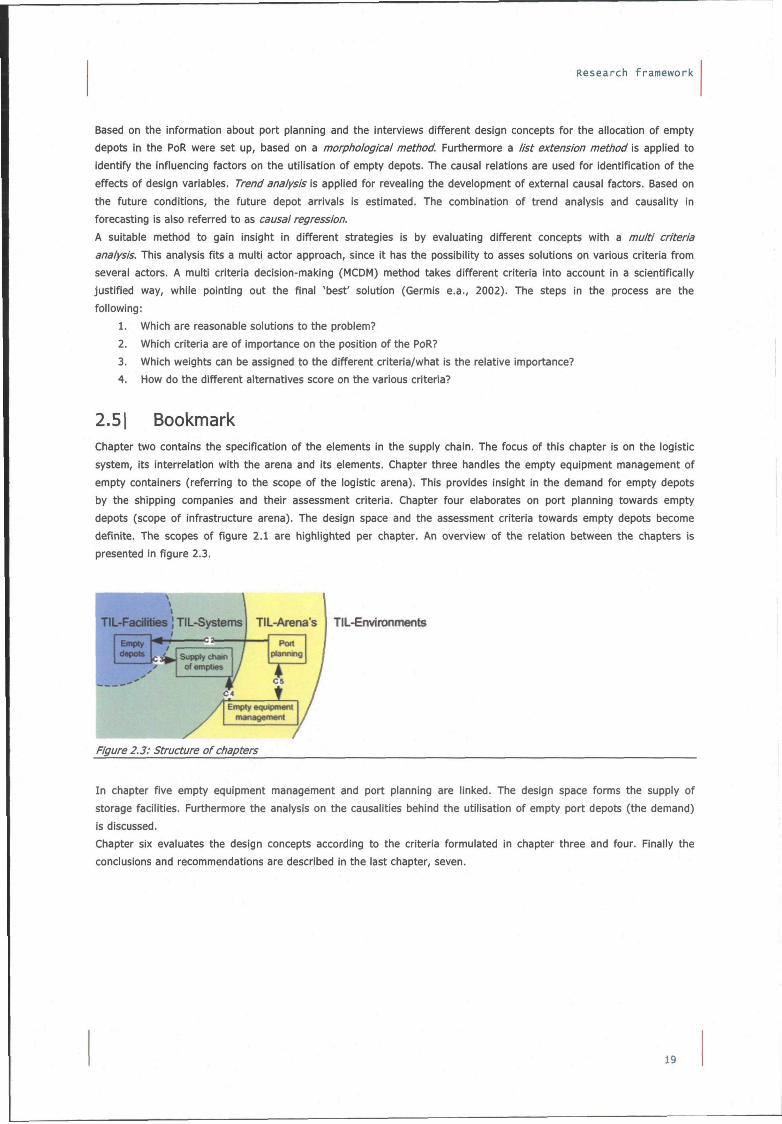
2.51 Bookmark Chapter two contains the specification of the elements in the supply chain. The focus of this chapter is on the logistic
system, its interrelation with the arena and its elements. Chapter three handles the empty equipment management of
empty containers (referring to the scope of the logistic arena). This provides insight in the demand for empty depots
by the shipping companies and their assessment criteria. Chapter four elaborates on port planning towards empty
depots (scope of infrastructure arena). The design space and the assessment criteria towards empty depots become
definite. The scopes of figure 2.1 are highlighted per chapter. An overview of the relation between the chapters is
presented in figure 2.3.
L-Facilities ] TIL-Systenis TIL-Arena's TIL-Environments
Empty depots C 3 ^ Supptychain
ofempiias
Port planning
T cs
t Empty aQulpaMnl
Figure 2.3: Structure of chapters
In chapter five empty equipment management and port planning are linked. The design space forms the supply of
storage facilities. Furthermore the analysis on the causalities behind the utilisation of empty port depots (the demand)
is discussed.
Chapter six evaluates the design concepts according to the criteria formulated in chapter three and four. Finally the conclusions and recommendations are described in the last chapter, seven.
19

Logistics of empty containers
20
31 Port planning and empty depots
The facilities and services provided by a port are services and facilities for ships, administrative formalities, cargo
transfer, services and facilities for cargo (e.g. cargo handling on ship and on quay transport to and from storage,
storage and warehousing) and additional value added services (Alderton, 2005). Storage, value adding services and
transport of empty containers is one part of the wide range of facilities and services provided by a port.
A port is a connection between seaside and landside operations. Besides the primary function of traffic node, other
activities are facilitates by ports, like industrial activities, often in relation to cargo flows or ship repair (Ligteringen).
According to Ligteringen this traffic function requires three conditions to be fulfilled; a good front door (accessibility
from sea), a good backdoor (hinteriand accessibility) and sufficient capacity in the port itself. Planning a port is a
creative and interactive process, since a lot of different facilities should be taken into account.
The RPA has an active role in the supply of depot terrain. The RPA has the objective to maximize the profit, but at the
same time to confine land transport movements. Minimum transport movements through the port are beneficial for
environment and accessibility.
Translating that objective to the allocation of the new port area results in a trade off between supporting activities
(like storage of empty containers, distriparks and partly terminal operations).
The incomes of the RPA consist of harbour dues and lease revenues. Lots with a quayside are very valuable for the RPA
since it also generates to harbour dues. Harbour dues are charged for the use by sea going vessels of the Rotterdam
harbours. For other land areas there is a trade off between activities other than terminal operations. In this way
industry is competing with depot operators. The relatively low margins in the depot business form a motive for the RPA
to reduce the surface of land dedicated to depot services.
The yield of leasing land to depot operators is significantly less attractive for the RPA than of leasing land to (other)
industries. Since empty containers are located at an assortment of relatively small lots, the empty depots do not have
right of way in the current port planning.
The modal split is important for the environmental effects of transport movements. The current modal split of empty
containers is approximately 55% via road, 10% via rail and 35% via barge. A substantial shift towards rail transport is
not to be expected, since rail is not enough flexible and because it is not feasible to realize sufficient rail connection
for the empty depots. A modal shift of empty container transport towards barge is inclined. The role of the RPA Is to
encourage the modal shift by supplying infrastructural necessities.
Not just the kilometres travelled with empty containers contribute to traffic flows, the kilometres travelled without any
container are also important. An efficient system ensures a high degree of utilisation. The better the possibility to
make combinations between trips, the better the utilisation of transport means and the less the chance of trips without
containers. Besides the yield of leasing land lots, transport performance and the modal split within the port area, the
combination of trips also forms a criterion. A depot, which is only accessible by truck, creates more than a million truck
movements per year (Dekker and Schuylenburg., personal interview 2006).
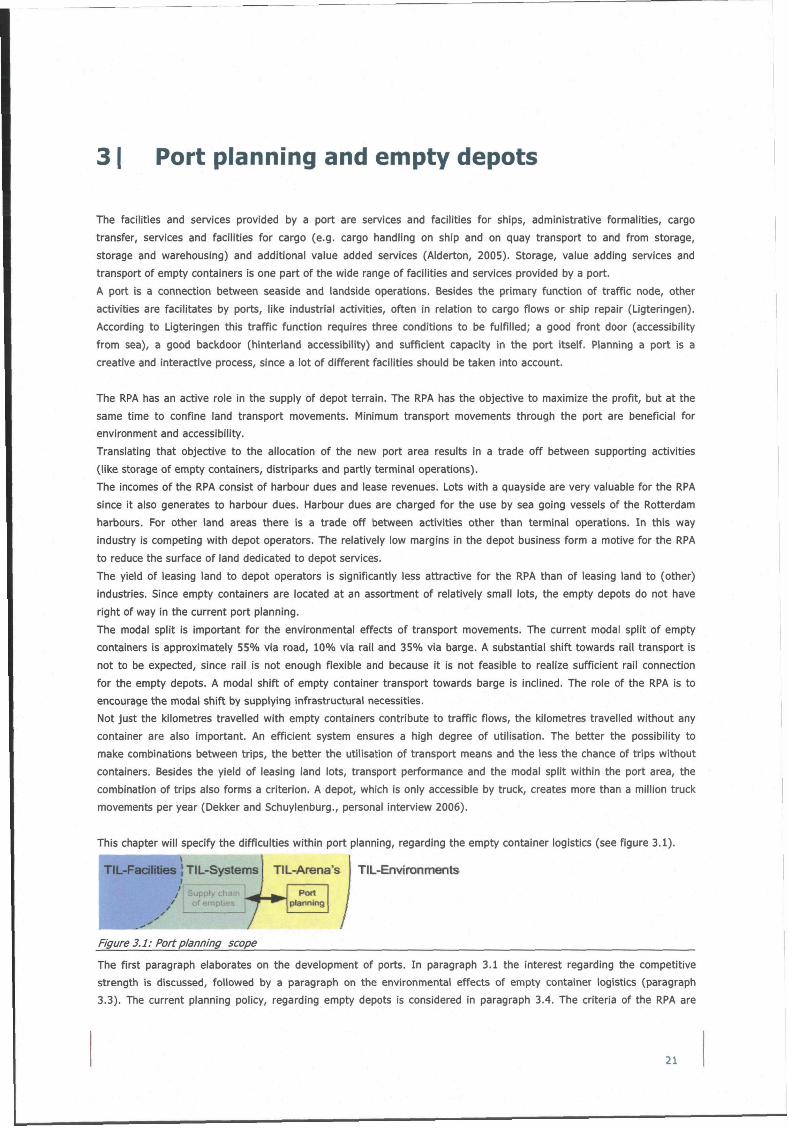
This chapter will specify the difficulties within port planning, regarding the empty container logistics (see figure 3.1).
TIL-Environnnents TIL-Fadlities | TIL-Systems
/ i i jpp iy t.tiLiin ^^^J / of empties ^ ^ T "
• ,.' ' /
TIL-Arena's
Port planning
/
Figure 3.1: Port planning scope
The first paragraph elaborates on the development of ports. In paragraph 3.1 the interest regarding the competitive
strength is discussed, followed by a paragraph on the environmental effects of empty container logistics (paragraph
3.3). The current planning policy, regarding empty depots is considered in paragraph 3.4. The criteria of the RPA are
21
Logistics of empty containers
formulated in paragraph 3.5. Next the possible design variables of the allocation of empty depots are presented in
paragraph 3.6. The chapter is concluded with a summarizing paragraph.
3.11 Port development Notteboom (2004) explains that there is a stage in port development, which he names port regionalisation. Port
regionalisation represents a stage in port development where efficiency is derived with higher levels of integration with
inland freight distribution systems. Containerisation, intermodallty and ICT enhance the spatial and functional
reconfiguration among iogistics nodes. The PoR is developing from port city to port network.
The new function of port terminals requires the elaboration of inland terminals to accommodate new port-Inland
linkages. The immense pressure on the collection and distribution networks, demands and promotes the development
of inland terminals. The implementation of the concept has affected trade flows, the routings between ports and
hinteriands and some traditional port functions.
In the regionalization phase iogistics chains have become the relevant scope of port competition. The success of a port
will depend on its capability to fit into the networks. The port community has to fully benefit from synergies with other
transport nodes and other players within the networks of which they are part.
In the tradition of the landlord port, it is presumed that port authorities should act as 'facilitators' in transport chains.
In general four types of port management can be distinguished; the privately owned and operated port, the landlord
fiort (publicly owned land, privately operated port services), the tool port (publicly owned land and port tools, privately
operated labour) and the service port (all services provided by public bodies) (Ecorys, 2005). The PoR is a landlord
port. This means that the RPA is responsible for the land subject, administration, development and maintenance of the
infrastructure. The RPA used to be a public institution, but transferred into private ownership in 2004. The land subject
concerns the assessment and contracting of terminals and in a later stage other operators, like depot operators (see
box 2).
six proposals for Maasvlakte 2
30 June 2006
te rminal
This week, the Port of Rotterdam Authority received six proposals from
companies and consortiums for a container terminal on Maasvlakte 2~. This 138
ha terminal, which will be the first to become operational on Maasvlakte 2. is
to be allocated via a so-called Open Assessment procedure. Separately from
this, the Port Authority last week concluded a contract with A P M Terminals for
the right to operate another terminal on Maasvlakte 2. These two ter
be opposite each other.
The large number of proposals confirms the great interest in Maasvlakte 2 as a
business location. The Port of Rotterdam Authority is now analysing the
proposals and, in this connection, will consult with the parties. They must
submit a final proposal at the end of September, after which negotiations will
be held with a selection of companies or consortiums. The Port Aut!
expects to sign a contract with the winner by mid 2007.
Next week, the Port Authority is expecting the tenders from the two contractor
consortiums for Maasvlakte 2. Any special requirements or wishes cont rvactor_s
and terminal operators might have can then be taken into account in the EIR and
pe rmi t procedu res.
•For the sake of completeness: Fourteen companies applied last year for this
Open Assessment Procedure. A number of them have formed consortiums in the
meantime. One of the six proposals made this week was from A P M Terminals. It
has been agreed that A P M Terminals will withdraw from this open Assessment
Procedure, but not until the terms and conditions referred to in the contract
(such as 'board approval') have been met.
BOX 2 Terminal proposals
22
Port planning and empty depots
The assessment procedure is open for every party. The plot and the dimensions of the terminal terrain are known.
Nevertheless the RPA formulated requirements regarding throughput volumes and environmental aspects (a.o. modal
split). An individual terminal operator has difficulties with the guarantee of throughput volumes, since they have
limited influence on container trade flows (van Dijk, personal interview, 2006). The used assessment procedures
stimulates the vertical integration of the supply chain.
The depot operators have little impact on the location of empty depots at MV2 (Schepen, personal interview, 2006).The
RPA and the shipping companies have the largest influences.
The growth of container volumes proceeding in stages and the relation between container terminals and depots makes
the planning process complicated. At the start, when a new terminal is operational, there is an overcapacity. The
available terminal space is then used for storage of empty containers (Borsodi, personal interview, 2006). Terminal
operators offer other depot services, e.g. they allow empty containers with a large dwell time. Therefore the empty
depots are little active in the beginning phase of a terminal. This way the terminal operator fully exploits its terrain and
maximizes its profit. The depot operator is in that matter the underdog; his turnover depends on the terminal actions.
When terminal capacity is getting tight, the empty containers are the first to leave the terminal and to be moved to an
empty depot. This expansion of demand for depot terrain makes the port planning process complex. An increasing
demand for depot terrain is expected, but it is not practical to put terrain aside for the future demand and not to
exploit it in the meanwhile.
In recent times depot terrain was subleased by a terminal operator (ECT) to a depot operator (van Doorn). Meanwhile
the terminal was operating near capacity. ECT needed the depot terrain for terminal operations. As a consequence the
sublease contract with van Doorn was not extended. Therefore van Doorn had to move to another location, further
away from the terminal. This led to resistance amongst the shipping companies. The RPA needed to put a lot of effort
in arranging a piece of land closer to the terminal, in order to keep their clients satisfied.
A seemingly simple way to prevent such situations from occurring is to put enough terrain of the new port area aside
for empty depot activities from the start. Depot operators are not able to exploit a depot from the start, since there
will be little demand and at the same time the rent needs to be paid. Potential loss of profit by the RPA, due to the
inactivity of depots in the starting phase of a new terminal, can be evaded by temporary leasing of land for other
activiWes. Then the land needs to be leased to depot operators in proceeding stages. Nevertheless it will be difficult to
find temporal destination for port activities.
If a terminal subleases the land to depot operators the price of land dilutes (Dekker and Schuylenburg., personal
interview 2006). Sometimes the prices of sublease are significantly higher than the direct lease prices of depot terrain,
which is justified by extra efforts put into the land by the sublessor. Regarding the physical use of the terrain there is
no difference, but the RPA is hereby restricted in the possibility to generate income from port tariffs. It would be a
possibility to prohibit depot activities at terminals. But this option is difficult to monitor and diminishes the advantage
of geographical concentration.
3.21 Competitive strength According to the RPA (2005) the ports within the HLH range are fairly competiting with each other, regarding the served hinteriand and especially concerning the transhipment of containers. The hinteriand is defined as the area to be
reached from the port to transport goods for import and export (Kruk, 2006). Because there is a competition for cargo
from and to the same hinterland, the efficiency of cargo handling and costs for pilotage, harbour dues, etc. become
important. The RPA is also aware of the possibility that the storage and handling of empty containers will move to
other ports, like Antwerp. In that way the RPA lets container flows pass.
23
Logistics of empty containers
As mentioned in the first chapter the main competitors of the PoR are the ports within the HLH-range. Especially
Antwerp and Hamburg are rivals since they are the ports with the largest market share. In direct competition between
ports to attract certain trade and cargo volumes, the following competitive factors are important (Ligteringen, 2000):
o availability of land for terminals and the related costs per m2
o port tariffs and dues.
o quality of the port and or existing stevedores (efficiency, reliability, flexibility, handling and costs)
o quality of the hinterland connections
o environmental requirements
o customs regime.
The terminal activities have a relation with the depot facilities since the containers are handled and/or stored at the
terminal. Within further analysis the available capacity on terminals is taken into account, since that capacity is
sometimes used for the storage of empty containers. The speed of the container handling at the terminal is of great
importance to shipping companies (especially when large vessel sizes are used) but it has a small influence on the
empty depots. The design concepts will be evaluated on the functioning of the system in the future. Terminal capacity
will be maximally used.
According to Welters (2000) the PoR has a strong structure (location, infrastructure and hinterland connections), but a
weak process aspect (regulations, productivity and flexibility) and a weak integration of the supply chain by ICT.
In order to maintain the competitive strength of the PoR, the competitors of the PoR are briefly reviewed below.
Rotterdam has a good connection with the hinterland by barge relative to Hamburg. Therefore Hapag Lloyd prefers the
PoR above the port of Hamburg to import empty containers to Germany (Tabbers, personal interview, 2006). The ports
of Bremen and Hamburg have good rail connections (Sprengers, personal interview, 2006). The competition of the PoR
with Hamburg and Bremen is mainly based on hinteriand transport (costs and connections) (Welters, 2000).
Also compared to the port of Amsterdam and Antwerp, PoR has good hinteriand connections (van Dijk, personal
interview, 2006 and Overgaauw, personal interview, 2006). The ports of Amsterdam and Antwerp both handle
containers faster than PoR (Van Driel, personal interview, 2006). This is also confirmed by Welters (2000), who states
that the competition with Antwerp is mainly based on port performance and port dues.
The port of Amsterdam has very limited hinterland connections for rail and barge (Van Driel, personal interview, 2006).
The lock at Amsterdam limits the draught, and thereby the accessibility for sea vessels (Van Driel, personal interview,
2006).
Van Dijk (marketing manager at ECT) states that Antwerp is a close competitor, since a lot of containers with a bill of
lading for Antwerp are transhipped to barges and then transported to Antwerp. Furthermore there are a lot of
containers transported from Antwerp to Rotterdam by feeder services because of agreements between operators. While
those could be picked up directly from Antwerp just as well (Hulsk, personal interview, 2006). Sprengers (equipment
manager Europe, APL) states that the ports of Rotterdam and Antwerp are often perceived as one port. There is a lot
of repositioning of empty containers between Antwerp and Rotterdam. Generally Antwerp is deficit area for empty
containers.
These phenomena illustrate that the PoR and the port of Antwerp are strongly related, especially for empty containers.
Apart from that, the tariffs at PoR for storage are lower than in Antwerp, which makes the PoR more attractive (van
Dijk, personal interview, 2006). Another disadvantage of Antwerp related to PoR is that the barges are only handled by
day and not by night. Furthermore the locks at Antwerp only open for sea vessels, which forces barges to wait for
sometimes four hours (Hulsk, personal interview, 2006). The Port of Antwerp is limited by the draught of the waterway
and the manoeuvring is difficult (Van Driel, personal interview, 2006). The tides occurring at Antwerp limits the
draught (Sprengers, personal interview, 2006). Furthermore there are no depots in Antwerp with a water connection
(Tabbers, personal interview, 2006).
The main disadvantage of PoR related to the port of Antwerp is that customs regimes are stricter in Rotterdam than in
Antwerp (Hulsk, personal interview, 2006) and that labour is more flexible in Antwerp. Therefore it is advantageous to
24
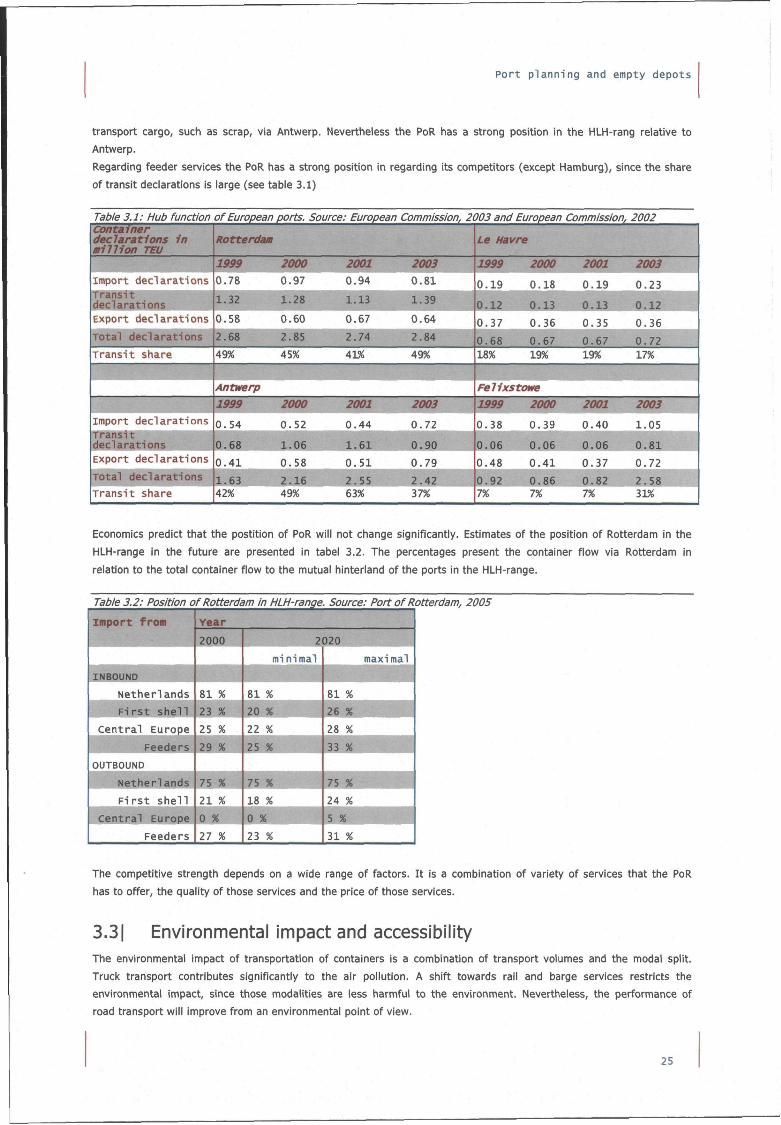
Port planning and empty depots
transport cargo, such as scrap, via Antwerp. Nevertheless the PoR has a strong position in the HLH-rang relative to
Antwerp.
Regarding feeder services the PoR has a strong position in regarding its competitors (except Hamburg), since the share
of transit declarations is large (see table 3.1)
Table 3.1: Hub function of European ports. Source: European container declarations in mm ion TEU
import declarations
nransTt ~ declarations Export dec la ra t ions
Total declarations
Trans i t share
import declarations
declarations Export dec la ra t ions
Total declarations
Trans i t share
Commission, 2003 and
Rotterdam
i ^ g _ 0.78
1.32
0.58
2.68
49%
0.97
1.28
0.60
2.85
45%
0.94
1.13
0.67
2.74
41%
0.81
1 . 3 1 ^
0.64
European Commission, 2002
Le Havre
2ss^^ 0.19
0.37 2.84 ^ 5 ^ ^ 49% 18%
^JOU^ 0.18
0.36
0.67 19%
2001
0.19 UB 0.35
QT^ 19%
2003
0.23
" 4 0.36
^ ^ ^ ^ 17% " l
Antwerp
1999
0.54
0.68
0 . 4 1
1.63, 42%
2000
0.52
1.06
0.58
7 I R
49X
2001
0.44
1 .61
0 . 5 1
„ 2.55 63%
2003
0.72
0.90
0.79
2.42 37%
Felixstowe
1999
0.38
0.06
0.48
0.92 7%
0.39
0.06
0 .41
0.86 7%
^m 0.40
0.06
0.37
0.82 7%
200i
1.05
0 . 8 1
0.72
2 ^ ^ ^ ^ ! 31% 1
Economics predict that the postition of PoR will not change significantly. Estimates of the position of Rotterdam in the
HLH-range in the future are presented in tabel 3.2. The percentages present the container flow via Rotterdam in
relation to the total container flow to the mutual hinteriand of the ports in the HLH-range.
Table 3.2: Position of Rotterdam in HLH-range. Source: Port of Rotterdam, 2005
The competitive strength depends on a wide range of factors. It is a combination of variety of services that the PoR
has to offer, the quality of those services and the price of those services.
3.31 Environmental impact and accessibility The environmental impact of transportation of containers is a combination of transport volumes and the modal split.
Truck transport contributes significantly to the air pollution. A shift towards rail and barge services restricts the
environmental impact, since those modalities are less harmful to the environment. Nevertheless, the performance of
road transport will improve from an environmental point of view.
25
Logistics of empty containers
Ports have a limited capacity, regarding transhipment volumes and road capacity. Furthermore there is a maximum
capacity related to the air quality. In theory, pollution of the air could reach its maximum even before the maximum of
to hinteriand capacities is reached. Regarding a fair competition it is important for the PoR that the same regulations
hold for other ports in Europe.
The possibilities for a shift towards other modalities than truck are obstructed by three factors.
The first factor is that the limited value of rail transport for empty container transport. Rail transport is restricted in its
flexibility. Inertia forms the second factor. Freight forwarders will not easily change their mode of transport (van Wee
e.a., 2002).
The third factor is related to the institutional arrangements of parties involved. Through contractual relationships of
deep sea ocean carriers and/or forwarding agents with trucking companies and rail operators, the barge operators have
less guarantee for transport volumes. According to Dierickx, commercial representative of Neska, which operates
several barge terminals on the River Rhine, there is not an equal competition between the different hinterland modes
(Foxcroft, 2006b).
The current modal split of containers moving between the PoR to the hinteriand is 60% road, 10% rail and 30% barge.
The modal split for empties is less for road, since they are more frequentiy moved with rail and barge (Dekker e.a.,
2006).
Approximately 30% of the movements at an empty depot with water connection are done by barge (Borsodi, 2006).
The difference in type of haulage also affects the modal split. As Overgaauw (Inland Equipment Manager Central
Europe, personal interview, 2006) states the merchant haulage of Maersk is performed with 60% truck, 10% per rail
and 30% barge, for carrier haulage 30% truck, 40% rail, 30% truck in 2005. It should be taken into account that
Maersk has a special position in modal split figures, since they own the European Railway Shuttie. The modal split of
empty containers was 66% truck, 9% rail and 25% barge in 2005. This verifies the statement before, that rail is not
often used for the transport of empty containers.
But is does not positively verifies the statement of Dekker that empties are transported less with truck than full
containers. Nevertheless Hapag Lloyd positions Its containers for 45% by barge, while empty containers are
transported for 95% by barge (Tabbers, personal interview, 2006). Hapag-Lloyd only uses rail for empty container
transport to Swiss.
Accessibility from the landside of the port can be categorized according to the different modalities available;
accessibility on the road network, waterways and railways. There are different geographical levels at which those
movements take place; from intraport transport to hinteriand related transport. It is assumed that there will not be
made changes on hinteriand transportation infrastructures. Therefore accessibility is mainly influenced by the intensity
on the different networks.
The road network has the highest utilisation grade. And a growth in container volumes could form a threat to the
accessibility by road.
Railways have enough capacity left for an increase in intensity. Waterways are known to have an infinite capacity. At
least in the links of the network. Different opinions exist on the capacity of nodes in inland waterway networks.
It can be concluded that the intensity on road and rail network links and the intensity at waterway network nodes are
relevant indicators for the accessibility.
The environmental aspect is a wide notion, and concerns safety, noise pollution, soil quality, water quality and air
quality. The stacking of empty containers can cause quite some clamour. But this is not relevant because Maasvlakte 2
is not situated in a living environment. Nevertheless at the Waal-/Eemhaven the nuisance and visual amenity are
present.
Since transportation of empty containers has the most impact on the air quality this is the major indicator for the
environmental impact. The effects on air quality can be approached by determining the number of movements (empty
26
Port planning and empty depots
and without container), the length of those movements and the modal split. The number and the length of empty
container transportation can be formulated in a transport performance in empty container kilometres.
Although the effects of freight transport on the environment can strongly differ per tonkilometer, the transport
performance is an environmental impact indicator that is more useful than the total transported mass (van Wee e.a.,
2002).
3.4| Planning policy The current policy is based on an increase of the use of inland depots. The policy particularly affects the empty depots
on Waal-/Eemhaven, that intentionally could disappear. The following line of thought underlies this policy.
The increasing use of inland depots reduces the necessity to use the Rotterdam port depots. Especially these inland
depots constitute an alternative for the depots in area Waal-/Eemhaven. The growing extension of cargo in the
hinterland and an improved planning of the empty streams contribute to the decrease of the support area from Waal-
/Eemhaven. First the top 20 of shipping companies, possibly in cooperation, can generate sufficient volume to use
more and more inland depots. Indeed, on the long-term still 80% of the number of shipping in the Waal-/Eemhaven
depots (rough estimation; 20-80 ratio), but this concerns only the left 20% of the number of containers. So the use of
the Waal-/Eemhaven depots will decrease.
This is brought into practice by rejecting new requests for the Waal-/Eemhaven area and by no longer extending
existing contracts, unless the depots have a water connection. In the future there will be less depots in that area, but
all with water connection and thus stimulating the modal shift (Borsodi, personal interview, 2006).
When space is scarce and demand equals or even increases, the market mechanism will instigate clients searching
depots with left capacity, so called 'filling holes'. When that is no more possible, prices will raise. Containers that ought
to be handled not necessarily in the area, will thus be pushed out of the depots, because the containers cannot carry
the depot cost.In this respect lease containers are concerned first.
Other containers possibly being pushed from the depots are delivery containers that stay a long time and/or are
destined for loading more distantly in the European hinteriand. These containers are shifted to inland depots. Also the
empty containers representing the imbalance in the European trade will less use the Waal Eemhaven depots. On the
one hand by faster transport of empties to the terminal, on the other hand by intermodal transport empties from the
hinteriand (depot) directly to the terminal. Containers always being present are related to the delivery function of the
Waal Eemhaven depots on behalf of the Groot-Rijnmond region.
According to Dekker (2005) the intention is that empty depots exclusively accomplish a regional task and a terminal
task. Herewith supraregional and supranational tasks are being left out. Dekker states that there is no reason to accept
that loaded containers will avoid the port and that the transhipment decreases. But Borsodi (2006) points out that they
have no idea what could happen. According to Dekker the advantages are clear:
More wholesome empty depot sector, for resting containers pay a higher charge
Less traffic movements in the neighbour of empty depots
Higher productivity of depots, because long staying ones have been crowded out of the depots.
The possibility of crowding out empty containers, destined for loading in the distant European hinteriand and the
empty containers with large dwell time (such as lease containers) will be discussed later in this report. The option of
inland terminal as an alternative for port depots will be discussed.
Dekker (2005) states that empty depots will always be necessary in the PoR, since they are essential for serving the
empty container market in the slipstream of full containers transport. Concerning depot space on the Maasvlakte the
RPA ought to promote a limited amount of depots indeed optimally positioned and focussed on repositioning of
empties. These depots will have to get a certain capacity, which makes it suitable for business economical operation; a
careful estimate is a surface of 10-15 ha. Nevertheless the estimate has changed to 69 ha for Maasvlakte 2 (in
masterplan 3.3.1). This indicates the uncertainty regarding the quantitative need for empty depots. There is more
demand for the Waal-/Eemhaven area than for the Maasvlakte. Dekker translates this trend, that there is less demand
for depots related to the terminal, in the nearness of container throughput. Therefore the prognoses for empty depot
terrain at the Maasvlakte are kept low.
27
Logistics of empty containers
Regarding the location of empty depots at the Maasvlakte, a depot behind or next to the terminal is advantageous
since the possibility of different modalities (especially barge), stimulates a positive modal split.
On the estimation of surface will be elaborated in appendix H.
Since it is indicated that a significant volume of empty containers is making an inefficient movement, the RPA is
convinced that the supply of depots is bigger than the demand, in the current situation. The fact that request for depot
terrain are still being handed in, is an indication that there is a shortage in empty depot terrain (Dekker, 2005). But by
granting every request there is no incentive for efficiency improvement by depot operators and shipping companies. In
other words there are containers stored at the PoR that should not necessarily be stored there. Although it might be
preferred to be stored there it is not necessary.
Regarding the balance between the demand and the supply, an analogy with the problem of congestion on highways
explains the effect of generation of demand by Increasing capacity. Constructing an extra lane to a highway reduces
congestion only for a short period of time. After a while the roads are jammed again. The supply of depot terrain
triggers the demand and therefore the empty depots are never literally empty. This phenomenon is also known as the
law of Say. The necessity of storage at port depots will be clarified in chapter 5.
The revenue adapted from a reduction in space used for depot activities can be illustrated by opportunity costs.
When the amount of depot terrain, in the nearness of the terminal, is reduced more space is available for terminals to
operate their activities. The limited amount of space at the Maasvlakte 2 and the request of empty depots to be located
near the terminal causes a competition between terminal and depot (Dekker, 2005). At some point there will be a
maximum in terminal growth, since there is a limited quay wall and a limited terminal productivity. In that case it is
interesting to exploit other activities. These activities are likely to be container related, since the location is near a
container terminal. This leaves distriparks as the most obvious option. Within distriparks there is a slightiy higher
margin. Of course there is a maximum here as well.
The most common one is distribution activities. The leasing of space to distribution park operators will result in a
higher yield than empty depots since the margins within distribution activities is higher than that of empty depot
activities. Space somewhere else in the port, can be used for all another port activities which are not directly related to
a water connection, likely industries.
From a commercial viewpoint it is important for the RPA to realise as much yield from different slots as possible. This
criterion can be measured by comparing yield from empty depot terrain with those of other activities. The yield from
other activities is not only dependent on the price of the terrain, but also on the possibilities to gain other income. This
is within the container business, harbour dues from terminals. Leasing prices of container terminal space are lower
than that of depot grounds. From interviews it appears that the spin-off is less for empty depots than for container
terminals.
The possible alternatives for depot terrain, consists of terminal use or distribution facilities, for terrain near the
terminal and industry for terrain far from the terminal. The hierarchy of priorities in land use preferable land use is
terminal, non-container related port activities, distribution areas and empty depots.
3.51 Design space Possible instruments of the RPA, regarding direct influences on empty depots, are pricing and the quality of services,
amongst others the accessibility and size of areas for handling and storage.
The increasing demand for terrain makes it very difficult to plan for the uncertain future. This means flexibility Is
important.
If the planning abilities of transportation operators increase there will be made less use of the port depots, but if that
is not the case, containers cannot disappear Itself. The effects are being made clear according to scenarios in which
uncertain factors take different forms, such as the economic growth, collaboration dynamics and other external
dynamics. Insight in the effects is needed, because of the following reasons:
o With the effect of crowding out it is important that there are other possibilities to store the containers.
Furthermore it is not clear which effects might occur on the long term when the surface is relatively smaller.
28
Port planning and empty depots
o When different depot locations are in use there will be intraport transportation on the horizontal axis.
o If it is preferred to have as less space available at Maasvlakte 2 and the rest needs to be stored somewhere
else then there should be a high frequency, short travel time, low cost connection between that place and the
Maasvlakte.
o The handling capacity of barges at the Maasvlakte terminal is a limiting factor at the moment.
o The logistical optimum in geographical location.
On the one hand the RPA stimulates the use of barges for movements of empty containers; this is encouraged by
environmental regulations. But on the other hand available quay space can facilitate deep sea in stead of barge
transport, the latter gives higher revenue per container according to port tariffs. The priorities of the RPA should
determine the trade-off between environmental impact and revenues.
When designing empty depots for a new port area a few variables can be distinguished. On basis of interviews with
representatives of the RPA, the relevant design elements of a port depot are determined:
o the amount of lots and their area, assigned to depot operators
o the location of depot areas
o the lease price of land
Number of depot areas and their surface Shipping companies prefer to be able to keep the depot business healthy by creating a certain amount of
competitiveness. If only one depot is being exploited the shipping companies have no alternatives.
Few depot areas mean that the total capacity can be kept small. According to the economies of scale there needs to be
less separate safety stocks. And stacks can be kept relatively high, since each type and each shipping company has its
own stack. From ground productivity point of view, less depots is efficient up to a certain level, although the relative
distances between one depot and the terminals become larger. Some terminals will be further away from depot terrain
than others, which might cause friction between terminal operators.
Shipping companies will endeavour to ensure that at least two depots are competing in one area to safeguard their
bargaining position.
It is assumed that it is not possible to assign relatively more space to empty depots, since there is no space available.
It is also assumed that a certain amount of depot is needed. It is not feasible to put all the empties on the terminal.
If the surface will be decreased relatively from now, different events are possible to happen. It is very difficult to
predict which direction the events will take, but by taken a closer look at the situation from a causal perspective.
Location The location of the depots has a strong relation with the type of transport mode and the roundtrips to be maid by
transport operators.
If the empty depot is right behind the terminal, an internal lane is quite advantageous. With a Multi Trailer System few
containers can be transported in one trip, without weighing down on the regular roadways.
The lack of an internal lane means that the intensity on the roadways will increase. Since short distances will be
covered, truck is the most obvious modality.
Furthermore if the depot is significantiy far away from the terminal, it might be interesting to cover the distances with
other modalities than truck. But then it is a requisite for the depot to have either a rail connection or a barge
connection of its own.
Since the RPA stimulates the use of barge, she gives priority to depots with a barge connection. But it is not possible
for all current depots to be connected to the water, since area with water connection is limited. If there is no
possibility for the depots to make use of waterways, not even via a terminal, it will be sure that there will be a lot of
transportation movements by truck. It depends on the location of the depot where these movements are concentrated
and what the extent of these movements is.
In the current situation there is only one depot, which has a rail connection. In order to make the rail transport
lucrative, a minimal or critical volume is needed. In order to collect enough empty containers the depot has to have
29
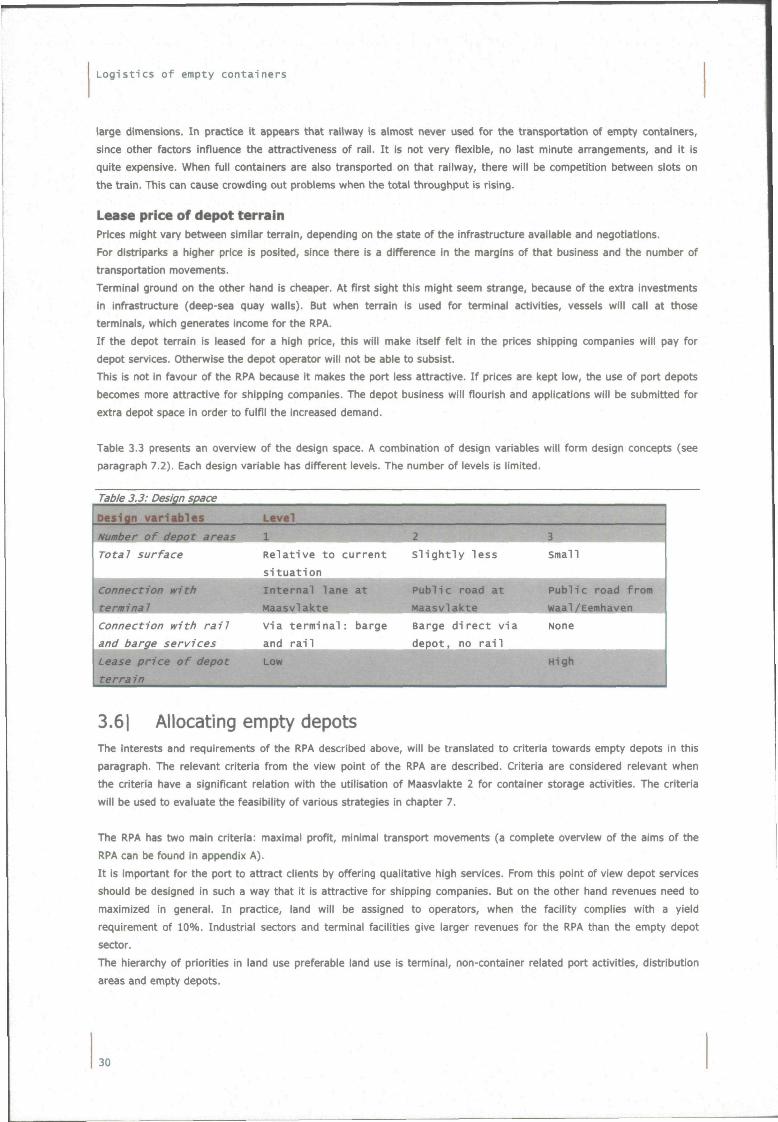
Logistics of empty containers
large dimensions. In practice it appears that railway is almost never used for the transportation of empty containers,
since other factors influence the attractiveness of rail. It is not very flexible, no last minute arrangements, and it is
quite expensive. When full containers are also transported on that railway, there will be competition between slots on
the train. This can cause crowding out problems when the total throughput is rising.
Lease price of depot terrain Prices might vary between similar terrain, depending on the state of the infrastructure available and negotiations.
For distriparks a higher price is posited, since there is a difference in the margins of that business and the number of
transportation movements.
Terminal ground on the other hand is cheaper. At first sight this might seem strange, because of the extra investments
in infrastructure (deep-sea quay walls). But when terrain is used for terminal activities, vessels will call at those
terminals, which generates income for the RPA.
If the depot terrain is leased for a high price, this will make itself felt In the prices shipping companies will pay for
depot services. Otherwise the depot operator will not be able to subsist.
This Is not in favour of the RPA because it makes the port less attractive. If prices are kept low, the use of port depots
becomes more attractive for shipping companies. The depot business will flourish and applications will be submitted for
extra depot space in order to fulfil the increased demand.
Table 3.3 presents an overview of the design space. A combination of design variables will form design concepts (see
paragraph 7.2). Each design variable has different levels. The number of levels is limited.
Table 3,3: Design space
Design v a r i a b l e s
Number of depot areas
Total surface
Connection with
Wbrminal i ^ ^ H
Connection with rail
and barge services
Lease price of depot
terra in
Level
1
R e l a t i v e t o c u r r e n t
s i t u a t i o n
I n t e r n a l lane a t
•rMaa.:v1akti> i J ^ ^ ^ ^ H
V ia t e r m i n a l : barge
and r a i l
Low
2
S l i g h t l y l e s s
P u b l i c road a t
BMaasvlakte ^ ^ ^ 1
Barge d i r e c t v i a
depo t , no r a i l
3
smal l
P u b l i c road f ro j | . ^
i waal/Eemhaven f//Ê
None
^ ^ ^ • P 3.61 Allocating empty depots The interests and requirements of the RPA described above, will be translated to criteria towards empty depots in this
paragraph. The relevant criteria from the view point of the RPA are described. Criteria are considered relevant when
the criteria have a significant relation with the utilisation of Maasvlakte 2 for container storage activities. The criteria
will be used to evaluate the feasibility of various strategies in chapter 7.
The RPA has two main criteria: maximal profit, minimal transport movements (a complete overview of the aims of the
RPA can be found in appendix A).
It is important for the port to attract clients by offering qualitative high services. From this point of view depot services
should be designed in such a way that it is attractive for shipping companies. But on the other hand revenues need to
maximized in general. In practice, land will be assigned to operators, when the facility compiles with a yield
requirement of 10%. Industrial sectors and terminal facilities give larger revenues for the RPA than the empty depot
sector.
The hierarchy of priorities in land use preferable land use Is terminal, non-container related port activities, distribution
areas and empty depots.
30
Port planmng and empty depots
The RPA also aims to confine the environmental effects in the port area in relation to the Environmental Impact
Assessment (Milieu Effect Rapportage in Dutch) for Maasvlakte 2. One of their sub targets is to maximize the quality of
the environment. A manner to operationalize this aim is to steering at a right modal share.
The criteria are:
o Minimal transport performance with empty containers
o Modal shift towards barge and rail
o Maximum yield from depot terrains
The possible alternatives for depot terrain, consists of terminal use or distribution facilities, for terrain near the
terminal and industry for terrain far from the terminal. The hierarchy of priorities in land use preferable land use is
terminal, non-container related port activities, distribution areas and empty depots.
The decision-making ability of the RPA consists of the following factors:
o the amount of slots and their area, assigned for depot operators
o the location of depot areas
o the price of the lease of land
Challenges facing the ports around the worid today are related not only to the amount of traffic, but also to the quality
of services. The continuous progress of globalization of shipping and trade business is resulting in increased pressure
on ports to reduce costs and improve operational efficiency (Boilé, 2006).
From the aspect angle of the TIL-master prgram the different arena's and the multi actor aspect of the problem will be
discussed. In that way the possibilities for minimizing transport movement and a shift amongst modalities will be
investigated. But first the system of the empty container supply chain requires specification.
31

Logist ics of empty containers
32
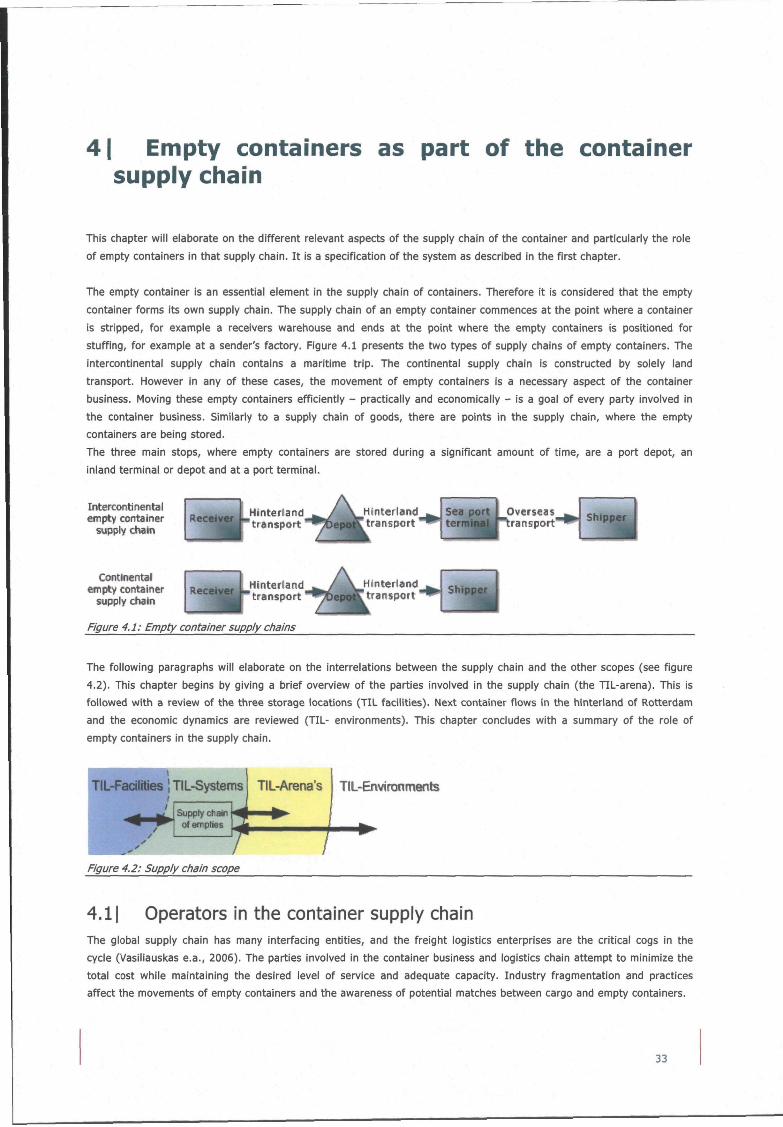
41 Empty containers as part of the container supply chain
This chapter will elaborate on the different relevant aspects of the supply chain of the container and particuiariy the role
of empty containers in that supply chain. It is a specification of the system as described in the first chapter.
The empty container is an essential element in the supply chain of containers. Therefore it is considered that the empty
container forms its own supply chain. The supply chain of an empty container commences at the point where a container
is stripped, for example a receivers warehouse and ends at the point where the empty containers is positioned for
stuffing, for example at a sender's factory. Figure 4.1 presents the two types of supply chains of empty containers. The
intercontinental supply chain contains a maritime trip. The continental supply chain is constructed by solely land
transport. However in any of these cases, the movement of empty containers is a necessary aspect of the container
business. Moving these empty containers efficientiy - practically and economically - is a goal of every party involved in
the container business. Similarly to a supply chain of goods, there are points in the supply chain, where the empty
containers are being stored.
The three main stops, where empty containers are stored during a significant amount of time, are a port depot, an
inland terminal or depot and at a port terminal.
Intercontinental empty container
supply chain
Continental empty container
supply chain
-jUgnJ I Hinterland transport
Hinterland transport
Hinterland transport *
Hinterland t ranspor t "
Sea port I O v e r s e a s ^ ^ ta rmi i« |J~ t ra n s p o r t " ^
S M j ^ ^
Figure 4.1: Empty container supply chains
The following paragraphs will elaborate on the interrelations between the supply chain and the other scopes (see figure
4.2). This chapter begins by giving a brief overview of the parties involved in the supply chain (the TIL-arena). This is
followed with a review of the three storage locations (TIL facilities). Next container flows in the hinteriand of Rotterdam
and the economic dynamics are reviewed (TIL- environments). This chapter concludes with a summary of the role of
empty containers in the supply chain.
U^M&f iiuS'.'. '[r «>bH^V ia,-<E
TIL-Facilities \ TIL-Systems TIL-Ai^na's TIL-Environments
Figure 4.2: Supply chain scope
4.11 Operators in the container supply chain The global supply chain has many interfacing entities, and the freight logistics enterprises are the critical cogs in the
cycle (Vasiliauskas e.a., 2006). The parties involved in the container business and logistics chain attempt to minimize the
total cost while maintaining the desired level of service and adequate capacity. Industry fragmentation and practices
affect the movements of empty containers and the awareness of potential matches between cargo and empty containers.
33
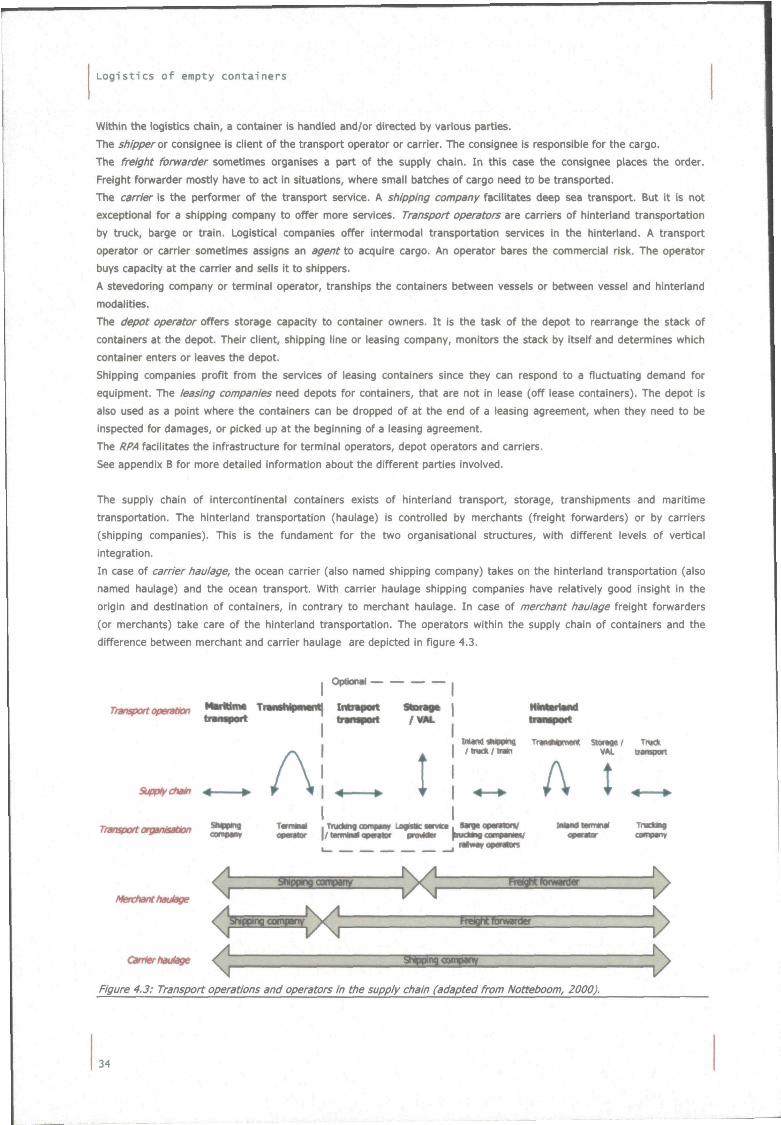
Logist ics of empty containers
Within the logistics chain, a container is handled and/or directed by various parties.
The shipper ot consignee is client of the transport operator or carrier. The consignee is responsible for the cargo.
The freight forwarder sometimes organises a part of the supply chain. In this case the consignee places the order.
Freight forwarder mostiy have to act in situations, where small batches of cargo need to be transported.
The carrier is the performer of the transport service. A shipping company facilitates deep sea transport. But it is not
exceptional for a shipping company to offer more services. Transport operators are carriers of hinteriand transportation
by truck, barge or train. Logistical companies offer intermodal transportation services in the hinteriand. A transport
operator or carrier sometimes assigns an agent to acquire cargo. An operator bares the commercial risk. The operator
buys capacity at the carrier and sells it to shippers.
A stevedoring company or terminal operator, tranships the containers between vessels or between vessel and hinteriand
modalities.
The depot operator offers storage capacity to container owners. It Is the task of the depot to rearrange the stack of
containers at the depot. Their client, shipping line or leasing company, monitors the stack by itself and determines which
container enters or leaves the depot.
Shipping companies profit from the services of leasing containers since they can respond to a fluctuating demand for
equipment. The leasing companies need depots for containers, that are not in lease (off lease containers). The depot is
also used as a point where the containers can be dropped of at the end of a leasing agreement, when they need to be
inspected for damages, or picked up at the beginning of a leasing agreement.
The RPA facilitates the infrastructure for terminal operators, depot operators and carriers.
See appendix B for more detailed information about the different parties involved.
The supply chain of intercontinental containers exists of hinteriand transport, storage, transhipments and maritime
transportation. The hinterland transportation (haulage) is controlled by merchants (freight forwarders) or by carriers
(shipping companies). This is the fundament for the two organisational structures, with different levels of vertical
integration.
In case of carrier haulage, the ocean carrier (also named shipping company) takes on the hinterland transportation (also
named haulage) and the ocean transport. With carrier haulage shipping companies have relatively good insight in the
origin and destination of containers, in contrary to merchant haulage. In case of merchant haulage freight forwarders
(or merchants) take care of the hinterland transportation. The operators within the supply chain of containers and the
difference between merchant and carrier haulage are depicted in figure 4.3.
OpMOMi
Transport operation
SupptyOmh
Transport organisation
VM.
A t _
Merchant hautage
Cmterhautage
4 aimcmooanwi»" X rWWK*BnWKWr
freight fOrwarOy
srnn^ng cowpany
Figure 4.3: Transport operations and operators in the supply chain (adapted from Notteboom, 2000).
^
^
^
34
Empty containers as part of the container supply chain
The container lease company takes up a rather exceptional position in the transport chain: the company's primary role is
supplier of equipment. Leasing companies provide spot availability of containers around the worid. They need to obtain
the equipment where there is a demand for it. For shipping lines the containerisation is a capital intensive business,
which makes leasing attractive.
Figure 4.3 is a schematised reflection of the supply chain. In reality some of the parts of the transportation are
outsourced, which causes a variety of horizontal and vertical integration. Vertical integration of supply chains can
improve efficiency, but at the same time can increase the complexity and transparency. For this research the most
important characteristic of the organisational aspect is the distinction between merchant and carrier haulage.
Besides the shipping companies, transport operators also form a special role in the empty container supply chain. Three
elements are present for transportation, namely the transport equipment, the container, cargo. This means transport
equipment can be empty as well (e.g. trailer without any container). Since that is not very efficient, transport operators
try to match containers with their equipment. The chance for a match is the biggest in areas where there are lots of
container flows. From the perspective of a transport operator it is advantageous to combine empty container trips with
loaded container trips. Firstiy the planning of transports is less complicated, when there is a limited amount of pick-up
and drop-off points. Moreover the reliability of the planning is better since pick-up and drop-off point are geographically
concentrated. E.g. an intermediate stopping point at Waal-/Eemhaven is avoided, in case the empty container is directly
transported to the MV. Intermediate stopping takes extra time. Furthermore the distance between WEH and MV is quite
large, about 40 kilometres, the price of such a trip is approximately 35 euros (Borsodi, 2006). When a transport operator
travels without any containers, he cannot pass these costs on to his clients.
4.1. II Merchant versus Carrier Haulage Shipping companies, that use merchant haulage, prefer to have delivered the containers back at the port. This
stimulates the hinteriand - port depot - hinteriand movement (described in paragraph 1.2, situation A). This is confirmed
by M. Van Selm (logistics department. Evergreen), who states that empty containers of Evergreen, that offers carrier
haulage for only 20%, regularly make these movements. R.Tabbers (manager equipment centre, Hapag Lloyd) also
confirms that in case of merchant haulage, empty containers are often delivered to a port depot. Fundamentally, the
transport market is managed by merchants. Shipping companies allow merchants to use their containers, but in return
demand that the empty containers are returned at a certain place, in interest of the shipping company. This place is
usually the port area.
The possibility of matching empty containers with cargo is not in the hands of a shipping company, in case of merchant
haulage. The shipping companies have few insight in the origins and destinations of empty containers in the hinteriand,
since there are a lot of intermediate parties, such as agents, involved. The merchant has to pay a drop-off fee, when
delivering and a pick-up fee for collecting (approximately 50 US dollars (approx. 38 euro), according to Tabbers, 2006).
In this way the costs for repositioning the container are covered. If it were decided to store the empty containers at an
inland terminal, the costs for a trip to the port would have to be paid and arranged by the shipping company. This would
result in higher tariffs and extra organisational effort. In theory it is possible, but in practice the problem is not big
enough to the actors to actually change their business structure. The incentive for action is not sufficient. Besides,
inland haulage is the core business of transport operators, agents and freight forwarders and not the core business of
shipping companies. The other parties are closer to the market and therefore better able to make matches (Borsodi,
personal interview, 2006), which creates a competition between carrier and merchant haulage.
Historically, the PoR has always been a typical "carrier haulage" port (Dekker, 2005). The ratio of carrier haulage to
merchant haulage has been 6:4 for years. Meanwhile the PoR turned into a port where the ratio carrier haulage to
merchant haulage has currently converted to 3:7, according to an estimate of the RPA (Dekker, 2005). Regarding the
information collected from the interviews, this ratio greatiy varies per shipping company and/or trade lane (see table
4.1). But from an overall point of view the estimate of 30% merchant haulage is valid. This means that the
organisational structure significantiy contributes to the utilisation of port depots.
35
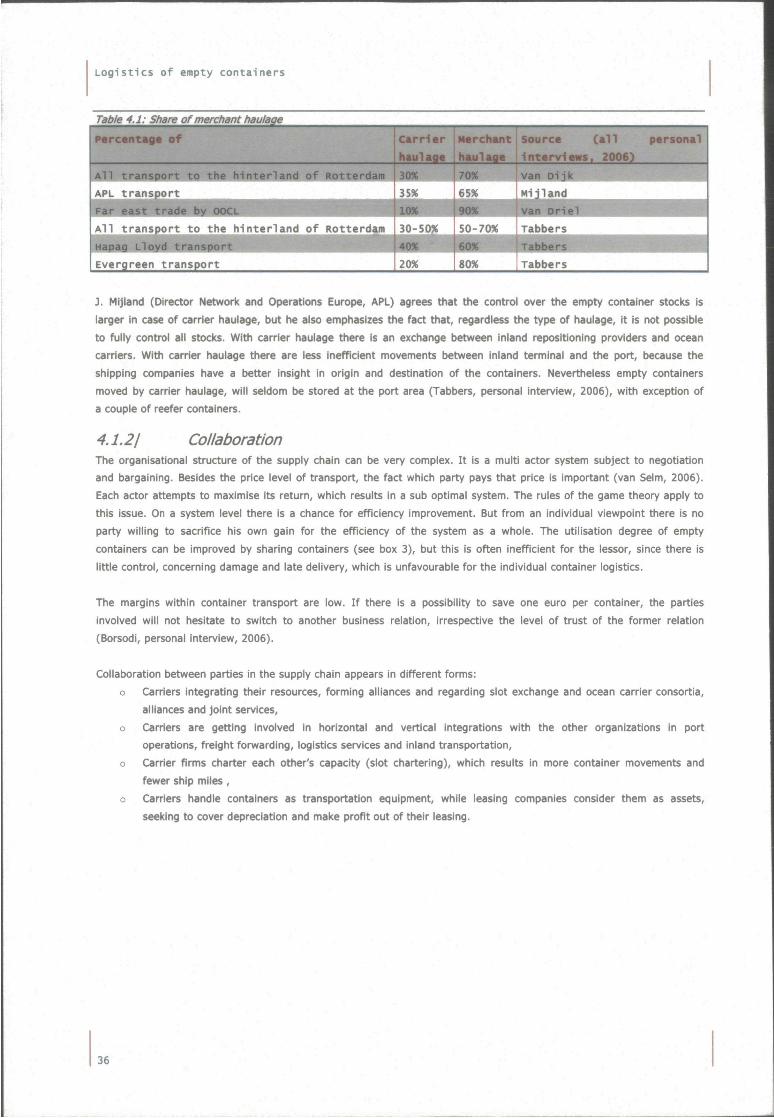
Logistics of empty containers
Table 4.1: Share of merchant haulage
Percentage of
A l l t ransport to the h inter land of Rotterdam APL transport
Carrier
haulage
30%
35*
Merchant
haulage
70%
65%
source ( a n
i n te rv iews , 2006)
van D i jk
Mi j land
personal
•fl
A11 transport to the hinterland of Rottcrdvi so-sm 50-70% Tabbers
Evergreen transport 20X 80% Tabbers
J. Mijland (Director Network and Operations Europe, APL) agrees that the control over the empty container stocks is
larger in case of carrier haulage, but he also emphasizes the fact that, regardless the type of haulage. It Is not possible to fully control all stocks. With carrier haulage there is an exchange between inland repositioning providers and ocean
carriers. With carrier haulage there are less inefficient movements between inland terminal and the port, because the
shipping companies have a better insight in origin and destination of the containers. Nevertheless empty containers
moved by carrier haulage, will seldom be stored at the port area (Tabbers, personal interview, 2006), with exception of
a couple of reefer containers.
4.1.2/ Collaboration The organisational structure of the supply chain can be very complex. It is a multi actor system subject to negotiation
and bargaining. Besides the price level of transport, the fact which party pays that price is important (van Selm, 2006).
Each actor attempts to maximise its return, which results in a sub optimal system. The rules of the game theory apply to
this issue. On a system level there Is a chance for efficiency improvement. But from an individual viewpoint there is no
party willing to sacrifice his own gain for the efficiency of the system as a whole. The utilisation degree of empty
containers can be improved by sharing containers (see box 3), but this is often inefficient for the lessor, since there is
little control, concerning damage and late delivery, which is unfavourable for the individual container logistics.
The margins within container transport are low. If there is a possibility to save one euro per container, the parties
involved will not hesitate to switch to another business relation, irrespective the level of trust of the former relation
(Borsodi, personal interview, 2006).
Collaboration between parties in the supply chain appears in different forms:
o Carriers integrating their resources, forming alliances and regarding slot exchange and ocean carrier consortia,
alliances and joint services,
o Carriers are getting involved in horizontal and vertical integrations with the other organizations in port
operations, freight forwarding, logistics services and inland transportation,
o Carrier firms charter each other's capacity (slot chartering), which results in more container movements and
fewer ship miles,
o Carriers handle containers as transportation equipment, while leasing companies consider them as assets,
seeking to cover depreciation and make profit out of their leasing.
36
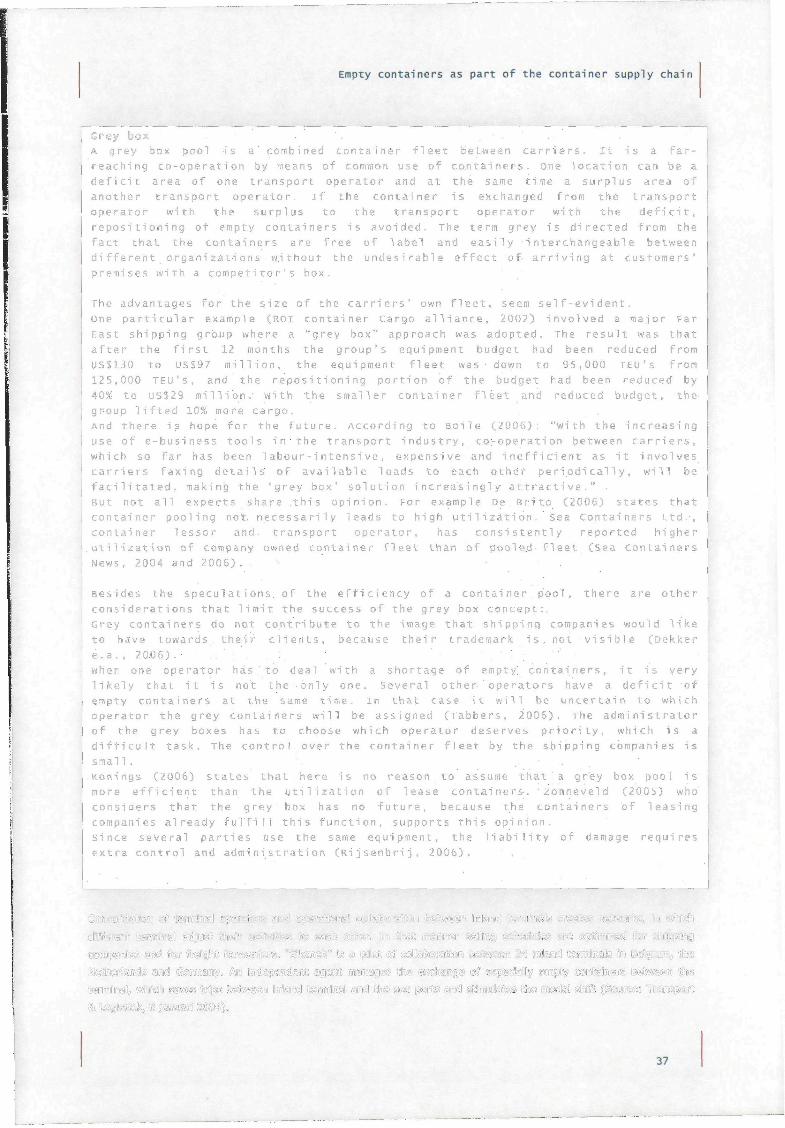
Empty containers as part of the container supply chain
Grey box ' • ' . , • . ' . .
A grey box p.ool is a' combined container fleet between carriers. It is a far-
reaching co-operation by raeans of common use of containers, one location can be a
deficit area of one transport operator and at the same time a surplus area of
another transport operator, if the container is exchanged from the transport
operator with the surplus to the transport operator with the deficit,
repositioning of empty containers is avoided. The term grey is directed from the
fact that the containers are free of label and easily interchangeable between
different organizations without the undesirable effect of arriving at customers'
premises with a competitor's box.
The advantages for the size of the carriers' own fleet, seem self-evident.
One particular example (ROI container Cargo alliance, 2002) involved a major Far
East shipping group where a "grey box" approach was adopted. The result was that
after the first 12 months the group's equipment budget had been reduced from
US$130 to US$97 million, the equipment fleet was down to 95,000 TEU's from
125,000 TEU's, and the repositioning portion of the budget had been reduced by
40% to US$29 million. With the smaller container fleet and reduced budget, the
group lifted 10% more cargo.
And there is hope for the future. According to Boile (2006): "With the increasing
use of e-business tools in the transport industry, co-operation between carriers,
which so far has been labour-intensive, expensive and inefficient as it involves
carriers faxing details of available loads to each other periodically, will be
facilitated, making the 'grey box' solution increasingly attractive."
But not all experts share this opinion. For example De: Brito (2006) states that
container pooling not necessarily leads to high utilization. Sea Containers Ltd.,
container lessor and transport operator, has consistently reported higher
utilization of company owned container fleet than of pooled fleet (Sea containers
News, 2004 and 2006) . .
Besides the speculations, of the efficiency of a container , pool, there are other
considerations that limit the success of the grey box concept:
Grey containers do not contribute to the image that shipping companies would like
to have towards, their clients, because their trademark is, not visible (Dekker
e..a. , 20,06) . • ' , ' , ' : , , : ,
when one operator has .' to deal with a shortage of emptyi containers, it is very
likely that it is not the only one. Several othe r ' ope rators have a deficit of
empty containers at the same time, in that case it will be uncertain to which
operator the grey containers will be assigned (Tabbers, 2006). The administrator
of the grey boxes has to choose which operator deserves priority, which is a
difficult task. The control, over the container fleet by the shipping companies is
smal 1 .
Konings (2006) states t h a t h e r e is no reason to assume t h a t a grey box pool is
more efficient than the utilization of lease containers. ^Zonneveld (2005) who
considers that the grey box has no future, because the containers of leasing
companies already fulfill this function, supports this opinion.
Since several parties use the same equipment, the liability of damage requires
extra control and administration (Rijsenbrij, 2006).
torrtmiil, «adii mmm Mm tf^mmfn UWnê teJwB»J giüid) iiis sas pst® aisii gaaiatete ite maê^ * l t famifSis Tiauii tsï,
37
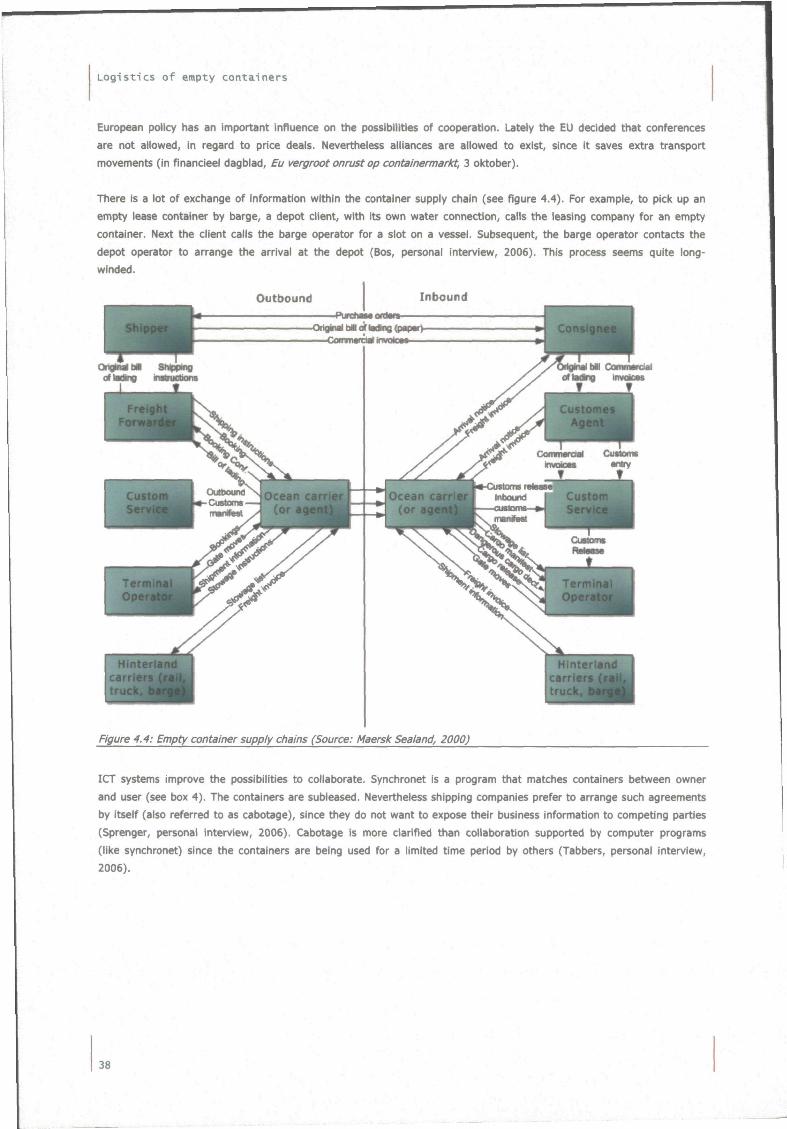
Logist ics o f empty containers
European policy has an important influence on the possibilities of cooperation. Lately the EU decided that conferences
are not allowed, in regard to price deals. Nevertheless alliances are allowed to exist, since it saves extra transport
movements (in financieel dagblad, Eu vergroot onrust op containermarkt, 3 oktober).
There is a lot of exchange of Information within the container supply chain (see figure 4.4). For example, to pick up an
empty lease container by barge, a depot client, with Its own water connection, calls the leasing company for an empty
container. Next the client calls the barge operator for a slot on a vessel. Subsequent, the barge operator contacts the
depot operator to arrange the arrival at the depot (Bos, personal interview, 2006). This process seems quite long-
winded.
Figure 4.4: Empty container supply chains (Source: Maersk Sealand, 2000)
ICT systems improve the possibilities to collaborate. Synchronet is a program that matches containers between owner
and user (see box 4). The containers are subleased. Nevertheless shipping companies prefer to arrange such agreements
by itself (also referred to as cabotage), since they do not want to expose their business information to competing parties
(Sprenger, personal interview, 2006). Cabotage is more clarified than collaboration supported by computer programs
(like synchronet) since the containers are being used for a limited time period by others (Tabbers, personal interview,
2006).
38
Empty containers as part of the container supply chain
SynchroBox™ provides the platform that allows ocean carriers to inexpensively
reposition equipment from
surplus to deficit locations with cost savings up to 80% (compared to empty
repositioning of the equipment). The carrier who receives the equipment at the
booking origin location saves in repositioning empty equipment to the booking
origin location and protects cargo bookings.
SynchroBox offers repositioning alternatives to multiple stakeholders. in an
effort to maximize mutually beneficial opportunities to a wide range of
customers, SynchroNet offers several sub-services including:
SynchroBox International™ provides customers the
opportunity to review and select container interchanges in a real-time online
environment. The SynchroBox service maximizes the potential for cooperative
container
management which address the imbalances that exist for major trade lane carriers
and short sea operators in the Asian, Americas, and European markets.
SynchroBox Domestic'" brings together Ocean Carriers and teasing Companies with
Intermodal Marketing
Companies (iMC's). The service provides I M C ' S end to end booking requirements
including the ability to source for available equipment, perform booking requests
online, and track and trace container activity.
Box 4: Synchronet (bron: http: //www.synchronetmarine. .aspx#01)
There is a chain of interests of different parties involved. The competitive strength of the RPA is determined by the
quality of port facilities as depots. The RPA facilitates the logistics of containers, while aiming at a strong competitive
position and therefore satisfying their valuable customers. The depot operator also aims at a high level of throughput.
Shipping companies have the objective to efficientiy exploit the container logistics. On its turn the transport operator
aims at efficientiy exploitation of their vehicle fleet, by optimising their routing.
Within maritime container transport, the shipping company fulfils a central role in the logistical chain (Konings, 2005).
Shipping companies monitor empty containers at depots and reposition empty containers. The other parties involved are
facilitating the empty container logistics. The shipping company is responsible for the decisions in relation to storage
and transportation. A shipping company has several objectives regarding transportation costs, transportation time,
service costs, planning and reliability.
The manner in which the inventory at a depot is monitored and steered is called container management or empty
container management (see chapter 5).
4.21 Empty containers at sea port container terminal The main function of a seaport container terminal is to tranship containers to and/or from sea going vessels. The aim of
the terminal operator is to handle as many containers as possible. To emulate this aim there should be enough space
available on the terminal. When the dwell time is short, more containers can be handled and the time per handled
container is also short (since stacks can be kept small). Thus empty containers are allowed to be stored at a terminal,
but the dwell time is limited.
At the seaport terminal outbound empty containers are only placed if their destination is known, in contrary to a depot.
Incoming containers from the seaside are placed at the terminal and are waiting to be picked up. The time involved in
this is called the dwell time. The terminal has a function in the routing of the containers (Dekker, 2005), since it is a
next stop after a depot for a container, which is send of an overseas trip.
39
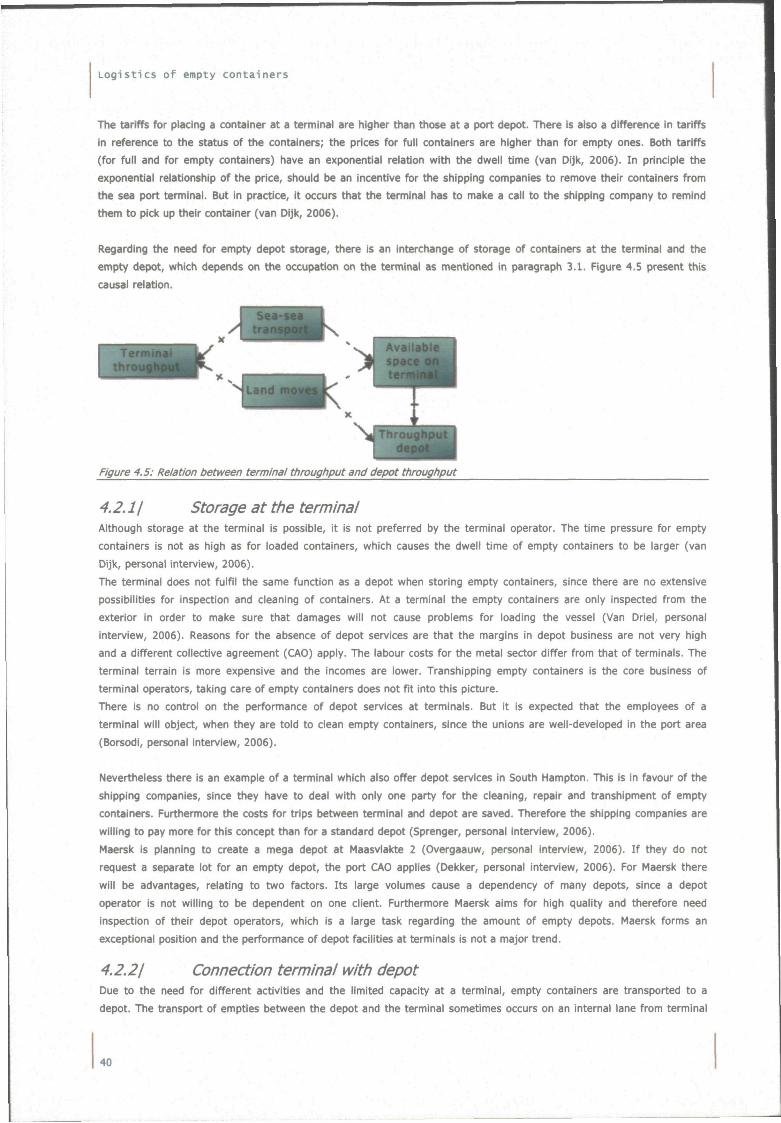
Logistics of empty containers
The tariffs for placing a container at a terminal are higher than those at a port depot. There is also a difference in tariffs
in reference to the status of the containers; the prices for full containers are higher than for empty ones. Both tariffs
(for full and for empty containers) have an exponential relation with the dwell time (van Dijk, 2006). In principle the
exponential relationship of the price, should be an incentive for the shipping companies to remove their containers from
the sea port terminal. But in practice, it occurs that the terminal has to make a call to the shipping company to remind
them to pick up their container (van Oljk, 2006).
Regarding the need for empty depot storage, there is an interchange of storage of containers at the terminal and the
empty depot, which depends on the occupation on the terminal as mentioned in paragraph 3.1. Figure 4.5 present this
causal relation.
Figure 4.5: Relation between terminal throughput and depot throughput
4.2. II Storage at the terminal Although storage at the terminal is possible, it is not preferred by the terminal operator. The time pressure for empty
containers is not as high as for loaded containers, which causes the dwell time of empty containers to be larger (van
Dijk, personal interview, 2006).
The terminal does not fulfil the same function as a depot when storing empty containers, since there are no extensive
possibilities for inspection and cleaning of containers. At a terminal the empty containers are only inspected from the
exterior in order to make sure that damages will not cause problems for loading the vessel (Van Driel, personal
interview, 2006). Reasons for the absence of depot services are that the margins in depot business are not very high
and a different collective agreement (CAO) apply. The labour costs for the metal sector differ from that of terminals. The
terminal terrain is more expensive and the incomes are lower. Transhipping empty containers is the core business of
terminal operators, taking care of empty containers does not fit into this picture.
There is no control on the performance of depot services at terminals. But it is expected that the employees of a
terminal will object, when they are told to clean empty containers, since the unions are well-developed in the port area
(Borsodi, personal interview, 2006).
Nevertheless there is an example of a terminal which also offer depot services in South Hampton. This is in favour of the
shipping companies, since they have to deal with only one party for the cleaning, repair and transhipment of empty
containers. Furthermore the costs for trips between terminal and depot are saved. Therefore the shipping companies are
willing to pay more for this concept than for a standard depot (Sprenger, personal interview, 2006).
Maersk is planning to create a mega depot at Maasvlakte 2 (Overgaauw, personal interview, 2006). If they do not
request a separate lot for an empty depot, the port CAO applies (Dekker, personal interview, 2006). For Maersk there
will be advantages, relating to two factors. Its large volumes cause a dependency of many depots, since a depot
operator is not willing to be dependent on one client. Furthermore Maersk aims for high quality and therefore need
inspection of their depot operators, which is a large task regarding the amount of empty depots. Maersk forms an
exceptional position and the performance of depot facilities at terminals is not a major trend.
4.2.21 Connection terminal with depot Due to the need for different activities and the limited capacity at a terminal, empty containers are transported to a
depot. The transport of empties between the depot and the terminal sometimes occurs on an internal lane from terminal
40
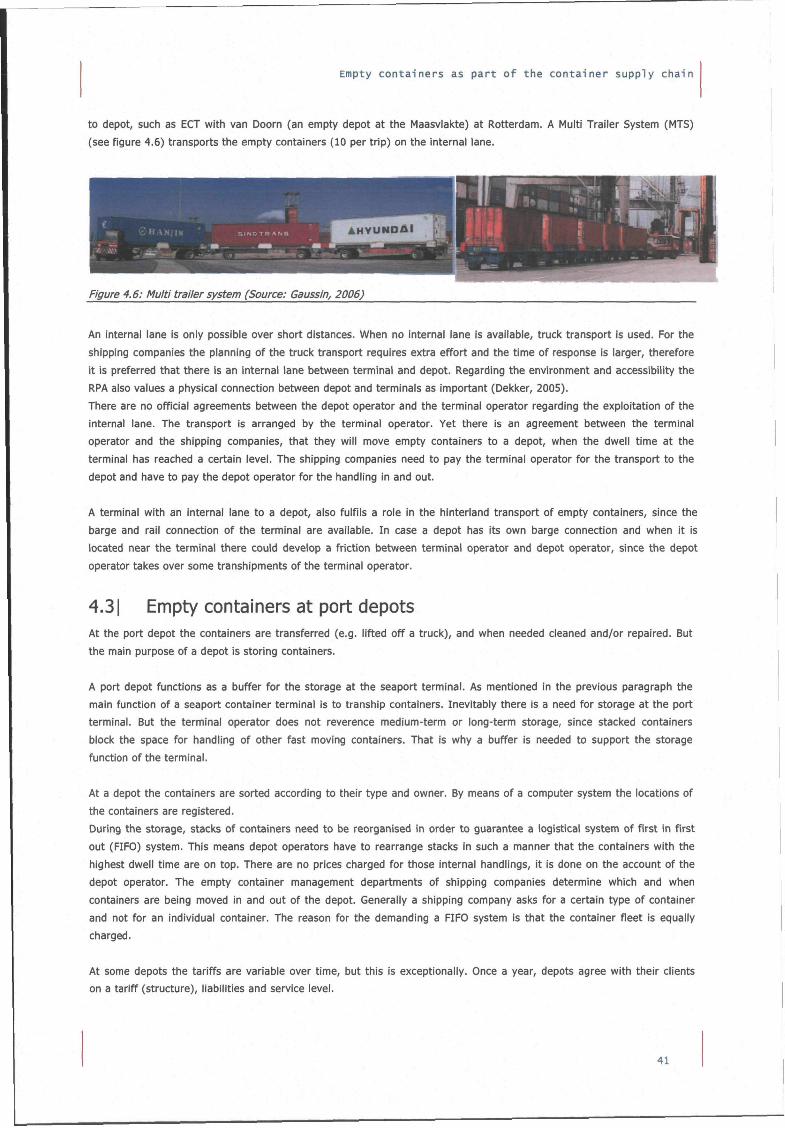
Empty containers as part of the container supply chain
to depot, such as ECT with van Doorn (an empty depot at the Maasvlakte) at Rotterdam. A Multi Trailer System (MTS)
(see figure 4.6) transports the empty containers (10 per trip) on the internal lane.
Figure 4.6: Multi trailer system (Source: Gaussin, 2006)
An internal lane is only possible over short distances. When no internal lane is available, truck transport is used. For the
shipping companies the planning of the truck transport requires extra effort and the time of response is larger, therefore
it is preferred that there is an internal lane between terminal and depot. Regarding the environment and accessibility the
RPA also values a physical connection between depot and terminals as important (Dekker, 2005).
There are no official agreements between the depot operator and the terminal operator regarding the exploitation of the
internal lane. The transport is arranged by the terminal operator. Yet there is an agreement between the terminal
operator and the shipping companies, that they will move empty containers to a depot, when the dwell time at the
terminal has reached a certain level. The shipping companies need to pay the terminal operator for the transport to the
depot and have to pay the depot operator for the handling in and out.
A terminal with an internal lane to a depot, also fulfils a role in the hinteriand transport of empty containers, since the
barge and rail connection of the terminal are available. In case a depot has its own barge connection and when it is
located near the terminal there could develop a friction between terminal operator and depot operator, since the depot
operator takes over some transhipments of the terminal operator.
4.31 Empty containers at port depots At the port depot the containers are transferred (e.g. lifted off a truck), and when needed cleaned and/or repaired. But
the main purpose of a depot is storing containers.
A port depot functions as a buffer for the storage at the seaport terminal. As mentioned in the previous paragraph the
main function of a seaport container terminal is to tranship containers. Inevitably there is a need for storage at the port
terminal. But the terminal operator does not reverence medium-term or long-term storage, since stacked containers
block the space for handling of other fast moving containers. That is why a buffer is needed to support the storage
function of the terminal.
At a depot the containers are sorted according to their type and owner. By means of a computer system the locations of
the containers are registered.
During the storage, stacks of containers need to be reorganised in order to guarantee a logistical system of first in first
out (FIFO) system. This means depot operators have to rearrange stacks in such a manner that the containers with the
highest dwell time are on top. There are no prices charged for those internal handlings, it is done on the account of the
depot operator. The empty container management departments of shipping companies determine which and when
containers are being moved in and out of the depot. Generally a shipping company asks for a certain type of container
and not for an individual container. The reason for the demanding a FIFO system is that the container fleet is equally
charged.
At some depots the tariffs are variable over time, but this is exceptionally. Once a year, depots agree with their clients on a tariff (structure), liabilities and service level.
41
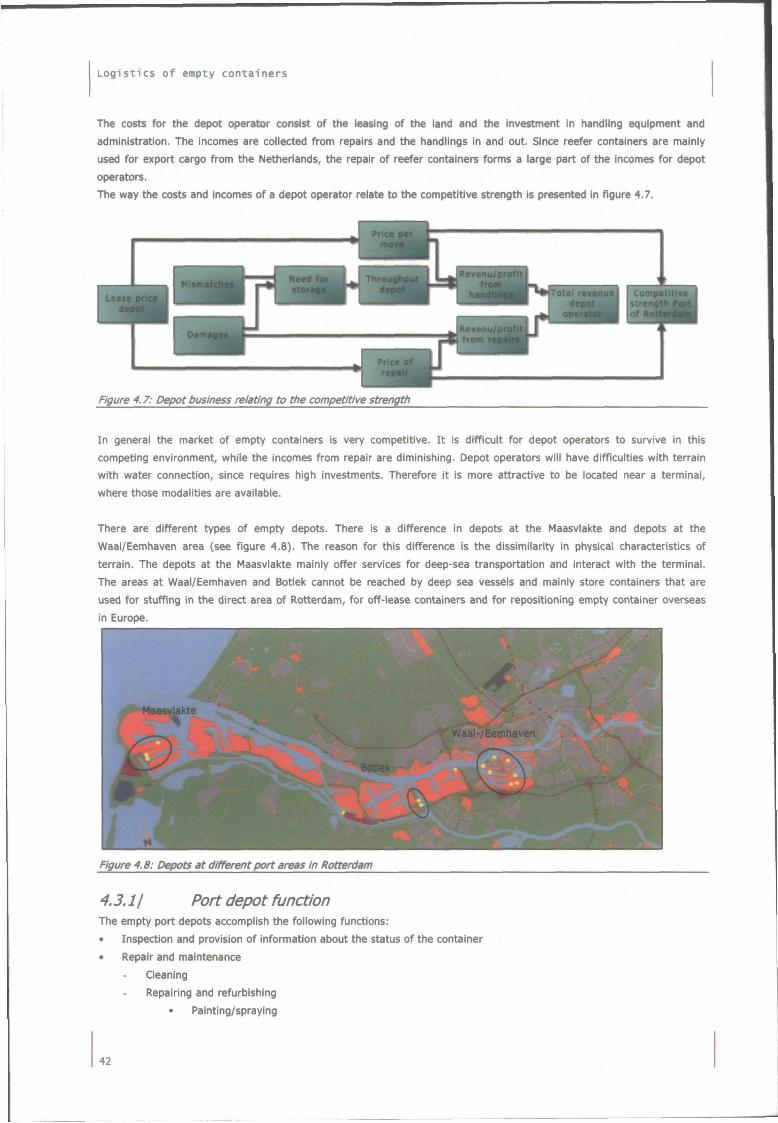
Logist ics of empty containers
The costs for the depot operator consist of the leasing of the land and the investment in handling equipment and
administration. The incomes are collected from repairs and the handlings in and out. Since reefer containers are mainly
used for export cargo from the Netheriands, the repair of reefer containers forms a large part of the incomes for depot
operators.
The way the costs and incomes of a depot operator relate to the competitive strength Is presented in figure 4.7.
Figure 4.7: Depot business relating to the competitive strength
In general the market of empty containers is very competitive. It is difficult for depot operators to survive in this
competing environment, while the incomes from repair are diminishing. Depot operators will have difficulties with terrain
with water connection, since requires high investments. Therefore it is more attractive to be located near a terminal,
where those modalities are available.
There are different types of empty depots. There is a difference in depots at the Maasvlakte and depots at the
Waal/Eemhaven area (see figure 4.8). The reason for this difference is the dissimilarity in physical characteristics of
terrain. The depots at the Maasvlakte mainly offer services for deep-sea transportation and interact with the terminal.
The areas at Waal/Eemhaven and Botiek cannot be reached by deep sea vessels and mainly store containers that are
used for stuffing in the direct area of Rotterdam, for off-lease containers and for repositioning empty container overseas
in Europe.
Figure 4.8: Depots at different port areas in Rotterdam
4.3.11 Port depot function The empty port depots accomplish the following functions:
• Inspection and provision of information about the status of the container
• Repair and maintenance
Cleaning
Repairing and refurbishing
• Painting/spraying
42
Empty containers as part of the container supply chain
• Grit blasting
• Flatting
Pre-tripping (testing of reefer containers before use)
• Storage of empty containers (standard and off-lease containers)
• Selling used containers
• Truck transport in the region Rotterdam (this occurs limited).
Before a container can be recovered it needs to have a food grade, this means it is clean, dry and odourless (Van Driel,
personal interview, 2006). At Hapag Lloyd 10% of the import containers need cleaning (Tabbers, personal interview,
2006). This differs per shipping company because it is strongly dependent of the type of imported cargo. Sometimes the
containers need extra services (such as removal of clothing racks).
Twenty-five percent of the standard containers need repair, but almost every container is transhipped to the far east
(Schepen, personal interview, 2006). Reefer containers and open top containers have the largest chance to be damaged.
All reefer containers need to be cleaned and their cooling mechanism is sensitive for failures. Hundred percent of the
open top containers need repair. At Evergreen every container is inspected at arrival at a depot, ten percent of the
containers is being repaired (Van Selm, written response to questionnaire, 2006).
Regular damages that occur are dents or malfunctioning of reefer installation. If the container is sincerely damaged
(costs of 100 dollars estimated by Dekker and Schuylenburg., personal interview 2006 and of 300 dollar by Verstoep,
personal interview, 2006), the depot operator forms an estimate report of the damages. This report will be send to the
owner of the container, mainly a shipping company. The owner decides whether the container will be repaired or not at
that depot. If it is possible to transport the container and the repair price is very high, empty containers are sometimes
send back to Asia damaged. In Asia labour is cheaper, which makes the repairs less expensive. Since there are enough
empty containers in Northwest Europe, it does not matter that the container can not be used as package on the way to
Asia. Since repair is also less expensive in Munchen, Germany than in the Netheriands, some containers are repaired
there (Verstoep, personal interview, 2006).
In the Waal-/Eemhaven area there is a lot of short sea transport. Short sea vessels are able to reach that part of the
port and therefore it is lucrative for the shipping companies and freight forwarders to store the containers at the WEH
and avoid an expensive trip by truck to the MV (Borsodi, personal interview, 2006).
Since short sea supply chain consists of truck transport and short sea transport, the chain is less complex than the deep
sea supply chain and directed by carrier haulage. Because of the overview, the forecasting is easier and there is a
minimal need for storage (Dekker, personal interview, 2006).
The standard for repairs become less strict and the repairs need to be done faster (Verstoep, personal interview, 2006).
Despite the fact that a lot of containers are being repaired in the far east, the depot operator has an important role to
the shipping company regarding the status of the container. The information supply about the level of damage of
containers and the estimate of the damage is of more importance than the repair itself (Mijland, personal interview,
2006).
The relationship between depot operators and shipping companies has been shaped by past experiences. In eariier days
the depot operators were known to swindle shipping companies. Therefore the shipping companies are more careful and
check upon the depot activities. Each shipping company has several depots in use. The relationship is not very solid,
since shipping companies easily switch to another depot.
Off-lease containers are containers which need storage during the period that they are not in lease. Shipping companies
drop off or pick up containers at a lease depot. The lease depots are mainly situated in the Waal/-Eemhaven area
(Kijzerwaard e.a., 2003). Lease depots are discussed in paragraph 4.3.3.
In Northwest Europe there is a secondary market for empty containers. These containers are used for other purposes
than marine transport. Containers that are stored at or nearby port terminals are most susceptible to the economic
43
Logist ics of empty containers
swings of market demand. Furthermore, if containers are located nearby a high demand area, they typically sell at
higher prices in larger quantities (Boile, 2005).
4.3.21 Depot business Depot operators get paid per move in and out of the depot. In some cases there are no charges for the time spend in a
depot, in other cases the pricing mechanisms (increasing in steps over time or not) vary from depot to depot. Repairs
form a decreasing part of the depot incomes because of cheaper prices in China and because the standards about the
urge for repair have declined at the shipping companies (Verstoep, personal interview, 2006). There are no long term
liabilities, other than an agreement on tariffs. The aim of depot operators is a high throughput in containers (TEU/time
unit in and out). Between depots the competition is strong.
For a port depot which handlings by truck are per year 18 euro times 200,000 moves annually, creating an income of 3.6
million euros. The price of depot terrain is approximately 15 euro per m per year. A depot with 200,000 moves will have
a size of 8 ha, which means that the costs for the terrain are annually 1.2 million euros. The terrain costs fonn
approximately one third of the turnover.
Regarding their competitors in the HLH-range, the port depots have a safe position. The handlings in the PoR are twice
as cheap as in Germany (Hulsk, personal interview, 2006 and Van Driel, personal interview, 2006), the same holds for
France (Overgaauw, personal interview, 2006). But in relation to inland depots the port depots are expensive (Tabt>ers,
personal interview, 2006)
The arrivals in combination with dwell time and stack height and type of handling equipment determines the surface
needed for storage. If literally the sky would be the limit there wouldn't be a capacity problem in depot for depot
terrain. Unfortunately there is a maximum in stack height, which is mainly determined by the wind speed, but also by
the available handling equipment. The stack height at the Waal-/Eemhaven can be higher than at the Maasvlakte since
wind forces are lower. At the Maasvlakte the maximum stack height is 7 container. The quantity of containers, which are
stored at the Maasvlakte in the PoR, depends on a various factors. In chapter 6 an extensive analysis of the influences
on the inventory level in a port depot is presented.
The number of arrivals is defined as the total of handling of the depot. Often the productivity of a depot is measured in
terms of the number of moves, this is the total of handlings in an out of the depot and excludes the number of move on
the terrain of the depot. The aim of a depot operator is to realise as much arrivals as possible since it is being paid per
handling (in or out).
The dwell time of the larger part of the containers at the Maasvlakte is relatively short, 2 to 3 days (Schepen, personal
interview, 2006). Nevertheless there are containers that stay a depot for three weeks. Although the dwell time is short
there is still a need for rearranging the stacks in order to guarantee a FIFO system.
4.3.31 Lease depots Off lease containers are a separate group of containers since their characteristics differ from standard containers. A
container, that has been leased needs a more detailed inspection on special support, due to the liability issues. The
inspection of owned containers is more easy, since they can get a check up white situated on the truck (Verstoep,
personal interview, 2006).The dwell time of containers stored at a lease depot is four to five times the dwell time of
containers in use by a shipping company (Zonneveld, interview, 2005).
Lease containers form a separate category for the container depot functionality. There are depots that only facilitate the
storage of containers that are out of lease. Containers that are in lease are part of the total container fleet of a shipping
company and those containers get the same treatment as containers owned by the shipping company during the lease
period. There are two types of leasing agreements. The first one is a long term lease contract, in which the lease
company decides where the container needs to be dropped off. The second one is a master lease contract, which is more
expensive per container for the shipping company and is valid for one or several trips. This is often done with new
containers. The shipping company decides where they drop off the container.
An important characteristic of containers that are out of lease is that their dwell time is higher than other containers in
depot. Relatively they take up more space. The number of containers that is out of lease is dependent on the size of the
44
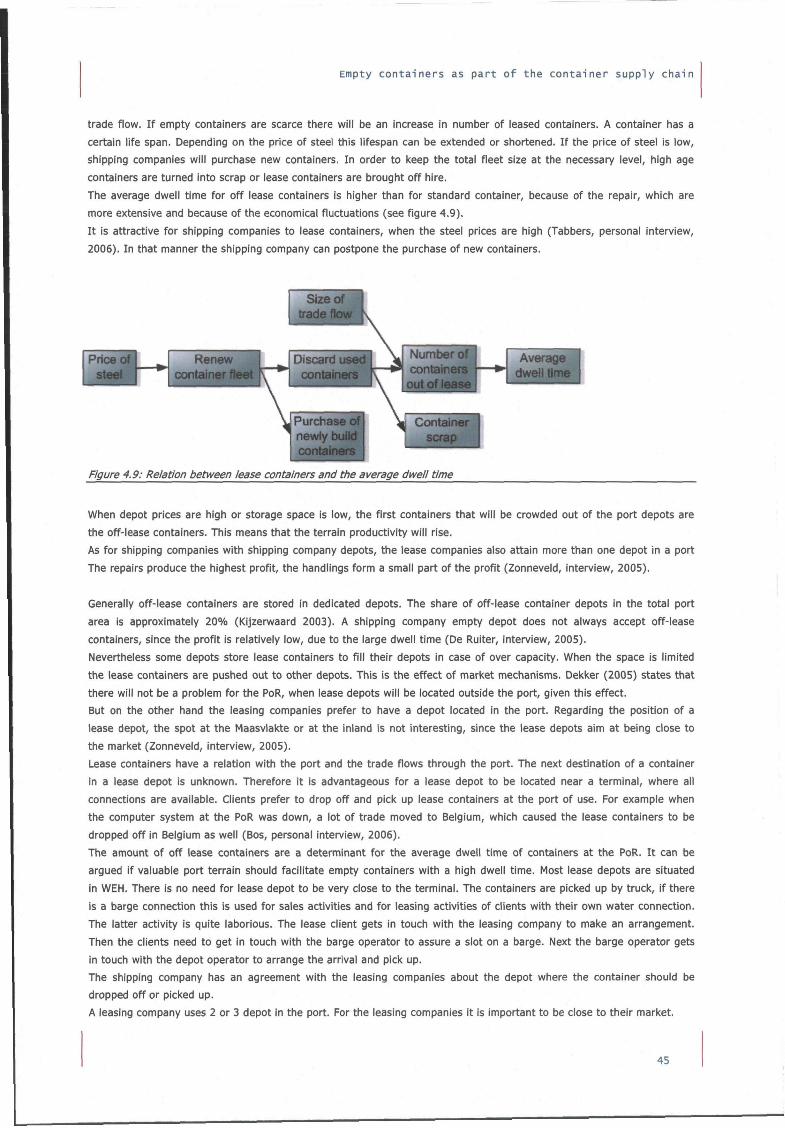
Empty containers as part of the container supply chain
trade flow. If empty containers are scarce there will be an increase in number of leased containers. A container has a
certain life span. Depending on the price of steel this lifespan can be extended or shortened. If the price of steel is low,
shipping companies will purchase new containers. In order to keep the total fleet size at the necessary level, high age
containers are turned into scrap or lease containers are brought off hire.
The average dwell time for off lease containers is higher than for standard container, because of the repair, which are
more extensive and because of the economical fluctuations (see figure 4.9).
It is attractive for shipping companies to lease containers, when the steel prices are high (Tabbers, personal interview,
2006). In that manner the shipping company can postpone the purchase of new containers.
Size of trade fbw
Pric« steel 3H Renew
container fleet Discard
containers
Purchaser newly build cantainers
Number^ containers
jaut of lease
Averagi dwell tinfie
Container scrap
Figure 4.9: Relation between lease containers and the average dwell time
When depot prices are high or storage space is low, the first containers that will be crowded out of the port depots are
the off-lease containers. This means that the terrain productivity will rise.
As for shipping companies with shipping company depots, the lease companies also attain more than one depot in a port
The repairs produce the highest profit, the handlings form a small part of the profit (Zonneveld, interview, 2005).
Generally off-lease containers are stored in dedicated depots. The share of off-lease container depots in the total port
area is approximately 20% (Kijzerwaard 2003). A shipping company empty depot does not always accept off-lease
containers, since the profit is relatively low, due to the large dwell time (De Ruiter, interview, 2005).
Nevertheless some depots store lease containers to fill their depots in case of over capacity. When the space is limited
the lease containers are pushed out to other depots. This is the effect of market mechanisms. Dekker (2005) states that
there will not be a problem for the PoR, when lease depots will be located outside the port, given this effect.
But on the other hand the leasing companies prefer to have a depot located in the port. Regarding the position of a
lease depot, the spot at the Maasvlakte or at the inland is not interesting, since the lease depots aim at being close to
the market (Zonneveld, interview, 2005).
Lease containers have a relation with the port and the trade flows through the port. The next destination of a container
in a lease depot is unknown. Therefore it is advantageous for a lease depot to be located near a terminal, where all
connections are available. Clients prefer to drop off and pick up lease containers at the port of use. For example when
the computer system at the PoR was down, a lot of trade moved to Belgium, which caused the lease containers to be
dropped off in Belgium as well (Bos, personal interview, 2006).
The amount of off lease containers are a determinant for the average dwell time of containers at the PoR. It can be
argued if valuable port terrain should facilitate empty containers with a high dwell time. Most lease depots are situated
in WEH. There is no need for lease depot to be very close to the terminal. The containers are picked up by truck, if there
is a barge connection this is used for sales activities and for leasing activities of clients with their own water connection.
The latter activity is quite laborious. The lease client gets in touch with the leasing company to make an arrangement.
Then the clients need to get in touch with the barge operator to assure a slot on a barge. Next the barge operator gets
in touch with the depot operator to arrange the arrival and pick up.
The shipping company has an agreement with the leasing companies about the depot where the container should be
dropped off or picked up.
A leasing company uses 2 or 3 depot in the port. For the leasing companies it is important to be close to their market.
45
Logistics of empty containers
l^ase containers do not always leave the depot In lease. Lease companies repositioning their containers to deficit areas
to serve their clients. This is a push system. So there is not a high time pressure. There is also an amount of lease
containers that is sold to the depot operator to resell or as repair material. The repositioning and selling activity does
not require a location in the port in contrary to the drop off and pick up activities of leasing containers.
It will be difficult to banish the storage of lease containers in the port area. One of the three activities in lease depots is
strongly port related, while the other activities are necessary for the continuity of leasing depots. The most promising
solution is to relocate the lease depots to boundary of the port area (Ridderkerk).
4.41 Empty containers at inland terminals As mentioned in chapter 1, inland terminals are important nodes regarding the efficiency of the empty container
logistics.
4.4.11 Inland terminal function The primary function of an inland terminal is to ensure the transfer of containers (and other intermodal units, such as
swap bodies and semi-trailers suitable for intermodal transport) from one transportation mode to another, whether in a
single mode, bi-modal or multimodal system (EC Best practice handbook 2002). The use of multimodal transport is
advantageous for shipping companies, since 40 to 80% of the transport costs are related to hinteriand traffic
(Notteboom, 2005) and barge is a inexpensive alternative for truck.
An inland terminal functions as an intermediate station for container transport (Hulsk, personal Interview, 2006). The
inland terminal and the port are connected with barge and rail services. From the inland terminal containers are
distributed by truck. Depots in the far hinteriand (Germany) are served by the inland terminals. Without inland terminals
containers emptied at the hinteriand would have to be transported to the PoR, from where they would be transhipped to
barge for a trip to Germany. Besides the containers used for import to the Netherlands, there are empty containers
imported via Rotterdam for distribution amongst depots in the far hinteriand. The inland terminal is a node in this supply
chain.
Inland terminals have a function as empty depot. Like port depots the FIFO system also applies here. And the costs
structure is also based on the handlings in and out and not on basis of dwell time (Hulsk, personal interview, 2006).
Apart from the location of the storage facility, a few more differences can be identified between port depots and Inland
terminals.
Repair activities are being offered less at inland terminals than at port depots (Verstoep, 2006 and Hulsk, personal
interview, 2006). Storage at inland terminals is cheaper than at port depots (Foxcroft, 2006b).
The advantage of an inland terminal is that the operator is closer situated to the market and has good insight in the
regional traffic pattern. When the depot facilities at an inland terminal tend to be saturated, the inland terminal operator
will look for cargo, by contacting exporting companies (Hulsk, personal interview, 2006). This is in favour of the shipping
companies, who do not have to acquire the containers themselves.
Public facilities for the storage of empty containers in hinterland areas are always accompanied by transhipment or
distribution services. That is why the term inland terminal is used to identify storage places in non-sea-port areas.
This also indicates the important difference between an inland terminal and an inland depot. An Inland depot only
handles empty containers, which makes it more difficult to match containers with vehicles. This causes a difficulty in
combining trips back and forward (see appendix C). Regarding the organisational differentiation, a lot of collaboration
between shipping companies is need to realise a feasible possibility for matches.
4.4.21 Substitute for port depots A lot of inland terminals have been developed during the past few years, together with the container transport via
Inland shipping. This is why there are a lot of inland terminals are situated near waterways. Inland shipping is a popular
mean of transportation since it is relatively cheap and the reliability is high, congestion hardly occurs on the waterways
46
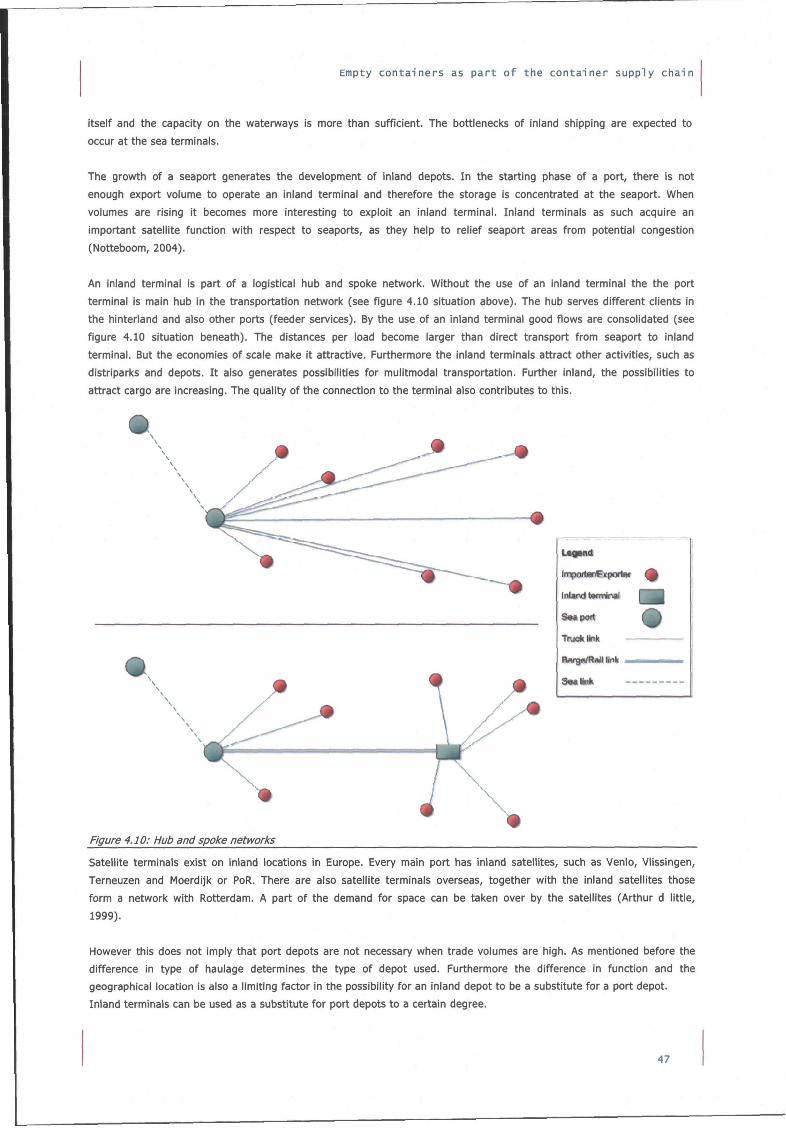
Empty containers as part of the container supply chain
itself and the capacity on the waterways is more than sufficient. The bottlenecks of inland shipping are expected to
occur at the sea terminals.
The growth of a seaport generates the development of inland depots. In the starting phase of a port, there is not
enough export volume to operate an inland terminal and therefore the storage is concentrated at the seaport. When
volumes are rising it becomes more interesting to exploit an inland terminal. Inland terminals as such acquire an
important satellite function with respect to seaports, as they help to relief seaport areas from potential congestion
(Notiieboom, 2004).
An inland terminal is part of a logistical hub and spoke network. Without the use of an inland terminal the the port
terminal is main hub in the transportation network (see figure 4.10 situation above). The hub serves different clients in
the hinteriand and also other ports (feeder services). By the use of an inland terminal good flows are consolidated (see
figure 4.10 situation beneath). The distances per load become larger than direct transport from seaport to inland
terminal. But the economies of scale make it attractive. Furthermore the inland terminals attract other activities, such as
distriparks and depots. It also generates possibilities for mulitmodal transportation. Further inland, the possibilities to
attract cargo are increasing. The quality of the connection to the terminal also contributes to this.
UOMtf
Itnportsr icpartei
Inland terminal
S«*|)ort
Truck link —
Rmgn/Rall link »
SMKnk
Figure 4.10: Hub and spoke networks
Satellite terminals exist on inland locations in Europe. Every main port has inland satellites, such as Venio, Vlissingen,
Terneuzen and Moerdijk or PoR. There are also satellite terminals overseas, together with the inland satellites those
form a network with Rotterdam. A part of the demand for space can be taken over by the satellites (Arthur d littie,
1999).
However this does not imply that port depots are not necessary when trade volumes are high. As mentioned before the
difference in type of haulage determines the type of depot used. Furthermore the difference in function and the
geographical location is also a limiting factor in the possibility for an inland depot to be a substitute for a port depot.
Inland terminals can be used as a substitute for port depots to a certain degree.
47
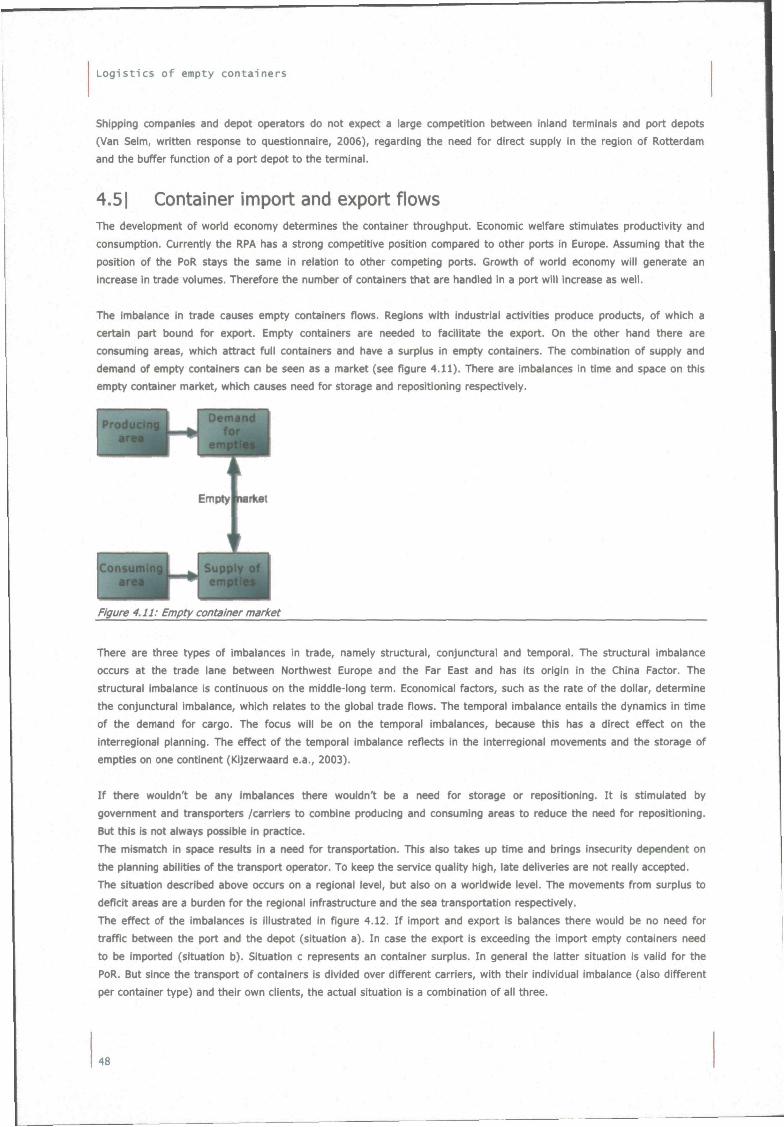
Logistics of empty containers
Shipping companies and depot operators do not expect a large competition between inland terminals and port depots
(Van Selm, written response to questionnaire, 2006), regarding the need for direct supply in the region of Rotterdam
and the buffer function of a port depot to the terminal.
4.51 Container import and export flows The development of worid economy determines the container throughput. Economic welfare stimulates productivity and
consumption. Currentiy the RPA has a strong competitive position compared to other ports in Europe. Assuming that the
position of the PoR stays the same in relation to other competing ports. Growth of world economy will generate an
increase in trade volumes. Therefore the number of containers that are handled in a port will increase as well.
The imbalance in trade causes empty containers flows. Regions with industrial activities produce products, of which a
certain part bound for export. Empty containers are needed to facilitate the export. On the other hand there are
consuming areas, which attract full containers and have a surplus in empty containers. The combination of supply and
demand of empty containers can be seen as a market (see figure 4.11). There are imbalances in time and space on this
empty container market, which causes need for storage and repositioning respectively.
[ConsuiTilnfti ^ I Suppjy_^B
Figure 4.11: Empty container market
There are three types of imbalances in trade, namely structural, conjunctural and temporal. The structural imbalance
occurs at the trade lane between Northwest Europe and the Far East and has its origin in the China Factor. The
structural imbalance is continuous on the middle-long term. Economical factors, such as the rate of the dollar, determine
the conjunctural imbalance, which relates to the global trade flows. The temporal imbalance entails the dynamics in time
of the demand for cargo. The focus will be on the temporal imbalances, because this has a direct effect on the
interregional planning. The effect of the temporal imbalance reflects in the interregional movements and the storage of
empties on one continent (Kijzerwaard e.a., 2003).
If there wouldn't be any imbalances there wouldn't be a need for storage or repositioning. It Is stimulated by
government and transporters /carriers to combine producing and consuming areas to reduce the need for repositioning.
But this is not always possible in practice.
The mismatch in space results in a need for transportation. This also takes up time and brings insecurity dependent on
the planning abilities of the transport operator. To keep the service quality high, late deliveries are not really accepted.
The situation described above occurs on a regional level, but also on a woridwide level. The movements from surplus to
deficit areas are a burden for the regional infrastructure and the sea transportation respectively.
The effect of the imttalances is illustrated in figure 4.12. If import and export is balances there would be no need for
traffic between the port and the depot (situation a). In case the export is exceeding the import empty containers need
to be imported (situation b). Situation c represents an container surplus. In general the latter situation is valid for the
PoR. But since the transport of containers is divided over different carriers, with their individual imbalance (also different
per container type) and their own clients, the actual situation is a combination of all three.
48
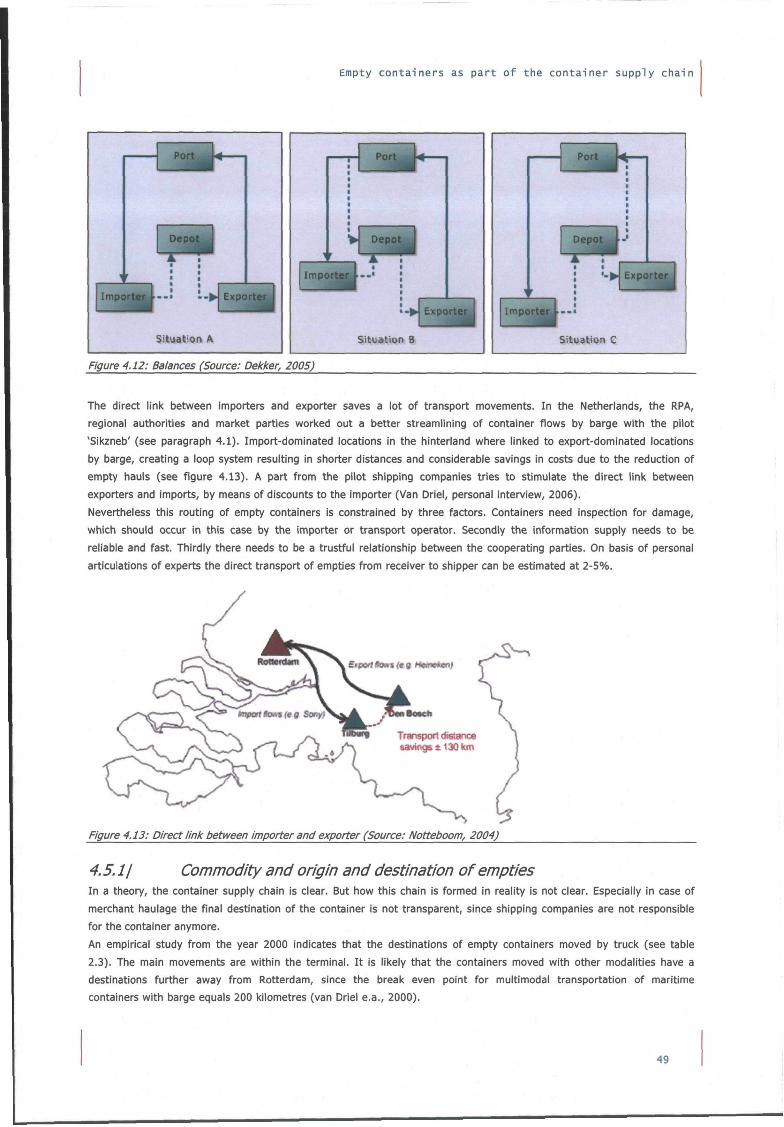
Empty containers as part of the container supply chain
1
• • : :
Situation A
Oei
•-^ Exports
Situation C
Figure 4.12: Balances (Source: Dekker, 2005)
The direct link between importers and exporter saves a lot of transport movements. In the Netherlands, the RPA,
regional authorities and market parties worked out a better streamlining of container flows by barge with the pilot
'Sikzneb' (see paragraph 4.1). Import-dominated locations in the hinteriand where linked to export-dominated locations
by barge, creating a loop system resulting in shorter distances and considerable savings in costs due to the reduction of
empty hauls (see figure 4.13). A part from the pilot shipping companies tries to stimulate the direct link between
exporters and imports, by means of discounts to the importer (Van Driel, personal interview, 2006).
Nevertheless this routing of empty containers is constrained by three factors. Containers need inspection for damage,
which should occur in this case by the importer or transport operator. Secondly the information supply needs to be
reliable and fast. Thirdly there needs to be a trustful relationship between the cooperating parties. On basis of personal
articulations of experts the direct transport of empties from receiver to shipper can be estimated at 2-5%.
Figure 4.13: Direct link between importer and exporter (Source: Notteboom, 2004)
4.5.11 Commodity and origin and destination of empties In a theory, the container supply chain is clear. But how this chain is formed in reality is not clear. Especially in case of
merchant haulage the final destination of the container is not transparent, since shipping companies are not responsible
for the container anymore.
An empirical study from the year 2000 indicates that the destinations of empty containers moved by truck (see table
2.3). The main movements are within the terminal. It is likely that the containers moved with other modalities have a
destinations further away from Rotterdam, since the break even point for multimodal transportation of maritime
containers with barge equals 200 kilometres (van Driel e.a., 2000).
49
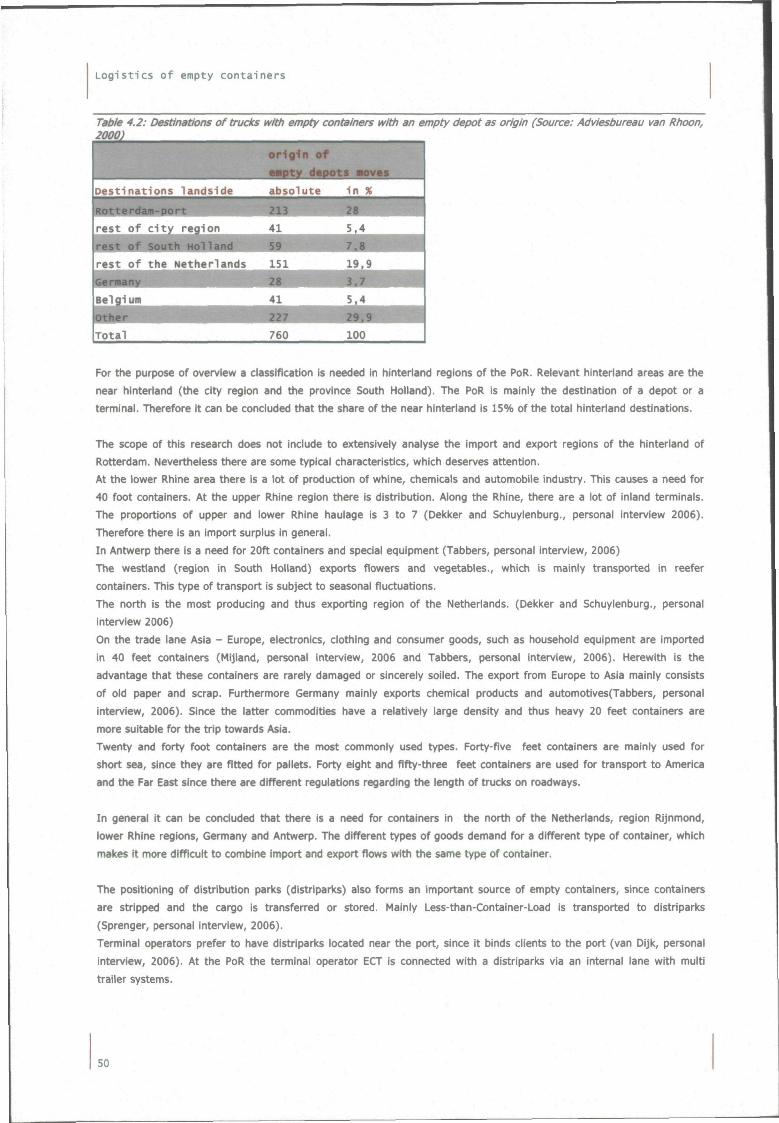
Logistics of empty containers
Table 4.2: Destinations of trucks with empty containers with an empty depot as origin (Source: Adviesbureau van Rhoon, 2000)
B origin of ^^
H H ^ ^ wpty depots aovcs H
Destinations landside absolute in %
rest of city region 41 5,4
rest of the Netherlands ISl 19.9
W « 1 w ^ ^ ^ ^ ^ ^ ^ ^ ^
Total
4 ^ ^ ^ ^
760
S j ^ ^ ^ ^ l
100 1
For the purpose of overview a classification is needed in hinteriand regions of the PoR. Relevant hinterland areas are the
near hinterland (the city region and the province South Holland). The PoR is mainly the destination of a depot or a
terminal. Therefore it can be concluded that the share of the near hinteriand is 15% of the total hinteriand destinations.
The scope of this research does not include to extensively analyse the import and export regions of the hinteriand of
Rotterdam. Nevertheless there are some typical characteristics, which deserves attention.
At the lower Rhine area there is a lot of production of whine, chemicals and automobile industry. This causes a need for
40 foot containers. At the upper Rhine region there is distribution. Along the Rhine, there are a lot of inland terminals.
The proportions of upper and lower Rhine haulage is 3 to 7 (Dekker and Schuylenburg., personal interview 2006).
Therefore there is an import surplus in general.
In Antwerp there is a need for 20ft containers and special equipment (Tabbers, personal interview, 2006)
The westiand (region in South Holland) exports flowers and vegetables., which is mainly transported in reefer
containers. This type of transport is subject to seasonal fluctuations.
The north is the most producing and thus exporting region of the Netheriands. (Dekker and Schuylenburg., personal
interview 2006)
On the trade lane Asia - Europe, electronics, clothing and consumer goods, such as household equipment are imported
in 40 feet containers (Mijland, personal interview, 2006 and Tabbers, personal interview, 2006). Herewith is the
advantage that these containers are rarely damaged or sincerely soiled. The export from Europe to Asia mainly consists
of old paper and scrap. Furthermore Germany mainly exports chemical products and automotives(Tabbers, personal
interview, 2006). Since the latter commodities have a relatively large density and thus heavy 20 feet containers are
more suitable for the trip towards Asia.
Twenty and forty foot containers are the most commonly used types. Forty-five feet containers are mainly used for
short sea, since they are fitted for pallets. Forty eight and fifty-three feet containers are used for transport to America
and the Far East since there are different regulations regarding the length of trucks on roadways.
In general it can be concluded that there is a need for containers in the north of the Netherlands, region Rijnmond,
lower Rhine regions, Germany and Antwerp. The different types of goods demand for a different type of container, which
makes it more difficult to combine Import and export fiows with the same type of container.
The positioning of distribution parks (distriparks) also forms an important source of empty containers, since containers
are stripped and the cargo is transferred or stored. Mainly Less-than-Container-Load is transported to distriparks
(Sprenger, personal interview, 2006).
Terminal operators prefer to have distriparks located near the port, since it binds clients to the port (van Dijk, personal
interview, 2006). At the PoR the terminal operator ECT is connected with a distriparks via an internal lane with multi
trailer systems.
SO
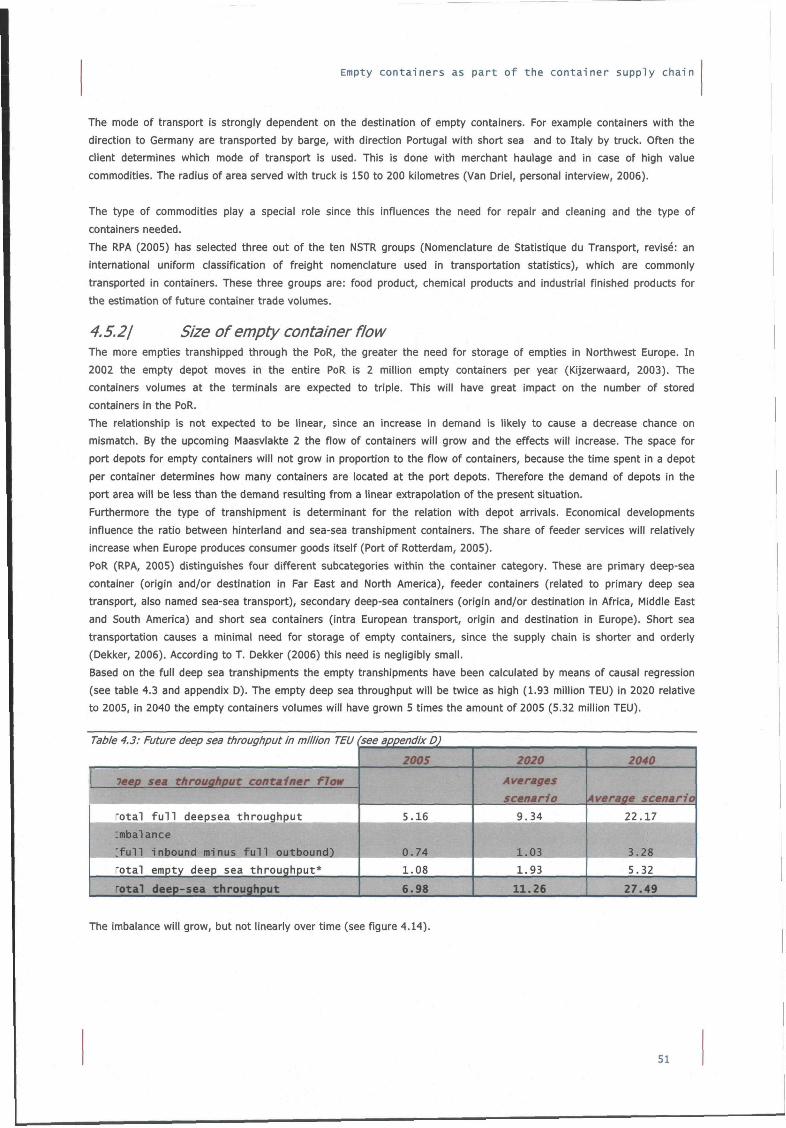
Empty containers as part of the container supply chain
The mode of transport is strongly dependent on the destination of empty containers. For example containers with the
direction to Germany are transported by barge, with direction Portugal with short sea and to Italy by truck. Often the
client determines which mode of transport is used. This is done with merchant haulage and in case of high value
commodities. The radius of area served with truck is 150 to 200 kilometres (Van Driel, personal interview, 2006).
The type of commodities play a special role since this influences the need for repair and cleaning and the type of
containers needed.
The RPA (2005) has selected three out of the ten NSTR groups (Nomenclature de Statistique du Transport, revise: an
international uniform classification of freight nomenclature used in transportation statistics), which are commonly
transported in containers. These three groups are: food product, chemical products and industrial finished products for
the estimation of future container trade volumes.
4.5.21 Size of empty container flow The more empties transhipped through the PoR, the greater the need for storage of empties in Northwest Europe. In
2002 the empty depot moves in the entire PoR is 2 million empty containers per year (Kijzerwaard, 2003). The
containers volumes at the terminals are expected to triple. This will have great impact on the number of stored
containers in the PoR.
The relationship is not expected to be linear, since an increase in demand is likely to cause a decrease chance on
mismatch. By the upcoming Maasvlakte 2 the flow of containers will grow and the effects will increase. The space for
port depots for empty containers will not grow in proportion to the flow of containers, because the time spent in a depot
per container determines how many containers are located at the port depots. Therefore the demand of depots in the
port area will be less than the demand resulting from a linear extrapolation of the present situation.
Furthermore the type of transhipment is determinant for the relation with depot arrivals. Economical developments
influence the ratio between hinteriand and sea-sea transhipment containers. The share of feeder services will relatively
increase when Europe produces consumer goods itself (Port of Rotterdam, 2005).
PoR (RPA, 2005) distinguishes four different subcategories within the container category. These are primary deep-sea
container (origin and/or destination in Far East and North America), feeder containers (related to primary deep sea
transport, also named sea-sea transport), secondary deep-sea containers (origin and/or destination in Africa, Middle East
and South America) and short sea containers (intra European transport, origin and destination in Europe). Short sea
transportation causes a minimal need for storage of empty containers, since the supply chain is shorter and orderiy
(Dekker, 2006). According to T. Dekker (2006) this need is negligibly small.
Based on the full deep sea transhipments the empty transhipments have been calculated by means of causal regression
(see table 4.3 and appendix D). The empty deep sea throughput will be twice as high (1.93 million TEU) in 2020 relative
to 2005, in 2040 the empty containers volumes will have grown 5 times the amount of 2005 (5,32 million TEU).
Table 4.3: Future deep sea throughput in million TEU
1 7eep sea throughput container flow ^ , ^^^m,
rotal f u l l deepsea throughput
[ f u l l inbound minus f u l l outbound)
rotal empty deep sea throughput*
E rotal deep-sea throughput
''see appendix D)
2005
5.16
0.74
1.08
6.98
2020
Averages
scenario
9.34
1.03^^H 1.93
11.26
2040
Average scenario
22.17
• 3.28 5.32
27.49
The imbalance will grow, but not lineariy over time (see figure 4.14).
51
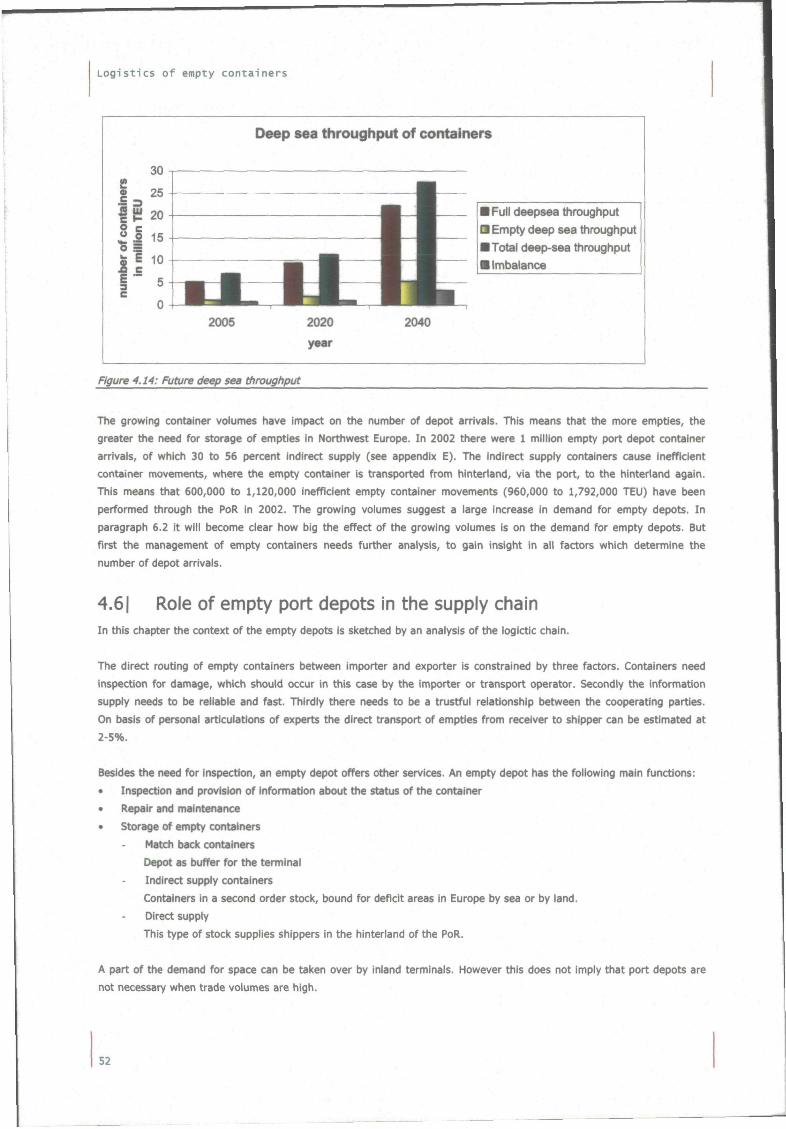
Logistics of empty containers
Deep sea throughput of containers
I Full deepsea throughput
I Empty deep sea throughput
I Total deep-sea throughput
I Imbalance
2006 2020
year
2040
Figure 4.14: Future deep sea throughput
The growing container volumes have impact on the number of depot arrivals. This means that the more empties, the
greater the need for storage of empties in Northwest Europe. In 2002 there were 1 million empty port depot container
arrivals, of which 30 to 56 percent indirect supply (see appendix E). The indirect supply containers cause inefficient
container movements, where the empty container is transported from hinteriand, via the port, to the hinteriand again.
This means that 600,000 to 1,120,000 inefficient empty container movements (960,000 to 1,792,000 TEU) have been
performed through the PoR in 2002. The growing volumes suggest a large increase in demand for empty depots. In
paragraph 6.2 it will become clear how big the effect of the growing volumes is on the demand for empty depots. But
first the management of empty containers needs further analysis, to gain insight in ail factors which determine the
number of depot arrivals.
4.61 Role of empty port depots in the supply chain In this chapter the context of the empty depots is sketched by an analysis of the iogictic chain.
The direct routing of empty containers between importer and exporter is constrained by three factors. Containers need
inspection for damage, which should occur in this case by the importer or transport operator. Secondly the information
supply needs to be reliable and fast. Thirdly there needs to be a trustful relationship between the cooperating parties.
On basis of personal articulations of experts the direct transport of empties from receiver to shipper can be estimated at
2-5%.
Besides the need for inspection, an empty depot offers other services. An empty depot has the following main functions:
• Inspection and provision of information about the status of the container
• Repair and maintenance
• Storage of empty containers
Match back containers
Depot as buffer for the terminal
Indirect supply containers
Containers in a second order stock, bound for deficit areas in Europe by sea or by land.
Direct supply
This type of stock supplies shippers in the hinterland of the PoR.
A part of the demand for space can be taken over by inland terminals. However this does not imply that port depots are
not necessary when trade volumes are high.
52
Empty containers as part of the container supply chain
Shipping companies are the central actor in the positioning of empty containers. The difference in type of haulage
determines the type of depot used. Furthermore the difference in function (repair activities in the port area) and the
geographical location (supply of region Rotterdam) is also a limiting factor In the possibility for an inland depot to be a
substitute for a port depot.
Transport operators from a smaller, but not less important role in the transport of empty containers, since they need to
be able to efficiently combine trips. Inland terminals can be used as a substitute for port depots to a certain degree.
The gradual flow of the future container flow, complicate the planning task of the RPA. Empty containers are in the
starting phase of a new terminal stored at the terminal. This retreats the moment at which a critical mass is reached for
operators to profitable exploit a depot, in the highly competitive environment.
A connection of a depot with the terminal is logistical efficient.
Regarding the amount of inefficient empty container movements, there seems to be an opportunity for transport
savings. In 2002, 600,000 to 1,120,000 inefficient empty container movements (960,000 to 1,792,000 TEU) have been
performed through the PoR. The empty deep sea throughput will be twice as high (1.93 million TEU) in 2020 relative to
2005, in 2040 the empty containers volumes will have grown 5 times the amount of 2005 (5.32 million TEU). Based on
these predictions one would expect an enormous amount of empty container movements and thus a great opportunity
for savings, by making use of inland terminals.
Despite the fact that the shipping companies would also benefit from these potential savings, there are restrictions to
this opportunity. A few restrictions have already been mentioned (the type of haulage, difference in depot activities and
the combination of trips). Further analysis of the characteristics of the empty container management is needed, to
identify the reasons for preference of a port depot above a inland depot, by doing so the demand of empty depots in the
port area will become clear.
53

Logistics of empty containers
54
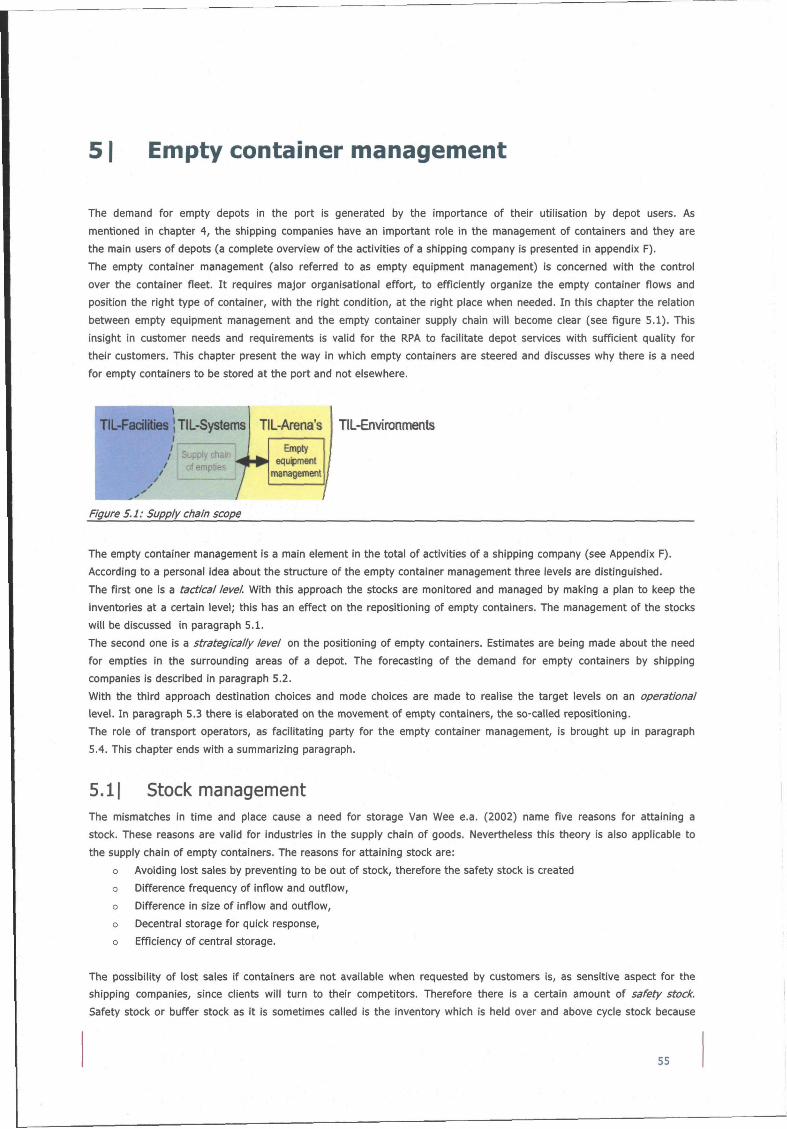
51 Empty container management
The demand for empty depots in the port is generated by the importance of their utilisation by depot users. As
mentioned in chapter 4, the shipping companies have an important role in the management of containers and they are
the main users of depots (a complete overview of the activities of a shipping company is presented in appendix F).
The empty container management (also referred to as empty equipment management) is concerned with the control
over the container fleet. It requires major organisational effort, to efficiently organize the empty container flows and
position the right type of container, with the right condition, at the right place when needed. In this chapter the relation
between empty equipment management and the empty container supply chain will become clear (see figure 5.1). This
insight in customer needs and requirements is valid for the RPA to facilitate depot services with sufficient quality for
their customers. This chapter present the way in which empty containers are steered and discusses why there is a need
for empty containers to be stored at the port and not elsewhere.
TIL-Facilities | TIL-Systems
k Supply chain of empties P
Empty equipment
management
TIL-Arena's TIL-Environments
Figure 5.1: Supply chain scope
The empty container management is a main element in the total of activities of a shipping company (see Appendix F).
According to a personal idea about the structure of the empty container management three levels are distinguished.
The first one is a tactical level With this approach the stocks are monitored and managed by making a plan to keep the
inventories at a certain level; this has an effect on the repositioning of empty containers. The management of the stocks
will be discussed in paragraph 5.1.
The second one is a strategically level on the positioning of empty containers. Estimates are being made about the need
for empties in the surrounding areas of a depot. The forecasting of the demand for empty containers by shipping
companies is described in paragraph 5.2.
With the third approach destination choices and mode choices are made to realise the target levels on an operational
level. In paragraph 5.3 there is elaborated on the movement of empty containers, the so-called repositioning.
The role of transport operators, as facilitating party for the empty container management, is brought up in paragraph
5.4. This chapter ends with a summarizing paragraph.
5.11 Stock management The mismatches in time and place cause a need for storage Van Wee e.a. (2002) name five reasons for attaining a
stock. These reasons are valid for industries in the supply chain of goods. Nevertheless this theory is also applicable to
the supply chain of empty containers. The reasons for attaining stock are:
o Avoiding lost sales by preventing to be out of stock, therefore the safety stock is created
Difference frequency of inflow and outflow,
Difference in size of inflow and outflow,
Decentral storage for quick response,
Efficiency of central storage.
The possibility of lost sales if containers are not available when requested by customers is, as sensitive aspect for the
shipping companies, since clients will turn to their competitors. Therefore there is a certain amount of safety stock.
Safety stock or buffer stock as it is sometimes called is the inventory which is held over and above cycle stock because
55
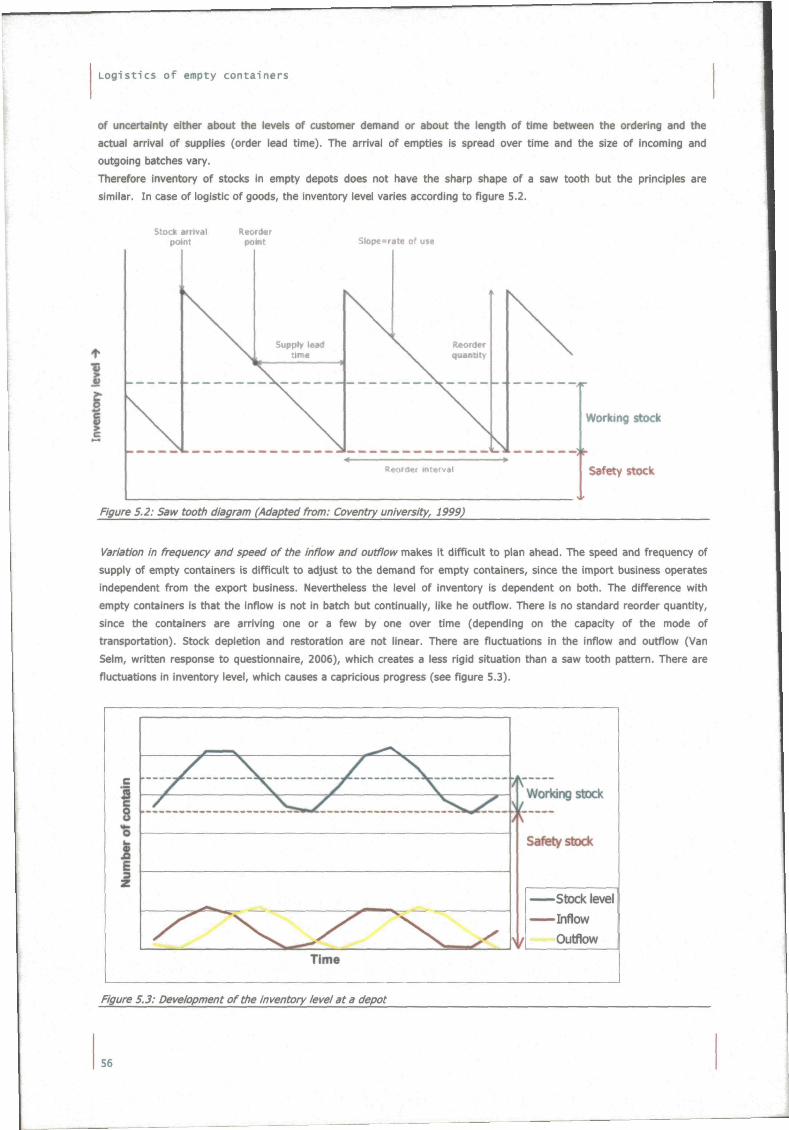
Logistics of empty containers
of uncertainty either about the levels of customer demand or about the length of time between the ordering and the
actual arrival of supplies (order lead time). The arrival of empties is spread over time and the size of incoming and
outgoing batches vary.
Therefore inventory of stocks in empty depots does not have the sharp shape of a saw tooth but the principles are
similar. In case of logistic of goods, the inventory level varies according to figure 5.2.
Stixni arrtv*! point
RMTdir Stepcarata of u n
I e
\
Supply toad tMna
\ '
r
\ \ Itaortfar
\ «MMky
X
.
\
S Raofder Intarval
K i r
\
— 4
Working Stock
Safety stock
Figure 5.2: Saw tooth diagram (Adapted from: Coventry university, 1999)
Variation in frequency and speed of the inflow and outflow makes it difficult to plan ahead. The speed and frequency of
supply of empty containers is difficult to adjust to the demand for empty containers, since the import business operates
independent from the export business. Nevertheless the level of inventory is dependent on both. The difference with
empty containers is that the infiow is not in batch but continually, like he outflow. There is no standard reorder quantity,
since the containers are arriving one or a few by one over time (depending on the capacity of the mode of
transportation). Stock depletion and restoration are not linear. There are fluctuations in the inflow and outflow (Van
Selm, written response to questionnaire, 2006), which creates a less rigid situation than a saw tooth pattern. There are
fluctuations in inventory level, which causes a capricious progress (see figure 5.3).
Working stock
-Stock level
-Inflow
Outflow
Time
Figure 5.3: Development of the inventory level at a depot
56
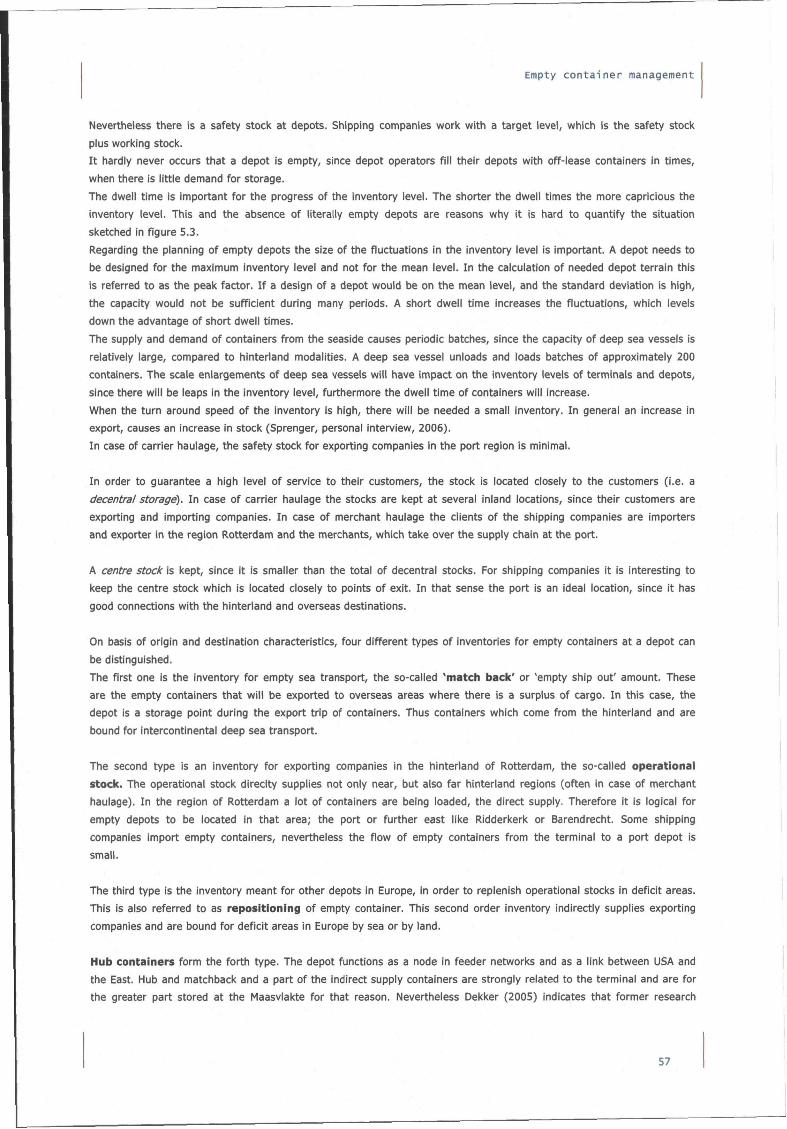
Empty container management
Nevertheless there is a safety stock at depots. Shipping companies work with a target level, which is the safety stock
plus working stock.
It hardly never occurs that a depot is empty, since depot operators fill their depots with off-lease containers in times,
when there is little demand for storage.
The dwell time is important for the progress of the inventory level. The shorter the dwell times the more capricious the
inventory level. This and the absence of literally empty depots are reasons why it is hard to quantify the situation
sketched in figure 5.3.
Regarding the planning of empty depots the size of the fluctuations in the inventory level is important. A depot needs to
be designed for the maximum inventory level and not for the mean level. In the calculation of needed depot terrain this
is referred to as the peak factor. If a design of a depot would be on the mean level, and the standard deviation is high,
the capacity would not be sufficient during many periods. A short dwell time increases the fluctuations, which levels
down the advantage of short dwell times.
The supply and demand of containers from the seaside causes periodic batches, since the capacity of deep sea vessels is
relatively large, compared to hinteriand modalities. A deep sea vessel unloads and loads batches of approximately 200
containers. The scale enlargements of deep sea vessels will have impact on the inventory levels of terminals and depots,
since there will be leaps in the inventory level, furthermore the dwell time of containers will increase.
When the turn around speed of the inventory is high, there will be needed a small inventory. In general an increase in
export, causes an increase in stock (Sprenger, personal interview, 2006).
In case of carrier haulage, the safety stock for exporting companies in the port region is minimal.
In order to guarantee a high level of service to their customers, the stock is located closely to the customers (i.e. a
decentral storage). In case of carrier haulage the stocks are kept at several inland locations, since their customers are
exporting and importing companies. In case of merchant haulage the clients of the shipping companies are importers
and exporter in the region Rotterdam and the merchants, which take over the supply chain at the port.
A centre stock is kept, since it is smaller than the total of decentral stocks. For shipping companies it is interesting to
keep the centre stock which is located closely to points of exit. In that sense the port is an ideal location, since it has
good connections with the hinteriand and overseas destinations.
On basis of origin and destination characteristics, four different types of inventories for empty containers at a depot can
be distinguished.
The first one is the inventory for empty sea transport, the so-called 'match back' or 'empty ship out' amount. These
are the empty containers that will be exported to overseas areas where there is a surplus of cargo. In this case, the
depot is a storage point during the export trip of containers. Thus containers which come from the hinterland and are
bound for intercontinental deep sea transport.
The second type is an inventory for exporting companies in the hinterland of Rotterdam, the so-called operational stock. The operational stock direclty supplies not only near, but also far hinterland regions (often in case of merchant
haulage). In the region of Rotterdam a lot of containers are being loaded, the direct supply. Therefore it is logical for
empty depots to be located in that area; the port or further east like Ridderkerk or Barendrecht. Some shipping
companies import empty containers, nevertheless the flow of empty containers from the terminal to a port depot is
small.
The third type is the inventory meant for other depots in Europe, in order to replenish operational stocks in deficit areas.
This is also referred to as repositioning of empty container. This second order inventory indirectiy supplies exporting
companies and are bound for deficit areas in Europe by sea or by land.
Hub containers form the forth type. The depot functions as a node in feeder networks and as a link between USA and
the East. Hub and matchback and a part of the indirect supply containers are strongly related to the terminal and are for
the greater part stored at the Maasvlakte for that reason. Nevertheless Dekker (2005) indicates that former research
57
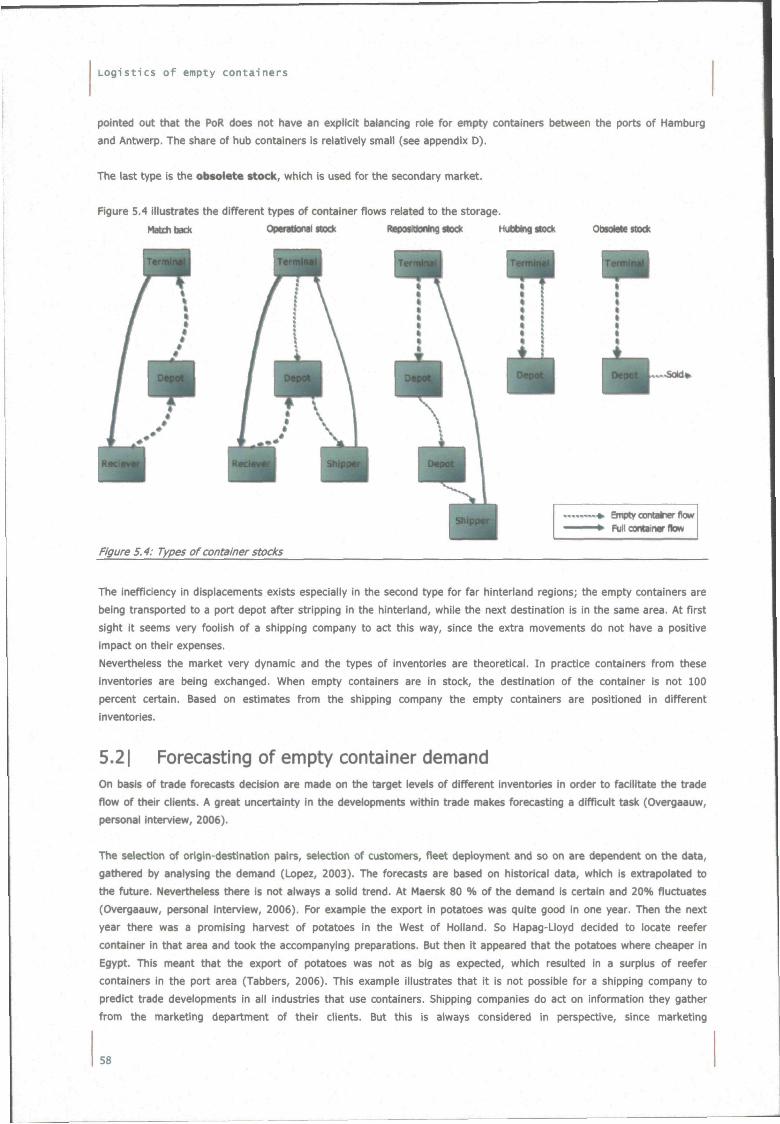
Logistics of empty containers
pointed out that the PoR does not have an explicit balancing role for empty containers between the ports of Hamburg
and Antwerp. The share of hub containers is relatively small (see appendix D).
The last type is the obsolete stock, which is used for the secondary market.
Figure 5.4 illustrates the different types of container fiows related to the storage.
Matchback Operational stock Repositioning slock HuMtng stock OtJsoWie stock
..SQkl»
^ ^ ^ ^ _ . — . — • — ^ - . uiWRv vonmmWiVKmf PullcanWfMrflOM
Figure 5.4: Types of container stocks
The inefficiency in displacements exists especially in the second type for far hinterland regions; the empty containers are
being transported to a port depot after stripping in the hinteriand, while the next destination is in the same area. At first
sight it seems very foolish of a shipping company to act this way, since the extra movements do not have a positive
impact on their expenses.
Nevertheless the market very dynamic and the types of inventories are theoretical. In practice containers from these
inventories are being exchanged. When empty containers are in stock, the destination of the container is not 100
percent certain. Based on estimates from the shipping company the empty containers are positioned in different
inventories.
5.21 Forecasting of empty container demand On basis of trade forecasts decision are made on the target levels of different inventories in order to facilitate the trade
flow of their clients. A great uncertainty in the developments within trade makes forecasting a difficult task (Overgaauw,
personal interview, 2006).
The selection of origin-destination pairs, selection of customers, fieet deployment and so on are dependent on the data,
gathered by analysing the demand (Lopez, 2003). The forecasts are based on historical data, which is extrapolated to
the future. Nevertheless there is not always a solid trend. At Maersk 80 % of the demand is certain and 20% fiuctuates
(Overgaauw, personal interview, 2006). For example the export in potatoes was quite good in one year. Then the next
year there was a promising harvest of potatoes in the West of Holland. So Hapag-Lloyd decided to locate reefer
container in that area and took the accompanying preparations. But then it appeared that the potatoes where cheaper in
Egypt. This meant that the export of potatoes was not as big as expected, which resulted in a surplus of reefer
containers in the port area (Tabbers, 2006). This example illustrates that it is not possible for a shipping company to
predict trade developments in all industries that use containers. Shipping companies do act on information they gather
from the marketing department of their clients. But this is always considered in perspective, since marketing
58
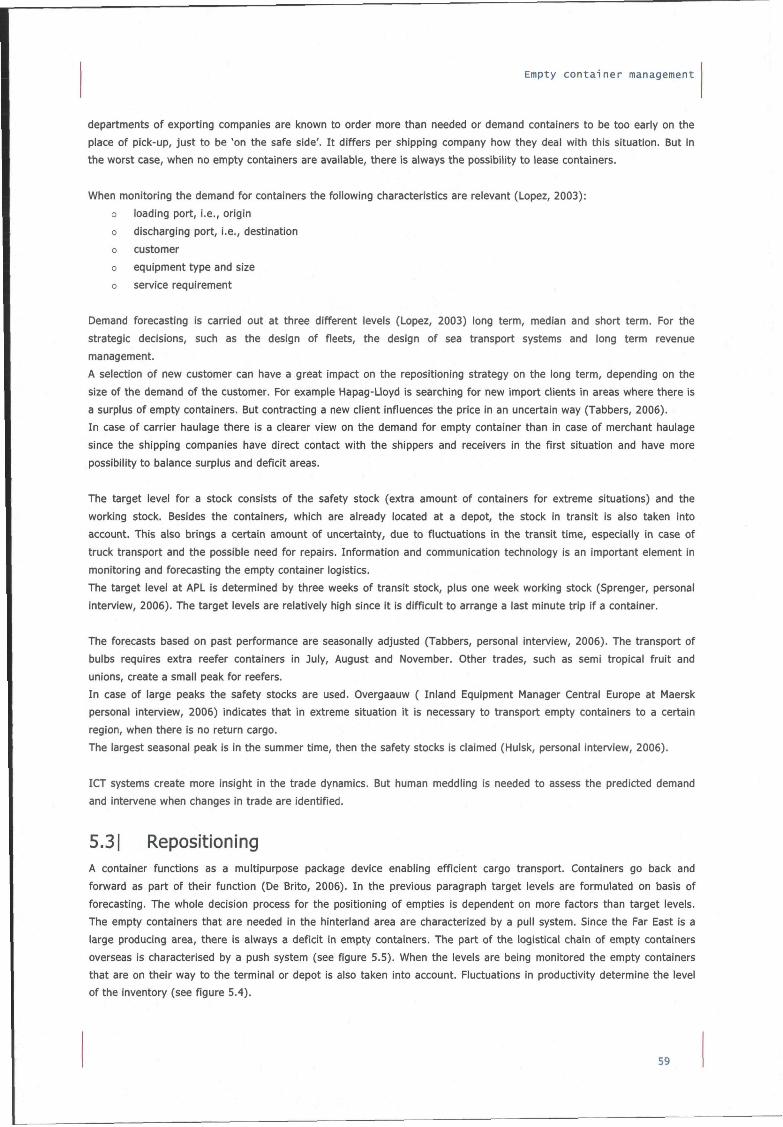
Empty container management
departments of exporting companies are known to order more than needed or demand containers to be too eariy on the
place of pick-up, just to be 'on the safe side'. It differs per shipping company how they deal with this situation. But in
the worst case, when no empty containers are available, there is always the possibility to lease containers.
When monitoring the demand for containers the following characteristics are relevant (Lopez, 2003):
0 loading port, i.e., origin
o discharging port, i.e., destination
0 customer
o equipment type and size
o service requirement
Demand forecasting is carried out at three different levels (Lopez, 2003) long term, median and short term. For the
strategic decisions, such as the design of fleets, the design of sea transport systems and long term revenue
management.
A selection of new customer can have a great impact on the repositioning strategy on the long term, depending on the
size of the demand of the customer. For example Hapag-Lloyd is searching for new import clients in areas where there is
a surplus of empty containers. But contracting a new client influences the price in an uncertain way (Tabbers, 2006).
In case of carrier haulage there is a clearer view on the demand for empty container than in case of merchant haulage
since the shipping companies have direct contact with the shippers and receivers in the first situation and have more
possibility to balance surplus and deficit areas.
The target level for a stock consists of the safety stock (extra amount of containers for extreme situations) and the
working stock. Besides the containers, which are already located at a depot, the stock in transit is also taken into
account. This also brings a certain amount of uncertainty, due to fiuctuations in the transit time, especially in case of
truck transport and the possible need for repairs. Information and communication technology is an important element in
monitoring and forecasting the empty container logistics.
The target level at APL is determined by three weeks of transit stock, plus one week working stock (Sprenger, personal
interview, 2006). The target levels are relatively high since it is difficult to arrange a last minute trip if a container.
The forecasts based on past performance are seasonally adjusted (Tabbers, personal interview, 2006). The transport of
bulbs requires extra reefer containers in July, August and November. Other trades, such as semi tropical fruit and
unions, create a small peak for reefers.
In case of large peaks the safety stocks are used. Overgaauw ( Inland Equipment Manager Central Europe at Maersk
personal interview, 2006) indicates that in extreme situation it is necessary to transport empty containers to a certain
region, when there is no return cargo.
The largest seasonal peak is in the summer time, then the safety stocks is claimed (Hulsk, personal interview, 2006).
ICT systems create more insight in the trade dynamics. But human meddling is needed to assess the predicted demand
and intervene when changes in trade are identified.
5.31 Repositioning A container functions as a multipurpose package device enabling efficient cargo transport. Containers go back and
forward as part of their function (De Brito, 2006). In the previous paragraph target levels are formulated on basis of
forecasting. The whole decision process for the positioning of empties is dependent on more factors than target levels.
The empty containers that are needed in the hinterland area are characterized by a pull system. Since the Far East is a
large producing area, there is always a deficit in empty containers. The part of the logistical chain of empty containers
overseas is characterised by a push system (see figure 5.5). When the levels are being monitored the empty containers
that are on their way to the terminal or depot is also taken into account. Fluctuations in productivity determine the level
of the inventory (see figure 5.4).
59
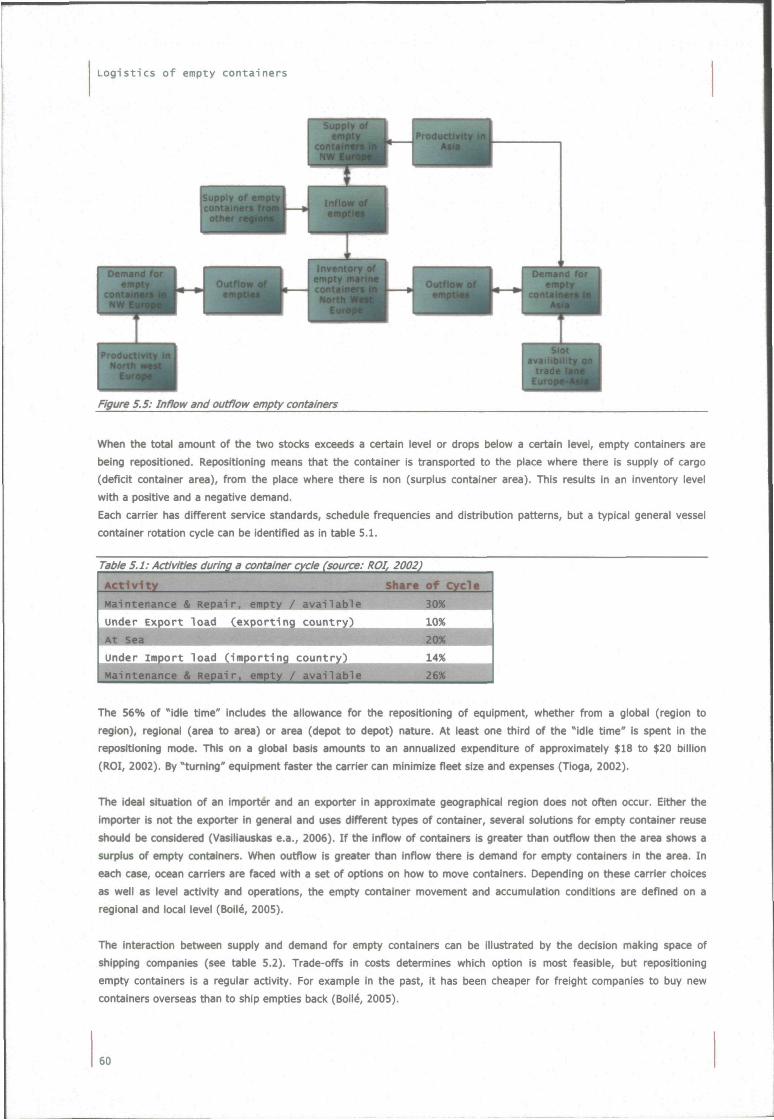
Logistics of empty containers
Figure 5.5: Inflow and outflow empty containers
When the total amount of the two stocks exceeds a certain level or drops below a certain level, empty containers are being repositioned. Repositioning means that the container is transported to the place where there is supply of cargo
(deficit container area), from the place where there is non (surplus container area). This results in an inventory level
with a positive and a negative demand.
Each carrier has different service standards, schedule frequencies and distribution patterns, but a typical general vessel
container rotation cycle can be identified as in table 5.1.
Taftfe 5.1: AcO^Oes during a container cycle (source: ROI, 2002)
Activi ty share of Cycle
The 56% of "idle time" includes the allowance for the repositioning of equipment, whether from a global (region to
region), regional (area to area) or area (depot to depot) nature. At least one third of the "idle time" is spent In the repositioning mode. This on a global basis amounts to an annualized expenditure of approximately $18 to $20 billion
(ROI, 2002). By "turning" equipment faster the carrier can minimize fleet size and expenses (Tioga, 2002).
The ideal situation of an importer and an exporter in approximate geographical region does not often occur. Either the
importer is not the exporter in general and uses different types of container, several solutions for empty container reuse
should be considered (Vasiliauskas e.a., 2006). If the inflow of containers is greater than outflow then the area shows a
surplus of empty containers. When outflow is greater than inflow there is demand for empty containers in the area. In
each case, ocean carriers are faced with a set of options on how to move containers. Depending on these carrier choices
as well as level activity and operations, the empty container movement and accumulation conditions are defined on a
regional and local level (Boilé, 2005).
The interaction between supply and demand for empty containers can be illustrated by the decision making space of
shipping companies (see table 5.2). Trade-offs in costs determines which option is most feasible, but repositioning
empty containers is a regular activity. For example in the past, it has been cheaper for freight companies to buy new
containers overseas than to ship empties back (Boilé, 2005).
60
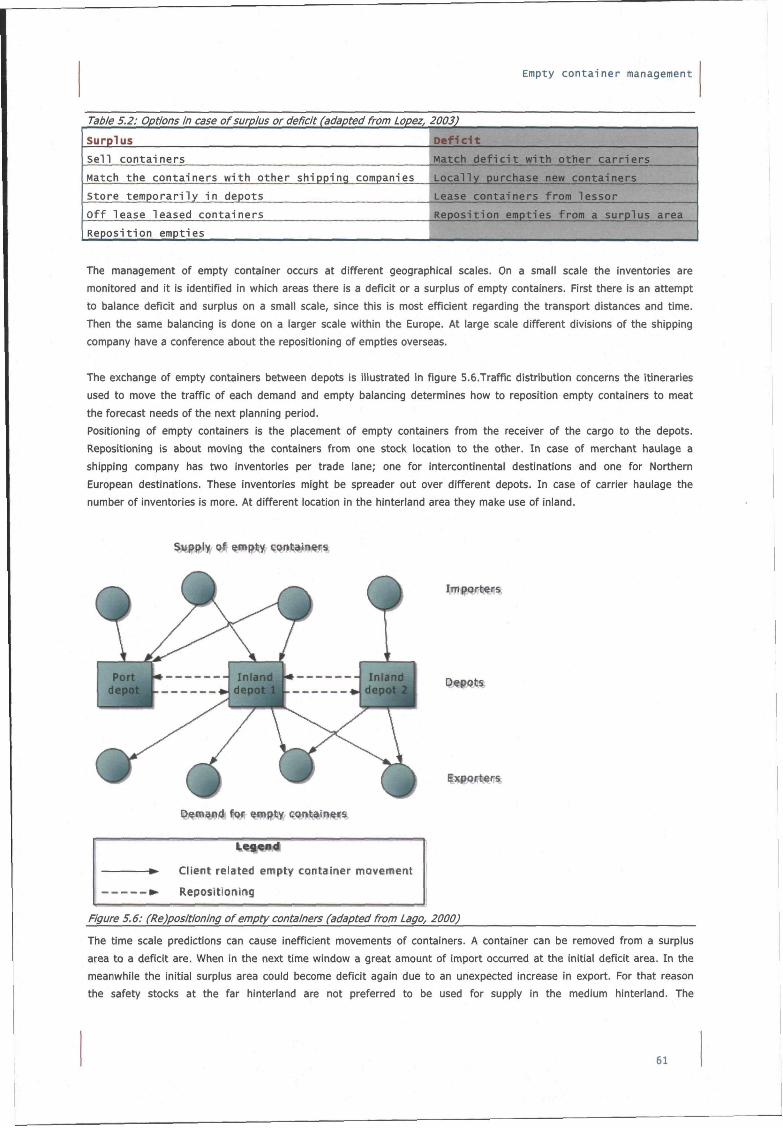
Empty container management
Table 5.2: Options in case
Surplus
se l l containers
Match the containers
Store temporari ly in
of surplus or deficit (adapted from Lopez, 2003)
wi th other
depots
Off lease leased containers
Reposition empties
shipping companies
Def ic i t
Match d e f i c i t wi
Local ly purchase
Lease containers
t h other car r ie rs
new containers
f
Reposition empties
-om lessor
from a surplus area
The management of empty container occurs at different geographical scales. On a small scale the inventories are
monitored and it is identified in which areas there is a deficit or a surplus of empty containers. First there is an attempt
to balance deficit and surplus on a small scale, since this is most efficient regarding the transport distances and time.
Then the same balancing is done on a larger scale within the Europe. At large scale different divisions of the shipping
company have a conference about the repositioning of empties overseas.
The exchange of empty containers between depots is illustrated in figure 5.6.Trafnc distribution concerns the itineraries
used to move the traffic of each demand and empty balancing determines how to reposition empty containers to meat
the forecast needs of the next planning period.
Positioning of empty containers is the placement of empty containers from the receiver of the cargo to the depots.
Repositioning is about moving the containers from one stock location to the other. In case of merchant haulage a
shipping company has two inventories per trade lane; one for intercontinental destinations and one for Northern
European destinations. These inventories might be spreader out over different depots. In case of carrier haulage the
number of inventories is more. At different location in the hinteriand area they make use of inland.
^««My of empty contain^s*
Importeif*
DepotMf,
in f iwf**^
gi^fffg^d for empty cortOiners
Client related empty container movement
Repositiorting
Figure 5.6: (Re)positioning of empty containers (adapted from Lago, 2000)
The time scale predictions can cause inefficient movements of containers. A container can be removed from a surplus
area to a deficit are. When in the next time window a great amount of import occurred at the initial deficit area. In the
meanwhile the initial surplus area could become deficit again due to an unexpected increase in export. For that reason
the safety stocks at the far hinterland are not preferred to be used for supply in the medium hinterland. The
61
Logist ics of empty containers
transportation costs involved in replenishing the stocks in the far hinteriand are higher than the transportation costs
from the port to the medium hinteriand. This example accentuates the role of a port depot as centre stock.
Nevertheless it does not often occur in case of carrier haulage, in contrary to merchant haulage. Then merchants are not
using any storage areas and use the container for a one way trip.
The decision process can be illustrated according to the algorithm in appendix G. It illustrates the complexity of handling
with demand and supply at different locations.
The information supplied by depot operators about the status of their containers is important for the decision making of
the shipping companies. In addition the flexibility and the costs, involved in repositioning are important.
5.3.11 International repositioning In case it is decided that the containers need repositioning overseas, the availability of capacity of the vessel needs to
be investigated. In general a vessel needs to be "full and down" (Van Driel, personal interview, 2006), i.e. the volume
and weight capacity of a vessel is fully exploited. The stowage of a vessel requires special attention regarding the
following vessel balancing aspects (Sprenger, personal Interview, 2006):
o Ship attitude (draft/air draft, list/trim)
o Ship forces (bend (hog or sag), torsion, shear)
o Cargo forces (lashing forces)
Empty containers are often positioned at the top and at the outer bays, to balance the vessel and to minimize the risk of
loosing containers at the ocean, due to dash of the waves.
Generally there is enough capacity for empty containers, since the inbound containers have a larger weight than the
outbound containers. Forty eight hours in advance of a departure of a deep sea vessel the available space for empty
containers is known (Overgaauw, personal interview, 2006).
The sailing schedule of the vessels is factor which limits the possibilities for empty deep sea transport. Because the
empty containers are placed on top It is advantageous to stow them at the last or penultimate port of call (Sprenger,
personal interview, 2006). In case the time for stowage of containers is smaller than expected the stowage of empty
containers is cancelled flrst (Sprenger, personal interview, 2006).
In consequence of strikes and bad weather conditions, such as fog and storm, there is a delay of maximal 100 to 150
hours per year (Dekker, personal interview, 2006). This delay is not significant.
Empty containers wait maximally 8 days on a slot on a deep sea vessel.
In the Far East the demand for empty containers is larger than in Europe, except for the secondary market of used
containers. It is logistical efficient to place empty container at the ports in the Far East. Nevertheless that is not
financial efficient. While rates in the peak direction are at a high level. In the opposite direction they are substantially
lower, caused by the high demand for empty containers in the opposite direction (Boilé, 2005). In 2005 a container trip
form Europe to Asia was 850 dollar and the trip from Asia to Europe 1750 dollar (Containerisation Intemational, April
2006). This rate imbalance and the need to reposition empty containers back to Asia, especially China, creates another
problem. The highest storage charges are increasingly incurred in the areas of strongest demand, such as Hong Kong,
South Korea and many coastal locations in China (Boilé, 2005). These same costs are generally lower in Europe, where
the secondary market for containers is also better developed. Thus, shipping companies have a choice: to reposition
their idle containers into more expensive, but higher demand areas in Asia, or leave them in cheaper locations, where
the best option may be to sell.
It is preferable to positioning empty containers at a port in Northwest Europe, in shipping terms match back, in order to
promptiy reposition the containers to the Far East when needed. Locating these containers at an inland terminal or
depot extends the transit time of a container from Europe to the Far East.
62
Empty container management
5.3.21 Port of Rotterdam as empty container hub The role of the PoR as hub for empty containers is contributing the depot arrivals, especially for depots located at the
Maasvlakte. From the figures of the RPA (2005), the importance of the PoR as overseas hub for empty containers cannot
be derived (see appendix E). Nevertheless shipping companies indicate that there is a significant amount of containers
transported from the USA to Asia via Rotterdam.
The trade lane between the America and Rotterdam is moderately balanced. But vessels calling at America are narrower
than vessels on the trade lane Europe-Asia, Regarding the economies of scale, it is cost efficient to transport containers
via Rotterdam (Sprenger, personal interview, 2006). Another advantage is that it is possible to import empty containers,
when there is a demand in the hinteriand of the PoR (Overgaauw, personal interview, 2006). Two of the questioned
shipping companies (APL and Evergreen) indicate that this concerns a few hundred containers per week.
In principle sea-sea transhipment containers are not transported to the depot (Tabbers, personal interview, 2006). Since
the empty containers are checked at the port of departure, there is generally no need for inspection. Furthermore the
dwell time is relatively short. In addition the transport from the terminal to the depot involves extra costs, although the
transportation via an internal lane is not registered as import.
Furthermore feeder services transport a significant amount of empty containers. The RPA identifies that there is an
exchange of empties between the terminal and the depot in case of feeder services (Dekker, personal interview, 2006).
But the connection with the deep sea vessels is closely monitored and therefore the feeder containers are minimally
stored at depots (van Dijk, personal interview, 2006).
Generally there are three (e.g. Maersk) to five ports (e.g. Evergreen) of call in one region (Baird, 2005).The hubbing
degree (which provides a lowest cost solution) tends to be route specific, and is therefore difficult to generalise for all
trades. It is a trade off between feeding and extra handling costs and the extra costs of calling at an additional port.
The hub function of empty depots at the PoR is minimal in the current situation. Nevertheless, several major carriers and
alliances busily select new transhipment hubs and call at these hubs with ever-larger vessels (Baird, 2005).
5.3.31 Repositioning strategies Each shipping company has its own strategy towards repositioning, depending on their company values. The differences
in strategies make it difficult to create an overall picture of quantitative empty container flows. From the parties that
have been interviewed four typologies can be derived (see appendix H).
o Empty importer (based on Hapag Lloyd) imports empty containers. Despite the imbalance there is a deficit area
for empty containers
o The merchant (based on Evergreen) has little insight in the total supply chain.
o Giant (based on Maersk) has a lot of control on hinteriand transportation and is strict in scheduling.
o High value empties (based on APL) prefers to treat empties with same priority as loaded containers
o Intelligent communicator (based on OOCL) focuses on efficient communication systems
Sometimes semi empty transport is used to prevent empty transport (Dekker and Schuylenburg., personal interview
2006). For example paper and scrap are transported to Asia. The shipment of low value goods generates just enough
revenue to cover the handling costs in Asia (Tabbers, personal interview, 2006).
Nevertheless the distances in Asia are large and the low value goods are not always demanded at the same region as
the empty container, which causes extra movements and thus extra costs and time. Often it is not lucrative for a
shipping company to exploit semi empty transport.
Furthermore there is another insecurity involved in stuffing the container in Europe. Therefore it does not reduce the
need for empty container storage.
5.4| Transport operations Empty equipment management primarily focuses on equipment transportation optimization and matching opportunities. The transport operations are described according to the matchability and routing.
63
Logist ics of empty containers
Regarding the expected modal shift, the truck operators will only loose relative market share, but maintain the alisolute
market share. In other words the extra volumes are to be shifted to other modalities. In consequence it is not expected
that truck operators will not obstruct the modal shift (Dekker and Schuylenburg., personal interview 2006).
5.4.11 Matchability A mismatch in time and space develops a need for storage (Dekker, 2006). Dekker aimed at the match between empty
container and cargo. But there are more matches needed in order to realise a smooth container supply chain. The
degree in, which there is a possibility to make a match, is an indication of the need for storage. As per personal idea,
this concept is referred to as matchability; in other words the chance to make a match. Consequentiy three types of
matchabilities should be distinguished;
• Matchability between cargo and empty container
• Matchability between empty container and sea vessel
• Matchability between empty container and hinteriand transportation mode.
Matchability between full containers and their transportation mode can also be an issue in the container supply chain.
But since this research focus on the empty container this is beyond the scope. Besides the urgency of full containers is
much higher than for empty ones, since they have a higher value.
The matchability between cargo and the empty container has been discussed in paragraph 5.2. Fluctuations in trade hold
back probable matches. Furthermore the type of the container has to match with the type of cargo and the ownership of
the container needs comply with the approached shipping company, for the cargo transport.
ICT moderates the matchability and created chances for exchanging empty containers. For example Hapag Lloyd uses a
Freight Information System for optimal combinations between cargo and containers. The system indicates which
container is best to be used in a certain demand situation. It is mostiy used for advice on distance (Tabbers, personal
interview, 2006).
There are also ICT systems which moderate matchability by of cargo and containers between shipping companies, e.g.
Synchronet. Nevertheless the competition will hinder an optimal synergy effect. Furthermore the time and place of the
return is uncertain.
Technical conditions, stowage time and the sailing schedule influence the strategic considerations, causing the chance to
match a container with a deep sea vessel as mentioned in paragraph 5.3.1. The matchability is minimal 1 out of 8, since
the maximum wait time of a container for a slot on a vessel is eight days.
The matchability between an empty container and a hinterland transportation mode is dependent on the location of the
depot and the available connections and the capacity of the hinteriand modalities.
The flrst type of matchability (related to cargo) is of main importance to the operational stocks and thus the depots at
the Waal-/Eemhaven in the PoR. The second type (related to deep sea vessels) is of main importance to matchback and
hub containers and therefore affects the depots behind the terminal. The last type (related to hinteriand modalities) is to
importance of both types of depots.
5.4.21 Hinterland routing Transport operators aim at optimal use of their means of transport, which implies optimal routing. Sometimes a truck
operator drives to a depot at haphazard and sometimes a departure or arrival is announced three weeks in advance, in
general it is known one day in advance (Schepen, personal interview, 2006).
64
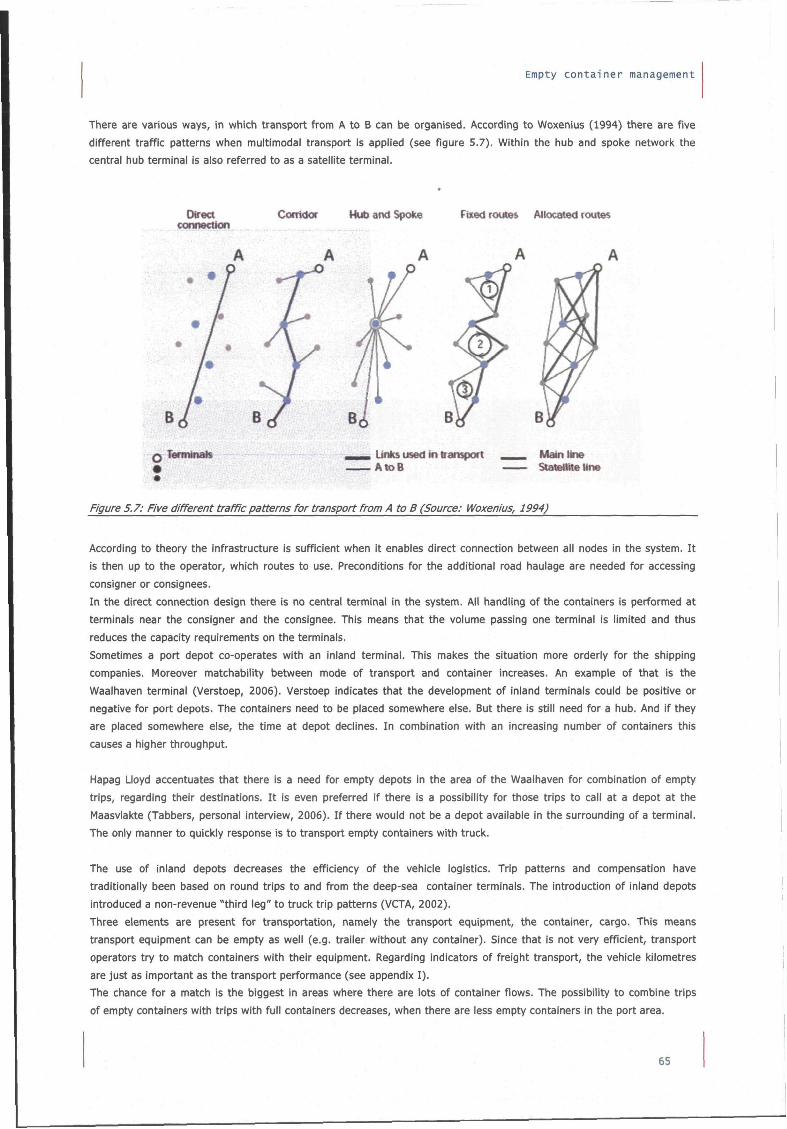
Empty container management
There are various ways, in which transport from A to B can be organised. According to Woxenius (1994) there are five
different traffic patterns when multimodal transport is applied (see figure 5.7). Within the hub and spoke network the
central hub terminal is also referred to as a satellite terminal.
Ok-eo Corridor Hub and Spoke Fixed routes Altocated routes connectkxi
Q Termini a , ^ Unks used in transport ^ . ^ Main line « AtoB Statellite line
Figure 5.7: Five different traffic patterns for transport from A to B (Source: Woxenius, 1994)
According to theory the infrastructure is sufficient when it enables direct connection between ail nodes in the system. It
is then up to the operator, which routes to use. Preconditions for the additional road haulage are needed for accessing
consigner or consignees.
In the direct connection design there is no central terminal in the system. All handling of the containers is performed at
terminals near the consigner and the consignee. This means that the volume passing one terminal is limited and thus
reduces the capacity requirements on the terminals.
Sometimes a port depot co-operates with an inland terminal. This makes the situation more orderly for the shipping
companies. Moreover matchability between mode of transport and container increases. An example of that is the
Waalhaven terminal (Verstoep, 2006). Verstoep indicates that the development of inland terminals could be positive or
negative for port depots. The containers need to be placed somewhere else. But there is still need for a hub. And if they
are placed somewhere else, the time at depot declines. In combination with an increasing number of containers this
causes a higher throughput.
Hapag Lloyd accentuates that there is a need for empty depots in the area of the Waalhaven for combination of empty
trips, regarding their destinations. It is even preferred if there is a possibility for those trips to call at a depot at the
Maasvlakte (Tabbers, personal interview, 2006). If there would not be a depot available in the surrounding of a terminal.
The only manner to quickly response is to transport empty containers with truck.
The use of inland depots decreases the efficiency of the vehicle logistics. Trip patterns and compensation have
traditionally been based on round trips to and from the deep-sea container terminals. The introduction of inland depots
introduced a non-revenue "third leg" to truck trip patterns (VCTA, 2002).
Three elements are present for transportation, namely the transport equipment, the container, cargo. This means
transport equipment can be empty as well (e.g. trailer without any container). Since that is not very efficient, transport
operators try to match containers with their equipment. Regarding indicators of freight transport, the vehicle kilometres
are just as Important as the transport performance (see appendix I).
The chance for a match is the biggest in areas where there are lots of container flows. The possibility to combine trips
of empty containers with trips with full containers decreases, when there are less empty containers in the port area.
65
Logistics of empty containers
Trucking companies are mainly situated in the environment of Rotterdam, e.g. Voorneputten. This is determining for tlie
combination of trips, since the origin of the trips is in the environment of Rotterdam (Dekker and Schuylenburg.,
personal interview 2006).
Barge is the preferred modality to reposition empty containers since it is a low-cost mode (Van Driel, personal interview,
2006) and has a high level of reliability. Truck is used when time pressure is high. Despite congestion, truck is the most
cost efficient mode for short distances
Shipping companies and/or forwarding agents have contractual relationships with trucking companies and rail operators,
which creates an irregular competition between the different hinteriand modes.
For positioning of empty containers the client of the merchant or shipping company decides which mode is being used,
since they need to pay for the transportation. There is a trade-off between transit time and transport costs. A shipping
company might suggest other modes, but the choice is not his (Tabbers, personal interview, 2006).
The hinteriand lead-time is the time needed to bring a container from the depot to the hinterland destination. Within this
research two types of destination will be distinguished, namely far hinteriand and near hinteriand. The near hinteriand is
the area in the surroundings of Rotterdam (approximately with a radius of 20 kilometres). Between Waal-/Eemhaven and
MV is a distance of 40 kilometres. This is quite expensive, example. But as can be seen from the analysis of the current
situation it is important that the transport planner is the one who pays the trip. If someone else pays there is no reason
to cut back and make the transportation more efficient. But this issue is covered by the criterion of the combination of
trips. Overall it can be said that the lead-time for hinterland is longer for depot situated at the Maasvlakte. Since the trip
takes about an hour it has small effects on long haulage and a medium effect on medium haulage. Here the distance
between depot and destination will be accepted as an indicator.
5.51 Container management and empty depots It has become clear that more factors are relevant in container logistics than, the transport performance with empty
containers.
Stocks are monitored and managed by making a plan to keep the inventories at a certain level; this has an effect on the
repositioning of empty containers. Due to uncertainty in the infiow and outfiow of the inventory, the stock level
porgresses capricious. Further more a safety stock is needed to avoid lost sales if containers are not available when
requested by customers and to cope with seasonal peaks in the summer time. Incidental fiuctuations in trade are
covered by the use of lease containers. A drawback from the use of lease containers for the RPA, is the need for lease
depots in the port. Since the dwell time of off-lease containers is relatively large, lease depots require a relatively large
amount of space.
The dwell time is important for the progress of the inventory level. The shorter the dwell times the more capricious the
inventory level. Regarding the planning of empty depots the size of the fiuctuations in the inventory level is important. A
short dwell time increases the fluctuations and therefore the peak factor, which levels down the advantage of short
dwell times.
Scale enlargements of deep sea vessels will have impact on the inventory levels of terminals and depots, since there will
be leaps in the inventory level and the dwell time of containers will increase. Currentiy a container has to wait maximal 8
days for a slot on a deep sea vessel.
The general increase of container flows, will Increase the turn around speed of the inventory is high and therefore
diminishes the need for inventory.
In order to guarantee a high level of service to their customers, the stock is located closely to the customers. In case of
carrier haulage the stocks are kept at several inland locations, since their customers are exporting and importing
companies. In case of merchant haulage the clients of the shipping companies are importers and exporter in the region
Rotterdam and the merchants, which take over the supply chain at the port.
For shipping companies it is interesting to keep the centre stock which Is located closely to points of exit. In that sense
the port is an ideal location, since it has good connections with the hinterland and overseas destinations.
66
Empty container management
Reasons for keeping the stock at Northwest Europe and not in high demand areas, such as Asia are that Europe has a
secondary market and that the prices for storage in Asia are significantiy higher.
In practice containers from various inventories (matchback, operational, repositioning and obsolete stock) are being
exchanged. When empty containers are in stock, the destination of the container is not 100 percent certain. Based on
estimates from the shipping company the empty containers are positioned in different inventories. A great uncertainty in
the developments within various trades (and thus various types of containers) makes forecasting a difficult task
The sea hub function of the port depots is still minimal.
Destination choices and mode choices are made to realise the target levels. The use of inland depots decreases the
efficiency of the vehicle logistics. Trip patterns and compensation have traditionally been based on round trips to and
from the deep-sea container terminals. The introduction of inland depots introduced a non-revenue "third leg" to truck
trip patterns.
Moreover each shipping company has its own repositioning strategy. The whole of individual optima refiects in a mixed
overall picture of empty container movements. The demand for empty depots differs per type of shipping company,
nevertheless every shipping company needs a certain amount of depot terrain in the port, and especially near the
terminal. Repositioning of empty containers is an inevitable activity. The port is an ideal node in the network of
positioning, due to the widespread presence connections.
For shipping companies it is very important that they can use empty depots to position their containers in a fiexible
manner. The unavoidable mismatch of an empty container in time and place causes a need for storage.
Empty depots form an important part of service provision towards shipping companies and by this means infiuence the
competitiveness of the port. Maximal flexibility and minimal costs are the main objectives of shipping companies
regarding the storage of empty containers.
From the point of view of empty equipment management the following criteria are relevant: the total transport
performance of empty containers, the combination of trips, the modal shift towards barge and train, the depot costs and
the availability of container slots at empty port depots. The planning of empty depots in the PoR need to take these
criteria into account.
In the next chapter the demand for empty depots in the port will be quantified, furthermore the possibilities for
balancing the supply with the demand will be discussed.
67

Logistics of empty containers
68
61 Empty depots: the balance between port planning and container management
From the point of view of empty equipment management there is a certain demand for storage space for empty
containers. Through port planning activities, there is a supply of storage space. In order to create an optimal situation
there should be a balance in supply and demand, which is satisfying for both parties; i.e. shipping companies and the
RPA. The previous chapters elaborated on empty depots and their context. Criteria for empty depots have been
differentiated from a multi-actor perspective. For the most part these criteria are about the characteristics and effects
of empty depots.
For the RPA it is important to know the size of the demand for empty depots, as this is needed for the planning process
of Maasvlakte 2 and as the RPA needs to balance the supply with the demand. Therefore this chapter elaborates on the
demand for empty depots in 2020 and 2040 and the manner in which the RPA can facilitate this demand.
This chapter forms the start of the synthesis part of the research. Up to this point, the research focussed on
management, strategies and system analysis. This chapter has another approach. Statistical analyses (linear and causal
regression) and calculation of the spatial productivity are methods with a technical background.
In the first paragraph, the limitations of existing estimations will be discussed. It appears that the existing estimations
are limited in their treatment of future conditions and causalities. Therefore all factors, which influence the demand for
empty depot terrain, are identified in the second paragraph. This overall view on the utilisation of empty depots is a
typical approach of the TIL-program. Next, the depot arrivals are estimated for the year 2020 and 2040 in the third
paragraph. Furthermore the valid conditions for these estimates have been specified. The effects of tight supply are
discussed in paragraph four. This chapter ends with a summary.
6.11 Preliminary land use estimates In 2003 the total depot area in the PoR was equal to 129 hectare, which corresponded with a TEU capacity of 145.344
(Kijzerwaard e.a., 2003). Since container volumes will nearly quadruple in 2040 (see appendix D), an increase in the
need for depot terrain can be expected.
There have been three studies on future land use of Maasvlakte 2.
o CPB analysed the prosperity effects of Maasvlakte 2 in 2000. In this research the empty depot and distribution
centres are perceived as one category, which is extrapolated according to the increase in throughput. There is
no insight in the developments of empty depots.
0 T. Dekker and J. Eenhuizen (2005) made a memorandum about the future of empty depots in the PoR. Here it
is also assumed that the relation between depot arrivals and throughput will remain constant in the future
(5,8%). Nevertheless the productivity of the empty depots is believed to increase under the assumption that
lease containers will be crowded out of the port depot, but it is not quantitatively specified.
o The report "Ruimtevraag containersector MV2 in 2020 en 2040" (RPA, 2005) is the most recent and detailed
estimation of empty depot terrain. This research is (just like the first research) mainly focused on the terrain
needed for terminals. Empty depots get few attention, because they form a small part of the total picture or
because there is little data, accurate enough for direct use, available.
The preliminary land use estimate (RPA, 2005) in the latter research are constructed according to the following steps:
o Determining the percentage containers treated at depots at MV depots in relation to the total throughput of
containers at the Delta island terminal.
o Determining the ground productivity of MV depots by dividing the number of treated containers by the ground
area of the depots.
o Determining the throughput of deep-sea containers at the Maasvlakte in 2020 and 2040.
69
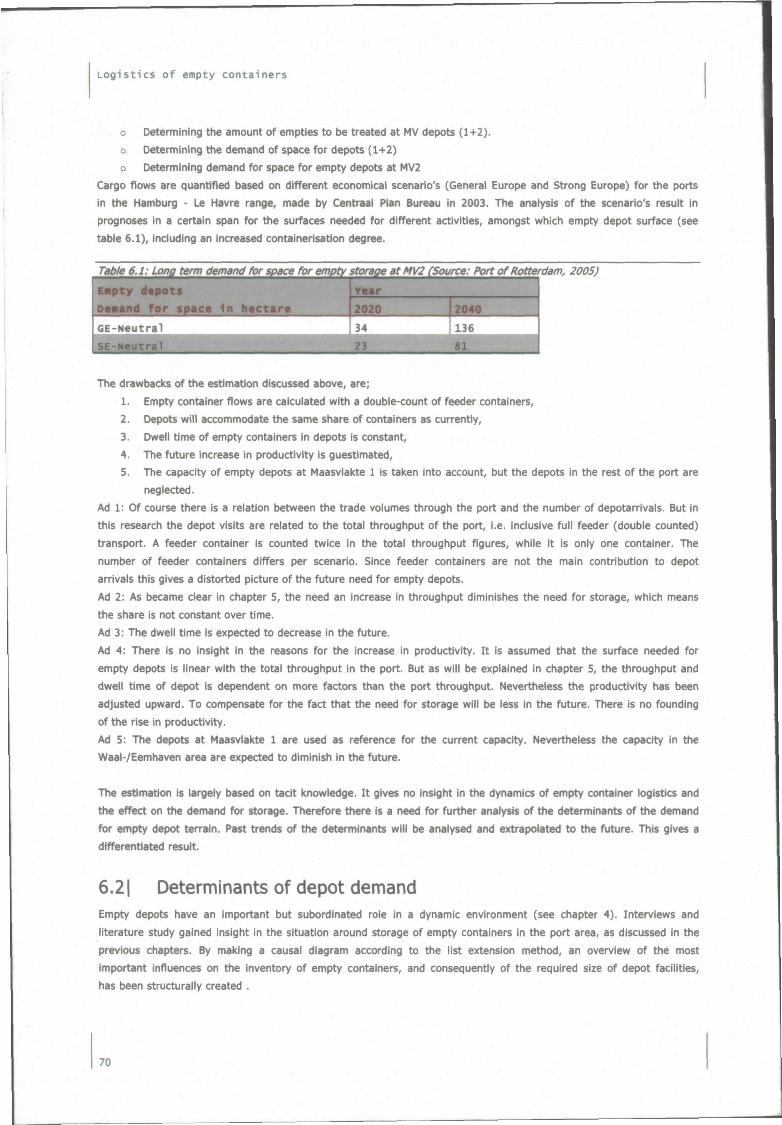
Logistics of empty containers
o Determining the amount of empties to be treated at MV depots (1+2).
o Determining the demand of space for depots (1+2)
o Determining demand for space for empty depots at MV2
Cargo flows are quantifled based on different economical scenario's (General Europe and Strong Europe) for the ports
in the Hamburg - Le Havre range, made by Centraal Plan Bureau in 2003. The analysis of the scenario's result in
prognoses in a certain span for the surfaces needed for different activities, amongst which empty depot surface (see
table 6.1), including an increased containerisation degree.
Table 6.1: Long term demand for space for empty storage at MV2 (Source: Port of Rotterdam, 2005)
tapty depots
ftwund for spjtc» in tiatict»r«
eE-N«utra1
Year
j §20 .
34 ifilS. 136
"1?t" 81 3 The drawbacks of the estimation discussed above, are;
1. Empty container flows are calculated with a double-count of feeder containers,
2. Depots will accommodate the same share of containers as currently,
3. Dwell time of empty containers in depots is constant,
4. The future increase in productivity is guestimated,
5. The capacity of empty depots at Maasvlakte 1 is taken into account, but the depots in the rest of the port are
neglected.
Ad 1: Of course there is a relation between the trade volumes through the port and the number of depotarrivals. But in
this research the depot visits are related to the total throughput of the port, i.e. inclusive full feeder (double counted)
transport. A feeder container is counted twice in the total throughput flgures, while it is only one container. The
number of feeder containers differs per scenario. Since feeder containers are not the main contribution to depot
arrivals this gives a distorted picture of the future need for empty depots.
Ad 2: As became clear in chapter 5, the need an increase in throughput diminishes the need for storage, which means
the share is not constant over time.
Ad 3: The dwell time is expected to decrease in the future.
Ad 4: There is no insight in the reasons for the increase in productivity. It is assumed that the surface needed for
empty depots is linear with the total throughput in the port. But as will be explained in chapter 5, the throughput and
dwell time of depot is dependent on more factors than the port throughput. Nevertheless the productivity has been
adjusted upward. To compensate for the fact that the need for storage will be less in the future. There is no founding
of the rise in productivity.
Ad 5: The depots at Maasvlakte 1 are used as reference for the current capacity. Nevertheless the capacity in the
Waal-/Eemhaven area are expected to diminish in the future.
The estimation is largely based on tacit knowledge. It gives no insight in the dynamics of empty container logistics and
the effect on the demand for storage. Therefore there is a need for further analysis of the determinants of the demand
for empty depot terrain. Past trends of the determinants will be analysed and extrapolated to the future. This gives a
differentiated result.
6.21 Determinants of depot demand Empty depots have an important but subordinated role in a dynamic environment (see chapter 4). Interviews and
literature study gained insight in the situation around storage of empty containers in the port area, as discussed in the
previous chapters. By making a causal diagram according to the list extension method, an overview of the most
important influences on the inventory of empty containers, and consequentiy of the required size of depot facilities,
has been structurally created .
70
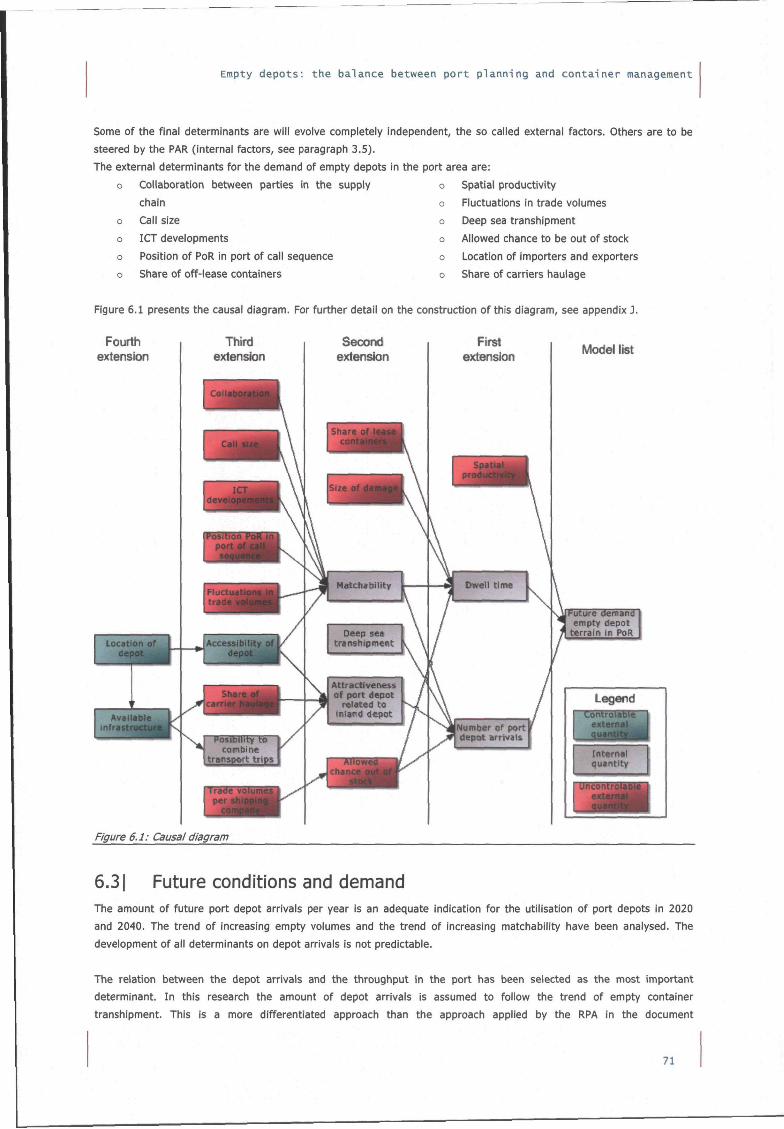
Empty depots: the balance between port planning and container management
Some of the final determinants are will evolve completely independent, the so called external factors. Others are to be
steered by the PAR (internal factors, see paragraph 3.5).
The external determinants for the demand of empty depots in the port area are:
Collaboration between parties in the supply
chain
Call size
ICT developments
Position of PoR in port of call sequence
Share of off-lease containers
o Spatial productivity
o Fluctuations in trade volumes
o Deep sea transhipment
o Allowed chance to be out of stock
o Location of importers and exporters
o Share of carriers haulage
Figure 6.1 presents the causal diagram. For further detail on the construction of this diagram, see appendix J.
Fourth extensbn
Third extension
mgsBm^
Second extension
First extension Model list
Purture demand empty depot
terrain in PoR
Internal qusntity
Luncontro^a
Figure 6.1: Causal diagram
6.31 Future conditions and demand The amount of future port depot arrivals per year is an adequate indication for the utilisation of port depots in 2020
and 2040. The trend of increasing empty volumes and the trend of increasing matchability have been analysed. The
development of all determinants on depot arrivals is not predictable.
The relation between the depot arrivals and the throughput in the port has been selected as the most important
determinant. In this research the amount of depot arrivals Is assumed to follow the trend of empty container
transhipment. This is a more differentiated approach than the approach applied by the RPA in the document
71
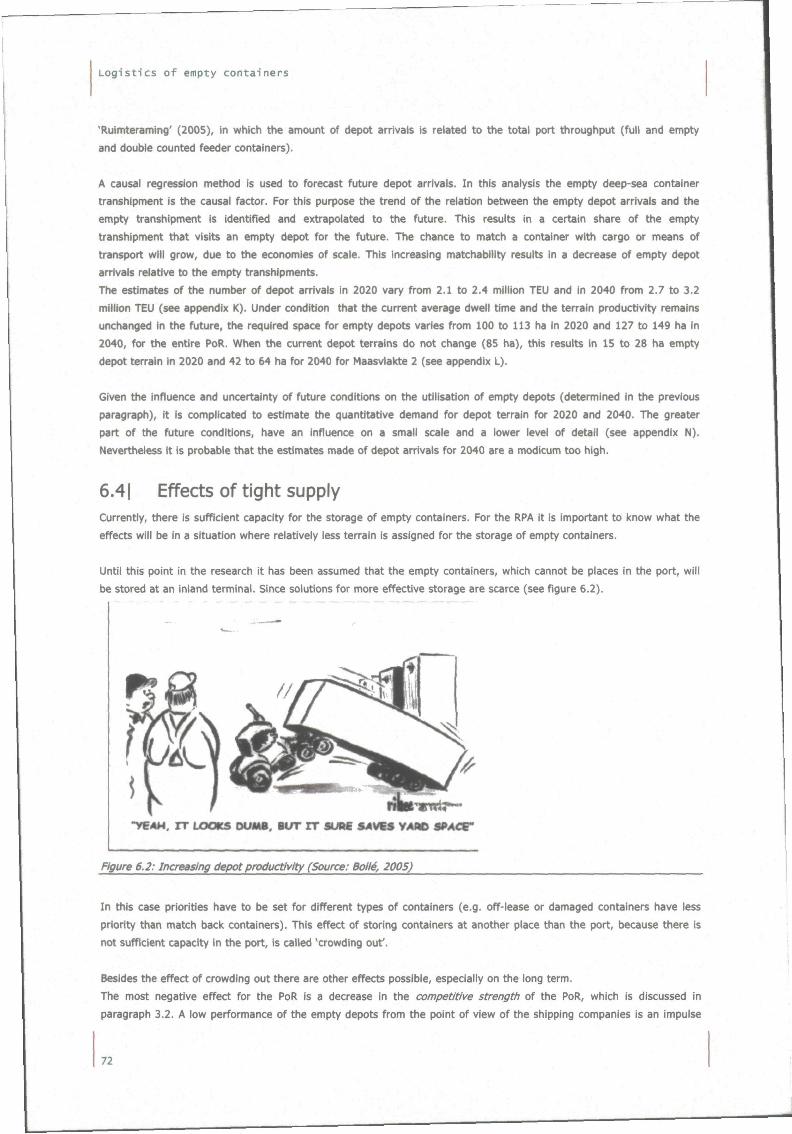
Logist ics of empty containers
'Ruimteraming' (2005), in which the amount of depot arrivals is related to the total port throughput (full and empty
and double counted feeder containers).
A causal regression method is used to forecast future depot arrivals. In this analysis the empty deep-sea container
transhipment is the causal factor. For this purpose the trend of the relation between the empty depot arrivals and the
empty transhipment is identified and extrapolated to the future. This results in a certain share of the empty
transhipment that visits an empty depot for the future. The chance to match a container with cargo or means of
transport will grow, due to the economies of scale. This increasing matchability results in a decrease of empty depot
arrivals relative to the empty transhipments.
The estimates of the number of depot arrivals in 2020 vary from 2.1 to 2.4 million TEU and in 2040 from 2.7 to 3.2
million TEU (see appendix K). Under condition that the current average dwell time and the terrain productivity remains
unchanged in the future, the required space for empty depots varies from 100 to 113 ha in 2020 and 127 to 149 ha in
2040, for the entire PoR. When the current depot terrains do not change (85 ha), this results in 15 to 28 ha empty
depot terrain in 2020 and 42 to 64 ha for 2040 for Maasvlakte 2 (see appendix L).
Given the infiuence and uncertainty of future conditions on the utilisation of empty depots (determined in the previous
paragraph), it is complicated to estimate the quantitative demand for depot terrain for 2020 and 2040. The greater
part of the future conditions, have an infiuence on a small scale and a lower level of detail (see appendix N).
Nevertheless it is probable that the estimates made of depot arrivals for 2040 are a modicum too high.
6.41 Effects of tight supply Currentiy, there is sufficient capacity for the storage of empty containers. For the RPA it is important to know what the
effects will be in a situation where relatively less terrain is assigned for the storage of empty containers.
Until this point in the research it has been assumed that the empty containers, which cannot be places in the port, will
be stored at an inland terminal. Since solutions for more effective storage are scarce (see figure 6.2).
"YEAH. I T LOCKS DUMB, Birr IT SURE SAVES YARD SfiACC
Figure 6.2: Increasing depot productivity (Source: Boilé, 2005)
In this case priorities have to be set for different types of containers (e.g. off-lease or damaged containers have less
priority than match back containers). This effect of storing containers at another place than the port, because there is
not sufficient capacity in the port, is called 'crowding out'.
Besides the effect of crowding out there are other effects possible, especially on the long term.
The most negative effect for the PoR is a decrease in the competitive strength of the PoR, which is discussed in
paragraph 3.2. A low performance of the empty depots from the point of view of the shipping companies is an impulse
72
Empty depots: the balance between port planning and container management
for shipping companies to locate their empty containers at another point. As a result of which a share of the full
transhipment in the PoR will fall through, since the transport of empty containers is closely related to the transport of
full containers.
Another possible effect is the development in merchant versus carrier haulage. In chapter 3 it became clear that
merchants frequently use the depot in the port are, even for empty containers that are part of the operational stock.
There could develop a trend towards carrier haulage or in other words there will be a trend in vertical integration of
the supply chain. Because of the shift towards inland terminals, the insight in the supply chain is advantageous. The
trend could also be towards an intermediate form between merchant and carrier haulage, where merchants drop their
empty containers off at an inland terminal.
The last effect is the shortening of dwell time in depots. In that manner more containers can be places in a year on the
same area. In order to realise a shorter dwell time, the matchability needs to increase. There are four main influencing
factors on the matchability. An increase In hinteriand transport capacity (1) diminishes the concealed wait time. The
concealed wait time consists of the time between the moment of decision on the destination of the container and the
moment of pick up of the container from the depot. Efficient planning of logistics (2) is also an influencing factor on
the matchability.Transport operators need improved equipment visibility, to divert boxes to cargo demand locations at
short notice. When using the logistical concept of Just In Time, there is no need for large stocks of empty containers.
Herewith good supply of information about the status of the container is a boundary condition. Collaboration (3) also
increases the matchability between different transport operators. The grey container concept is an example of integral
collaboration. Unfortunately this concept did not prove to be a success on a large scale (see box 3 in paragraph 4.1.2).
In theory it is a very efficient concept, but in practice there were competitive and liability related resistances. The grey
container concept is not the only way of collaboration. Potential increase in cabotage and fusion's will result in scale
advantages. Through scale advantages the demanded size of the physical stock will decrease. Another possibility for
shortening the dwell time is the extensive repairs. The last factor regarding the matchability concerns the conditions in
the contract. When the price is related to the dwell time, there is an extra incentive to move the empty container.
The above mentioned effects are traceable by using the causal diagram (see appendix J). Investigating the influences
on the utilisation of depot terrain resulted in this diagram. But the causal diagram can be used in the opposite
direction. The effects of tight supply will develop in one or more different branches in the diagram.
The problem of offering a suitable capacity can be better understood when comparing this problem to the problem of
congestion on highways. It is known that an enlargements of capacity to a certain degree generates demand (van der
Heijden, 1994). In case of the utilisation of roadways it appears that people are willing to accept a certain amount of
delay. If capacity is too small that the delay rises to unacceptable level, alternatives are used (move house, take the
bicycle, train or bus or not travel at all). Those alternatives are not the ones of first choice, but given the
circumstances these alternatives are better than travelling by car with an unacceptable delay.
In case of storing empty containers a reduction of capacity might not lead to a significant decrease in competitive
strength. Although storing the empty containers at the port is appealing to the users, there are alternatives (as
described above).
The attractiveness of the alternatives per user and the possible effects on the total system is very difficult to predict
with firmness. It is dependent on the complexity and dynamics of the market. A comparison of costs and benefits can
point out the balance between choosing for another port to store the empty containers, an increase in vertical
integration, a decrease in dwell time.
With empty container storage it is the question how many costs the users of empty depots are willing to pay for the
different alternatives. This is just like the problem of congestion where the question is how willing the motorist is to
accept being in a road jam during a certain period, before making the choice for not travelling at ail.
The situation would be ideal if there were only feeders and import and export related containers behind the terminal.
Nevertheless this is inevitable, because the concurrence of the following reasons:
Shipping companies, using merchant haulage prefer to use the port as storage place for their empty containers.
73
Logistics of empty containers
Carrier haulages try to make minimal use of port depots . But It is Impossible to prevent events where empties are
needed in the hinteriand.
Storage in Asia is less attractive than in Europe, since prices are higher in Asia and there is a second market for used
containers in Europe.
Taking a container from the real distant hinteriand to supply the medium distant hinteriand is also more expensive.
Since the transporation is expensive since there are less scale advantages in the far hinteriand. In contrary at the port,
where a lot of container fiows are concentrated.
These reasons explain the function of the port depot as direct supplier for the hinteriand. Even so, if one would want
to try to force out the containers for direct supply, it would be very difficult. It means a decrease of efficienct use of
the containerfleet for the shipping companies. Therefore it is debatable In what degree the crowding out effect can
take place. If capacity at the port depots is tight, prices will rise. It is very likely that the price will relate to the dwell
time. Therefore it is unattractive to leave the container too long at a port depot. The chance to remove containers from
the port depot is larger when the demand for empties in the hinteriand is taken in to account. In this line of argument
the number of movements with empty containers in the port area will increase. Consequentiy there should be sought
for other soluations to prevent the operational movements, nevertheless this is not part of the direct design variables
available to the RPA.
The terminal operator ECT is in a similar position as the RPA, but for the terminal operator the effects of container
logistics are larger. The terminal operator and the RPA are both dependent on the shipping companies for their income.
The number of containers transshipped at the PoR is in the hands of the shipping companies. The terminal operator is
thinking ahead in a situation where lack of space is increasing the possibility of lost sales. Furthermore in case of
Maasvlakte 2 there will be more competing terminal operators, of which some are components of shippng companies,
which ensures a strong market position, since volumes can be garantueed. In which case it is even more important to
be innovative. They are considering an extended gate principle.
This extended gate offers the opportunity for merchants to drop off their container at an inland terminal, which Is
perceived as gate. The terminal operator takes care of the transport from the inland terminal to the port terminal.
This principle is compatible with the deveiopement of the port (see paragraph 3.1). But the RPA has indicated that
there is no interest in involvement in inland terminals. It seems a very promising solution. Therefore it is
recommendable for the RPA to monitor and maybe stimulate these developments, without interference in the
competition amongst terminal operators.
In case of a high price level, there might also be a crowding out effect to Asia. In order to identify the breakeven point
of depot costs a comparison of the costs of storage at the PoR and the opportunity costs for selling containers on the
second market should be weight against the costs of storage at Asia.
6.51 Balancing In the ideal situation supply and demand for empty depots are balanced.
The demand for empty depots is approximately 2 million TEU in 2020 and 3 mlllton TEU in 2040, in case there is no
'crowding out'-effect (i.e. maximum facilitation of demand). The estimates of the number of depot arrivals in 2020 vary
from 2.1 to 2.4 million TEU and in 2040 from 2.7 to 3.2 million TEU. Under condition that the current average dwell
time and the terrain productivity remains unchanged in the future, the required space for empty depots varies from
100 to 113 ha in 2020 and 127 to 149 ha in 2040, for the entire PoR. When the current depot terrains do not change
(85 ha), this results in 15 to 28 ha empty depot terrain in 2020 and 42 to 64 ha for 2040 for Maasvlakte 2.
Given the influence and uncertainty of future conditions on the utilisation of empty depots, it is complicated to
estimate the quantitative demand for depot terrain for 2020 and 2040. The greater part of the future conditions, have
an infiuence on a small scale and a lower level of detail. Nevertheless the estimates made of depot arrivals for 2040
are probably a modicum too high.
74
Empty depots: the balance between port planning and container management
The possibilities for relatively decrease of the storage capacity in the port seems advantageous at first sight.
Nevertheless there is a great uncertainty on the long-term developments, of which some are affecting the position of
the PoR.
Since the current supply is maximal, it is assumed that inland terminals are a possible substitute for port depots. The
effects on transport operations and costs will be treated in the next chapter. It will go into detail on the direct effects
of different quantities in the port, and furthermore other design aspects will be handled.
75

Logistics of empty containers
76
71 Evaluation of empty depot design concepts
In this phase of the research different solution alternatives, in this case the strategies, need to be compared to each
other in a logical and consistent manner in order to form a tool for making decisions about the strategy towards empty
depots (Bots, 2003).
Regarding empty depots the RPA has a few measures (elements of a strategy) within direct reach (see paragraph 3.5).
In this chapter design concepts are formulated, given the design space. Design concepts are formed in order to identify
the effects of different port planning strategies. The design concepts cover the whole design space and are therefore
representative for potential strategies.
A reference design is needed to compare design concepts. The reference design is related to the current situation.
Then design concepts are chosen in order to cleariy identify effects and possible bottlenecks, which partially occur due
to interaction effects between the design variables. First, the points of departure will be discussed (paragraph 7.1).
The second paragraph elaborates on the design concepts. The different concepts are assessed by their performance in
2020 and 2040 on the criteria of the two main parties involved. Next, the assessment framework for the design
concepts is summarized.
7.11 Constraints and points of departure In order to limit the design space it was necessary to make some basic assumptions. The following points of departure
are valid in the remainder of this report.
It is assumed that it is necessary to have a certain amount of depot terrain available at the port. The only hypothetical
situation in which that is not true is when no uncertainties occur and it is possible for shipping companies to perfectiy
plan their movements. It would not be realistic not to have any depots in the port area. Different specialists in the field
confirm this.
There will be no variation in prevailing logistical concepts within the time horizon of this research. The spatial
productivity is assumed to be constant in the future. Only with innovative logistical concepts, a significant change could
be obtained.
It is also assumed that the TEU-factor will stay 1.7 in future situations.
All depots in the Waal-/Eemhaven area have a barge connection (see paragraph 3.4).
For the development and evaluation of the design concepts the year 2020 is taken as a reference. This time horizon is
set to have a realistic occupation rate of the new terminals at Maasvlakte 2. In the start up phase the occupation rates
will be lower than considered optimal.
The storage for empty marine container in the whole port area is taken into account. This geographical area is within
the control of the RPA.
Although this research focuses on the planning issue concerning the additional container fiows that will be attracted by
Maasvlakte 2, all depots in the PoR are studied. Since depots in the port replenish each other.
The direct design area only concerns possibilities for storage within the boundaries of the port. This is within direct
reach of the PAR's policy. Inland terminals are considered as rest capacity.
77
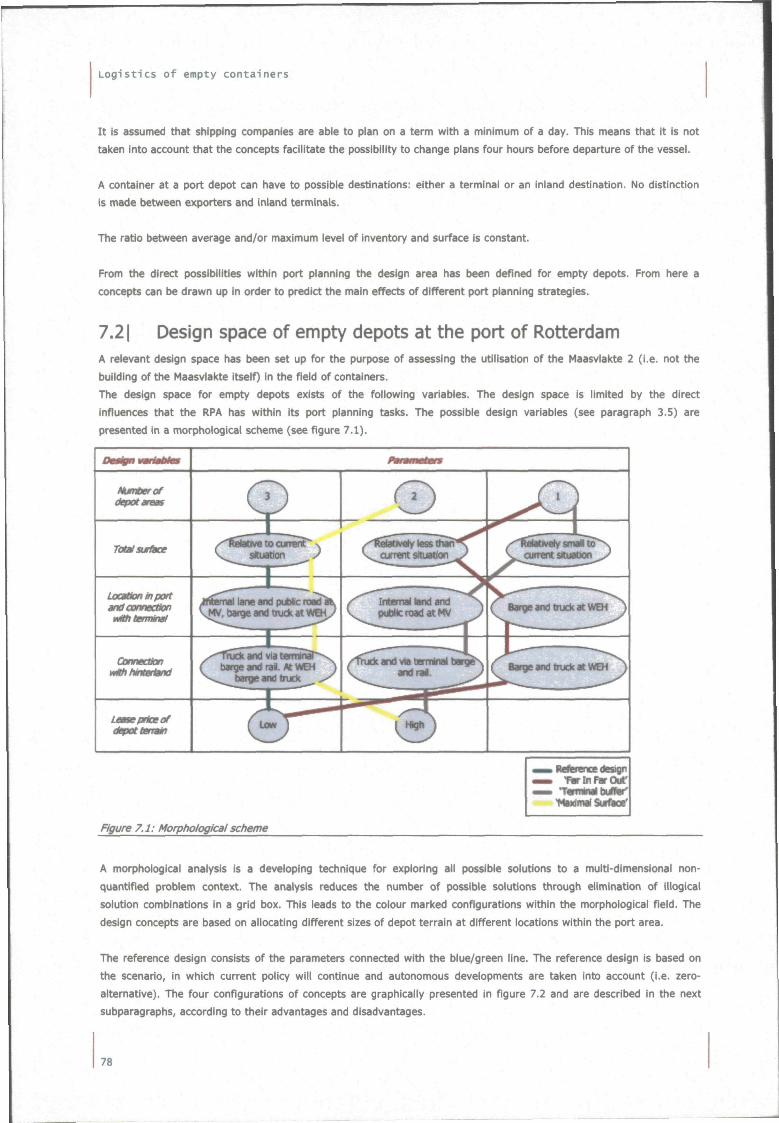
Logist ics of empty containers
It is assumed that shipping companies are able to plan on a term with a minimum of a day. This means that it is not
taken into account that the concepts facilitate the possibility to change plans four hours before departure of the vessel.
A container at a port depot can have to possible destinations: either a terminal or an inland destination. No distinction
is made between exporters and inland terminals.
The ratio between average and/or maximum level of inventory and surface is constant.
From the direct possibilities within port planning the design area has been defined for empty depots. From here a
concepts can be drawn up in order to predict the main effects of different port planning strategies.
7.21 Design space of empty depots at the port of Rotterdam A relevant design space has been set up for the purpose of assessing the utilisation of the Maasvlakte 2 (i.e. not the
building of the Maasvlakte itself) in the field of containers.
The design space for empty depots exists of the following variables. The design space is limited by the direct
influences that the RPA has within its port planning tasks. The possible design variables (see paragraph 3.5) are
presented in a morphological scheme (see figure 7.1).
^^m Hcfef ei'ue design « • • farlnFarOut' — termlMlbuMiir'
liMlinilSurftai
Figure 7.1: Morphological scheme
A morphological analysis is a developing technique for exploring all possible solutions to a multi-dimensional non-
quantified problem context. The analysis reduces the number of possible solutions through elimination of illogical
solution combinations in a grid box. This leads to the colour marked configurations within the morphological field. The
design concepts are based on allocating different sizes of depot terrain at different locations within the port area.
The reference design consists of the parameters connected with the blue/green line. The reference design is based on
the scenario, in which current policy will continue and autonomous developments are taken into account (i.e. zero-
alternative). The four configurations of concepts are graphically presented in figure 7.2 and are described in the next
subparagraphs, according to their advantages and disadvantages.
78
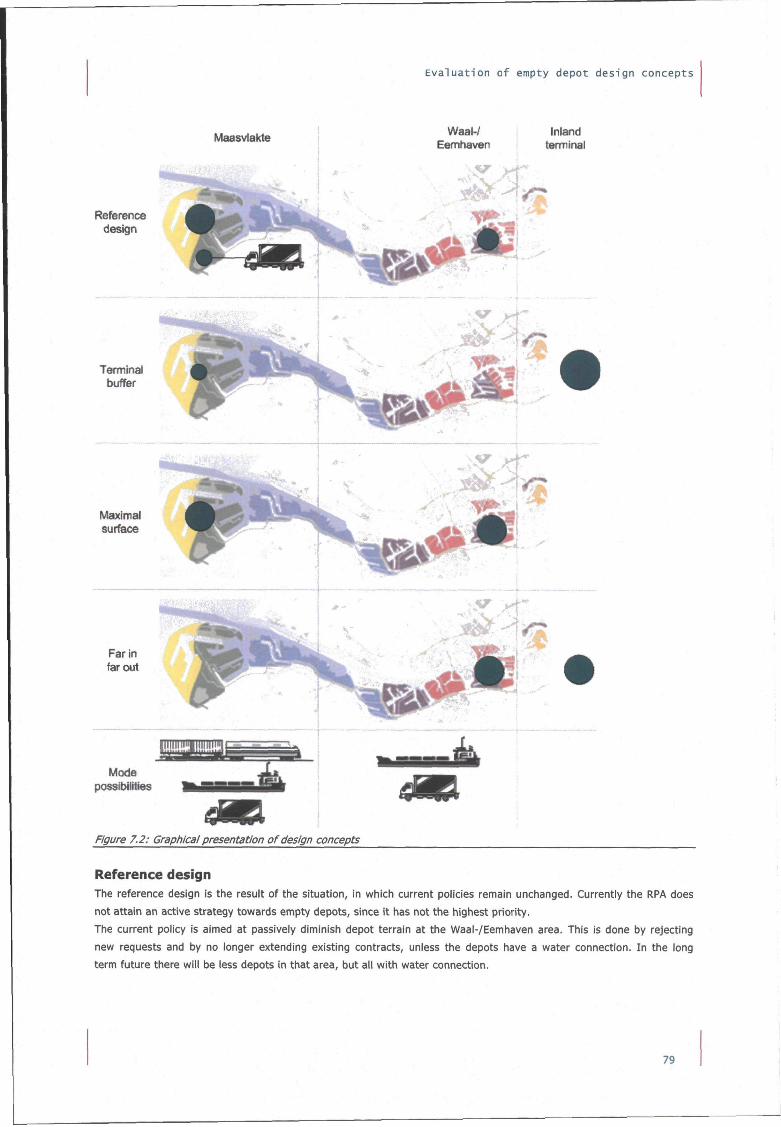
Maasvlakte
Evaluation of empty depot design concepts
Waal-/ Inland Eemtiaven terminal
Reference design
Mode possibililies
Figure 7.2: Graphical presentation of design concepts
Reference design The reference design is the result of the situation, in which current policies remain unchanged. Currentiy the RPA does
not attain an active strategy towards empty depots, since it has not the highest priority.
The current policy is aimed at passively diminish depot terrain at the Waal-/Eemhaven area. This is done by rejecting
new requests and by no longer extending existing contracts, unless the depots have a water connection. In the long
term future there will be less depots in that area, but all with water connection.
79
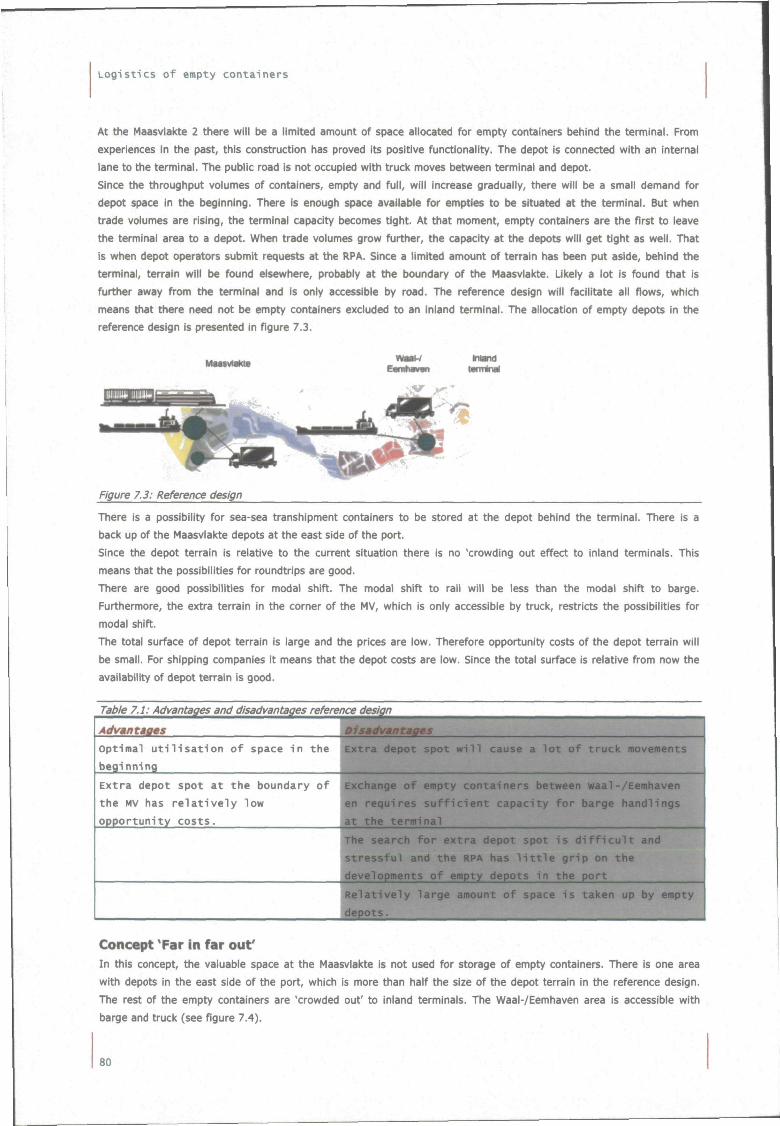
Logistics of empty containers
At the Maasvlakte 2 there wil l be a limited amount of space allocated for empty containers behind the terminal. From
experiences in the past, this construction has proved its positive functionality. The depot is connected with an internal
lane to the terminal. The public road is not occupied with truck moves between terminal and depot.
Since the throughput volumes of containers, empty and fu l l , wil l increase gradually, there will be a small demand for
depot space in the beginning. There is enough space available for empties to be situated at the terminal. But when
trade volumes are rising, the terminal capacity becomes t ight. At that moment, empty containers are the first to leave
the terminal area to a depot. When trade volumes grow further, the capacity at the depots will get tight as well . That
is when depot operators submit requests at the RPA. Since a l imited amount of terrain has been put aside, behind the
terminal, terrain will be found elsewhere, probably at the boundary of the Maasvlakte. Likely a lot is found that is
further away from the terminal and is only accessible by road. The reference design will facil itate all fiows, which
means that there need not be empty containers excluded to an inland terminal. The allocation of empty depots in the
reference design is presented in figure 7.3.
miand IWI IÉMI
Figure 7.3: Reference design
There is a possibility for sea-sea transhipment containers to be stored at the depot behind the terminal. There is a
back up of the Maasvlakte depots at the east side of the port.
Since the depot terrain is relative to the current situation there is no 'crowding out effect to inland terminals. This
means that the possibilities for roundtrips are good.
There are good possibilities for modal shift. The modal shift t o rail wil l be less than the modal shift to barge.
Furthermore, the extra terrain in the corner of the MV, which is only accessible by truck, restricts the possibilities for
modal shift.
The total surface of depot terrain is large and the prices are low. Therefore opportunity costs of the depot terrain will
be small. For shipping companies it means that the depot costs are low. Since the total surface is relative from now the
availability o f depot terrain is good.
Table 7.1: Advantages and disadvantages reference design
Advantages
Optimal utilisation of space
beginning
in
Extra depot spot at the boundary
the MV has relatively low
opportunity costs.
the
of
Disadvantages I
Extra depot spot will cause a lot of truck movements
,
Exchange of empty containers between waal-/Eemhaven
'en requires sufficient capacity for barge handlings
jat the terminal
iThe search for extra depot spot is difficult and
retressful and the RPA has little grip on the >•
fdeveloDments of emotv depots in the oort J^^l
Relatively large amount of space is taken up by empty
Idepots. A
Concept Tar in far ouf In this concept, the valuable space at the Maasvlakte Is not used for storage of empty containers. There is one area
with depots in the east side of the port, which is more than half the size of the depot terrain in the reference design.
The rest of the empty containers are 'crowded out ' to inland terminals. The Waal-/Eemhaven area is accessible wi th
barge and truck (see figure 7.4).
80
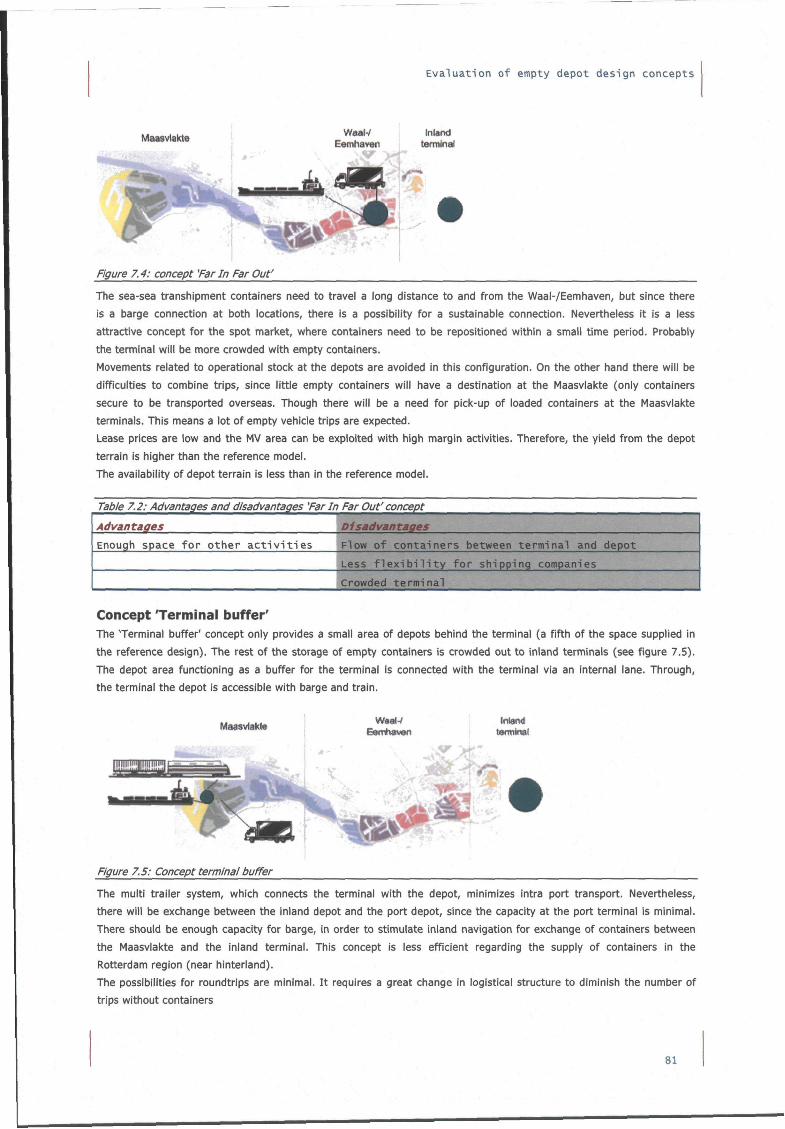
Evaluation of empty depot design concepts
Figure 7.4: concept 'Far In Far Out'
The sea-sea transhipment containers need to travel a long distance to and from the Waal-/Eemhaven, but since there
is a barge connection at both locations, there is a possibility for a sustainable connection. Nevertheless it is a less
attractive concept for the spot market, where containers need to be repositioned within a small time period. Probably
the terminal will be more crowded with empty containers.
Movements related to operational stock at the depots are avoided in this configuration. On the other hand there will be
difficulties to combine trips, since little empty containers will have a destination at the Maasvlakte (only containers
secure to be transported overseas. Though there will be a need for pick-up of loaded containers at the Maasvlakte
terminals. This means a lot of empty vehicle trips are expected.
Lease prices are low and the MV area can be exploited with high margin activities. Therefore, the yield from the depot
terrain is higher than the reference model.
The availability of depot terrain is less than in the reference model.
Table 7.2: Advantages and disadvantages 'Far In Far Out'concept
Advantages Disadvan tages
Enough space for other activities Flow of containers between terminal and depot
Less flexibility for shipping companies
Crowded terminal
Concept Terminal buffer' The Terminal buffer' concept only provides a small area of depots behind the terminal (a fifth of the space supplied in
the reference design). The rest of the storage of empty containers is crowded out to inland terminals (see figure 7.5).
The depot area functioning as a buffer for the terminal is connected with the terminal via an internal lane. Through,
the terminal the depot is accessible with barge and train.
Maasvlafcle Waal-/ Eemhaven
Inland terminal
Figure 7.5: Concept terminal buffer
The multi trailer system, which connects the terminal with the depot, minimizes intra port transport. Nevertheless,
there will be exchange between the inland depot and the port depot, since the capacity at the port terminal is minimal.
There should be enough capacity for barge, in order to stimulate inland navigation for exchange of containers between
the Maasvlakte and the inland terminal. This concept is less efficient regarding the supply of containers in the
Rotterdam region (near hinteriand).
The possibilities for roundtrips are minimal. It requires a great change in logistical structure to diminish the number of
trips without containers
81
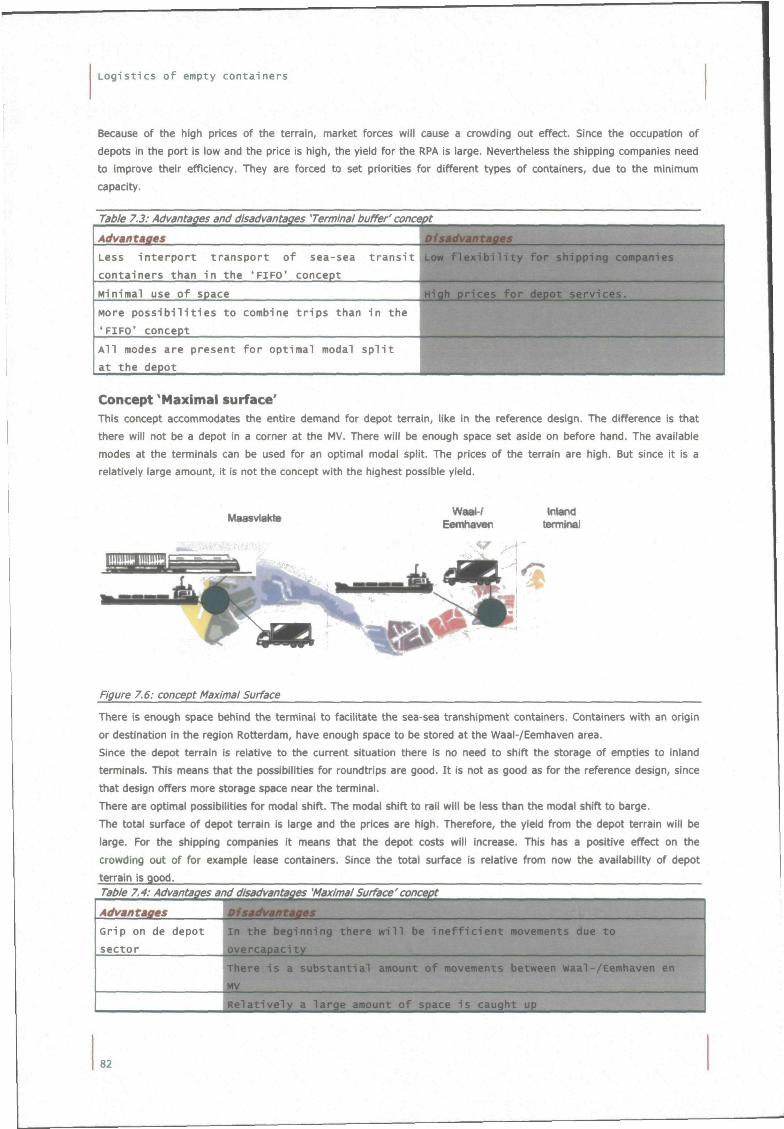
Logistics of empty containers
Because of the high prices of the terrain, market forces will cause a crowding out effect. Since the occupation of
depots in the port is low and the price is high, the yield for the RPA is large. Nevertheless the shipping companies need
to improve their efficiency. They are forced to set priorities for different types of containers, due to the minimum
capacity.
Table 7.3: Advantages and disadvantages 'Terminal buffer'concept
Advantages tadvantages
Less i n te rpo r t t ransport of sea-sea t r a n s i t LOW f l e x i b i l i t y for shipping companies
containers than i n the ' F I F O ' concept
Minimal use of space High prices fo r depot services.
More p o s s i b i l i t i e s to combine t r i p s than in the
'FIFO' concept
A 1 1 modes are present f o r optima! modal s p l i t
at the depot
Concept 'Maximal surface' This concept accommodates the entire demand for depot terrain, like In the reference design. The difference is that
there will not be a depot in a corner at the MV. There will be enough space set aside on before hand. The available
modes at the terminals can be used for an optimal modal split. The prices of the terrain are high. But since it is a
relatively large amount, it is not the concept with the highest possible yield.
Figure 7.6: concept Maximal Surface
There is enough space behind the terminal to facilitate the sea-sea transhipment containers. Containers with an origin
or destination in the region Rotterdam, have enough space to be stored at the Waal-/Eemhaven area.
Since the depot terrain is relative to the current situation there is no need to shift the storage of empties to inland
terminals. This means that the possibilities for roundtrips are good. It is not as good as for the reference design, since
that design offers more storage space near the terminal.
There are optimal possibilities for modal shift. The modal shift to rail will be less than the modal shift to barge.
The total surface of depot terrain is large and the prices are high. Therefore, the yield from the depot terrain will be
large. For the shipping companies it means that the depot costs will increase. This has a positive effect on the
crowding out of for example lease containers. Since the total surface Is relative from now the availability of depot
terrain is good. Table 7.4: Advantages and disadvantages 'Maximal Surface'concept
Advantages j/Êkad}wttages_
Grip on de depot In the beginning there w i l l be i n e f f i c i e n t movements due to
sector overcapacity
There i s a substant ia l amount of movements between waal-/Eemhaven en MV
„Sa^atiyely a large amount o f space i s caught MB-
82
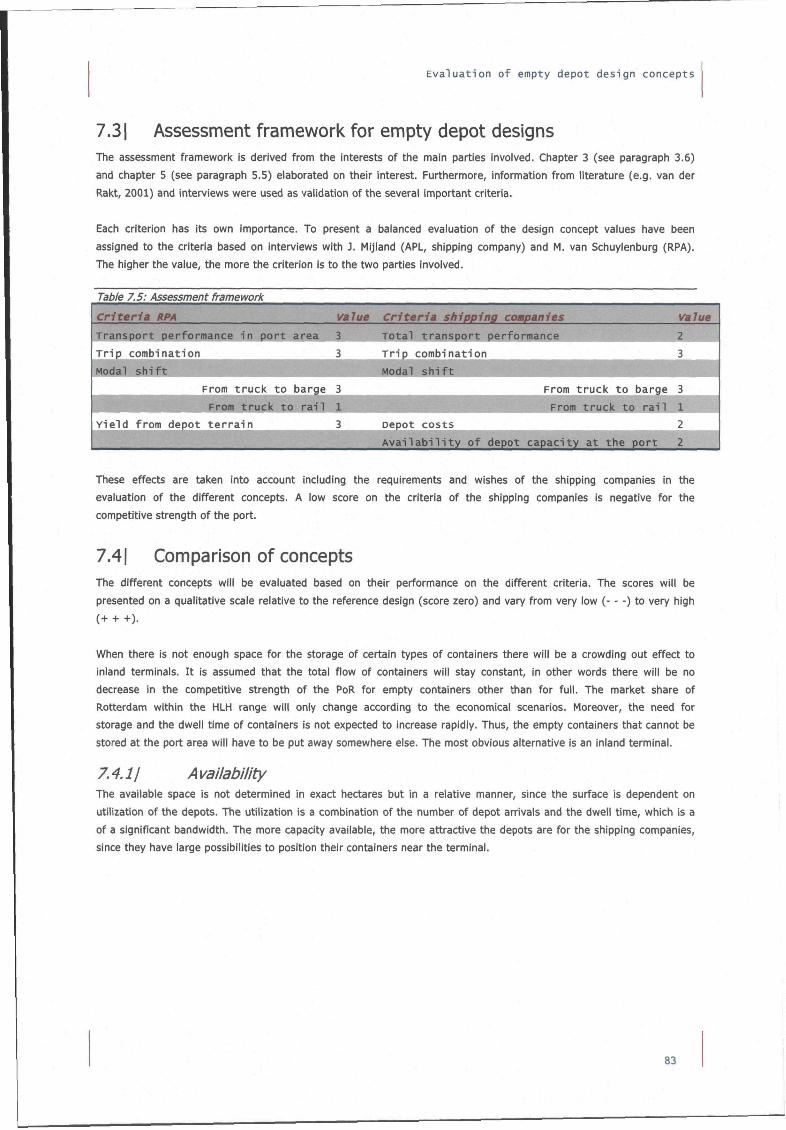
Evaluation of empty depot design concepts
7.31 Assessment framework for empty depot designs The assessment framework is derived from the interests of the main parties involved. Chapter 3 (see paragraph 3.6)
and chapter 5 (see paragraph 5.5) elaborated on their interest. Furthermore, information from literature (e.g. van der
Rakt, 2001) and interviews were used as validation of the several important criteria.
Each criterion has its own importance. To present a balanced evaluation of the design concept values have been
assigned to the criteria based on interviews with J. Mijland (APL, shipping company) and M. van Schuylenburg (RPA).
The higher the value, the more the criterion is to the two parties involved.
Table 7.5: Assessment framework
These effects are taken into account including the requirements and wishes of the shipping companies in the
evaluation of the different concepts. A low score on the criteria of the shipping companies is negative for the
competitive strength of the port.
7.41 Comparison of concepts The different concepts will be evaluated based on their performance on the different criteria. The scores will be
presented on a qualitative scale relative to the reference design (score zero) and vary from very low (- - -) to very high
(+ + +).
When there is not enough space for the storage of certain types of containers there will be a crowding out effect to
inland terminals. It is assumed that the total flow of containers will stay constant, in other words there will be no
decrease in the competitive strength of the PoR for empty containers other than for full. The market share of
Rotterdam within the HLH range will only change according to the economical scenarios. Moreover, the need for
storage and the dwell time of containers is not expected to increase rapidly. Thus, the empty containers that cannot be
stored at the port area will have to be put away somewhere else. The most obvious alternative is an inland terminal.
7.4.11 Availability The available space is not determined in exact hectares but in a relative manner, since the surface is dependent on
utilization of the depots. The utilization is a combination of the number of depot arrivals and the dwell time, which is a
of a significant bandwidth. The more capacity available, the more attractive the depots are for the shipping companies,
since they have large possibilities to position their containers near the terminal.
83
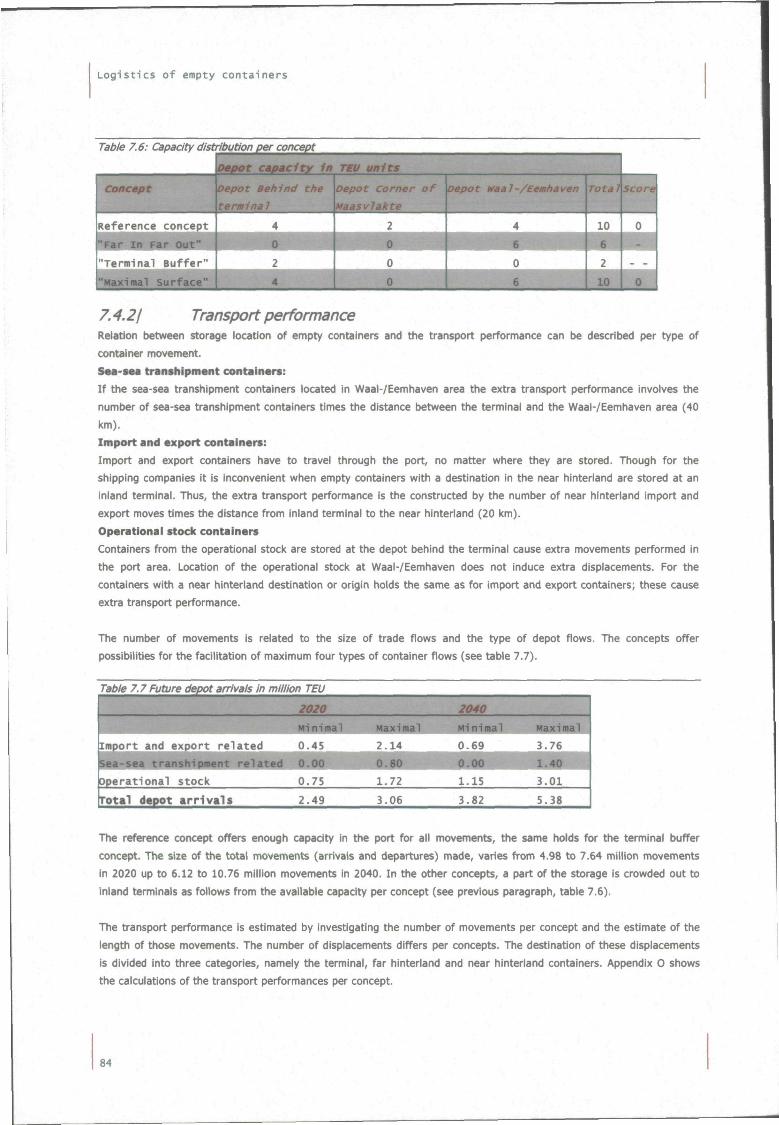
Logistics of empty containers
Table 7.6: Capacity distribution per concept
7.4.21 Transport performance Relation between storage location of empty containers and the transport performance can be described per type of
container movement.
S«a-sea transhipment containers: If the sea-sea transhipment containers located in Waal-/Eemhaven area the extra transport performance involves the
number of sea-sea transhipment containers times the distance between the terminal and the Waal-/Eemhaven area (40
km).
Import and export containers:
Import and export containers have to travel through the port, no matter where they are stored. Though for the
shipping companies it is inconvenient when empty containers with a destination in the near hinteriand are stored at an
inland terminal. Thus, the extra transport performance is the constructed by the number of near hinteriand import and
export moves times the distance from inland terminal to the near hinteriand (20 km).
Operational stock containers Containers from the operational stock are stored at the depot behind the terminal cause extra movements performed in
the port area. Location of the operational stock at Waal-/Eemhaven does not induce extra displacements. For the
containers with a near hinteriand destination or origin holds the same as for import and export containers; these cause
extra transport performance.
The number of movements is related to the size of trade fiows and the type of depot fiows. The concepts offer
possibilities for the facilitation of maximum four types of container fiows (see table 7.7).
Table 7.7 Future depot arrivals In million TEU
iMPort and export related
Operational stock
rotal depot arrivals
2020
Minimal
^ 0 ^ 4 ^ ^ ^
0.75
2.49
Maximal
^ ^ ^ ^ ^
1.72
3.06
2040
Minimal
^ 0 ^ 6 ^ ^ ^
1.15
3.82
Maximal
^ 3 ^ 7 ^ ^
3.01
5.38
The reference concept offers enough capacity in the port for all movements, the same holds for the terminal buffer
concept. The size of the total movements (arrivals and departures) made, varies from 4.98 to 7.64 million movements
in 2020 up to 6.12 to 10.76 million movements in 2040. In the other concepts, a part of the storage is crowded out to
inland terminals as follows from the available capacity per concept (see previous paragraph, table 7.6).
The transport performance is estimated by investigating the number of movements per concept and the estimate of the
length of those movements. The number of displacements differs per concepts. The destination of these displacements
Is divided into three categories, namely the terminal, far hinterland and near hinterland containers. Appendix 0 shows
the calculations of the transport performances per concept.
84
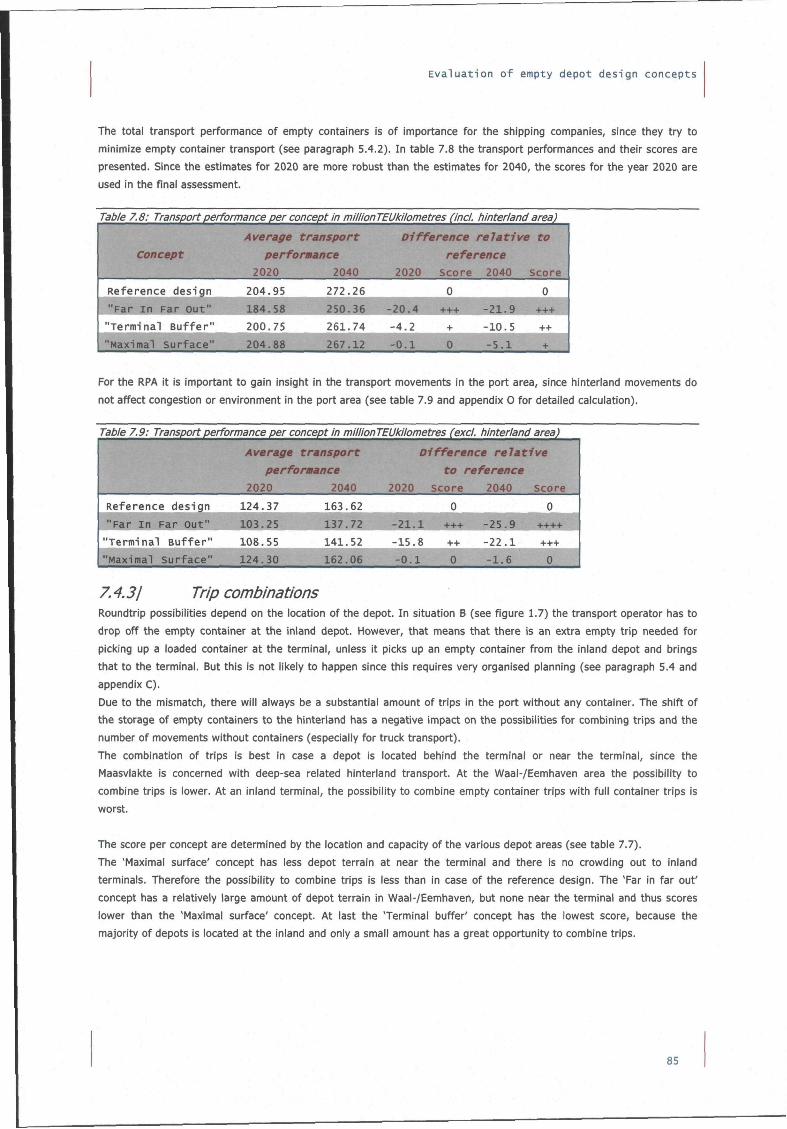
Evaluation of empty depot design concepts
The total transport performance of empty containers is of importance for the shipping companies, since they try to
minimize empty container transport (see paragraph 5.4.2). In table 7.8 the transport performances and their scores are
presented. Since the estimates for 2020 are more robust than the estimates for 2040, the scores for the year 2020 are
used in the final assessment.
Table 7.8: Transport performance per concept in millionTEUkilometres (incl. hinterland area)
Concept Average transport
performance 2020 2040
Difference relative to reference
2020 Score 2040 Score
Reference design
"Far in Far out
"Terminal Buffer"
'^Maximal Surface
204.95 272.26 0 0
I^I^HB^I 200.75
* | ' " * ' J ! 1 ! | ! K ' ^ 261.74
B^m -4 .2
- 0 . 1
B*-++
+
0
- 2 1 . 9 ;
-10 .5
- 5 . 1
+++
++
+
For the RPA it is important to gain insight in the transport movements in the port area, since hinteriand movements do
not affect congestion or environment in the port area (see table 7.9 and appendix 0 for detailed calculation).
Table 7.9: Transport performance per concept in millionTEUkilometres (excl. hinterland area)
Average transport performance
2020 2040
Difference relative to reference
2020 score 2040 Score
Reference design
"Far In Far Out"|
"Terminal Buffer"
«Maximal Surface"
124.37
108.55
124.30
7.4.31 Trip combinations Roundtrip possibilities depend on the location of the depot. In situation B (see figure 1.7) the transport operator has to
drop off the empty container at the inland depot. However, that means that there is an extra empty trip needed for
picking up a loaded container at the terminal, unless it picks up an empty container from the inland depot and brings
that to the terminal. But this is not likely to happen since this requires very organised planning (see paragraph 5.4 and
appendix C).
Due to the mismatch, there will always be a substantial amount of trips in the port without any container. The shift of
the storage of empty containers to the hinterland has a negative impact on the possibilities for combining trips and the
number of movements without containers (especially for truck transport).
The combination of trips is best in case a depot is located behind the terminal or near the terminal, since the
Maasvlakte is concerned with deep-sea related hinteriand transport. At the Waal-/Eemhaven area the possibility to
combine trips is lower. At an inland terminal, the possibility to combine empty container trips with full container trips is
worst.
The score per concept are determined by the location and capacity of the various depot areas (see table 7.7).
The 'Maximal surface' concept has less depot terrain at near the terminal and there is no crowding out to inland
terminals. Therefore the possibility to combine trips is less than in case of the reference design. The 'Far in far out'
concept has a relatively large amount of depot terrain in Waal-/Eemhaven, but none near the terminal and thus scores
lower than the "Maximal surface' concept. At last the 'Terminal buffer' concept has the lowest score, because the
majority of depots is located at the inland and only a small amount has a great opportunity to combine trips.
85
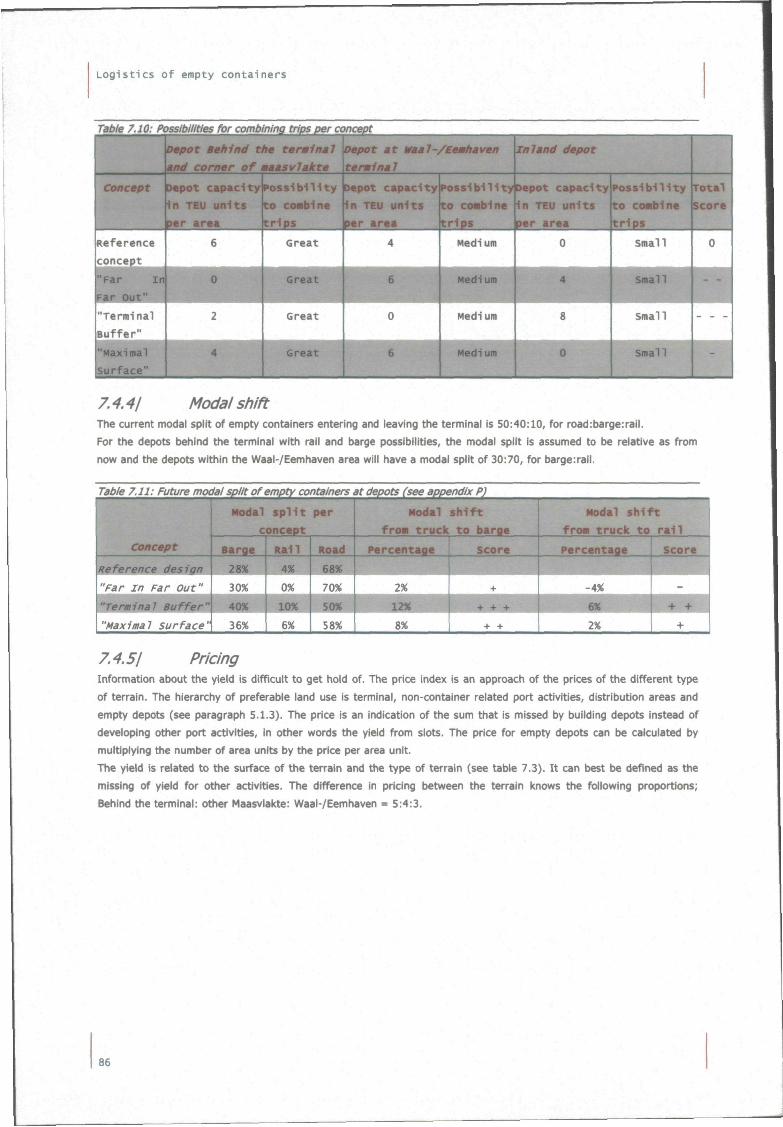
Logistics of empty containers
Table 7.10: Possibilities for combining trips per concept
Depot Behind the terminal
and corner of maasvlakte
Depot at Waal-/Eemhaven
termina 1
Inland depot
Concept Depot capaci i
n TEU un-its
per area
t y Pos s i b i l i t y
to conblne
t r i p s
Depot capac i ty
In TEU un i ts
per area
p o s s l b l l l
to co«b1ne
t r i p s
tyDepot capaci ty
I n TEU uni ts
per area
P o s s i b i l i t y
t o coablne
t r i p s
Tota l
Score
Reference
concept
Great
Far in Great
Tera ina l
Isuffer"
Maximal
Surface"
Great
Great
Medi um
Medium
Medium
Medium
small
7.4.41 Modal shift The current modal split of empty containers entering and leaving the terminal is 50:40:10, for road:barge:rall.
For the depots behind the terminal with rail and barge possibilities, the modal split is assumed to be relative as from
now and the depots within the Waal-/Eemhaven area will have a modal split of 30:70, for barge:rail.
Table 7.11: Future modal split of
Concept
Reference design
"Far in Far Out"
empty containers at depots (see appendix P)
Modal s p l i t per
concept
Barge
28%
30%
Rail
4%
OX
"Maximal Surface' 36X 6%
Road
68%
70X
Modal shi f t
from trucic to barge
Percentage
2%
score
+
Modal shi f t ' S
from truck to ra i l ^
Percentage
-4%
score
-
58% 8% 1 + + 2% +
7.4.51 Pricing Information about the yield is difficult to get hold of. The price index is an approach of the prices of the different type
of terrain. The hierarchy of preferable land use is terminal, non-container related port activities, distribution areas and
empty depots (see paragraph 5.1.3). The price is an indication of the sum that is missed by building depots instead of
developing other port activities, in other words the yield from slots. The price for empty depots can be calculated by
multiplying the number of area units by the price per area unit.
The yield is related to the surface of the terrain and the type of terrain (see table 7.3). It can best be defined as the
missing of yield for other activities. The difference in pricing between the terrain knows the following proportions;
Behind the terminal: other Maasvlakte: Waai-/Eemhaven - 5:4:3.
86
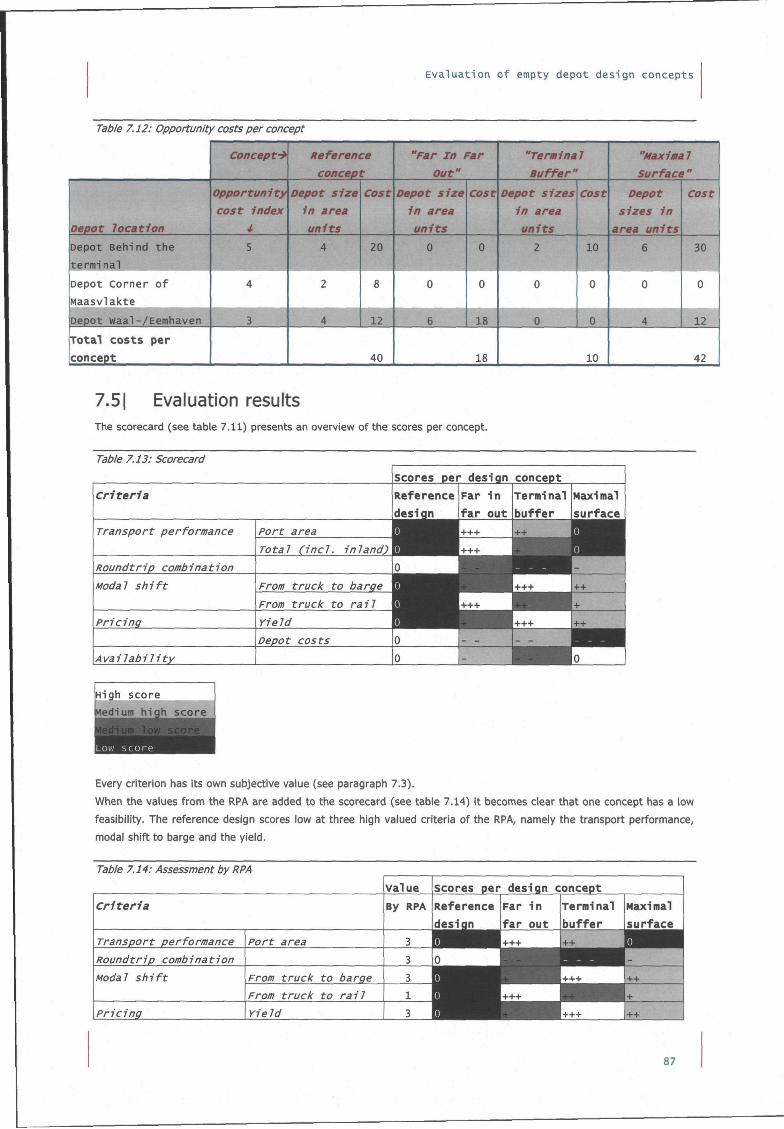
Evaluation of empty depot design concepts
Table 7.12: Opportunity costs per concept
Depot location
Depot Behind the
t e r m i n a l
Depot co rne r o f
Maasvlakte
Depot Waal-/Eemhaven
Tota l costs per
concept
Concept-^ Reference
concept
Opportunity Depot size
cost index in area
4 units
5
4
3 ' * •
4
2
^™^^
cost
20
8
T 40
"Far in Far
Out"
Depot size
in area
units
0
0
6
cost
0
0
18
18
"Terminal
Buffer"
Depot sizes
in area
units
cost
"Maxima 1
Surface " Depot
sizes in
area units
cost
2 10 6 30
0
0
0
0
10
0
4
0
12
42
7.51 Evaluation results The scorecard (see table 7.11) presents an overview of the scores per concept.
Table 7.13: Scorecard
criteria
Transport performance
Roundtrip combination
Modal shift
Pricing
Availability
Port area
Total (incl. inland)
From truck to barge
From truck to rail
Yield
Depot costs
Scores per design concept
Reference
design M Far I n
f a r out
+++
Terminal
bu f fe r
++
+++ ^ ^ ^ ^ ^ H
Maximal
surface •i ^H ^^H^^^^H-
0
0
^^^^^l+++ ++
+-I-+ ^ ^ ^ ^ ^ 1 +
^^^^^l+++ _ _
_
++
- - ^B^^ ^^^Ho
High score
• score
^•HHË- iow score 1
^MÉÉHÉ Every criterion has its own subjective value (see paragraph 7.3).
When the values from the RPA are added to the scorecard (see table 7.14) it becomes clear that one concept has a low
feasibility. The reference design scores low at three high valued criteria of the RPA, namely the transport performance,
modal shift to barge and the yield.
Table 7.14: Assessment by RPA
criteria
Transport performance
Roundtrip combination
Modal shift
Pricing
Port area
From truck to barge
From truck to rail
Yie Id
Value
By RPA
Scores per design concept
Reference
design
Far I n
f a r out
^ ^ ^ ^ H + +4 3
3
1
3
Termlna!
bu f fe r
++
B^BB^++^^^^ +++ ^^^^^^B ^^^^^H+++
Maximal
surface
^KÊÊÊk _
++
+
++
87
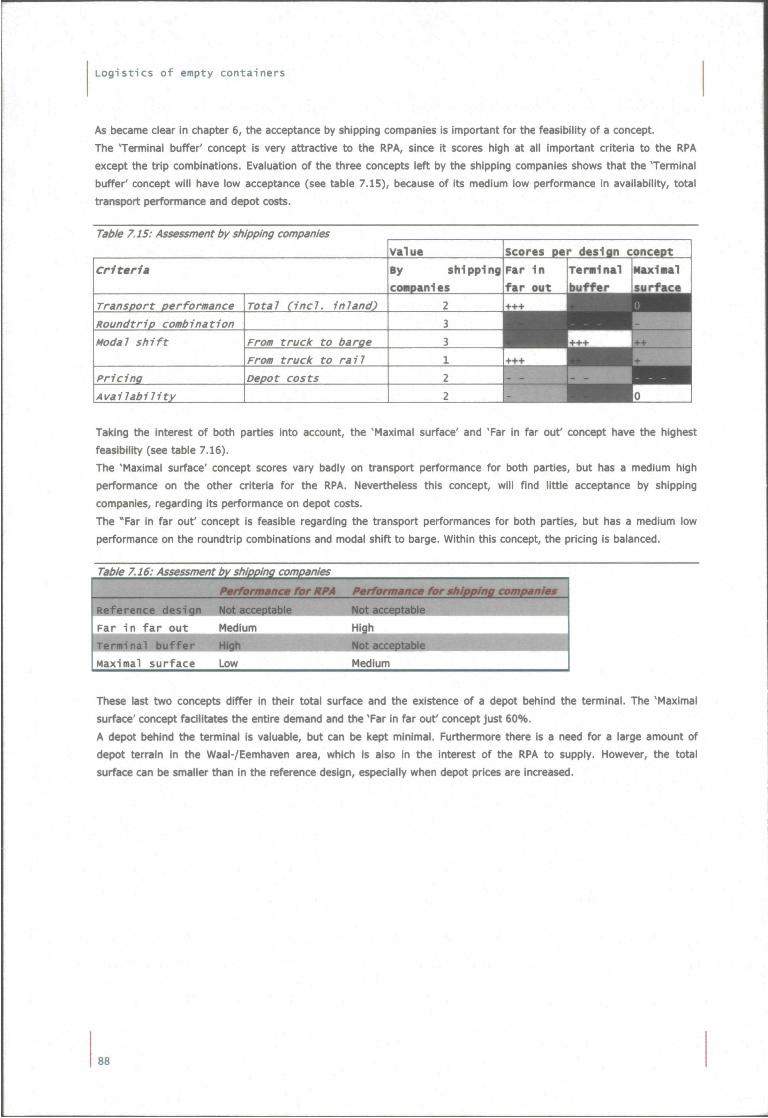
Logistics of empty containers
As became clear in chapter 6, the acceptance by shipping companies is important for the feasibility of a concept.
The 'Terminal buffer' concept is very attractive to the RPA, since it scores high at all important criteria to the RPA
except the trip combinations. Evaluation of the three concepts left by the shipping companies shows that the 'Terminal
buffer' concept will have low acceptance (see table 7.15), because of its medium low performance in availability, total
transport performance and depot costs.
Table 7.15: Assessment by shipping companies
criteria
Transport performance
Roundtrip combination
Modal shift
pricing
Availability
Total (incl. inland)
From truck to barge
From truck to rail
Depot costs
value
By shipping
coapanles
scores pe
Far In
far out
+++
+++
m'
r design concept
Terainal
buffer
Maxlaal
surface
^^^^^ I V ^ +++ ++
^^^^^^^H-i-
- - ^ H ^ m 0 Taking the interest of both parties into account, the 'Maximal surface' and 'Far in far ouf concept have the highest
feasibility (see table 7.16).
The 'Maximal surface' concept scores vary badly on transport performance for both parties, but has a medium high
performance on the other criteria for the RPA. Nevertheless this concept, will find littie acceptance by shipping
companies, regarding its performance on depot costs.
The "Far in far out' concept is feasible regarding the transport performances for both parties, but has a medium low
performance on the roundtrip combinations and modal shift to barge. Within this concept, the pricing is balanced.
These last two concepts differ in their total surface and the existence of a depot behind the terminal. The 'Maximal
surface' concept facilitates the entire demand and the 'Far in far out' concept just 60%.
A depot behind the terminal is valuable, but can be kept minimal. Furthermore there is a need for a large amount of
depot terrain in the Waal-/Eemhaven area, which is also In the interest of the RPA to supply. However, the total
surface can be smaller than in the reference design, especially when depot prices are increased.
88
81 Conclusions and recommendations
The existence of empty containers is often seen as a negative side product of container transport. The movements
related to the empty container logistics have an impact on the capacity of the hinteriand network and the accessibility
of the Port of Rotterdam and on the environment. The Rotterdam Port Authority is constrained in her plans by
environmental regulations.
Due to the different parties involved with various interests and tasks, insight in the supply chain of containers is
complex. The main parties involved in the planning of new empty depots are the Rotterdam Port Authority and the
shipping companies and they proved to have some confiicting interests.
When designing empty depots for a new port area a few variables can be distinguished. A combination of design
variables forms design concepts. Each design variable has different levels. The number of levels is limited.
Relevant design elements of a port depot are:
o the amount of slots and their area, assigned for depot operators
o the location of depot areas,
o the lease price of land.
These three factors form the level playing field of the RPA.
For shipping companies, it is very important that they can use empty depots to position their containers in a flexible
manner. The unavoidable mismatch of an empty container in time and place causes a need for storage. Empty depots
form an important part of service provision towards shipping companies and by this means infiuence the
competitiveness of the port.
A feasible strategy towards the allocation of empty depots (balancing the supply and demand for empty depots) can be
divided into two elements; the location and the quantity.
Location
Another aspect is the different possibilities for storage. Besides, the usual empty depots in the port area also a port
terminal can function as a substitute for the empty depot to a limited degree. Next to these options, inland terminals
are also suitable for functioning as an empty depot. Regarding the transport movements of empty containers, it seems
efficient to store containers of the operational stock at inland terminals. This crowding out effect is restricted by the
following factors:
1. Storage costs, relative to the Far East, other ports in the HLH - range
2. High demand for used containers in Europe
3. Storage at the port entails more possibilities to combine hinteriand trips
4. The type of hinterland haulage (merchant haulage requires storage at the port)
5. High range of depot activities is offered in the port in contrast with inland terminals
6. Uncertainty in demand and destination of empty containers (central storage)
7. Location of importers and exporters (supply of region Rotterdam)
Ad 1: The storage costs at depots in Northwest Europe is lower than in Asia. At the PoR, the depot prices are lower
than at the other ports in the HLH-range.
Ad 2: Europe has a relatively good secondary container market. In Europe, the demand for used containers is higher
than in Asia.
89
Logistics of empty containers
Ad 3: The use of inland depots increases the efficiency of empty container moves, but decreases the efficiency of the
vehicle logistics. Trip patterns and compensation have traditionally been based on round trips to and from the deep-sea
container terminals. The introduction of inland depots introduced a non-revenue "third leg" to truck trip patterns.
Ad 4: Carrier haulage is characterised by an exchange between inland repositioning providers and ocean carriers and
by less inefficient movements between inland terminal and the port. Shipping companies have a better insight in origin
and destination of the containers. Shipping companies, using merchant haulage, prefer to have the containers returned
to the port for financial and organisational reasons.
Ad 5: At the port there are more services regarding the repair of empty containers.
Ad 6: In practice containers from various inventories ('matchback', operational, repositioning and obsolete stock) are
being exchanged. When empty containers are in stock, the destination of the container is not 100 percent certain.
Based on estimates from the shipping company the empty containers are positioned in different inventories. A great
uncertainty in the developments within various trades (and thus various types of containers) makes forecasting a
difficult task. Moreover, each shipping company has its own repositioning strategy. The whole of individual optima
reflects in a mixed overall picture of empty container movements. The demand for empty depots differs per type of
shipping company, nevertheless every shipping company needs a certain amount of depot terrain in the port, and
especially near the terminal. Repositioning of empty containers is an inevitable activity. The port is an ideal node in the
network of positioning, due to the widespread presence connections.
Ad 7: In order to supply exporters in the region of Rotterdam, it is advantageous for shipping companies to locate their
operational stock in one depot at the port.
Hub containers require storage behind the terminal, as well as a certain amount of 'matchback' containers. The sea hub
function of the port depots is minimal. Other type of containers might be stored, somewhere else in the port (like
Waal-/Eemhaven area). When needed, they can be transported to the terminal within an acceptable time span.
A part of the demand for space can be taken over by inland terminals. However, this does not imply that port depots
are not necessary when trade volumes will rise.
When the RPA aims at achieving a modal shift, all depots should have a water connection. . A modal shift in empty
container transport can be achieved by locating empty depots behind terminals or by assigning depots to lots with a
water connection. A connection of a depot with the terminal is logistically efficient. Nevertheless, it is not lucrative for
the RPA to locate all empty depots behind the terminals at MV2.
Quantity
Empty containers are becoming noteworthy. The empty deep sea throughput will be twice as high (1.93 million TEU) in
2020 relative to 2005, in 2040 the empty containers volumes will have grown 5 times the amount of 2005 (5.32 million
TEU).
Different former researches estimated the demand for depot terrain at Maasvlakte 2 varying from 15 to 136 ha In 2040.
These estimates are based on an extrapolation of the present relation on port and empty depot throughput or space.
The key determinants are ICT developments, type of haulage, empty deep-sea transhipment and scale enlargements.
It is reasonable to expect an increase in ICT applications, which may decrease the need (volume and time) for storage
of empties.
The organisational structure is characterised by merchant and carrier haulage. The share between these two types is
known to fluctuate, but short-term trends are disputable. A shift towards merchant haulage increases the need for
storage in the port area.
The empty deep-sea throughput has a linear relation with the full deep-sea container throughput end the imbalance,
between import and export deep-sea container throughput. By means of regression analysis, the relation between the
future numbers of empty deep-sea throughput is identified. This results in the following forecasts:
In 2020, the deep-sea throughput will be on average (in neutral scenario) 11 million TEU, of which 2 million TEU empty
and in 2040 27 million TEU, of which 5 million empty. The empty throughput in the PoR is growing slower than the
throughput in full containers.
90
Conclus ions and recommendations
The relation between empty container throughput at the port terminal and port depots is not linear. The depot arrivals
increase less than port throughput.
Economies of scale positively infiuence the chance of matching a container with cargo. The general increase of
container flows, will increase the turn around speed of the inventory is high, and therefore diminishes the need for
inventory. The trend of the relation between the empty depot arrivals and the empty container throughput in the port
is identified and extrapolated to the future.
The demand for empty depots is approximately 2 million TEU in 2020 and 3 million TEU in 2040, in case there is no
'crowding out'-effect (i.e. maximum facilitation of demand). The estimates of the number of depot arrivals in 2020 vary
2.1 to 2.4 million TEU in 2020 and on 2.7 to 3.2 million TEU in 2040. Under condition that the current average dwell
time and the terrain productivity remains unchanged in the future, the required space for empty depots varies from
100 to 113 ha in 2020 and 127 to 149 ha in 2040, for the entire PoR.
In case the current depot terrains do not change (85 ha), this results in a requirement for 15 to 28 ha empty depot
terrain in 2020 and 42 to 64 ha for 2040 for Maasvlakte 2.
Given the infiuence and uncertainty of future conditions on the utilisation of empty depots, it is complicated to
estimate the quantitative demand for depot terrain for 2020 and 2040. The greater part of the future conditions, have
an infiuence on a small scale and a lower level of detail. Nevertheless, the estimates made of depot arrivals for 2040
are probably a modicum too high.
The possibilities for further decrease the storage capacity in the port seems advantageous at first sight. Nevertheless,
there is a great uncertainty on the long-term developments, of which some are affecting the position of the PoR.
An interesting issue in this research is the identification of possibilities to relatively decrease the area for empty depots
at the PoR. It is likely that the storage of empty containers shifts towards inland depots. The tight supply of terrain
however may result in the following effects.
A reduction in supply may lead to less service to port users. The throughput of the port will decrease, as shipping
companies take refuge in other ports for their storage of empty containers.
Tight supply might be an incentive to further increase matchability, to a shift from merchant towards carrier haulage,
or to less dwell time by avoiding maintenance and repair in the port depots. Due to the complicated logistic market, it
is difficult to predict the future developments.
To protect the competitive strength of the port, in case of tight supply, mitigating measures are needed to keep the
same level of service to the clients. Potential mitigating measures can compensate for the decrease in supply of depot
terrain. This new approach requires a commercially innovative attitude of the PoR towards empty container services.
The possibilities for mitigating measures were investigated, but both the RPA and the shipping companies are of the
opinion that those extra container services should originate independentiy as result of market dynamics.
Allocation
The analysis of the different allocations of depot terrains, confirmed that it is advantageous to allocate terrain in a
master plan in order to prevent planning difficulties in later stages. This strategy results in lots, that are suitable for
empty container storage, due to their accessibility by different modalities and to logistical efficient location.
Until the empty depot volumes reach the maximal level of occupancy, there will be terrain that the RPA cannot lease to
depot operators yet, because the market for depot operators is insufficient at that moment. Therefore, it is lucrative
and recommendable for the RPA to find temporary destinations for terrain that will be used for empty depot in a later
stage.
In order to adjust to changes in the demand, the supplying possibilities need to be flexible. By restricting the duration
of lease contracts with depot operators (about of five years) and by fractioning the leased depot terrain, fiexibility will
be achieved.
A drawback from the use of lease containers for the RPA is the need for lease depots in the port. Since the dwell time
of off-lease containers is relatively large, lease depots require a relatively large amount of space. It is recommended to
minimize lease depots in the port.
91
Logistics of empty containers
It is advantageous to increase the depot prices, since this will stimulate the crowding out effect. Regarding the prices
of competing ports there is enough room for price increase.
Recommendations for further research
In this report it became clear which factors infiuence the need for the storage of empty containers. Monitoring trend in
these factors and the depot arrivals and their trajectories, is important for a feasible facility for empty container
storage in the PoR.
Developments around the mega depot Maersk is planning to create should be followed. Maersk creates large
transhipment volumes in the PoR and is consequentiy responsible for a large part of the need for empty container
storage. When Maersk (in stead of depot operators) takes charge of depot services at its terminal, there is less need
for depots elsewhere in the PoR.
Furthermore, the flows of empty containers through port depots require monitoring. The following aspects of the depot
moves are of importance to refine the estimates of the future demand:
Type of container (distinction in reefer or standard and TEU or FEU)
Type of modality
Direction (towards MV or hinteriand)
Dwell time
Price level of depot services
It is recommended that the RPA monitors the above-mentioned aspects, since an objective and multimodal approach is
required.
Further research is needed to investigate the role of lease containers and the storage of off-lease containers. The dwell
time of off lease containers is remarkably higher than of containers in use. Negotiations in location, time and costs of
dropping off and hiring make this a complex situation.
On the long term, the relation between terminal throughput and depot moves can be nuanced. This is possible with
data collection about the full and empty deep sea and feeder container fiows over the years and by data collection of
depot arrivals. Within the available data from the RPA there has only been made a distinction between three types of
fiows, namely between deep sea to hinterland (deep sea containers), between deep sea to short sea (feeder
containers) and between hinterland and short sea (short sea containers). The utilisation of the port as a deep-sea hub
for empty containers requires further investigation regarding the magnitude of this flow and the motivation for the
shipping companies.
92
Epilogue
The efficiency problem of empty containers has been investigated before, however, not concerning the problems of
port planning. At first, there was the intent to search for a solution regarding the empty transport. Solutions like those
of collapsible containers and return logistics haven been investigated. Nevertheless, it appeared that those concepts
were not capable of preventing storage of empty containers, since the logistics of empty containers is not simple, in
fact there are many factors playing a role. But by investigating the feasibility of those concepts, more insight was
gained in the problem itself
In the process of the research different approaches were considered; theory versus practice, testing hypotheses,
simulating the container flows from deep sea transport to hinteriand destinations, developing alternative to which
extend (level of detail and level of possible interference of the RPA). The ultimate choice was to map the situation for
the PoR and to evaluate some abstract concepts, as a first step in the investigating the possibilities of empty container
storage and its effects for balancing the supply with the demand.
Intangible dynamics make this issue very difficult to analyse in a structured way. Multiple people, who I have spoken in
relation to this issue, confirm this. This can be further illustrated by the tests with RFID, which are held in Hamburg
(Eurift, 2006). This main objective of the tests is to gain transparency of the supply chain of containers in reality. In
other words, currentiy the supply chain is not clear. Full insight in origin and destination of containers would make the
problem easier to approach. Shipping companies work on basis of stocks and not from an individual container tracks
point of view. The number of possible destinations origin and container status, make a quantitative approach turbid.
I had the privilege to attend to the common planning activities at APL (shipping company) for one day. This generated
insight in the numerous factors playing a role in steering containers, maintaining stocks and the constraints of
transporting empty containers by sea. The tremendous effort needed for container management, rendered by a group
of calling, e-mailing and deliberating employees was very impressive.
When considering the different approaches, the concept of the TIL-master also played a role. A TIL Master thesis
should be a balance between the theory lectured at the faculty of Mechanical, Maritime and Materials Engineering
(3ME) and at the faculty of Technology, Policy and Management (TPM), accompanied by questions about what can be
typified as a technical component in logistics. Nevertheless, there were also aspects of the theory of Civil Engineering
and Geosciences (CITG) applicable, regarding the hinterland transportation and infrastructure.
A special discussion in this research was the need for a simulation. Concerning the technical aspect of the educational
program, it seemed a logical step. On the other hand, there were questions about the practical value and problems
with the gathering of data.
Yet, the thesis has become a combination of all fields. The broad approach of the multi-actor aspect, the operational
aspects and the policy aspect made the issue difficult to mark. Furthermore, different methods from different fields
have been applied, which made the research not only multidisciplinary but also interdisciplinary.
Just like this research, the educational program of the TIL-master is very broad, from designing a transporter bridge to
the analysis of congestion on roadways to risk analysis in case of repairing an oilrig. In my opinion the skill to link the
different elements together has been taken too lightly within the educational program, which I have faced during this
research. The concept of the different scopes within the TIL-field has been applied. However, there is not a universal
methodology to approach all TIL-issues.
The broad approach stimulates the following answer to possible solutions: 'Yes, that is possible, but regarding this
aspect...', which leads to indecisiveness. On the other hand that is valuable, since uni-disciplinary research focus on
93

Logistics of empty containers
suboptimalisation, which possibly replaces bottlenecks. A research with a purely 3ME background, would have focussed
on a detailed design of a depot or on the stock management of a shipping company. A research with a background of
civil engineering would have focussed on the traffic movements and the effects on the accessibility. And a TPM
research would have focussed in detail on the policy of the RPA or in the collaboration of parties involved in the supply
chain. However it is not possible to go deep and broad into an issue within one thesis. The interscope relations make
the research difficult to present in a structured way, since the different subjects are linked to each other.
94
References
Literature
Adviesbureau van Roon (2000), Track, Onderzoek containervervoer Rijnmondgebied 2000.
Alderton, P.M. (2005) Port management and operations, Londen: LLP
Antwerp Port Authority (2006) Port Handbook, Statistics, Antwerp
Arthur D. Little, Rijsenbrij Consultancy and TNO Inro (1999) Sectorstudie containers, Rotterdam
Baird, A.J. (2006) Optimising the container transhipment hub location in norhtern Europe, in: Journal of Transport
Geogrgraphy, Vol.14, No.3, p. 195-214
Beddow, M (2006) Peacable or predatory, in: Containerisation International april p.53-55.
Blauwens, G., P de Baere and E. van de Voorde (2006) Transport Economics, Antwerpen
Boilé, M. (2005) Empty Marine Container Management in a Marine Container Management in a Port Mega City Region,
Maritime Infrastructure Engineering and Management Program, Rutgers University
Boilé, M. (2006) Empty intermodal container management, Rutgers the University of New Jersey
Bots, P.W.G. (2003) Inleiding technische bestuurskunde. Technische Universiteit Delft
Buck Consultants International (1999) Sectorstudie Distributie, Nijmegen
Bureau vooriichting binnenvaart (2006) Waardevol transport, Rotterdam
Centraal Plan Bureau, NEI and Rijksinstituut voor Volksgezondheid en milieu (2000) Welvaartseffecten Maasvlakte 2,
Kosten-batenanalyse van uitbreiding van de Rotterdamse haven door landaanwinning
Charies River Associates (2004) Study on the Port of Rotterdam - market definition and market power, Brussels
Choong, S.T., M. H. Cole and E. Kutanoglu (2001), Empty container management for intermodal transportation
networks, in.-Transportation Research Part E 38 (2002) p. 423-438
Containerisation International (2006), Key numbers East west trade cargo analysis, april
Connekt (2003) Famas Maasvlakte 2: Truck afhandeling. Delft
Coyle, R.G. (1996). Optimization in system dynamics in: System dynamics Modeling: A practical approach. Chapman
and Hall, London, pp.236-248.
Davies, P (2006) Off-Dock Storage of Empty Containers in the Lower Mainland of British Columbia: Industry Impacts
and Institutional Issues, Transport Canada, Vancouver
95
Logistics of empty containers
De Brito, M.P. and R. Konings (2006), The reverse logistics of empty maritime containers. First conference on
International Logistics, 'Logistics in Global Economy: Challenges and Trends,' INTLOG 2006, September 23-26,
Poland (forthcoming).
Decisio (2002) Tussenevalutaie Subsidieregeling Openbare Inland Terminals, Amsterdam
Dekker, T. and J. Eenhuizen (2005) De toekomst van empty depots in het havengebied, Rotterdam
Driel, van. P., Nentjes, A. en Rietveld, P.(2000), Achtergrondstudie Verkeer en Vervoer, Den Haag: VROM-raad
Projectgroep Verkeer en Vervoer
Dynamar (2005) The North Europe Far East container trade
Ecorys (2004) Ontwikkeling marktaandeelmodel containersector, Rotterdam
Ecorys (2005) Complementary economic evaluation Rotterdam
Enserink, B., 3.F.M. Koppenjan, W.A.H. Thissen (2002) Analyse van complexe omgevingen. Technische Universiteit Delft
European Transport n.25-26 (2005):81-88
Erera, A.L., J. C. Morales and M. Savelsbergh (2006) Robust Optimization for Empty Repositioning Problems, The
Logistics Institute School of Industrial and Systems Engineering, Georgia Institute of Technology, Atlanta
Eurift (2006) RFID in sea freight provides greater transparency in the supply chain, in: Eurift Newsletter No. 154, week
35/2006
European Commission (2003) Ralfh Comparison of Ports, Brussels
Financieel dagblad (2006) Eu vergroot onrust op containermarkt, 3 oktober
Foxcroft, A. (2004) Box drama, in: Containerisation international, August, 54-57
Foxcroft, A. (2006a) Tougher times ahead, in: Containerisation International, September, p.60-63
Foxcroft, A. (2006b) Where is the belgan chockablock?, in: Containerisation International, January, p.56-57.
Germis, J. en Vannieuwenhuyse B. (2002) Promodi resultatenrapport 2002, Antwerpen
Gaussin {2006) Optimised transport solutions for ports and inland terminals, Hericourt
Hengst-Bruggeling, den, M. (1999) Interorganisational Coordination in Container Transport, a chain management
design. Delft University of Technology
Heijden, van der, R.E.C.M. and W.A.H. Thissen, Regulering van files, Blad Bestuurskunde jaargang 3 nummer 2 p.58-68
Incodelta Zuid-Nederland (2005) Eindrapport project 'SIKZNEB', Tilburg
Kijzerwaard, P.J. and J.H. Smit (2003) De lege containersector anno 2003, Rotterdam
96
References
Konings, R and R. Thijs (2001) Foldable contianers: a new perspective on reducing contianerrepositioning costs,
Technological, logistic and economic issues, in: European Journal of Transport and Infrastructure Research,
vol 1., no. 4, pp. 333 - 352.
Konings, R. (2004) Smart collection and distribution of containers on barge in the port of Rotterdam, at: NECTAR
cluster meeting Freight Transport and Intermodallty, Lugano
Konings, R. (2005a) Foldable containers to reduce the Costs of emtpy transport? k cost-Benefit Analysis from a Chain
and Multi-Actor prespective in: Maritime Economics and Logistics, No. 7, p.223-249
Konings, R (2005b). How to boost market introduction of foldable containers? The unexpected role of containerlease
industry. Delft
Kruk, C.B. (2006) Hinterland connections and intermodal transport
Lago, A en J.L. Wu (2000) Empty container depot. Allocation problem with balance requirements
Ligteringen, H. (2000) Ports and terminals. Delft University of Technology
Ludema, M. (2005) Self-evaluation 2005, Interfaculty MSc Degree Programme, Transport, Infrastructure <S Logistics,
Delft University of Technology
Lopez, E. (2003) How do ocean carriers organize the empty container repositioning activity in the USA? in: Maritime
Policy Management, Vol. 30, No. 4, p. 339-355
Lloyds shipping economist (2006) A special case, June 2006, p.21-23
Maersk Sealand (2000) Electronic Commerce and International Transport, Services; Ocean Carrier Perspective
Notteboom, T. (2002) Current issues in Port Logistics and Intermodallty, Antwerpen: Garant uitgevers
Notteboom, T and J.P. Rodrigue (2004) Inland freight distribution and the Sub-harborization of Port Terminals, In: Proceeding of the First International Conference of Logistics Strategy for ports, 22-26 September 2004, Dalian, China/Licheng Sun [edit.] e.a., Dalian, Dalian Maritime University Press, 2004, p.365-382
Rotterdam Port Authority (2006a) Port statistics 2005, Rotterdam: Port Information desk
Powell, W.B., B. Bouzaiene-Ayari and H. P. Simao (2003) Dynamic Models for Freight Transportation, Department of
Operations Research and Financial Engineering Princeton University
Rabobank Nederland Corporate Clients (2004) Sectorverkenning container binnenvaart, Utrecht
Rakt, B.J.A. van der (2001) Voorontwerp afhandeling Wegcontainers in knooppunt Maasvlakten, Delft
Rakt, B.J.A. van der (2002) Onderzoek naar de mogelijke inrichtingen en bijbehorende ontwerpeisen van de
wegcontainerafhandeling in knooppunt Maasvlakten in 2020, TUDelft
Realise (2004) Multimodal transport pricing and costing analysis, Workplan 4, task 4.2, Brussels
Ritchey (1998) Modeling complex socio technical systems using morphological analysis At: 16'" Euro Conference on
Operational Analysis, Brussels
97
Logistics of empty containers
Robinson, R. (2002) Ports as elements in value-driven chain systems: the new paradigm. Maritime Policy and Management, 29, 241-255.
ROI (2002) Profit optimization for container carriers. White paper, Longmont USA
Rotterdam Port Authority (2005) Ruimtevraag containersector op MV2 in 2020 en 2040, op basis van nieuwe lange
termijn ramingen, Rotterdam
Senter Novem (2005) Doelgroepanalyse verladerssamenwerking, Amstelveen
Stribley N. (2000) Owning versus Leasing - New answers to an old issue?, in: Intermodal 2000, Genua, December.
Tanigushi, E. and R.G. Thompson (2003) Innovations in freight transport, Southampton, Boston; WITpress
Tioga Group (2002) Empty container logistics study, California
Transport 8i Logistiek, 8 januari 2004
Vasiliauskas, A. V. and D. Bazaras (2006) Analysis of problems with containers as intermodal loading unit, in: Transport
and Telecommunications, Vol. 7, No.2, p.232-239
Vancouver Container Truck Association (August 24, 2005) Submission to the Task Force on Transportation and
Industrial Relations Issues in the Ports of Vancouver, pp 7-8.
Wee, B. van en M. Dijst (2002) Verkeer en vervoer in hoofdlijnen, Bussum: Coutinho
Welters, H.W.H (2000) Haven- en terminal planning, De containermarkt: een analyse, Erasmus Universiteit Rotterdam
Woxenius, J. (1994) Modelling European Combined transport as an Industrual System, Department of Transportation
and Logistics, Chalmer University of Technology, Göteborg, Sweden.
Web sites Coventry University (1999) Analysis of stock holding costs, http://www.kbe.cov.ac.uk/eMDATA/68EOQ.html
export bureau {200f>) A-Z Dictionary of Export, Trade and Shipping Terms,
http://www.exportbureau.eom/trade_shipping_terms/M.html
Havenraad (2006) Facts and figure, http://www.minvenw.nl/extdomein/havenraad/facts_figures/defin_nstr.htm, august
2006
Interglobo International Freight Forwarders (2006), Trades, http://www.lnterglobo.it/news/news21.htm
ITS library (2006), Fifty years of container shipping,
http://translib.blogspot.com/2006/04/50-years-of-container-ship_114589782592624873.html, July 2006
Rotterdam Port Authority (2006b), Incoming and outgoing containers by trade areas 2004,
http://www.portofrotterdam.com/mmfiles/Containers%20naar%20vaargebied%20jaar_tcm26-9614.pdf, July
2006
98
References
Rotterdam Port Authority (2006c), Incoming and outgoing containers over sea at Rotterdam by classes of length 2004 -
2005, http://www.portofrotterdam.com/mmfiles/Containers%20jaar_tcm26-9649.pdf, July 2006
Port of Rotterdam (2006d) Port tariffs,
http://www.portofrotterdam.com/en/maritime/seashipplng/port_tariffs/index.jsp, July 2006
Port of Hamburg (2006) Container throughput worldwide, http://www.hafen-
hamburg.de/en/index.php?option=com_content&task=view&id=58&Itemid=91, august 2006
Project organisatie Maasvlakte 2 (2006) Fysieke kenmerken,
http://www.maasvlakte2.com/nl/aanleg/kenmerken/index.jsp, July 2006
99
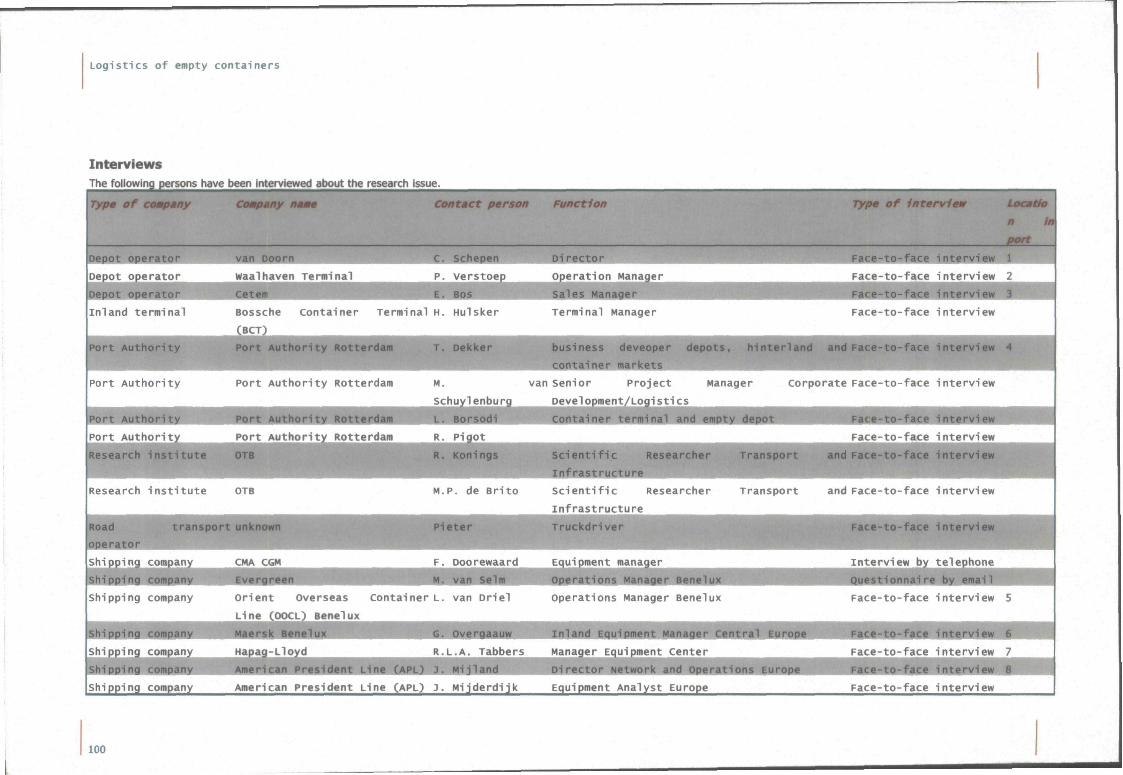
Logistics of empty containers
Interviews The following persons have been interviewed about the research issue.
type of company N P U H p f f f f y name Wfl^mitact person Function Type of Intervlem LoeaOo
n In
port
)epot operator
loepot operator
pepot operator?
Inland terminal
k^van J H iiiiaiiftr sch MMOlMMiÉaMaMi
waalhavenTjralnal^^^^^^P. verstpej
Ite tjl^^HHI^^IH^IH &o£ Bossche container Terminal H. Hulsker
(BCT
|o
Di rector mÊÊÊm
Research Institute O T B M.P. de Brito
Operation Manager
Sales Manager|
I erminal Manager
business deveopi
container market
van Senior Project
Development/Logistics
Container terminal and e!
Scientific Reseijj
Infrastructure
Scientific Researcher
Infrastructure
Truckdrlvi
Face-to-fac
Face-to-face
Face-to-fac
Fa<:e-to- face
:erview
In terv iew 2
in terv iew
Face-to- face in terv iew
ipping coapan
iPi
Shipping company
ihipplngl
shipping compan
H ü i É l i i compa
Shipping company
Or ient Overseas container L. van D r i e l
J J n e (OOCL) Benelux ^ ^ ^ ^ ^ ^
H ^ a p a g - L l o y d ^ ^ ^ ^ ^ ^ ^ ^ ^ ^ ^ R j L ^ A j T a b b e r s
American President Line (APL) 3. M i j d e r d i j k
operations Manager Benelux Face-to-face interview 5
ppmc
Manager Eouipment Center
i c t e l ^ K t w o
Equipment Analyst Europe Face- to- face In terv iew
100
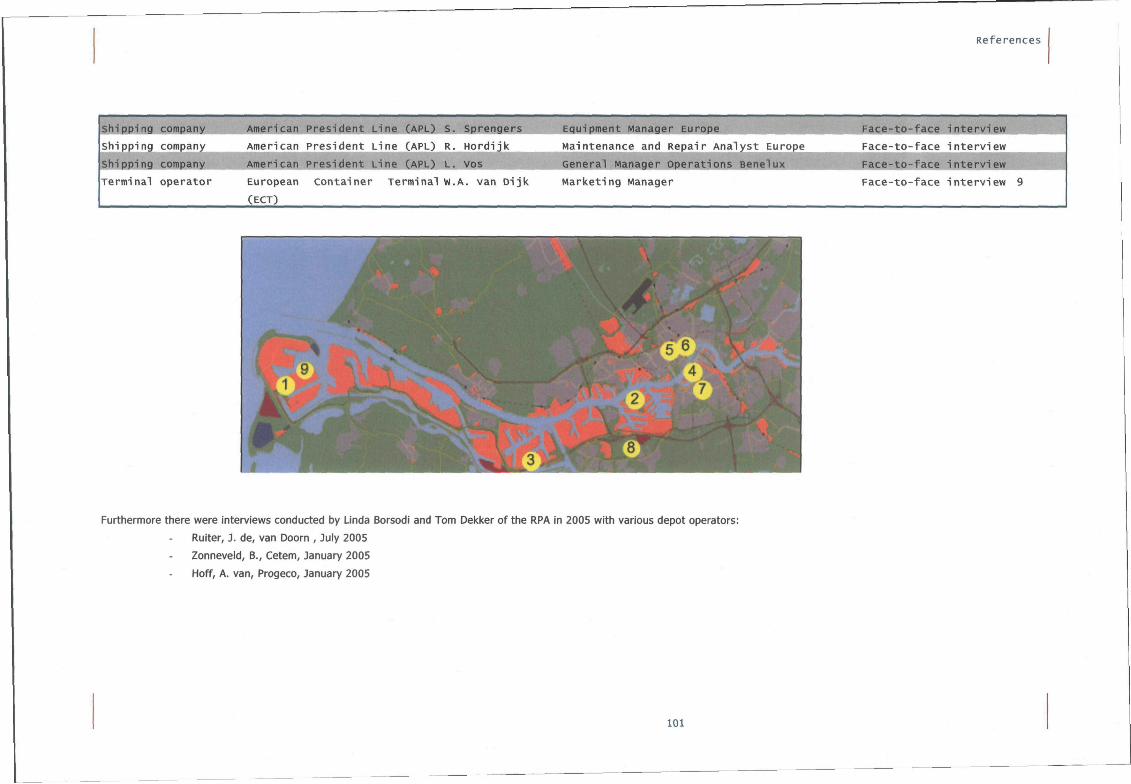
References
Shipp ing
s h i p p i n g
Sh ipp ing
Terminal
company
company
company
ope ra to r
American P res iden t L ine ( A P L )
American P res iden t L ine (APL)
Amer i caO i i ^as i den t L ine (APL)
European Con ta ine r Terminal
(ECT)
S.
R.
L .
W.
S o r e n o e r s ^ H '
H o r d i j k
VOS ^ 1
A. van D i j k
Eouioment Manaoer Eurooe ^ ^ ^ ^ ^ ^ ^ ^ H
Maintenance and Repair A n a l y s t Europe
General Manaoer Ooera t ions w M ^ ^ ^ ^ H
Marke t ing Manager
H I Faco'^tö- face
Face- to - facG
I B P F a c e - t o - f a c e
F a c e - t o - f a c e
i n te r v i i ^ ^ ^ ^ B H
i n t e r v i e w
i n t e r v i e i ^ ^ ^ ^ K
i n t e r v i e w 9
Furthermore there were interviews conducted by Linda Borsodi and Tom Dekker of the RPA in 2005 with various depot operators:
Ruiter, J. de, van Doorn , July 2005
Zonneveld, B., Cetem, January 2005
Hoff, A. van, Progeco, January 2005
101

Logistics of empty containers
102
Glossary
The definition of the different terms in this glossary are based on literature of Alderton (2005), Charles River
Associates (2004), Notteboom (2002), Export Bureau (2006), Hengst-Bruggeling (1999) and Konings (2005).
Cabotage
The carriage of a container from a surplus area to an area specified by the owner of that container, in exchange of
which and during which the operator can use this container.
(There are other definitions of cabotage, which do not apply to this research:
0 Transport of goods between two ports or places located in the same country.
0 Transport of cargo in a country other than the country where the vehicle is registered (road-cargo).)
Carrier Haulage
The inland transport service, which is performed by the sea carrier (shipping company) under the terms and conditions
of the tariff and of the relevant transport document.
Container
A truck trailer body that can be detached from the chassis for loading onto a vessel, a rail car, or for stacking.
Containers may be ventilated, insulated, refrigerated, flat rack, vehicle rack, open top, bulk liquid, dry bulk, or other
special configurations. Typical containers may be 20 feet, 40 feet, 45 feet, 48 feet, or 53 feet in length, 8 feet or 8.5
feet in width, and 8.5 feet or 9.5 feet in height
Container Pool
A certain stock of containers which is jointly used by several container carriers and/or leasing companies.
Container Stacic
Two or more containers, one placed above the other, forming a vertical column. Container Sublease Contract by which
a carrier gives the use of containers to another carrier for a specified period of time and for fixed payments.
Container Terminal
An area designated for the stowage of cargo in containers, usually accessible by truck, railroad and marine
transportation, where containers are picked up, dropped off, maintained, and housed.
Container Yard
A materials handling/storage facility used for completely unitised loads in containers and/or empty containers.
Consolidation
The grouping together of smaller consignments of goods into a large consignment for carriage as a larger unit in order
to obtain a reduced rate. A consolidated container is loaded with several shipments (consignments) from different
shippers for delivery to one or more consignees.
Crowd Out
Press, force, or thrust out of a small space
103
Logist ics of empty containers
Deep sea transhipment Distribution method, where containers are moved to or from a deep sea-going vessel, via the quay. Movements to or
from short sea vessels are no part of deep sea transhipment. Herewith transhipment from a deep sea vessel to a short
sea vessel is counted as one move (in contrast with transhipment at port, where feeder services are counted twice).
Deficit area
Region where there is a shortage of empty containers. Generally more exporters than importers are located in a deficit
area. Antonym: surplus area.
Forty-foot Equivalent Unit (FEU)
Unit of measurement equivalent to one forty foot container. Two twenty-foot containers (TEU's) equal one FEU.
Container vessel capacity and port throughput capacity are frequentiy referred to in FEU's or TEU's.
Feeder Service
Transport service, whereby loaded or empty containers in an international area are transferred to or from a "mother
ship" for a long-haul ocean, continental, voyage.
Haulage
The inland carriage of cargo or containers between to points.
Hamburg-Le Havre range (HLH-range)
Competing ports located between Hamburg and Le Havre in Germany, the Netheriands, Belgium and France; Hamburg,
Bremen, Wilhelmhaven, Amsterdam, Rotterdam, Zeeland Seaports, Zeebrugge, Duinkerken and Le Havre.
Hinteriand
The area which uses the PoR as port for the transhipment of their import or export cargo.
Hub
The central transhipment point in a transport network, serving a number of consignees and/or consignors by means of
spokes.
Hub Port or Centre Port
A hub port is a port where a significant part of the total cargo transhipment, has neither a destination nor an origin in
the port region. Also sometimes referred to as a mega port, direct call port, hub and load centre port, mega hub
(greater than four million TEU's per annum), super hub (greater than 1 million TEU's per annum, load centre port or
pivot port.
Idle time
The time involved in a container, which is not being used for the transportation of cargo.
Imbalance
A structural inequity in cargo flows between two points, where the flow in one direction is exceeding the flow in the
opposite direction.
Intermodal Transport
Intermodal transport involves the movement of goods in one and the same loading unit (or even in the same vehicle)
which uses successively several modes of transport without handling of the goods themselves in changing modes.
(Intermodal transport is a subset of multimodal transport)
Interzonal Positioning
104
References
Displacement of empty containers including a signiflcant sea voyage.
Intrazonai Positioning
Displacement of empty containers over land.
Landlord Port
An institutional structure whereby the port authority or other relevant public agency retains ownership of the land, as
well as responsibility for maintaining approach channels and navigation aids; under this model, the port does not
engage in any operational activities.
Logistics
Lloyds' practical shipping guide defines logistics as an optimisation process of the location, movement and storage of
resources from the point of origin, through various economic activities, to the final consume.
Maritime Container or Marine Container
Containers that are transported over sea between two continents. The term continental container includes those
containers that do not cross the border of a continent via overseas transport, i.e. short sea.
Matchability
The possibility to make a match between an empty container and cargo or means of transport.
Mariceting
The process of organising and directing all the company activities which relate to determining the market demand and
converting the customers buying power into an effective demand for a service and bringing that service to the
customer.
Materials Handling
Short distance movement of goods within a storage area. The activities of loading, unloading, placing and manipulating
material and of in-process movement.
Materials Management
The planning and control of the activities related to the materials flow from the suppliers up to the end of the
conversion/production process.
Means of Transport Type of vehicle used for the transport of goods (e.g. aircraft, barge, truck, vessel or train).
Merchant For cargo carried under the terms and conditions of the Carrier's Bill of Lading and of a tariff, it means any trader or
persons (e.g. Shipper, Consignee) and including anyone acting on their behalf, owning or entitied to possession of the
goods.
Merchant Haulage
Inland transport of cargo in containers arranged by the Merchant. It includes empty container-moves to and from
hand-over points in respect of containers released by the Carrier to Merchants. Note: Carrier's responsibility under the
Bill of Lading does not include the inland transport stretch under Merchant Haulage.
Modal Shift Change in the modal split
105
Logistics of empty containers
Modal Split Division of container fiows over different modes of transport (barge- , rail-, and road). The unit of this entity is
percentages per mode of the total moves.
Mode of Transport Method of transport used for the conveyance of goods, (e.g. by rail, by road, by sea).
Move or movement The act or process of changing the position of a container
Multimodal Transport The carriage of goods (containers) by at least two different modes of transport
Obsolete Stoelt The products or materials that cannot be or is unlikely to be used in future processes and which is to be sold or
disposed of through the usual outlets.
Operational stocic
Stock of empty containers, which will be reused for export from the hinteriand area of Rotterdam.
Opportunity cost
The cost of something in terms of an opportunity forgone and the benefits that could be received from that opportunity
(the most valuable alternative).
PoR
Port of Rotterdam
Port Dues Charges levied against a ship owner or ship operator by a port authority for the use of a port.
Reefer
Refrigerated container, requiring electrical supply points on ship, on terminal and for maintenance and repair on
depots.
RPA Rotterdam Port Authority
Sea-carrier See shipping company
Sea-Land Transhipment
Distribution method, where containers are moved between a sea-going vessel and a hinterland means of transport, via
the quay.
Sea-Sea Transhipment
Distribution method, where containers are moved from a sea-going vessel to a sea-going vessel, via the quay.
Secondary maricet
Market for used containers.
106
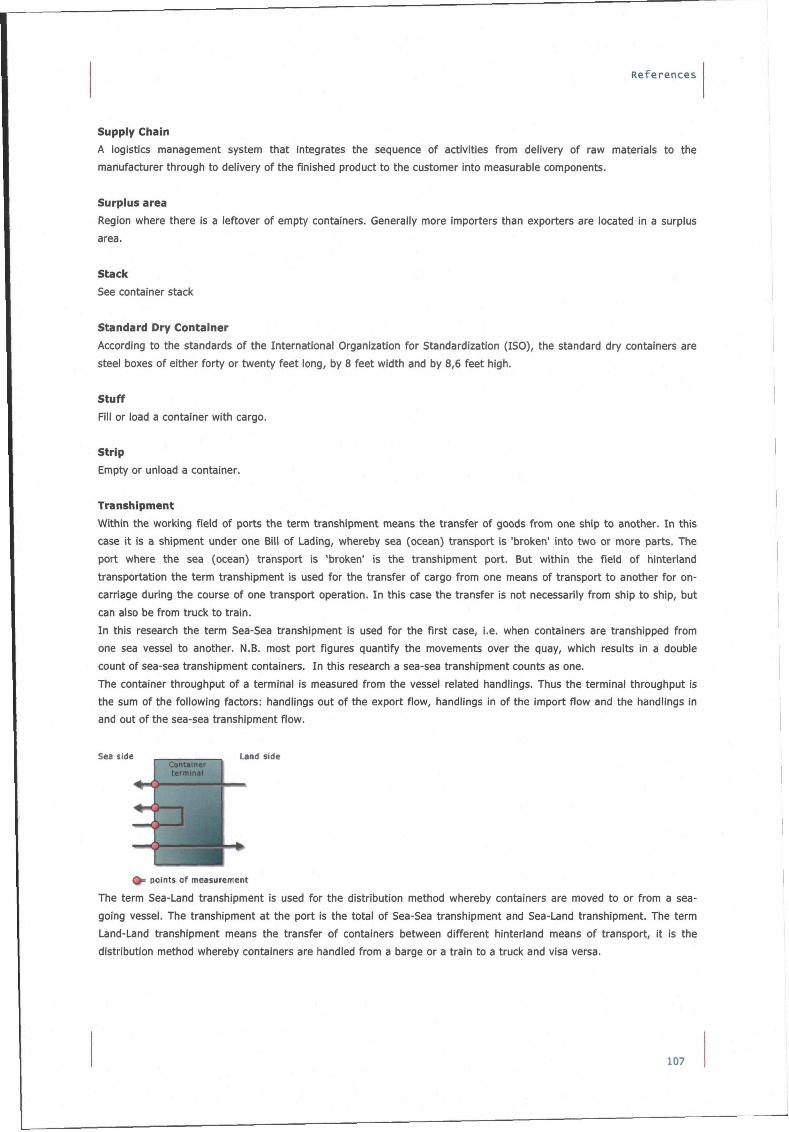
References
Supply Chain A logistics management system that integrates the sequence of activities from delivery of raw materials to the
manufacturer through to delivery of the finished product to the customer into measurable components.
Surplus area
Region where there is a leftover of empty containers. Generally more importers than exporters are located in a surplus
area.
Stacic
See container stack
Standard Dry Container
According to the standards of the International Organization for Standardization (ISO), the standard dry containers are
steel boxes of either forty or twenty feet long, by 8 feet width and by 8,6 feet high.
Stuff
Fill or load a container with cargo.
Strip
Empty or unload a container.
Transhipment
Within the working field of ports the term transhipment means the transfer of goods from one ship to another. In this
case it is a shipment under one Bill of Lading, whereby sea (ocean) transport is 'broken' into two or more parts. The
port where the sea (ocean) transport is 'broken' is the transhipment port. But within the field of hinterland
transportation the term transhipment is used for the transfer of cargo from one means of transport to another for on-
carriage during the course of one transport operation. In this case the transfer is not necessarily from ship to ship, but
can also be from truck to train.
In this research the term Sea-Sea transhipment is used for the first case, i.e. when containers are transhipped from
one sea vessel to another. N.B. most port figures quantify the movements over the quay, which results in a double
count of sea-sea transhipment containers. In this research a sea-sea transhipment counts as one.
The container throughput of a terminal is measured from the vessel related handlings. Thus the terminal throughput is
the sum of the following factors: handlings out of the export fiow, handlings in of the import fiow and the handlings in
and out of the sea-sea transhipment flow.
Sea side , . Land side
^ points of measurement
The term Sea-Land transhipment is used for the distribution method whereby containers are moved to or from a sea
going vessel. The transhipment at the port is the total of Sea-Sea transhipment and Sea-Land transhipment. The term
Land-Land transhipment means the transfer of containers between different hinteriand means of transport, it is the
distribution method whereby containers are handled from a barge or a train to a truck and visa versa.
107
Logist ics of empty containers
Twenty-foot equivalent unit (TEU) Container size standard of twenty feet. Two twenty foot containers (TEU's) equal one FEU. Container vessel capacity
and port throughput capacity are frequentiy referred to in FEU's or TEU's.
TEU-factor Factor for converting the number of containers to the number of TEU's. Currently the TEU-factor is 1,6 In the PoR. For
the future it is assumed to be 1,7 since the share of large containers (FEU's) is expected to grow.
108

Appendices
109

Logistics of empty containers
110
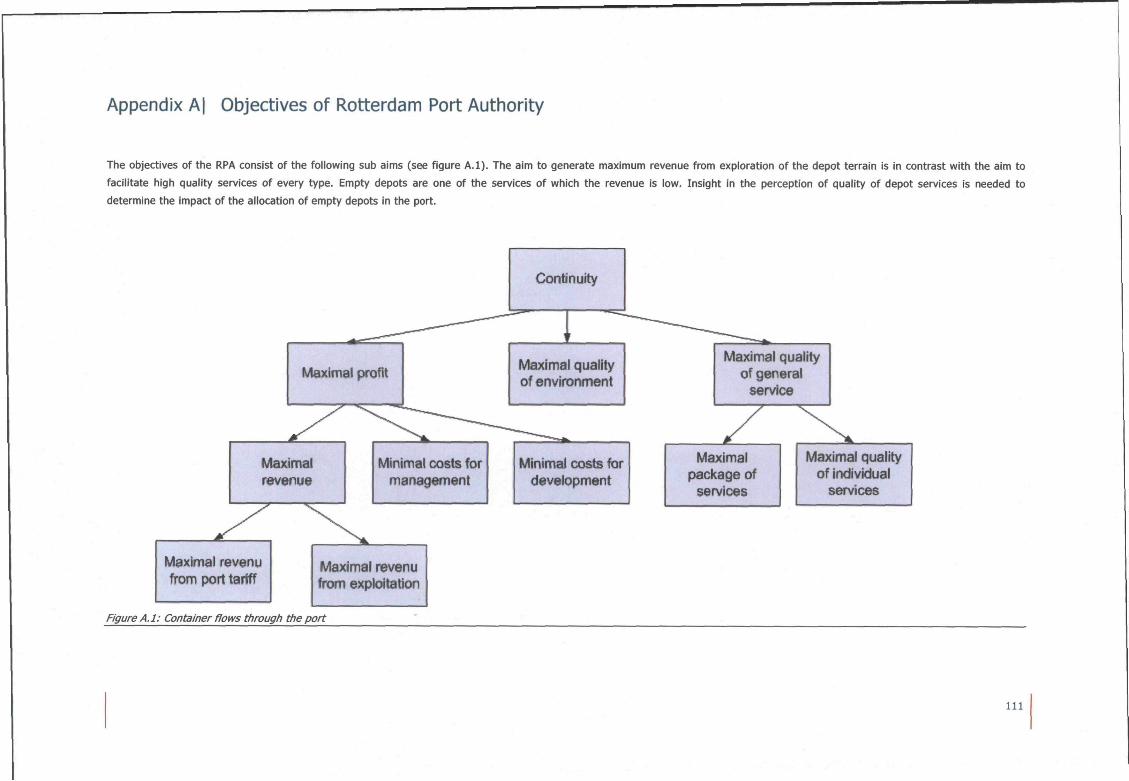
Appendix A| Objectives of Rotterdam Port Authority
The objectives of the RPA consist of the following sub aims (see figure A.l). The aim to generate maximum revenue from exploration of the depot terrain is in contrast with the aim to
facilitate high quality services of every type. Empty depots are one of the services of which the revenue is low. Insight in the perception of quality of depot services is needed to
determine the impact of the allocation of empty depots in the port.
Continuity
Maximal profit Maximal quality of environment
Maximal revenue
Minimal cx)sts for management
Minimal costs for development
Maximal quality of general
service
Maximal package of
services
Maximal quality of individual
services
Maximal revenu from port tariff
Maximal revenu from exploitation
Figure A.l: Container flows through the port
111

Logist ics of empty containers
112
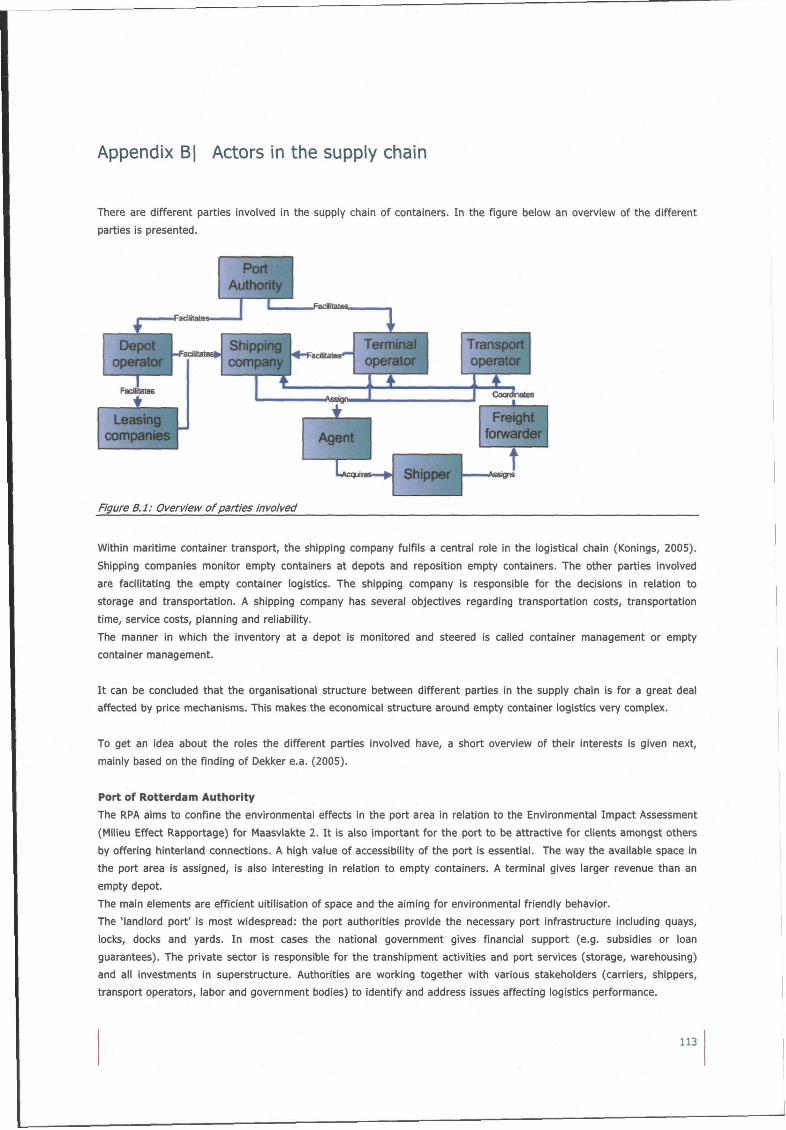
Appendix B| Actors in the supply chain
There are different parties involved in the supply chain of containers. In the figure below an overview of the different
parties is presented.
Depot"^ operator I
Facllitali
Facilitates^
Facilitates
t , Leasing '
companies
Figure B.l: Overview of parties involved
Within maritime container transport, the shipping company fulfils a central role in the logistical chain (Konings, 2005).
Shipping companies monitor empty containers at depots and reposition empty containers. The other parties involved
are facilitating the empty container logistics. The shipping company is responsible for the decisions in relation to
storage and transportation. A shipping company has several objectives regarding transportation costs, transportation
time, service costs, planning and reliability.
The manner in which the inventory at a depot is monitored and steered is called container management or empty
container management.
It can be concluded that the organisational structure between different parties in the supply chain is for a great deal
affected by price mechanisms. This makes the economical structure around empty container logistics very complex.
To get an idea about the roles the different parties involved have, a short overview of their interests is given next,
mainly based on the finding of Dekker e.a. (2005).
Port of Rotterdam Authority The RPA aims to confine the environmental effects in the port area in relation to the Environmental Impact Assessment
(l*1ilieu Effect Rapportage) for Maasvlakte 2. It is also important for the port to be attractive for clients amongst others
by offering hinterland connections. A high value of accessibility of the port is essential. The way the available space in
the port area is assigned, is also interesting in relation to empty containers. A terminal gives larger revenue than an
empty depot.
The main elements are efficient uitilisation of space and the aiming for environmental friendly behavior.
The 'landlord port' is most widespread: the port authorities provide the necessary port infrastructure including quays,
locks, docks and yards. In most cases the national government gives financial support (e.g. subsidies or loan
guarantees). The private sector is responsible for the transhipment activities and port services (storage, warehousing)
and all investments in superstructure. Authorities are working together with various stakeholders (carriers, shippers,
transport operators, labor and government bodies) to identify and address issues affecting logistics performance.
113
Logist ics of empty containers
Port depot operator The port depot functions as an empty container buffer for the terminal. An increasing turnover can be realized when
the speed of throughput increases.
Port terminal operator
The port terminal is a buffer for empty containers of which the destination is known.
Inland depot operator
At an inland depot empty containers are being repositioned and extra services like cleaning and repairs are carried out.
An inland depot differs from an inland terminal In the sense that a terminal is used in case of intermodal transport. In
that case empty and full containers are being transshipped. A depot operator rather handles containers from a shipping
company than lease containers because of the difference in revenue.
Shipping company A shipping company has several objectives, summed up below.
• Minimum transportation costs. A minimal distance between depot and exporter is preferred.
• Minimum transportation time. Sometimes it is preferable to use a barge terminal, since congestion on the road
causes too much delay.
• Minimum service costs. If possible big repairs are done in Asia because that is cheaper.
• Minimum buffer of empty containers while dealing with the fiuctuations in demand.
• Minimum planning costs. The number of buffers determines the complexity of planning effort.
• Reliable service
There is a need for a distinction between different shipping companies, as the strategy of large companies differ from
the small ones.
Trucicing company
The trucking companies prefer make a round trip, where the depot is near to the terminal. This way an empty
container can be moved to the depot and a full container is being picked up at the terminal.
In the current situation trucking companies earn by driving with an empty container.
Municipality
An empty depot brings on local traffic, which is not in the best interest of the concerning municipality. On the other
hand the establishment of a depot improves the employment.
Exporter
The exporter needs empty containers to export its goods. Often too many empry containers are ordered to minimize
the risk of having too less containers available.
Importer
At the importing company the trailers are emptied. Usually the importer possesses no facilities to pick up the container
and lift it off the trailer.
Lease companies
Try to rent their containers as much as possible to shipping companies. Long term lease: the lease company decides
where the container needs to be dropped off
Master lease: expensive and for one or several trips. The shipping company decides where they drop off. Lease
maatschppij moet dna repositioneren.
Long term leases have significant impact on the throughput volume in depots as lower gate volumes from leasing
companies mean lower repair revenues to depots. When ocean carriers have been faced with strengthening demand,
rising container prices, lengthening delivery lead times and shortfalls in immediately available stocks they tended to
lease in greater amounts and take the cost of moving containers from surplus to demand areas at their own expense.
Drop off charges (penalty costs for dropping the container of at a surplus area) usually do not reflect the expenses in
repositioning of the containers, because the leasing company has to hire slots from the carrier. This explains why it is
not lucrative to apply these contracts on large scale. The carrier though is able to give his own priority for containers.
114
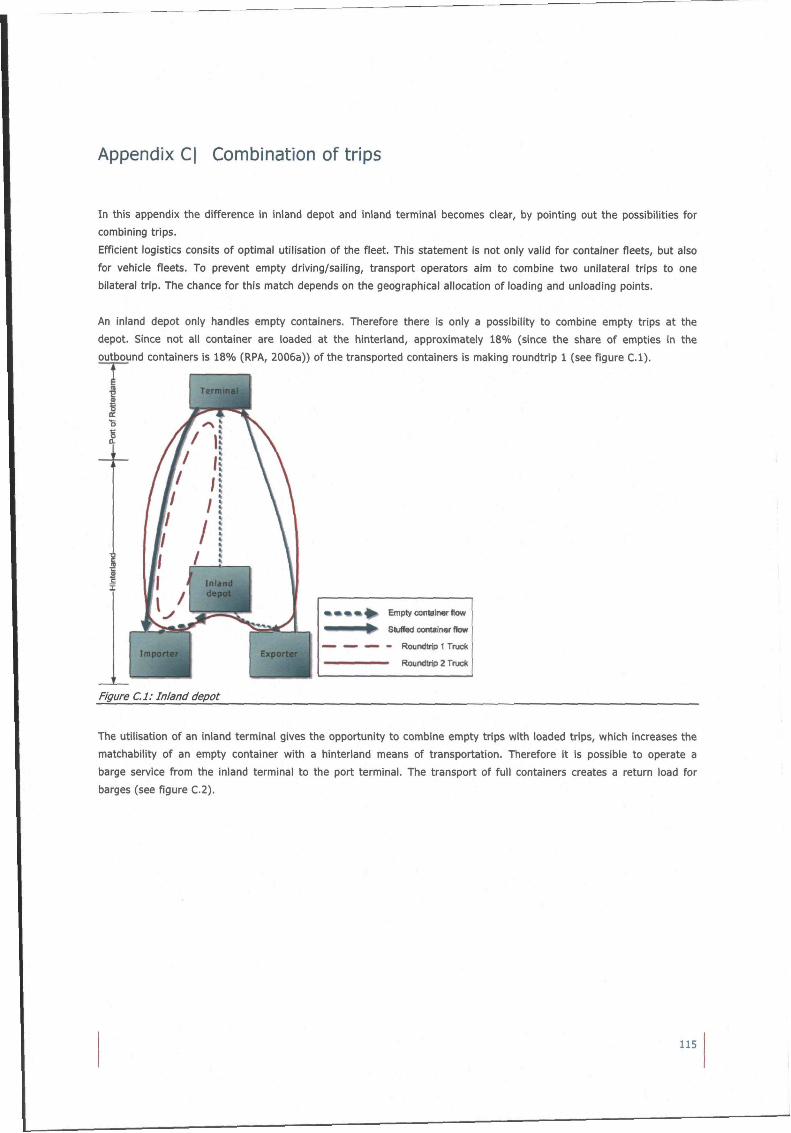
Appendix C| Combination of trips
In this appendix the difference in inland depot and inland terminal becomes clear, by pointing out the possibilities for combining trips.
Efficient logistics consits of optimal utilisation of the fieet. This statement is not only valid for container fieets, but also
for vehicle fleets. To prevent empty driving/sailing, transport operators aim to combine two unilateral trips to one
bilateral trip. The chance for this match depends on the geographical allocation of loading and unloading points.
An inland depot only handles empty containers. Therefore there is only a possibility to combine empty trips at the
depot. Since not all container are loaded at the hinteriand, approximately 18% (since the share of empties in the
outbound containers is 18% (RPA, 2006a)) of the transported containers is making roundtrip 1 (see figure C.l).
k • ^ ^ Empty conlsinw How
Stuffsd container flow
• ^ " Roundtrip 1 Truck
— ^ - " Roundtrip 2 Truck
Figure C.l: Inland depot
The utilisation of an inland terminal gives the opportunity to combine empty trips with loaded trips, which increases the
matchability of an empty container with a hinteriand means of transportation. Therefore it is possible to operate a
barge service from the inland terminal to the port terminal. The transport of full containers creates a return load for
barges (see figure C.2).
115
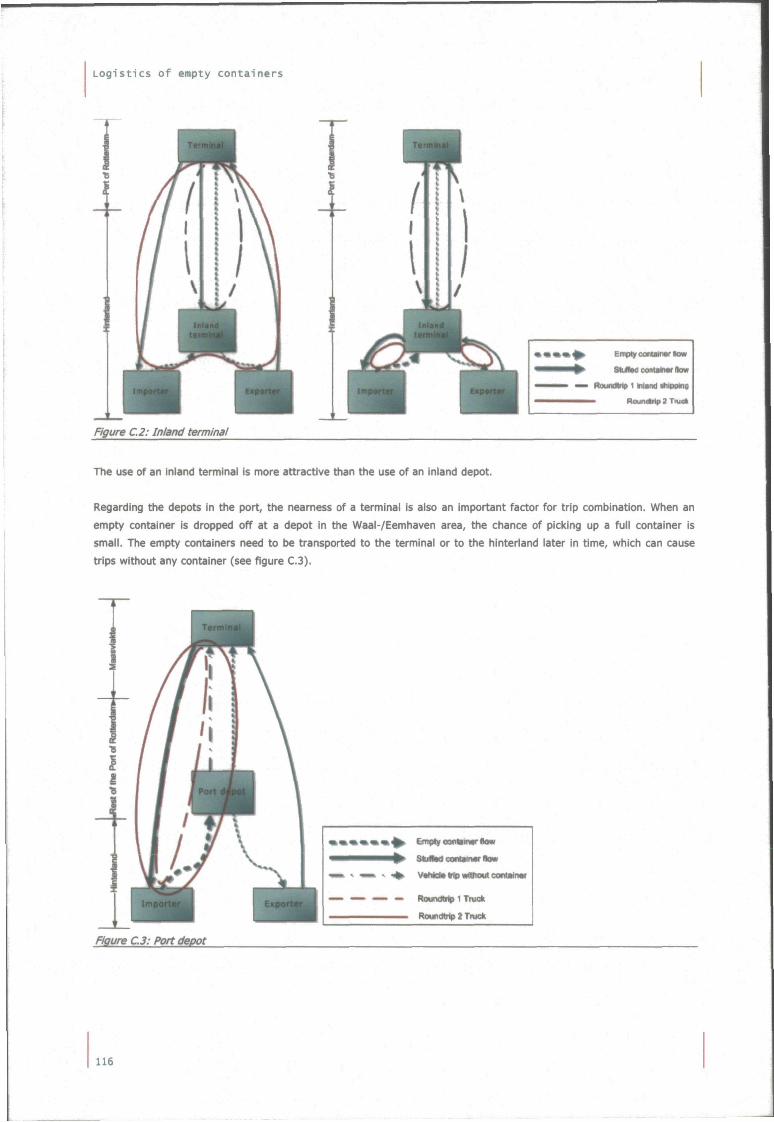
Logistics of empty containers
empty conlaliw low
— RourdM» 11nland aMpping
^ ^ ^ Roun^MpZTfuet
Figure C.2: Inland terminal
The use of an inland terminal is more attractive than the use of an inland depot.
Regarding the depots in the port, the nearness of a terminal is also an important factor for trip combination. When an
empty container is dropped off at a depot in the Waal-/Eemhaven area, the chance of picking up a full container is
small. The empty containers need to be transported to the terminal or to the hinteriand later in time, which can cause
trips without any container (see figure C.3).
• • • • • « ^ cmply conlvmvr flow
Skiltod conMincrflMf
V M * Mp «OMiit oonMnw
RoutKMp 1 Trui*
Roundtrip 2 Tiuefc
Figure C.3: Port depot
116
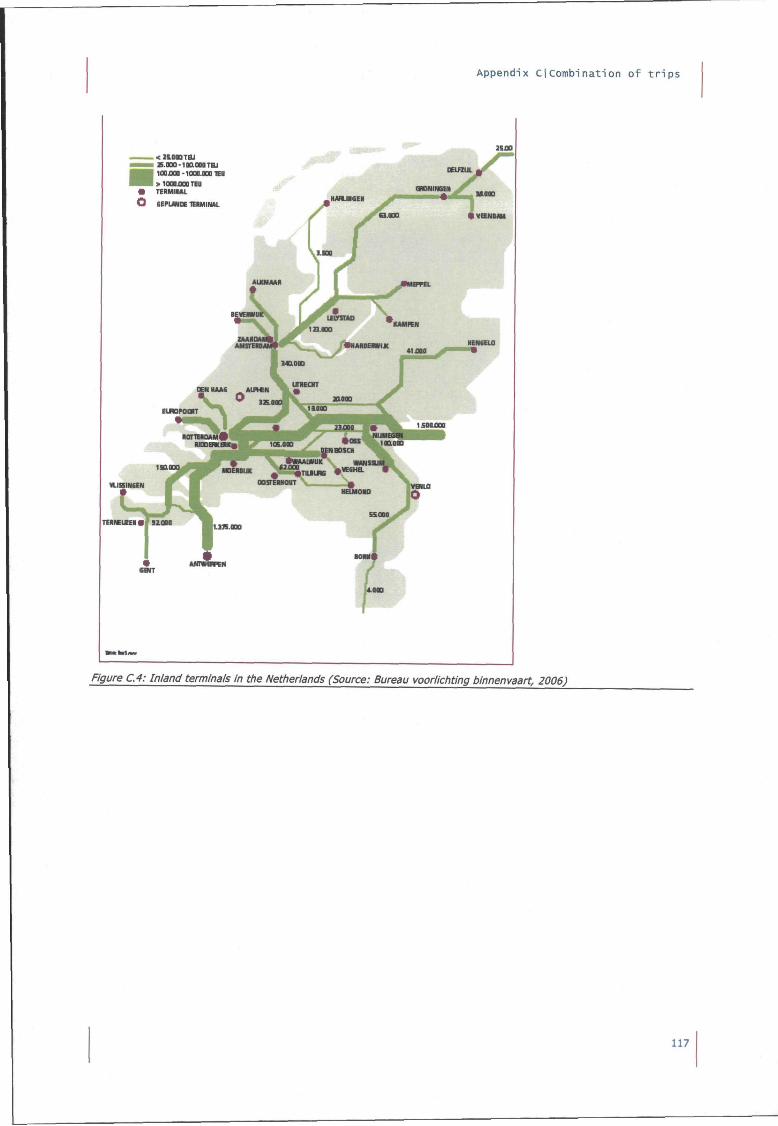
Appendix CjCombination of trips
. 4 ISBODiaJ • E.ODO-iaacaoTHi
I lOOiSO-1000.1001EU
TEIIMIUL
lociaai gENBDsai
HELMOID 1 0
TEmniEie noN
Figure C.4: Inland terminals in the Netherlands (Source: Bureau voorlichting binnenvaart, 2006)
117

Logistics of empty containers
118
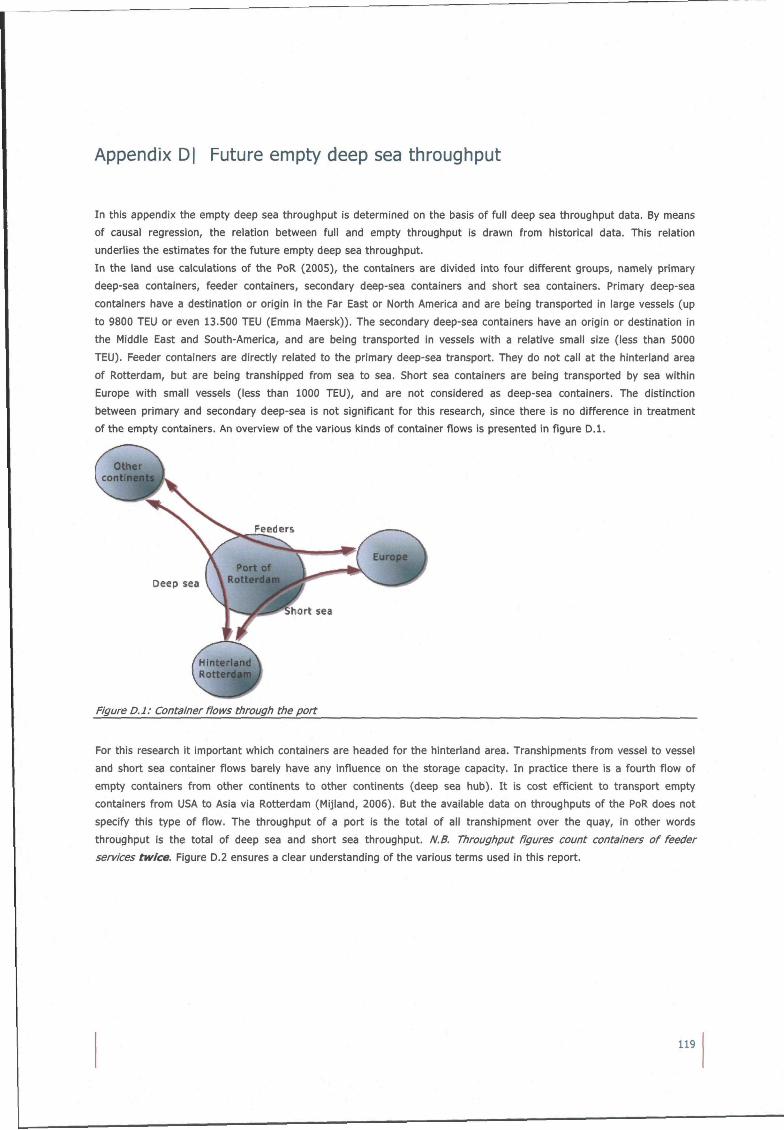
Appendix D| Future empty deep sea throughput
In this appendix the empty deep sea throughput is determined on the basis of full deep sea throughput data. By means
of causal regression, the relation between full and empty throughput is drawn from historical data. This relation
underlies the estimates for the future empty deep sea throughput.
In the land use calculations of the PoR (2005), the containers are divided into four different groups, namely primary
deep-sea containers, feeder containers, secondary deep-sea containers and short sea containers. Primary deep-sea
containers have a destination or origin in the Far East or North America and are being transported in large vessels (up
to 9800 TEU or even 13.500 TEU (Emma Maersk)). The secondary deep-sea containers have an origin or destination in
the Middle East and South-America, and are being transported in vessels with a relative small size (less than 5000
TEU). Feeder containers are directly related to the primary deep-sea transport. They do not call at the hinterland area
of Rotterdam, but are being transhipped from sea to sea. Short sea containers are being transported by sea within
Europe with small vessels (less than 1000 TEU), and are not considered as deep-sea containers. The distinction
between primary and secondary deep-sea is not significant for this research, since there is no difference in treatment
of the empty containers. An overview of the various kinds of container flows is presented in figure D.l.
Figure D.l: Container flows through the port
For this research it important which containers are headed for the hinterland area. Transhipments from vessel to vessel
and short sea container flows barely have any influence on the storage capacity. In practice there is a fourth flow of
empty containers from other continents to other continents (deep sea hub). It is cost efficient to transport empty
containers from USA to Asia via Rotterdam (Mijland, 2006). But the available data on throughputs of the PoR does not
specify this type of fiow. The throughput of a port is the total of all transhipment over the quay, in other words
throughput is the total of deep sea and short sea throughput. N.B. Throughput figures count containers of feeder
services twice. Figure D.2 ensures a clear understanding of the various terms used in this report.
119
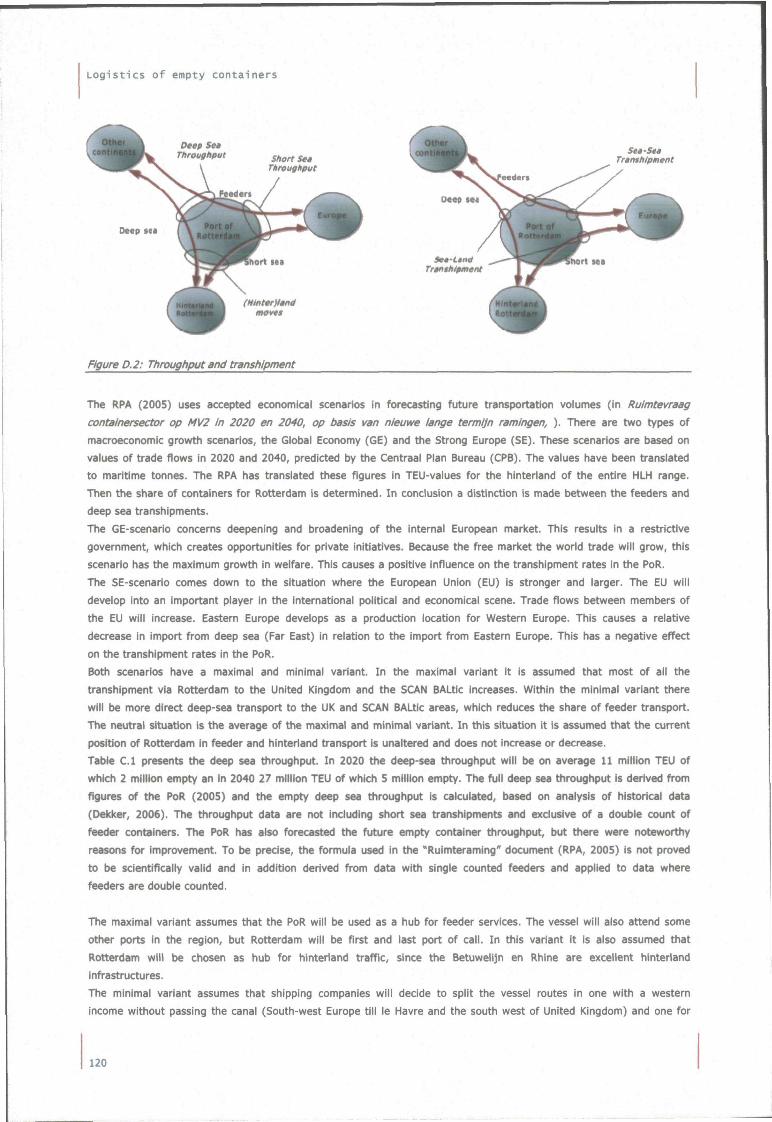
Logistics of empty containers
Figure D.2: Throughput and transhipment
The RPA (2005) uses accepted economical scenarios in forecasting future transportation volumes (in Ruimtevraag
containersector op MV2 in 2020 en 2040, op basis van nieuwe lange termijn ramingen, ). There are two types of
macroeconomic growth scenarios, the Global Economy (GE) and the Strong Europe (SE). These scenarios are based on
values of trade flows in 2020 and 2040, predicted by the Centraal Plan Bureau (CPB). The values have been translated
to maritime tonnes. The RPA has translated these flgures in TEU-values for the hinteriand of the entire HLH range.
Then the share of containers for Rotterdam is determined. In conclusion a distinction is made between the feeders and
deep sea transhipments.
The GE-scenario concerns deepening and broadening of the internal European market. This results in a restrictive
government, which creates opportunities for private initiatives. Because the free market the worid trade will grow, this
scenario has the maximum growth in welfare. This causes a positive influence on the transhipment rates in the PoR.
The SE-scenario comes down to the situation where the European Union (EU) is stronger and larger. The EU will
develop into an important player in the international political and economical scene. Trade flows between members of
the EU will increase. Eastern Europe develops as a production location for Western Europe. This causes a relative
decrease in import from deep sea (Far East) in relation to the import from Eastern Europe. This has a negative effect
on the transhipment rates in the PoR.
Both scenarios have a maximal and minimal variant. In the maximal variant it is assumed that most of all the
transhipment via Rotterdam to the United Kingdom and the SCAN BALtic increases. Within the minimal variant there
will be more direct deep-sea transport to the UK and SCAN BALtic areas, which reduces the share of feeder transport.
The neutral situation is the average of the maximal and minimal variant. In this situation it is assumed that the current
position of Rotterdam in feeder and hinteriand transport is unaltered and does not increase or decrease.
Table C.l presents the deep sea throughput. In 2020 the deep-sea throughput will be on average 11 million TEU of
which 2 million empty an in 2040 27 million TEU of which 5 million empty. The full deep sea throughput is derived from
flgures of the PoR (2005) and the empty deep sea throughput is calculated, based on analysis of historical data
(Dekker, 2006). The throughput data are not including short sea transhipments and exclusive of a double count of
feeder containers. The PoR has also forecasted the future empty container throughput, but there were noteworthy
reasons for improvement. To be precise, the formula used in the "Ruimteraming" document (RPA, 2005) is not proved
to be scientiflcally valid and in addition derived from data with single counted feeders and applied to data where
feeders are double counted.
The maximal variant assumes that the PoR will be used as a hub for feeder services. The vessel will also attend some
other ports in the region, but Rotterdam will be first and last port of call. In this variant it is also assumed that
Rotterdam will be chosen as hub for hinteriand traffic, since the Betuwelijn en Rhine are excellent hinteriand
infrastructures.
The minimal variant assumes that shipping companies will decide to spilt the vessel routes in one with a western
income without passing the canal (South-west Europe till le Havre and the south west of United Kingdom) and one for
120
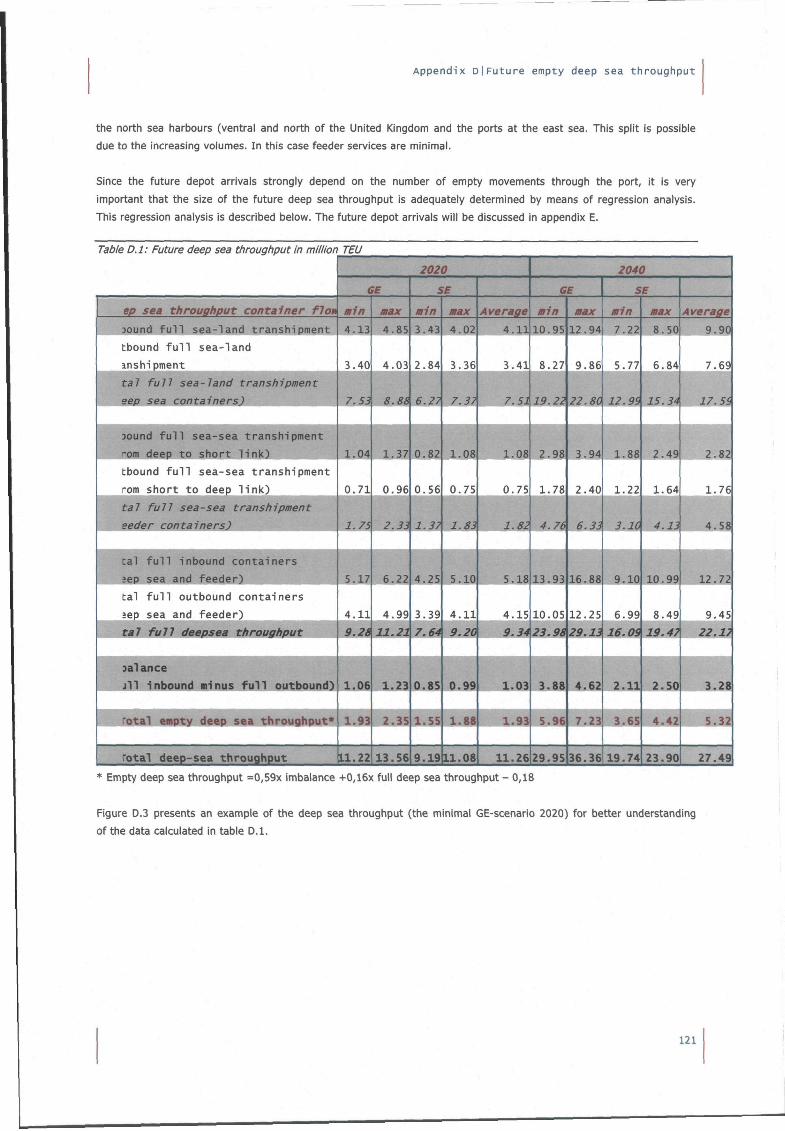
Appendix Dj Future empty deep sea throughput
the north sea harbours (ventral and north of the United Kingdom and the ports at the east sea. This split is possible
due to the increasing volumes. In this case feeder services are minimal.
Since the future depot arrivals strongly depend on the number of empty movements through the port, it is very
important that the size of the future deep sea throughput is adequately determined by means of regression analysis.
This regression analysis is described below. The future depot arrivals will be discussed in appendix E.
Table D.l: Future deep sea throughput in million TEU
ep sea throughput container f Ion
Dound f u l l sea- land t ransh ipmen t
tbound f u l l sea - l and
inshipment
tal full sea-land transhipment
sep sea containers)
Dound f u l l sea-sea t ransh ipmen t
-om deep to short link)
tbound f u l l sea-sea t ransh ipmen t
rom sho r t t o deep l i n k )
tal full sea-sea transhipment
eeder containers)
t a l f u l l inbound c o W a i n e r s
>ep sea and fgf ids j : , ! .„
t a l f u l l outbound c o n t a i n e r s
jep sea and f eede r ) ^ ^ ^ ^
n deepsea throughput
3alance J 1 1 inbound minus f u l l outbound)
ipty deep sea throughout*
1^^ rotal deep-sea throughput [11.22| 13.5619.19111.08! 11.26|29.95i36.36|19.74|23.90| 27.49 * Empty deep sea throughput =0,59x imbalance +0,16x full deep sea throughput - 0,18
Figure D.3 presents an example of the deep sea throughput (the minimal GE-scenario 2020) for better understanding
of the data calculated in table D.l .
121
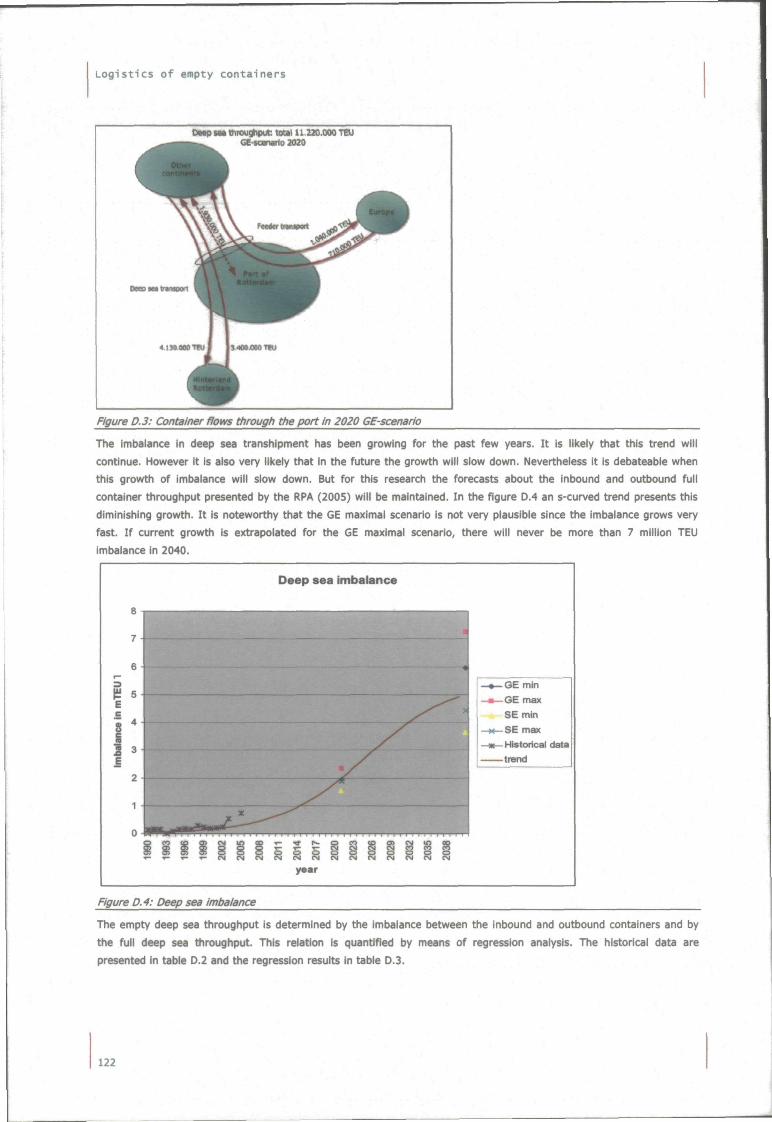
Logistics of empty containers
OMP ( M ttiraughput: total U.220.000 TEU QH-Kmrniio 2020
Figure D.3: Container flows through the port in 2020 GE-scenario
The imbalance in deep sea transhipment has been growing for the past few years. It is likely that this trend will
continue. However it is also very likely that in the future the growth will slow down. Nevertheless it is debateable when
this growth of imbalance will slow down. But for this research the forecasts about the inbound and outbound full
container throughput presented by the RPA (2005) will be maintained. In the figure D.4 an s-curved trend presents this
diminishing growth. It is noteworthy that the GE maximal scenario is not very plausible since the imbalance grows very
fast. If current growth is extrapolated for the GE maximal scenario, there will never be more than 7 million TEU
imbalance in 2040.
Deep sea imbalance
CN i n
8 8 _ _ _ r g CN CM CM CM
year
Figure D.4: Deep sea imbalance
The empty deep sea throughput is determined by the imbalance between the inbound and outbound containers and by
the full deep sea throughput. This relation is quantified by means of regression analysis. The historical data are
presented in table D.2 and the regression results in table D.3.
122
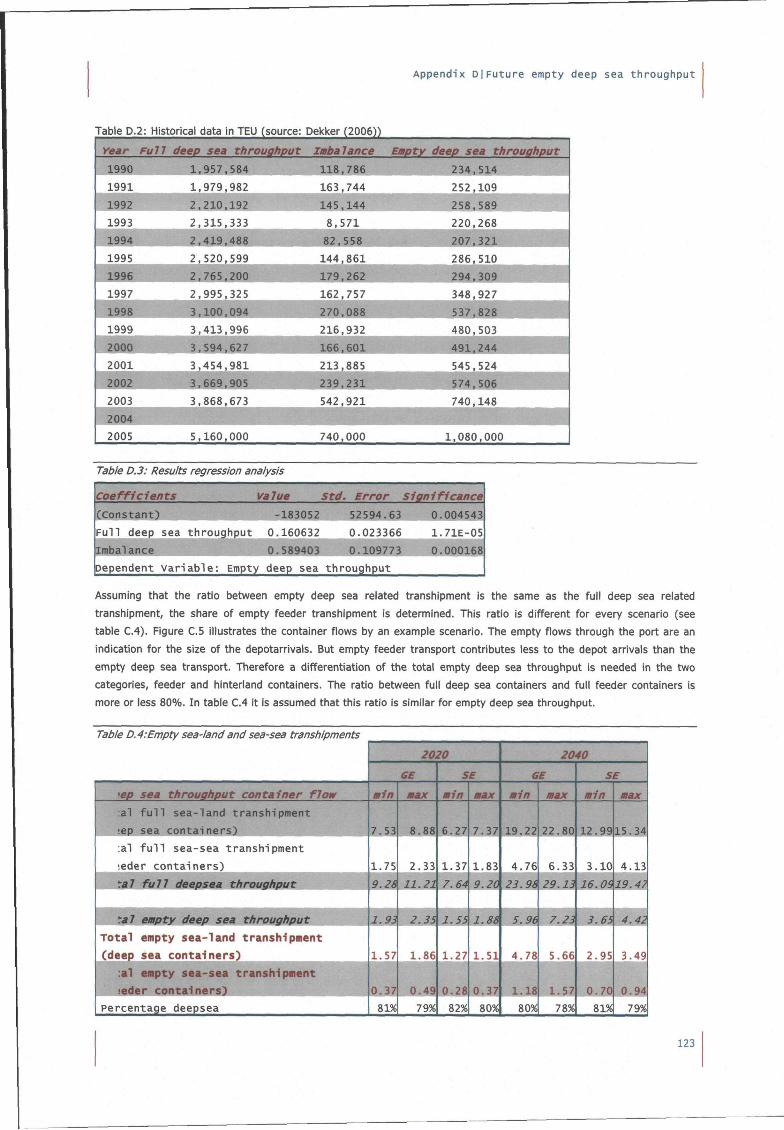
Appendix D|Future empty deep sea throughput
Table D.2: Historical data in TEU (source: Dekker (2006))
rear Full deep sea throughput Imbalance Empty deep sea throughput
1990
1991
1991
1993
1994
1S95
1997
199i
1999
2001
200^
2003
1,957,584
1,979,982
2.210,192
2,315,333
1.9,488
2.520,599
f?765,200
2j995^325
3,413,996
3,454,981
1.669,!
3,868,673
5,160,000
118,786,
163,744
145,144
8,571
82,558
144,861
179,262
162,757
270,088
216,932
166,601
213,885
239,231
542,921
234,514
252,109
258,589
220,268
-207.321 ^
2005 740,000 1,080,000
Table D.3: Results regression analysis
Coefficients Value Std. Error Significance
( c o n s t a n t ) -183052 52594.63
F u l l deep sea th roughput 0.160632 0.023366
0.004543
1.71E-05
o.ooo iM Dependent V a r i a b l e : Empty deep sea t h roughpu t
Assuming that the ratio between empty deep sea related transhipment is the same as the full deep sea related
transhipment, the share of empty feeder transhipment is determined. This ratio is different for every scenario (see
table C.4). Figure C.5 illustrates the container fiows by an example scenario. The empty flows through the port are an
indication for the size of the depotarrivals. But empty feeder transport contributes less to the depot arrivals than the
empty deep sea transport. Therefore a differentiation of the total empty deep sea throughput is needed in the two
categories, feeder and hinteriand containers. The ratio between full deep sea containers and full feeder containers is
more or less 80%. In table C.4 it is assumed that this ratio is similar for empty deep sea throughput.
Table D. 4:Empty sea-land and sea-sea transhipments
'.ep sea throughput container flow
:al f u l l sea- land t ransh ipment
lep sea c o n t a i n e r s )
:al f u l l sea-sea t ransh ipment
ieder c o n t a i n e r s )
-al full deeosea throuahau^^^^^^^M
^^^^emotv deeo sea throuahoB^^^^^^
Tota l empty s e a - l a n d t r a n s h i p m e n t
(deep sea c o n t a i n e r s )
:a1 empty sea-sea transhipment
seder conta iners )
percentage deepsea
2020
6E
min
7.53
1.75
h.2&
9 ^
1.57
0.37
81%
max
8.88
2.33
11.21
2.35
1.86
0.49
79%
SE
min
6.27
1.37
7.64
1.55
1.27
0.28
82%
max
7.37
1.83
9.2C
1.86
1.51
0.37
80%
2040
GE
min
19.22
4.76
23.M
5.96
4.78
1.18
80%
max
22.80
6.33
29. li
7.23
5.66
1.57
78%
«
min
12.99
3.10
JjLiiS
3.65
2.95
0 .70
81%
max
15.34
4.13
19 d^
4.42
3.49
0.94
79%
123
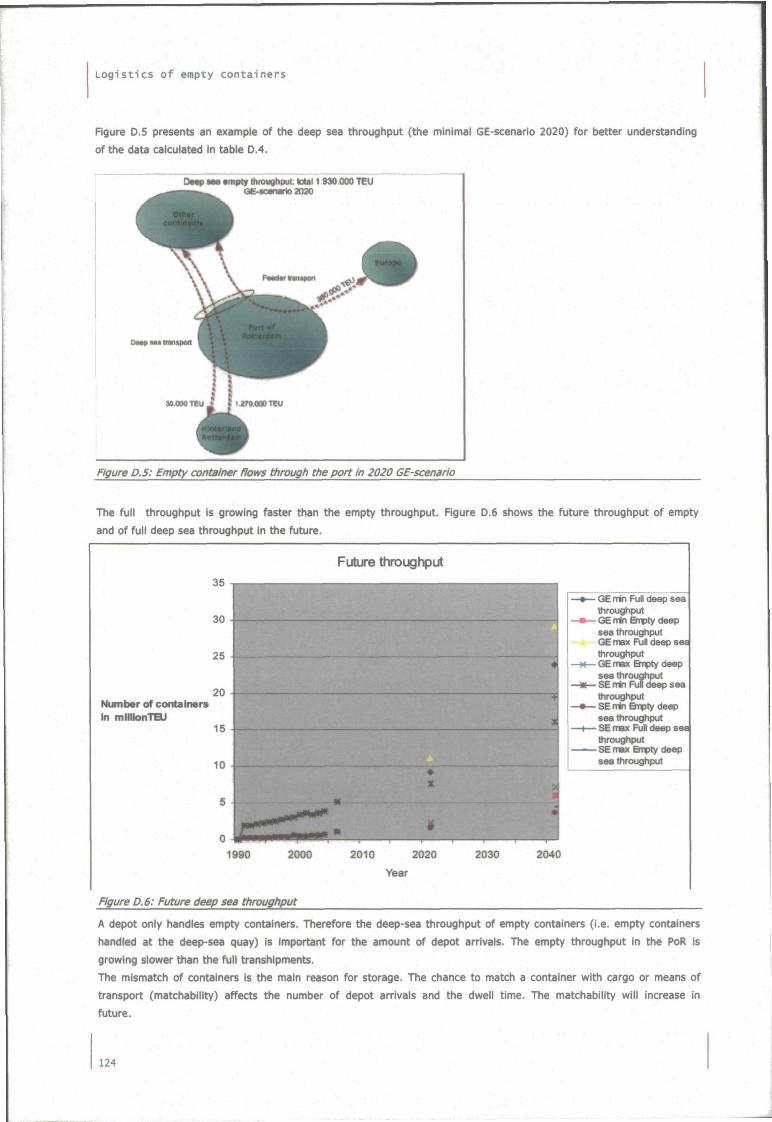
Logist ics of empty containers
Figure D.5 presents an example of the deep sea throughput (the minimal GE-scenario 2020) for better understanding
of the data calculated in table D.4.
OMpMaempty throughpuL total t 930000 TEU
Figure D.5: Empty container flows through the port in 2020 GE-scenario
The full throughput Is growing faster than the empty throughput. Figure D.6 shows the future throughput of empty
and of full deep sea throughput in the future.
35 -,
30
25
9n Number of containers In millionTEU
15 .
10 -
5
0
1<
Future throughput
X
l - - * * - " ' * ^ . »
• 1
«
-tj
*
%
m
—«—QEnnin Full deep sea throughput
—•— GE min Brpty deep sea throughput GE max Full deep ses throughput
X GE max Brpty deep sea throughput
— « — SE min Full deep sea
throughput —•— SE min Brpty deep
sea throughput — 1 — SE max Full deep sea
throughput —•— SE max Btpty deep
sea throughput
J90 2000 2010 2020 2030 2040
Year
Figure D.6: Future deep sea throughput
A depot only handles empty containers. Therefore the deep-sea throughput of empty containers (i.e. empty containers
handled at the deep-sea quay) is important for the amount of depot arrivals. The empty throughput in the PoR is
growing slower than the full transhipments.
The mismatch of containers is the main reason for storage. The chance to match a container with cargo or means of
transport (matchability) affects the number of depot arrivals and the dwell time. The matchability will increase in
future.
124
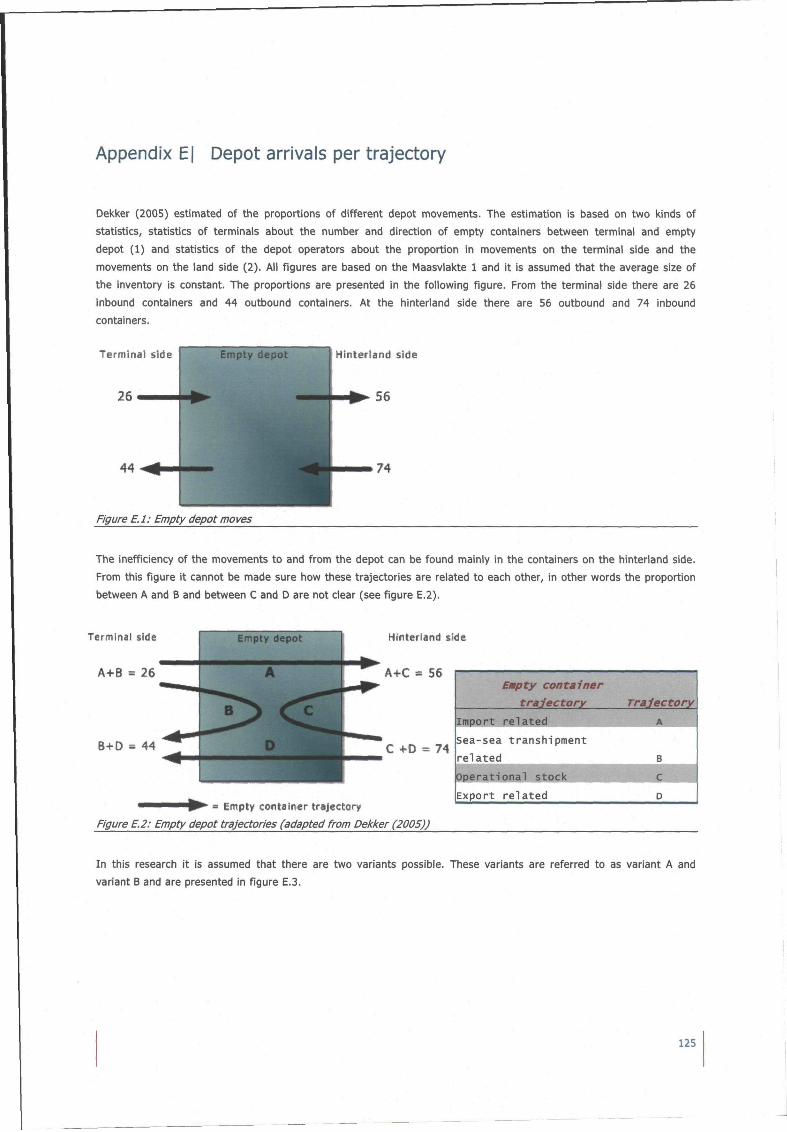
Appendix E| Depot arrivals per trajectory
Dekker (2005) estimated of the proportions of different depot movements. The estimation is based on two kinds of
statistics, statistics of terminals about the number and direction of empty containers between terminal and empty
depot (1) and statistics of the depot operators about the proportion in movements on the terminal side and the
movements on the land side (2). All figures are based on the Maasvlakte 1 and it is assumed that the average size of
the inventory is constant. The proportions are presented in the following figure. From the terminal side there are 26
inbound containers and 44 outbound containers. At the hinteriand side there are 56 outbound and 74 inbound
containers.
Terminal side Empty depot Hinterland side
Figure E.l: Empty depot moves
The inefficiency of the movements to and from the depot can be found mainly in the containers on the hinterland side.
From this figure it cannot be made sure how these trajectories are related to each other, in other words the proportion
between A and B and between C and D are not clear (see figure E.2).
Terminal side
A+B = 26
B+D = 44 ^
EnTpty depot
A
b><C D
^^j^
" * * •
Hinterland side
A+C = 56
C +D = 74
Empty container trajectory
Figure E.2: Empty depot trajectories (adapted from Dekker (2005))
Empty container
trajectory
Import related
Sea-sea transhipment
related
Operational stock
Export related
Trajectory
In this research it is assumed that there are two variants possible. These variants are referred to as variant A and
variant B and are presented in figure E.3.
125
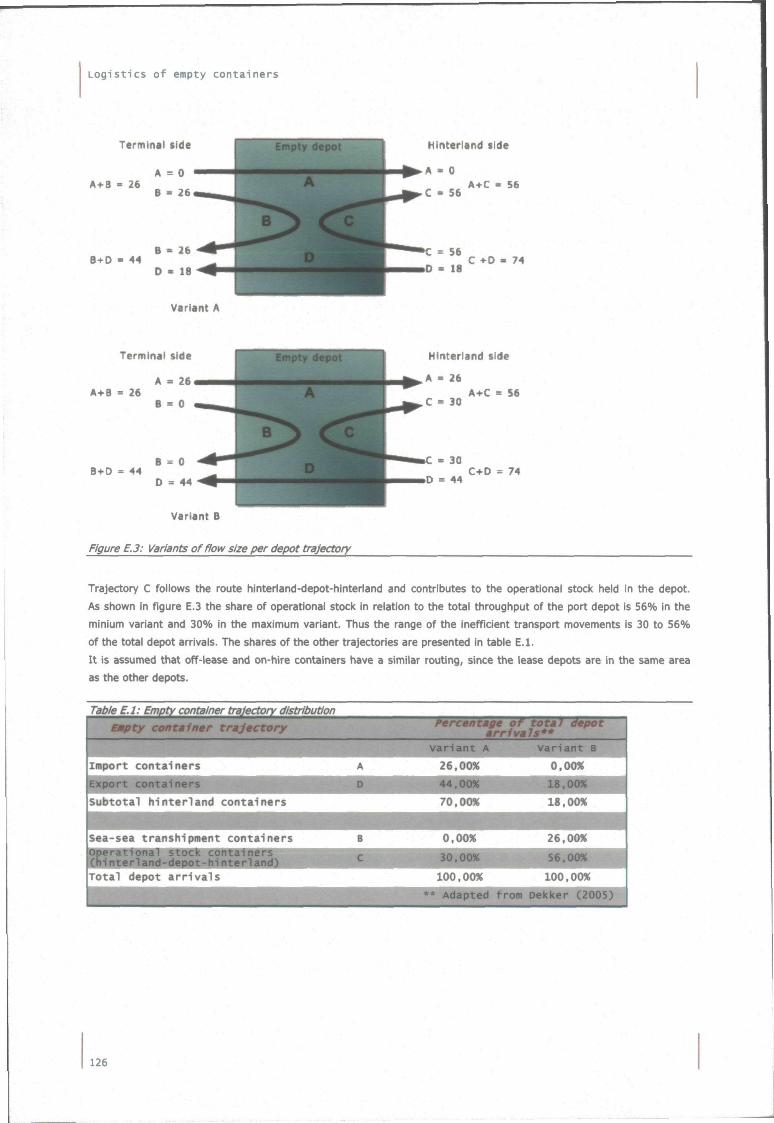
Logistics of empty containers
A-i-B - 26
B-cD - 44
Variant A
Hinterland tide
A - 0
C • 56 A+C « 56
56 D - la C +0 - 74
A4-B s 26
B+O = 44
Hinterland tide
A - 26
C - 30 A+C * 56
- 30
0 = 44 C+D = 74
Figure E.3: Variants of flow size per depot trajectory
Trajectory C follows the route hinteriand-depot-hinteriand and contributes to the operational stock held in the depot.
As shown in figure E.3 the share of operational stock in relation to the total throughput of the port depot is 56% in the
minium variant and 30% in the maximum variant. Thus the range of the inefficient transport movements is 30 to 56%
of the total depot arrivals. The shares of the other trajectories are presented in table E.l.
It is assumed that off-lease and on-hIre containers have a similar routing, since the lease depots are in the same area
as the other depots.
Table E.l: Empty container trajectory distribution Empty container trajectory
Import containers
contai q i ^ i ^ ^ m ^ ^ m i ^ i Siditotal hinterland containers
A
umii
Percentage o¥ toéaf depot— arrivals**
var ian t A
26,00%
m^m^omiM 70,OOK
• var ian t B | |
0,00% 1 ^ K l & » i U t t ^ ^ ^ H
11,OOK 1
Sea-sea transhipment containers
operational stock containers j l ^ H
Total depot arrivals
B
i i i i i ^ ^
n
0,00%
^HHÉÉf^L^ 100.oox
• ^ • * * ' ^ Adapted from
26,O0« 1
Bfii Sg l H 100,OOX
Dekker (2005)
126
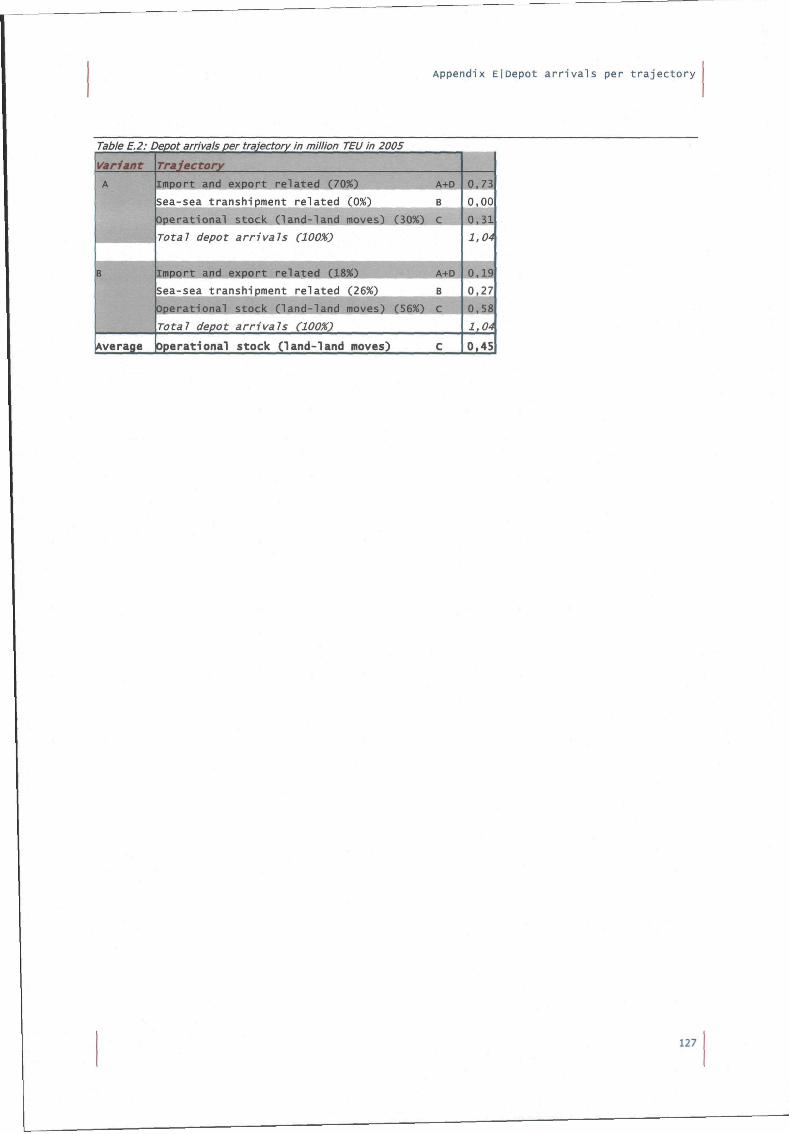
Appendix EjDepot arrivals per trajectory
Table E.2: Depot arrivals per trajectory in million TEU in 2005
Variant
A
B
Average
Traiectory
impo r t and expo r t r e l a t e d (70%)
sea-sea t ransh ipment r e l a t e d (0%)
Total depot arrivals (100%)
Impor t and expor t r e l a t e d (18%)
Sea-sea t ransh ipment r e l a t e d (26%)
Opera t iona l s tock ( l a n d - l a n d moves) (56%)
Total depot arrivals (100%)
Operat ional stock C1and-1and moves)
A+D
B ^
A+D
B
C
c
0.73
0,00
0 . 3 1
1,04
T l 9 0,27
0,58
1,04
0,45
127

Logist ics of empty containers
128
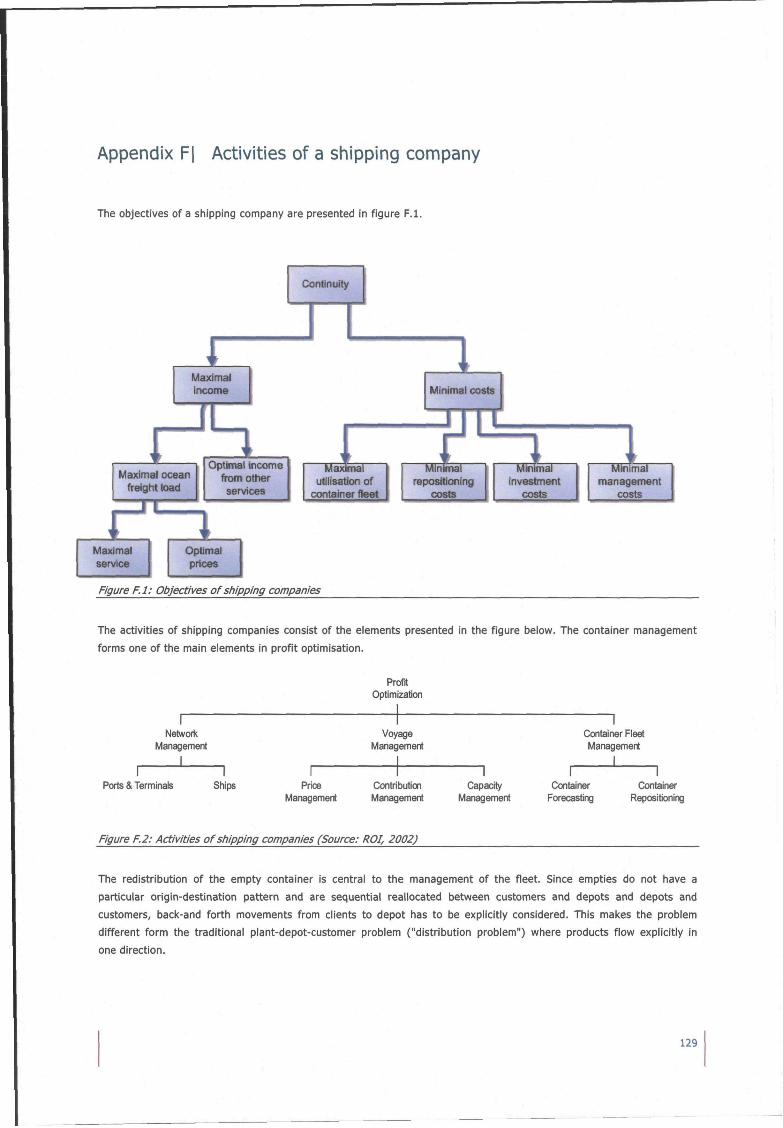
Appendix F| Activities of a shipping company
The objectives of a shipping company are presented in figure F.l.
Continuity
L Maximal income
1 Minimal costs
- ^ 1 rVtt imal inr r tmo i 1 j -? i i i 1 j . ' r l -_ i 1 i 1 i'' i k i k I'—Th Maximal ocean
freight load
Optimal income from other services
Maximal utiisation of
container fleet
MInNnal repositioning
costs
Minimal investment
costs
Minmial management
costs
Maximal service
Optimal prices
Figure F.l: Objectives of shipping companies
The activities of shipping companies consist of the elements presented in the figure below. The container management
forms one of the main elements in profit optimisation.
Profit Optimization
Netwotk Management
I
Ports & Terminals Ships Price Management
Voyage Management
Contributicn Management
Capacity Management
Container Fleet Management
I
Container Forecasting
Container Repositioning
Figure F.2: Activities of shipping companies (Source: ROI, 2002)
The redistribution of the empty container is central to the management of the fieet. Since empties do not have a
particular origin-destination pattern and are sequential reallocated between customers and depots and depots and
customers, back-and forth movements from clients to depot has to be explicitly considered. This makes the problem
different form the traditional plant-depot-customer problem ("distribution problem") where products fiow explicitly in
one direction.
129

Logistics of empty containers
130
Appendix G| Positioning algorithm
A detailed description of the actual flows is needed to quantify the flow of empty containers in and out the port area.
When marine containers arrive by sea at the terminal loaded containers present the greatest share of the total flow. In
case the port functions as a hub, some containers do not leave the terminals on the land side. The containers that are
bound to leave the terminal at the land side are being transhipped to one of the three main hinteriand modalities. Very
seldom a loaded container will be stored at a depot. The reason for this is the urge to deliver the goods in time. But
there are movements of loaded containers between terminals, depending on the accessibility of the different terminals.
For the overall picture it is assumed that those terminals are one unity. It is possible for the container to leave the
terminal at three different modalities, namely truck, barge and train.
From the terminal the containers are transported to different receivers in the hinterland area, this could be in the
Netherlands, but also in Germany, Belgium or France. At the receivers the containers are stripped. Most of the
containers will eventually leave the continent via Rotterdam. But there are also a number of containers that leave the
continent via another port and a number of containers that find another functionality (from student house or restaurant
to scrap). From the empty marine containers, which are spread around the hinteriand area, few will be stuffed in the
near surroundings. Furthermore these loaded containers are immediately transported to the port, either directly by
truck or via an inland terminal. The inland terminal is only used for transhipment and not for storage.
The dwell time of containers and the inventory level are important aspects in the repositioning of empty containers
(Van Selm, written response to questionnaire, 2006). Every day the status of the containers in depots are monitored.
Containers which are located at a depot for more than seven days need to be repositioned. First the possibilities to
balance stocks in the region are perceived, followed by the possibilities on a larger geographical scale. If there is a
need for international transport the shipping company searches for a slot on a deep sea vessel (which often does not
take more than 8 days)(Overgaauw, personal interview, 2006).
On basis on the interviews with different shipping companies. The following algorithm is valid (see figure G.l). The
diamond shaped forms present the decisions made by the shipping companies. The blocks are activities. The grey
blocks are only used in case of intermodal transport. The algorithm is not chronological, since mode choice and
destination are often made at the same time, in stead of sequential. The arrival of empty containers at the port is not
taken into account in this diagram.
131
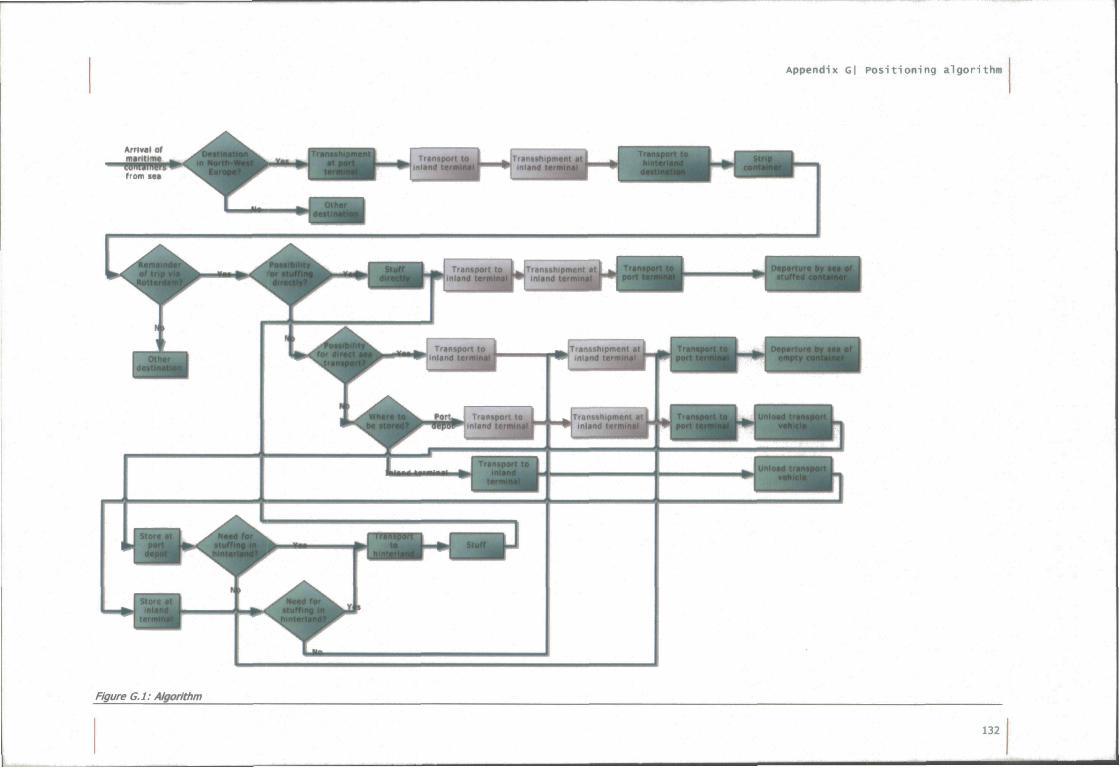
Appendix Gj Positioning algorithm
FlgweQ-UMtoHOun
132
Appendix H| Repositioning strategies
Empty importer The inventory turn over speed at Hapag Lloyd is higher than at other shipping companies according to Tabbers
(Manager Equipment Center2006). The reason for this is that they sharply maintain their safety stock, by a critical
treatment of the requests form their customers. Sometimes empty containers are requested and the marketing
department of the client demands early supply, just in case. Hapag Lloyd is not very flexible in that sense, since they
reject eariy delivery.
Within the trade-off between customer service and minimal fieet capacity, Hapag Lloyd chooses the second.
In general the repositioning strategy is characterised by Just In Time delivery, therefore reliability is more important
than speed. For example the time of departure from a depot is already known even before the arrivals. This involves
the risk of being out of stock, but generally there are few problems, which cannot be by leasing or repositioning.
Hapag Lloyd has a lot of exporting clients in Germany. Therefore it is sometimes agreed with merchants to drop-off
containers in a hinteriand depot for transport savings. The deficit areas could be balanced by acquiring importing
companies. But this has a negative impact on the stability of their tariffs, due to the uncertainty of the supply. High
deep sea transport volumes are valued more important than the costs involved in empty container transport. As a
result empty containers are being imported via the PoR, regarding the well developed barge connection between
Rotterdam and Germany. Nevertheless these import containers do not call at a depot in the PoR, since this costs an
extra trip. In order to prevent events, in which the terminal operator (ECT) moves containers with a dwell time of more
than 72 hours to a depot, Hapag Lloyd has a special agreement with ECT, based on their average low dwell times.
Another characteristic of Hapag Lloyd is that they operate a depot for reefer containers. In that way structural failures
in container series can be identified and the repair can be executed extensively. Further more the communication
between technicians and managers is uncomplicated. Inspection of the integrity of the damage reports is not
necessary, which saves time and money.
The merchant
Evergreen seldom imports empty containers, besides the special equipment such as open top, fiat racks and reefer
containers, yet the export of empty containers is large. Since Evergreen mainly uses merchant haulage, the insight in
the hinteriand transportation network is little. They have no insight in the locations where the empty containers are
being stuffed. Ten percent of the containers are bound for clients with their own depot, which creates the possibility
for merchants to drop containers off at the hinterland. The rest of the containers are transported to the port, which
generates a great amount of operational stock and therefore inefficient movements.
Giant
Maersk line has a strong market position since it has a greater critical mass than its competitors (Beddow, 2006). To
illustrate this Maersk is twice as big as the worlds next largest ocean company (Mediterranean Shipping Company).
Maersk Sealand have gone rather far in door-to-door services and integrated logistic packages (that is Maersk
Logistics), managing the container terminal operation (that is APM Terminals with a network of dedicated terminals
that has been opened to third users as well) and inland transport (for example European Rail Shuttie in joint venture
with P8iO Nedlloyd) and bypassing the freight forwarder by developing direct relationships with the shipper
(Notteboom, 2004).
Scale advantages have generated the opportunity to exploit various operations in the supply chain.
High value empties APL does not own inland terminals. But employees, located near inland terminals, monitor the developments in regional
trade. Empty containers are repositioned from inland locations with care, since it involves a lot of time and money to
replenish a stock in the far hinteriand. However, operational stocks are mainly maintained in hinteriand areas.
133
Logist ics of empty containers
J. Mijland states that empty containers should be treated with the same importance as loaded containers, since they
are crucial elements of the containers iogistics.
Intelligent communicator OOCL distinguished itself by an advanced world wide computer system, which offers information about the shipment
life cycle. Therefore this shipping company has good insight in their empty container logistics.
134
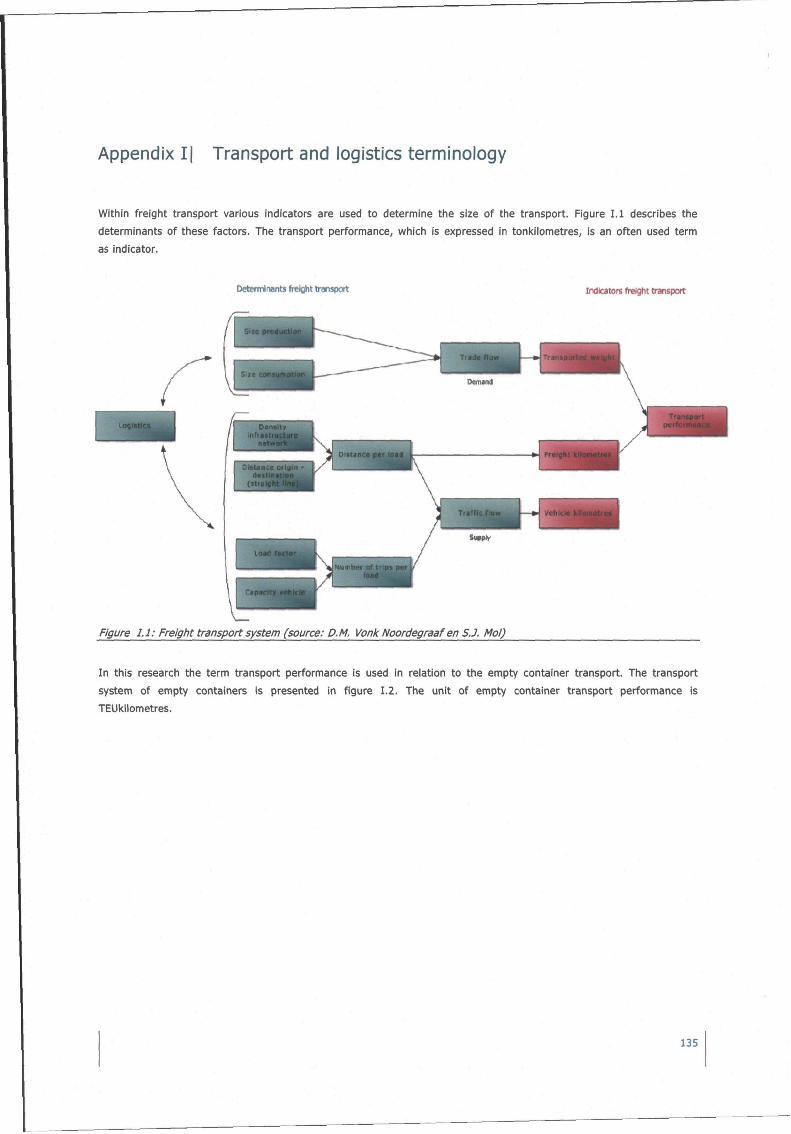
Appendix I| Transport and logistics terminology
Within freight transport various indicators are used to determine the size of the transport. Figure 1.1 describes the
determinants of these factors. The transport performance, which is expressed in tonkilometres, is an often used term
as indicator.
Detemiifwnts freight transport Indicator freight transport
Figure 1.1: Freight transport system (source: D.M. Vonk Noordegraaf en S.J. Mol)
In this research the term transport performance is used in relation to the empty container transport. The transport
system of empty containers is presented in figure 1.2. The unit of empty container transport performance is
TEUkilometres.
135
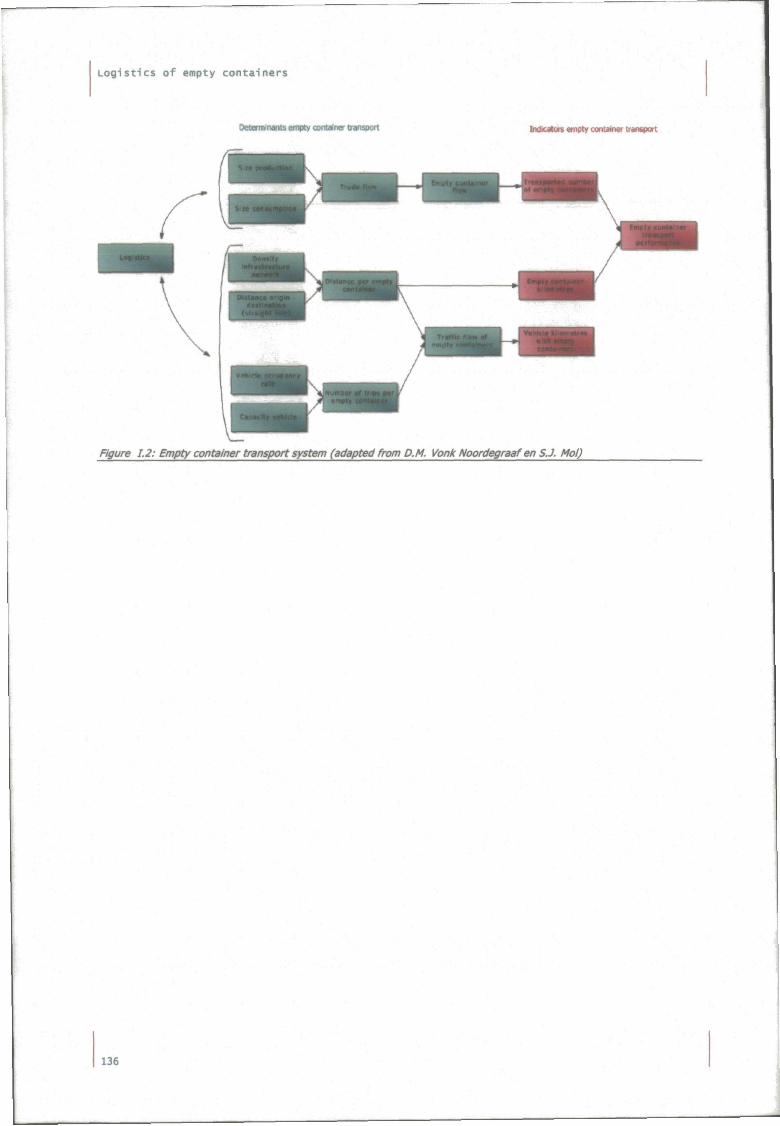
Logistics of empty containers
Odflnnlninls w v t y otMitalnor transport Irxlicjlare «mpty contilnw trancport
Figure 1.2: Empty container transport system (adapted from D.M. Vonk Noordegraaf en S.J. Mol)
136
Appendix JI List extension
The list extension method is systematic approach to identify most important quantities. The method starts with a model
list. In this column the quantities are placed, which are most in interest of the problem owner. The meaning of the
system model is to infiuence this main quantity. Then the list is extended by identifying the second order quantities,
which influence the main quantities. A second extension identities the third order quantities, which are the causalities
of the second order quantities. The chain of influences stops at external factors, the so called exogenous quantities.
The causalities of the exogenous quantities fall beyond the scope of the system. The rest of the quantities are
endogenous and part of the system. The extended list is called the Initial quantity list. The initial quantity list is then
analysed on the relations between different quantities from different extension. Loops, such as feed back loops,
become visible.
As became clear from the first four chapters, there are a lot of factors, which relate to the demand for empty depot
terrain. This appendix explaines the causal relations within empty container logistics, by application of a systematic
approach, the list extension method in small steps. First the initial quantity list is constructed, in which several
elements are specified. Then the interrelations between quantities are indentified. Finally the external factors are
categorized in controlable and uncontrolable quantities.
137
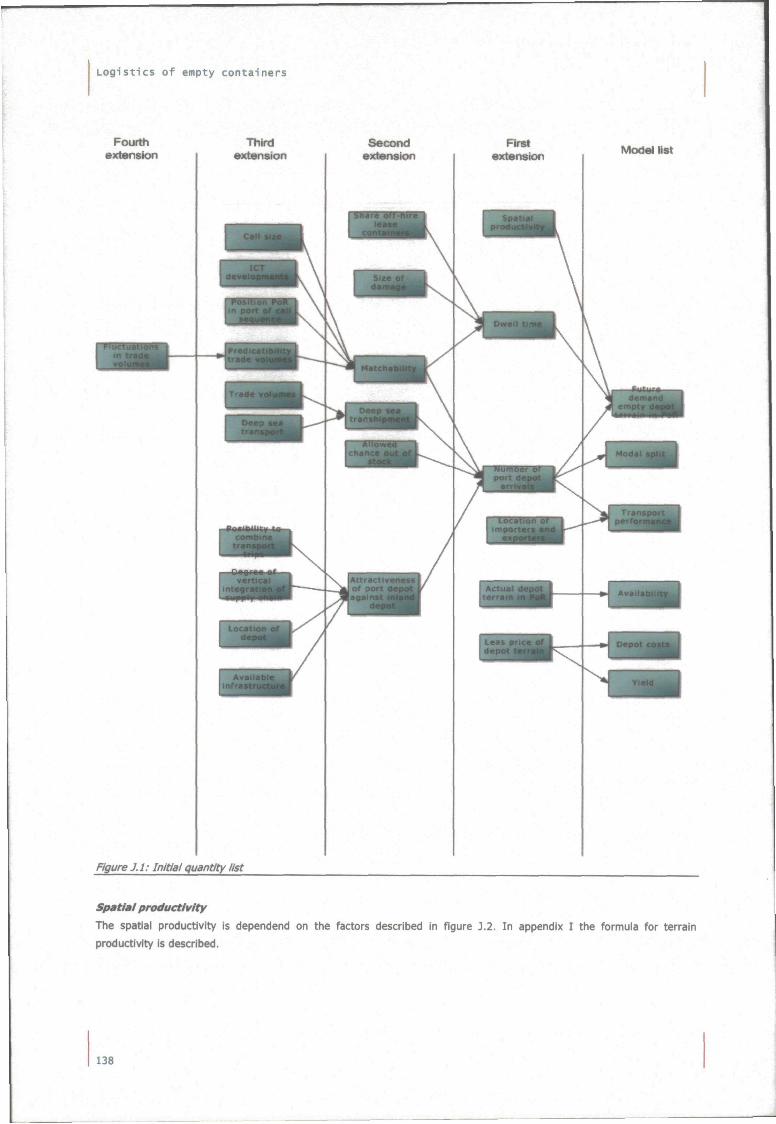
Logist ics of empty containers
Fourth extension
Third extension
Figure J.l: Initial quantity list
Second extension
First extension Model Hst
Spatial productivity
The spatial productivity is dependend on the factors described in figure J.2. In appendix I the formula for terrain productivity is described.
138
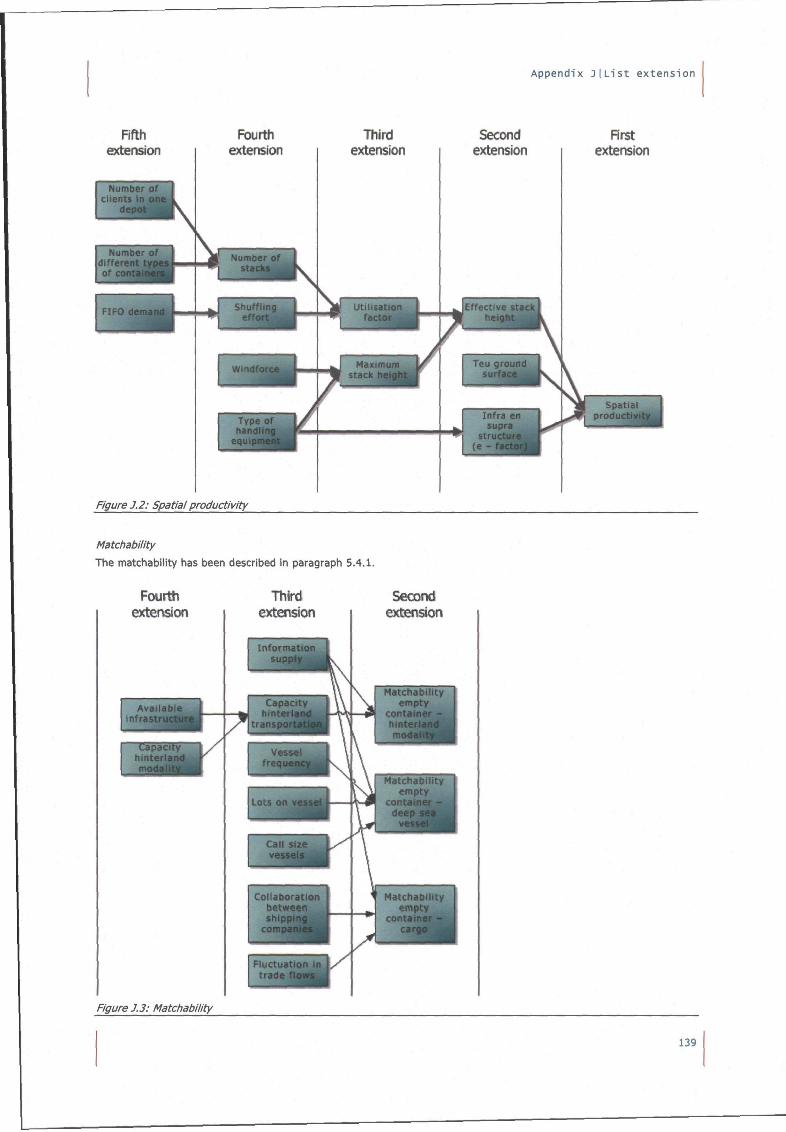
Fifth extension
Number of clients in J
depjQ
Fourth extension
Third extension
Appendix J|List extension
Second Rrst extension extension
Figure J.2: Spatial productivity
Spatial productivity ^
Matchability
The matchability has been described in paragraph 5.4.1.
Fourth extension
Third extension
Second extension
Figure J. 3: Matchability
139
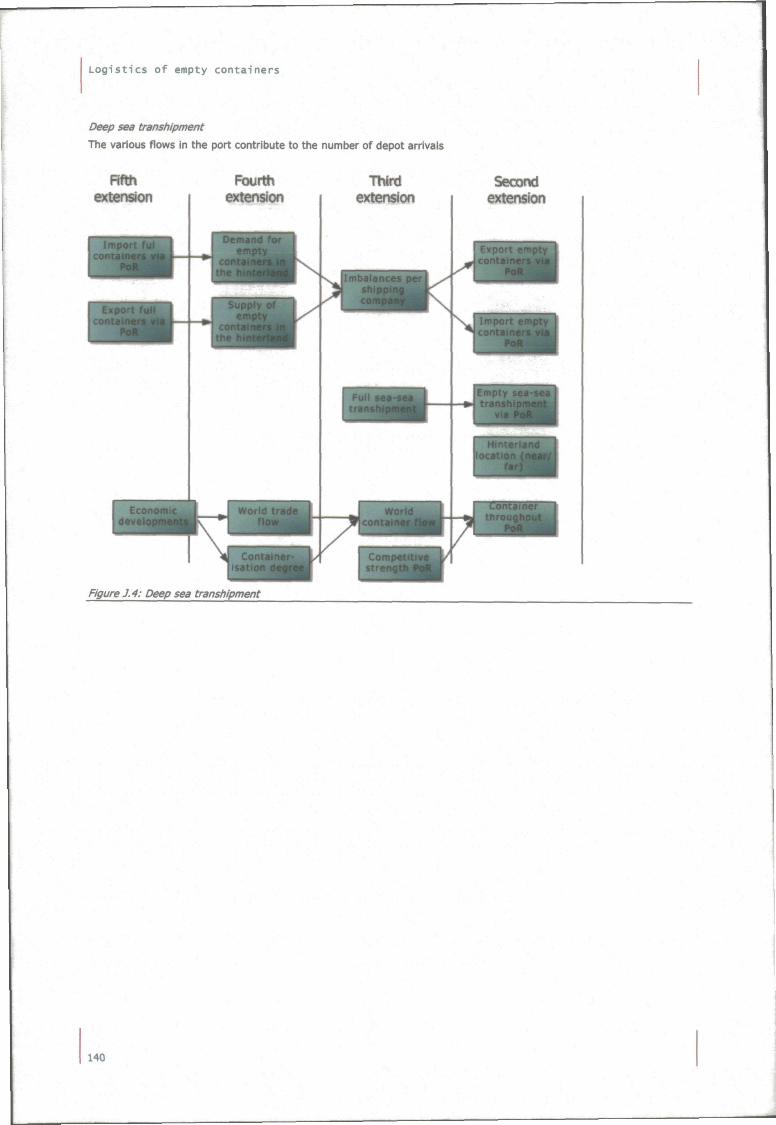
Logist ics of empty containers
Deep sea transhipment
The various flows in the port contribute to the number of depot arrivals
Rfth extension
Fourth extension
Third extension
Second extension
Figure J. 4: Deep sea transhipment
140
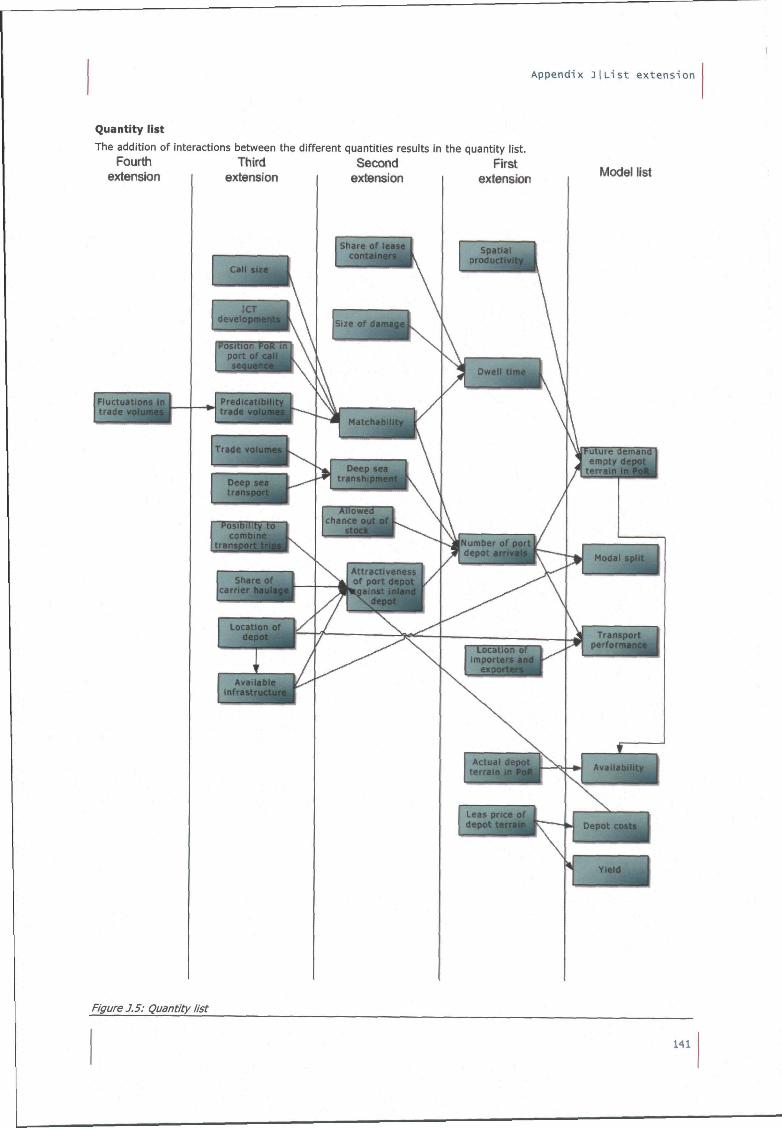
Appendix JiList extens
Quantity list
The addition of interactions between the different quantities results in the quantity list. Fourth Third Second First
extension extension extension extension Model list
Figure J.5: Quantity list
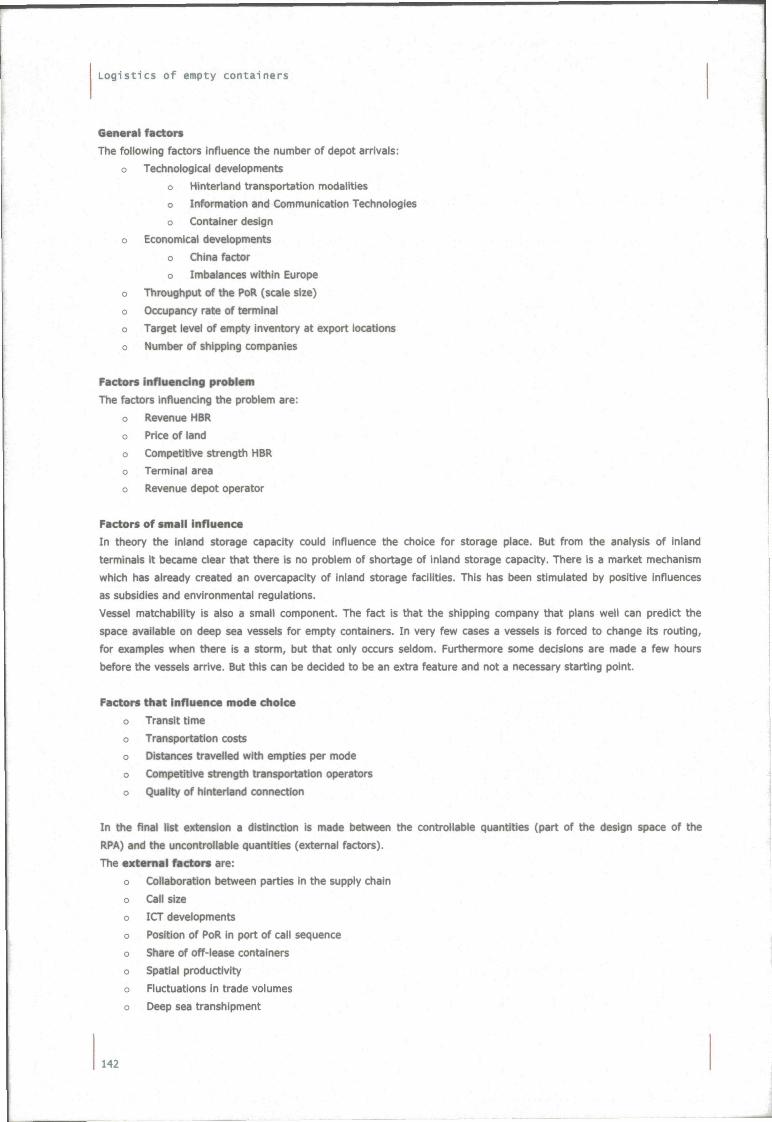
Logist ics of empty containers
General factors
The following factors infiuence the number of depot arrivals:
o Technological developments
o Hinteriand transportation modalities
o Information and Communication Technologies
o Container design
o Economical developments
o China factor
o Imbalances within Europe
o Throughput of the PoR (scale size)
o Occupancy rate of terminal
o Target level of empty inventory at export locations
o Number of shipping companies
Factors influencing problem
The factors infiuencing the problem are:
o Revenue HBR
o Price of land
o Competitive strength HBR
o Terminal area
o Revenue depot operator
Factors of small influence
In theory the inland storage capacity could influence the choice for storage place. But from the analysis of inland
terminals it became clear that there is no problem of shortage of inland storage capacity. There is a market mechanism
which has already created an overcapacity of inland storage facilities. This has been stimulated by positive infiuences
as subsidies and environmental regulations.
Vessel matchability is also a small component. The fact is that the shipping company that plans well can predict the
space available on deep sea vessels for empty containers. In very few cases a vessels is forced to change its routing,
for examples when there is a storm, but that only occurs seldom. Furthermore some decisions are made a few hours
before the vessels arrive. But this can be decided to be an extra feature and not a necessary starting point.
Factors that influence mode choice
o Transit time
o Transportation costs
o Distances travelled with empties per mode
o Competitive strength transportation operators
o Quality of hinteriand connection
In the final list extension a distinction is made between the controllable quantities (part of the design space of the
RPA) and the uncontrollable quantities (external factors).
The external factors are:
o Collaboration between parties in the supply chain
o Call size
o ICT developments
o Position of PoR in port of call sequence
o Share of off-lease containers
o Spatial productivity
o Fluctuations in trade volumes
o Deep sea transhipment
142
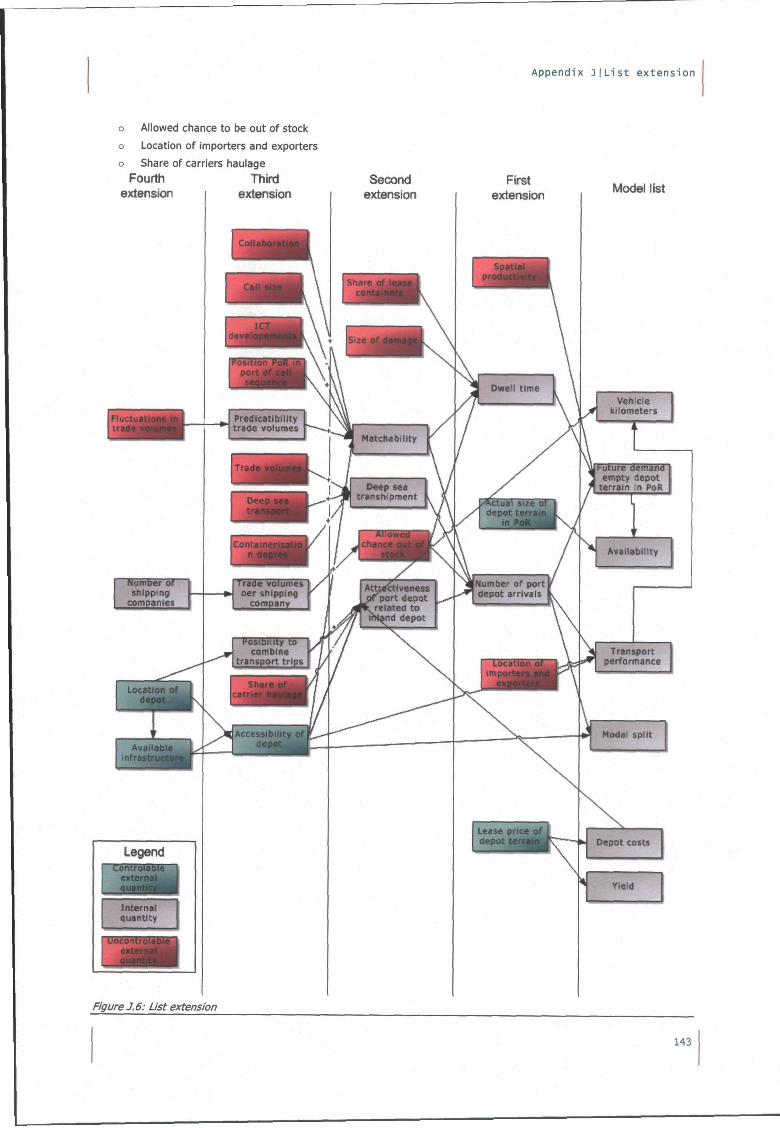
Appendix j j L i s t e x t e n s i o n
o Allowed chance to be out of stock
o Location of importers and exporters
o Share of carriers haulage
Fourth Third extension extension
Legend KlontrolaDle ^ E external ^ • quantftiill
Interrtal Ouantlty
••i
Second extension
First extension Model list
Vehicle kilometers
(-uture demand empty depot
terrain In PoR
AvallBbillty
Transport perform a rice
Yield
Figure J. 6: List extension
143

Logistics of empty containers
144
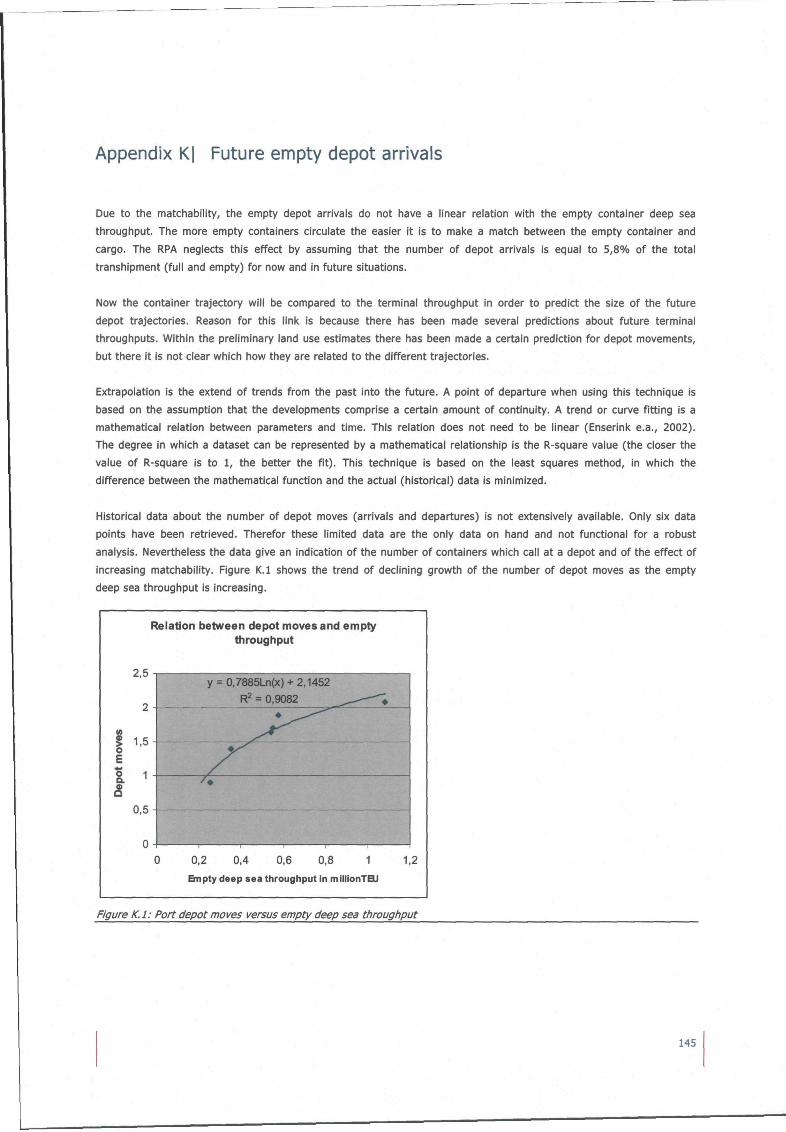
Appendix K| Future empty depot arrivals
Due to the matchability, the empty depot arrivals do not have a linear relation with the empty container deep sea
throughput. The more empty containers circulate the easier it is to make a match between the empty container and
cargo. The RPA neglects this effect by assuming that the number of depot arrivals is equal to 5,8% of the total
transhipment (full and empty) for now and in future situations.
Now the container trajectory will be compared to the terminal throughput in order to predict the size of the future
depot trajectories. Reason for this link is because there has been made several predictions about future terminal
throughputs. Within the preliminary land use estimates there has been made a certain prediction for depot movements,
but there it is not clear which how they are related to the different trajectories.
Extrapolation is the extend of trends from the past into the future. A point of departure when using this technique is
based on the assumption that the developments comprise a certain amount of continuity. A trend or curve fitting is a
mathematical relation between parameters and time. This relation does not need to be linear (Enserink e.a., 2002).
The degree in which a dataset can be represented by a mathematical relationship is the R-square value (the closer the
value of R-square is to 1, the better the fit). This technique is based on the least squares method, in which the
difference between the mathematical function and the actual (historical) data is minimized.
Historical data about the number of depot moves (arrivals and departures) is not extensively available. Only six data
points have been retrieved. Therefor these limited data are the only data on hand and not functional for a robust
analysis. Nevertheless the data give an indication of the number of containers which call at a depot and of the effect of
increasing matchability. Figure K.l shows the trend of declining growth of the number of depot moves as the empty
deep sea throughput is increasing.
Relation between depot moves and empty throughput
2,5
2
S 1,0 o E
I 1 &
0,5
y = 0,7885Ln(x) +2,1452
R2 = 0,9082 ^ ^ ^ ^ • ^
/ ^ 4
- ^ , -, , , 0 0,2 0,4 0,6 0,8 1
Bnpty deep sea throughput in millionTEU
1,2
Figure K.l: Port depot moves versus empty deep sea throughput
145
Logistics of empty containers
The future depot arrivals will follow this trend. Based on the future empty deep sea throughput per scenario (see
appendix C), the future depot arrivals are determined. Figure K.2 shows the future depot arrivals. The linear
extrapolation of the historical data shows that the growth of depot arrivals is less than linear. The table on the right
presents the future values.
Depot arr ival*
Year
G&scsnarlo rrtr<
S6-scenario max
GE-scenario iiBx
Hstoricaldata
SE-tcanaito n*i
Lirwar oxtrapototion histoncal data
Total depot arrivals in million TEU
2005
GE ^'"^ 2020 " * *
cc "ill max min
2040 "^^ mm max
1,78 2,26 2,40 2,12 2,25 3,02 3.15 2,69 2,82
Figure K.2: Port depot arrivals in time
Figure K.3 shows that the depot arrivals and terminal throughput converge. The grey lines present the range of
historical and future data.
146
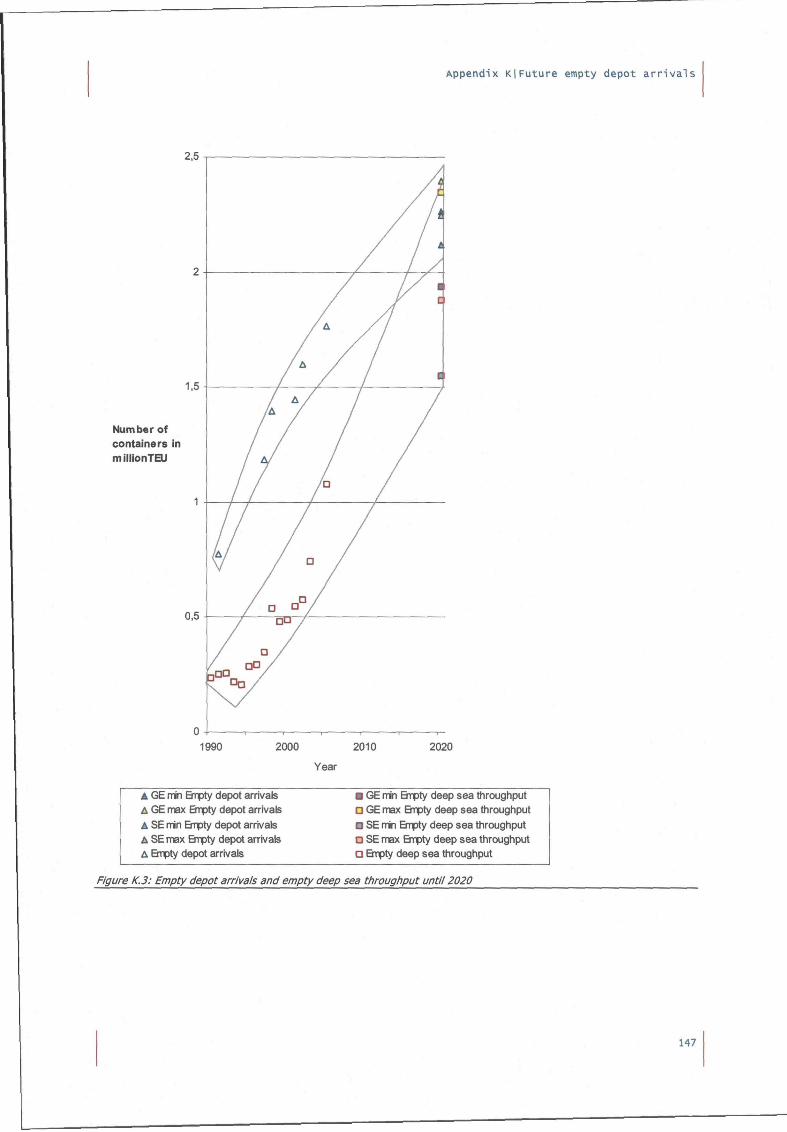
Appendix K|Future empty depot a r r i va l s
Number of containers in millionTEU
1990 2000 2010 2020
Year
A GE mn Empty depot arrivals A GE max Brpty depot arrivals A SE nin Bipty depot arrivals A SE max Brpty depot arrivals A Brpty depot arrivals
• GE min Bipty deep sea throughput D GE max Brpty deep sea throughput B SE min Brpty deep sea throughput D SE max Brpty deep sea throughput D Brpty deep sea throughput
Figure K.3: Empty depot arrivals and empty deep sea throughput until 2020

Logistics of empty containers
148
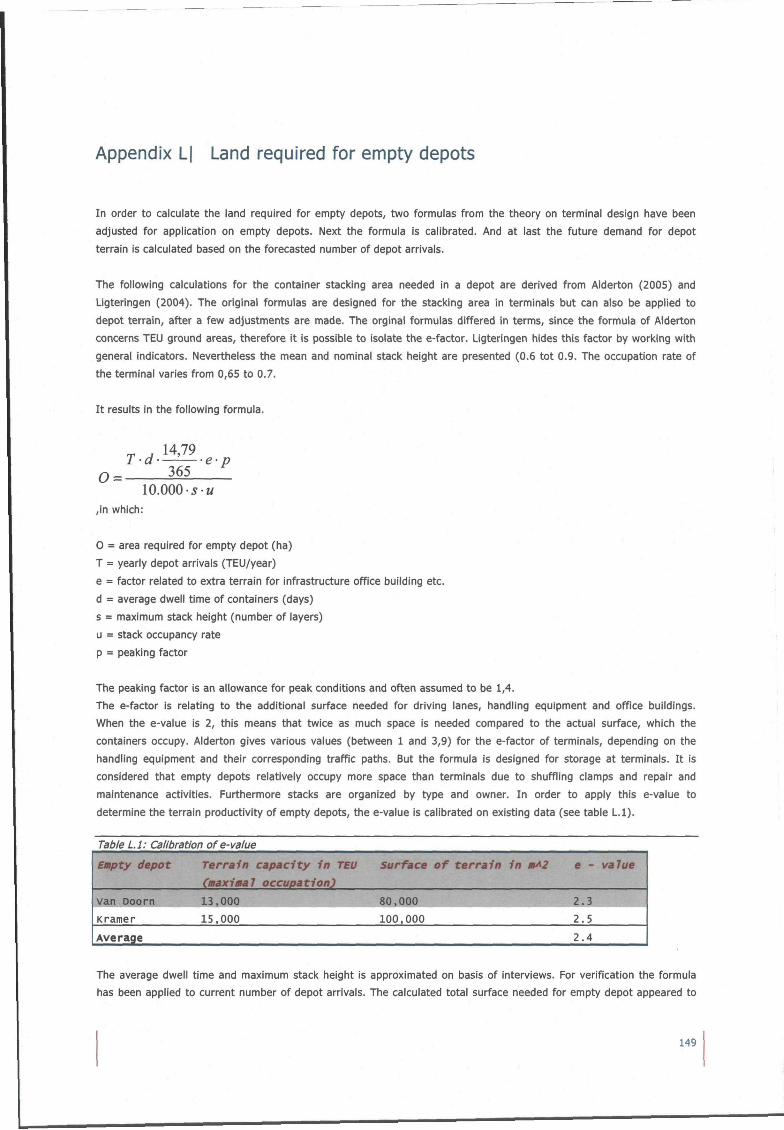
Appendix L| Land required for empty depots
In order to calculate the land required for empty depots, two formulas from the theory on terminal design have been
adjusted for application on empty depots. Next the formula is calibrated. And at last the future demand for depot
terrain is calculated based on the forecasted number of depot arrivals.
The following calculations for the container stacking area needed in a depot are derived from Alderton (2005) and
Ligteringen (2004). The original formulas are designed for the stacking area in terminals but can also be applied to
depot terrain, after a few adjustments are made. The orginal formulas differed in terms, since the formula of Alderton
concerns TEU ground areas, therefore it is possible to isolate the e-factor. Ligteringen hides this factor by working with
general indicators. Nevertheless the mean and nominal stack height are presented (0.6 tot 0.9. The occupation rate of
the terminal varies from 0,65 to 0.7.
It results in the following formula.
0 = 365 1 10.000 J M
,jn which:
0 = area required for empty depot (ha)
T = yearly depot arrivals (TEU/year)
e = factor related to extra terrain for infrastructure office building etc.
d = average dwell time of containers (days)
s = maximum stack height (number of layers)
u = stack occupancy rate
p = peaking factor
The peaking factor is an allowance for peak conditions and often assumed to be 1,4.
The e-factor is relating to the additional surface needed for driving lanes, handling equipment and office buildings.
When the e-value is 2, this means that twice as much space is needed compared to the actual surface, which the
containers occupy. Alderton gives various values (between 1 and 3,9) for the e-factor of terminals, depending on the
handling equipment and their corresponding traffic paths. But the formula is designed for storage at terminals. It is
considered that empty depots relatively occupy more space than terminals due to shuffling clamps and repair and
maintenance activities. Furthermore stacks are organized by type and owner. In order to apply this e-value to
determine the terrain productivity of empty depots, the e-value is calibrated on existing data (see table L.l).
Table L.l: Calibration of e-value
Empty depot
Van Doom
Kramer
Average
Terrain capacity in TEU
(maximal occupation)
13,000
15,000
Surface of terrain in mA2
80,000
100,000
e - value
2.3
2.5
2.4
The average dwell time and maximum stack height is approximated on basis of interviews. For verification the formula
has been applied to current number of depot arrivals. The calculated total surface needed for empty depot appeared to
149
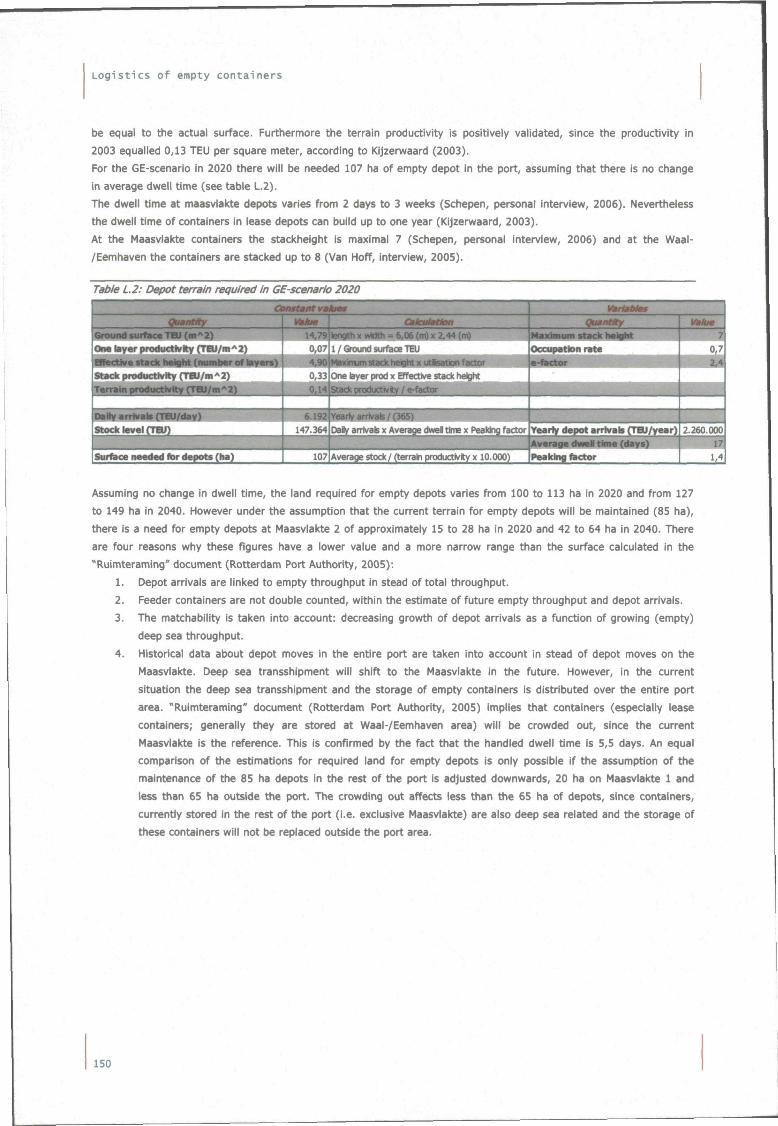
Logistics of empty containers
be equal to the actual surface. Furthermore the terrain productivity is positively validated, since the productivity in
2003 equalled 0,13 TEU per square meter, according to Kijzerwaard (2003).
For the GE-scenario in 2020 there will be needed 107 ha of empty depot in the port, assuming that there is no change
in average dwell time (see table L.2).
The dwell time at maasvlakte depots varies from 2 days to 3 weeks (Schepen, personal interview, 2006). Nevertheless
the dwell time of containers in lease depots can build up to one year (Kijzerwaard, 2003).
At the Maasvlakte containers the stackheight is maximal 7 (Schepen, personal interview, 2006) and at the Waal-
/Eemhaven the containers are stacked up to 8 (Van Hoff, interview, 2005).
Table L.2: Depot terrain required in GE-scenario 2020
Surface needed for depots (ha) 107 [Average stock/ (terrain productJyly x 10.000) Average dwel time (days) Peakinfl factor
Assuming no change in dwell time, the land required for empty depots varies from 100 to 113 ha in 2020 and from 127
to 149 ha in 2040. However under the assumption that the current terrain for empty depots will be maintained (85 ha),
there is a need for empty depots at Maasvlakte 2 of approximately 15 to 28 ha in 2020 and 42 to 64 ha in 2040. There
are four reasons why these figures have a lower value and a more narrow range than the surface calculated in the
"Ruimteraming" document (Rotterdam Port Authority, 2005):
1. Depot arrivals are linked to empty throughput in stead of total throughput.
2. Feeder containers are not double counted, within the estimate of future empty throughput and depot arrivals.
3. The matchability is taken into account: decreasing growth of depot arrivals as a function of growing (empty)
deep sea throughput.
4. Historical data about depot moves in the entire port are taken into account in stead of depot moves on the
Maasvlakte. Deep sea transshipment will shift to the Maasvlakte in the future. However, in the current
situation the deep sea transshipment and the storage of empty containers is distributed over the entire port
area. "Ruimteraming" document (Rotterdam Port Authority, 2005) implies that containers (especially lease
containers; generally they are stored at Waal-/Eemhaven area) will be crowded out, since the current
Maasvlakte is the reference. This is confirmed by the fact that the handled dwell time is 5,5 days. An equal
comparison of the estimations for required land for empty depots is only possible if the assumption of the
maintenance of the 85 ha depots in the rest of the port is adjusted downwards, 20 ha on Maasvlakte 1 and
less than 65 ha outside the port. The crowding out affects less than the 65 ha of depots, since containers,
currentiy stored in the rest of the port (i.e. exclusive Maasvlakte) are also deep sea related and the storage of
these containers will not be replaced outside the port area.
150
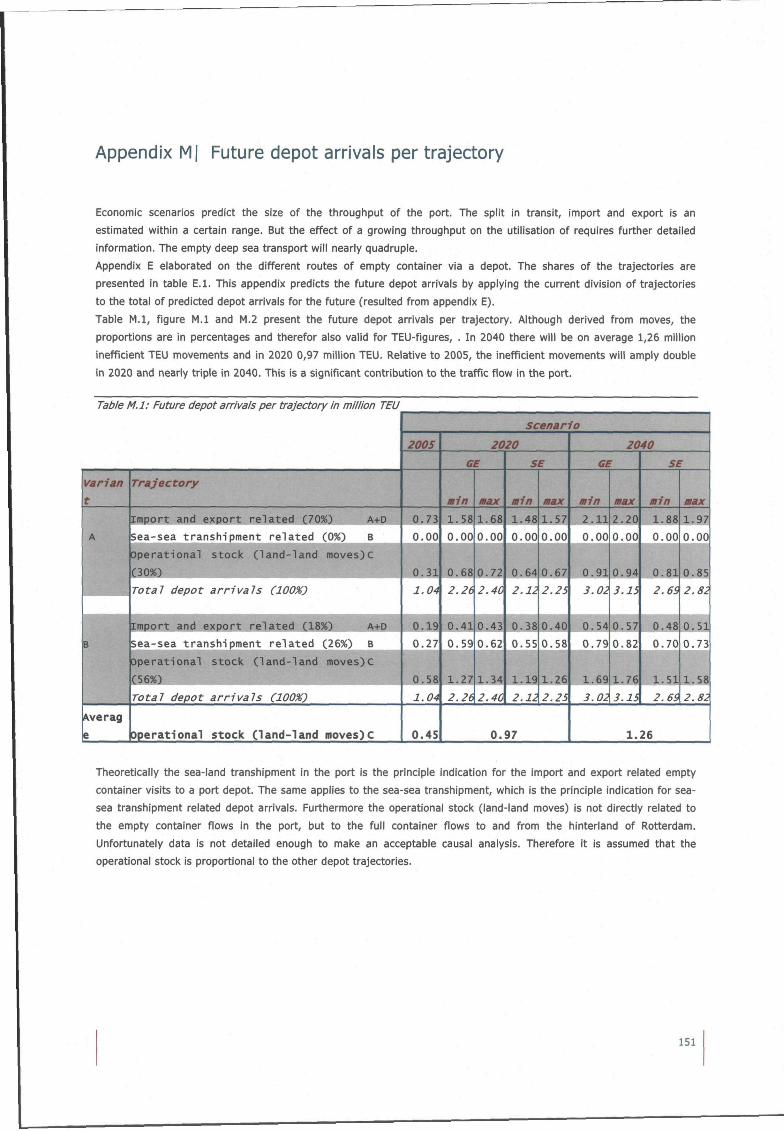
Appendix l^| Future depot arrivals per trajectory
Economic scenarios predict the size of the throughput of the port. The split in transit, import and export is an
estimated within a certain range. But the effect of a growing throughput on the utilisation of requires further detailed
information. The empty deep sea transport will neariy quadruple.
Appendix E elaborated on the different routes of empty container via a depot. The shares of the trajectories are
presented in table E.l. This appendix predicts the future depot arrivals by applying the current division of trajectories
to the total of predicted depot arrivals for the future (resulted from appendix E).
Table M.l, figure M.l and M.2 present the future depot arrivals per trajectory. Although derived from moves, the
proportions are in percentages and therefor also valid for TEU-figures, . In 2040 there will be on average 1,26 million
inefficient TEU movements and in 2020 0,97 million TEU. Relative to 2005, the inefficient movements will amply double
in 2020 and neariy triple in 2040. This is a significant contribution to the traffic flow in the port.
Table M.l: Future depot arrivals per trajectory in million TEU
varian
t
A
• B
Averag
e
Trajectory
Import and expor t r e l a t e d (70%) A+D
Sea-sea t ransh ipment r e l a t e d (0%) B
Opera t iona l s tock ( l a n d - l a n d moves)C
(30%)
Total depot arrivals (100%)
impor t and expor t r e l a t e d (18%) A+D
sea-sea t ransh ipment r e l a t e d (26%) B
Opera t iona l s tock ( l a n d - l a n d moves)c
Total depot arrivals (100%)
operat ional stock ( l a n d - l a n d moves)c
scenario
2005
0.73
0.00
0 . 3 1
1.04
0.19
0.27
0.58
1.04
0.45
2020
GE
min
1.58
0.00
0.68
2.26
0 . 4 1
0.59
1.27
2.26
max
1.68
0.00
0.72
2.40
0.43
0.62
1.34
2.40
SE
min
1.48
0.00
0.64
2.n
0.38
0.55
1.19
2.12
max
1.57
0.00
0.67
2.25
0.40
0.58
1.26
2.25
0.97
2040
GE
min
2 . 1 1
0.00
0 . 9 1
3.02
0.54
0.79
1.69
3.02
max
2.20
0.00
0.94
3.15
0.57
0.82
1.76
3.15
1 .
SE
min
1.88
0.00
0 . 8 1
2.6S
0.48
0.70
1.51
2.69
max
1.97
0.00
0.85
2.8k
0 . 5 1
0.73
1.58
2.82
26
Theoretically the sea-land transhipment in the port is the principle indication for the import and export related empty
container visits to a port depot. The same applies to the sea-sea transhipment, which is the principle indication for sea-
sea transhipment related depot arrivals. Furthermore the operational stock (land-land moves) is not directly related to
the empty container flows in the port, but to the full container flows to and from the hinterland of Rotterdam.
Unfortunately data is not detailed enough to make an acceptable causal analysis. Therefore it is assumed that the
operational stock is proportional to the other depot trajectories.
151
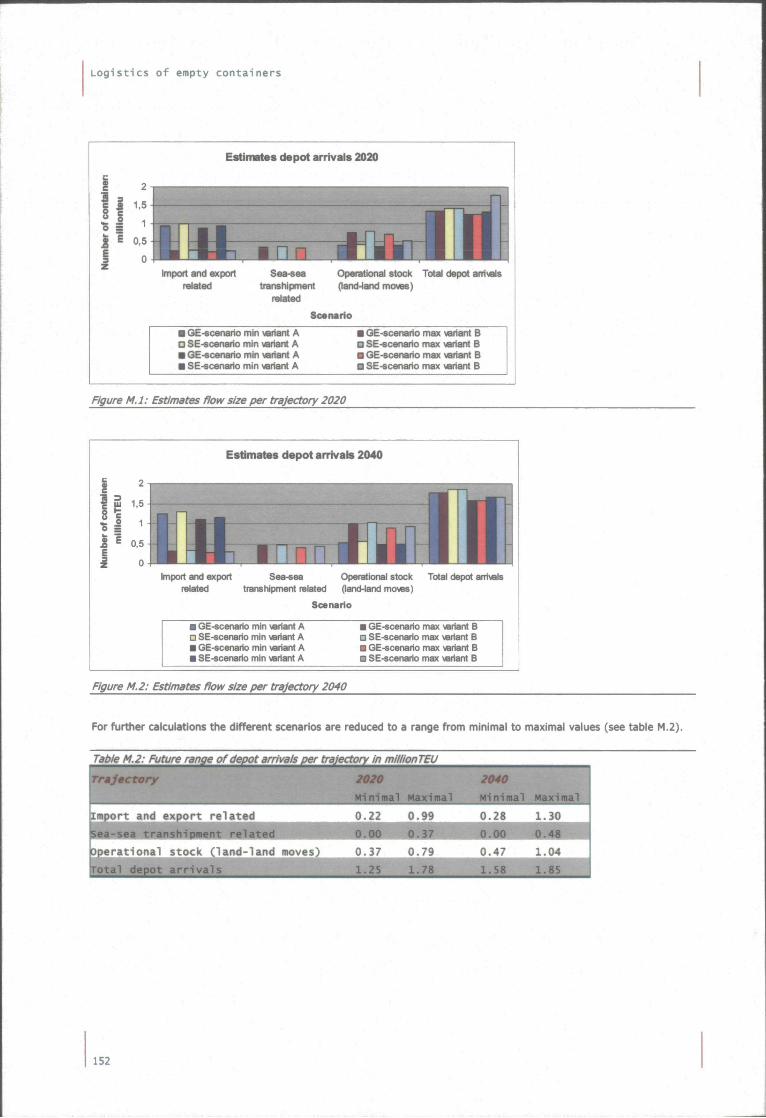
Logist ics of empty containers
Eatlmatas depot arrivals 2020
Import and export related
Operational stock Total depot arrivals transhipment (land-land moves)
related
Scenario
• GE-scenario min veiiant A a SE-scenario min variant A • GE-scenario min variant A • SE-scenatio min variant A
• GE-scenario max variant 6 a SE-scenario max variant B • GE-scenario max variant 8 • SE-scenarto max variant B
f^ure M.l: Estimates flow size per trajectory 2020
Estimates depot anrlvais 2040
If I Ë 0,6 IttFr^^^^^rFMinl
Import and export Sea-«ea Operational stock Total depot arrivals related transhipment related (land-land moves)
Scenario
• GE-scenario min variant A a SE-scenario min variant A • GE-scenaiio min variant A • SE-scenario min \ariant A
• GE-scenario max variant B • SE-scenario max variant B • GE-scenario max variant B • SE-scenario max variant B
^ure M.2: Estimates flow size per trajectory 2040
For further calculations the different scenarios are reduced to a range from minimal to maximal values (see table M.2).
7ir^/e M.2: Future range of depot arrivals per trajectory in millionTEU
Trajectory 2020
Minimal Maximal
[Import and export re la ted
related^
?perationa1 stock ( land-land moves)
Total depot a r r i va l s 0.37
152
Appendix N| Trends
In this appendix the trends of the external factors will be discussed.
Scale enlargements Regarding the scale enlargements of depot terrain, the capacity has grown and fusions caused that the capacity per
depot has increased (Schepen, personal interview, 2006).
Deep sea container vessels
Container vessels are increasing in size especially the vessels on the trade lane to the Far East (PAR, 2005). On basis
of the order books it can be concluded that the deep sea vessel capacity of containers is growing (Lloyds shipping
economist, 2006). Since 50% of the transhipment of containers is related to the Far East trade lane this will have an
impact. But it is not sure if this impact will be positive or negative.
If a vessel needs to load and unload more containers within one visit, the dwell time of vessel in the port will increase.
From a direct point of view this will increase the time of the roundtrip between the Far East and Europe. The question
is if this will still bring scale advantages.
Shipping lines differ on opinion about these advantages. Some wait for the cat to jump, in order to see if it is lucrative.
Advantages are that the size of the crew can be kept minimal (14 persons on the Emma Maersk ship) and relatively
less fuel is needed, which is very interesting, since fuel is getting scarce.
Dyna liners (2004/37, September) states that because of the increase of the turnaround time of nine in stead of eight
weeks, more vessels need to be deployed, to guarantee the same frequency. If that is the case, the costs will increase
with 12,5%.
Besides the vessel size, it is probable that fewer ports are being visited in one trip, which results in an increase of
feeders or solely a decrease in frequency. One way or the other the trip time of containers will increase, unless the
speed is remarkably high,
According to RPA (2005) it was expected that the big vessels would call less ports as possible in order to make
efficiently use of the vessels. But it turned out to be different. The vessels try to call as many ports as possible in order
to reduce costs for feeder services and land moves.
But at the same time feeder services increased to United Kingdom and the East Sea area. This might change if
mainports are developed at those places.
Since the development of the routing of great container vessels Is not sure, RPA has developed two alternative
solutions.
An advantage of the Maasvlakte is that bigger vessels are able to reach the terminal relatively easy, since it is situated
on the sea, a minimum of manoeuvres has to be performed. The draft of the vessels is also important. According to
dynaliners (2005,21) 'the maximum number of boxes to be stowed on each other onboard of a ship is 10 tiers high,
according to classification society Germanischer Lloyd. This parameter will decide whether ships will become wider
and/or longer, but their draft will not much further increase than the current around 15 metres anymore. Unless a
more advanced system for under deck stowage would be developed, of course.'
In the current situation Rotterdam is on front when it comes to accessibility for vessels with great drafts. But since that
is not likely to set the trend, Rotterdam might lose this leading position.
According to PAR (2005) the container vessel fleet had a capacity of 7.29 million TEU woridwide, divided over 3362
vessels.
Barge capacity
Barge traffic has grown in the past few years (see figure N.I).
153
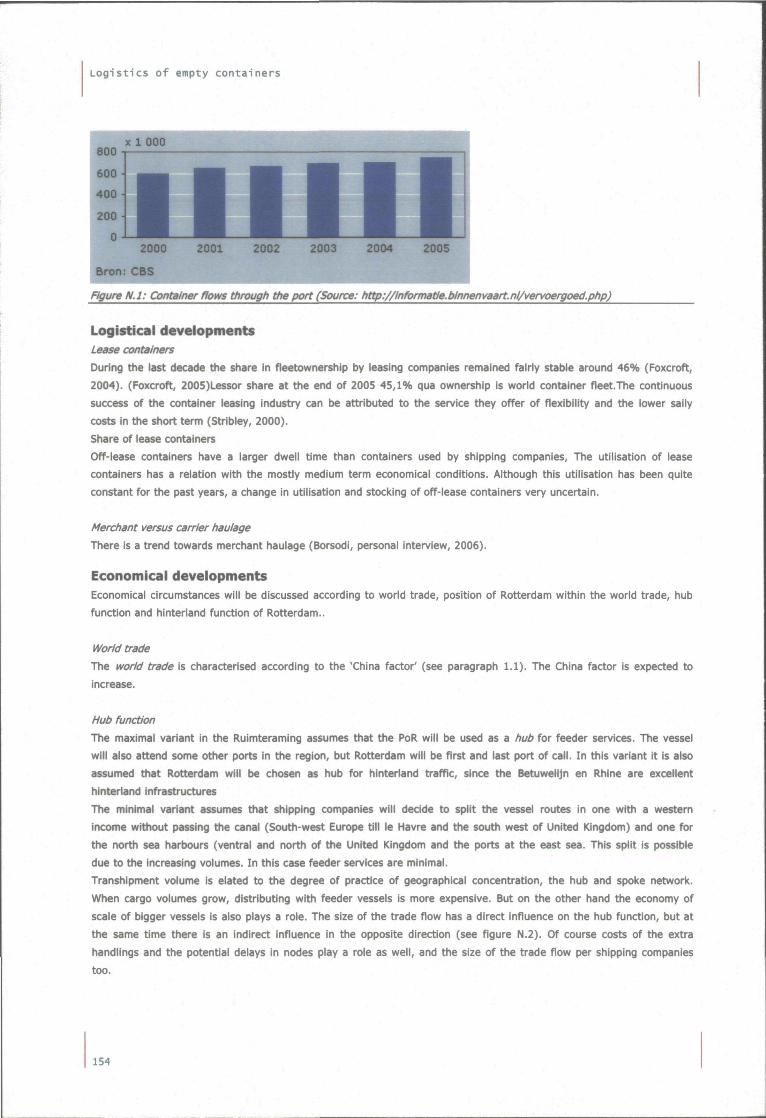
Logistics of empty containers
^ x 1 000 800
600 -
400 •
I: 2000 2001 2002 2003 2004 2005
on; CBS
Figure N.I: Container flows through the port (Source: http://informatie.binnenvaart.nl/vervoergoed.php)
Logistical developments Lease containers
During the last decade the share in fieetownership by leasing companies remained fairiy stable around 46% (Foxcroft,
2004). (Foxcroft, 2005)Lessor share at the end of 2005 45,1% qua ownership is worid container fieet.The continuous
success of the container leasing industry can be attributed to the service they offer of fiexibility and the lower sally
costs in the short term (Stribley, 2000).
Share of lease containers
Off-lease containers have a larger dwell time than containers used by shipping companies. The utilisation of lease
containers has a relation with the mostiy medium term economical conditions. Although this utilisation has been quite
constant for the past years, a change in utilisation and stocking of off-lease containers very uncertain.
Merchant versus carrier haulage
There is a trend towards merchant haulage (Borsodi, personal interview, 2006).
Economical developments Economical circumstances will be discussed according to worid trade, position of Rotterdam within the worid trade, hub
function and hinteriand function of Rotterdam..
World trade
The world trade is characterised according to the "China factor' (see paragraph 1.1). The China factor is expected to
increase.
Hub function
The maximal variant in the Ruimteraming assumes that the PoR will be used as a hub for feeder services. The vessel
will also attend some other ports in the region, but Rotterdam will be first and last port of call. In this variant it is also
assumed that Rotterdam will be chosen as hub for hinteriand traffic, since the Betuwelijn en Rhine are excellent
hinterland infrastructures
The minimal variant assumes that shipping companies will decide to split the vessel routes in one with a western
income without passing the canal (South-west Europe till le Havre and the south west of United Kingdom) and one for
the north sea harbours (ventral and north of the United Kingdom and the ports at the east sea. This split is possible
due to the increasing volumes. In this case feeder services are minimal.
Transhipment volume is elated to the degree of practice of geographical concentration, the hub and spoke network.
When cargo volumes grow, distributing with feeder vessels is more expensive. But on the other hand the economy of
scale of bigger vessels is also plays a role. The size of the trade fiow has a direct influence on the hub function, but at
the same time there is an indirect influence in the opposite direction (see figure N.2). Of course costs of the extra
handlings and the potential delays in nodes play a role as well, and the size of the trade fiow per shipping companies
too.
154
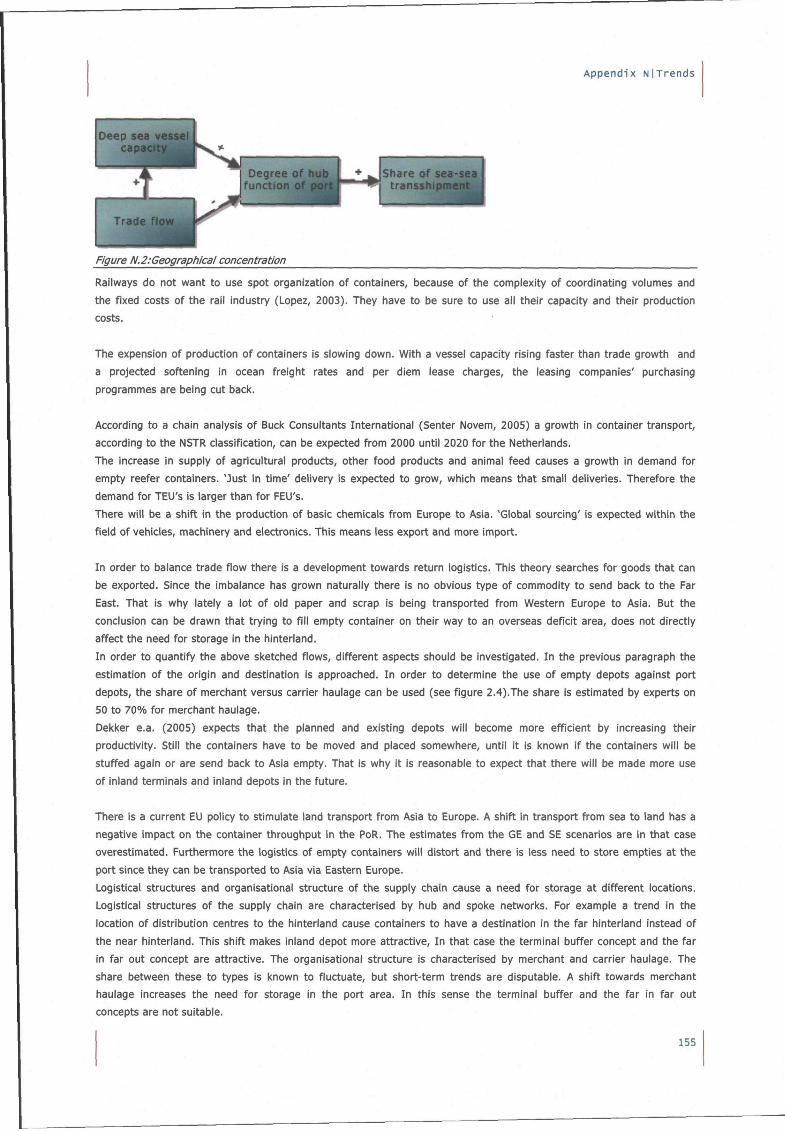
Appendix NI Trends
Figure N.2:Geographical concentration
Railways do not want to use spot organization of containers, because of the complexity of coordinating volumes and
the fixed costs of the rail industry (Lopez, 2003). They have to be sure to use all their capacity and their production
costs.
The expension of production of containers is slowing down. With a vessel capacity rising faster than trade growth and
a projected softening in ocean freight rates and per diem lease charges, the leasing companies' purchasing
programmes are being cut back.
According to a chain analysis of Buck Consultants International (Senter Novem, 2005) a growth in container transport,
according to the NSTR classification, can be expected from 2000 until 2020 for the Netherlands.
The increase in supply of agricultural products, other food products and animal feed causes a growth in demand for
empty reefer containers. 'Just in time' delivery is expected to grow, which means that small deliveries. Therefore the
demand for TEU's is larger than for FEU's.
There will be a shift in the production of basic chemicals from Europe to Asia. 'Global sourcing' is expected within the
field of vehicles, machinery and electronics. This means less export and more import.
In order to balance trade flow there is a development towards return logistics. This theory searches for goods that can
be exported. Since the imbalance has grown naturally there is no obvious type of commodity to send back to the Far
East. That is why lately a lot of old paper and scrap is being transported from Western Europe to Asia. But the
conclusion can be drawn that trying to fill empty container on their way to an overseas deficit area, does not directly
affect the need for storage in the hinterland.
In order to quantify the above sketched flows, different aspects should be investigated. In the previous paragraph the
estimation of the origin and destination is approached. In order to determine the use of empty depots against port
depots, the share of merchant versus carrier haulage can be used (see figure 2.4).The share is estimated by experts on
50 to 70% for merchant haulage.
Dekker e.a, (2005) expects that the planned and existing depots will become more efficient by increasing their
productivity. Still the containers have to be moved and placed somewhere, until it is known if the containers will be
stuffed again or are send back to Asia empty. That is why it is reasonable to expect that there will be made more use
of inland terminals and inland depots in the future.
There is a current EU policy to stimulate land transport from Asia to Europe. A shift in transport from sea to land has a
negative impact on the container throughput in the PoR. The estimates from the GE and SE scenarios are in that case
overestimated. Furthermore the logistics of empty containers will distort and there is less need to store empties at the
port since they can be transported to Asia via Eastern Europe.
Logistical structures and organisational structure of the supply chain cause a need for storage at different locations.
Logistical structures of the supply chain are characterised by hub and spoke networks. For example a trend in the
location of distribution centres to the hinterland cause containers to have a destination in the far hinteriand instead of
the near hinteriand. This shift makes inland depot more attractive. In that case the terminal buffer concept and the far
in far out concept are attractive. The organisational structure is characterised by merchant and carrier haulage. The
share between these to types is known to fluctuate, but short-term trends are disputable. A shift towards merchant
haulage increases the need for storage in the port area. In this sense the terminal buffer and the far in far out
concepts are not suitable.
155
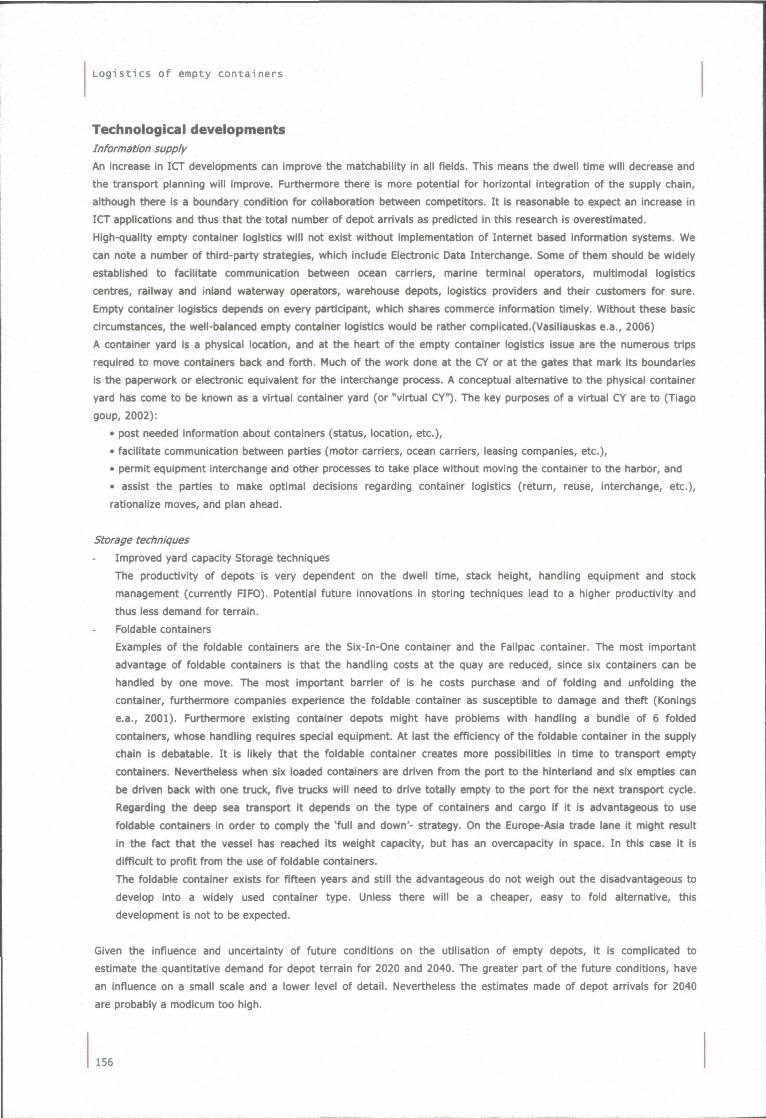
Logistics of empty containers
Technological developments Information supply
An increase in ICT developments can improve the matchability in all fields. This means the dwell time will decrease and
the transport planning will improve. Furthermore there is more potential for horizontal integration of the supply chain,
although there is a boundary condition for collaboration between competitors. It is reasonable to expect an increase in
ICT applications and thus that the total number of depot arrivals as predicted in this research is overestimated.
High-quality empty container logistics will not exist without implementation of Internet based information systems. We
can note a number of third-party strategies, which include Electronic Data Interchange. Some of them should be widely
established to facilitate communication between ocean carriers, marine terminal operators, multimodal logistics
centres, railway and inland waterway operators, warehouse depots, logistics providers and their customers for sure.
Empty container logistics depends on every participant, which shares commerce information timely. Without these basic
circumstances, the well-balanced empty container logistics would be rather complicated.(Vasiliauskas e.a., 2006)
A container yard is a physical location, and at the heart of the empty container logistics issue are the numerous trips
required to move containers back and forth. Much of the work done at the CY or at the gates that mark its boundaries
is the paperwork or electronic equivalent for the interchange process. A conceptual alternative to the physical container
yard has come to be known as a virtual container yard (or "virtual CY'O- The key purposes of a virtual CY are to (Tiago
goup, 2002):
• post needed information about containers (status, location, etc.),
• facilitate communication between parties (motor carriers, ocean carriers, leasing companies, etc.),
• permit equipment interchange and other processes to take place without moving the container to the hart>or, and
• assist the parties to make optimal decisions regarding container logistics (return, reuse, interchange, etc.),
rationalize moves, and plan ahead.
Storage techniques
Improved yard capacity Storage techniques
The productivity of depots is very dependent on the dwell time, stack height, handling equipment and stock
management (currentiy FIFO). Potential future innovations in storing techniques lead to a higher productivity and
thus less demand for terrain.
Foldable containers
Examples of the foldable containers are the Six-In-One container and the Fallpac container. The most important
advantage of foldable containers is that the handling costs at the quay are reduced, since six containers can be
handled by one move. The most important barrier of is he costs purchase and of folding and unfolding the
container, furthermore companies experience the foldable container as susceptible to damage and theft (Konings
e.a., 2001). Furthermore existing container depots might have problems with handling a bundle of 6 folded
containers, whose handling requires special equipment. At last the efficiency of the foldable container in the supply
chain is debatable. It Is likely that the foldable container creates more possibilities in time to transport empty
containers. Nevertheless when six loaded containers are driven from the port to the hinteriand and six empties can
be driven back with one truck, five trucks will need to drive totally empty to the port for the next transport cyde.
Regarding the deep sea transport it depends on the type of containers and cargo If it is advantageous to use
foldable containers in order to comply the 'full and down'- strategy. On the Europe-Asia trade lane It might result
In the fact that the vessel has reached its weight capacity, but has an overcapacity In space. In this case it is
difficult to profit from the use of foldable containers.
The foldable container exists for fifteen years and still the advantageous do not weigh out the disadvantageous to
develop Into a widely used container type. Unless there will be a cheaper, easy to fold alternative, this
development is not to be expected.
Given the influence and uncertainty of future conditions on the utilisation of empty depots, it is complicated to
estimate the quantitative demand for depot terrain for 2020 and 2040. The greater part of the future conditions, have
an influence on a small scale and a lower level of detail. Nevertheless the estimates made of depot arrivals for 2040
are probably a modicum too high.
156
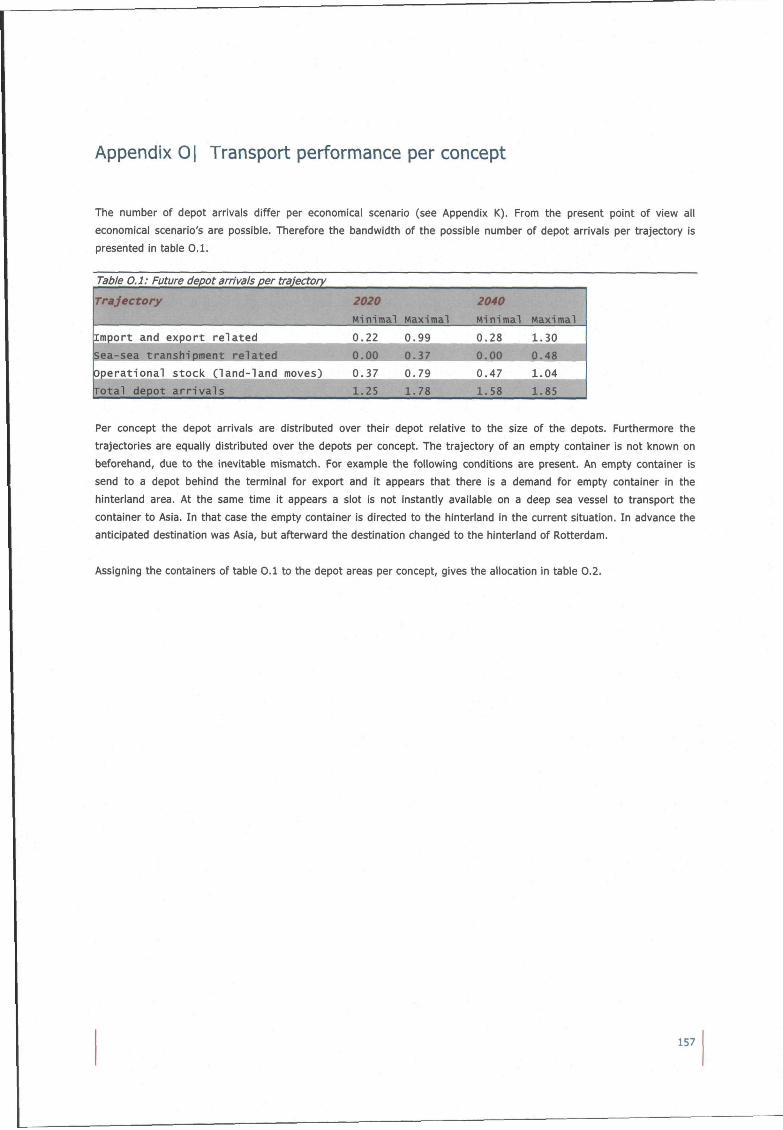
Appendix 0| Transport performance per concept
The number of depot arrivals differ per economical scenario (see Appendix K). From the present point of view all
economical scenario's are possible. Therefore the bandwidth of the possible number of depot arrivals per trajectory is
presented in table 0.1.
Table 0.1: Future depot arrivals per trajectory
Trajectory
Import and export re lated sea-sea transhinment r p l a i ^ ^ ^ ^ ^ ^ H
Operational stock ( land-land moves)
ro ta l depot a r r i va l s
2020
Minimal
0.22
0.37 \.,£.^
Maximal
0.99 imn 0.79
l .?8
2040
Minimal
0.28
• • I H 0.47
1.58
Maximal
1.30
B»8 1.04
1.85
Per concept the depot arrivals are distributed over their depot relative to the size of the depots. Furthermore the
trajectories are equally distributed over the depots per concept. The trajectory of an empty container is not known on
beforehand, due to the inevitable mismatch. For example the following conditions are present. An empty container is
send to a depot behind the terminal for export and it appears that there is a demand for empty container in the
hinteriand area. At the same time it appears a slot is not instantiy available on a deep sea vessel to transport the
container to Asia. In that case the empty container is directed to the hinterland in the current situation. In advance the
anticipated destination was Asia, but afterward the destination changed to the hinteriand of Rotterdam.
Assigning the containers of table 0.1 to the depot areas per concept, gives the allocation in table 0.2.
157
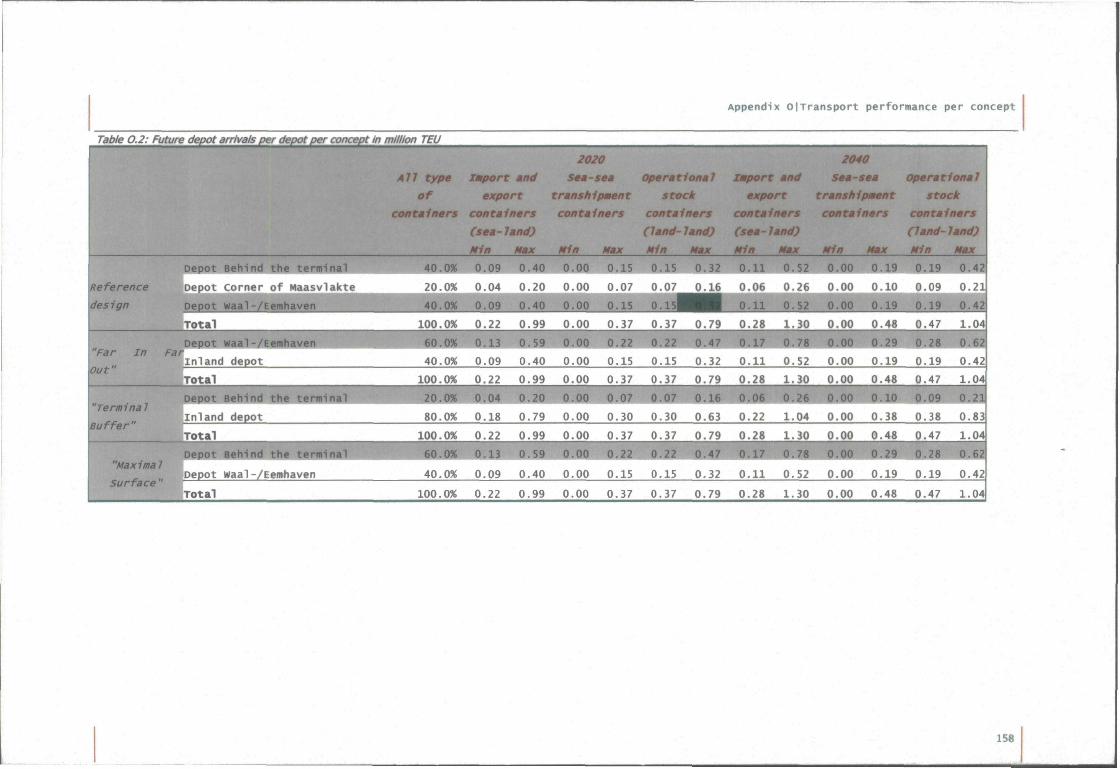
Appendix OjTransport performance per concept
Table 0.2: Future depot arrivals i
Depot Behind the t e r m i n a l
Reference Depot co rner of Maasvlaicte
design Depot Waal-/Eemhaven
T o t a l
All type
of
containers
wÊÊÊÊÊï^^
"Far
Out"
in Far Depot Waal-/Eemhaven
Inland depot
Total
"Termina 1
Buffer"
Depot Behind the term^
Inland depot
Total
"Maximal
Surface "
DepQlMMdUJid t h *
Depot waal-/Eemhaven
To ta l
Import and
export
containers
(sea-land)
Min Max
2020
Sea-sea
transhipment
containers
Min Max
operatlmnêJ
stock
containers
(land-land)
Min Max
Import
export
containers
(sea-land)
Min Max
2040
Sea-sea
transhipment
containers
Min Max
operational
stock
containers
(land- land)
Min Max
0.11 0.52
0.06 0.26
0 .11 0.52
0.00
0.00
0.00
0.19
0.10
0.19
0.19 0.42
0.09 0.21
0.19 0.421
0.48 0.47 1.04
«ÉÉZS 0.62
0.19 0.42
100.0% 1.04
9 0 .21
0.38 0.83
100.0% 0.22
100.0% 0.22 0.99 0.00 0.37 0.37 0.79 0.28 1.30 0.00 0.48 0.47 1.04
15«
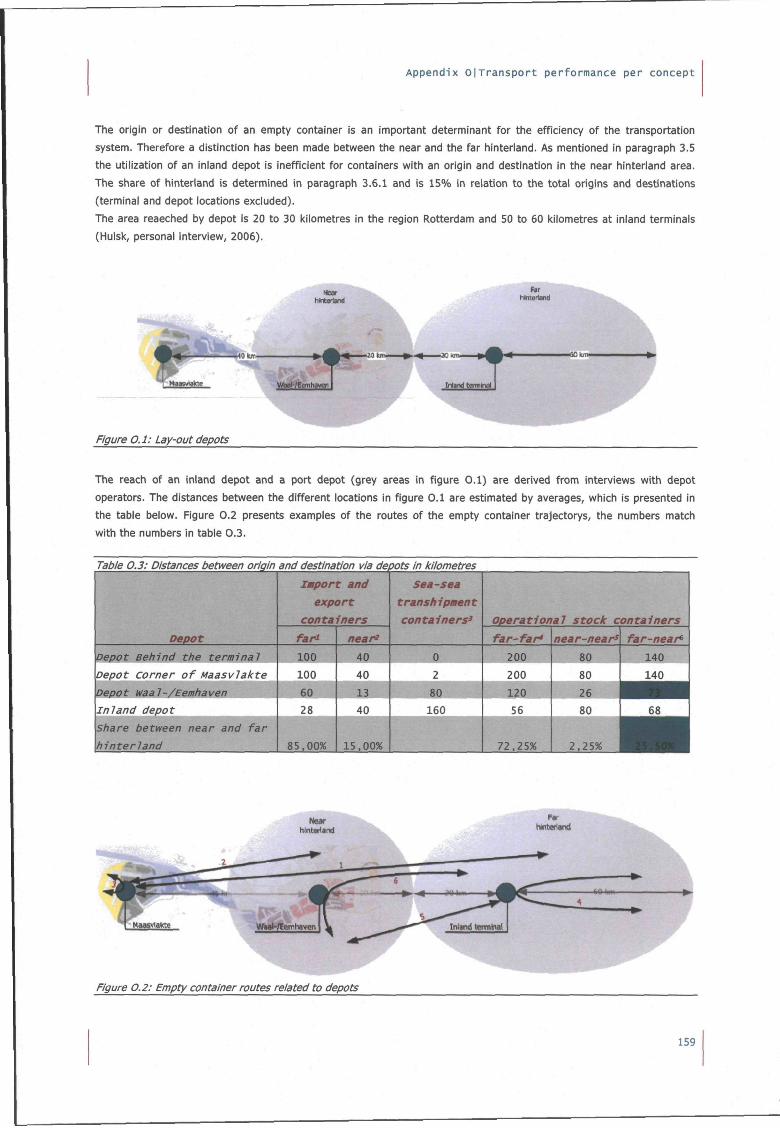
Appendix OjTransport performance per concept
The origin or destination of an empty container is an important determinant for the efficiency of the transportation
system. Therefore a distinction has been made between the near and the far hinteriand. As mentioned in paragraph 3.5
the utilization of an inland depot is inefficient for containers with an origin and destination in the near hinteriand area.
The share of hinteriand is determined in paragraph 3.6.1 and is 15% in relation to the total origins and destinations
(terminal and depot locations excluded).
The area reaeched by depot is 20 to 30 kilometres in the region Rotterdam and 50 to 60 kilometres at inland terminals
(Hulsk, personal interview, 2006).
A r hinterlarNi
I^Ha.
Vftel/tOTllXCT Inland terminal
Figure 0.1: Lay-out depots
The reach of an inland depot and a port depot (grey areas in figure 0.1) are derived from interviews with depot
operators. The distances between the different locations in figure 0.1 are estimated by averages, which is presented in
the table below. Figure 0.2 presents examples of the routes of the empty container trajectorys, the numbers match
with the numbers in table 0.3.
Table 0.3: Distances between origin
Depot
Depot Behind the terminal
Depot corner of Maasvlakte Denot uaal-/EemhavMn.^^^^
Inland depot ^ ^ ^ ^
Share between nea^an^rar
hinterland
and destination via depots in kilometres
Import and
export
containers
fari
100
100
near'
40
40
^ ^ ^ H ^ 13 28
85.00%
40
15,00%
Sea-sea
transhipment
containers^
0
2
80
160
Operational stock containers
far-far*
200
200
120
56
72,25%
near-near'
80
80
far-near^
140
140
^ ^ H 80 68 1
^ ^ H
Figure 0.2: Empty container routes related to depots
159
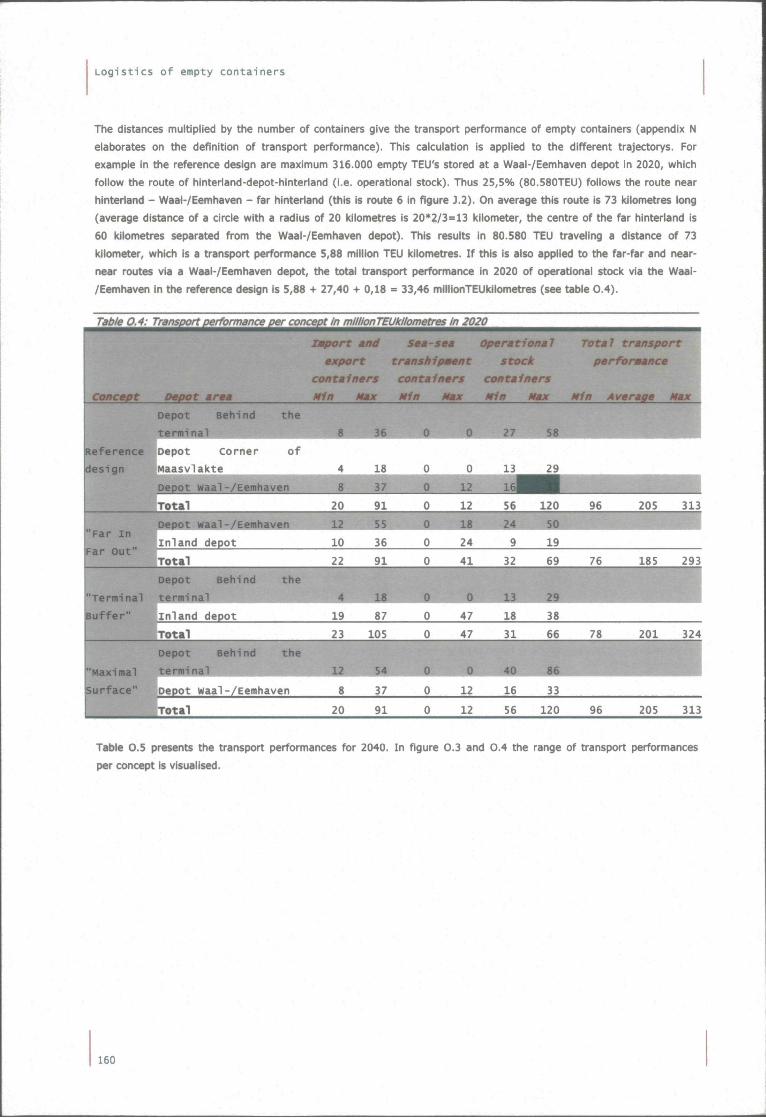
Logistics of empty containers
The distances multiplied by the number of containers give the transport performance of empty containers (appendix N
elaborates on the definition of transport performance). This calculation is applied to the different trajectorys. For
example in the reference design are maximum 316.000 empty TEU's stored at a Waal-/Eemhaven depot in 2020, which
follow the route of hinteriand-depot-hinteriand (i.e. operational stock). Thus 25,5% (80.580TEU) follows the route near
hinteriand - Waal-/Eemhaven - far hinteriand (this is route 6 in figure J.2). On average this route is 73 kilometres long
(average distance of a circle with a radius of 20 kilometres is 20*2/3=13 kilometer, the centre of the far hinterland is
60 kilometres separated from the Waal-/Eemhaven depot). This results in 80.580 TEU traveling a distance of 73
kilometer, which is a transport performance 5,88 million TEU kilometres. If this is also applied to the far-far and near-
near routes via a Waal-/Eemhaven depot, the total transport performance in 2020 of operational stock via the Waal-
/Eemhaven in the reference design is 5,88 •*• 27,40 + 0,18 = 33,46 millionTEUkilometres (see table 0.4).
Table 0.4. com in millionTEUkilometres in 2020
Depot area
import and Sea-sea operational
export transhipment stock
containers containers containers
Min Max Min Max Min Max
Total transport
performance M
Min Average Max
Reference
design
Depot Behind the
termi na^^^^^^^^^^H
Depot Corner of
Maasvlakte
J Depot Waal-/Eemhaven
"Far In
Far Out"
Total
•inland depot
Total
20 • n
10
22
91 - ue:
36
91
0
0
0
12 1 »
24
41
56 « * • - •
9
32
120
19
69
96 •.,.v;--:
76
205
185
313
293
"Termi nal
Buffer"
Depot Behind
terminal ^ ^ ^
the
"Maximal
Surface"
Inland depot
Total
Depot Behind the
Depot waa1-/Eemhaven
19
23
8
87
105
37
0
0
0
47 47
12
18
31
16
38
66
33
78 201 324
J Tota l 20 91 12 56 120 96 205 313
Table 0.5 presents the transport performances for 2040. In figure 0.3 and 0.4 the range of transport performances
per concept is visualised.
160
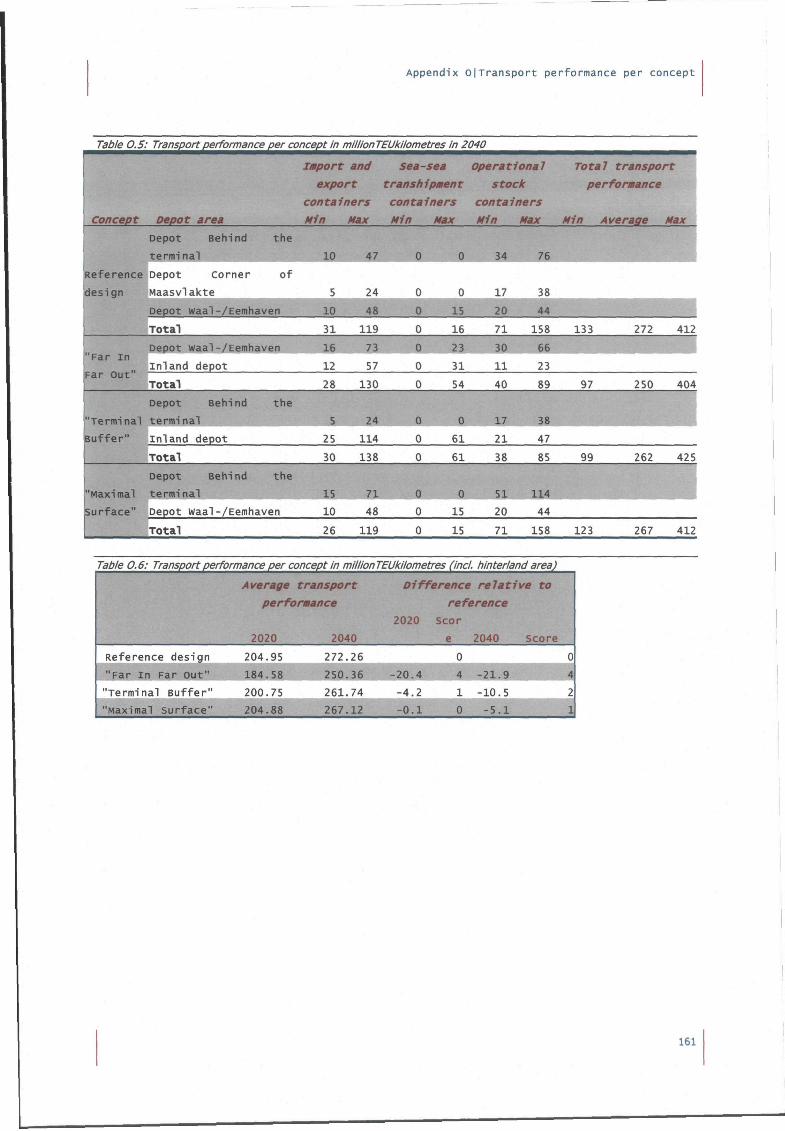
Appendix olTransport performance per concept
Table 0.5: Transport performance per concept in millionTEUkilometres in 2040
Concept Depot area
import and sea-sea operational
export transhipment stock
containers containers containers
Min Max Min Max Min Max
Total transport
performance
Min Average Max
Depot Behind the
terminal
Reference Depot corner of
design Maasvlakte
Depot Waal-/Eemhaven
10
5
10
47
24
«1
0
0
H
0
0 • 1
34
17
••
76
38
•;
Vüüüi Tota l 31 119 16 71 158 133 272 412
"Far i n
Far Out"
Depot waal-/Eemhaven 16 73 0 23 30 66
in land depot 12 57 0 31 11 23
Total
Depot Behind
terminal
Inland depot
the
m
28
^ ^
25
130
1^4 114
0
0
0
54
0
61
40
17
21
89
38
47
97 250 404 "I
"Termina l
B u f f e r "
Total 30 138 61 38 85 99 262 425
Maximal
Su r face"
Depot Behind the
te rm i nal
Depot Waal-/Eemhaven
15
10
71
48
0
0
0
15
51
20
114
44 m
Total 26 119 15 71 158 123 267 412
Table 0.6: Transport performance per concept in million TEUkilometres (incl. hinterland area) u Average transport
performance
2020 2040
Difference relative to
reference
2020 SCOT
e 2040 Score
Reference design
"Far In Far out"
"Terminal Buffer"
Maximal surface"
204.95
184^58
200.75
204.88
272.26
„ 250.36
261.74
267.12
-20.4
-4.2
-0.1
0
4
1
0
-iM -10.5
-5.1
161
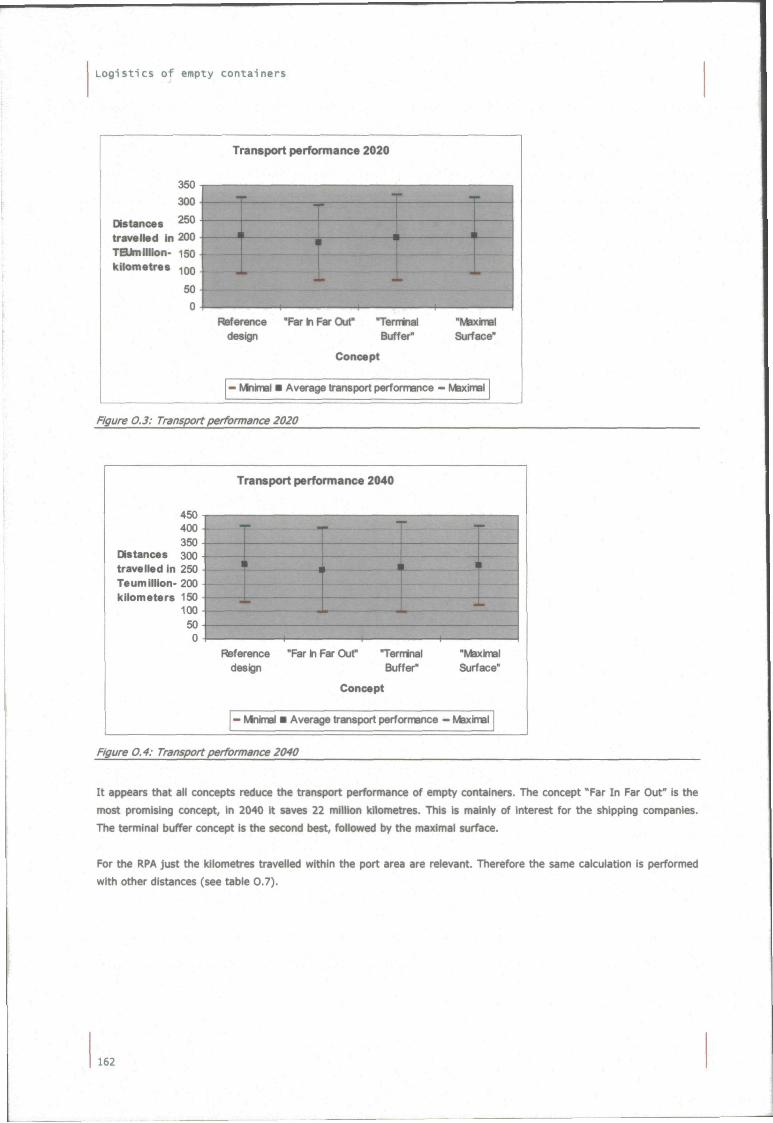
Logist ics o f empty containers
Transport performance 2020
350
300
Distances ^50 travelled In 200 TBUmlllion- 150 kilometres . QQ
50 + 0
[ ^ ^ S ^ S I I H H ^ - ^v ï-.c-^ï^i«;.'-> -1
Reference "Far In Far Out" "Ternninal "Maximal design Buffer" Surface"
Concept
— Mnlmal • Average transport performance - Maximal
Figure 0.3: Transport performance 2020
Transport performance 2040
450 400 350
Distances 300 travelled In 250 Teumilllon- 200 kilometers 150
100 50
O
ot
t
Reference design
"Far ki Far Our "Ternninai Buffer"
"Maximal Surface"
Concept
- Mnlmal • Average transport performance - Maximal
Figure 0.4: Transport performance 2040
I t appears that ail concepts reduce the transport performance of empty containers. The concept "Far In Far Out" is the
most promising concept, in 2040 it saves 22 million kilometres. This is mainly of interest for the shipping companies.
The terminal buffer concept is the second best, followed by the maximal surface.
For the RPA just the kilometres travelled within the port area are relevant. Therefore the same calculation is performed
with other distances (see table 0.7).
162
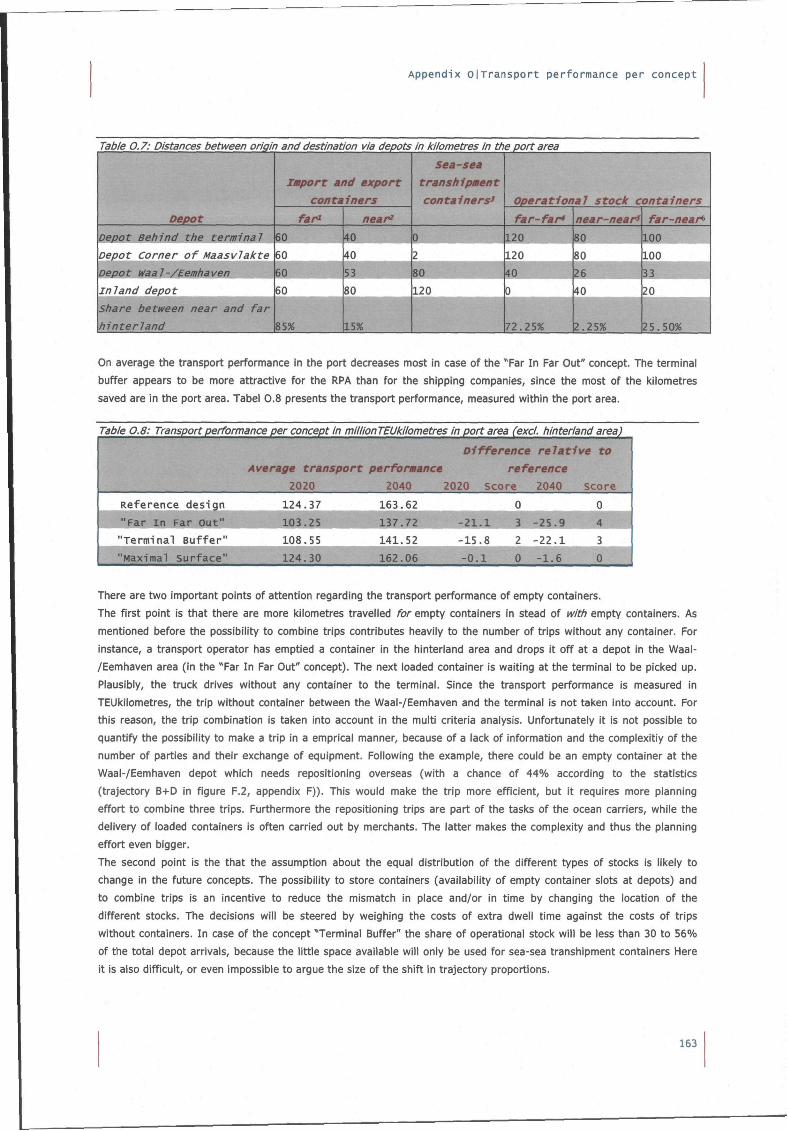
Appendix olTransport performance per concept
Table 0.7: Distances between origin and destination via depots in kilometres In the port area
Depot
Depot Behind the terminal
Depot Corner of Maasvlakte
Depot Uaal-/Eemhaven
inland depot
share between near and far
hinterland
Import and export containers
fari
60
60
60
60
85%
near'
40
40
53
80
15%
Sea-sea
transhipment
containers^
0
2
80
120
Operational stock containers
far-far*
120
L20
40
0
72.25%
near-near'
80
80
26
40
2.25%
far-near^
100
100
33
20
25.50%
On average the transport performance in the port decreases most in case of the "Far In Far Out" concept. The terminal
buffer appears to be more attractive for the RPA than for the shipping companies, since the most of the kilometres
saved are in the port area. Tabel 0.8 presents the transport performance, measured within the port area.
Table 0.8: Transport performance per concept in million TEUkilometres in port area (excl. hinterland area)
Reference design
"Far i n Far Out"
"Terminal Buffer"
"Maximal Surface"
Average transport performance
2020 2040
124.37
103. ^ ^ H 108.55
124.30
163.62
fei 137.721^ 141.52
162.06^™
Difference relati reference
2020 score 2040
0
-15.8 2 -22.1
ve to
score
0
m 3
0
There are two important points of attention regarding the transport performance of empty containers.
The first point is that there are more kilometres travelled for empty containers in stead of with empty containers. As
mentioned before the possibility to combine trips contributes heavily to the number of trips without any container. For instance, a transport operator has emptied a container in the hinteriand area and drops it off at a depot in the Waal-
/Eemhaven area (in the "Far In Far Out" concept). The next loaded container is waiting at the terminal to be picked up.
Plausibly, the truck drives without any container to the terminal. Since the transport performance is measured in
TEUkilometres, the trip without container between the Waal-/Eemhaven and the terminal is not taken into account. For
this reason, the trip combination is taken into account in the multi criteria analysis. Unfortunately it is not possible to
quantify the possibility to make a trip in a emprical manner, because of a lack of information and the complexitiy of the
number of parties and their exchange of equipment. Following the example, there could be an empty container at the
Waal-/Eemhaven depot which needs repositioning overseas (with a chance of 44% according to the statistics
(trajectory B+D in figure F.2, appendix F)). This would make the trip more efficient, but it requires more planning
effort to combine three trips. Furthermore the repositioning trips are part of the tasks of the ocean carriers, while the
delivery of loaded containers is often carried out by merchants. The latter makes the complexity and thus the planning
effort even bigger.
The second point is the that the assumption about the equal distribution of the different types of stocks is likely to
change in the future concepts. The possibility to store containers (availability of empty container slots at depots) and
to combine trips is an incentive to reduce the mismatch in place and/or in time by changing the location of the
different stocks. The decisions will be steered by weighing the costs of extra dwell time against the costs of trips
without containers. In case of the concept "Terminal Buffer" the share of operational stock will be less than 30 to 56%
of the total depot arrivals, because the little space available will only be used for sea-sea transhipment containers Here
it is also difficult, or even impossible to argue the size of the shift in trajectory proportions.
163
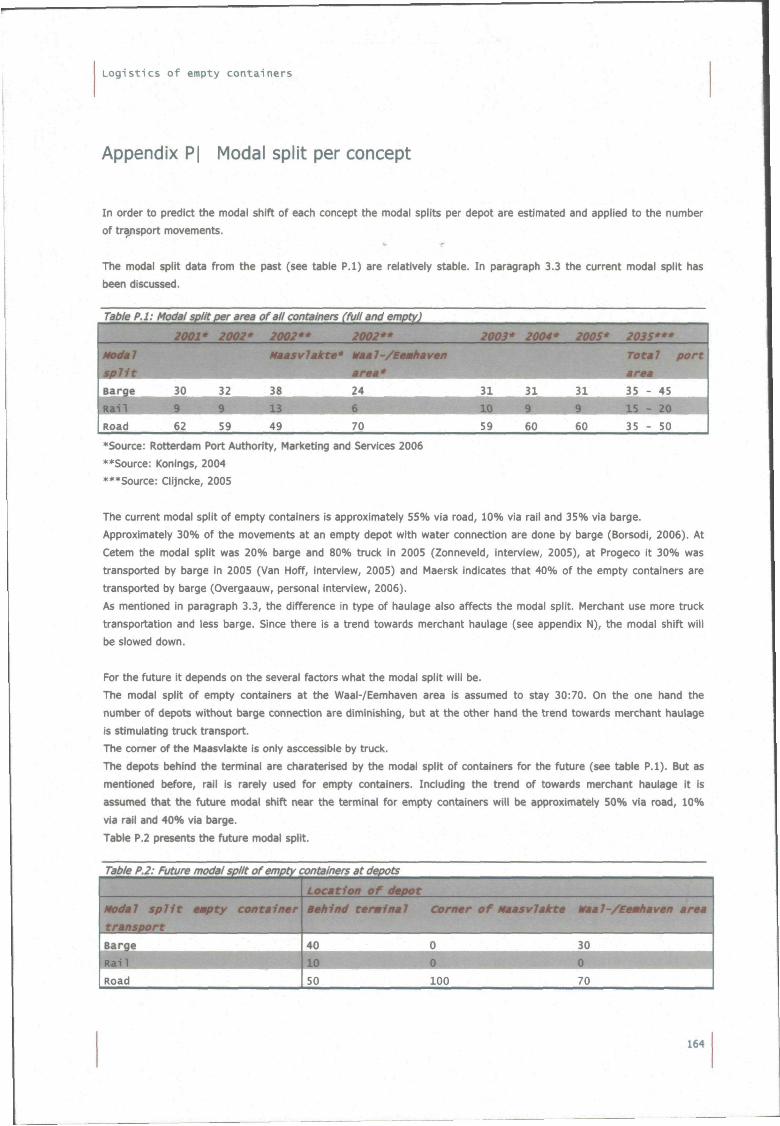
Logistics of empty containers
Appendix P| l^odal split per concept
In order to predict the modal shift of each concept the modal splits per depot are estimated and applied to the number of tr^sport movements.
The modal split data from the past (see table P.l) are relatively stable. In paragraph 3.3 the current modal split has been discussed.
Table PI.
1 Modal
ËpJIt Barge
Modal split per area
2001* 2002*
30 32
of all containers
2002**
Maasvlakte
38
(full and empty)
2002**
' Waal-/Eemhaven
area*
24
2003*
31
2004*
31
2005*
31
2035***
Total poe^
35 - 45
Road 62 59 49 70 59 60 60 35 - 50
•Source: Rotterdam Port Authority, Marketing and Services 2006 **Source: Konings, 2004 ***Source: Clijncke, 2005
The current modal split of empty containers is approximately 55% via road, 10% via rail and 35% via barge.
Approximately 30% of the movements at an empty depot with water connection are done by barge (Borsodi, 2006). At
Cetem the modal split was 20% barge and 80% truck in 2005 (Zonneveld, interview, 2005), at Progeco it 30% was
transported by barge in 2005 (Van Hoff, interview, 2005) and Maersk indicates that 40% of the empty containers are
transported by barge (Overgaauw, personal interview, 2006).
As mentioned in paragraph 3.3, the difference in type of haulage also affects the modal split. Merchant use more truck transportation and less barge. Since there is a trend towards merchant haulage (see appendix N), the modal shift will be slowed down.
For the future it depends on the several factors what the modal split will be.
The modal split of empty containers at the Waal-/Eemhaven area is assumed to stay 30:70. On the one hand the
number of depots without barge connection are diminishing, but at the other hand the trend towards merchant haulage is stimulating truck transport. The comer of the Maasvlakte is only asccessible by truck.
The depots behind the terminal are charaterised by the modal split of containers for the future (see table P.l). But as
mentioned before, rail is rarely used for empty containers. Including the trend of towards merchant haulage it is
assumed that the future modal shift near the terminal for empty containers will be approximately 50% via road, 10%
via rail and 40% via barge.
Table P.2 presents the future modal split.
Table P.2: Future modal split of empty containers at depots
Modal split ea^ty container
transport
Barge
Location of depot
Behind terminal Corner of Maasvlakte Waal-/Eemhaven area
40 0 30
Road IsO 100 70
164
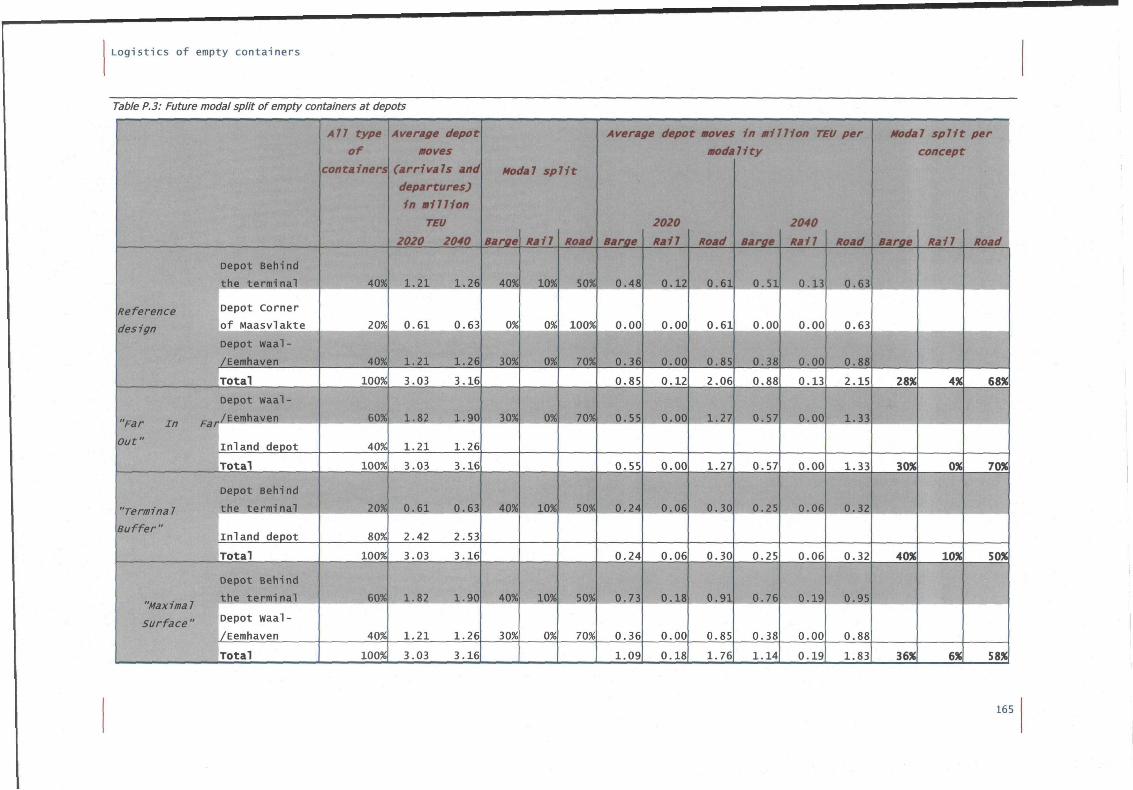
Logistics of empty containers
Table P. 3: Future modal split of empty containers at depots
Reference
design
"Far in
Out"
"Terminal
Buffer"
"Maximal
surface "
Depot Behind
the terminal
Depot Corner
of Maasvlakte
Depot Waal 0 1
/Eemhaven J^H
Total
Depot waal-
,_, „/Eemhaven
inland depot
Total
Depot Behind
the terminal
inland depot
Total
Depot Behind
the terminal
Depot waal-
/Eemhaven
Total
All type
of
containers
40%
20%
•1 40%
100%
60%
40%
100%
20%
80%
100%
60%
40%
100%
Average depot
moves
(arrivals and
departures)
in million
TEU
2020 2040
1.21 1.26
0.61 0.63
1.21 1.26
3.03 3.16
1.82 ^J..90
1.21 1.26
3.03 3.16
0.61 0.63
2.42 2.53
3.03 3.16
1.82 1.90
1.21 1.26
3.03 3.16
Modal sp
Barge
40%
0%
30%
30%
40%
40%
30%
Rail
10%
0%
0%
0%
10%
10%
0%
lit
Road
50%
100%
70%
70%
50%
50%
70%
Average depot moves
Barge
0.48
0.00
0.36
0.85
0.55
0.55
0.24
0.24
0.73
0.36
1.09
2020
Rail
0.12
0.00
0.00
0.12
0.00
0.00
0.06
0.06
0.18
0.00
0.18
In million TEU per
modality
Road
0.61
0.61
0.85
2.06
1.27
1.27
0.30
0.30
0.91
0.85
1.76
Barge
0.51
0.00
0.38
0.88
0.57
0.57
0.25
0.25
0.76
0.38
1.14
2040
Rail
0.13
0.00
0.00
0.13
0.00
0.00
0.06
0.06
0.19
0.00
0.19
Road
0.63
0.63
0.88
2.15
1.33
1.33
0.32
0.32
0.95
0.88
1.83
Modal split per
concept
Barge
tJIÊU
^w^
28%
Êis- •
30%
40%
36X
Rail Road
ÉHIWiii -'•••"
^ " ^
4%
--A:
0%
10%
6X
'"T-^-WW-
68%
70%
50%
1 •
58X
165
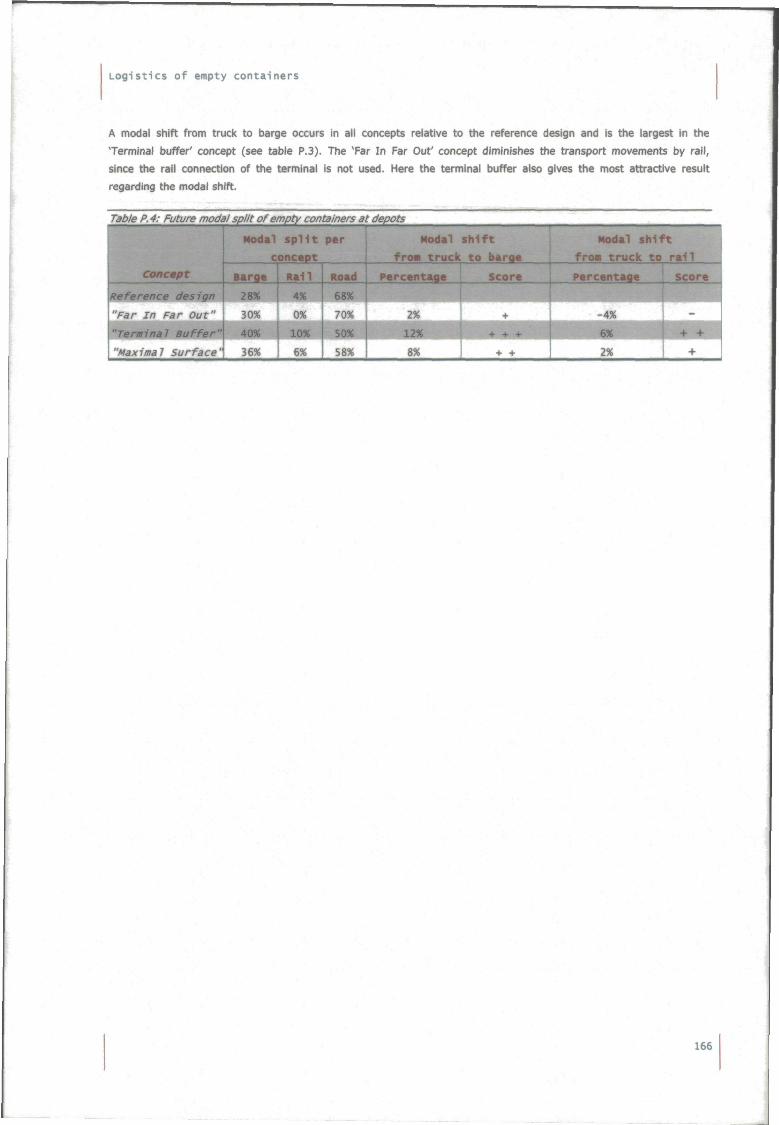
Logistics of empty containers
A modal shift from truck to barge occurs in all concepts relative to the reference design and is the largest in the
'Terminal buffer' concept (see table P.3). The 'Far In Far Out' concept diminishes the transport movements by rail,
since the rail connection of the terminal is not used. Here the terminal buffer also gives the most attractive result
regarding the modal shift.
r innnn
Table P. 4: Future modal split of empty containers at depots
Concept
^Reference design
Modal s p l i t per
concept
Barge
28%
Ra i l
4%
Road
68%
"Far in Far Out" 30% 0% , 70%
V'Terninal Buffer'\ 40% 10% 50%
\"Maximal surface'] 36% j 6% 1 58%
Modal s h i f t
f roB t ruck t o barge
Percentage
2%
12%
8%
Score
+
+ +
Modal s h i f t
f r o » t ruck to r a i l
Percentage ^
Score
^
-4% \
2% +
166
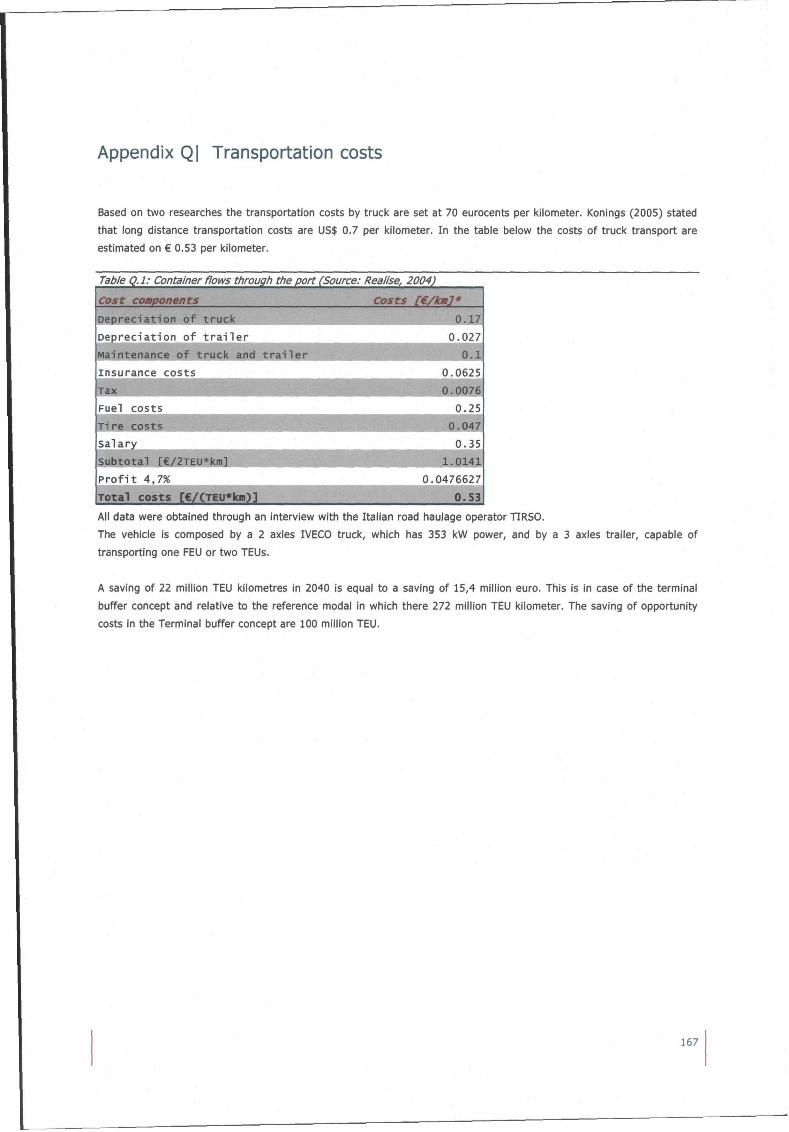
Appendix Q| Transportation costs
Based on two researches the transportation costs by truck are set at 70 eurocents per kilometer. Konings (2005) stated
that long distance transportation costs are US$ 0.7 per kilometer. In the table below the costs of truck transport are
estimated on € 0.53 per kilometer.
Table Q.l: Container flows through the port (Source:
Cost components
D e p r e c i a t i o n o f t r a i l e r
Realise, 2004)
Costs [€/km]* ^ ^ ^ ^ ^ K 0.17
0.027
insurance costs 0.0625
I S X - ^ ^ ^ ^ ^ ^ ^ ^ ^ ^ B L - ^ ^ ^ ^ ^ ^ ^ ^ ^ ^ B Fuel costs
s a l a r y
P r o f i t 4,7%
Tota l costs [€/(TEU*kni)] ^ ^ ^ ^ ^ H
BIlii Bill B l
0.25
i^Bo.047 0.35
| : 1.0141
0.0476627
1 0.53 All data were obtained through an interview with the Italian road haulage operator TIRSO.
The vehicle is composed by a 2 axles IVECO truck, which has 353 kW power, and by a 3 axles trailer, capable of
transporting one FEU or two TEUs.
A saving of 22 million TEU kilometres in 2040 is equal to a saving of 15,4 million euro. This is in case of the terminal
buffer concept and relative to the reference modal in which there 272 million TEU kilometer. The saving of opportunity
costs in the Terminal buffer concept are 100 million TEU.
167


—i^.j,ffjm"

WiW^^^:'^':}':''-r-r'-''^-' • •'•>•••' •••'••: ••"• •':•: ••'•.•••••. .• r •.... • :,. •-.;-' • • • • • • ^ ••• .:rmiêJ:.-^-^::^is%^ ^ ' • • • • • • - . : ; . • : . • • • • : • • ; • • • • • • • • - ^ •
Related Documents