January 2014 Research Report: UCPRC-RR-2014-02 Logistics Augmentation to the Freight- Truck-Pavement Interaction Pilot Study: Final Report Authors: Nadia Viljoen, Quintin van Heerden, Lorina Popescu, Livison Mashoko, Esbeth van Dyk, and Wilna Bean Work Conducted Under Partnered Pavement Research Program (PPRC) Strategic Plan Element 4.44: Pilot Study Investigating the Interaction and Effects for State Highway Pavements, Trucks, Freight, and Logistics PREPARED FOR: California Department of Transportation Division of Transportation Planning (DOTP) Office of Materials and Infrastructure PREPARED BY: CSIR University of Pretoria University of California Pavement Research Center UC Berkeley

Welcome message from author
This document is posted to help you gain knowledge. Please leave a comment to let me know what you think about it! Share it to your friends and learn new things together.
Transcript
January 2014Research Report: UCPRC-RR-2014-02
Logistics Augmentation to the Freight-
Truck-Pavement Interaction Pilot Study:
Final Report
Authors:Nadia Viljoen, Quintin van Heerden, Lorina Popescu, Livison Mashoko,
Esbeth van Dyk, and Wilna Bean
Work Conducted Under Partnered Pavement Research Program (PPRC) Strategic Plan
Element 4.44: Pilot Study Investigating the Interaction and Effects for State Highway Pavements, Trucks,
Freight, and Logistics
PREPARED FOR: California Department of Transportation
Division of Transportation Planning (DOTP)
Office of Materials and Infrastructure
PREPARED BY:
CSIR
University of Pretoria
University of California
Pavement Research Center UC Berkeley

(This page blank)
UCPRC-RR-2014-02 i
DOCUMENT RETRIEVAL PAGE Research Report No.:
UCPRC-RR-2014-02
Title: Logistics Augmentation to the Freight-Truck-Pavement Interaction Pilot Study: Final Report Authors: Nadia Viljoen, Quintin van Heerden, Livison Mashoko, Esbeth van Dyk, and Wilna Bean Caltrans Technical Lead: Nerie Rose Agacer-Solis and Bill Nokes Prepared for: Caltrans Division of Transportation Planning
FHWA No.: CA142482C
Date Work Submitted:
January 2014
Date:January 2014
Strategic Plan Element No.: 4.44
Status: Stage 6, final version
Version No.:Final
Abstract: The objectives of this logistics augmentation to the Freight-Truck-Pavement interaction pilot study are: (1) to provide a basic understanding to Caltrans of private-sector decision making in road-freight transportation; (2) to identify and describe the comprehensive set of interactions between the efficiency and efficacy of road-freight transportation and the capacity, performance and regulation of road infrastructure in the state and recommend which of these interactions warrant more in-depth assessment on a statewide scale to quantify the overall economic and efficiency impact road infrastructure decisions have on the economy of California; and (3) to illustrate the value of direct interactions and consultations with private companies in exploring private sector decision making and the interdependence of these decisions on public sector actions. Conclusions: By using desktop studies, qualitative analysis, and case studies, this study has shown that road infrastructure and
regulation, as managed by Caltrans, have a marked impact on supply chain operations and strategies. Given the critical role that supply chains play in the economic well-being of and quality of life in California and the
dependence of these supply chains on road infrastructure and regulation, it is imperative that the public sector (Caltrans) and the private sector engage in the planning and construction of road infrastructure as well in the drafting and implementation of policy.
This pilot study has shown that road infrastructure and regulations have a direct effect on supply chain vulnerability, and that design and private companies need to consider these elements in their decision making.
Recommendations: Recognize that supply chain vulnerability and design are different for each economic goods movement-dependent
sector and therefore a blanket approach to the treatment of sectors will not suffice, and In order for this study to be comprehensive enough to form part of Caltrans’ routine decision making regarding road
infrastructure and regulation, expand the study’s scope to cover all goods movement-dependent sectors and deepen the study by conducting representative case studies of each sector.
Keywords: public sector, private sector, road-freight transportation, logistics, road infrastructure Proposals for Implementation: Publish this final report to provide the client with information to support planning and decision making regarding logistics, goods movement, and road infrastructure and regulation.
ii UCPRC-RR-2014-02
Related Documents: W.J.vdM. Steyn, N. Viljoen, L. Popescu, and L. du Plessis . 2012. Freight-Truck-Pavement Interaction, Logistics,
and Economics: Final Phase 1 Report (Tasks 1–6). Research Report prepared for Caltrans Division of Transportation Planning. (UCPRC-RR-2012-06)
W.J.vdM. Steyn. 2013. Freight-Truck-Pavement Interaction, Logistics, and Economics: Final Phase 1 Report (Tasks 7–8). Research Report prepared for Caltrans Division of Transportation Planning. (UCPRC-RR-2013-08)
W.J.vdM Steyn, and L. du Plessis. Freight-Truck-Pavement Interaction, Logistics, and Economics: Final Phase 1 Report (Tasks 9–11). (UCPRC-RR-2014-01)
W.J.vdM. Steyn, L. du Plessis, N. Viljoen, Q. van Heerden, L. Mashoko, E. van Dyk, and L. Popescu. 2014. Prepared for Caltrans Division of Transportation Planning. (UCPRC-SR-2014-01)Freight-Truck-Pavement Interaction, Logistics, & Economics: Final Executive Summary Report. Summary Report
Signatures N. Viljoen First Author
Nerie Rose Agacer-Solis
Bill Nokes Technical Reviewers
W.J.vdM. Steyn John T. Harvey Principal Investigators
Nerie Rose Agacer-Solis
Bill Nokes Caltrans Technical Leads
T. Joe Holland Caltrans Contract Manager
UCPRC-RR-2014-02 iii
TABLE OF CONTENTS
LIST OF FIGURES .............................................................................................................................................. ix
LIST OF TABLES ................................................................................................................................................ xi
DISCLAIMER STATEMENT ........................................................................................................................... xii
PROJECT OBJECTIVES ................................................................................................................................. xiii
EXECUTIVE SUMMARY ................................................................................................................................. xv
SECTION 1: BACKGROUND INVESTIGATION AND LITERATURE STUDY ...................................... xv
SECTION 2: CASE STUDY RESEARCH REGARDING THE INTERSECTION OF SUPPLY CHAINS
AND ROAD INFRASTRUCTURE AND REGULATION .................................................................. xvii
CONCLUSIONS AND WAY FORWARD .................................................................................................. xxiii
LIST OF ABBREVIATIONS ........................................................................................................................... xxv
SECTION 1: BACKGROUND INVESTIGATION AND LITERATURE STUDY
1 INTRODUCTION .......................................................................................................................................... 1
1.1 Background to the Logistics Augmentation Study ................................................................................... 3
1.2 The Interface Between the Public and Private Sector in Road Freight Systems ...................................... 3
1.3 Objectives of the Logistics Augmentation Study ...................................................................................... 5
1.4 Scope of the Logistics Augmentation Study ............................................................................................. 5
2 TASKS L1 – L4 SUMMARY ......................................................................................................................... 7
2.1 Task L1: Background Investigation and Project Inception Workshops .................................................... 7
2.2 Task L2: Literature Survey and Fieldwork Preparation ............................................................................ 7
2.3 Task L3: Operational Investigation (Fieldwork) ....................................................................................... 8
2.4 Task L4: Information Analysis and Progress Evaluation .......................................................................... 8
3 OVERVIEW OF CALIFORNIA FREIGHT TRANSPORTATION ......................................................... 11
3.1 Freight Trends in California .................................................................................................................... 11
3.1.1 Drivers of Growth in Freight Transportation ...................................................................................... 11
3.1.2 Current Freight Flows and Priority Corridors .................................................................................... 13
3.2 Freight Transportation Infrastructure in California ................................................................................. 17
3.2.1 Rail ..................................................................................................................................................... 17
3.2.2 Road ................................................................................................................................................... 18
3.2.3 Airports .............................................................................................................................................. 19
3.2.4 Ports ................................................................................................................................................... 20
3.3 Rail-Road Intermodal Systems ............................................................................................................... 21
iv UCPRC-RR-2014-02
3.3.1 Long-Haul Intermodal Shipments ...................................................................................................... 21
3.3.2 Short-Haul Intermodal Shipments ...................................................................................................... 22
4 PUBLIC SECTOR PERSPECTIVE ........................................................................................................... 23
4.1 Role of the Public Sector in Road Freight Systems ................................................................................ 23
4.2 Public Sector Decision Making .............................................................................................................. 26
4.3 Strategic Plans Impacting Road-Freight in California ............................................................................ 28
4.3.1 California Transportation Plan 2025 [7] ............................................................................................ 29
4.3.2 Goods Movement Action Plan [15] ................................................................................................... 31
4.3.3 California State Rail Plan 2007-08 to 2017-18 [9] ............................................................................ 31
4.3.4 SJV Interregional Goods Movement Plan [16] .................................................................................. 32
4.3.5 Central Coast California Commercial Flows Study [17] ................................................................... 33
4.3.6 Regional Transportation Plans ........................................................................................................... 34
4.3.7 Merced County Overall Work Program [23] ..................................................................................... 38
4.3.8 Colusa County Overall Work Program [24] ...................................................................................... 38
4.4 Decision Support for Freight Planning ................................................................................................... 38
5 PRIVATE SECTOR PERSPECTIVE ......................................................................................................... 41
5.1 Role of the Private Sector in Road Freight Systems ............................................................................... 41
5.1.1 Freight Companies ............................................................................................................................. 41
5.1.2 Support Services ................................................................................................................................ 42
5.1.3 Industry Associations ......................................................................................................................... 42
5.2 Private Sector Decision Making ............................................................................................................. 43
5.3 Emergent Logistics Practices .................................................................................................................. 45
5.3.1 Outsourcing Trends ............................................................................................................................ 45
5.3.2 Intermodal Transport .......................................................................................................................... 46
5.3.3 Inventory-Pull Systems ...................................................................................................................... 47
5.4 Trucking Industry Trends ........................................................................................................................ 49
6 INTERDEPENDENCE OF PUBLIC AND PRIVATE DECISIONS ....................................................... 51
6.1 Interaction Between Public and Private Decision Making ..................................................................... 51
6.2 Success Factors for Public-Private Interaction in Freight Systems ........................................................ 52
UCPRC-RR-2014-02 v
SECTION 2: CASE STUDY RESEARCH REGARDING THE INTERSECTION OF SUPPLY CHAINS AND ROAD INFRASTRUCTURE AND REGULATION
7 TASK L3: OPERATIONAL INVESTIGATION ....................................................................................... 55
7.1 Rationale for the Operational Investigation ............................................................................................ 55
7.2 The Case Study Research Method .......................................................................................................... 56
7.3 Case Study 1: Operational Investigation of Company A ........................................................................ 57
7.3.1 Day 1, May 15, 2013 – Understanding the Organization and its Scope of Business ......................... 57
7.3.2 Day 2, May 16, 2013 – Understanding the Interface between Transport and the Processing Plant(s)58
7.3.3 Day 3, May 17, 2013 – Understanding the Road Transport Function ................................................ 58
7.4 Summary of Findings: Company A ........................................................................................................ 59
7.4.1 The Seasonal Nature of Transport Operations ................................................................................... 60
7.4.2 The Interface between Inbound and Outbound Logistics and the Facilities ...................................... 61
7.4.3 Reverse Logistics ............................................................................................................................... 63
7.4.4 Driver Recruitment, Regulation, Training and Management ............................................................. 63
7.4.5 From the Driver’s Perspective ............................................................................................................ 64
7.4.6 Fleet Management .............................................................................................................................. 66
7.4.7 Public-Private Interaction ................................................................................................................... 66
7.5 Business Decisions Affected by Road Infrastructure and Regulation: Company A ............................... 67
7.5.1 Strategic Decisions ............................................................................................................................. 67
7.5.2 Operational and Tactical Decisions .................................................................................................... 68
7.6 Case Study 2: Operational Investigation of Company B ........................................................................ 68
7.6.1 Day 1, May 21, 2013 – Understanding the Organization and its Scope of Business ......................... 68
7.6.2 Day 2, May 22, 2013 – Observing Shipments from Pickup to Delivery ........................................... 69
7.7 Summary of Findings: Company B ........................................................................................................ 69
7.7.1 The Role of Less-than-Truckload Shipping in the Supply Chain ...................................................... 72
7.7.2 Cycles in Less-than-Truckload Shipping ........................................................................................... 72
7.7.3 Driver Management ........................................................................................................................... 73
7.7.4 Crossing the Canadian Border ........................................................................................................... 74
7.7.5 From the Driver’s Perspective ............................................................................................................ 75
7.7.6 Fleet Management .............................................................................................................................. 76
7.7.7 Inspections and Freeway Restrictions ................................................................................................ 77
7.7.8 The Image of Trucking ....................................................................................................................... 78
7.7.9 Triple Trailers and Truck Lanes ......................................................................................................... 78
7.8 Business Decisions Affected by Road Infrastructure and Regulation: Company B ............................... 79
vi UCPRC-RR-2014-02
7.8.1 Strategic Decisions ............................................................................................................................. 79
7.8.2 Operational and Tactical Decisions .................................................................................................... 79
7.9 Congruency of Findings with the San Joaquin Valley Interregional Goods Movement Plan ................. 79
7.10 Lessons Learned and Recommendations for Future Case Studies ......................................................... 80
7.10.1 Executive Support ....................................................................................................................... 80
7.10.2 Privacy and Confidentiality Protocols ........................................................................................ 81
7.10.3 A Flexible Plan of Action ............................................................................................................ 81
7.10.4 Exploring Topics through Conversation ..................................................................................... 81
7.10.5 Recording Notes .......................................................................................................................... 82
8 SUPPLY CHAIN DESIGN AND VULNERABILITY ............................................................................... 83
8.1 The Role of Transport Infrastructure in Supply Chain Management ...................................................... 83
8.2 Supply Chain Risk and Vulnerability ..................................................................................................... 84
8.2.1 Supply Chain Risk and Vulnerability in California ............................................................................ 86
8.3 General Risks in the Agriculture, Forestry and Fishing sector ............................................................... 87
8.3.1 Weather-Related Hazards ................................................................................................................... 89
8.3.2 Natural Disasters ................................................................................................................................ 89
8.3.3 Biological and Environmental Hazards.............................................................................................. 90
8.3.4 Market-Related Hazards ..................................................................................................................... 90
8.3.5 Logistics and Infrastructure Hazards ................................................................................................. 91
8.3.6 Managerial and Operational Hazards ................................................................................................. 92
8.3.7 Public Policy and Institutional Hazards ............................................................................................. 92
8.3.8 Political Risks .................................................................................................................................... 92
8.4 Specific Transportation Risks in Agricultural and Food Commodity Supply Chains ........................... 93
8.4.1 Vulnerability of Transport to Terrorist Attacks .................................................................................. 93
8.4.2 Transport of Fresh Produce ................................................................................................................ 93
8.5 General Risks in the Transport and Warehousing Sector ........................................................................ 94
8.5.1 The Role of Third-Party Logistics in the Supply Chain ..................................................................... 94
8.5.2 Transport Infrastructure ...................................................................................................................... 96
8.5.3 Communications Infrastructure .......................................................................................................... 97
8.5.4 Economic Volatility ............................................................................................................................ 97
8.5.5 Environmental Regulation ................................................................................................................. 98
8.5.6 Geopolitical Unrest ............................................................................................................................ 98
8.6 Supply Chain Network Design ............................................................................................................... 99
8.6.1 Impact of Infrastructure on Supply Chain Network Design ............................................................. 100
UCPRC-RR-2014-02 vii
8.6.2 Interdependencies between Supply Chain Network Design and Vulnerability ................................ 101
9 THE SPREAD OF ECONOMIC SECTORS IN CALIFORNIA AND IMPLICATIONS FOR ROAD
INFRASTRUCTURE AND REGULATION ............................................................................................ 103
9.1 The Value and Spatial Spread of Goods-Movement Dependent Sectors in California ......................... 103
10 CONCLUSION AND WAY FORWARD ................................................................................................... 107
10.1 Implications of the Findings of the Logistics Augmentation Pilot Study for Caltrans ......................... 107
10.2 Expanding the Scope and Depth of the Logistics Augmentation Pilot Study ....................................... 108
10.2.1 Expanding the Scope of the Study ............................................................................................ 108
10.2.2 Developing Representative Case Study Ensembles .................................................................. 108
10.3 Complex Network Analysis to Analyze Supply Chain Vulnerability Drivers in the Californian Road
Freight Network .................................................................................................................................... 109
REFERENCES ................................................................................................................................................... 110
TECHNICAL APPENDICES ........................................................................................................................... 115
APPENDIX A: SUMMARY TABLES OF FREIGHT FLOW ANALYSES ................................................. 115
APPENDIX B: PRELIMINARY GMAP ACTIONS AFFECTING ROAD FREIGHT
TRANSPORTATION .................................................................................................................................. 117
APPENDIX C: SHORT DESCRIPTIONS OF PUBLIC-PRIVATE INTERACTION CASE STUDIES . 122
APPENDIX D: INTERVIEW QUESTIONS PREPARED FOR TASK L3 ................................................. 124
APPENDIX E: PRIVACY AND CONFIDENTIALITY PROTOCOLS ...................................................... 130
APPENDIX F: ECONOMIC CONTRIBUTION OF CALIFORNIAN COUNTIES ................................. 134
APPENDIX G: PRELIMINARY SECTOR SEGMENTATION .................................................................. 143
APPENDIX H: POTENTIAL PARTICIPANTS FOR FUTURE CASE STUDIES .................................... 154

viii UCPRC-RR-2014-02
UCPRC-RR-2014-02 ix
LIST OF FIGURES
Figure 3.1: California projected population growth 2010 – 2060, percent change [10]. ...................................... 12
Figure 3.2: Estimated freight flows within California and through California in 2011 [11]. ............................... 13
Figure 3.3: Estimated freight flows into and out of California in 2011 [11]. ........................................................ 14
Figure 3.4: National truck freight flows to and from California in 2007 [12]. ..................................................... 14
Figure 3.5: Priority freight regions and corridors in California [14]. ................................................................... 15
Figure 3.6: Rail freight tonnage in California, 2005 [9]. ...................................................................................... 17
Figure 3.7: California State Highway network [7]. .............................................................................................. 19
Figure 3.8: California public use and military airports [7]. .................................................................................. 20
Figure 3.9: California seaports [7]. ....................................................................................................................... 21
Figure 4.1: Interactions between the public sector, the private sector and academia relating to road-freight
systems. ................................................................................................................................................. 23
Figure 4.2: Vision, goals and policies of the California Transportation Plan 2025 [7]. ........................................ 30
Figure 4.3: California Regional Transportation Planning Agencies (RTPAs) and Metropolitan Planning
Organizations (MPOs) [7]. ................................................................................................................... 34
Figure 5.1: Interactions between the public sector, the private sector and academia relating to road-freight
systems. ................................................................................................................................................. 41
Figure 7.1: Overview of Company A supply chain operations. ............................................................................ 60
Figure 7.2: Overview of Company B’s operations. ............................................................................................... 70
Figure 8.1: Typology of supply chain risk sources. ............................................................................................... 85
Figure 8.2: 3PL revenue growth in the U.S. [61]. ................................................................................................. 95
Figure 8.3: Typology of supply chain value drivers. ........................................................................................... 100
Figure 8.4: Relationship between the number of facilities and logistics cost. .................................................... 101
Figure 9.1: Economic contribution of the 58 Californian counties in terms of the 10 goods movement dependent
sectors. ................................................................................................................................................. 105
Figure 9.2: Economic contribution of Los Angeles and Orange counties by sector. .......................................... 106
Figure A.1: Summary analysis of all estimated exports originating from or travelling through California in 2011
(Center for Transportation Analysis, 2013). ......................................................................................... 115
Figure A.2: Summary analysis of all estimated imports destined for or travelling through California in 2011
(Center for Transportation Analysis, 2013). ......................................................................................... 116
Figure F.1: Economic contribution per county, per sector (A). ........................................................................... 135
Figure F.2: Economic contribution per county, per sector (B). ........................................................................... 136
Figure F.3: Economic contribution per county, per sector (C). ........................................................................... 137
Figure F.4: Economic contribution per county, per sector (D). ........................................................................... 138
x UCPRC-RR-2014-02
Figure F.5: Economic contribution per county, per sector (E). ........................................................................... 139
Figure F.6: Economic contribution per county, per sector (F). ........................................................................... 140
Figure F.7: Economic contribution per county, per sector (G). ........................................................................... 141
Figure F.8: Economic contribution per county, per sector (H). ........................................................................... 142
Figure G.1: List of prominent utility companies in California. ........................................................................... 145
Figure G.2: California’s gross cash receipts. ....................................................................................................... 146
Figure G.3: Wood harvested in California by industry sector. ............................................................................ 148
UCPRC-RR-2014-02 xi
LIST OF TABLES
Table 1.1: Key Differences in Public and Private Sector Freight Decision Making [6] ......................................... 4
Table 1.2: Task Description for Project ................................................................................................................... 6
Table 4.1: Federal Level Public Sector Role Players [7] ...................................................................................... 24
Table 4.2: State-Level Public Sector Role Players [7] .......................................................................................... 25
Table 4.3: Regional-, Local-Level and Other Public Sector Role Players [7] ...................................................... 26
Table 4.4: Primary Government Level of Responsibility by Function and Mode [6] .......................................... 27
Table 5.1: The States in Which the Top 40 3PL Providers in North America Are Headquartered [29] ................ 46
Table 6.1: Key Differences in Public and Private Sector Freight Decision Making [6] ....................................... 51
Table 6.2: Timeframe and Hierarchy of Decision Making in Public Sector [6] ................................................... 51
Table 7.1: Different Levels of Business Decisions Investigated During Operational Investigation ..................... 55
Table 8.1: Categories of Major Hazards Facing Agricultural Supply Chains (adapted from [52]) ...................... 88
Table 8.2: Key Findings and Recommendations from the ATRI Study Regarding Agricultural and Food
Commodity Vulnerability to Targeted Attack on Transportation [55] .................................................. 93
Table B.1: GMAP Preliminary Candidate Actions Impacting Road Freight Transportation— Infrastructure
and Operations (BTH and CalEPA, 2007: page I-6) ............................................................................ 117
Table B.2: GMAP Preliminary Candidate Actions Impacting Road Freight Transportation—Public Health
and Environmental Mitigation (BTH and CalEPA, 2007: page I-7 – I-10) .......................................... 118
Table B.3: GMAP Preliminary Candidate Actions Impacting Road Freight Transportation—Community
Impact Mitigation and Workforce Development (BTH and CalEPA, 2007: page I-11 – I-12) ........... 120
Table B.4: GMAP Preliminary Candidate Actions Impacting Road Freight Transportation—Public Safety
and Security (BTH and CalEPA, 2007: page I-13) ............................................................................. 121
Table G.1: Mining Contribution to the Californian Economy ............................................................................ 144
xii UCPRC-RR-2014-02
DISCLAIMER STATEMENT
This document is disseminated in the interest of information exchange. The contents of this report reflect the
views of the authors who are responsible for the facts and accuracy of the data presented herein. The contents do
not necessarily reflect the official views or policies of the State of California or the Federal Highway
Administration. This publication does not constitute a standard, specification or regulation. This report does not
constitute an endorsement by the Department of any product described herein.
For individuals with sensory disabilities, this document is available in alternate formats. For information, call
(916) 654-8899, TTY 711, or write to California Department of Transportation, Division of Research,
Innovation and System Information, MS-83, P.O. Box 942873, Sacramento, CA 94273-0001.
ACKNOWLEDGMENTS
The authors gratefully acknowledge the comments and input of all the organizations contacted for information
in this project. The authors are especially grateful to the following individuals:
Caltrans technical advisors to the project team: Al Arana (DOTP Office of System Planning), Joanne
McDermott (DOTP Office of Freight Planning);
DOTP Economic Analysis Branch staff: Rose Agacer, Barry Padilla, Seunggeun Paek, and Austin
Hicks.
Division of Transport Planning: Doug MacIvor
DRISI Office of Materials and Infrastructure: Joe Holland and Bill Nokes
UCPRC-RR-2014-02 xiii
PROJECT OBJECTIVES
The objectives of the logistics augmentation study are to:
Provide a basic understanding to Caltrans of private sector decision making in road-freight
transportation;
Identify and describe the comprehensive set of interactions between the efficiency and efficacy of road-
freight transportation and the capacity, performance and regulation of road infrastructure in the state and
recommend which of these interactions warrant more in-depth assessment on a statewide scale to
quantify the overall economic and efficiency impacts that road infrastructure decisions have on the
economy of California, and
Illustrate the value of direct interactions and consultations with private companies in exploring private
sector decision making and the interdependence of these decisions on public sector actions.
The objectives of this report are to summarize the activities and findings of Task L1, Background study and
project inception workshops, and Task L2, Literature review and fieldwork preparation of this study, and to
provide guidance regarding Task L3, Operational investigation (Fieldwork).

xiv UCPRC-RR-2014-02
(This page blank.)
UCPRC-RR-2014-02 xv
EXECUTIVE SUMMARY
The efficient movement of goods within an economy is a crucial lever to competitiveness. Road freight is the
predominant freight transportation mechanism in California, with 78 percent of communities connected
exclusively by road and 88 percent of manufactured goods being transported by truck. The efficiency of road-
freight transportation depends on the capacity and performance of publicly owned and managed road networks
as well on as the capacity and performance of privately owned truck fleets. Growing freight volumes and
increasing demands on freight transportation systems to be reliable, cost efficient, time efficient, flexible and
adaptable have highlighted the importance of the interdependence between the public and private sector in
providing the population with the essential freight systems it requires. Despite the importance of this
interdependence between the public and private sector in road-freight transportation, the divergent decision-
making styles of the two parties hamper collaboration. In essence, the differences between these two parties
arise from the fundamentally different roles they play. The purpose of this logistics augmentation pilot study is
to identify and examine those interdependencies that have particular bearing on road-freight transportation in
California.
SECTION 1: BACKGROUND INVESTIGATION AND LITERATURE STUDY
Overview of California Freight Transportation
Freight transport is the cornerstone of California’s economy, and with 40 percent of freight entering and exiting
the U.S. through California’s sea, land and air gateways, the state’s freight systems are critical to the overall U.S.
economy. A significant component of California’s freight flows arise from through traffic of international
shipments. California is regarded as the breadbasket of the U.S. economy, supplying more than 50 percent of its
agricultural goods, and combined with manufacturing, and especially the high-value manufacturing industries,
California has a freight-heavy economy. The freight growth drivers impacting California are:
The growth in international trade;
Growth in the local consumer population, and
A move towards inventory-pull systems and an increase in manufacturing output.
The four priority freight regions identified in California (Los Angeles/Inland Empire Region, Bay Area Region,
San Diego/Border Region, Central Valley Region) all experience very high levels of road-freight volumes that
result in rapid infrastructure deterioration and congestion. Capacity constraints hamper all transport modes in
California but are especially acute for road infrastructure. Deterioration and aging road infrastructure also pose a
critical problem for freight movement in California. However, there is great opportunity for road-rail intermodal
solutions, specifically long-haul rail services and short-haul rail shuttle services, to reduce congestion and
overall transport costs in California.
xvi UCPRC-RR-2014-02
Public Sector Perspective
The role of the public sector is in the planning, ownership and maintenance of road-freight infrastructure as well
as in creating the economic environment within which private entities operate through regulations. There are key
role players on every level of government that directly impact road-freight transportation in California. Key
drivers of public sector decision making include investment and financing, economic regulation, providing and
maintaining infrastructure, land use, environmental issues, safety, operations and jobs and employment.
State-level strategic plans that hold particular relevance for this study are the California Transportation Plan
2025, the California State Rail Plan 2007-08 to 2017-18 and the Goods Movement Action Plan. The recent San
Joaquin Valley Interregional Goods Movement Plan and the Central Coast California Commercial Flows Study
are also of particular interest as they followed a directed and successful private and public sector engagement
approach in identifying and prioritizing regional freight challenges and projects. In addition, the 2010 Regional
Transportation Plan Guidelines are explicit about freight modeling requirements and cooperation and
collaboration requirements for Regional Transport Plans. The move towards activity-based freight models will
provide better decision support and it will also require a far better understanding of private sector operations and
decision making, as well as extensive access to private sector data; this will not be achieved without close
cooperation and collaboration with a large number of private companies. The guidelines now also require
explicit private sector involvement in the formulation of regional plans, similar to the extensive public
participation processes currently employed during the development of plans. Insights and findings relevant to
road-freight transportation were extracted from a selected number of Regional Transport Plans relevant to the
operational investigation that will be conducted in Task L3 of this pilot study.
Private Sector Perspective
The role of the private sector is to generate earnings for shareholders through the selling of goods and services.
In fulfilling this role, the private sector is a user of the available road-freight systems to transport goods in the
most competitive manner possible. Private sector decisions can be strategic (long-term), operational (short- to
medium-term) or tactical (short-term) in nature. The key decision drivers that cut across all levels of private
sector decisions are market and shipper demand, financial performance metrics, efficient operational
management, and regulatory issues.
Outsourcing is a growing logistics trend even despite tough market conditions and the growing volatility of
logistics chains. Outsourcing practices obscure the locus of control for many logistics decisions in the private
sector. These days, shippers are demanding disruptive innovation from third-party logistics (3PL) providers,
which requires real-time information technology solutions and the ability to extract business value from big
data—and herein lies an opportunity for the public sector to collaborate with the private sector and obtain the
data required for accurate freight modeling.
UCPRC-RR-2014-02 xvii
The move toward inventory-pull systems is greatly increasing the demand for transportation, generally negating
the benefits of economies of scale. Higher-value inventory is being reduced at the cost of increasing lower-value
transport activities. However, this trend greatly contributes to congestion and emissions, especially in urban
areas where the e-commerce industry has skyrocketed.
The need for road-rail intermodal services is increasingly apparent among rising fuel costs, increased congestion
and escalating environmental pressures. But for intermodal solutions to be viable alternatives to door-to-door
trucking requires efficient and reliable rail service (akin to trucking performance) and efficient and aptly located
intermodal terminals.
Some trends in the trucking industry also have bearing on the efficiency of road-freight transport in California.
In particular, the disaggregated nature of the industry, with 90 percent of motor carriers having six or less power
units, has a distinct impact on private sector decision making and behavior. Fleet capacity constraints caused by
driver shortages and increased regulation of driver working conditions and vehicles is anticipated to become a
major choke point for the logistics industry in the future. Road congestion is also especially rife in California
with dire consequences to trucking competitiveness. Fifteen of the 250 truck bottlenecks identified by the
Federal Highway Administration (FHWA) and American Transportation Research Institute (ATRI) in the U.S.
are in California [1].
Interdependence of Public and Private Decisions
Differences in decision-making paradigms between the public and private sector arise from their fundamentally
different roles and objectives when engaging with road-freight systems. Particular differences relate to the
following decision characteristics: scale of investment, geography, the process whereby decisions are reached,
planning horizons and timing, the objectives of decisions and the decision-making attitude. Recommendations
for successful private-public interactions based on case studies conducted by the National Cooperative Freight
Research Program (NCFRP) highlight the importance of communication, education and appreciation between
the two parties.
SECTION 2: CASE STUDY RESEARCH REGARDING THE INTERSECTION OF SUPPLY CHAINS AND
ROAD INFRASTRUCTURE AND REGULATION
Section 2 of this study is specifically targeted to apprise Caltrans (public sector) of the practical ways in which
California road infrastructure and regulations affect daily supply chain management practices within specific
economic sectors.
xviii UCPRC-RR-2014-02
Task L3: Operational Investigation
Within the scope of this pilot study, the operational investigation served to show how the case study method
could yield useful practical insights for specific industries when founded on a comprehensive literature review.
Narrowing the focus to road-freight systems under the jurisdiction of Caltrans, this operational investigation
explores and describes the practical elements of the interdependence between the public and private sector by
observing operations at companies and conducting structured interviews with private sector managers. A case
study approach is used for this exploratory and descriptive investigation. In order to validate the empirical
evidence from the case studies, the findings will be tested against the literature review and various triangulation
methods have been designed into the case study methodology. Explicit privacy and confidentiality protocols
were also developed to safeguard the anonymity and confidentiality of the companies that participated in this
study. Operational investigations were conducted at two companies, Company A and Company B.
Company A
Company A is in the agricultural and food processing sector. Its primary business is the production of a range of
bulk food products from fresh produce. The company harvests its own fresh produce from farms in northern and
southern California and it leases and operates a truck fleet that transports the produce from the farms to the
processing facilities. The company also owns and operates a number of processing and storage facilities in
California, and its transport division handles the staging of empty tins and packaging materials between these
facilities. Company A’s transport division also handles some deliveries of finished products to customers. The
operational investigation of Company A was conducted over three days, May15, 16, and 17, 2013.
The scope of business operations and resource planning in Company A hinges on the seasonality of the fresh
produce. This is typical of agricultural supply chains where the harvesting cycle sets the tempo for downstream
logistics activities. Due to peak-season surges in supply and the fact that there is no inventory buffer between the
inbound logistics and the processing facilities, the timing and efficiency of inbound logistics are critical. Road
works and traffic congestion pose the greatest threat to the efficiency of inbound logistics.
Outbound logistics efficiency is decoupled from processing plant operations by a significant inventory buffer.
Although outbound logistics efficiency does not affect plant operations, it is still important from a cost-saving
and customer service point-of-view. The biggest threat to outbound logistics efficiency is erratic customer
orders.
Drivers are highly motivated as a result of the following organizational practices:
None of the drivers at Company A are unionized;
Drivers are all paid per load and distance (not per hour), and
The majority of drivers are employed seasonally with stringent recruitment/readmission criteria.
UCPRC-RR-2014-02 xix
Compliance, Safety, Accountability (CSA) regulations are strictly enforced using an On Board Computer (OBC)
system and there is no leniency for safety or regulatory violations. Three factors that dampen driver morale are
situations where drivers believe they are not being fully utilized (and therefore not accruing maximum earnings),
physical comfort while driving, and road safety. Rough road conditions increase driver discomfort and physical
fatigue. The short merging lanes on some highways and the mixing of passenger and truck traffic both pose
significant road safety hazards and frustrate the drivers. Drivers generally know the predetermined routes by
heart, and when traffic is diverted from these routes (due to road works or accidents) it can be tricky to
recalculate the shortest route while taking into consideration prevailing route restrictions. As key motivators,
drivers cited their love of driving, the freedom and independence of driving their own truck, and their self-
determination.
A successful example of public-private interaction is where one of the processing plants joined forces with other
companies in the area to contribute financially to the upkeep and maintenance of the rural road leading to their
facilities. This ensured that local agencies promptly attend to road repairs. Other than this initiative, Company A
had minimal interaction with public agencies. The Senior Manager agreed that there would definitely be mutual
benefit to more structured interaction between public and private agencies, and he indicated willingness to
dedicate a couple of days to such initiatives. A quick-win in this regard would be better communication
regarding the scheduling of road works during peak-season, as these could greatly disrupt inbound logistics.
Road infrastructure considerations contribute marginally to Company A’s decisions regarding whether to take on
certain customers or suppliers; this is a strategic-level decision. On the operational and tactical levels, the daily
scheduling and routing of pickups and deliveries are affected by road works and congestion while CSA
regulations affect driver management and trip planning.
Company B
Company B is an asset-based motor carrier with two primary business streams:
Consolidating less-than-truckload (LTL) shipments from the continental U.S. for shipment to Canadian
terminals, and
Domestic LTL shipments across the continental U.S.
Company B has a number of terminals within its network in the U.S. as well as partner terminals in Canada and
the U.S. The California terminal where the researchers conducted their operational investigation has an
additional business stream that was inherited from the company that previously operated from that terminal and
it is unique within Company B’s network. This business stream is the pickup and delivery of intrastate LTL
freight. The operational investigation of Company B was conducted over two days, May 21 and 22, 2013.
xx UCPRC-RR-2014-02
LTL shippers need to be very flexible and adaptable to serve their customer’s transport needs amid volatile
business cycles. The efficacy and efficiency of the consolidation and synchronization of shipments is critical in
keeping costs and lead times down. Achieving this requires constant coordination and communication among
the terminals in the network and thus the physical structure of the network, i.e., the location of terminal facilities
and their interconnectivity , greatly influences the business’s performance.
Drivers are permanently employed by Company B, are paid by the hour (and compensated for distance) and are
not unionized. Drivers that can adhere to Company B’s stringent safety requirements and have the right
credentials for CSA accreditation are in short supply. CSA accreditation is essential for drivers crossing the
Canadian border. Drivers cite the thrill of driving and the freedom and autonomy of truck driving as primary
motivators. Meanwhile, road safety, congestion and waiting at client terminals cause great frustration. Drivers at
Company B also state that the short merging lanes and mixing of passenger and truck traffic are road safety
hazards and they suggest truck-only lanes. Narrow streets and driveways and a lack of truck parking also cause
great frustration when executing pickups and deliveries in urban areas. Drivers noted a clear difference in road
conditions between California and neighboring states, and reported that rougher road conditions affect their
driving comfort and fatigue.
Road regulation hampers Company B’s operations, especially when compared with other states. Firstly, the
process to register new trucks is reportedly cumbersome. Secondly, the implementation schedule of the new
environmental efficiency regulations for trucks is forcing Company B to retire trucks long before their 750,000
mile cut-off point, causing severe financial repercussions. The excessive inspections performed on trucks also
waste a lot of time. While the content of environmental and road safety regulations are supported in principle,
their implementation causes operational inefficiencies. Route restrictions in Northern California are considered
excessive and are causing severe traffic chokepoints in the Bay Area. Company B makes two pertinent
suggestions regarding road regulations: allowing triple trailers and opening of the road to trucks through truck-
only lanes and the lifting of route restrictions.
Road infrastructure and regulation can play a key role in deciding where to build a network terminal, which is a
strategic level decision. Conversely, although congestion, road works and road conditions frustrate drivers and
managers, these factors do not seem to affect actual operational and tactical level decisions.
The issues uncovered and suggestions made during the case studies were congruent with those challenges
identified and projects prioritized in the San Joaquin Valley Interregional Goods Movement Plan.
UCPRC-RR-2014-02 xxi
Supply Chain Design and Vulnerability
Transport infrastructure and regulation affects the supply chain in two ways:
The design, location, performance and regulation of transport infrastructure are critical inputs to the
design of the supply chain network, and
The propensity of transport disruptions and delays caused by infrastructure failure contributes to overall
supply chain vulnerability.
There are three classes of supply chain risk sources, namely demand-side risk sources, supply-side risk sources,
and supply chain structure risk sources. Road infrastructure and regulation can render supply chains more
vulnerable to these risk sources on three levels—on the product or process level, on the asset and infrastructure
dependency level, or on the operating environment level. The analysis of how road infrastructure and regulation
affects supply chain vulnerability was conducted considering industry/economic sector aggregation. In this pilot
study, two of the ten goods movement-dependent economic sectors of California were considered in case
studies, namely the Agriculture, Forestry and Fishing sector and the Transportation and Warehousing sector.
The major hazards facing the agricultural industry in general are broad-based, contributing to each one of the
three supply chain risk source categories. In the case of Company A, weather-related hazards, natural disasters
and biological or environmental hazards can have a great impact because all of their suppliers are geographically
concentrated. Logistics and infrastructure hazards are also especially detrimental due to the perishable nature of
its products and the seasonal pressures of inbound logistics. Agricultural products are generally low margin
products and thus changes in input costs (such as energy or transport costs) can be debilitating. Transport
efficiency plays a tremendous role in ensuring that product is not lost and that costs are kept low. In addition,
studies have shown that food supply chains are very vulnerable to terrorist attacks and that targeting the
transport function (either through jeopardizing infrastructure or vehicles) would be the most effective way to
undermine these supply chains.
The Transport and Warehousing sector is comprised mostly of third-party logistics (3PL) companies to whom
one or more logistics activity has been outsourced. The U.S. 3PL sector has grown significantly, with revenue
quadrupling between 1996 and 2008. 3PL companies are mostly exposed to two groups of risks: volatility in
business demand as a result of any one of the previously mentioned risk sources in their clients’ supply chains;
and vulnerability to factors that jeopardize 3PLs’ abilities to deliver the expected service. The factors that could
seriously jeopardize 3PLs’ abilities to deliver the expected service are related to transport infrastructure,
communication infrastructure, economic volatility, environmental regulation, and geopolitical unrest. Given
California’s heavy dependence on road infrastructure, even short-term delays or capacity constrictions caused by
congestion or construction could be detrimental to the 3PL industry, not just the large-scale disruptions caused
xxii UCPRC-RR-2014-02
by, for example, terrorist attacks or earthquakes. The implementation of ever-stricter environmental regulation
also places severe financial and operational burdens on Company B and other asset-based motor carriers.
Supply chain network design is also significantly affected by transport infrastructure and regulation. Supply
chain network design has been defined by Klibi et al. [2] as the “strategic decisions on the number, location,
capacity and mission of production-distribution facilities in a company, or of a set of collaborating companies, in
order to provide goods to a predetermined, but possibly evolving, customer base. It also involves decisions
related to the selection of suppliers, subcontractors and 3PLs, and to the offers to make to product-markets.”
During supply chain network design, a number of value drivers have to be balanced among many diverse supply
chain organizations. These value drivers are related to revenue (customer service, product, market coverage),
cost (product cost, logistics cost, overheads), and capital expenditures (network investments, value of current
assets). Transport infrastructure and regulation affect revenue by impacting customer service, product
availability, and potential market coverage. In addition, transport costs are the greatest drivers of logistics costs
and are heavily influenced by the design, location and performance of infrastructure as well as the cost of
adhering to regulations. Lastly, infrastructure and regulation affect decisions regarding facility location (capital
expenditures).
The Spread of Economic Sectors in California and Implications for Road Infrastructure and Regulation
Ten of the economic sectors identified by the United State Census Bureau are considered goods movement-
dependent economic sectors, namely:
Mining;
Utilities;
Agriculture, Forestry and Fishing;
Manufacturing;
Transportation and Warehousing;
Retail Trade;
Wholesale Trade;
Waste Management;
Health Care and Social Assistance, and
Accommodation and Food Services
The supply chain design and vulnerability factors relevant within each of these economic sectors varies greatly
and thus the manner in which road infrastructure and regulation affects each of these sectors also varies. The
Agriculture, Forestry and Fishing and Transport and Warehousing sectors have been discussed in this pilot study
based on the case study findings. Analysis of the other eight sectors is beyond the scope of this pilot study. It is
UCPRC-RR-2014-02 xxiii
critical for Caltrans to be aware of which sectors are present in which counties and the size of those sectors.
Having this awareness could alert Caltrans to the potential impact of certain road infrastructure and regulation
decisions on the various sectors present and spur collaboration with private industry to mitigate potential
negative effects.
Analysis of these economic sectors within the 58 Californian counties was based on the economic values
reported by the United States Census Bureau’s American Fact Finder tool. (Economic contribution was
considered instead of tons transported to ascertain a better picture of the potential economic impact of supply
chains in these sectors.) Los Angeles, Orange, Santa Clara, Alameda and San Diego are the five most prominent
counties, with wholesale trade, retail trade and manufacturing contributing most to these counties’ economic
well-being. Individual county analyses for all 58 counties are presented in the technical appendices.
CONCLUSIONS AND WAY FORWARD
This study has shown through desktop studies, qualitative analysis, and case studies that road infrastructure and
regulation, as managed by Caltrans, has a marked impact on supply chain operations and strategies. This is one
instance where public sector decision making greatly influences private sector decision making. The analysis has
shown that, in this instance, the reciprocal influence of private sector decision making on public sector decision
making is not as significant. Given the critical role that supply chains play in the economic well-being and
quality of life in California and the dependence of these supply chains on road infrastructure and regulation, it is
imperative that the public sector (Caltrans) and private sector are engage throughout the planning and
construction of road infrastructure as well as during the drafting and implementation of policy. There have been
a few successful efforts in this regard, for example in the recent establishment of the California Freight Advisory
Committee and in the deliberate and interactive inclusion of the private sector stakeholders during drafting of
the San Joaquin Valley (SJV) Interregional Good Movement Plan.
The first step in more meaningful engagement between Caltrans and the private sector is an adequate
understanding of how and when road infrastructure and regulation influence supply chains. In this pilot study, it
has been identified that road infrastructure and regulation have a direct effect on supply chain vulnerability and
design, and that private companies make decisions that take these two elements into consideration. However,
supply chain vulnerability and design are different for each economic goods movement-dependent sector and
therefore a blanket approach would not suffice.
xxiv UCPRC-RR-2014-02
This pilot study presented the methodology for a sector-by-sector analysis that can inform Caltrans regarding the
intricacies and considerations of supply chain vulnerability and design in different sectors. The scope of the pilot
study was limited in the following terms:
Only two of the ten identified goods movement-dependent sectors were analyzed, namely the
Agriculture, Forestry and Fishing sector and the Transportation and Warehousing sector, and
Case studies were only conducted at one company in each of the sectors mentioned above.
In order for this study to be comprehensive enough to form part of routine Caltrans decision making regarding
road infrastructure and regulation, its scope needs to be expanded to cover all goods movement-dependent
sectors and it also needs to be deepened by conducting a representative ensemble of case studies in each sector.
UCPRC-RR-2014-02 xxv
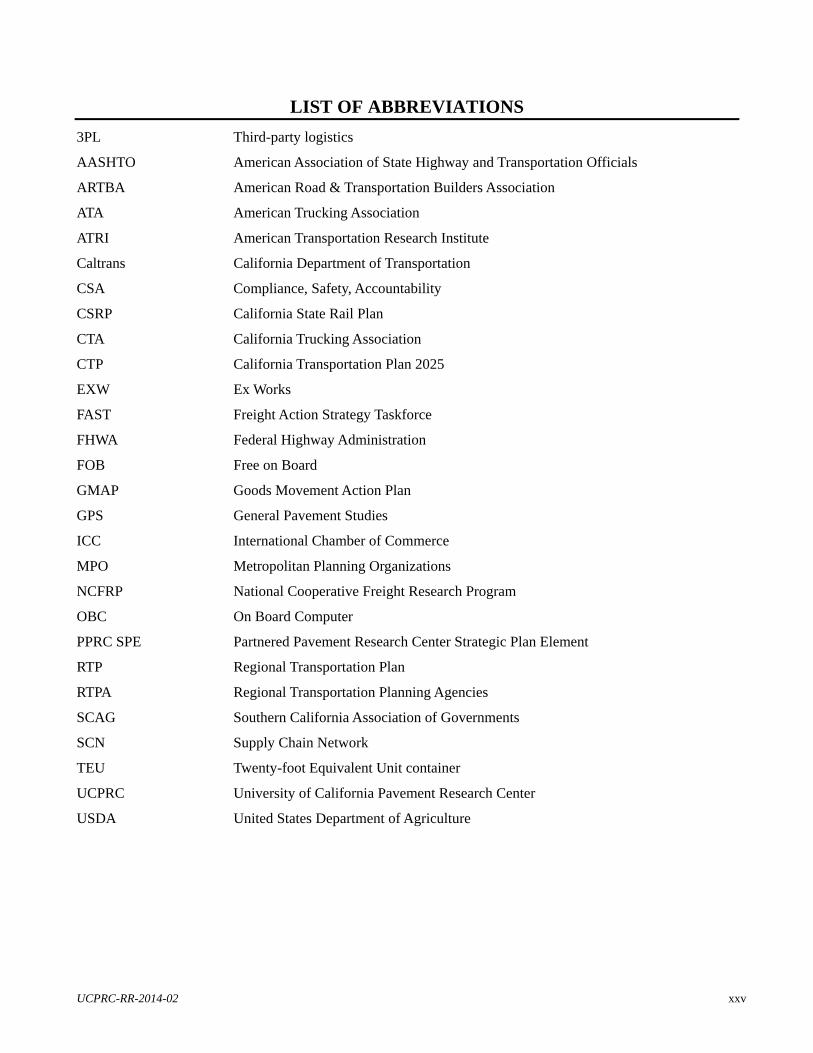
LIST OF ABBREVIATIONS
3PL Third-party logistics
AASHTO American Association of State Highway and Transportation Officials
ARTBA American Road & Transportation Builders Association
ATA American Trucking Association
ATRI American Transportation Research Institute
Caltrans California Department of Transportation
CSA Compliance, Safety, Accountability
CSRP California State Rail Plan
CTA California Trucking Association
CTP California Transportation Plan 2025
EXW Ex Works
FAST Freight Action Strategy Taskforce
FHWA Federal Highway Administration
FOB Free on Board
GMAP Goods Movement Action Plan
GPS General Pavement Studies
ICC International Chamber of Commerce
MPO Metropolitan Planning Organizations
NCFRP National Cooperative Freight Research Program
OBC On Board Computer
PPRC SPE Partnered Pavement Research Center Strategic Plan Element
RTP Regional Transportation Plan
RTPA Regional Transportation Planning Agencies
SCAG Southern California Association of Governments
SCN Supply Chain Network
TEU Twenty-foot Equivalent Unit container
UCPRC University of California Pavement Research Center
USDA United States Department of Agriculture
xxvi UCPRC-RR-2014-02
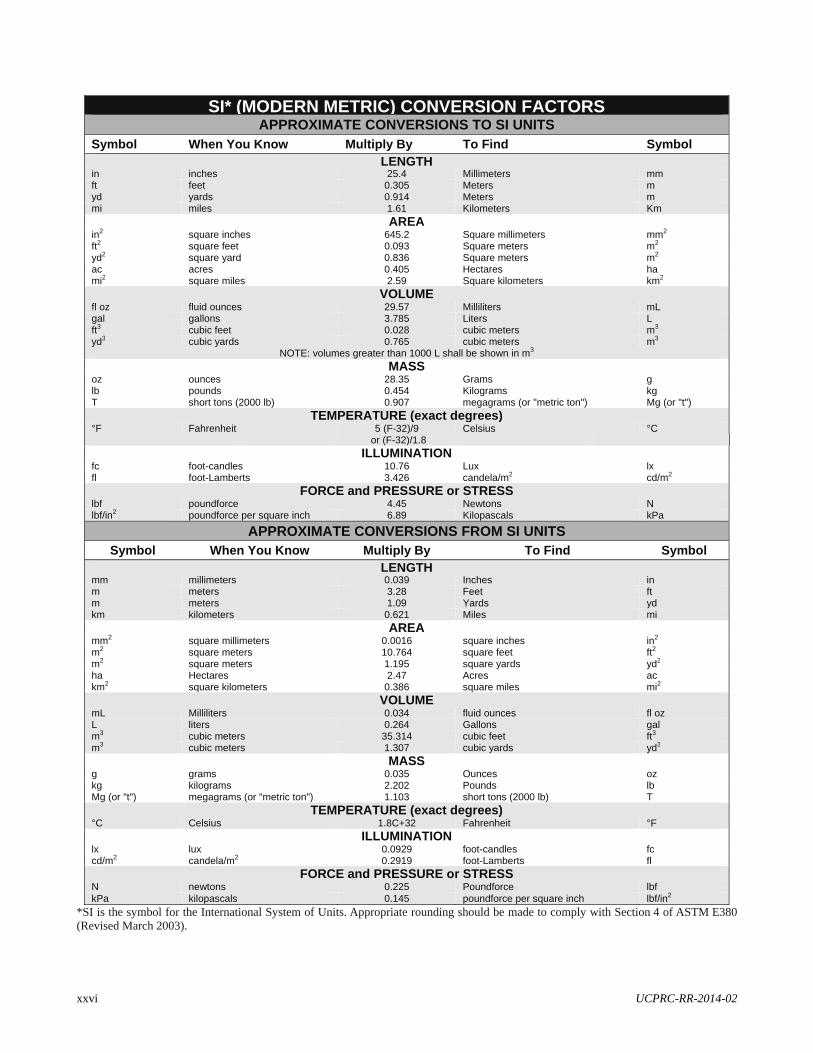
SI* (MODERN METRIC) CONVERSION FACTORS APPROXIMATE CONVERSIONS TO SI UNITS
Symbol When You Know Multiply By To Find Symbol LENGTH
in inches 25.4 Millimeters mm ft feet 0.305 Meters m yd yards 0.914 Meters m mi miles 1.61 Kilometers Km
AREAin2 square inches 645.2 Square millimeters mm2
ft2 square feet 0.093 Square meters m2 yd2 square yard 0.836 Square meters m2
ac acres 0.405 Hectares ha mi2 square miles 2.59 Square kilometers km2
VOLUMEfl oz fluid ounces 29.57 Milliliters mL gal gallons 3.785 Liters L ft3 cubic feet 0.028 cubic meters m3 yd3 cubic yards 0.765 cubic meters m3
NOTE: volumes greater than 1000 L shall be shown in m3
MASSoz ounces 28.35 Grams g lb pounds 0.454 Kilograms kg T short tons (2000 lb) 0.907 megagrams (or "metric ton") Mg (or "t")
TEMPERATURE (exact degrees)°F Fahrenheit 5 (F-32)/9 Celsius °C
or (F-32)/1.8
ILLUMINATION fc foot-candles 10.76 Lux lx fl foot-Lamberts 3.426 candela/m2 cd/m2
FORCE and PRESSURE or STRESS lbf poundforce 4.45 Newtons N lbf/in2 poundforce per square inch 6.89 Kilopascals kPa
APPROXIMATE CONVERSIONS FROM SI UNITS
Symbol When You Know Multiply By To Find Symbol LENGTH
mm millimeters 0.039 Inches in m meters 3.28 Feet ft m meters 1.09 Yards yd km kilometers 0.621 Miles mi
AREAmm2 square millimeters 0.0016 square inches in2
m2 square meters 10.764 square feet ft2
m2 square meters 1.195 square yards yd2 ha Hectares 2.47 Acres ac km2 square kilometers 0.386 square miles mi2
VOLUMEmL Milliliters 0.034 fluid ounces fl oz L liters 0.264 Gallons gal m3 cubic meters 35.314 cubic feet ft3
m3 cubic meters 1.307 cubic yards yd3
MASSg grams 0.035 Ounces oz kg kilograms 2.202 Pounds lb Mg (or "t") megagrams (or "metric ton") 1.103 short tons (2000 lb) T
TEMPERATURE (exact degrees) °C Celsius 1.8C+32 Fahrenheit °F
ILLUMINATION lx lux 0.0929 foot-candles fc cd/m2 candela/m2 0.2919 foot-Lamberts fl
FORCE and PRESSURE or STRESSN newtons 0.225 Poundforce lbf kPa kilopascals 0.145 poundforce per square inch lbf/in2
*SI is the symbol for the International System of Units. Appropriate rounding should be made to comply with Section 4 of ASTM E380 (Revised March 2003).
UCPRC-RR-2014-02 1
SECTION 1: BACKGROUND INVESTIGATION AND
LITERATURE STUDY

2 UCPRC-RR-2014-02
UCPRC-RR-2014-02 3
1 INTRODUCTION
1.1 Background to the Logistics Augmentation Study
The topic of the logistics augmentation study originated from the Pilot Study Investigating the Interaction and
Effects for State Highway Pavements, Trucks, Freight and Logistics (hereafter referred to as the Vehicle-
Pavement Interaction Pilot Study).
One of the tasks of the Vehicle-Pavement Interaction Pilot Study entailed, among its other elements, was the
investigation of how rough road conditions could impact the logistics activities of cargo owners through its
contribution to cargo damage during transportation. This work led to discussions regarding the interface between
the public and private sectors in road-freight transportation, which made it apparent that there is a need for
Caltrans to better understand the road-freight users they serve. This pilot study was conceptualized based on
these discussions, and it was deemed appropriate to conduct the study as a value-adding funding augmentation
to the Vehicle-Pavement Interaction Pilot Study.
1.2 The Interface Between the Public and Private Sector in Road Freight Systems
The efficient movement of goods within an economy is a crucial lever to competitiveness. The impact that the
efficiency of logistics activities, especially the cost of logistics, has on the cost of doing business within a
specific region is a topic of ongoing study worldwide [3, 4, 5]. Road freight transportation is a significant
element of logistics activities in California with 78 percent of communities depending exclusively on trucks to
transport their goods and 88 percent of all manufactured tonnage in the state being moved on trucks [1]. Road
freight transportation is the predominant freight transport mode in California and it is used for long-haul
shipments, interregional transport and last-mile or urban distribution. It serves all industries and is a critical link
in any intermodal logistics chain. The efficiency of road-freight transportation is dependent on the capacity and
performance of the publicly owned and managed road networks, as well as on the capacity and performance of
privately owned truck fleets.
California’s growing population and growing economy place increasing strain on existing (and aging) road
infrastructure in the state. One results of this is that rapidly growing populations of passenger and freight road
users are colliding in a daily battle for space on the road. The impact of congestion on passenger travel and
perceived quality of life has been extensively studied in transport planning. However, there is far less
appreciation for the impact of congestion on the trucking industry. A study conducted by Golob and Regan
(2000) reported that more than 80 percent of managers of trucking operations cited highway congestion as a
serious to critical problem. The five aspects that affect their business in particular are slow average speeds,
4 UCPRC-RR-2014-02
unreliable travel times, increased driver frustration and lower morale, higher fuel and maintenance costs, and
higher accident and insurance costs. Other issues that impact road-freight efficiency are the deteriorating
condition of road infrastructure (exacerbated by increased traffic volumes), increasing route restrictions and
efficiency of shared infrastructure, such as intermodal terminals.
Growing freight volumes and the increasing demands on freight transportation systems to be reliable, cost
efficient, time efficient, flexible and adaptable are highlighting the importance of the interdependence between
the public and private sector in providing the population with the essential freight systems it requires. As the
NCFRP report Public and Private Sector Interdependence in Freight Transportation Markets succinctly states:
“With excess capacity on public portions of the system used up and increasing security and environmental
regulations, the public sector-related constraints on freight have become more important for the private sector’s
operations and planning” [6].
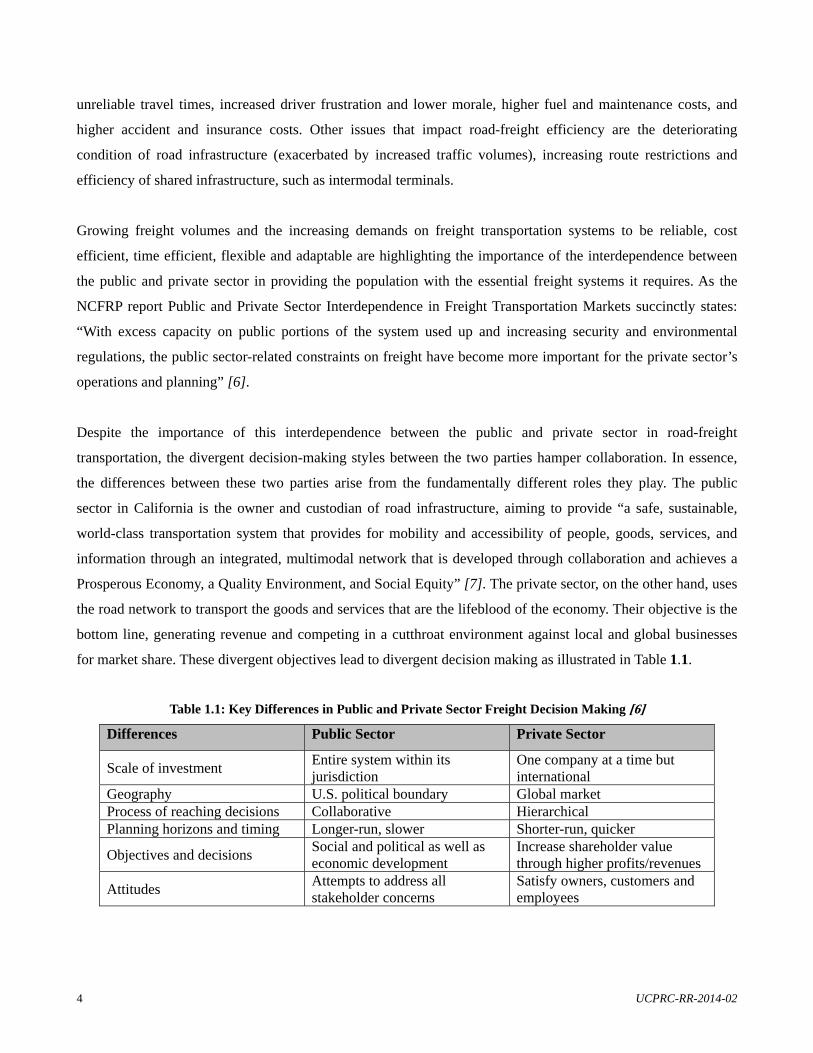
Despite the importance of this interdependence between the public and private sector in road-freight
transportation, the divergent decision-making styles between the two parties hamper collaboration. In essence,
the differences between these two parties arise from the fundamentally different roles they play. The public
sector in California is the owner and custodian of road infrastructure, aiming to provide “a safe, sustainable,
world-class transportation system that provides for mobility and accessibility of people, goods, services, and
information through an integrated, multimodal network that is developed through collaboration and achieves a
Prosperous Economy, a Quality Environment, and Social Equity” [7]. The private sector, on the other hand, uses
the road network to transport the goods and services that are the lifeblood of the economy. Their objective is the
bottom line, generating revenue and competing in a cutthroat environment against local and global businesses
for market share. These divergent objectives lead to divergent decision making as illustrated in Table 1.1.
Table 1.1: Key Differences in Public and Private Sector Freight Decision Making [6]
Differences Public Sector Private Sector
Scale of investment Entire system within its jurisdiction
One company at a time but international
Geography U.S. political boundary Global market Process of reaching decisions Collaborative Hierarchical Planning horizons and timing Longer-run, slower Shorter-run, quicker
Objectives and decisions Social and political as well as economic development
Increase shareholder value through higher profits/revenues
Attitudes Attempts to address all stakeholder concerns
Satisfy owners, customers and employees
UCPRC-RR-2014-02 5
The fact that these two parties have different objectives and divergent decision-making styles is not the root
cause to be addressed, instead it is the lack of understanding between these two parties that creates problems in
road-freight transportation. It is generally recognized that public sector agencies are unfamiliar with private
sector operations and planning [8] and of the ways that public sector decision making affects private sector
operations and planning activities [6]. This leads to situations where public agencies develop road infrastructure
plans and policies without an accurate understanding of how those plans and policies will affect daily business
operations and, consequently, of how the private sector will adapt.
Much research has been done on a conceptual level regarding the relationship between the public and private
sector, their divergent decision-making styles and how this affects freight transportation. This pilot study takes a
far more practical approach to identifying and describing those particular interdependencies affecting road-
freight transportation in the state of California.
1.3 Objectives of the Logistics Augmentation Study
The objectives of this study are to:
Provide a basic understanding to Caltrans of private sector decision making in road-freight
transportation;
Identify and describe the comprehensive set of interactions between the efficiency and efficacy of road-
freight transportation and the capacity, performance and regulation of road infrastructure, in the state
and recommend which of these interactions warrant more in-depth assessment on a state-wide scale to
quantify the overall economic and efficiency impact road infrastructure decisions have on the economy
of California, and
Illustrate the value of direct interactions and consultations with private companies in exploring private
sector decision making and the interdependence of these decisions on public sector actions.
1.4 Scope of the Logistics Augmentation Study
This logistics augmentation study is an exploratory study of the interdependencies between public and private
sector decision making relating to road-freight transportation in the state of California. In particular, it
investigates private sector decisions, on a strategic, operational and tactical level, that are affected by the current
road infrastructure in California as well as by road-freight regulation. This study will identify and explore
specific interdependencies through an operational investigation of a limited number of companies to illustrate
the potential value to Caltrans of direct interaction and consultation with private-sector companies. This
exploratory study does not aim to investigate any one interdependency in sufficient depth to give specific
instructions regarding current road-freight projects or policy, but instead it aims to identify potentially critical
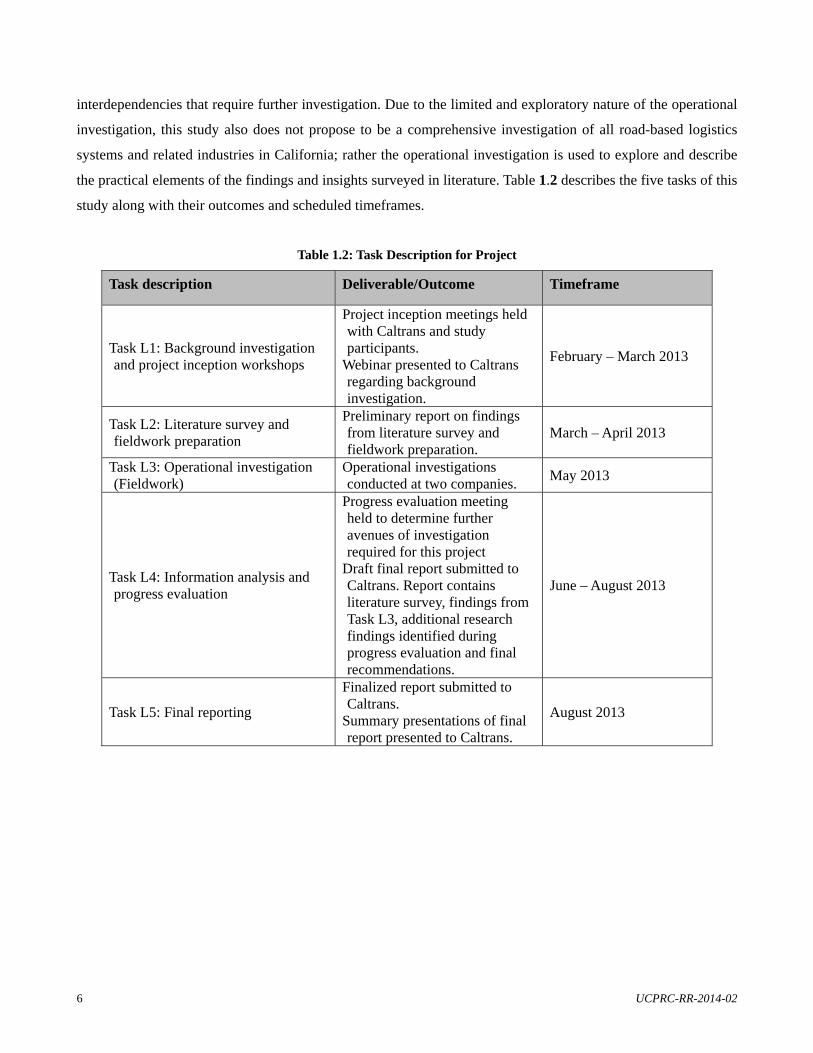
6 UCPRC-RR-2014-02
interdependencies that require further investigation. Due to the limited and exploratory nature of the operational
investigation, this study also does not propose to be a comprehensive investigation of all road-based logistics
systems and related industries in California; rather the operational investigation is used to explore and describe
the practical elements of the findings and insights surveyed in literature. Table 1.2 describes the five tasks of this
study along with their outcomes and scheduled timeframes.
Table 1.2: Task Description for Project
Task description Deliverable/Outcome Timeframe
Task L1: Background investigation and project inception workshops
Project inception meetings held with Caltrans and study participants.
Webinar presented to Caltrans regarding background investigation.
February – March 2013
Task L2: Literature survey and fieldwork preparation
Preliminary report on findings from literature survey and fieldwork preparation.
March – April 2013
Task L3: Operational investigation (Fieldwork)
Operational investigations conducted at two companies.
May 2013
Task L4: Information analysis and progress evaluation
Progress evaluation meeting held to determine further avenues of investigation required for this project
Draft final report submitted to Caltrans. Report contains literature survey, findings from Task L3, additional research findings identified during progress evaluation and final recommendations.
June – August 2013
Task L5: Final reporting
Finalized report submitted to Caltrans.
Summary presentations of final report presented to Caltrans.
August 2013
UCPRC-RR-2014-02 7
2 TASKS L1 – L4 SUMMARY
2.1 Task L1: Background Investigation and Project Inception Workshops
The objectives of this task were:
To establish foundational knowledge of the general interdependencies between the public and private
sector in freight transportation;
To reach consensus between the research team and Caltrans regarding the purpose and expected
outcomes of the study, and
To elicit firm commitment from the two study participants to participate in Task L3: Operational
Investigation (Fieldwork).
Task L1 was executed during March 2013. On March 13, 2013 a Webinar was presented by Nadia Viljoen
(CSIR) to the Caltrans project team summarizing the information gathered during the background investigation
and explaining the purpose and expected outcomes of the study as well as the detailed project plan. Between
March 25 and March 28, 2013 Nadia Viljoen, Prof. Wynand Steyn (University of Pretoria) and Lorina Popescu
(UC Berkeley) held a number of meetings with Caltrans staff and one of the two study participants to achieve
the objectives stated above. The meeting with the other study participant was held via web conference on
April 4, 2013. Task L1 was successfully completed.
2.2 Task L2: Literature Survey and Fieldwork Preparation
The objectives of this task were:
To obtain a general understanding of road-freight systems in California;
To obtain a high-level understanding of freight movement in California;
To survey the most relevant planning documents related to freight planning in California;
To survey the most prevalent private sector considerations related to road-freight transportation in
California, and
To make arrangements and prepare for Task L3: Operational Investigation (Fieldwork).
Task L2 was executed during March and April 2013. Much of the information gathered during the background
investigation guided Task L2. A desktop study of a collection of plans and reports (see References) was
conducted. A draft preliminary report summarized the insights gained from these reports, specifically compiled
in such a way as to frame and inform Task L3: Operational Investigation (Fieldwork). This report outlines the
arrangements and preparations made for Task L3. The draft preliminary report was the primary deliverable of
8 UCPRC-RR-2014-02
Tasks L1 and L2, and was submitted to Caltrans for comment on May 2, 2013. Revisions were made to the
report during June and July and the final version was submitted and accepted during August 2013.
2.3 Task L3: Operational Investigation (Fieldwork)
The objective of this task was to conduct extensive operational investigations at two companies (Company A
and Company B), identified as part of the Vehicle-Pavement Interaction Pilot Study. These operational
investigations included:
Interviews with senior managers, operational managers and truck drivers, and
Observations of operations, especially truck deliveries and pickups.
The operational investigations were successfully conducted during May 2013 by two researchers, Nadia Viljoen
(CSIR) and Lorina Popescu (UC Berkeley). Written and approved privacy and confidentiality protocols were
followed and the companies did not raise any concern regarding the analysis of their businesses as presented in
this report.
Company A was visited from May 15 to May 17, 2013:
May 15, 2013: Interviews were conducted with senior and operational managers;
May 16, 2013: The researchers were taken on guided tours of two processing plants and interviews were
conducted with operational managers at the plants, and
May 17, 2013: The researchers accompanied truck drivers on routine pickups and deliveries.
Company B was visited from 21 to 22 May 2013:
May 21, 2013: Interviews were conducted with senior and operational managers, and
May 22, 2013: The researchers accompanied truck drivers on routine pickups and deliveries.
2.4 Task L4: Information Analysis and Progress Evaluation
The objectives of this task were:
To collate and analyze the notes collected during Task L3;
To present technical contents to the Caltrans team during a Project Progress Evaluation Meeting;
To identify topics warranting further investigation or discussion based on the findings in Task L3;
To identify a future research strategy to escalate the pilot study to a comprehensive, state-wide study,
and
To compile a draft final report containing all the work conducted in Tasks L1 to L4.
UCPRC-RR-2014-02 9
The notes taken during Task L3 were collated, analyzed and written up in strict adherence to the agreed privacy
and confidentiality protocols. Drafts of the written sections for inclusion in this report were sent to Company A
and Company B for approval. As agreed, two weeks were given for the companies to review and approve the
sections.
It became apparent that the topics of supply chain vulnerability and design and how road infrastructure and
regulations affected these had to be addressed in further detail. This research direction was discussed with
Caltrans on May 20, 2013 and again during the project progress meeting on July 2, 2013.
Due to schedule constraints within the Caltrans team, the Project Progress Evaluation Meeting could not be held
before the draft report was submitted. The draft report containing Tasks L1 to L4 and a future research strategy
for escalating the pilot study to a comprehensive state-wide study was submitted to Caltrans on August 30, 2013
for comment.

10 UCPRC-RR-2014-02
UCPRC-RR-2014-02 11
3 OVERVIEW OF CALIFORNIA FREIGHT TRANSPORTATION
3.1 Freight Trends in California
3.1.1 Drivers of Growth in Freight Transportation
California is the largest state economy in the U.S. and one of the largest economies in the world. The state is a
gateway between the Pacific Rim and Northern America; a major supplier of agricultural and high-tech
manufactured products to the rest of the U.S.; and the most populous state in the U.S., with a vibrant consumer
market that fuels imports from other states and the rest of the world. California’s freight transportation networks
are critical to California’s economy and, with 20 percent of all U.S. foreign trade ($436 billion in goods) passing
through California [9], it is critical to the economies of other U.S. states as well. The four biggest trends behind
fast growth in freight transportation in the U.S. are these [6]:
Population and economic growth resulting in increased consumption that fuels freight volumes;
An increase in manufacturing output, despite a decline in manufacturing jobs;
Increased freight transport activity resulting from logistics trends such as just-in-time deliveries and
inventory-pull systems (see Section 5.3.3), and
Increasing international trade that spurs import and export volumes.
Each of these four trends are evident in California and it is clear from planning documents such as the Goods
Movement Action Plan, the California Transportation Plan 2025, and the California State Rail Plan 2007-08 to
2017-18 that if drastic action is not taken to increase the capacity and performance of California’s freight
transportation networks, the state will reach a choke point within the next two to three decades.
Three of the top ten U.S. international gateways are in California, namely the Port of Los Angeles, the Port of
Long Beach and Los Angeles International Airport [6]. Trade through the ports of Los Angeles and Long Beach
alone is expected to triple by 2030 [9]. Not only are the volumes of international trade increasing, but the share
of imports and exports out of the total amount of freight transported across U.S. freight networks is increasing.
This implies that the average traveling distance per ton (ton-miles) will also increase, meaning that each ton that
travels uses up more capacity in the network [6].
Population growth in California is also a major driver of increased freight transportation. Currently, the
population of California is approximately 38 million and latest estimates [10] predict that the population will
cross the 50 million mark in 2049. The population gain between 2010 and 2060 is estimated at 15.4 million,
exceeding the current populations of either Illinois or Pennsylvania. Figure 3.1 shows the projected population
growth (percent change) per county between 2010 and 2060. It is interesting to note that the counties with the
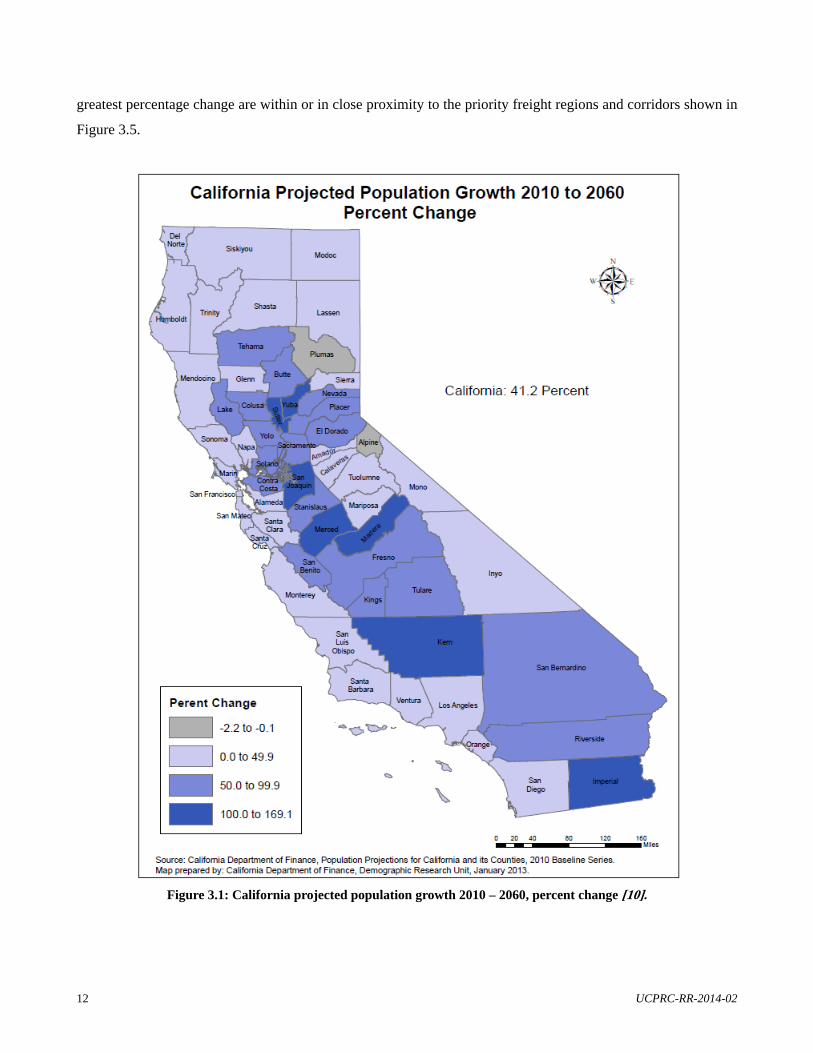
12 UCPRC-RR-2014-02
greatest percentage change are within or in close proximity to the priority freight regions and corridors shown in
Figure 3.5.
Figure 3.1: California projected population growth 2010 – 2060, percent change [10].
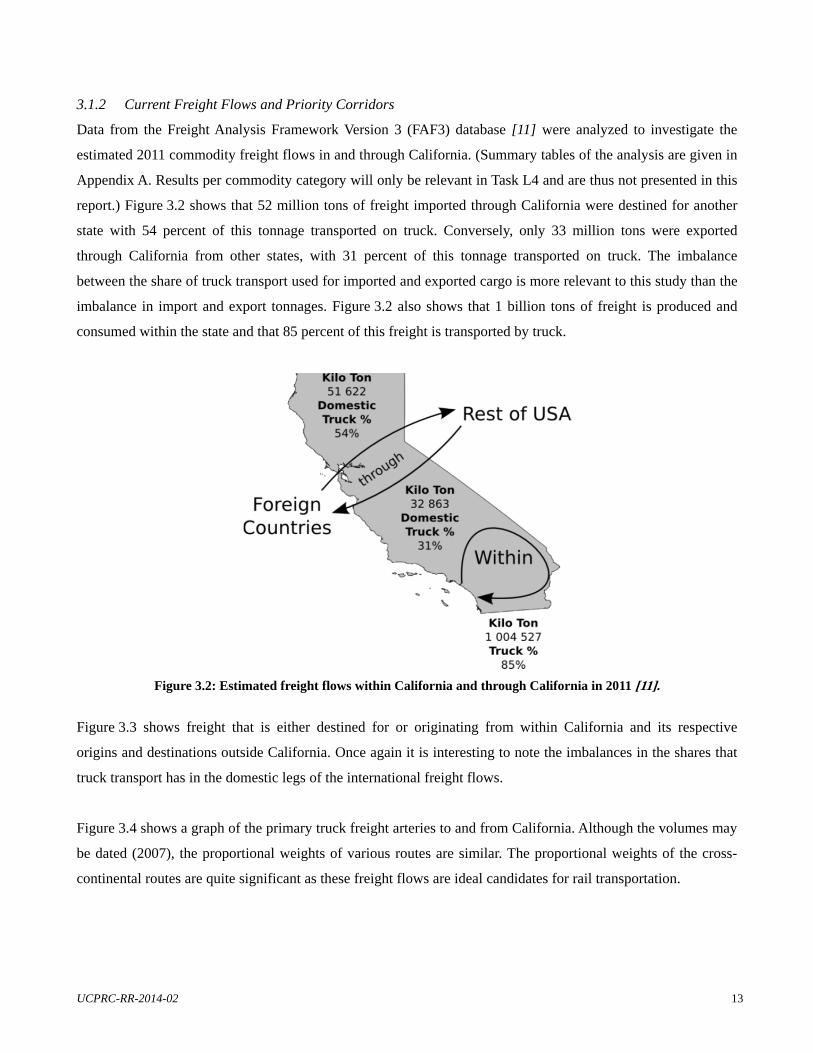
UCPRC-RR-2014-02 13
3.1.2 Current Freight Flows and Priority Corridors
Data from the Freight Analysis Framework Version 3 (FAF3) database [11] were analyzed to investigate the
estimated 2011 commodity freight flows in and through California. (Summary tables of the analysis are given in
Appendix A. Results per commodity category will only be relevant in Task L4 and are thus not presented in this
report.) Figure 3.2 shows that 52 million tons of freight imported through California were destined for another
state with 54 percent of this tonnage transported on truck. Conversely, only 33 million tons were exported
through California from other states, with 31 percent of this tonnage transported on truck. The imbalance
between the share of truck transport used for imported and exported cargo is more relevant to this study than the
imbalance in import and export tonnages. Figure 3.2 also shows that 1 billion tons of freight is produced and
consumed within the state and that 85 percent of this freight is transported by truck.
Figure 3.2: Estimated freight flows within California and through California in 2011 [11].
Figure 3.3 shows freight that is either destined for or originating from within California and its respective
origins and destinations outside California. Once again it is interesting to note the imbalances in the shares that
truck transport has in the domestic legs of the international freight flows.
Figure 3.4 shows a graph of the primary truck freight arteries to and from California. Although the volumes may
be dated (2007), the proportional weights of various routes are similar. The proportional weights of the cross-
continental routes are quite significant as these freight flows are ideal candidates for rail transportation.
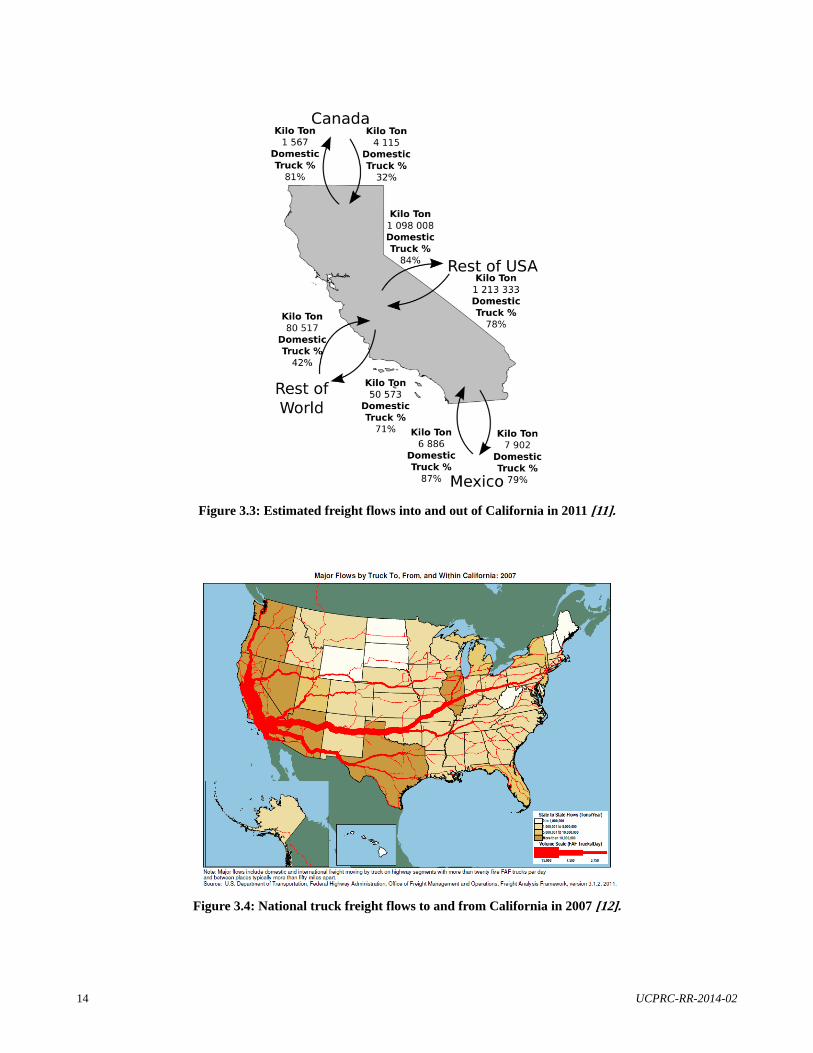
14 UCPRC-RR-2014-02
Figure 3.3: Estimated freight flows into and out of California in 2011 [11].
Figure 3.4: National truck freight flows to and from California in 2007 [12].
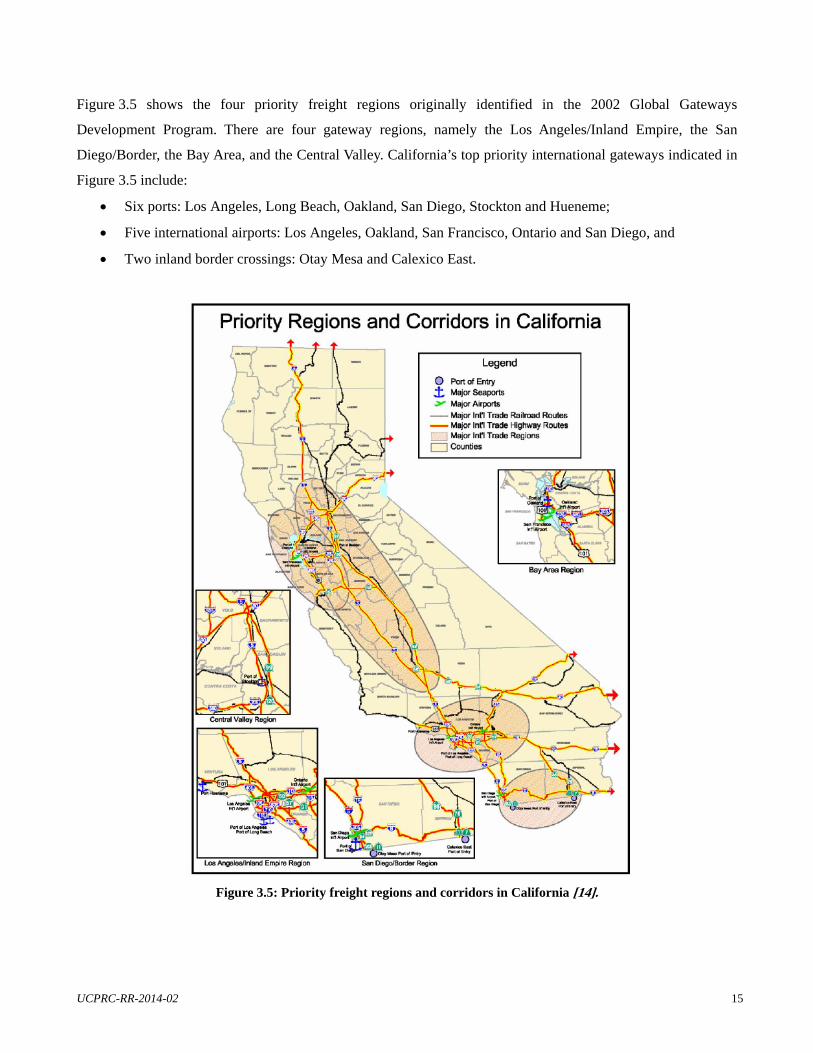
UCPRC-RR-2014-02 15
Figure 3.5 shows the four priority freight regions originally identified in the 2002 Global Gateways
Development Program. There are four gateway regions, namely the Los Angeles/Inland Empire, the San
Diego/Border, the Bay Area, and the Central Valley. California’s top priority international gateways indicated in
Figure 3.5 include:
Six ports: Los Angeles, Long Beach, Oakland, San Diego, Stockton and Hueneme;
Five international airports: Los Angeles, Oakland, San Francisco, Ontario and San Diego, and
Two inland border crossings: Otay Mesa and Calexico East.
Figure 3.5: Priority freight regions and corridors in California [14].
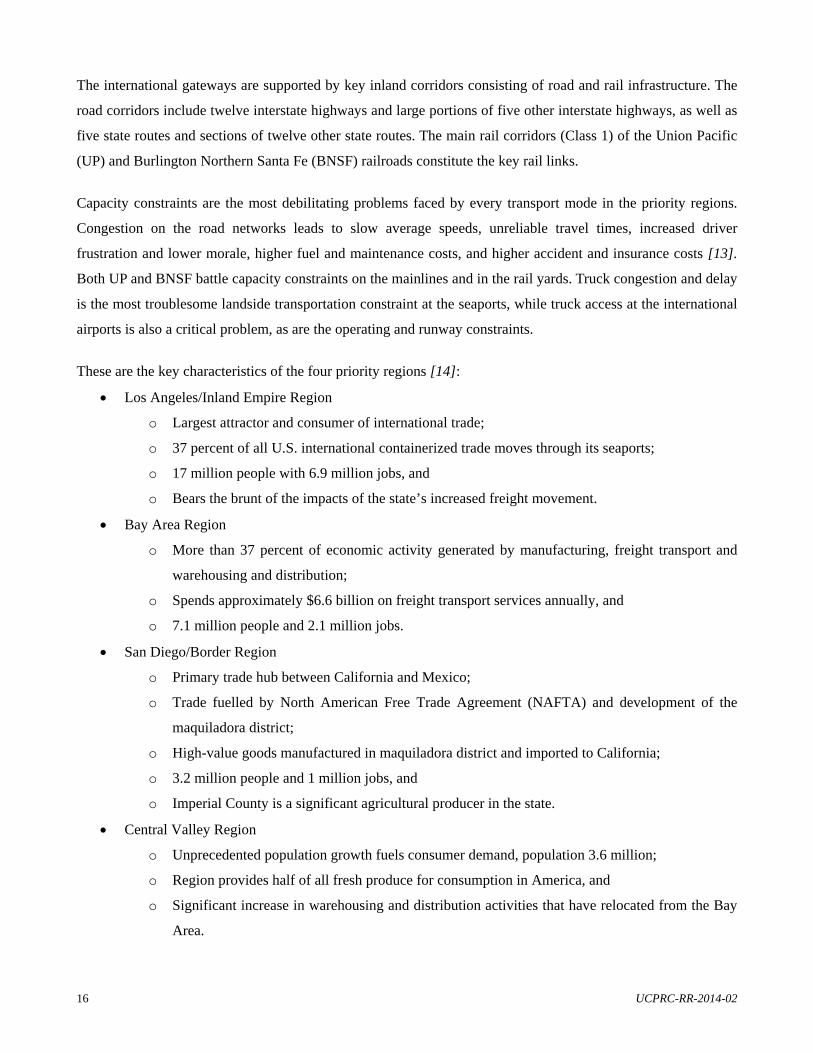
16 UCPRC-RR-2014-02
The international gateways are supported by key inland corridors consisting of road and rail infrastructure. The
road corridors include twelve interstate highways and large portions of five other interstate highways, as well as
five state routes and sections of twelve other state routes. The main rail corridors (Class 1) of the Union Pacific
(UP) and Burlington Northern Santa Fe (BNSF) railroads constitute the key rail links.
Capacity constraints are the most debilitating problems faced by every transport mode in the priority regions.
Congestion on the road networks leads to slow average speeds, unreliable travel times, increased driver
frustration and lower morale, higher fuel and maintenance costs, and higher accident and insurance costs [13].
Both UP and BNSF battle capacity constraints on the mainlines and in the rail yards. Truck congestion and delay
is the most troublesome landside transportation constraint at the seaports, while truck access at the international
airports is also a critical problem, as are the operating and runway constraints.
These are the key characteristics of the four priority regions [14]:
Los Angeles/Inland Empire Region
o Largest attractor and consumer of international trade;
o 37 percent of all U.S. international containerized trade moves through its seaports;
o 17 million people with 6.9 million jobs, and
o Bears the brunt of the impacts of the state’s increased freight movement.
Bay Area Region
o More than 37 percent of economic activity generated by manufacturing, freight transport and
warehousing and distribution;
o Spends approximately $6.6 billion on freight transport services annually, and
o 7.1 million people and 2.1 million jobs.
San Diego/Border Region
o Primary trade hub between California and Mexico;
o Trade fuelled by North American Free Trade Agreement (NAFTA) and development of the
maquiladora district;
o High-value goods manufactured in maquiladora district and imported to California;
o 3.2 million people and 1 million jobs, and
o Imperial County is a significant agricultural producer in the state.
Central Valley Region
o Unprecedented population growth fuels consumer demand, population 3.6 million;
o Region provides half of all fresh produce for consumption in America, and
o Significant increase in warehousing and distribution activities that have relocated from the Bay
Area.
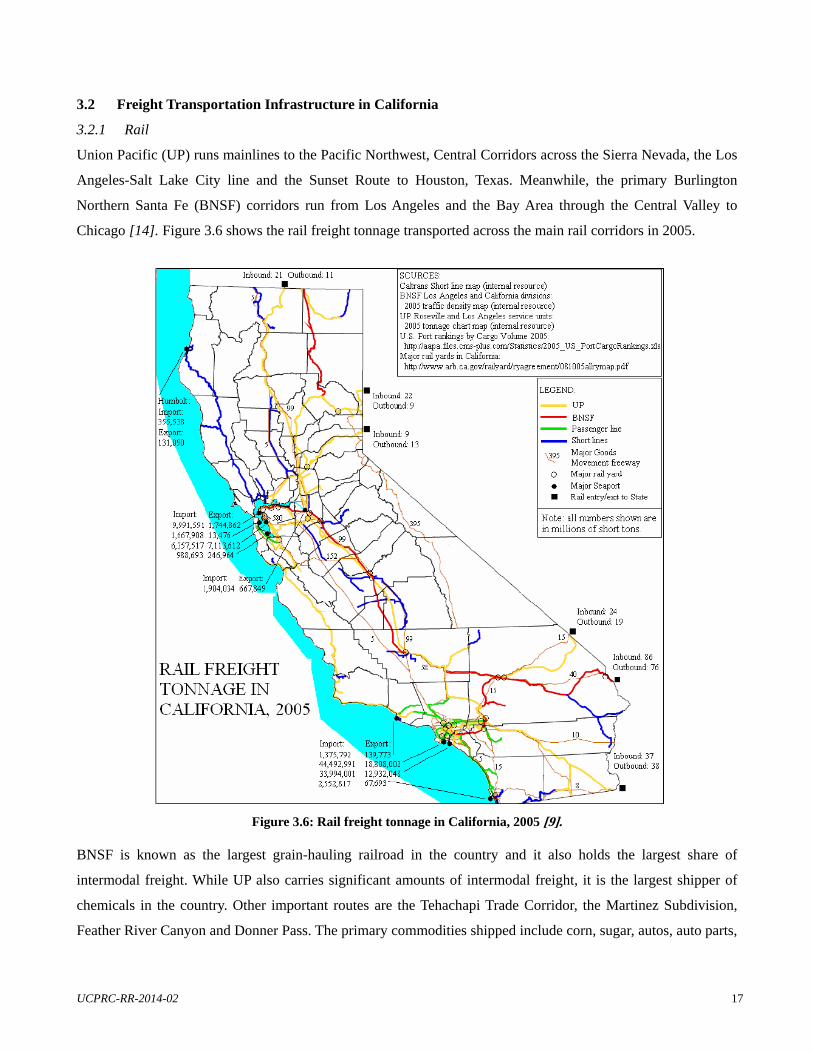
UCPRC-RR-2014-02 17
3.2 Freight Transportation Infrastructure in California
3.2.1 Rail
Union Pacific (UP) runs mainlines to the Pacific Northwest, Central Corridors across the Sierra Nevada, the Los
Angeles-Salt Lake City line and the Sunset Route to Houston, Texas. Meanwhile, the primary Burlington
Northern Santa Fe (BNSF) corridors run from Los Angeles and the Bay Area through the Central Valley to
Chicago [14]. Figure 3.6 shows the rail freight tonnage transported across the main rail corridors in 2005.
Figure 3.6: Rail freight tonnage in California, 2005 [9]. BNSF is known as the largest grain-hauling railroad in the country and it also holds the largest share of
intermodal freight. While UP also carries significant amounts of intermodal freight, it is the largest shipper of
chemicals in the country. Other important routes are the Tehachapi Trade Corridor, the Martinez Subdivision,
Feather River Canyon and Donner Pass. The primary commodities shipped include corn, sugar, autos, auto parts,
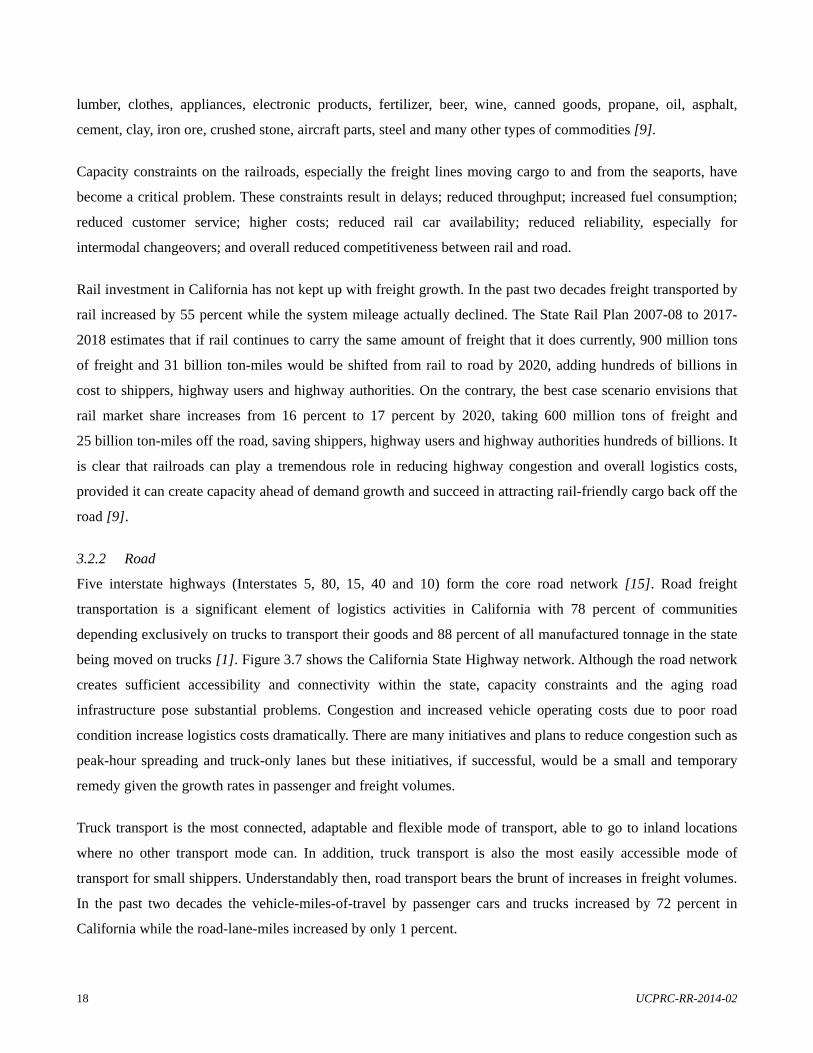
18 UCPRC-RR-2014-02
lumber, clothes, appliances, electronic products, fertilizer, beer, wine, canned goods, propane, oil, asphalt,
cement, clay, iron ore, crushed stone, aircraft parts, steel and many other types of commodities [9].
Capacity constraints on the railroads, especially the freight lines moving cargo to and from the seaports, have
become a critical problem. These constraints result in delays; reduced throughput; increased fuel consumption;
reduced customer service; higher costs; reduced rail car availability; reduced reliability, especially for
intermodal changeovers; and overall reduced competitiveness between rail and road.
Rail investment in California has not kept up with freight growth. In the past two decades freight transported by
rail increased by 55 percent while the system mileage actually declined. The State Rail Plan 2007-08 to 2017-
2018 estimates that if rail continues to carry the same amount of freight that it does currently, 900 million tons
of freight and 31 billion ton-miles would be shifted from rail to road by 2020, adding hundreds of billions in
cost to shippers, highway users and highway authorities. On the contrary, the best case scenario envisions that
rail market share increases from 16 percent to 17 percent by 2020, taking 600 million tons of freight and
25 billion ton-miles off the road, saving shippers, highway users and highway authorities hundreds of billions. It
is clear that railroads can play a tremendous role in reducing highway congestion and overall logistics costs,
provided it can create capacity ahead of demand growth and succeed in attracting rail-friendly cargo back off the
road [9].
3.2.2 Road
Five interstate highways (Interstates 5, 80, 15, 40 and 10) form the core road network [15]. Road freight
transportation is a significant element of logistics activities in California with 78 percent of communities
depending exclusively on trucks to transport their goods and 88 percent of all manufactured tonnage in the state
being moved on trucks [1]. Figure 3.7 shows the California State Highway network. Although the road network
creates sufficient accessibility and connectivity within the state, capacity constraints and the aging road
infrastructure pose substantial problems. Congestion and increased vehicle operating costs due to poor road
condition increase logistics costs dramatically. There are many initiatives and plans to reduce congestion such as
peak-hour spreading and truck-only lanes but these initiatives, if successful, would be a small and temporary
remedy given the growth rates in passenger and freight volumes.
Truck transport is the most connected, adaptable and flexible mode of transport, able to go to inland locations
where no other transport mode can. In addition, truck transport is also the most easily accessible mode of
transport for small shippers. Understandably then, road transport bears the brunt of increases in freight volumes.
In the past two decades the vehicle-miles-of-travel by passenger cars and trucks increased by 72 percent in
California while the road-lane-miles increased by only 1 percent.
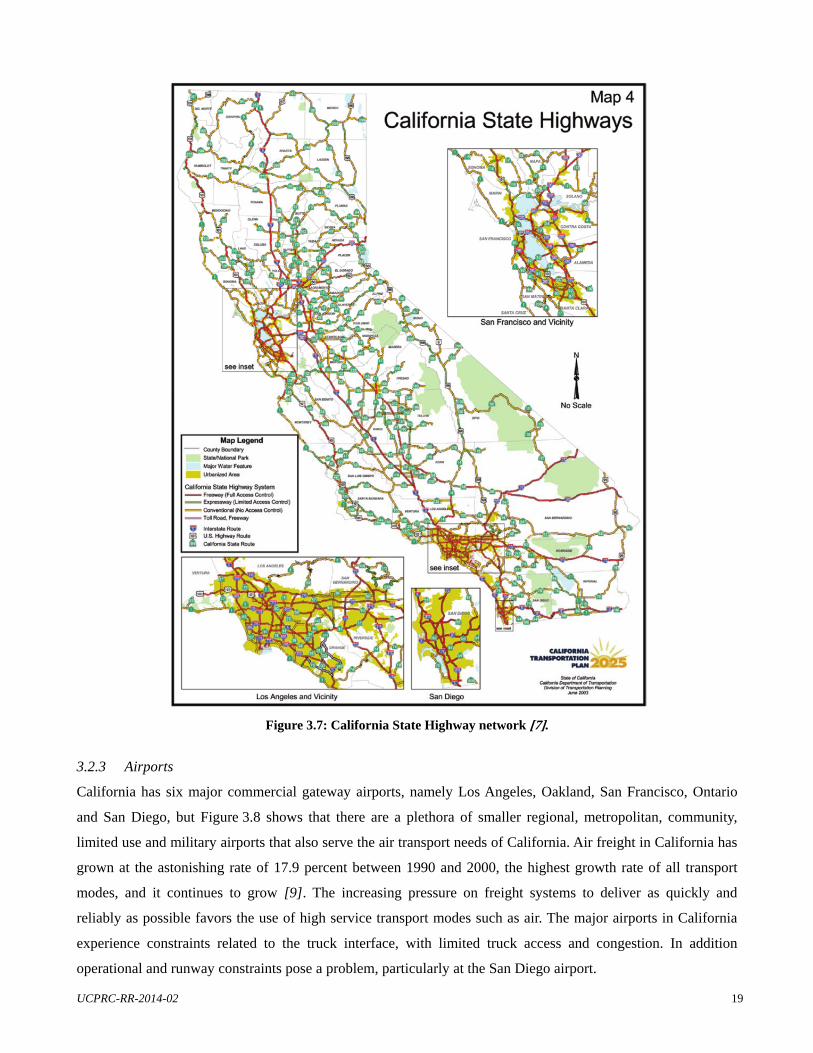
UCPRC-RR-2014-02 19
Figure 3.7: California State Highway network [7].
3.2.3 Airports
California has six major commercial gateway airports, namely Los Angeles, Oakland, San Francisco, Ontario
and San Diego, but Figure 3.8 shows that there are a plethora of smaller regional, metropolitan, community,
limited use and military airports that also serve the air transport needs of California. Air freight in California has
grown at the astonishing rate of 17.9 percent between 1990 and 2000, the highest growth rate of all transport
modes, and it continues to grow [9]. The increasing pressure on freight systems to deliver as quickly and
reliably as possible favors the use of high service transport modes such as air. The major airports in California
experience constraints related to the truck interface, with limited truck access and congestion. In addition
operational and runway constraints pose a problem, particularly at the San Diego airport.
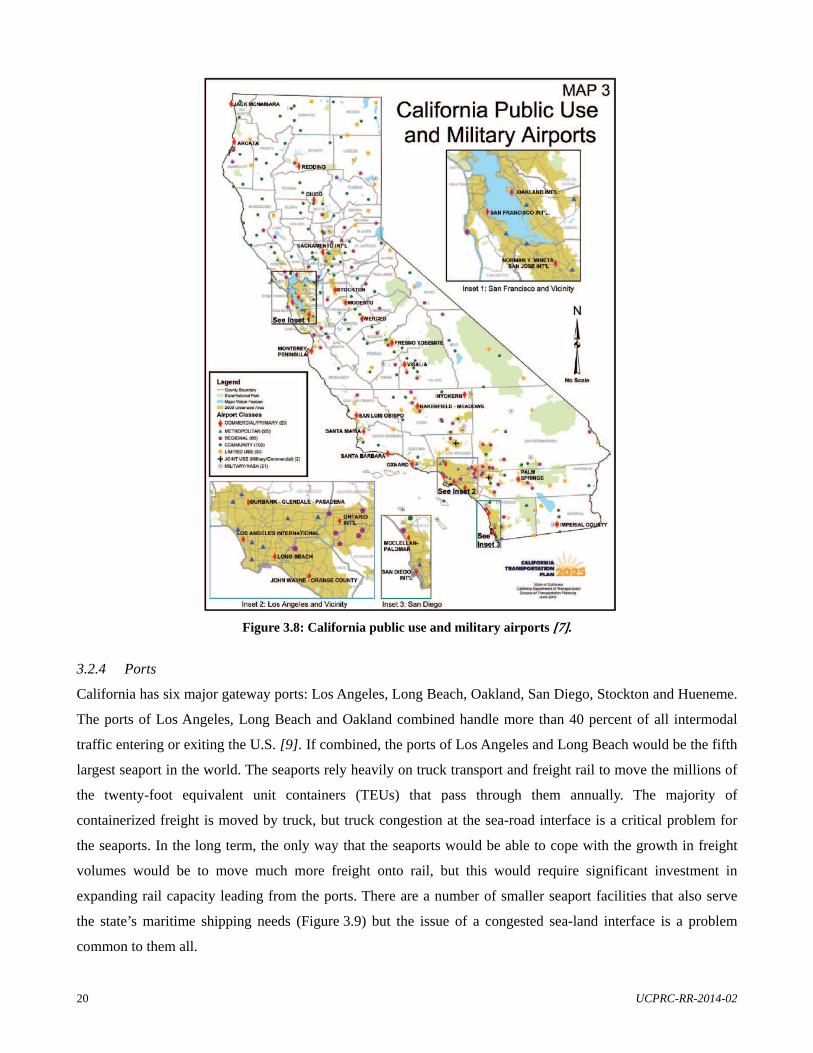
20 UCPRC-RR-2014-02
Figure 3.8: California public use and military airports [7].
3.2.4 Ports
California has six major gateway ports: Los Angeles, Long Beach, Oakland, San Diego, Stockton and Hueneme.
The ports of Los Angeles, Long Beach and Oakland combined handle more than 40 percent of all intermodal
traffic entering or exiting the U.S. [9]. If combined, the ports of Los Angeles and Long Beach would be the fifth
largest seaport in the world. The seaports rely heavily on truck transport and freight rail to move the millions of
the twenty-foot equivalent unit containers (TEUs) that pass through them annually. The majority of
containerized freight is moved by truck, but truck congestion at the sea-road interface is a critical problem for
the seaports. In the long term, the only way that the seaports would be able to cope with the growth in freight
volumes would be to move much more freight onto rail, but this would require significant investment in
expanding rail capacity leading from the ports. There are a number of smaller seaport facilities that also serve
the state’s maritime shipping needs (Figure 3.9) but the issue of a congested sea-land interface is a problem
common to them all.
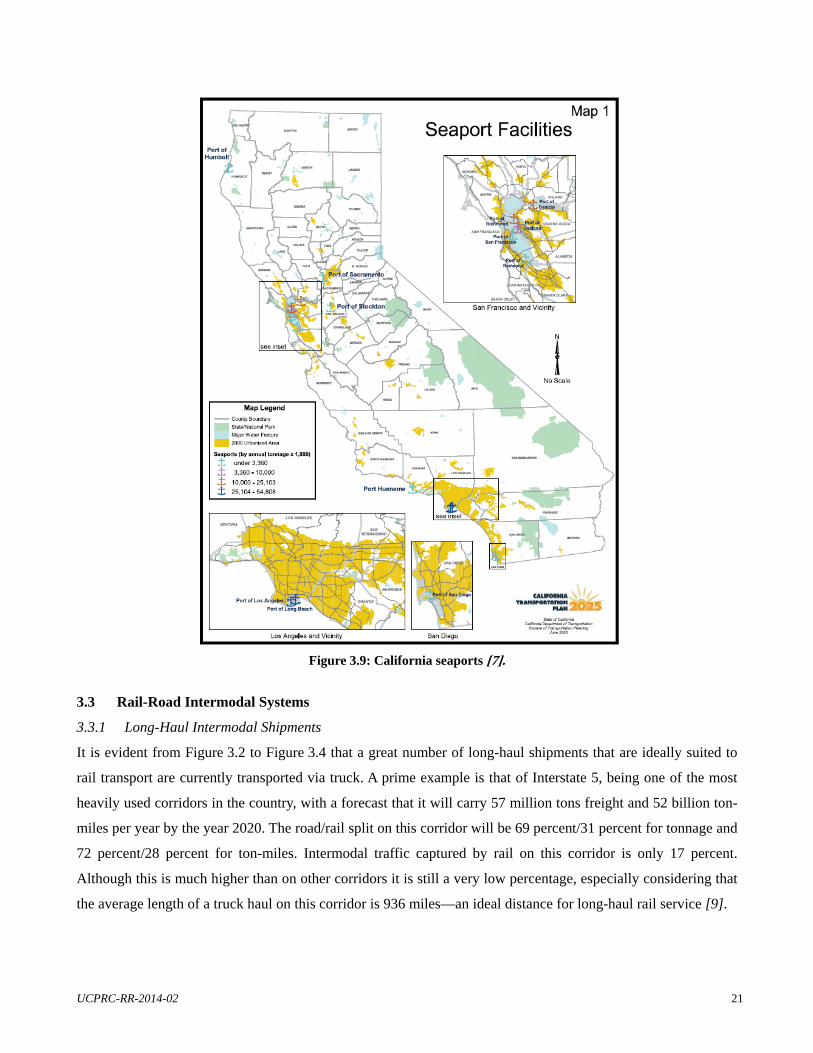
UCPRC-RR-2014-02 21
Figure 3.9: California seaports [7].
3.3 Rail-Road Intermodal Systems
3.3.1 Long-Haul Intermodal Shipments
It is evident from Figure 3.2 to Figure 3.4 that a great number of long-haul shipments that are ideally suited to
rail transport are currently transported via truck. A prime example is that of Interstate 5, being one of the most
heavily used corridors in the country, with a forecast that it will carry 57 million tons freight and 52 billion ton-
miles per year by the year 2020. The road/rail split on this corridor will be 69 percent/31 percent for tonnage and
72 percent/28 percent for ton-miles. Intermodal traffic captured by rail on this corridor is only 17 percent.
Although this is much higher than on other corridors it is still a very low percentage, especially considering that
the average length of a truck haul on this corridor is 936 miles—an ideal distance for long-haul rail service [9].
22 UCPRC-RR-2014-02
Why rail has such a relatively low market share in long-haul intermodal freight in the U.S. is a topic of national
debate. One explanation is that the move to just-in-time deliveries and inventory pull-systems (see Section 5.3.3)
places such immense pressure on supply chains to deliver shipments quickly and frequently that the slight
increases in lead time and decreases in lead time reliability characteristic of rail are unacceptable given current
market forces. For long-haul intermodal to be competitive to long-haul truck from a speed and reliability point-
of-view not only requires that the rail legs of the journey be fast and reliable, but also that the switch between
rail and road at intermodal terminals be efficient and that the location of intermodal terminals not add significant
distance to the overall trip.
However, the rising trends in congestion and the clamp down on the environmental impact of freight transport
may soon force long-haul shipments onto rail simply because the alternative will be unsustainable.
3.3.2 Short-Haul Intermodal Shipments
The potential of short-haul rail shuttle services to reduce congestion on the state’s highways and reduce the
environmental impact and overall costs of freight transport is immense. However, short-haul freight yields a
much lower profit margin than long-haul freight and thus rail companies are reluctant to invest in short-haul
solutions. Large railroad companies find the economics favorable at distances of 500 miles or more. Thus the
provision of a subsidy for short-haul rail services is under consideration [9]. Another element crucial to the
success of short-haul intermodal services is the availability of intermodal terminals that can be easily accessed
by both truck and rail, are close to major shippers, and have high throughput rates. The operation of night trains
would also be crucial if rail wants to capture short-haul shipments that are typically sent overnight by truck.
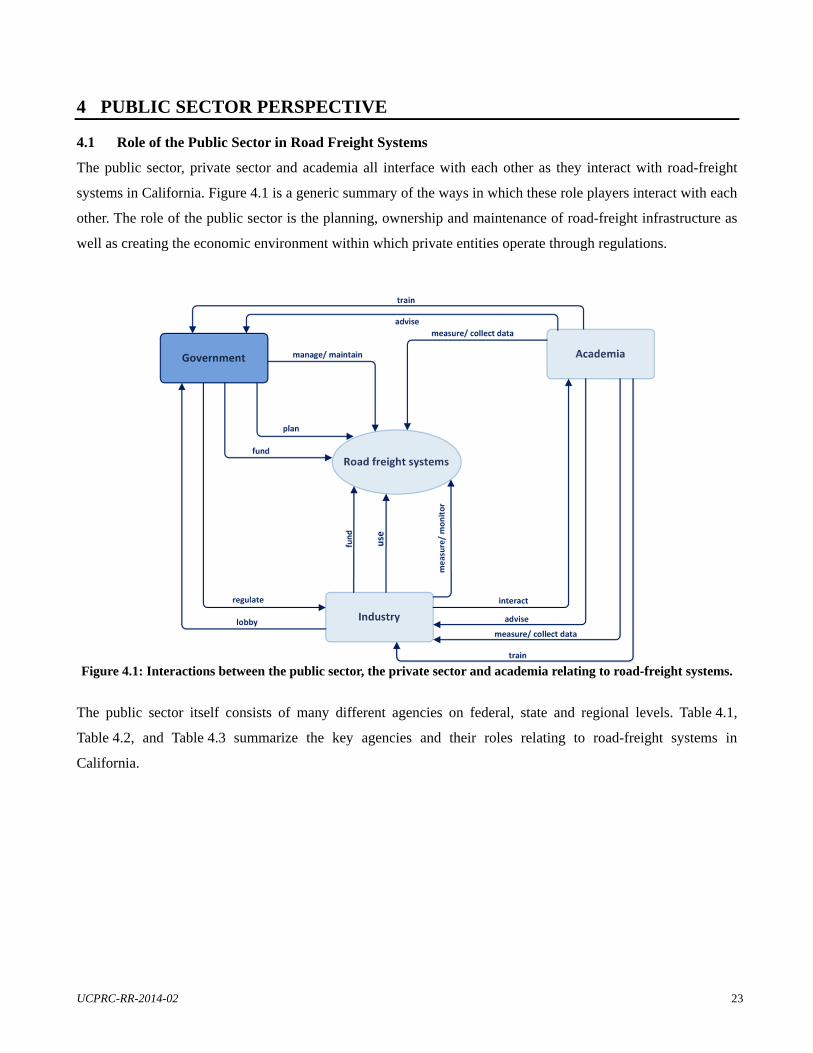
UCPRC-RR-2014-02 23
4 PUBLIC SECTOR PERSPECTIVE
4.1 Role of the Public Sector in Road Freight Systems
The public sector, private sector and academia all interface with each other as they interact with road-freight
systems in California. Figure 4.1 is a generic summary of the ways in which these role players interact with each
other. The role of the public sector is the planning, ownership and maintenance of road-freight infrastructure as
well as creating the economic environment within which private entities operate through regulations.
Figure 4.1: Interactions between the public sector, the private sector and academia relating to road-freight systems.
The public sector itself consists of many different agencies on federal, state and regional levels. Table 4.1,
Table 4.2, and Table 4.3 summarize the key agencies and their roles relating to road-freight systems in
California.
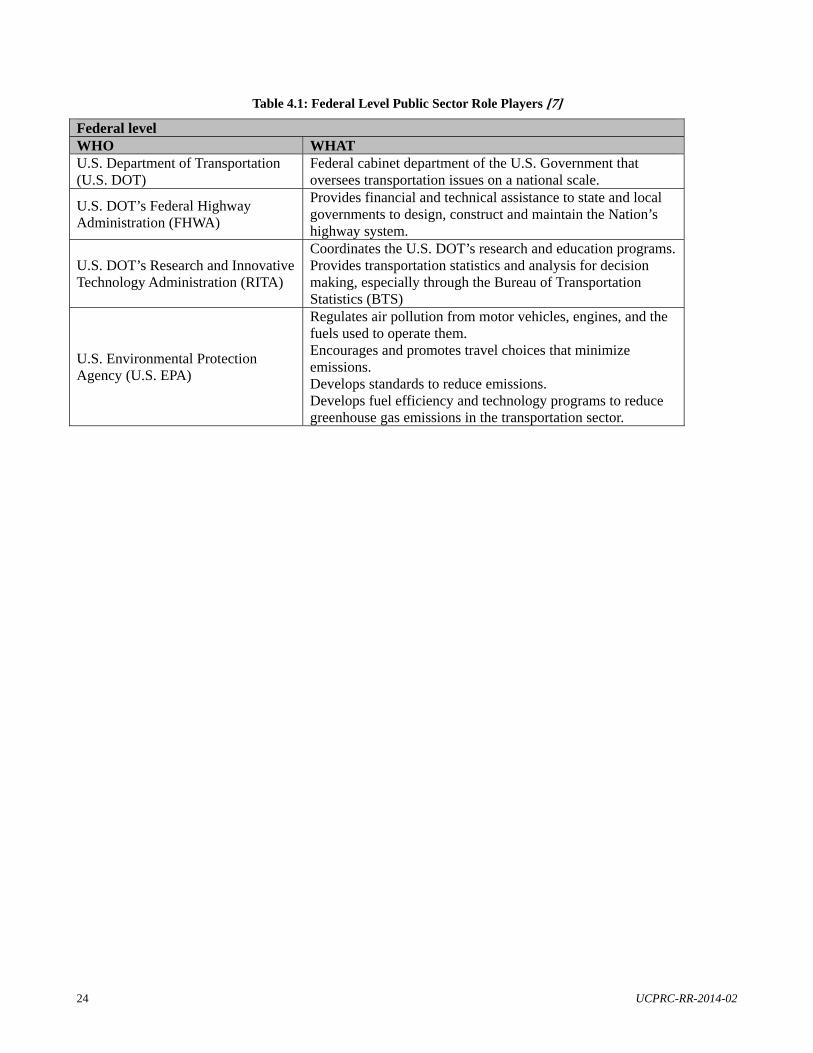
24 UCPRC-RR-2014-02
Table 4.1: Federal Level Public Sector Role Players [7]
Federal level WHO WHAT U.S. Department of Transportation (U.S. DOT)
Federal cabinet department of the U.S. Government that oversees transportation issues on a national scale.
U.S. DOT’s Federal Highway Administration (FHWA)
Provides financial and technical assistance to state and local governments to design, construct and maintain the Nation’s highway system.
U.S. DOT’s Research and Innovative Technology Administration (RITA)
Coordinates the U.S. DOT’s research and education programs. Provides transportation statistics and analysis for decision making, especially through the Bureau of Transportation Statistics (BTS)
U.S. Environmental Protection Agency (U.S. EPA)
Regulates air pollution from motor vehicles, engines, and the fuels used to operate them. Encourages and promotes travel choices that minimize emissions. Develops standards to reduce emissions. Develops fuel efficiency and technology programs to reduce greenhouse gas emissions in the transportation sector.
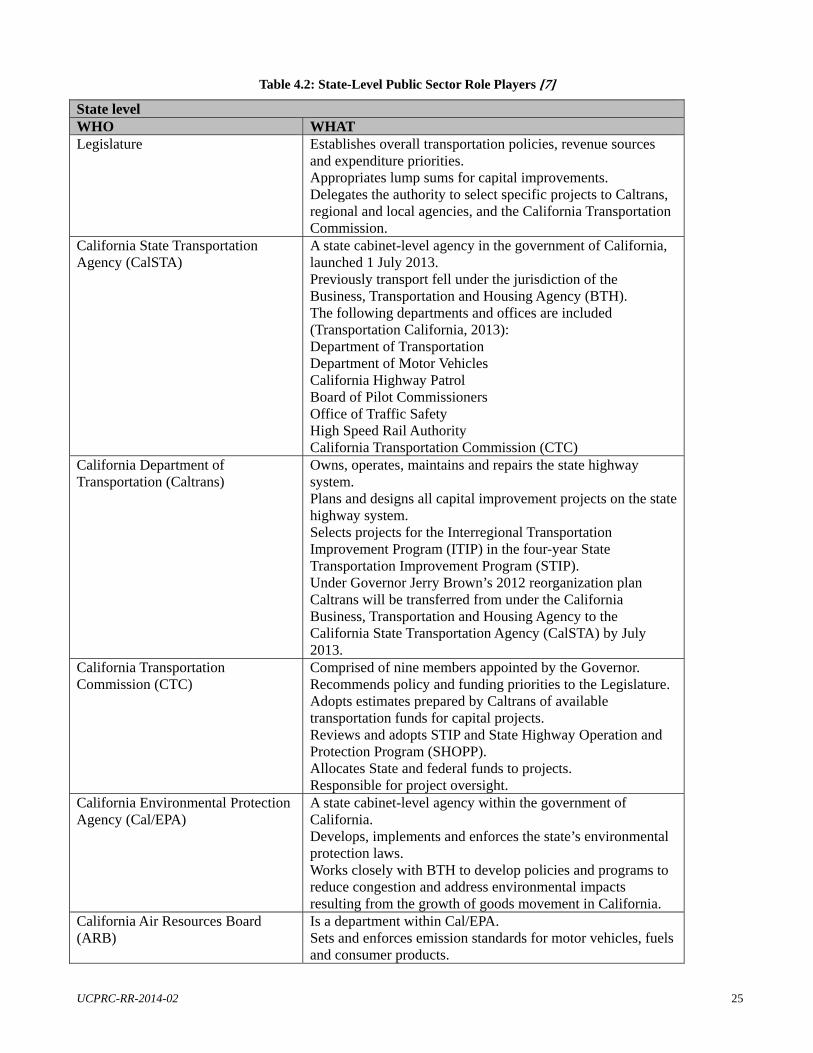
UCPRC-RR-2014-02 25
Table 4.2: State-Level Public Sector Role Players [7]
State level WHO WHAT Legislature Establishes overall transportation policies, revenue sources
and expenditure priorities. Appropriates lump sums for capital improvements. Delegates the authority to select specific projects to Caltrans, regional and local agencies, and the California Transportation Commission.
California State Transportation Agency (CalSTA)
A state cabinet-level agency in the government of California, launched 1 July 2013. Previously transport fell under the jurisdiction of the Business, Transportation and Housing Agency (BTH). The following departments and offices are included (Transportation California, 2013): Department of Transportation Department of Motor Vehicles California Highway Patrol Board of Pilot Commissioners Office of Traffic Safety High Speed Rail Authority California Transportation Commission (CTC)
California Department of Transportation (Caltrans)
Owns, operates, maintains and repairs the state highway system. Plans and designs all capital improvement projects on the state highway system. Selects projects for the Interregional Transportation Improvement Program (ITIP) in the four-year State Transportation Improvement Program (STIP). Under Governor Jerry Brown’s 2012 reorganization plan Caltrans will be transferred from under the California Business, Transportation and Housing Agency to the California State Transportation Agency (CalSTA) by July 2013.
California Transportation Commission (CTC)
Comprised of nine members appointed by the Governor. Recommends policy and funding priorities to the Legislature. Adopts estimates prepared by Caltrans of available transportation funds for capital projects. Reviews and adopts STIP and State Highway Operation and Protection Program (SHOPP). Allocates State and federal funds to projects. Responsible for project oversight.
California Environmental Protection Agency (Cal/EPA)
A state cabinet-level agency within the government of California. Develops, implements and enforces the state’s environmental protection laws. Works closely with BTH to develop policies and programs to reduce congestion and address environmental impacts resulting from the growth of goods movement in California.
California Air Resources Board (ARB)
Is a department within Cal/EPA. Sets and enforces emission standards for motor vehicles, fuels and consumer products.
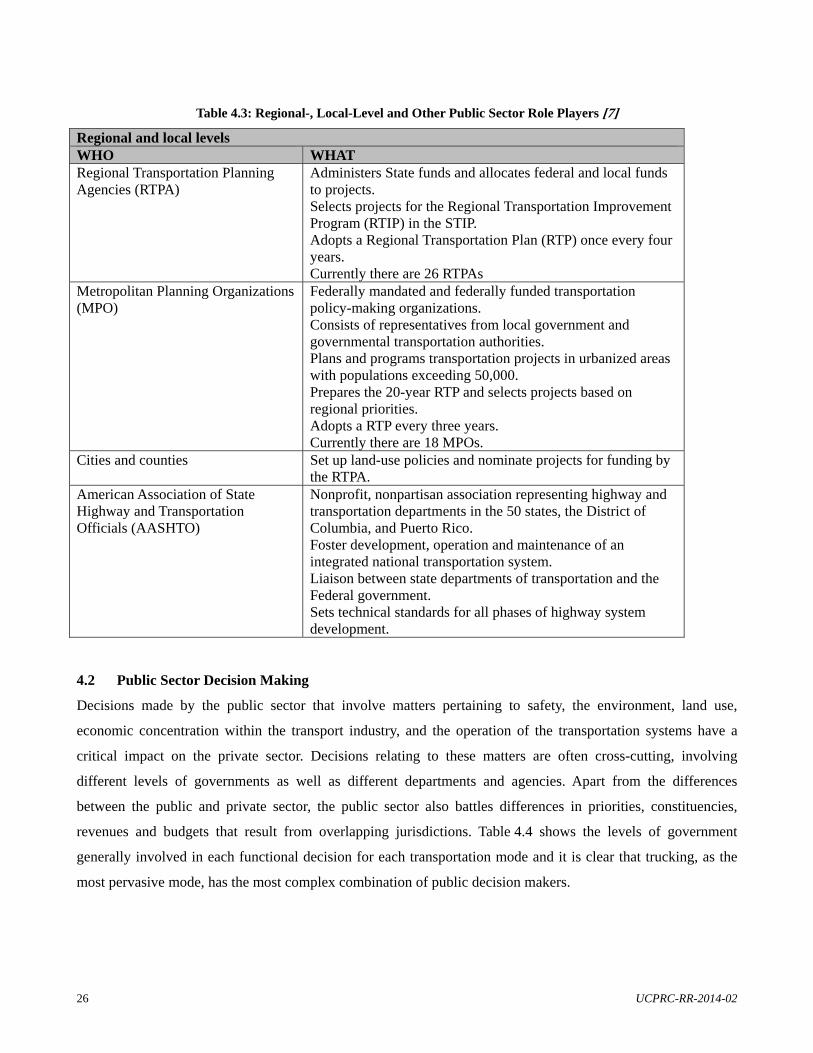
26 UCPRC-RR-2014-02
Table 4.3: Regional-, Local-Level and Other Public Sector Role Players [7]
Regional and local levels WHO WHAT Regional Transportation Planning Agencies (RTPA)
Administers State funds and allocates federal and local funds to projects. Selects projects for the Regional Transportation Improvement Program (RTIP) in the STIP. Adopts a Regional Transportation Plan (RTP) once every four years. Currently there are 26 RTPAs
Metropolitan Planning Organizations (MPO)
Federally mandated and federally funded transportation policy-making organizations. Consists of representatives from local government and governmental transportation authorities. Plans and programs transportation projects in urbanized areas with populations exceeding 50,000. Prepares the 20-year RTP and selects projects based on regional priorities. Adopts a RTP every three years. Currently there are 18 MPOs.
Cities and counties Set up land-use policies and nominate projects for funding by the RTPA.
American Association of State Highway and Transportation Officials (AASHTO)
Nonprofit, nonpartisan association representing highway and transportation departments in the 50 states, the District of Columbia, and Puerto Rico. Foster development, operation and maintenance of an integrated national transportation system. Liaison between state departments of transportation and the Federal government. Sets technical standards for all phases of highway system development.
4.2 Public Sector Decision Making
Decisions made by the public sector that involve matters pertaining to safety, the environment, land use,
economic concentration within the transport industry, and the operation of the transportation systems have a
critical impact on the private sector. Decisions relating to these matters are often cross-cutting, involving
different levels of governments as well as different departments and agencies. Apart from the differences
between the public and private sector, the public sector also battles differences in priorities, constituencies,
revenues and budgets that result from overlapping jurisdictions. Table 4.4 shows the levels of government
generally involved in each functional decision for each transportation mode and it is clear that trucking, as the
most pervasive mode, has the most complex combination of public decision makers.
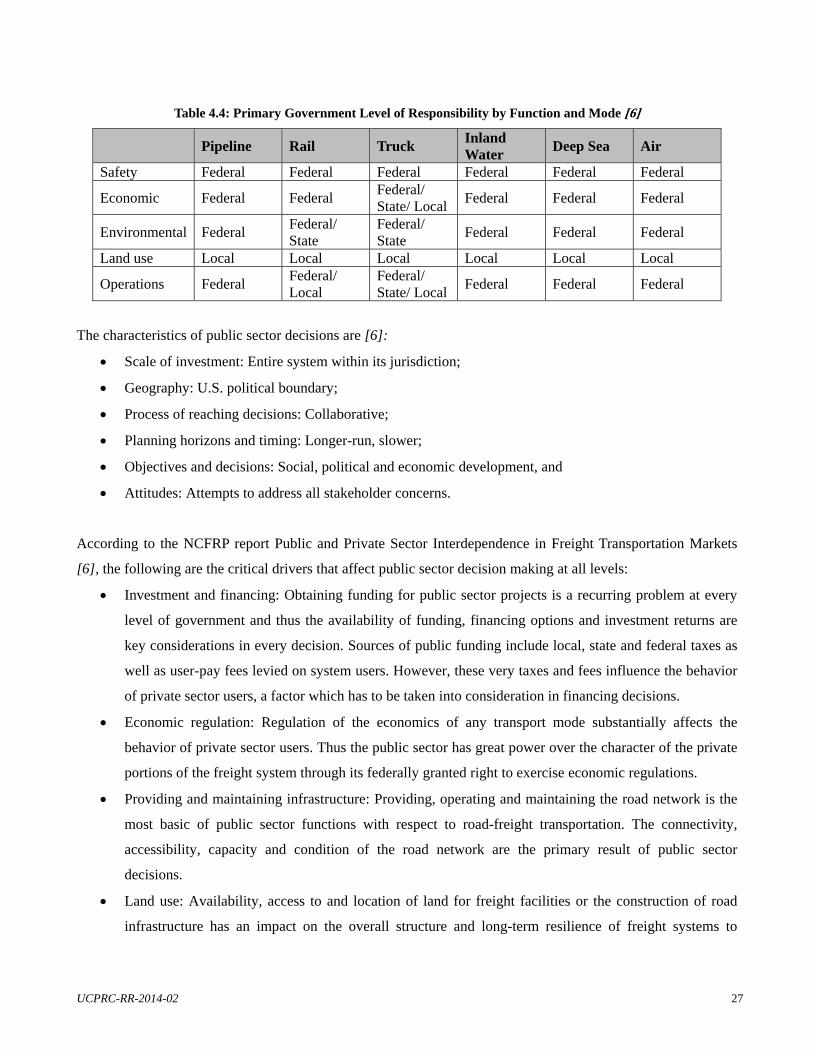
UCPRC-RR-2014-02 27
Table 4.4: Primary Government Level of Responsibility by Function and Mode [6]
Pipeline Rail Truck Inland Water
Deep Sea Air
Safety Federal Federal Federal Federal Federal Federal
Economic Federal Federal Federal/ State/ Local
Federal Federal Federal
Environmental Federal Federal/ State
Federal/ State
Federal Federal Federal
Land use Local Local Local Local Local Local
Operations Federal Federal/ Local
Federal/ State/ Local
Federal Federal Federal
The characteristics of public sector decisions are [6]:
Scale of investment: Entire system within its jurisdiction;
Geography: U.S. political boundary;
Process of reaching decisions: Collaborative;
Planning horizons and timing: Longer-run, slower;
Objectives and decisions: Social, political and economic development, and
Attitudes: Attempts to address all stakeholder concerns.
According to the NCFRP report Public and Private Sector Interdependence in Freight Transportation Markets
[6], the following are the critical drivers that affect public sector decision making at all levels:
Investment and financing: Obtaining funding for public sector projects is a recurring problem at every
level of government and thus the availability of funding, financing options and investment returns are
key considerations in every decision. Sources of public funding include local, state and federal taxes as
well as user-pay fees levied on system users. However, these very taxes and fees influence the behavior
of private sector users, a factor which has to be taken into consideration in financing decisions.
Economic regulation: Regulation of the economics of any transport mode substantially affects the
behavior of private sector users. Thus the public sector has great power over the character of the private
portions of the freight system through its federally granted right to exercise economic regulations.
Providing and maintaining infrastructure: Providing, operating and maintaining the road network is the
most basic of public sector functions with respect to road-freight transportation. The connectivity,
accessibility, capacity and condition of the road network are the primary result of public sector
decisions.
Land use: Availability, access to and location of land for freight facilities or the construction of road
infrastructure has an impact on the overall structure and long-term resilience of freight systems to
28 UCPRC-RR-2014-02
changes in freight demand volumes and patterns. However, public sector agencies have to keep in mind
the competing demands for land use for social infrastructure, housing, military use and environmental
preservation. Policy decisions regarding land use are made at a local level and have a considerable
impact in shaping the suitability of an area for freight business.
Environmental issues: Regulations, mitigation strategies, fees and taxes levied to protect the
environment all affect freight transportation and private sector planning. Environmental protection is a
top priority for the public sector, especially in California where the promotion of a Quality Environment
is one of the tenets of the California Transportation Plan.
Safety: Safety encompasses protection of both the worker and traveler, extending from construction and
operation of road infrastructure to the safety of the vehicles, trucks and other equipment used on the
road system. Safety regulations can impact the private sector operationally and financially, with the
power to influence operational behavior, even in switching between transport modes.
Operations: Operating and maintaining the road infrastructure affects both passenger and freight users
and thus even decisions relating to passenger traffic will inevitably affect freight users and vice versa.
The capacity and efficiency of the road network depends greatly on the public sector’s ability to
maintain that road network in a high performing condition.
Jobs and employment: Freight transportation creates and sustains a great many jobs in the U.S. and
California in particular, a fact not fully appreciated by the public sector decision makers. Care should be
taken to fully assess the impact of policy decisions and program development that encumbers the road-
freight industry in creating jobs and employing appropriate talent.
4.3 Strategic Plans Impacting Road-Freight in California
The most important strategic plans affecting road freight on a statewide scale are the California Transportation
Plan 2025 (updated 2006), the Goods Movement Action Plan (released 2007) and the California State Rail Plan
2007-08 to 2017-18 (updated 2008). On a regional level the 2010 California Regional Transportation Plan
Guidelines guide and inform the development of transport plans on an RTPA and MPO level. This section
provides a brief summary of the purpose and major outcomes of each plan as it is directly relevant to road-
freight transportation.
UCPRC-RR-2014-02 29
4.3.1 California Transportation Plan 2025 [7]
The latest version of the California Transportation Plan 2025 (CTP) was released in April 2006. It describes the
vision where:
California has a safe, sustainable, world-class transportation system that provides for the mobility and
accessibility of people, goods, services, and information through an integrated, multimodal network that
is developed through collaboration and achieves a Prosperous Economy, a Quality Environment, and
Social Equity.
The three underpinning tenets of a Prosperous Economy, Quality Environment and Social Equity underpin the
six transport goals. The plan took into account the major drivers of change in freight and passenger transport
needs over the next 20 years and then formulated 13 policies framed by the six goals to reach the vision stated
(Figure 4.2).
The CTP provides a common policy and strategic framework for decision makers on all levels of government. It
seeks to influence investments and decisions made by both the public and private sectors. The CTP reflects the
change brought about in transportation planning by Senate Bill 45 (Chapter 622, Statutes of 1997) which
delegated major planning and programming decisions to the RTPAs, requiring them to take a more active role in
providing and operating transport infrastructure in their regions.
A comprehensive public participation process was followed and rigorously documented in the development of
the CTP. What is notable is that there was no directed effort to engage with private companies. Although public
participation forums were “open to all” and representatives from industry organizations and private sector
companies were welcomed, there are no indications of efforts to go to the largest and most influential freight
companies to understand how transportation policy would impact their operations, nor efforts to engage with the
thousands of small business owners in their capacity as freight customers regarding the transportation plan.
However, it is unclear to what degree the CTP could actually impact private sector decision making as a policy
document. Typically, private sector decisions are impacted by concrete decisions such as infrastructure projects,
incentives, taxes or new regulations, not by policy documents or guidelines.
Mobility and accessibility are two recurring themes in the CTP. Mobility is the potential for movement, which in
freight terms means the capacity of infrastructure and the relative cost of transportation. Accessibility, in freight
terms, is the ability to move goods to a desired destination and is a function of distance, connectivity,
congestion, transportation options and cost factors. However, when discussed in the CTP the concepts of
mobility and accessibility are almost exclusively applied to passenger transport. While passenger transport is
indeed critical – both for a Prosperous Economy and Social Equity – freight transportation plays a
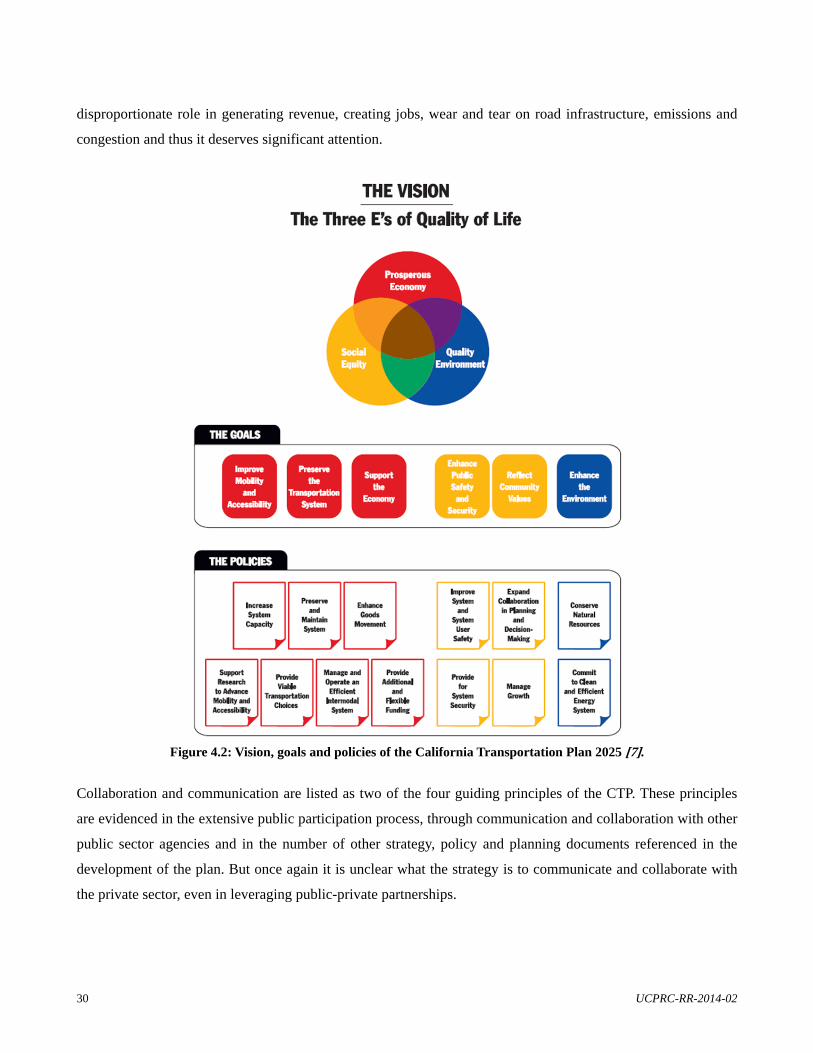
30 UCPRC-RR-2014-02
disproportionate role in generating revenue, creating jobs, wear and tear on road infrastructure, emissions and
congestion and thus it deserves significant attention.
Figure 4.2: Vision, goals and policies of the California Transportation Plan 2025 [7].
Collaboration and communication are listed as two of the four guiding principles of the CTP. These principles
are evidenced in the extensive public participation process, through communication and collaboration with other
public sector agencies and in the number of other strategy, policy and planning documents referenced in the
development of the plan. But once again it is unclear what the strategy is to communicate and collaborate with
the private sector, even in leveraging public-private partnerships.
UCPRC-RR-2014-02 31
The discussion on rural issues in the plan does, however, touch more directly on road-freight transportation.
Rural areas comprise 94 percent of the land and contain only 8 percent of California’s population, presenting the
difficulty of providing transportation to a sparsely and widely distributed population. Despite the negligible
freight demand generated by rural communities, these areas experience substantial freight movements due to the
importance of interregional trucking to California’s economy and the agricultural freight volumes generated in
these areas. These communities thus incur all the impacts of high-volume good movement without the adequate
financial and political support to mitigate the effects. The CTP discusses a number of strategies to mitigate the
impact of freight movement in rural areas and to increase the access of rural populations to essential services.
4.3.2 Goods Movement Action Plan [15]
The Goods Movement Action Plan (GMAP) presents a framework for action that aims to improve and expand
California’s goods movement industry and infrastructure in a manner which will:
Generate jobs;
Increase mobility and relieve traffic congestion;
Improve air quality and protect public health;
Enhance public and port safety, and
Improve California’s quality of life.
It includes a set of preliminary candidate actions specifically targeting five areas: operational improvements and
infrastructure additions, public health and environmental impact mitigation actions, community impact
mitigation and workforce development actions, and security and public safety improvement efforts. These
actions are founded on performance metrics. Appendix B tabulates those actions that would directly impact
road-freight systems in the four priority regions mentioned in Section 3.1.2.
4.3.3 California State Rail Plan 2007-08 to 2017-18 [9]
The California State Rail Plan (CSRP) is a government-mandated document that takes a ten-year view of
passenger and freight rail in California. With regards to freight rail, the document presents policy
recommendations and goals for the maintenance, preservation, improvement, and funding of the system.
Throughout the freight rail section of the document it is repeatedly highlighted that investment in freight rail –
expanding capacity and improving performance – will have a massive effect on easing the pressure of adding
more freight to the state’s highway system. Apart from the effect freight rail has on road freight by means of
absorbing additional volumes, the strong emphasis on intermodal solutions would also affect road-freight
systems. Successful implementation of long-haul intermodal solutions (Section 3.3.1) on major corridors such as
32 UCPRC-RR-2014-02
the I-5 would reduce the number on ton-miles immensely, consequently reducing emissions and overall
transportation costs. However, the feasibility of such a solution depends on the performance of rail, the
efficiency and location of intermodal terminals and the market factors (particularly costs) that would make rail
more favorable. Short-haul intermodal services (Section 3.3.2) would have a decided effect in reducing
congestion along metropolitan corridors. The plan explains, however, that for distances below 500 miles it is not
economically viable for the railroads to implement a short-haul service and thus government subsidies may be
required. In addition, short-haul services require ideally positioned intermodal yards with easy access to truck
and rail and proximity to major shippers as well as the operation of night trains if it is to be a true alternative for
trucking.
4.3.4 SJV Interregional Goods Movement Plan [16]
The San Joaquin Valley (SJV) consists of eight counties namely Kern, Kings, Tulare, Fresno, Madera, Merced,
Stanislaus, and San Joaquin. Historically, the SJV has been California’s geographic and agricultural center as
well as its main source of exports. In fact, SJV has been the nation’s number one agricultural producer for
decades. More recently, it has also become the Californian region with the fastest growing population and is
playing an increasing role in the burgeoning logistics and distribution sector. Growth in the freight sector in
general and the transformation and growth of SJV industries necessitated a deliberate, integrated and proactive
plan to ensure that transport infrastructure supports future goods movement needs.
The SJV Interregional Goods Movement Plan (“the SJV plan”) contains 49 prioritized projects that emanated
from in-depth research regarding SJV’s current and future goods movement demands and extensive interaction
with private stakeholders. In fact, the success and relevance of this plan is owed greatly to its deliberate and
continuous inclusion of the private sector in its research and planning processes. Involving the private sector is
listed as one of the SJV plan’s five guiding principles and they state:
Shippers, receivers and transportation providers will adapt to future transportation and land-use conditions,
planned or unplanned. How, where, and, how well they adapt will depend on how and when they are brought
into the planning process. In the stakeholder meetings for this project, consistent with consultant team
experience elsewhere, the quality and insightfulness of the goods movement strategies offered improved as
direct public-private communications increased. [16].
UCPRC-RR-2014-02 33
The 49 prioritized projects are grouped into seven categories:
Regional North-South highway capacity (13 projects);
East-West connectors (14 projects);
Local “Last-Mile” connectors (3 projects);
Modal capacity for expected flows (5 projects);
Contingent economic development opportunities (6 projects);
Inland ports (2 projects), and
Strategic programs (6 projects).
Twenty-one of the 49 projects entail the widening of sections of highways while six propose the construction of
new highway segments or upgrade of existing segments.
4.3.5 Central Coast California Commercial Flows Study [17]
The California Central Coast region comprises five counties, namely Santa Barbara, San Luis Obispo, Monterey,
Santa Cruz and San Benito. The commercial flows study is a succinct study that combines analysis of regional
freight flows with insight from a regional industries analysis and extensive private and public sector engagement
to identify county-level freight issues.
Major freight growth is expected across these five counties, with a growing economy and burgeoning population
being the main growth drivers. Agriculture, Manufacturing and Truck Transportation/Warehousing are the
primary goods movement dependent sectors in the five counties. The Freight Action Strategy Taskforce (FAST)
was formed alongside this study, and suggestions regarding its purpose and organizational setup are made. The
suggested freight priorities made by the study are:
Enhanced connections to the California Central Valley;
New thinking on truck parking solutions;
Improved intermodal rail opportunities;
Maintaining focus on improving/maintaining U.S. 101 for freight movements;
Developing and implementing a framework to evaluate regional freight issues/projects objectively;
Potential freight system performance metrics;
Regionwide truck count and classification program;
Structure and objectives for FAST, and
Strategic partnerships with regional trading partners.
The study also discusses, at length, potential funding mechanisms. Road congestion as well as congestion at
truck parking areas and logistics facilities are prevalent challenges in these counties.
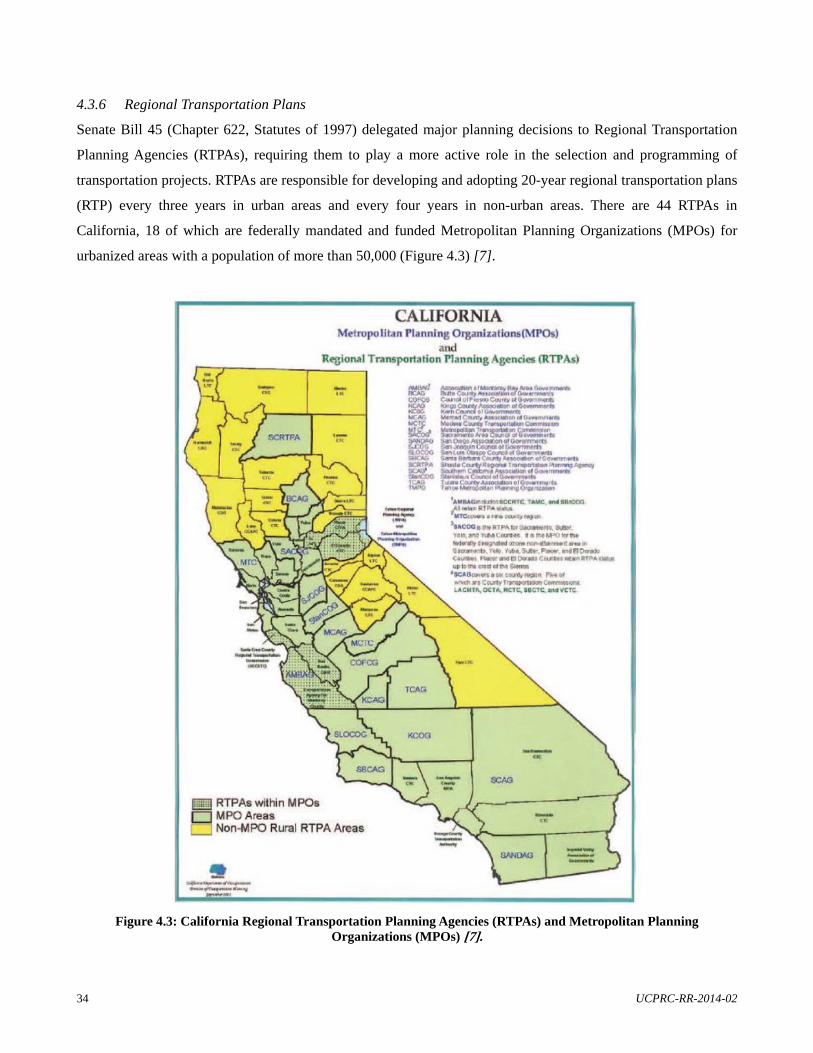
34 UCPRC-RR-2014-02
4.3.6 Regional Transportation Plans
Senate Bill 45 (Chapter 622, Statutes of 1997) delegated major planning decisions to Regional Transportation
Planning Agencies (RTPAs), requiring them to play a more active role in the selection and programming of
transportation projects. RTPAs are responsible for developing and adopting 20-year regional transportation plans
(RTP) every three years in urban areas and every four years in non-urban areas. There are 44 RTPAs in
California, 18 of which are federally mandated and funded Metropolitan Planning Organizations (MPOs) for
urbanized areas with a population of more than 50,000 (Figure 4.3) [7].
Figure 4.3: California Regional Transportation Planning Agencies (RTPAs) and Metropolitan Planning Organizations (MPOs) [7].
UCPRC-RR-2014-02 35
Unlike the California Transportation Plan, the RTPs identify specific projects to be executed. The California
Transportation Commission cannot program projects that are not consistent with an adopted RTP. The 2010
Regional Transportation Planning Guidelines [18] adopted by the California Transportation Commission gives
explicit instruction and comprehensive guidance in the development of RTPs. Of particular relevance to this
study are the guidelines related to Modeling (Chapter 3) and RTP Consultation and Coordination (Chapter 4).
The guidelines classify levels of modeling that are required for different types of RTPAs. These levels of
modeling differ in their degree of rigor and scope, with more in-depth and inclusive models required for
populous urban areas and areas with high traffic density (passenger and freight movement). The guidelines
present an extensive discussion of the merits of using activity-based models instead of the state-of-practice
three- and four-step models. Activity-based models capture more accurately the behavior of transport users than
current state-of-practice models, resulting in more representative and intuitive modeling to support decisions.
However, developing activity-based models requires a comprehensive understanding of the behavior of the
transport users and in most cases can be more data-intensive that typical modeling techniques. The RTP
guidelines recommend activity-based models for certain MPOs but encourage all RTPAs to move towards
building activity-based models in the next few years as it is anticipated to become the mandatory modeling
technique.
Although the move towards activity-based models is encouraging, the focus is still primarily on modeling
passenger transport. The recent study by SHRP2 on Freight Demand Modeling and Data Improvement [8]
explains why neglecting to develop tailored freight models leads to vastly inaccurate and unrepresentative
modeling results which, when used in decision making, lead to grossly one-sided transport decisions.
Developing activity-based freight models requires a deep and intuitive understanding of freight agents (private
sector companies) and their behavior and responses. Therefore, understanding private sector decision-making on
a grassroots level is a prerequisite in the move towards activity-based freight models.
The RTP guidelines are extensive on the topics of consultation and coordination. Relevant to this current
discussion is the fact that Private Sector Involvement is now a non-negotiable element of RTPs. The guidelines
state specifically:
…[A]n RTP that does not include the “Private Sector” in the planning process is not a viable plan. The
impact of the private sector on the transportation system is just too significant not to be included and
documented in the RTP process. Unfortunately, in many plans, the private sector is not identified as a
planning partner. Where addressed, goods movement is discussed in the abstract with minimal long-
range assumptions identified or assessed. MPOs/RTPAs should take necessary actions to ensure major
36 UCPRC-RR-2014-02
trucking firms, large employers and business organizations are formally invited to participate in the
preparation of the RTP. The MPO/RTPA should strive to include any major long-range plans of these
organizations that may have an impact on the regional transportation system. The purpose is to provide
private sector transportation providers a process of communication and involvement into the region’s
transportation planning process. [18].
Private sector involvement in the development of an RTP is a federal requirement under Title 23 USC Part 134
(g)(4), Title 23 USC Section 135(e) and Title 23 CFR Part 450.316 (a).
The next section of this report summarizes key points relating to road-freight planning in the regional areas
relevant to these two companies’ operations.
4.3.6.1 Regional Transportation Plan 2012 – 2035 [19]
The Southern California Association of Governments (SCAG) covers a six county region:
Imperial County Transportation Commission (ICTC);
Los Angeles County Metropolitan Transport Association (LACMTA);
Orange County Transport Authority (OCTA);
Riverside County Transport Commission;
San Bernardino Associated Governments, and
Ventura County Transportation Commission (VCTC).
The vision on goods movement is:
A world-class, coordinated Southern California goods movement system that accommodates growth in
the throughput of freight to the region and nation in ways that support the region’s economic vitality,
attainment of clean air standards, and the quality of life for our communities.
The economic lifeblood of the SCAG region is international trade and the related freight activities with
1.15 billion tons of cargo valued at $2 trillion moving across the region’s system. The region hosts one of the
largest clusters of logistics activities in North America with warehousing and distribution services attracting a
great amount of trans-shipment activities. Trucking access is particularly vital to the warehousing and
distribution activities in the region.
Following the completion of the 2008 RTP, SCAG put in place a comprehensive Regional Goods Movement
Plan. Its purpose was to develop a multimodal regional freight plan that encompasses existing strategies and
projects and newly developed regional initiatives. Two areas of specific relevance to this study are the potential
UCPRC-RR-2014-02 37
implementation of truck-only lanes on major corridors and investment into bottleneck relief strategies at
identified truck bottlenecks. Bottleneck relief strategies include ramp metering, extension of merging lanes,
ramp and interchange improvements, capacity improvements, and auxiliary lane additions.
4.3.6.2 Transportation 2035 Plan for the San Francisco Bay Area [20]
Freight-related initiatives of the RTP included findings from the MTC’s “2004 Regional Goods Movement
Study” as described in the Plan. In particular, land-use constraints will see approximately 65 percent of
industrial activities moving inland to the San Joaquin Valley which would result in displacement of 87,000
goods movement-related jobs, 300,000 more truck-miles traveled on regional routes, a 2 percent increase in
emissions and $400 million-per-day increase in transportation costs to businesses. This shift in industrial activity
is inevitable, and specific strategies are required to mitigate the effects.
Another strongly freight-focused initiative of the RTP is the expansion and performance improvement of the two
major freight corridors namely the Central Corridor (running from the Port of Oakland to Sacramento and across
the Sierra Nevada to Chicago) and the Altamont Corridor (running from the Port of Oakland through the San
Joaquin and Central Valleys).
4.3.6.3 Metropolitan Transportation Plan 2035 [21]
The Sacramento region depends greatly on the agriculture, manufacturing and distribution sectors. The
geographic dispersion of the region’s agricultural activity is one reason for the relatively large percentage of
freight moved by truck only (90.6 percent).
The agricultural economy poses unique freight challenges. Agricultural freight is transported over rural roads,
highways and freeways. Poor road condition and geographic limitations hinder transport on rural roads while
congestion hampers travel on the highways and freeways. The RTP regards it a priority to maintain a robust
network of routes that serve farms, processing facilities and distribution centers, and to capitalize on agricultural
export using multimodal solutions.
Another noteworthy topic mentioned in the RTP is the lack of private sector information. The needs of the
freight transportation industry are largely unknown to planners and policy-makers, which makes it difficult to
identify critical freight projects.
38 UCPRC-RR-2014-02
4.3.6.4 Regional Transportation Plan 2035 [22]
The operations of the companies in this pilot study extend beyond the borders of California, particularly to
Nevada. The RTPs of the City of Reno, the City of Sparks and Washoe County are thus also considered.
Roads in this region experience a lot of intermodal and manufacturing freight-related transport. Industrial roads
accommodate significant freight movement through the Reno-Sparks area and to and from major industrial areas
and intermodal and air-cargo terminals. A number of highway expansion and improvement projects are planned
for key freight routes moving through northern Nevada.
4.3.7 Merced County Overall Work Program [23]
Merced County also depends heavily on an agricultural economy which explains, in part, its heavy reliance on
trucking (94 percent) as a mode of transport. A key concern for the county is the impact of trucks on local streets
and communities – particularly the accelerated deterioration caused by heavy trucks. The Overall Work Program
strongly encourages those initiatives that seek intermodal solutions or to shift bulk agricultural freight from road
to rail.
4.3.8 Colusa County Overall Work Program [24]
Colusa County is a rural county that depends primarily on its agricultural economy. Its highway system is thus
the primary means for accessibility and mobility. Specific logistics-related strategies include enhancing the
integration and connectivity between transport modes (presumably road and rail for freight) and promoting
efficient system management and operation to preserve the existing transportation system.
4.4 Decision Support for Freight Planning
Transport modeling is the essential tool for providing decision support during planning, and significant
resources are spent on federal, state and regional levels to build transport models that inform transport planning
processes. Because of gradual movement away from the gravity-based, four-step model, it is anticipated that the
activity-based modeling paradigm [8, 18] will become the new state-of-practice in the next few years. Activity-
based models are based on an understanding of the behavior of transport agents (passengers, commercial
vehicles, and public transport vehicles) and thus are presumed to represent reality more accurately.
Another trend in transportation modeling is an increased focus on freight modeling. The primary focus in
transport modeling over the last few decades has been passenger transport, with freight transport added to
models by use of indiscriminate multiplication factors or “background noise.” It has now become clear that this
method of “adding freight” to transport models is hopelessly inadequate [8]. Freight vehicles contribute
UCPRC-RR-2014-02 39
disproportionately to congestion, emissions and road deterioration and therefore deserve disproportionately
more attention, especially in a trade-dependent, truck-reliant economy such as California’s. But freight vehicles
do not behave like passenger vehicles and they are driven by an entirely different set of operational decisions,
thus they cannot be modeled using the same rules. Two prominent barriers stand between the current state-of-
practice in freight modeling and a focused, activity-based freight modeling paradigm: a lack of understanding of
agent behavior and the need to obtain data.
Understanding agent behavior means that a modeler must understand the underlying market forces and supply-
chain trends that drive freight transport-related decisions. This requires a deep appreciation of the private sector,
something that is lacking among public sector transport modelers and policy makers [8]. The public sector will
have to work with the private sector to develop the insight required to develop these models. This collaboration
could take the form of case studies [25], job exchange or internship programs, or even focused private sector
work groups.
Obtaining data is a frequently cited hurdle in most transport modeling activities, especially with regard to freight
modeling. The data required for freight models reside within the private companies that move freight. Much data
regarding origin-destination pairs, loading and vehicle type can be deduced from public monitoring of
infrastructure such as traffic loops, weighbridges, digital imaging and even manual traffic counts. But the most
accurate source of detailed data regarding origin-destination pairs, loading, truck type, industry and even
specific commodities cannot be collected without private companies’ permission and cooperation. Cost data
especially can be near impossible to obtain from the private sector, despite its importance and usefulness to
freight modeling [26]. Furthermore, current public data collection mechanisms are not succeeding in producing
datasets suitable for accurate modeling on a regional or local level [8, 26].
Moving towards fully-fledged activity-based freight models is both necessary and inevitable, but private sector
cooperation is essential to cultivate an adequate understanding of freight agents and to provide the necessary
data. This is one specific area where the chasm between the public and private sector needs to be bridged as a
matter of priority.

40 UCPRC-RR-2014-02
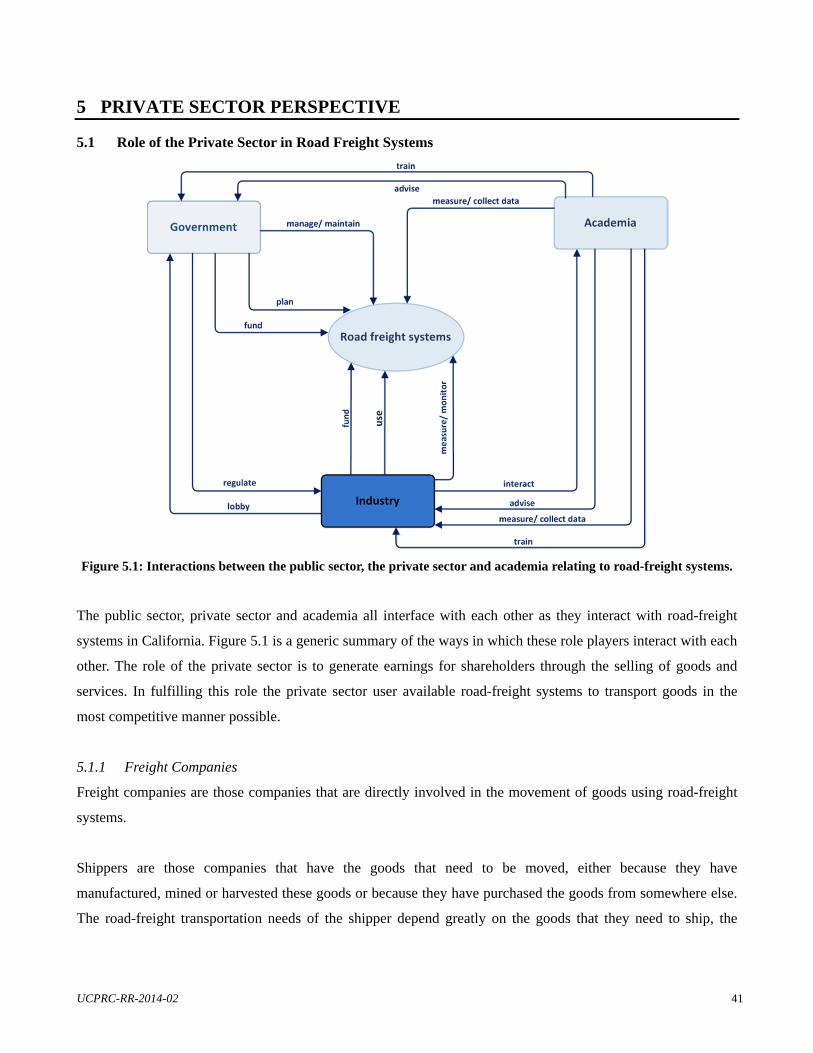
UCPRC-RR-2014-02 41
5 PRIVATE SECTOR PERSPECTIVE
5.1 Role of the Private Sector in Road Freight Systems
Figure 5.1: Interactions between the public sector, the private sector and academia relating to road-freight systems.
The public sector, private sector and academia all interface with each other as they interact with road-freight
systems in California. Figure 5.1 is a generic summary of the ways in which these role players interact with each
other. The role of the private sector is to generate earnings for shareholders through the selling of goods and
services. In fulfilling this role the private sector user available road-freight systems to transport goods in the
most competitive manner possible.
5.1.1 Freight Companies
Freight companies are those companies that are directly involved in the movement of goods using road-freight
systems.
Shippers are those companies that have the goods that need to be moved, either because they have
manufactured, mined or harvested these goods or because they have purchased the goods from somewhere else.
The road-freight transportation needs of the shipper depend greatly on the goods that they need to ship, the
42 UCPRC-RR-2014-02
timeframe within which they need to ship, and the customer they need to ship to. In California most shippers are
either in the agricultural, manufacturing or retail industries.
A shipper may have its own in-house truck fleet (bought or leased) with which to transport its goods or the
transportation function may be outsourced to a motor-carrier. Asset-based motor-carriers (carriers), in the
simplest sense, are companies that own a fleet of trucks and generate revenue solely from transporting other
companies’ goods from point A to point B.
Third-party logistics companies (3PL) are typically carrier companies that offer shippers a more extensive range
of logistics services. This may include the complete management of the transportation function, warehousing
and distribution and even Customs brokerage. The trend is for 3PLs to provide end-to-end service offerings so
that the shipper only requires one company to execute all the logistics functions from the factory gate to the
customer’s door.
Freight forwarders are typically non-asset companies (i.e., they do not own transportation fleets) that coordinate
all logistics related to international shipping on the shipper’s behalf. However, in the quest for end-to-end
services, the boundary lines between freight forwarders and 3PLs are blurring.
With California being an international gateway and trade hub for North America, the motor-carrier, 3PL and
freight forwarding industries are cornerstones of the Californian economy.
5.1.2 Support Services
Support services are those companies that enhance the performance of shippers, carriers, 3PLs and freight
forwarders by providing technology solutions or knowledge services. These are typically management
consultants, financial consultants, engineering consultants or software vendors. California, being a logistics hub,
has no shortage of companies offering these support services.
5.1.3 Industry Associations
The combined interests of the private sector are usually represented by industry organizations that communicate
and collaborate with, and often lobby against, the public sector on behalf of a group of companies.
UCPRC-RR-2014-02 43
The American Trucking Association (ATA) is a national affiliation of state trucking associations and its goals
are:
…to serve and represent the interests of the trucking industry with one united voice; to influence in a
positive manner federal and state governmental actions; to advance the trucking industry's image,
efficiency, competitiveness, and profitability; to provide educational programs and industry research; to
promote safety and security on the nation's highways and among drivers; and to strive for a healthy
business environment.
Similarly, the California Trucking Association (CTA):
…promotes leadership in the California motor carrier industry, advocates sound transportation policies
to all levels of government, and works to maintain a safe, environmentally responsible and efficient
California transportation goods movement system.
The American Road & Transportation Builders Association (ARTBA) states that its primary goal is:
…to aggressively grow and protect transportation infrastructure investment to meet the public and
business demand for safe and efficient travel.
Organizations representing specific industries, such as agriculture, automotive or pharmaceuticals, also engage
the public sector on matters pertaining to freight transport.
Labor unions are similar to industry associations in that they represent the interests of a group of employees to
their private sector employers and to public sector agencies.
5.2 Private Sector Decision Making
Private sector decisions are ultimately made to allow to survival in a competitive marketplace, to generate a
return for their owners, and to satisfy customers, all while operating under the law. Key characteristics of private
sector decisions are [6]:
Scale of investment: One company at a time but international;
Geography: Global market;
Process of reaching decisions: Hierarchical;
Planning horizons and timing: Shorter-run, quicker;
Objectives and decisions: Increase shareholder value through higher profits, and
Attitudes: Satisfy owners, customers and employees.
44 UCPRC-RR-2014-02
There are three levels of decision making in the private sector: strategic, operational and tactical. Strategic
decisions have long-term impacts and involve financial investments and long-term commitments. Examples
would be facility location decisions or a decision to add a new product to an existing product range. Operational
decisions are short-to-medium-term and include decisions such as whether or not to lease additional trucks to
increase fleet capacity. Tactical decisions are the daily execution decisions such as planning daily deliveries,
scheduling trucks and drivers or choosing a specific route for a specific shipment.
Outsourcing logistics activities is becoming increasingly prevalent in the freight movement industry
(Section 5.3.1). The third parties that handle outsourced freight often combine freight from different shippers to
achieve economies of scale. Decisions such as the route taken or delivery times are no longer exclusively in the
hands of the shipper. This means that the locus of decision-making control can be far removed from the physical
goods and transportation networks, and that local and regional public sector decisions are actually impacting
private sector decisions made far away from that geographic area. The same can be said of multinational
companies where the private sector decisions that influence freight movement in California are actually made on
another continent.
According to the NCFRP report Public and Private Sector Interdependence in Freight Transportation
Markets [6], the following are the critical drivers that affect private sector decision making at all levels:
Market and shipper demand: Ultimately, carriers will go where the business is. This means that all their
decisions regarding workers, equipment, technology and facilities are made based on where and when
the shipper wants the carrier to pick up the freight. Freight transportation is a derived activity from
extraction (mining and farming) and beneficiation (manufacturing) processes, so trends in the economy
dictate carrier decisions.
Financial performance metrics: Return on investment (ROI) and profitability are the primary
considerations for private sector decisions. Companies are very aware of the cost implications of each
activity. Market share and revenue growth are also strategic performance criteria.
Efficient operational management: Daily decisions relating to volumes, schedules and costs impact the
bottom line and company competitiveness.
Regulatory issues: Compliance with regulations in a way that minimizes disruption to operations and
costs influences decisions on all levels.
UCPRC-RR-2014-02 45
5.3 Emergent Logistics Practices
Logistics operations are becoming more vulnerable and more sensitive at the same time. While consumers
demand shorter lead times, lower costs and impeccable reliability, logistics chains are becoming longer and
more complex, and the cost drivers more volatile. Between 2009 and 2011, economic losses from supply chain
disruptions increased by 465 percent [27].
There are three pertinent logistics trends that have specific bearing on road-freight logistics in California:
outsourcing, intermodal transport and inventory-pull systems.
5.3.1 Outsourcing Trends
The 2013 Third-Party Logistics (3PL) Study [27], a survey of the global 3PL industry, shows that despite a
challenging business environment, aggregate global revenues for the 3PL sector continue to rise. The study also
reveals that 65 percent of shippers are increasing their use of outsourced logistics services as compared to 22
percent who are re-integrating logistics services into their own operations. Both shippers and 3PL providers
believe they have successful relationships that result in increased benefits for both shippers and 3PL providers.
Some of the benefits include a reduction in logistics costs, inventory costs and logistical fixed assets.
Maintaining a competitive advantage in logistics is requiring disruptive innovation. Shippers are realizing this
and 3PL providers will have to stay ahead of the curve to satisfy their customers. Marginal savings on transport
costs and lead times or slight increases in reliability are no longer enough to be the best-in-class. IT capabilities
and real-time information are two levers that could enable disruptive innovation. However, the survey shows
that there is a long-standing gap between the importance shippers attribute to 3PL IT capabilities and their
satisfaction with the performance of current IT capabilities offered by 3PLs. Shippers want 3PLs to offer
comprehensive and easily integrated solutions.
Big data is another emerging concept in the supply chain world. With huge volumes of data being generated
from increasingly sophisticated supply chain monitoring systems, the challenge is converting this data into
something of value to businesses. In order to take full advantage of big data, 3PLs must have competent data
managers, provide specialized tools, facilitate analysis and adopt a knowledge-centric approach to managing
their relationships with shippers.
The proliferation of data in the private sector provides an ideal opportunity for the public sector to harness the
data required for accurate freight modeling and planning. The challenge is building the bridge of trust between
the public and private sector to enable the data exchange.
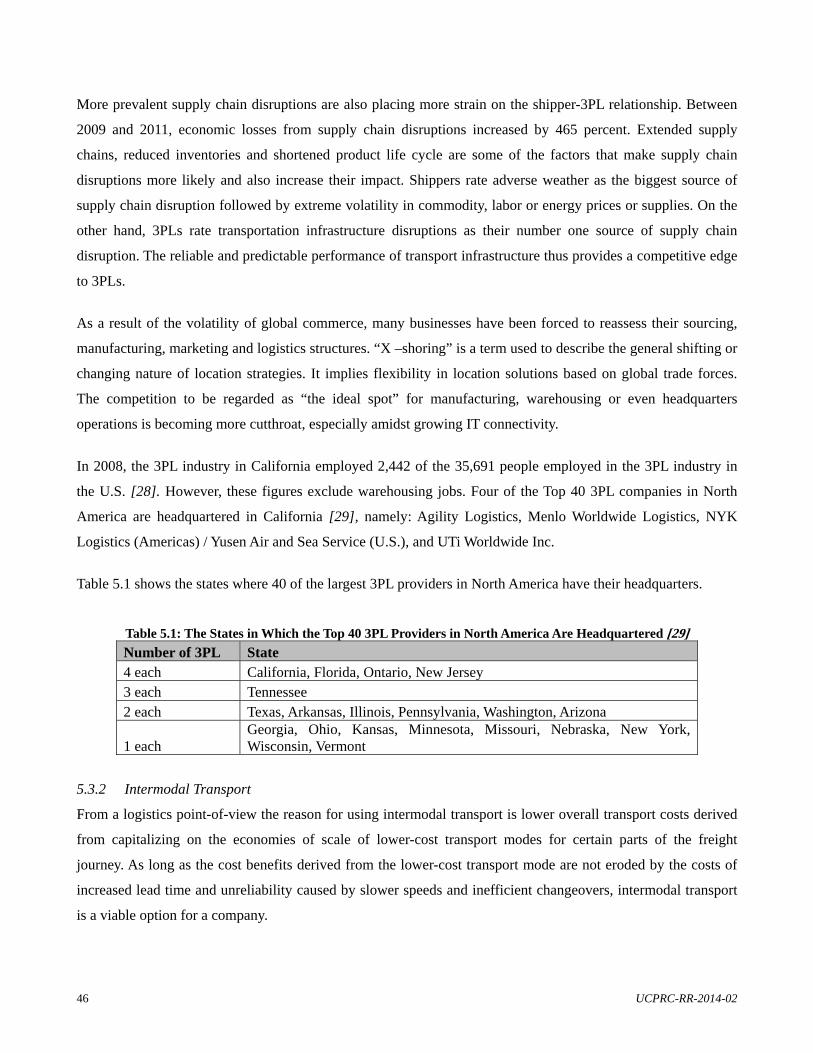
46 UCPRC-RR-2014-02
More prevalent supply chain disruptions are also placing more strain on the shipper-3PL relationship. Between
2009 and 2011, economic losses from supply chain disruptions increased by 465 percent. Extended supply
chains, reduced inventories and shortened product life cycle are some of the factors that make supply chain
disruptions more likely and also increase their impact. Shippers rate adverse weather as the biggest source of
supply chain disruption followed by extreme volatility in commodity, labor or energy prices or supplies. On the
other hand, 3PLs rate transportation infrastructure disruptions as their number one source of supply chain
disruption. The reliable and predictable performance of transport infrastructure thus provides a competitive edge
to 3PLs.
As a result of the volatility of global commerce, many businesses have been forced to reassess their sourcing,
manufacturing, marketing and logistics structures. “X –shoring” is a term used to describe the general shifting or
changing nature of location strategies. It implies flexibility in location solutions based on global trade forces.
The competition to be regarded as “the ideal spot” for manufacturing, warehousing or even headquarters
operations is becoming more cutthroat, especially amidst growing IT connectivity.
In 2008, the 3PL industry in California employed 2,442 of the 35,691 people employed in the 3PL industry in
the U.S. [28]. However, these figures exclude warehousing jobs. Four of the Top 40 3PL companies in North
America are headquartered in California [29], namely: Agility Logistics, Menlo Worldwide Logistics, NYK
Logistics (Americas) / Yusen Air and Sea Service (U.S.), and UTi Worldwide Inc.
Table 5.1 shows the states where 40 of the largest 3PL providers in North America have their headquarters.
Table 5.1: The States in Which the Top 40 3PL Providers in North America Are Headquartered [29] Number of 3PL State 4 each California, Florida, Ontario, New Jersey 3 each Tennessee 2 each Texas, Arkansas, Illinois, Pennsylvania, Washington, Arizona
1 each Georgia, Ohio, Kansas, Minnesota, Missouri, Nebraska, New York, Wisconsin, Vermont
5.3.2 Intermodal Transport
From a logistics point-of-view the reason for using intermodal transport is lower overall transport costs derived
from capitalizing on the economies of scale of lower-cost transport modes for certain parts of the freight
journey. As long as the cost benefits derived from the lower-cost transport mode are not eroded by the costs of
increased lead time and unreliability caused by slower speeds and inefficient changeovers, intermodal transport
is a viable option for a company.
UCPRC-RR-2014-02 47
For California, the drive towards intermodal road-rail solutions is critical. From a public sector perspective it
holds the benefits of reduced congestion, reduced emissions and reduced overall transport costs. But as long as
these benefits come at the expense of the private sector’s competitiveness, there will be no buy-in from
companies.
An intermodal road-rail solution is when a standardized intermodal container, or even a standardized truck
trailer, is loaded onto a railcar. This can be done in a variety of ways:
Container-on-Flatcar (COFC): Standard intermodal containers are placed directly on standard flatcars;
Trailer-on-Flatcar (TOFC): Over-the-road trailers or containers mounted on truck chassis are placed
directly on flatcars, and
Double-Stack Containers: Two containers on top of each other in a special low profile well car.
In 2000, 51 percent of intermodal traffic in California consisted of international containers, 23 percent were
domestic containers and 26 percent truck trailers [9]. Intermodal road-rail services typically handle higher-
value, lower-weight commodities than other types of train services. Dedicated intermodal services offer faster
speeds, higher train frequency, better schedule reliability and better visibility en route than other rail services
making it a competitive force against door-to-door trucking for distances exceeding 500 miles. However, the
intermodal rail service is priced slightly higher than other rail services. Section 3.3.1 and Section 3.3.2 discuss
the specific road-rail intermodal services that would greatly benefit California.
Successful intermodal rail service depends on strong partnerships between the railroads, trucking companies,
seaports and other logistics service providers. However, experience shows that it is not just a simple economic
decision that lies between door-to-door trucking and road-rail intermodal. It seems that there are more
intangible, qualitative decision factors that keep the private sector from shifting, but it is not quite certain what
those factors are [30].
5.3.3 Inventory-Pull Systems
Keeping inventory costs money. Not only is there capital tied up in inventory on the shelf (incurring a carrying
cost equivalent to what that capital could have earned invested elsewhere) but there are operational costs such as
insurance, rental costs, property taxes, wages and utilities required to keep a warehouse running. There is,
however, a reason for having inventory spread throughout a supply chain. Inventory is a buffer against
uncertainty in supply and demand as well as uncertainty in the transport lead time. The less inventory kept on-
hand, the more frequently deliveries have to be made to replenish that inventory and the more reliable those
deliveries must be. Reduced inventory increases demand for transportation. With market factors the way they
48 UCPRC-RR-2014-02
are currently, reducing inventory and increasing transport has increased customer service and reduced overall
logistics costs. Aside from the economic benefit, shortening product life-cycles in many high-value and retail
supply chains increases the risk of being left with obsolete stock if excessive inventory levels are maintained.
Inventory management has moved from an inventory-push model to an inventory-pull model. In the push model
raw materials are pushed from the supplier to the manufacturer where products are manufactured-to-stock and
pushed onto the retailer in large shipments which are then sold to the customer. Along the supply chain there are
warehouses that act as storage buffers for the excessive inventory. In a pull system, a customer purchase signals
to the supply chain that product has to be replenished and the product is pulled from the nearest location –
whether that be from the distribution center or from the manufacturer who manufactures-to-order. The push
model places a premium on fixed assets such as warehousing space and pallets of inventory, while the pull
system places a premium on timeliness, accurate real-time information and efficient transport and distribution
activities.
Inventory-pull systems have also been called just-in-time systems and are becoming more prevalent, especially
in time sensitive high-value supply chains. In these supply chains, the role of the warehouse has also evolved.
The role of the warehouse has become one of intermediary instead of stockpile: consolidating and
deconsolidating shipments, conducting last-minute value-added processes and, ultimately, being geared toward
moving goods through the supply chain as quickly as possible. Such warehouses are more aptly referred to as
distribution centers.
Considering the essential role these distribution centers now play in high-performing supply chains, it is
understandable that facility location and sizing decisions have become more critical. These decisions are unique
to a company’s business network, which consists of its customers, suppliers, factories and transport providers.
The market served by a distribution center can vary from a single town to the entire continent, depending on the
characteristics of the business, density of demand, velocity of product, etc. In fact, the distribution center has
become a science in itself and there are many 3PLs that specialize in managing this function on behalf of
shippers. The inventory of many different shippers may be kept in the same center, garnering economies of scale
at the cost of increasing complexity in operations.
The size of the manufacturing and logistics trade in California along with the volumes of international shipments
that pass through the state make it the ideal location for these centers. The Inland Empire, the Greater Los
Angeles Area, the Central Valley and the San Francisco Bay Area are known for their high-performing clusters
of distribution centers.
UCPRC-RR-2014-02 49
E-commerce has also benefitted from the move towards inventory-pull systems. The growth in e-commerce in
the U.S. has been explosive. In the second quarter of 2004, retail e-commerce earned $15.7 billion, a
23.1 percent increase from a year earlier [9]. E-commerce depends almost exclusively on air and road
intermodal combinations to deliver product to the customer’s door as quickly as possible. Smaller, more
frequent deliveries sacrifice economies of scale and have greatly increased freight traffic in urban areas.
5.4 Trucking Industry Trends
Trucking serves all inland transport markets from long-distance interstate freight movements to “last-mile”
distribution. Trucking serves every community in California with 78 percent of communities depending
exclusively on trucking. In 2010, trucks transported 88 percent of the total manufactured tonnage in the state,
equating to about 3 million tons a day. The Average Annual Daily Truck Miles for 4-axle or more trucks in
California in 2009 was 15.5 million of which the top three counties were San Bernardino (2.8 million), Los
Angeles (2.7 million) and Riverside (2.2 million) [1].
The trucking industry in the U.S. is deregulated and highly disaggregated. There are approximately 1.1 million
motor carrier companies in the U.S. with 76,000 (7 percent) of those in California. Of the 1.1 million motor
carrier companies, approximately 90 percent have six or less power units and only 3 percent have more than 20
power units. This means the industry is made up a multitude of small companies. Among these motor-carriers
53.3 percent are private carriers (in-house fleets) and 31.9 percent are for-hire carriers (outsourced transport
providers). In California, 36 percent of motor carriers are for-hire [31].
The trucking industry in California paid 36 percent of all taxes and fees levied on road users in California in
2008, although trucks only represent about 8 percent of all vehicle miles traveled on road. In 2009, Californian
trucking paid $4.3 billion in federal and state taxes. In 2011, the freight transport industry, which largely
constitutes trucking, employed one in 15 people statewide [1].
The Federal Highway Administration (FHWA) categorizes 10 classes of trucks. Classes 4 to 7 are medium-duty
trucks and Classes 8 to 13 are heavy-duty. Approximately 29 to 33 percent of the total Class 8 heavy-duty
mileage on Californian highways is traveled by out-of-state trucks. The legal limit for a semi-trailer in California
is 53 feet with the maximum length for a truck tractor semi-trailer combination being 65 feet. A motor truck
(3 axle) and trailer combination may be 75 feet. State regulations indicate the restrictions regarding which trucks
may travel on which routes [1].
50 UCPRC-RR-2014-02
According to a 2011 survey conducted by the American Transportation Research Institute (ATRI) the top ten
issues in the trucking industry were:
Economy;
Hours of service;
Driver shortage;
Federal Motor Carrier Safety Administration (CSA);
Fuel issues;
Congestion;
Transportation funding;
Tort reform;
Onboard truck technology, and
Truck size and weight.
The 23rd Annual State of Logistics Report® agrees that a lack of qualified drivers and stricter driver and truck
regulations combined with ever-increasing road-freight volumes will soon create a capacity point in the U.S.
The report strongly advises the logistics industry to make a serious shift to alternative transport modes [4]. In
addition to these national issues, California ranks first overall in terms of commercial vehicle parking shortage
at all public rest areas. Furthermore, the FHWA and ATRI identified that 15 of the 250 major freight chokepoints
in the country in 2011 were in California, with six in Los Angeles, three in Sacramento, two in Oakland and one
each in San Bernardino, Corona, San Rafael and San Diego [1].
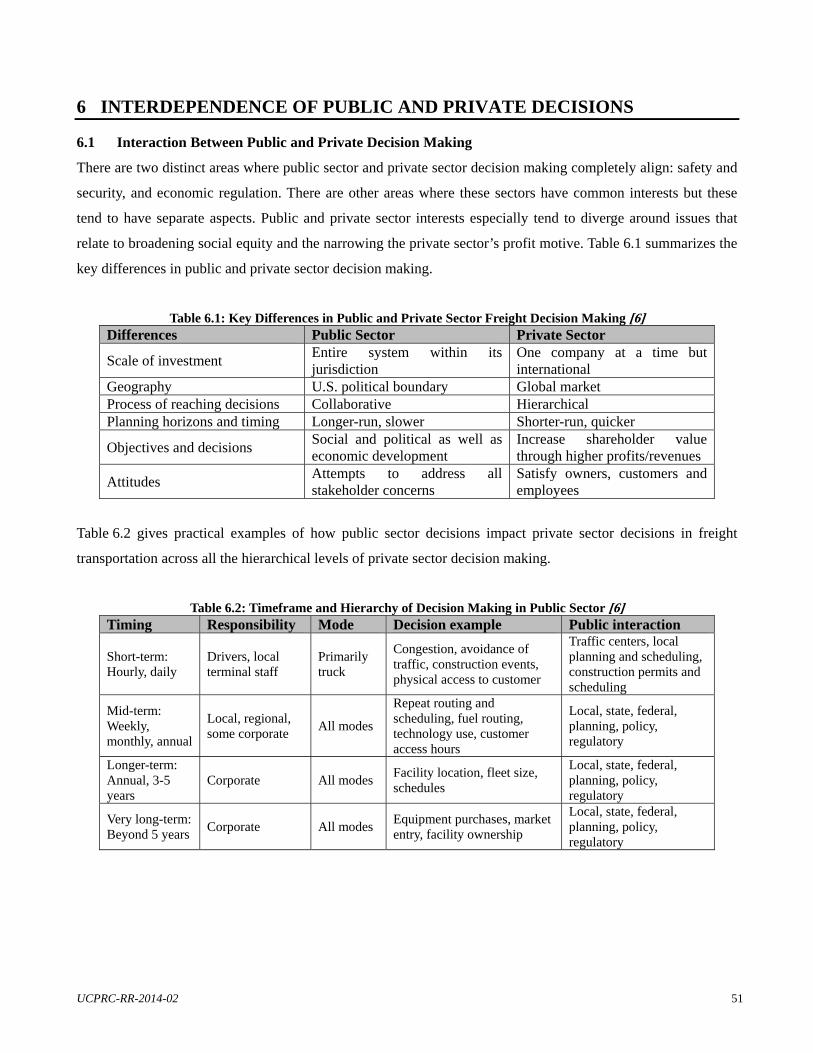
UCPRC-RR-2014-02 51
6 INTERDEPENDENCE OF PUBLIC AND PRIVATE DECISIONS
6.1 Interaction Between Public and Private Decision Making
There are two distinct areas where public sector and private sector decision making completely align: safety and
security, and economic regulation. There are other areas where these sectors have common interests but these
tend to have separate aspects. Public and private sector interests especially tend to diverge around issues that
relate to broadening social equity and the narrowing the private sector’s profit motive. Table 6.1 summarizes the
key differences in public and private sector decision making.
Table 6.1: Key Differences in Public and Private Sector Freight Decision Making [6] Differences Public Sector Private Sector
Scale of investment Entire system within its jurisdiction
One company at a time but international
Geography U.S. political boundary Global market Process of reaching decisions Collaborative Hierarchical Planning horizons and timing Longer-run, slower Shorter-run, quicker
Objectives and decisions Social and political as well as economic development
Increase shareholder value through higher profits/revenues
Attitudes Attempts to address all stakeholder concerns
Satisfy owners, customers and employees
Table 6.2 gives practical examples of how public sector decisions impact private sector decisions in freight
transportation across all the hierarchical levels of private sector decision making.
Table 6.2: Timeframe and Hierarchy of Decision Making in Public Sector [6] Timing Responsibility Mode Decision example Public interaction
Short-term: Hourly, daily
Drivers, local terminal staff
Primarily truck
Congestion, avoidance of traffic, construction events, physical access to customer
Traffic centers, local planning and scheduling, construction permits and scheduling
Mid-term: Weekly, monthly, annual
Local, regional, some corporate
All modes
Repeat routing and scheduling, fuel routing, technology use, customer access hours
Local, state, federal, planning, policy, regulatory
Longer-term: Annual, 3-5 years
Corporate All modes Facility location, fleet size, schedules
Local, state, federal, planning, policy, regulatory
Very long-term: Beyond 5 years
Corporate All modes Equipment purchases, market entry, facility ownership
Local, state, federal, planning, policy, regulatory
52 UCPRC-RR-2014-02
6.2 Success Factors for Public-Private Interaction in Freight Systems
A number of case studies were conducted by the NCFRP to determine those success factors that enable public-
private interactions to excel. Short descriptions of the following case studies are in Appendix C. The summary
lessons learned from these case studies were [6]:
Building and maintaining communication and cooperation among the many private and public
stakeholders is an absolute necessity;
Educating the public on the benefits of freight projects through public outreach and in the media is
important to overcome any opposition to freight activity;
Being aware of how a joint public and private process works is important at the start;
Maintaining key companies and officials who have undertaken an initiative is essential. It is important
to keep institutional memory;
Managing new multijurisdictional freight infrastructure projects through a governing agency with
responsibility for the design and construction of the project is important;
Clearly identifying the public and private project benefits to cement the desire for both sides to make a
project work is essential, and
Public sector understanding of the private requirements for the funding and timing of financial flows to
make public-private partnerships work better is critical.
A number of recommendations on improving public-private interaction emanated from these case studies. The
first was hiring (and retaining) qualified public agency decision-making support staff. Emphasis is placed on
ensuring that staff has the adequate training and experience to deal with planning and policy decisions on
different levels and to ensure that the staff have a decent appreciation of private-sector operations. Improving
communication and education is also essential and freight advisory groups, leadership exchanges and joint task
forces could greatly facilitate this process. Using state-of-practice benchmarking tools to assess the progress of
facilitation efforts and joint projects can help to redirect and reprioritize efforts in public-private interactions.
Furthermore, having joint public-private task teams that develop and monitor joint project milestones, especially
milestones related to the public-private interaction, retains focus and motivation in joint projects. Lastly, it is
essential that mutually established, mutually beneficial public-private financial partnerships are formed.
Financial incentive is a great motivator for both parties. Overall, maintaining the energy and open
communication between the public and private sectors is essential.
UCPRC-RR-2014-02 53
SECTION 2: CASE STUDY RESEARCH REGARDING THE
INTERSECTION OF SUPPLY CHAINS AND ROAD
INFRASTRUCTURE AND REGULATION

54 UCPRC-RR-2014-02
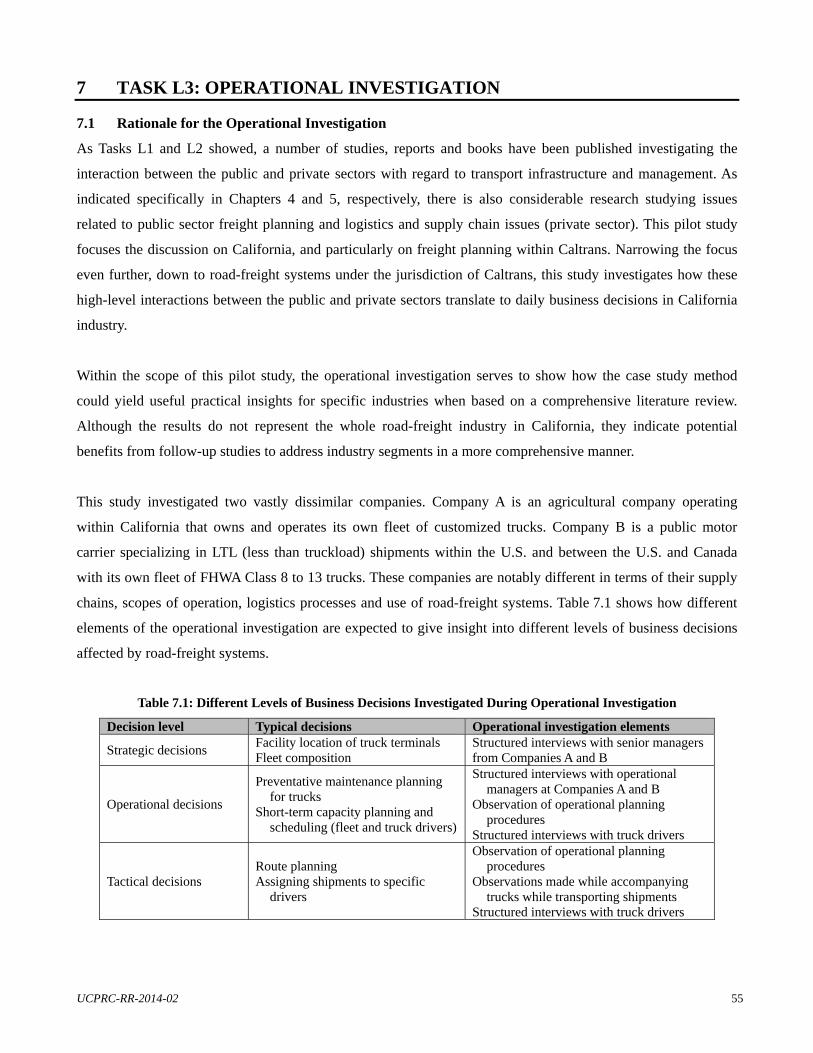
UCPRC-RR-2014-02 55
7 TASK L3: OPERATIONAL INVESTIGATION
7.1 Rationale for the Operational Investigation
As Tasks L1 and L2 showed, a number of studies, reports and books have been published investigating the
interaction between the public and private sectors with regard to transport infrastructure and management. As
indicated specifically in Chapters 4 and 5, respectively, there is also considerable research studying issues
related to public sector freight planning and logistics and supply chain issues (private sector). This pilot study
focuses the discussion on California, and particularly on freight planning within Caltrans. Narrowing the focus
even further, down to road-freight systems under the jurisdiction of Caltrans, this study investigates how these
high-level interactions between the public and private sectors translate to daily business decisions in California
industry.
Within the scope of this pilot study, the operational investigation serves to show how the case study method
could yield useful practical insights for specific industries when based on a comprehensive literature review.
Although the results do not represent the whole road-freight industry in California, they indicate potential
benefits from follow-up studies to address industry segments in a more comprehensive manner.
This study investigated two vastly dissimilar companies. Company A is an agricultural company operating
within California that owns and operates its own fleet of customized trucks. Company B is a public motor
carrier specializing in LTL (less than truckload) shipments within the U.S. and between the U.S. and Canada
with its own fleet of FHWA Class 8 to 13 trucks. These companies are notably different in terms of their supply
chains, scopes of operation, logistics processes and use of road-freight systems. Table 7.1 shows how different
elements of the operational investigation are expected to give insight into different levels of business decisions
affected by road-freight systems.
Table 7.1: Different Levels of Business Decisions Investigated During Operational Investigation
Decision level Typical decisions Operational investigation elements
Strategic decisions Facility location of truck terminals Fleet composition
Structured interviews with senior managers from Companies A and B
Operational decisions
Preventative maintenance planning for trucks
Short-term capacity planning and scheduling (fleet and truck drivers)
Structured interviews with operational managers at Companies A and B
Observation of operational planning procedures
Structured interviews with truck drivers
Tactical decisions Route planning Assigning shipments to specific
drivers
Observation of operational planning procedures
Observations made while accompanying trucks while transporting shipments
Structured interviews with truck drivers
56 UCPRC-RR-2014-02
7.2 The Case Study Research Method
The value and rigor of the case study research method is often underappreciated. If applied correctly, it ensures
methodological rigor and an accurate representation of empirical results. There are also different purposes or
research aims for case studies: studies can be theory-building in nature, often validated by focused surveys [32];
studies can be used to follow up survey results for better insight into certain phenomena [32]; or studies can be
used as exploratory investigations, uncovering insights and trends during the exploration phase of a research
project.
The operational investigation in this pilot study is exploratory and descriptive in nature. A broad-based literature
review guides the case study activities. Through company investigations and structured interviews, the study
explores how public sector activities related to road freight affect decisions made in California by Companies A
and B. It also details how supply chain operations are affected. Results from the case study activities were
compared to the literature review findings and were deemed reasonable and in accord with trends and
phenomena identified in other studies.
Apart from grounding the case studies with a comprehensive literature review, the use of multiple techniques to
study a phenomenon also increases the validity of the research method and findings. According to Ellram [32],
utilizing different sources of information during logistics case studies will strengthen the validity of constructs if
they coincide or shed light on differences. This technique is called “triangulation” of the case study findings.
During this pilot study the following methods were employed to strengthen the triangulation:
Two researchers were present during the company investigations and structured interviews. These
researchers had different backgrounds, with one being a supply chain specialist and the other being a
researcher in pavement engineering. Each researcher took notes and made observations on their own
and these were compared later to identify similarities and differences.
The two companies participating in this study are very different in terms of their operations and the
markets they serve. In fact, their daily use of road-based logistics systems is one of the few things they
have in common.
During each company investigation, the researchers observed operations and conducted structured
interviews with employees on various management levels, gathering a number of different perspectives
for the same set of case study questions.
Eisenhardt [33] supports the use of multiple sources of information in case studies, explaining that it allows for
within-case and cross-case analysis. Those findings that emerge consistently from the various analyses and are
backed by literature have empirical grounding. Also, comparing emerging concepts with literature provides a
better understanding of the reasons for similarities or contradictions between cases. Strong evidence is the
backbone of theoretical validity.
UCPRC-RR-2014-02 57
The case study method is appropriate for this pilot study as an exploratory and descriptive tool. The use of
multiple sources of information, within-case and cross-case analysis, and comparison with a broad-based
literature study all improve the case study method.
7.3 Case Study 1: Operational Investigation of Company A
(Researchers: Lorina Popescu, UC Berkeley; Nadia Viljoen, CSIR)
Company A’s primary business is the production of a range of bulk food products from fresh produce. The
company harvests its own fresh produce from farms in northern and southern California, and leases and operates
the fleet of trucks that transports the produce from the farms to processing facilities. The company also owns
and operates a number of processing and storage facilities in California and its transport division handles the
staging of empty tins and packaging materials between these facilities. Company A’s transport division also
handles some of the deliveries of finished product to customers. The operational investigation of Company A
was conducted over three days, May 15, 16, and 17, 2013.
7.3.1 Day 1, May 15, 2013 – Understanding the Organization and its Scope of Business
This day was dedicated to understanding the complete scope of Company A’s business and in particular to
understand both the road transport needs that arise from this business and the importance of road transport in the
overall success of its operations. In addition, an understanding of how road infrastructure and regulation issues
influence strategic decisions and expansion plans was to be obtained.
A preliminary list of interview questions was prepared and is provided in Appendix D. Although this list of
questions is relatively detailed, the purpose of the list of questions was not to capture detailed data of the
company’s operations per se, but rather to spark and guide discussions relating to the research topics addressed
in this pilot study. For this reason, and to protect the confidentiality and privacy of the study participant, the
specific answers to each of the questions are not provided. Instead, the insight and knowledge gained from these
answers are summarized in the subsections that follow.
On the first day the researchers conducted interviews with the Senior Manager of Company A’s transport
division as well as an Operational Manager involved in the recruitment, hiring, training and management of the
truck drivers. The interviews lasted a total of two hours. After these interviews were completed, the activities for
Day 2 and Day 3 were planned.
58 UCPRC-RR-2014-02
7.3.2 Day 2, May 16, 2013 – Understanding the Interface between Transport and the Processing Plant(s)
The purpose of this day’s investigation was to understand, on a grass-roots level, the role that transport plays in
the daily operation of the processing plants. Of particular interest were how inventory management policies
interact with transport scheduling and how the loading/unloading processes are planned and executed at the
loading docks.
On this day the researchers accompanied the Senior Manager of the transport division on visits to two
processing plants. At the first plant the researchers spoke to an Operational Manager in charge of outbound
logistics and afterward the Senior Manager took the researchers on a tour of the facility and detailed the inbound
logistics process that occurs during harvesting season (peak-season). At the second facility its Operational
Manager explained to the researchers the processes pertaining to outbound logistics and demonstrated the
recently installed electronic warehouse management system. The Operational Manager also answered interview
questions relating to the impact of transport efficiency on the operation of the facility.
At the end of the second day the Senior Manager introduced the researchers to personnel in the dispatch office
who assigned each researcher to the driver she would accompany on their pickups and deliveries the next day.
During this introduction the researchers took the opportunity to ask the dispatch personnel questions relating to
the scheduling and planning of trips and the daily assignment and management of drivers.
7.3.3 Day 3, May 17, 2013 – Understanding the Road Transport Function
The purpose of this day’s investigation was to observe the typical tactical and operational decisions made by
truck drivers and their operational managers, and to explore how road infrastructure and road-freight regulation
affects these decisions.
Each researcher was assigned to a different driver for the day, but the two drivers were to perform the same
pickup and delivery route that day. The drivers were assigned to move empty tins from a storage facility to a
processing plant approximately 1 hour and 15 minutes away. The routes started at a truck depot between 4:00
a.m. and 4:30 a.m., with the researchers following the trucks in private cars from the depot to the storage
facility, a trip of about an hour. The private cars were parked at the storage facility and the researchers rode the
rest of the way in the respective truck cabins. At the storage facility the trucks were loaded with empty tins to be
taken to the processing plant where they were unloaded. The trucks then returned to the storage facility for their
next load. Each truck driver made three round trips before returning to the depot. The researchers accompanied
the truck drivers for only one of these three trips (i.e., storage facility – processing plant – storage facility). The
researchers had informal discussions with the truck drivers during the trips between the storage facility and the
processing plants, enquiring specifically about their working conditions, the impact that road conditions have on
their daily driving, what motivates them and what hampers their morale.
UCPRC-RR-2014-02 59
7.4 Summary of Findings: Company A
Company A sources fresh produce directly from farms (growers) during the peak-season and transports it to
processing plants where the produce is processed into bulk food products for use in retail and in the food service
industry. Once processed, the finished product is placed onto pallets and stored at outdoor warehouses at the
processing plants. Orders from customers are filled from the stock in these warehouses.
The transport division of Company A is responsible for all of the inbound logistics of fresh produce from the
farms to the processing plants during the peak-season as well as the staging of empty tins and other packaging
material at the various processing facilities and storage locations during the off-season in preparation for the
peak-season. The outbound logistics of finished product to customers happens throughout the year and is
handled by Company A or by external transport operators, depending on a number of factors such as customer
preference, the distance to the customer, and the availability of a return load for Company A.
All of Company A’s suppliers (growers) are situated in California and are primarily concentrated in the Central
Valley. Farm locations are fixed and the majority is not situated close to rail sidings. For Company A, as for
most agricultural supply chains, truck transport is the only viable mode of transport from farm to processing
plant or from farm to market. At the same time, the road network in rural areas is very vulnerable as a) these
roads are not generally engineered to carry high-volumes and/or heavy loads and in many cases are relatively
narrow for trucks, and b) the funds generated through taxes and levies in these areas are not commensurate to
the funding required to maintain these roads for heavy truck traffic, as these areas have a much smaller revenue
base than urban areas.
Company A’s customers are mostly spread throughout the continental U.S. Their customers are food
manufacturing companies and range from large corporations to small “mom-and-pop” type businesses. The
processing plants have direct access to the railway through rail sidings and a significant proportion of finished
product is shipped via rail. Truck transport is also used for the outbound logistics and the processing plants are
equipped with efficient loading docks and streamlined loading operations to serve these trucks. Figure 7.1
depicts the overview of Company A’s supply chain operations.
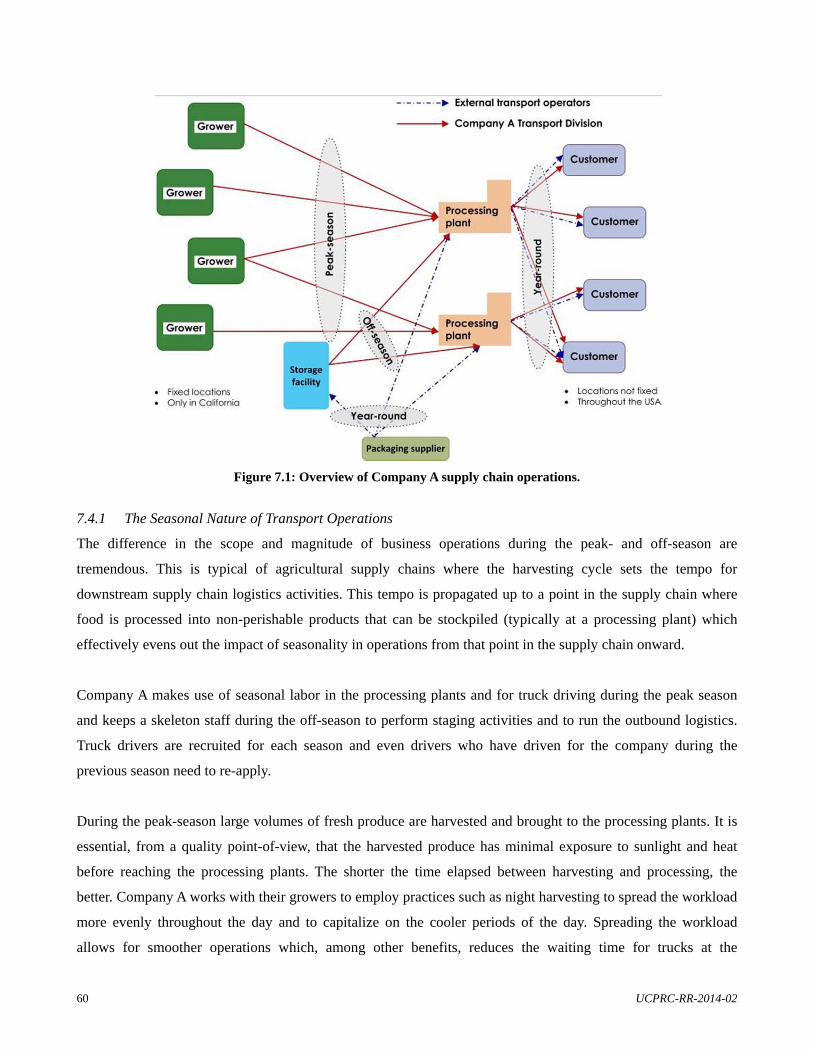
60 UCPRC-RR-2014-02
Figure 7.1: Overview of Company A supply chain operations.
7.4.1 The Seasonal Nature of Transport Operations
The difference in the scope and magnitude of business operations during the peak- and off-season are
tremendous. This is typical of agricultural supply chains where the harvesting cycle sets the tempo for
downstream supply chain logistics activities. This tempo is propagated up to a point in the supply chain where
food is processed into non-perishable products that can be stockpiled (typically at a processing plant) which
effectively evens out the impact of seasonality in operations from that point in the supply chain onward.
Company A makes use of seasonal labor in the processing plants and for truck driving during the peak season
and keeps a skeleton staff during the off-season to perform staging activities and to run the outbound logistics.
Truck drivers are recruited for each season and even drivers who have driven for the company during the
previous season need to re-apply.
During the peak-season large volumes of fresh produce are harvested and brought to the processing plants. It is
essential, from a quality point-of-view, that the harvested produce has minimal exposure to sunlight and heat
before reaching the processing plants. The shorter the time elapsed between harvesting and processing, the
better. Company A works with their growers to employ practices such as night harvesting to spread the workload
more evenly throughout the day and to capitalize on the cooler periods of the day. Spreading the workload
allows for smoother operations which, among other benefits, reduces the waiting time for trucks at the
UCPRC-RR-2014-02 61
processing plants when off-loading produce. Apart from evenly spreading the workload, the efficiency of the
inbound logistics is also critical to ensure minimal exposure of the produce. When loaded trucks are delayed due
to traffic congestion, road works or even congestion at the processing plants it results in unnecessary or
preventable exposure of the produce.
During the peak-season, operations have to run like clockwork with even a 15 minute delay in the arrival of a
truck at the processing plant causing disruptions. Traffic congestion and road works pose the biggest risk to the
inbound logistics function and seeing as the peak-season is during spring and summer, the probability of road
works on the routes travelled is high.
7.4.2 The Interface between Inbound and Outbound Logistics and the Facilities
On the inbound side there is no inventory buffer between the inbound logistics and the processing operations.
This means that fresh produce cannot be stored or stockpiled after being off-loaded from the trucks but needs to
be processed immediately. The scheduling and reliability of the harvesting and inbound logistics are thus very
important and during the peak-season these elements receive constant attention.
The outbound side has a considerable finished product inventory buffer, effectively de-coupling the operations
of the processing plant from the outbound logistics. Take the next scenario, for example: The customer’s
transport company experiences difficulties and cannot pick up the weekly truckload, and so the following week
the customer orders double the weekly amount to compensate. This increase in order volume does not impact
the operations within the processing plant at all as the additional inventory is available and waiting in the
warehouse. Another example could be the break-down of a critical machine inside the plant which effectively
halts production for a week. During this time (and in the following weeks) there is enough finished product
available in inventory so that customer orders are not affected while the machine is repaired and inventory levels
replenished. While the efficiency of the outbound logistics may still be important from a customer service point-
of-view, it has minimal impact on the operations of the processing plant.
Time windows at customer facilities can make the planning of the outbound logistics trickier. The largest risk
posed by customers to the efficiency of the outbound logistics is that of erratic orders. It often happens that
customers do not plan ahead and then place large orders to be filled in a very short time. Because customer
service is critically important, the company will dispatch as many drivers and trucks necessary to fill the order in
the given time, but that may not be the most efficient way from a resource utilization perspective.
62 UCPRC-RR-2014-02
Staging of the packaging material and empty tins happens primarily during the off-season so that it is ready and
accessible for use during the peak-season activities. These activities are under less schedule pressure than the
inbound farm-to-plant activities but the efficiency of the transport is still important from a cost-saving point-of-
view. Inventory buffers also exist both at storage locations and at processing plants so that disruptions in
transport do not necessarily affect other operations. Drivers are paid per load and during the operational
investigation one of the drivers commented that traffic is especially frustrating for him as it can make the
difference between being able to complete two or three loads during the Compliance, Safety, Accountability
(CSA) permitted driving time.
The off-loading (inbound) and loading (outbound) operations are the physical interface where facility operations
and the transport function meet. During the peak-season the off-loading of produce is streamlined so that
truckload after truckload is emptied onto a high-volume conveyor-type system that originates outside the facility
and flows produce into the facility in bulk. Once again the timing of inbound logistics is critical for smooth off-
loading operations.
Loading of finished products onto trucks and rail cars is a more manual process than the off-loading of fresh
produce. Finished goods are stacked onto pallets and stored in aisles in an outdoor warehouse. Rail cars and
trucks are then loaded according to a specific customer order using forklifts. The processing plants do not
impose an appointment or time-window system on truck pickups but rather serve trucks on a first-come-first-
serve basis. As long as the trucks arrive at the facilities during business hours they will be loaded. This takes a
lot of pressure off the transport operators in terms of schedule adherence. Typically, time-windows are imposed
by facilities to reduce traffic congestion at the facility and to ensure more balanced utilization of staff,
equipment and dock space. On the flip-side, imposing time-windows could strain the relationship between the
facility and transport operators and also adds administrative burden to the facility. Even though Company A
occasionally experiences truck congestion at its facilities (particularly during peak-season), they feel the benefits
of imposing time-windows would be marginal and is not worth the effort.
The loading and off-loading operations observed on day three of the operational investigation were very
efficient. One of the key reasons for the efficiency is the motivation of the driver to complete as many loads as
possible in the CSA permitted driving time. The driver thus does whatever is possible to complete the loading
and off-loading in minimum time. In addition, there is more leeway for the dispatch personnel to schedule
staging activities ahead of time so that truck arrivals at facilities are staggered and there is minimal waiting.
From the time spent with the dispatch staff it seems that some facilities do impose appointments while others are
more lenient, making the scheduling slightly more complicated.
UCPRC-RR-2014-02 63
7.4.3 Reverse Logistics
Reverse logistics are those activities required to return product from the customer to Company A, or from
Company A to its suppliers for whatever reason. Company A reports very little need for reverse logistics.
Because Company A processes the fresh produce into different products with different color, texture and
composition requirements, variations of the incoming fresh produce can be accommodated by spreading the
fresh produce among batches to make sure the final product still has the right characteristics. It is seldom that a
single bin of fresh produce is of such poor quality that it has to be returned to the field, but in such cases, that is
exactly what the company will do.
Customer returns based on product quality are unheard of in Company A. The only instances in which product
may be sent back is if the wrong product was delivered. In such cases Company A generally just goes and swaps
out the incorrect product for the correct product.
7.4.4 Driver Recruitment, Regulation, Training and Management
A small proportion of its drivers are employed by Company A on a year-round basis. In the off-season these
drivers stage packaging materials and empty tins among facilities while in the peak-season they may do the
same or may help out with the inbound farm-to-plant logistics. Every year there is a large recruitment initiative
just before peak-season to employ the necessary number of drivers required for the inbound logistics of the fresh
produce. Drivers are hired to drive the customized trucks between the farms and processing plants but also to
move the customized bins around on-site at the processing facilities.
The recruitment and training process at Company A is very strict. Drivers need to have a Class 8 license with a
doubles and triples endorsement. The vetting process is extensive with new drivers having to pass a training
course while return drivers have to pass a “check drive.” The training course is specific to the customized
vehicles used by the company for inbound logistics. At the end of each season the management reviews each
driver’s performance throughout the season and decides whether to invite them back the following season.
Drivers are paid per load delivered with a per mile contribution.
The managers interviewed felt that there is a reasonably large pool of potential drivers in the labor market and
that it was more a question of sifting out the high-quality candidates. None of the employees at Company A are
unionized and as a result the company is not hampered by labor disputes.
Company A strictly enforces all CSA driver regulations. In 2006 the company instituted the mandatory use of an
On Board Computer (OBC) system in each truck that tracks drive time and other statistics to enforce CSA
64 UCPRC-RR-2014-02
regulations. The company places the onus of adhering to driver regulations on the driver and will under no
circumstances require them to violate these regulations. (This was confirmed by one of the drivers on day three
who recounted an instance where a mechanical fault in the vehicle had delayed his activities and caused him to
reach his driving limit before returning to the depot. He called it in to the company and they arranged for
another driver to be dispatched to come and drive the truck back.)
The OBC system keeps detailed driver logs on a central server which can be accessed by the company as well as
the California Highway Patrol (CHP) during roadside investigations. During the peak-season the central OBC is
monitored 24 hours a day by personnel at the head office. CHP also conducts periodic audits of companies. The
company shows no leniency for safety violations or violations of the CSA regulations.
There is no formal incentive or punitive system in place to spur better performance, but Company A has an
open-door policy when it comes to performance management and dealing with driver complaints and concerns.
According to the managers, what dampens driver morale most is when they do not have work. The managers
and dispatch staff thus take their responsibility seriously to ensure that drivers are equally utilized and that just
enough drivers are hired to complete the work. The Operational Manager also commented that the heat during
the peak-season affects driver morale.
7.4.5 From the Driver’s Perspective
The two researchers accompanied different drivers who were completing similar deliveries using the same route.
Observations made by both researchers and discussions with both drivers highlighted the same issues, validating
that the matters discussed below are common in Company A.
Both drivers were permanent drivers for Company A. During the peak-season the drivers are assigned mixed
trips which include trips bringing fresh produce from the farms to the plants as well as trips to stage empty tins.
During the off-season the drivers focus only on staging empty tins and packaging materials.
Drivers are paid per load, so their main concern is to complete as many loads as possible each day within the
CSA-permitted driving time. This self-determination greatly spurs driver motivation and performance
(especially compared to other companies where drivers are paid per hour). The drivers avoid unnecessary stops
and thus usually pack their own lunches and take body breaks at the facilities while the truck is being loaded.
Two main safety issues were noted on the route driven that day. The first was the relatively short and often
concealed merging lanes on the freeway (especially on Route 99). Truck drivers on the freeway only see
UCPRC-RR-2014-02 65
merging traffic when the vehicles are right in front of or next to them, posing a greater accident risk. Similarly,
the shorter merging lanes make it trickier for trucks to enter and exit the freeway. The second safety concern and
driving frustration is the mix of passenger vehicles and trucks on the road. In general passenger vehicles are not
mindful of the trucks, cutting in front of them, slowing down and speeding up erratically, etc. Not only does this
pose a safety risk, but it causes additional stress for the truck drivers and the trucks are driven less efficiently
because they constantly have to brake and speed up again to accommodate passenger traffic.
One driver commented that his truck is his office and that he takes great pride in keeping it clean and setting up
his devices exactly the way he likes. Drivers are assigned to different trucks, depending on the loads they are
assigned, but the drivers know the different trucks and definitely have their preferences. The driver mentioned
here greatly prefers the newer Freightliner trucks because everything inside the cabin is adjustable, from the seat
to the steering wheel to the seatbelt height – making the driver more comfortable. He also mentioned that truck
driving is physically taxing because of the vibrations endured while driving. When pulling heavier loads, the
vibrations and jolts are even worse and the driver reported that he often goes home with backache. The driver
remarked that the road condition only really affects him in terms of the comfort of his drive and that rougher
road conditions definitely contributed to his physical discomfort.
Company A has set routes generally used by the drivers, both for farm-to-plant transport as well as for the
staging of empty tins and packaging materials between facilities. The drivers are well versed in these routes and
generally don’t need GPS guidance or additional support. However, when road construction, traffic or accidents
divert traffic, drivers may need assistance in finding the next best route. One of the drivers had invested in his
own personal GPS that could route trucks as well as passenger vehicles. He then preprogrammed his truck
classification into the GPS unit so it can calculate routes according to the prevailing truck restrictions in the
area. The driver feels that this was a meaningful personal investment, because it saves him a lot of time when he
needs to find a new route which could make the difference between doing an extra load that day or not.
According to the drivers, there is definitely a difference in the efficiency/throughput of facilities that are
unionized versus those that are not. Consistently (in this case study and the case study at Company B), drivers
would comment when arriving at a “union” facility that they expect to wait there because they arrived 10
minutes before starting time or they arrived during the coffee/tea break or lunch. The drivers seemed to know
the staff at the facilities very well, anticipating their reactions and behavior.
One of the drivers commented that he much prefers “local trucking” to long-distance trucking. He mentioned
that he preferred staying in an area he knows, with customers and routes he is familiar with. Secondly, he said
66 UCPRC-RR-2014-02
that timing and scheduling are more complicated for long-distance driving as you have to plan your
appointments and sleepovers more carefully to fit inside the CSA regulations. In his opinion, loading the vehicle
and deciding how much to fill the tanks were also more complicated when you have to deal with the
weighbridge restrictions on the long-distance routes. This was an interesting discussion to have as each driver
seem to have a personal preference about the type of trucking they prefer.
In general, truck drivers said that they enjoy their work for the same reasons. They mostly cite their love of
driving, the freedom and independence of being in charge of their own vehicle and being trusted to make their
deliveries. Some say it is also more interesting than working inside the plant or on the farms – clearly this would
also depend on personal preference.
7.4.6 Fleet Management
Company A uses two types of vehicles, namely flatbeds/curtain trailers for finished product and staging of
empty tins and packaging, and customized trucks for the farm-to-plant transport of fresh produce. These trucks
are Class 8 vehicles and the customized trucks are always doubles. The double curtain trailers are favored for
freight movement as they have the maximum dimensions (i.t.o. width, length and height) that one can drive
without a special permit.
Almost all the trucks in the fleet are leased by the company from different agents. Company A does not
experience the problem of truck shortages either for the customized trucks during peak-season or for the other
trucks in general. Regarding repairs, the company will make minor repairs to the customized trucks themselves
(e.g., tire changes and electrical repairs) but anything more serious than that or relating to the body of the
vehicle is done by the leasing agent. The agreement with the flatbed leasing companies is that Company A does
only the smallest repairs and the rest are referred to the leasing agent. The most frequent repair and maintenance
orders are tire changes and minor electrical problems.
Company A has more flexibility in the sizing of its fleet because of the rental agreements. Supposedly this
would also mean that the company can more easily maximize their vehicle utilization by hiring “just enough”
trucks during the different seasons.
7.4.7 Public-Private Interaction
Company A’s operations generate significant truck traffic on the rural road networks leading into their plants.
The company recognizes that this traffic greatly accelerates the degradation of the road surface. There are also
other production plants in the area that contribute to truck traffic. Apart from being good social citizens, these
UCPRC-RR-2014-02 67
companies know that it is in their best interest for the roads leading to their facilities to be in good condition,
particularly from a safety and traffic congestion perspective. Therefore, the larger of the two processing plants
visited during the operational investigation has joined forces with other companies and these contribute
financially to the expansion and maintenance of the rural road that passes by these facilities. The fact that these
companies contribute directly also gives them the liberty to demand that local authorities give attention and
priority to the maintenance and expansion of the road when needed. As a result the road is in a very good
condition, especially considering the truck volumes it endures.
This is one positive example of successful public-private interaction. Apart from this Company A indicated that
the only interaction they had with public agencies was when they would call in to report major problems to the
CHP.
The Senior Manager is satisfied that, in general, the road condition and connectivity in California is adequate.
The only matter they would like to raise is the timing and scheduling of road construction. When scheduled
during harvest time (peak-season), road construction causes major disruptions to the inbound logistics of some
of the processing plants. Even if the company could be warned of impending construction projects a few months
ahead, then they would have enough time to develop alternate routes and adjust their scheduling accordingly.
Perhaps if the public agencies responsible had a better idea of the harvesting and logistics timetables in the areas
in which they work, it would also assist these agencies in timing their projects at a mutually acceptable time.
Simply establishing communication between the public agencies and industry in this regard could go a long
way.
The Senior Manager agreed that there would definitely be mutual benefit in more deliberate and structured
interaction between the public and private sector in matters relating to road transport. He would be willing to
dedicate a couple of days to such initiatives, depending on the magnitude and relevance of the matter in
question.
7.5 Business Decisions Affected by Road Infrastructure and Regulation: Company A
7.5.1 Strategic Decisions
On a strategic level the Senior Manager did not think that road infrastructure and road regulations greatly impact
a decision on whether to take on a specific supplier (grower) or customer. He estimated that road considerations
probably only contributed 5 to 10 percent, mainly relating on the distance to the customer or supplier.
68 UCPRC-RR-2014-02
7.5.2 Operational and Tactical Decisions
The two primary ways in which the road systems affect operational and tactical decision making are by affecting
the daily scheduling and routing of pickups and deliveries and the accommodation of CSA driver regulations.
As mentioned previously, the reliability and consistency of the inbound logistics function is critical during the
peak season. Road works, traffic congestion and accidents all have the potential to disrupt regular truck routes,
forcing drivers and dispatch personnel to work under great pressure to reroute trucks and make sure operations
are not delayed.
The CSA driver regulations are implicitly accommodated in the company’s planning and scheduling. The
company does not feel that these regulations are too restrictive and supports their implementation. If, however,
the regulations were to change – for example the allowable driving hours – it could impact planning and
scheduling and even require them to hire more or fewer drivers during peak season.
7.6 Case Study 2: Operational Investigation of Company B
(Researchers: Lorina Popescu, UC Berkeley; Nadia Viljoen, CSIR)
Company B is an asset-based motor carrier with two primary business streams:
Consolidating less-than-truckload (LTL) shipments from the continental U.S. for shipment to Canadian
terminals, and
Domestic LTL shipments across the continental U.S.
The California terminal where the researchers conducted their operational investigation has an additional
business stream that was inherited from the previous company that operated from that terminal and is unique
within Company B’s network. This business stream is the pickup and delivery of intrastate LTL freight.
Company B has a number of terminals within their network in the U.S. as well as partner terminals in Canada
and the U.S. Company B has three terminals in California.
The operational investigation of Company B was conducted over two days, May 21 and 22, 2013.
7.6.1 Day 1, May 21, 2013 – Understanding the Organization and its Scope of Business
The purpose of this day’s investigation was to understand the scope of Company B’s business in California in
particular and how road infrastructure and road regulations affect the company’s operations and business
decisions.
UCPRC-RR-2014-02 69
A preliminary list of interview questions was prepared and is provided in Appendix D. Although this list of
questions is relatively detailed, the purpose of the list of questions was not to capture detailed data of the
company’s operations per se, but rather to spark and guide discussions relating to the research topics addressed
in this pilot study. For this reason, and to protect the confidentiality of the study participant, the specific answers
to each of the questions are not provided. Instead, the insight and knowledge gained from these answers are
summarized in the subsections that follow.
On the first day, the researchers had extensive interviews and discussions with the Senior Manager of the
terminal and one of the Operational Managers in charge of assigning and scheduling shipments. The researchers
also had the opportunity to observe an interview with a driver applicant who had Compliance, Safety,
Accountability (CSA) accreditation. After these interviews, the planning was done regarding the activities for
Day 2 of the investigation.
7.6.2 Day 2, May 22, 2013 – Observing Shipments from Pickup to Delivery
On the second day arrangements were made for the researchers to accompany two drivers as they completed
their intrastate pickups and deliveries. The purpose of this day’s investigation was to observe the typical tactical
and operational decisions made by truck drivers and their operational managers and to explore how road
infrastructure and road-freight regulation affect these decisions.
The researchers arrived at the terminal at 5:00 a.m. to observe how the truck trailers were being loaded with
freight for the day’s deliveries. Between 7:00 a.m. and 8:00 a.m. the Operational Manager on duty assigned the
different trailers to the different drivers. The researchers accompanied the respective drivers, riding along in the
cabin. Observations were made throughout the day as drivers completed their deliveries and pickups. In
addition, the researchers had informal discussions with the truck drivers while on the road regarding their
working conditions, the impact that road conditions have on their daily driving, what motivates them and what
hampers their morale. One researcher returned to the terminal shortly after lunch and spent some more time
interviewing the Senior Manager while the other researcher returned to the terminal around 5:00 p.m.
7.7 Summary of Findings: Company B
Company B’s network constitutes a combination of company-managed and partner terminals in the U.S. and in
Canada. The structure of Company B’s network is asymmetric, which means that it might be possible to ship
freight from Point A to Point B, but not from Point B to Point A. With regard to the U.S. – Canadian network,
cabotage laws are the primary reason for the asymmetry whereas with the transcontinental U.S. shipments,
profitability considerations dictate the structure of the network. The company has a philosophy “to only do that
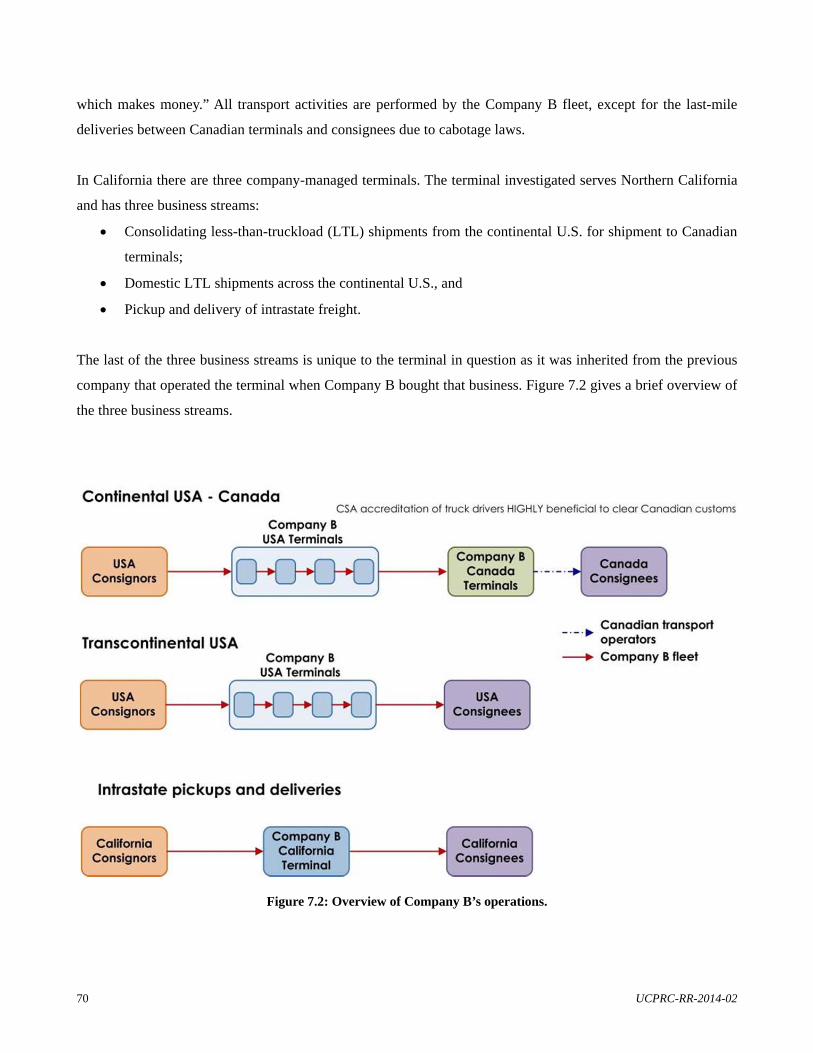
70 UCPRC-RR-2014-02
which makes money.” All transport activities are performed by the Company B fleet, except for the last-mile
deliveries between Canadian terminals and consignees due to cabotage laws.
In California there are three company-managed terminals. The terminal investigated serves Northern California
and has three business streams:
Consolidating less-than-truckload (LTL) shipments from the continental U.S. for shipment to Canadian
terminals;
Domestic LTL shipments across the continental U.S., and
Pickup and delivery of intrastate freight.
The last of the three business streams is unique to the terminal in question as it was inherited from the previous
company that operated the terminal when Company B bought that business. Figure 7.2 gives a brief overview of
the three business streams.
Figure 7.2: Overview of Company B’s operations.
UCPRC-RR-2014-02 71
The most profitable business stream is the consolidation of U.S. freight for shipment to Canada. A consignor in
the U.S. contracts Company B to ship his freight from the U.S. to Canada. The freight can be anything from a
single carton to a full-pallet to half a truckload of pallets. The freight is collected from the consignor by
Company B and taken to the nearest terminal. At the terminal the freight is consolidated with other Canada-
bound shipments. Freight is also consolidated from different terminals in the network. The aim is to maximize
the payload per truck that travels into Canada in order to maximize the profit per trip. Once the shipment has
been consolidated, a truck is dispatched from a terminal to cross the border and deliver the shipment to a
Canadian terminal. Cabotage laws prevent Company B from distributing the freight to the final consignees and
so the truck returns from the Canadian terminal to the U.S. The terminal visited said that they make use of
expedited teams to deliver shipments to Canada in the shortest time possible. Expedited teams consist of two
drivers where one driver sleeps/rests while the other drives. In so doing, the truck never stops while the drivers
still adhere to CSA regulations regarding driving time.
Domestic LTL shipments are the second most profitable business stream for Company B. Consignors in the U.S.
contract Company B to deliver freight to a consignee elsewhere in the U.S. Company B collects the freight from
the consignor and delivers it to a terminal. The freight is consolidated and transshipped between terminals until
it reaches a terminal close to the consignee at which point Company B delivers the shipment to the consignee.
These shipments generally occur across states and thus multiple terminals can be involved in transporting the
shipment from origin to final destination.
Intrastate, “overnight” shipments are unique to the terminal visited. Consignors in the surrounding cities contract
Company B to deliver freight to consignees in the vicinity. These shipments generally need to be done overnight
or within a few days, however the terminal does have a warehouse facility where freight can be stored for longer
periods. Company B collects the freight from the consignors and brings it to the terminal for consolidation. The
terminal then dispatches these local deliveries to the consignees in the following days.
In the LTL shipping industry, the efficacy and efficiency of the consolidation and synchronization of shipments
is critical in keeping costs and lead times down. Achieving this requires constant coordination and
communication among the terminals in the network. The physical structure of the network – i.e., the location of
terminal facilities and their interconnectivity – greatly influences the business’s performance. Further
information and comments from discussions with Company B are summarized below.
72 UCPRC-RR-2014-02
7.7.1 The Role of Less-than-Truckload Shipping in the Supply Chain
To understand the role of LTL shipping in supply chains, one needs to first understand the tradeoff between
inventory and transport. Having inventory at various points in the supply chain – for example in the back room
of the retail store, at a local depot, at a regional distribution center and in a warehouse at the manufacturing plant
– buffers the supply chain against uncertainty. More specifically, it ensures that customer demand can still be
met despite variations in demand and supply or a disruption of the transport function. But holding inventory is
expensive, both in terms of capital costs and storage space. In general, companies try to keep inventory levels as
low as possible. The lower the inventories, the more frequently shipments have to be made and the quicker and
more reliable the lead times need to be. Higher inventories create some slack for the transport function and
result in fewer but larger shipments.
The inventory/transport tradeoff is a strategic decision that each supply chain makes for itself. Therefore
different supply chains have different levels of dependence on LTL shippers. For supply chains with very low
inventories, the LTL shipper is a critical partner to the overall supply chain’s success, and the LTL shipper’s
customer is willing to pay a premium for reliable service. In supply chains with higher inventories, more
emphasis is placed on the cost efficiency of the LTL shipper. LTL companies must thus be flexible to provide a
service tailored to the needs of different supply chains, definitely a non-trivial task.
In addition, LTL shippers are not only transport providers, but are often also regarded as “suspenders of freight.”
Frequently it is mutually beneficial for both consignor and consignee if there is a delay between the sale and
shipment of freight and the receipt of freight. A typical example is at the end of the month when a consignor
would like all of the inventory that has been sold to be out of the warehouse but the consignee is not yet ready to
receive the inventory. Using the LTL shipper to delay the shipment a few days could solve this problem. This is
not the same as providing a storage or warehouse service, but refers to planning and using the scheduling slack
of the LTL shipper to everyone’s advantage. LTL shippers thus need to be flexible and adaptive to changing
customer requirements.
7.7.2 Cycles in Less-than-Truckload Shipping
LTL shipping experiences marked cycles in business. The size of shipments and velocity of shipments
characterize the business cycles. The size of shipments refers to the volume of products in each order and is
relative to the type of product considered – for example 5 pallets of canned food could be a large shipment
whereas one industrial washing machine could be a small shipment because it contains just one item (despite the
fact that it is physically large). The velocity of shipments refers to the frequency of orders and how quickly these
shipments need to move through the network from origin to destination.
UCPRC-RR-2014-02 73
In keeping with accounting cycles there is always a spike in freight volumes in the last week of a month and at
the end of a quarter. Consignors want to get freight “off their books” before the end of the month. This trend is
especially evident in high-value consumer products such as electronics.
Other cycles in the consumer goods industry (and related industries) are driven by fluctuations in customer
behavior and demand. January and February are considered dead months as there is very little customer demand
following the holiday season that spans the autumn and early winter months. During August through October
large, slow shipments start coming through to build up inventories ahead of the holidays. During November and
December shipment size drops dramatically and velocity picks up as retail shopping. In addition to these
calendar cycles, industries such as electronics and fashion consumables have big boom cycles around the launch
of a new product.
7.7.3 Driver Management
In general, all Company B truck drivers are employed by the company, are paid by the hour and are not
unionized. In the case of the terminal that was visited by the researchers, a number of owner-operators (truck
drivers who own their own trucks and are contracted by companies to deliver freight) were taken over from the
previous company that operated from that terminal. An agreement was made originally with these owner-
operators that Company B would continue making use of their services as owner-operators as long as they
abided by the same rules as the company-employed truck drivers. The truck driver complement at the terminal is
thus a mix of owner-operators and employees.
Owner-operators earn income per load delivered. Therefore it is most important for them that they deliver as
many loads as possible. Employees are recompensed per hour and based on the interview with the CSA
accredited driver it seemed that for the U.S. – Canada trips the drivers also get paid per mile.
In general there is a large pool of potential truck drivers in the job market, but because of Company B’s stringent
safety standards and the need to have drivers who can cross the Canadian border, it is difficult for them to find
the right recruits. The license requirement is a Class 8 with a doubles and triples endorsement.
The driver record (State and Federal) is a very important aspect of driver management as it affects the
company’s insurance. If a driver has accumulated too many violations or warnings, the insurance company may
refuse to insure the driver. Although drivers can attend safety training to have penalty points deducted from their
record, they are still under a lot of scrutiny as they risk being fired if the insurance will no longer cover them.

74 UCPRC-RR-2014-02
Company B does not have a formal incentive or punitive scheme to spur driver performance, but the Senior
Manager said they have an open door policy and if performance were to be an issue, he would talk to the drivers
personally. If something had to be done to penalize a driver for bad performance, the Senior Manager said that
he would not do anything that hurts the driver’s paycheck as that would have repercussions for the driver’s
family, but he would find another way.
The system whereby driving hours are recorded and managed at Company B is still manual. Drivers are
responsible for recording and reporting their driving hours to a staff member at the terminal that consolidates
and tracks the statistics for CSA compliance.
7.7.4 Crossing the Canadian Border
To be allowed to cross the Canadian border as a truck driver one must have absolutely no criminal record
whatsoever. This includes juvenile crimes and crimes committed in foreign countries. The Canadian Customs
vetting process is extremely thorough and picks up on offenses that many other U.S. regulatory agencies would
not. The first time a truck driver crosses the Canadian border he/she undergoes an extensive interview
(reportedly lasting up to three hours). If nothing comes up immediately, the driver is allowed through Customs
and will also be allowed through for any subsequent trips within the following four to eight weeks while
Canadian Customs completes their vetting process. However, if something should surface during the more
extensive vetting process that driver will no longer be allowed to cross the border.
Although Company B will under no circumstances knowingly hire a truck driver with a criminal record, many
offenses can slip through the conventional vetting systems. The Senior Manager estimates that up to 80 percent
of the drivers he hires without a known criminal record eventually “pop” at Canadian Customs. One way of
preventing this situation is hiring truck drivers who already have CSA accreditation. To obtain CSA
accreditation, drivers have to go through a vetting process which checks, among other things, for criminal
offenses. The CSA criminal vetting process is reputed to be just as stringent as that of Canadian Customs. CSA
accredited drivers are also fast-tracked at the Canadian border.
In the case of Company B, CSA accredited drivers are worth their weight in gold and very few applicants are
accredited. This is an example where the regulations regarding truck driving, especially the CSA vetting and
accreditation process, works in the favor of the private sector.
Although the CSA accreditation is invaluable when crossing the Canadian border, it represents no other benefit
to Company B in terms of domestic transport.
UCPRC-RR-2014-02 75
7.7.5 From the Driver’s Perspective
The truck drivers at Company B do their job because they enjoy driving trucks. Most of them comment that they
derive enjoyment from the thrill of driving a truck and of being on the open road, combined with a sense of
autonomy and independence they have in their jobs. What most affects the morale of drivers at Company B is
anything that prevents them from driving. The most common frustration is having to wait at terminals or at a
client location. Waiting for clients to prepare a pickup is common and both drivers observed by the researchers
commented that they frequently wait a few hours for pickups. The drivers knew which of the regular customers
were unionized or not and the perception is that unionized facilities are not as efficient when loading and
offloading. Unionized staff will not load or offload freight during their tea or lunch breaks and will not start
early or work a little overtime to help the driver.
During the interview with the CSA accredited driver, the Senior Manager commented that the first two streams
of business (U.S. – Canada LTL and transcontinental U.S. LTL) are “terminal support” functions and the truck
drivers do not interface with consignors or consignees. Terminal support means that the driver will only be
picking up and delivering loads to terminals within the Company B network, which implies better coordination
and communication so that waiting at terminals is minimized and the driver does not have to deal with
consignor/consignee matters. When serving customers directly (as observed with the intrastate pickups and
deliveries), Company B has no insight to the reasons for delays at terminals and therefore much less control over
wait times. Drivers then also have to deal with the consignor/consignee in person. Doing terminal support work
is thus preferable.
Both of the drivers observed during the operational investigation primarily do intrastate deliveries and pickups.
Drivers often have to navigate narrow streets and driveways in urban areas with large trucks. For those stops in
industrial areas this is much less of a problem as the roads and parking lots generally accommodate trucks.
Drivers often have to wait between stops, and then finding a place to park the truck (or parking the truck to buy
lunch) is troublesome in urban areas. The drivers observed knew the area very well and did not need any
navigation assistance to help plan their routes. Traffic and congestion is a daily frustration for drivers doing
intrastate deliveries and pickups.
A handheld device in the truck communicates to the driver all the deliveries and pickups that need to be made.
This device is linked to the system at the terminal so that the Operational Manager can keep track of what is
happening on the routes. In addition, pickup stops may be added to a drivers list throughout the day and these
then appear on the handheld device as the day progresses. Due to the nature of the business, a driver’s day is
very unpredictable.
76 UCPRC-RR-2014-02
The drivers had a number of suggestions regarding the road infrastructure and regulations that could make their
work easier. Longer merging lanes on the freeways would make driving much safer. Currently it is difficult to
merge into traffic with trucks, especially with double trailers. Dedicated truck lanes would also make driving
safer and more efficient as they would not have to contend with erratic passenger vehicle behavior. Drivers feel
that the CSA regulations are too restrictive, especially as they often stop and take breaks at terminals and are not
really driving for hours at a time. One driver also commented that asphalt roads are perceived to be smoother to
drive on.
The drivers who frequently make the trip from California to Canada or California to other states said that there
is a very clear difference in the road conditions between California and the surrounding states. (One driver
mentioned that even when he is sleeping in the bunker he can tell when they have left California because
suddenly the bunker does not shake as badly.) California’s road condition is a lot rougher and the roads are a lot
older than the surrounding states. The drivers that primarily do the intrastate pickups and deliveries commented
that some freeways in Northern California are much rougher than others, but they did not feel that this
significantly affected their driving.
7.7.6 Fleet Management
Company B owns all the tractors and trailers in its fleet. Each terminal manages its own fleet, making decisions
regarding capacity planning, maintenance and, in some cases, procurement. The trailers can be maintained and
repaired on-site at the terminal, but the company had to outsource the servicing and maintenance of the tractors
to a third party as the terminal lease agreement states that no oil or other industrial liquids may be spilled on the
site.
Maintenance plans and schedules are subject to both Federal and California state legislation. Companies may, of
their own accord, institute maintenance standards that are more stringent than the Federal and State standards
(for example regarding the frequency of oil changes). These company standards then become the new
“minimum requirement” for that fleet and if the authorities find a truck in violation of its own company’s
standard, the company is penalized.
The Senior Manager commented that the process to register new trucks in the state of California is very
restrictive and cumbersome.
The implementation of the new regulations regarding the environmental efficiency requirements of trucks in
California will greatly impact Company B’s fleet. The new regulations require that all trucks that do not adhere
to the new standards be replaced within a certain time period. This effectively means that the company has to
UCPRC-RR-2014-02 77
retire trucks before they have reached the 750,000 mile “retirement age,” despite the fact that these trucks are
still in perfect working condition. The company supports the new standards and regulations, but feels that it is
unreasonable to forcibly retire vehicle fleets that are still within the boundaries of the previous regulation. Not
only will the company lose a lot of value by retiring these vehicles early, but there is now no resale market in
California as no one can use the truck anymore. Other states will also adopt the new standards in time so the
market in the continental U.S. is marginal.
7.7.7 Inspections and Freeway Restrictions
The Senior Manager felt that the enforcement of regulations in California is particularly excessive and pedantic.
Although there is no disputing the content of the regulations, he feels that the frequency of inspections is
excessive. Company B prides itself on the fact that its fleet and drivers have a near perfect record; nonetheless a
lot of productive driving time is “wasted” at the scales and during roadside inspections.
Inspections mostly take place at roadside scales along the freeways. It is mandatory for trucks to stop at the
scales unless they have one of two types of permits. The PREPASS permit is valid in a set of states and the
NORPASS permit is valid only in California. The permit system is an effort to reduce the number of inspections
a truck is subjected to. A truck should be inspected once a quarter and then can further be randomly selected for
inspection. With the PREPASS or NORPASS a driver is notified a few miles ahead of the scales by means of an
audible signal from the tag if the truck needs to pull off for inspection. The perception is, however, that trucks
are still pulled off for inspection much too often. Ironically, on the second day of the investigation the one driver
being observed was pulled off twice in the same truck, despite having the permit. Generally, an inspection
causes a 30 minute delay for the driver.
There are many parts of the Californian road network (freeways especially) where trucks are not allowed to
travel. Mixing truck and passenger traffic increases the probability of accidents and trucks do contribute
disproportionately to road wear. These points are not contended. However, restricting trucks from many of the
routes in Northern California has caused major chokepoints in the network. In addition, the disparity in road
condition between the “truck freeways” and the restricted freeways is severe, because truck traffic is now
concentrated on only a few routes. It should be kept in mind that passenger vehicles still have to make use of the
freeways where trucks are permitted to travel and thus experience the same degraded road conditions and
chokepoints. Restricting trucks from certain freeways has a great impact on the overall level of connectivity of
the state.
78 UCPRC-RR-2014-02
7.7.8 The Image of Trucking
Trucking has a bad reputation. This reputation is pervasive simply because just about every member of the
public crosses paths with trucks on a daily basis—they are what one might call a visible nuisance. The fact of
the matter is that trucks are essential to sustain the way of life that the disgruntled members of the public wish to
maintain, especially in Northern California where trucks are a necessity to keep malls and retails outlets stocked
and to serve the burgeoning consumer population. It is often the middle and higher classes who fight hardest
against trucking, for example by enforcing route restrictions in wealthier areas, but these economic segments of
society create the greatest demand for truck traffic in their areas through their consumer habits.
According to Company B, from a road agency perspective trucks are regarded as “tax wagons.” It is true that
trucks contribute disproportionately to road wear and it is reasonable that trucks should thus contribute more to
the funding for its upkeep, but the sentiment is that taxing on trucks is excessive, especially in California.
7.7.9 Triple Trailers and Truck Lanes
Two pertinent suggestions were made by Company B regarding road regulation in California. The first is to
permit triple trailers and the second is to institute more truck-only lanes on freeways and to lift freeway
restrictions.
The State of California does not permit triple trailers, despite the fact that all the surrounding states do. The
primary concern is that triple trailers pose a greater road safety risk. The Senior Manager says that he can
improve his payload yield per tractor by up to 50 percent if he could add an additional trailer, whereas the fuel
consumption would not increase by the same margin. He would also save costs in terms of labor and tractor
utilization. Furthermore, his opinion is that one triple on the road is safer than a double and single driving one
behind the other. Accidents on the freeway are often caused by a lack of coordination between vehicles; thus by
reducing the number of tractors and drivers, less coordination is required. The fact that California does not allow
triples is a competitive disadvantage for both the private sector and California as a whole.
Truck-only lanes would greatly improve road safety and would reduce congestion on the freeways for passenger
vehicles. All the truck drivers interviewed from both Company A and B confirm that passenger vehicles are a
major risk to truck drivers. Drivers of passenger vehicles do not consider the hazards caused by cutting in front
of trucks, weaving through truck traffic or suddenly speeding up or slowing down in front of a truck. Sharing the
road with passenger vehicles is both stressful and dangerous for truck drivers; truck-only lanes would separate
these two types of traffic. For the reasons discussed in previous sections, it is also recommended that freeway
restrictions in Northern California be lifted, especially in instances where there is no efficient alternate route for
trucks. Implementing truck-only lanes is one way of solving the same problems authorities aspire to solve with
freeway restrictions.
UCPRC-RR-2014-02 79
7.8 Business Decisions Affected by Road Infrastructure and Regulation: Company B
7.8.1 Strategic Decisions
In the LTL business the structure of the network is pivotal to a company’s success, especially because of the
consolidation and coordination that needs to take place between terminals. Terminal location is both critical and
non-trivial. Terminals need to be placed in relation to the geographic spread of consignors and consignees in an
area. In addition, because of the high volume of inter-terminal traffic, terminals have to be located so that they
are easily connected to other terminals via freeways. There are certain regulations that could sway the decision
to locate a terminal within one state or another. An example is the regulations regarding the handling of
hazardous materials. The terminal investigated cannot take on customers with hazardous freight because the
leased facility does not adhere to the State of California regulations regarding hazardous materials. Another
consideration could be to locate a terminal outside of California so that it can accommodate triples trailers in
addition to trucks heading to or from California. In general, any regulations that affect the operations of the
terminal could influence the decision of whether to locate that terminal in one state or another.
Another factor that influences terminal location is the connectivity of the road network. How easily can one get
from one point to another on the network? Are there many alternatives or only one route?
Road infrastructure and regulation does not, however, have much of an impact when deciding whether to expand
into a new market or not. Company B decides to expand or not based on supply and demand, not based on
infrastructure. However, once the company decides to enter a new market, how they service that market depends
on the road network and regulations.
7.8.2 Operational and Tactical Decisions
Although factors such as traffic congestion, road works and road condition frustrate the drivers and operational
managers, it is seldom that it would result in them taking different routes. The Operational Manager said they
would just adjust their scheduling of stops to account for delays if they knew about construction or other
disruptions en route.
7.9 Congruency of Findings with the San Joaquin Valley Interregional Goods Movement Plan
A brief overview of the San Joaquin Valley (SJV) Interregional Goods Movement Plan (“the SJV plan”) is given
in Section 4.3.4. The SJV plan included a rigorous private stakeholder interaction process whereby key goods
movement challenges in the SJV were identified. The following challenges identified in the SJV plan are
congruent with challenges mentioned in the two case studies:
80 UCPRC-RR-2014-02
Highway corridor capacity on I-5 and SR-99;
“Last Mile” connectivity (especially in rural areas and relating to the agricultural industry);
Truck parking shortages (especially for urban delivery and pickup routes);
Pavement wear and tear;
Surface Transportation Assistance Act (STAA) routing issues (restricting trucks from certain critical
routes inhibits connectivity);
Seasonality concerns (especially in the agricultural sector);
Integrating freight and planning: Land use issues (facility location), and
Environmental regulation uncertainty.
Of the 49 prioritized projects proposed by the SJV plan, the 21 projects relating to the widening of highway
sections and the six relating to the construction of new highway sections or upgrades of certain sections will all
increase capacity and connectivity of the highway network – addressing issues of congestion and travel time
discussed in the case studies.
In addition to these projects, a few other priority projects will directly impact the issues brought up by
Companies A and B:
Project #2 – Truck Route Signage
Project #3 – Additional Truck Rest Areas
Project #4 – Oversize/Overweight Truck Pilot Program/Research
Project #5 – Reexamine STAA Designated Routes
Project #6 – I-580 Truck Climbing Lanes
Project #37 – CCT Lodi Branch Upgrade
Project #61 – Improve Speeds on SR 166 from Cuyama Grade to SR 33
Project #104 – West Coast Green Highway Initiative (LNG Truck Fuelling Stops)
7.10 Lessons Learned and Recommendations for Future Case Studies
7.10.1 Executive Support
Companies A and B have been very accommodating throughout both the original Vehicle-Pavement Interaction
Pilot Study and this logistics augmentation operational study. Although much of their willingness to participate
can be attributed to the open corporate culture within these companies, the researchers believe the success of this
study is due to the support the companies’ owners offered right from the start. Both companies are family-owned
companies with patriarch-type owners in charge of the entire business. Once the buy-in of these patriarchs had
UCPRC-RR-2014-02 81
been established, instructions were given to managers to accommodate researchers’ requests. This “instruction
from above” made it simpler for the managers to allow researchers access to their divisions. It also made it
easier for the researchers to interact with the managers, knowing that the study was supported by someone more
senior than the manager and therefore the manager could not just back out. Having said that, the senior
managers at both companies were very open and keen to participate, and went to great lengths to accommodate
the researchers’ requests. Without this open and trusting attitude the case studies would not have been
successful.
7.10.2 Privacy and Confidentiality Protocols
When dealing with the private sector it is important to appreciate how competitive their environment is and how
a breach of confidentiality could diminish their competitive advantage. Great care was taken from the start to
develop protocols that would ensure the companies could not be identified through the final study report
(privacy) and that no facts that could jeopardize their competitive advantage would be made public
(confidentiality). The researchers drafted the protocols and sent them to the managers for input. The protocols
were accepted without input or revision from the managers. The protocols are included in Appendix E for
reference. In hindsight it seems that the managers appreciated the written protocols as it instilled confidence in
sharing information, but the level of detail of the protocols may have been unnecessary from the companies’
perspective. The detail of the protocols was more relevant to Caltrans’ internal confidentiality policies.
7.10.3 A Flexible Plan of Action
It was important for the researchers to communicate clearly and upfront with the senior managers from both
companies what the purpose of their investigation was and what their plan of action was over the course of the
operational investigation. The researchers outlined each day’s purpose and proposed activities and sent this to
the managers for input and discussion. This enabled the managers to plan ahead to be able to accommodate the
researcher’s requests.
On the flipside, the researchers left the detail planning of appointments to the managers, making themselves
available at any time of day for the managers’ convenience. Giving the managers this flexibility facilitated more
meaningful interactions and observations.
7.10.4 Exploring Topics through Conversation
The research topics explored in this study (particularly how road infrastructure and regulations affect daily
business decisions) are open-ended in nature and interpreting responses correctly requires adequate appreciation
of the business’ context. It was thus very important to use the prepared interview questions (Appendix D) as
82 UCPRC-RR-2014-02
only a guideline and to allow discussions to develop organically. During the interviews at both companies a
wealth of information regarding the businesses, their operations and logistics were shared that do not directly
answer the research questions posed in this study but were invaluable from the researcher’s perspective as it
provided the much needed context with which to interpret the answers relevant to this study. This broader
context also allowed the researchers to draw generic parallels between what was witnessed at these companies
and what is generically observed in literature.
Whenever possible, observing an activity or operation is far better than merely talking about it. Much more
insight is gained by watching people make their business decisions. The researchers often identified questions
they hadn’t thought of before while observing activities; these questions would then later spark worthwhile
conversations with managers and truck drivers. Examples of where this worked particularly well was in
observing the truck drivers while driving with them on their routes, the demonstration of the electronic
warehouse management system by the operational manager at one of Company A’s processing plants, observing
the interview with the CSA accredited driver at Company B, observing the morning loading activities at
Company B, and observing the morning driver assignments at Company B.
7.10.5 Recording Notes
When interviews are of an open-ended nature it can often be difficult to capture all the important points through
note-taking without interrupting the discussion or losing eye contact – both of which stifle the easy flow of
conversation one wants to engender. One solution would be to have two researchers present and have them
alternate between asking questions and taking notes. However, even with this arrangement it might be difficult
to capture all relevant facts. Therefore, it should be arranged explicitly and upfront that all interviews will be
recorded and that recorded materials will be handled strictly according to the privacy and confidentiality
protocols (Appendix E). Although is it still possible that the presence of a recording device can make
interviewees more guarded, by using suitable people skills the interviewer can still create rapport within the first
few minutes to lessen the intimidation of the recording device.
UCPRC-RR-2014-02 83
8 SUPPLY CHAIN DESIGN AND VULNERABILITY
8.1 The Role of Transport Infrastructure in Supply Chain Management
The premise of this pilot study is that the road infrastructure and road freight-related regulations have a marked
impact on business operations in California. As the efficiency and efficacy of business operations contribute
directly to the economic competitiveness of the state, the public agencies that are the custodians of the
infrastructure and the enforcers of the regulations would do well to understand the impact of their decisions on
local business. To be more specific, the impacts of road infrastructure and regulations are on those business
operations that form part of the supply chains within economic sectors.
Aitken [34] defines a supply chain as “a network of connected and interdependent organizations, mutually and
co-operatively working together to control, manage and improve the flow of material and information from
suppliers to end users.” Christopher [35] takes a value-based approach and defines a supply chain as “the
network of organizations that are linked through upstream and downstream relationships in the different
processes and activities that produce value in the form of products and services in the hands of the ultimate
customer.” He goes on to define supply chain management as “the management of upstream and downstream
relationships with suppliers and customers to deliver superior customer value at less cost to the supply chain as a
whole” [35].
Logistics is one of the constituent functions of supply chain management that encompasses the movement and
storage of goods throughout the supply chain. Its primary activities are transport and inventory management.
According to the World Bank’s Logistics Performance Index, infrastructure performance is one of the four
criteria that influences a country’s overall logistics performance. The infrastructure index rating combines the
performance of ports, airports, roads, rail, warehousing and transloading facilities and information
communication technology (ICT) infrastructure. The 2012 results ranked the U.S. ninth out of 155 countries in
terms of its overall logistics performance with a ranking of fourth out of 155 for its infrastructure
performance [3].
Transport infrastructure and regulation affects the supply chain in two ways:
The design, location, performance and regulation of transport infrastructure are critical inputs to the
design of the supply chain network, and
The propensity of transport disruptions and delays caused by infrastructure failure contributes to overall
supply chain vulnerability.
84 UCPRC-RR-2014-02
8.2 Supply Chain Risk and Vulnerability
Over the past few decades supply chains have become increasingly vulnerable as a result of changes in
economics, business environments, and ecological phenomena. Wagner and Neshat [36] describe four pertinent
trends that have increased the vulnerability of supply chains. Firstly, natural disasters (tornadoes, epidemics,
floods, etc.) and man-made disasters (war, terrorism, etc.) have increased both in frequency and economic
impact. Secondly, the inherent complexity of modern supply chains has increased greatly due to factors such as
shorter product lifecycles, increased technology and innovation, stricter regulatory controls, outsourcing and the
globalization of supply chains. Thirdly, the financial squeeze on supply chain operations has tightened and thus
practices such as rapid product roll-outs, cost cutting, asset reduction and just-in-time inventory have been
applied excessively to push up the bottom line. However, all of these practices cut “fat” out of the supply chain
that could have acted as buffers, in the event of disruptions, that would enable the supply chain to maintain its
customer service levels. Lastly, fiercer competition forces companies to take more calculated risks, meaning that
executives knowingly make decisions that are more risky than they normally would, simply to remain
competitive.
Concurrently, the study of supply chain risk and vulnerability has risen in prominence over the last two decades.
There are variations in the literature regarding the nomenclature in the field, but the following definition of five
interrelated terms are regarded as intuitive and relevant to the pilot study:
Supply chain risk: A deviation from expected circumstances or behavior that negatively impacts supply
chain performance
Supply chain disruption: “…an unintended, untoward situation, which leads to supply chain risk. For the
affected firms, it is an exceptional and anomalous situation in comparison to every-day business.
Depending on its severity, other terms maybe applied, e.g. glitch, disturbance or crisis.” [37];
Supply chain risk sources: These are the different classifications of supply chain disturbances. There are
many different frameworks of supply chain risk sources in literature [36, 37, 38, 39, 40, 41, 42, 43, 44,
45, 46, 47, 48, 49]
Supply chain vulnerability: This is the susceptibility of the supply chain to the harm of a specific supply
chain disruption. The disruption is a situation that leads to the occurrence of a risk, but it is the
combination of the vulnerability of the supply chain and the severity of the disturbance that ultimately
determines the overall impact
Supply chain vulnerability driver: These are the variables and factors within the environment of the
supply chain that increase its exposure (vulnerability) to supply chain disturbances.
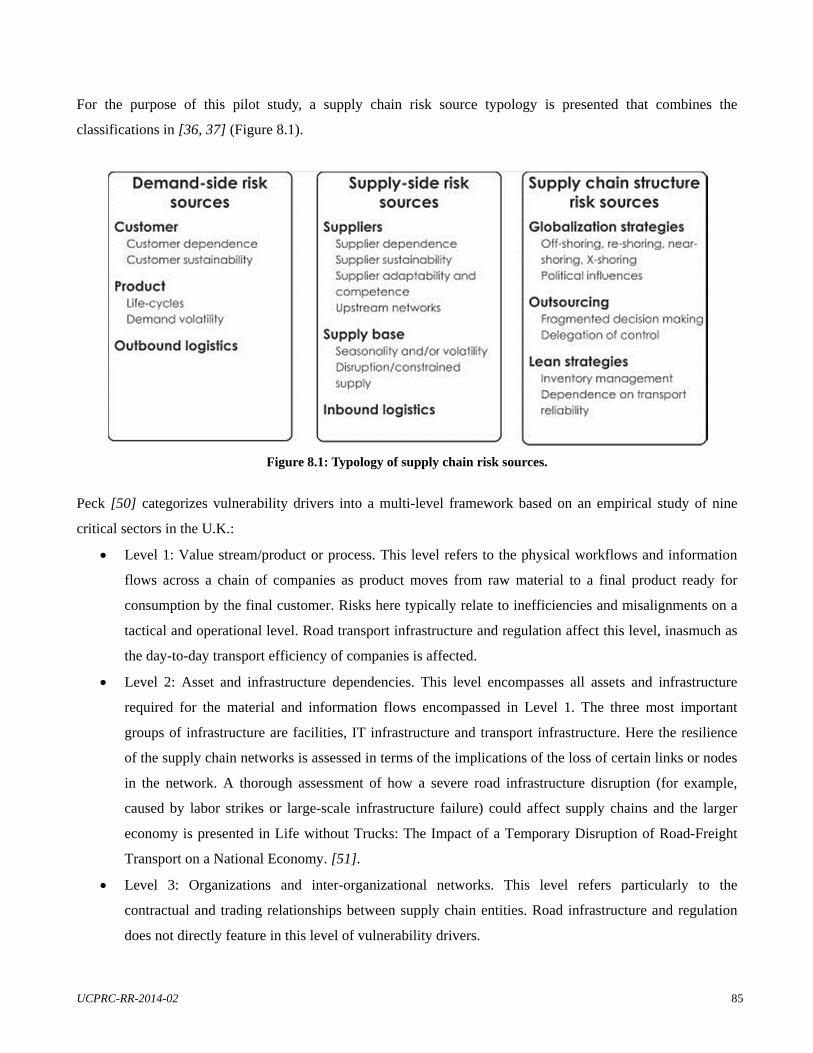
UCPRC-RR-2014-02 85
For the purpose of this pilot study, a supply chain risk source typology is presented that combines the
classifications in [36, 37] (Figure 8.1).
Figure 8.1: Typology of supply chain risk sources.
Peck [50] categorizes vulnerability drivers into a multi-level framework based on an empirical study of nine
critical sectors in the U.K.:
Level 1: Value stream/product or process. This level refers to the physical workflows and information
flows across a chain of companies as product moves from raw material to a final product ready for
consumption by the final customer. Risks here typically relate to inefficiencies and misalignments on a
tactical and operational level. Road transport infrastructure and regulation affect this level, inasmuch as
the day-to-day transport efficiency of companies is affected.
Level 2: Asset and infrastructure dependencies. This level encompasses all assets and infrastructure
required for the material and information flows encompassed in Level 1. The three most important
groups of infrastructure are facilities, IT infrastructure and transport infrastructure. Here the resilience
of the supply chain networks is assessed in terms of the implications of the loss of certain links or nodes
in the network. A thorough assessment of how a severe road infrastructure disruption (for example,
caused by labor strikes or large-scale infrastructure failure) could affect supply chains and the larger
economy is presented in Life without Trucks: The Impact of a Temporary Disruption of Road-Freight
Transport on a National Economy. [51].
Level 3: Organizations and inter-organizational networks. This level refers particularly to the
contractual and trading relationships between supply chain entities. Road infrastructure and regulation
does not directly feature in this level of vulnerability drivers.
86 UCPRC-RR-2014-02
Level 4: The environment. This level constitutes all political, social, economic, and technological
features that characterize the operating environment. It also includes exogenous factors such as natural
and man-made disasters. Road transport regulation would have a role to play in characterizing the
operating environment.
Wagner and Bode [36] and Wagner and Neshat [37] elaborate on the complexity of quantitatively assessing
supply chain vulnerability. To date research and literature on the topic is scant. They propose that before supply
chain vulnerability can be assessed, it must be defined at which plane of the economy vulnerability is to be
assessed. Vulnerability can be assessed on the following planes:
Focal firm – quantifying the vulnerability of one firm’s processes to supply chain risk sources;
Supply chain – quantifying the vulnerability of a network of firms engaged in the provision of a certain
product or service to market;
Industry – quantifying the vulnerability of an entire industry (e.g., agriculture) to cross-sectional supply
chain risk sources, and
Economy – quantifying the vulnerability of the overall economy to supply chain risk sources in one or
more industries (McKinnon’s [51] study is an example of such an assessment).
8.2.1 Supply Chain Risk and Vulnerability in California
In this pilot study the research focus is on the impact of public sector decision making regarding road
infrastructure and regulation on private sector decision making. The literature review (Task L2) and operational
investigation (Task L3) results show that the private sector is most impacted through the vulnerability of its
supply chains and the decisions firms make are to mitigate or counteract supply chain risks.
Road infrastructure and regulation impacts supply chain vulnerability in all industries on multiple levels (as
defined by Peck [50]). The assessment in this pilot study thus transcends the more detailed and confined focal
firm or supply chain level and is executed on an industry (economic sector) level [36]. Due to the limited nature
of the pilot study, empirical data on all California industries could not be obtained and thus a state economy
level assessment is not viable at this stage. Section 10 presents, among other topics, a future research agenda
that would enable an assessment akin to that of McKinnon [51].
During this pilot study operational investigations were conducted within specific segments of the Agriculture,
Forestry and Fishing sector (Company A) and the Transportation and Warehousing sector (Company B). These
two sectors are part of a list of 10 sectors that are considered as being dependent on goods movement:
UCPRC-RR-2014-02 87
Agriculture, Forestry and Fishing;
Transportation and Warehousing;
Mining;
Utilities;
Manufacturing;
Retail Trade;
Wholesale Trade;
Waste Management;
Health Care and Social Assistance, and
Accommodation and Food Services.
The San Joaquin Valley Interregional Goods Movement Plan also identifies the first eight sectors above as goods
movement-dependent, but classify Waste Management, Healthcare and social assistance, and Accommodation
and food services as consumer goods and service sectors. The authors of this pilot study agree with McKinnon
[51], who noted that if freight transport were to be disrupted, these specific service sectors would grind to a halt
as well and therefore they are, in fact, dependent on goods movement. In addition, these sectors contribute
markedly to the quality of life.
8.3 General Risks in the Agriculture, Forestry and Fishing sector
Agricultural supply chains are largely supply driven and seasonal, in contrast to the trend for just-in-time
demand-driven supply chains. Often the commodities are highly perishable and have to be maintained at their
optimum temperature and humidity levels to ensure quality and shelf life. The hazards that affect agricultural
supply chains are many, varying from unpredictable weather patterns to the price of energy used for production
and transport. Table 8.1 summarizes the main categories of hazards faced by agricultural supply chains as
identified by Jaffee et al. [52], cross-referenced with the risk sources delineated in Figure 8.1.
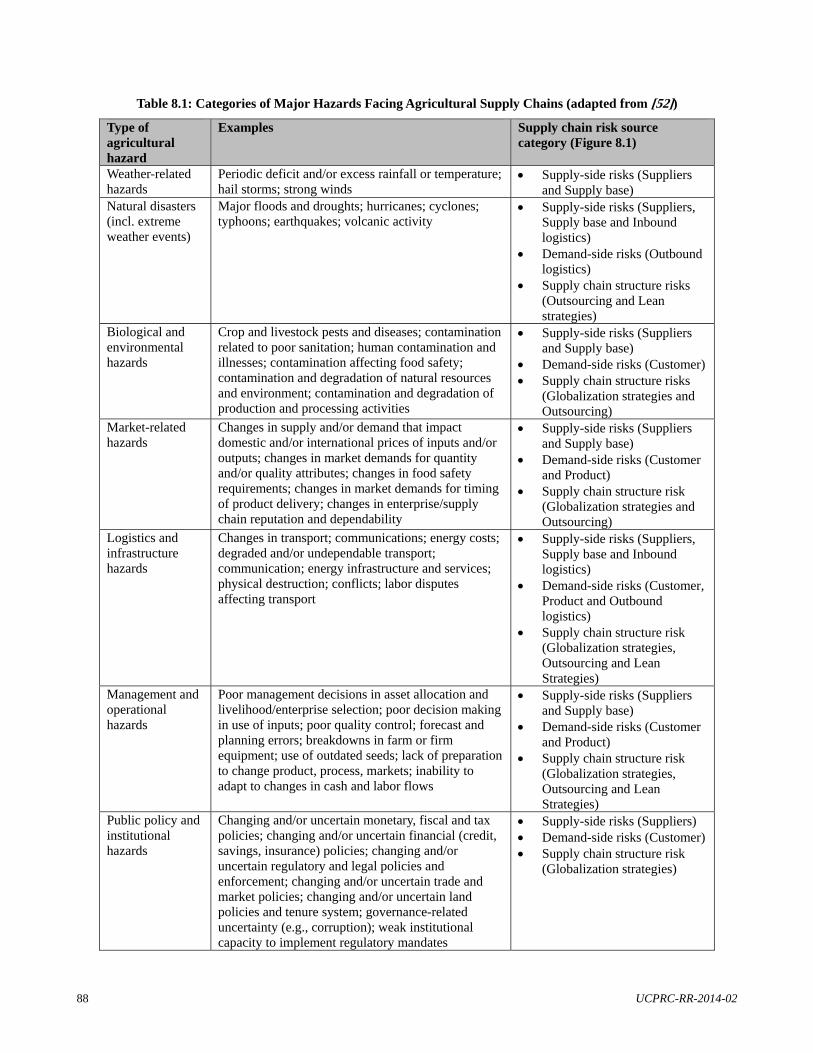
88 UCPRC-RR-2014-02
Table 8.1: Categories of Major Hazards Facing Agricultural Supply Chains (adapted from [52])
Type of agricultural hazard
Examples Supply chain risk source category (Figure 8.1)
Weather-related hazards
Periodic deficit and/or excess rainfall or temperature; hail storms; strong winds
Supply-side risks (Suppliers and Supply base)
Natural disasters (incl. extreme weather events)
Major floods and droughts; hurricanes; cyclones; typhoons; earthquakes; volcanic activity
Supply-side risks (Suppliers, Supply base and Inbound logistics)
Demand-side risks (Outbound logistics)
Supply chain structure risks (Outsourcing and Lean strategies)
Biological and environmental hazards
Crop and livestock pests and diseases; contamination related to poor sanitation; human contamination and illnesses; contamination affecting food safety; contamination and degradation of natural resources and environment; contamination and degradation of production and processing activities
Supply-side risks (Suppliers and Supply base)
Demand-side risks (Customer) Supply chain structure risks
(Globalization strategies and Outsourcing)
Market-related hazards
Changes in supply and/or demand that impact domestic and/or international prices of inputs and/or outputs; changes in market demands for quantity and/or quality attributes; changes in food safety requirements; changes in market demands for timing of product delivery; changes in enterprise/supply chain reputation and dependability
Supply-side risks (Suppliers and Supply base)
Demand-side risks (Customer and Product)
Supply chain structure risk (Globalization strategies and Outsourcing)
Logistics and infrastructure hazards
Changes in transport; communications; energy costs; degraded and/or undependable transport; communication; energy infrastructure and services; physical destruction; conflicts; labor disputes affecting transport
Supply-side risks (Suppliers, Supply base and Inbound logistics)
Demand-side risks (Customer, Product and Outbound logistics)
Supply chain structure risk (Globalization strategies, Outsourcing and Lean Strategies)
Management and operational hazards
Poor management decisions in asset allocation and livelihood/enterprise selection; poor decision making in use of inputs; poor quality control; forecast and planning errors; breakdowns in farm or firm equipment; use of outdated seeds; lack of preparation to change product, process, markets; inability to adapt to changes in cash and labor flows
Supply-side risks (Suppliers and Supply base)
Demand-side risks (Customer and Product)
Supply chain structure risk (Globalization strategies, Outsourcing and Lean Strategies)
Public policy and institutional hazards
Changing and/or uncertain monetary, fiscal and tax policies; changing and/or uncertain financial (credit, savings, insurance) policies; changing and/or uncertain regulatory and legal policies and enforcement; changing and/or uncertain trade and market policies; changing and/or uncertain land policies and tenure system; governance-related uncertainty (e.g., corruption); weak institutional capacity to implement regulatory mandates
Supply-side risks (Suppliers) Demand-side risks (Customer) Supply chain structure risk
(Globalization strategies)
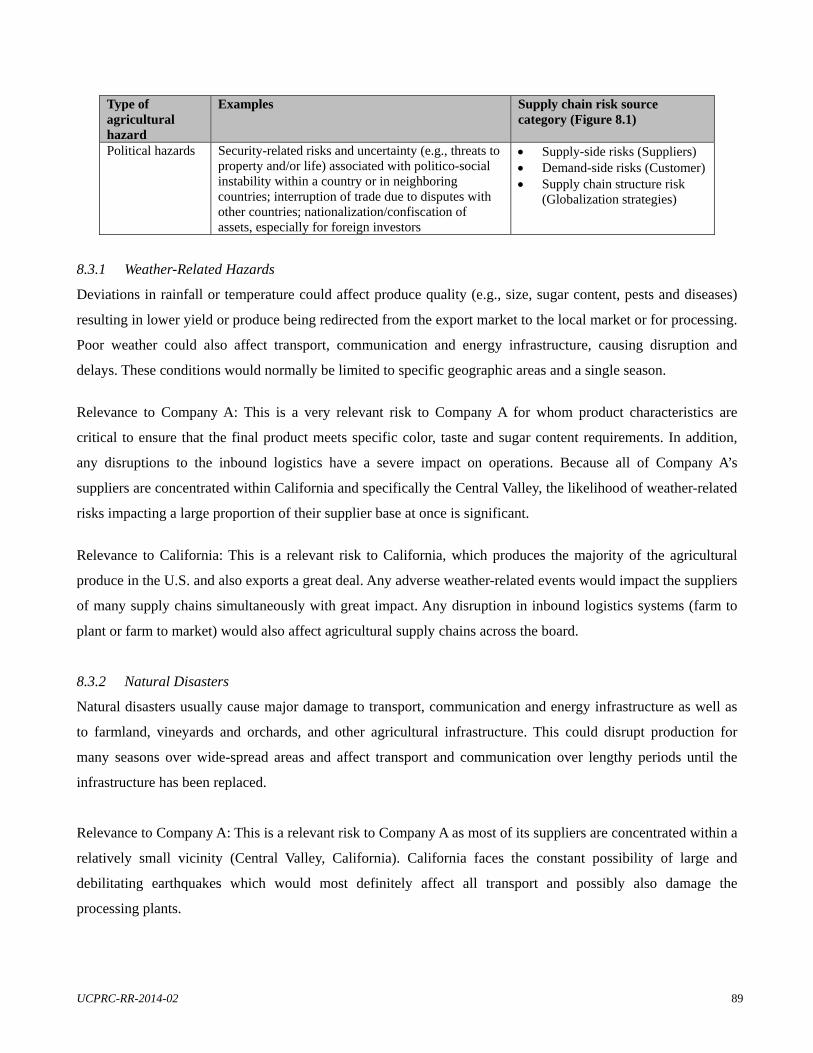
UCPRC-RR-2014-02 89
Type of agricultural hazard
Examples Supply chain risk source category (Figure 8.1)
Political hazards Security-related risks and uncertainty (e.g., threats to property and/or life) associated with politico-social instability within a country or in neighboring countries; interruption of trade due to disputes with other countries; nationalization/confiscation of assets, especially for foreign investors
Supply-side risks (Suppliers) Demand-side risks (Customer) Supply chain structure risk
(Globalization strategies)
8.3.1 Weather-Related Hazards
Deviations in rainfall or temperature could affect produce quality (e.g., size, sugar content, pests and diseases)
resulting in lower yield or produce being redirected from the export market to the local market or for processing.
Poor weather could also affect transport, communication and energy infrastructure, causing disruption and
delays. These conditions would normally be limited to specific geographic areas and a single season.
Relevance to Company A: This is a very relevant risk to Company A for whom product characteristics are
critical to ensure that the final product meets specific color, taste and sugar content requirements. In addition,
any disruptions to the inbound logistics have a severe impact on operations. Because all of Company A’s
suppliers are concentrated within California and specifically the Central Valley, the likelihood of weather-related
risks impacting a large proportion of their supplier base at once is significant.
Relevance to California: This is a relevant risk to California, which produces the majority of the agricultural
produce in the U.S. and also exports a great deal. Any adverse weather-related events would impact the suppliers
of many supply chains simultaneously with great impact. Any disruption in inbound logistics systems (farm to
plant or farm to market) would also affect agricultural supply chains across the board.
8.3.2 Natural Disasters
Natural disasters usually cause major damage to transport, communication and energy infrastructure as well as
to farmland, vineyards and orchards, and other agricultural infrastructure. This could disrupt production for
many seasons over wide-spread areas and affect transport and communication over lengthy periods until the
infrastructure has been replaced.
Relevance to Company A: This is a relevant risk to Company A as most of its suppliers are concentrated within a
relatively small vicinity (Central Valley, California). California faces the constant possibility of large and
debilitating earthquakes which would most definitely affect all transport and possibly also damage the
processing plants.
90 UCPRC-RR-2014-02
Relevance to California: California faces the constant possibility of large and debilitating earthquakes which
could affect all supply chains in terms of damaging transport and communication infrastructure as well as supply
chain facilities.
8.3.3 Biological and Environmental Hazards
Biological risks relate to pests and diseases while environmental risks relate to soil erosion or contamination. All
of these result in loss of quantity and/or quality of produce, which in turn affects the volumes to be transported
and the destinations – lower quality produce will be processed or sent to the local market rather than exported.
Relevance to Company A: This is an unlikely but relevant risk as a significant deviation in the quality of
incoming produce means that Company A cannot manufacture its products (product standards have been set).
Once again, the concentration of suppliers in the same geographic vicinity could increase the impact of
biological or environmental risks if these are widespread.
Relevance to California: Once again, this is an unlikely but relevant risk. (Unlikely, because of the very stringent
laws and regulations already in place in California.) However, the concentration of the country’s agricultural
suppliers in California does increase the impact of any widespread biological and environmental risks.
8.3.4 Market-Related Hazards
Market-related risks include aspects such as changes in market demand for quantity and/or quality, changes in
food safety requirements, changes in prices of inputs, etc. This could result in produce being diverted to other
international markets or sold locally. (Energy prices contribute significantly to input costs in California and are
thus discussed separately in Section 8.3.5)
Relevance to Company A: Company A produces a standardized commodity product which already adheres to
strict quality standards. Changes in market demand do not pose a significant risk as it is highly unlikely.
Changes in food safety requirements may affect the processing and/or labeling of the product which could add
additional time or costs. What does pose a concern is a significant increase in input costs. Company A’s product
is a low margin, high-volume product, thus changes in the input prices (such as the cost of logistics due to fuel
price escalations) could definitely affect profitability.
Relevance to California: Changes in the input prices pose a risk to all Californian agricultural supply chains as
these typically deal with low margin products. Pricing volatility especially poses a risk to smaller businesses in
the sector that may not be able to absorb the shock of increased prices. In general, the demand for Californian
UCPRC-RR-2014-02 91
produce is stable and high volume, making it unlikely that there will be a significant change in the quantity or
quality demanded. Food safety regulations would definitely affect processes and labeling – incurring further
costs or delays in the supply chain.
8.3.5 Logistics and Infrastructure Hazards
Disruptions in logistics and infrastructure availability, such as impassable roads and power outages, can result in
quality problems or missing a market opportunity. Other sources of risk include uneven road surfaces or poor
truck-loading practices, which could result in product damage. The latter has been an area of focused research in
the associated vehicle-pavement interaction tasks associated with this logistics study.
Relevance to Company A: This risk is highly significant to Company A. Disruptions due to congestion or road
works can severely hamper operations and result in great losses during the harvesting season. In general, a
rougher road condition increases vehicle operating costs and cargo damage (refer to the Vehicle-Pavement
Interaction Pilot Study).
Relevance to California: In general California’s road network is aging and operating close to capacity. The
state’s supply chains are extremely vulnerable to failures of the road network – especially considering the high
dependence on truck freight versus other modes. In fact, a breakdown in the road network in California would
affect supply chains across the continental U.S. as California acts as a gateway state for foreign trade.
Roland-Holst and Zilberman [53] found that California farmers are affected more by the energy price than most
other sectors and that the level of energy dependence varies considerably across the range of farm products. The
study took into account both direct and indirect effects of energy price increases. For example, an increase in the
price of energy will result in a direct production cost increase due to the energy used in a cotton mill. Indirect
effects will result from energy-induced cost increases of inputs such as fertilizers and pesticides (upstream
effects) and increased transport and distribution costs (downstream effects). Two-thirds of agricultural products
were above the median global value for the economy as a whole, meaning that they are more vulnerable. Farm
products were generally more vulnerable than processed food products. Indirect effects generally contribute
more than direct effects in agriculture and food processing. Only transport services and agrochemicals were
more vulnerable than farming. Farm products can be grouped into three categories: livestock and field crops
which have low value per volume and are the most vulnerable; fruit, vegetables and poultry are less vulnerable,
and nursery products and flowers, which are high-value crops, are the least vulnerable.
92 UCPRC-RR-2014-02
Relevance to Company A: Energy prices are one of the input prices referred to in Section 8.3.4 and therefore
Company A is highly vulnerable to fluctuations in the energy price.
Relevance to California: As discussed above, California is extremely vulnerable to energy price fluctuations.
8.3.6 Managerial and Operational Hazards
Managerial and operational risks are closely related to errors of human judgment and breakdown of equipment.
This could result in changes of input and transport requirements, delays of product availability, quality
problems, products being diverted to other markets, etc.
Relevance to Company A: During the harvesting season, Company A’s efficiency is highly dependent on the
quality of its managerial processes and the adaptability and experience of the managers in charge. Automating
some elements of the system (as is being done at the larger of the two processing plants visited) would remove
opportunity for error, but the risk will never be fully diverted.
Relevance to California: The severity of managerial and operational risks is closely linked to individual supply
chain design and cannot be assessed generically for California.
8.3.7 Public Policy and Institutional Hazards
Changes in policies and regulations could change the “rules of the game” and affect relationships between role-
players. It can result in certain products or markets becoming less profitable and can change the flows of goods
and services.
Relevance to Company A: This risk is not particularly relevant to Company A.
Relevance to California: It is difficult to assess the vulnerability of the broader Californian agricultural sector to
this risk without a more representative investigation.
8.3.8 Political Risks
Political unrest in a country could disrupt trade flows, resulting in unavailability of products.
Relevance to Company A: Not particularly relevant to Company A at this time.
Relevance to California: Refer to discussion in Section 8.5.
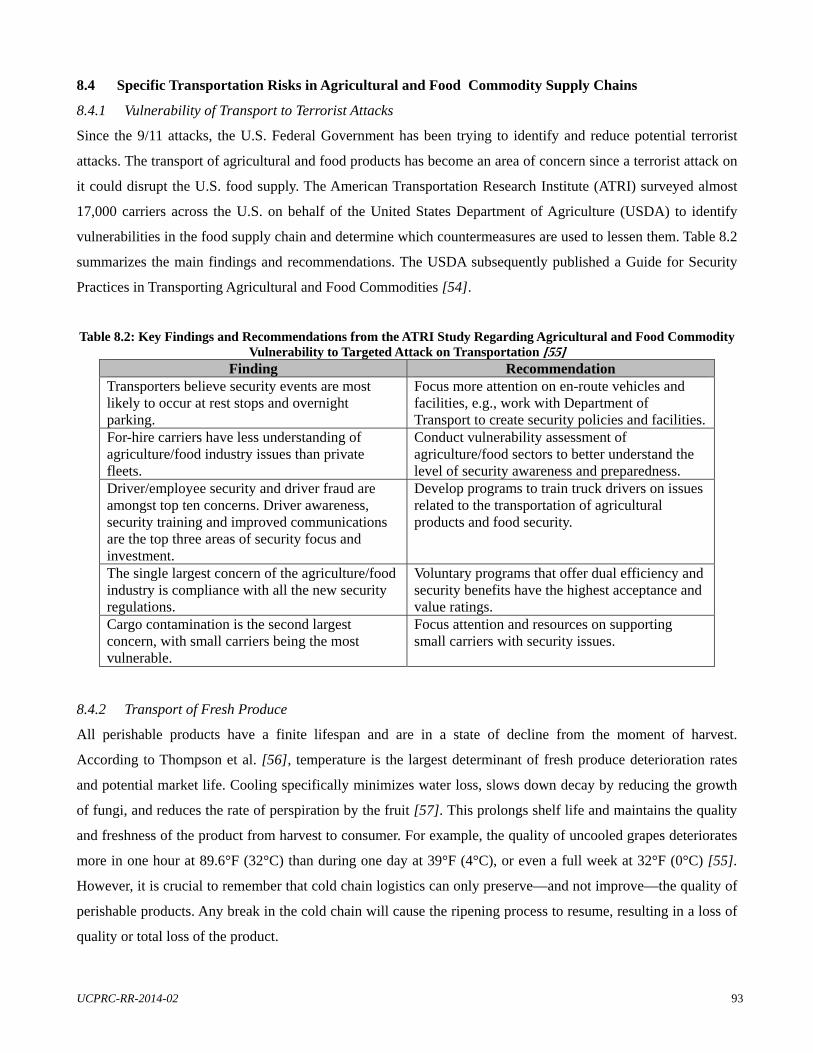
UCPRC-RR-2014-02 93
8.4 Specific Transportation Risks in Agricultural and Food Commodity Supply Chains
8.4.1 Vulnerability of Transport to Terrorist Attacks
Since the 9/11 attacks, the U.S. Federal Government has been trying to identify and reduce potential terrorist
attacks. The transport of agricultural and food products has become an area of concern since a terrorist attack on
it could disrupt the U.S. food supply. The American Transportation Research Institute (ATRI) surveyed almost
17,000 carriers across the U.S. on behalf of the United States Department of Agriculture (USDA) to identify
vulnerabilities in the food supply chain and determine which countermeasures are used to lessen them. Table 8.2
summarizes the main findings and recommendations. The USDA subsequently published a Guide for Security
Practices in Transporting Agricultural and Food Commodities [54].
Table 8.2: Key Findings and Recommendations from the ATRI Study Regarding Agricultural and Food Commodity Vulnerability to Targeted Attack on Transportation [55]
Finding Recommendation Transporters believe security events are most likely to occur at rest stops and overnight parking.
Focus more attention on en-route vehicles and facilities, e.g., work with Department of Transport to create security policies and facilities.
For-hire carriers have less understanding of agriculture/food industry issues than private fleets.
Conduct vulnerability assessment of agriculture/food sectors to better understand the level of security awareness and preparedness.
Driver/employee security and driver fraud are amongst top ten concerns. Driver awareness, security training and improved communications are the top three areas of security focus and investment.
Develop programs to train truck drivers on issues related to the transportation of agricultural products and food security.
The single largest concern of the agriculture/food industry is compliance with all the new security regulations.
Voluntary programs that offer dual efficiency and security benefits have the highest acceptance and value ratings.
Cargo contamination is the second largest concern, with small carriers being the most vulnerable.
Focus attention and resources on supporting small carriers with security issues.
8.4.2 Transport of Fresh Produce
All perishable products have a finite lifespan and are in a state of decline from the moment of harvest.
According to Thompson et al. [56], temperature is the largest determinant of fresh produce deterioration rates
and potential market life. Cooling specifically minimizes water loss, slows down decay by reducing the growth
of fungi, and reduces the rate of perspiration by the fruit [57]. This prolongs shelf life and maintains the quality
and freshness of the product from harvest to consumer. For example, the quality of uncooled grapes deteriorates
more in one hour at 89.6°F (32°C) than during one day at 39°F (4°C), or even a full week at 32°F (0°C) [55].
However, it is crucial to remember that cold chain logistics can only preserve—and not improve—the quality of
perishable products. Any break in the cold chain will cause the ripening process to resume, resulting in a loss of
quality or total loss of the product.
94 UCPRC-RR-2014-02
Another important cause of deterioration in fruit and vegetables is water loss. Water loss can be prevented by
maintaining the correct temperature and humidity. Care should be taken when transporting or storing different
commodities together, as they might have different ideal temperature or humidity requirements. In addition,
some commodities such as onions and garlic produce strong odors which might give off-flavors to commodities
such as apples and pears. Since ethylene hastens the ripening of certain commodities, these commodities should
not be stored or transported with commodities that give off significant quantities of ethylene [58].
Packaging should protect the produce during transport and handling. It should allow sufficient air flow to keep
the product at the desired temperature, prevent dehydration, and avoid collapse from high humidity. Packaging
should also protect the produce against bruising during transport and handling. Fresh produce should preferably
be cooled to its desired temperature before transport since refrigerated trucks and refrigerated containers can
only maintain product temperatures – they do not have the capacity to significantly reduce the product
temperature.
“It is important to bear in mind that quality is the factor that sells the final product. Quality can be maintained
only if all links in the handling and distribution chain show equal consideration for the commodities.” [58].
8.5 General Risks in the Transport and Warehousing Sector
8.5.1 The Role of Third-Party Logistics in the Supply Chain
The Transport and Warehousing sector comprises mostly companies to whom various logistics activities have
been outsourced. Such companies have come to be known as third-party logistics service providers or 3PLs.
These companies provide a broad range of logistics services including transport, warehousing, inventory
management, cross-docking, freight forwarding, and general supply chain management functions. A company
may choose to outsource its logistics to a 3PL because logistics is simply not that company’s core competence.
Other companies use 3PLs to make their operations more flexible to supply and demand volatility. Transport and
storage capacity can be “contracted in” when demand or supply surges and then phased out – or replaced by in-
house capacity if the surges turn out to be consistent and predictable business. 3PLs play a pivotal role in both of
these supply chain strategies.
3PLs, in essence, support the goals and objectives of the supply chains they serve. For example agile supply
chains in consumer electronics need highly responsive 3PLs that prioritize speed of delivery, whereas
commodity supply chains require cost optimization to ensure that the small margins on these products are
protected from unnecessary transport or warehousing costs.
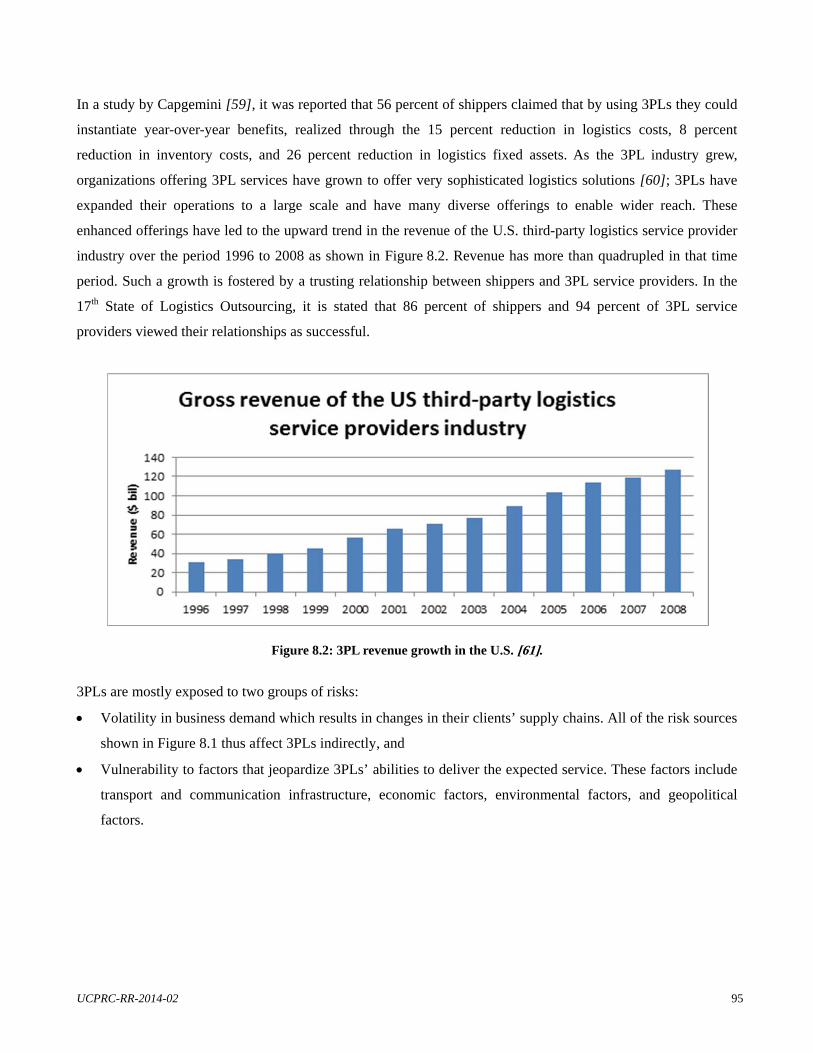
UCPRC-RR-2014-02 95
In a study by Capgemini [59], it was reported that 56 percent of shippers claimed that by using 3PLs they could
instantiate year-over-year benefits, realized through the 15 percent reduction in logistics costs, 8 percent
reduction in inventory costs, and 26 percent reduction in logistics fixed assets. As the 3PL industry grew,
organizations offering 3PL services have grown to offer very sophisticated logistics solutions [60]; 3PLs have
expanded their operations to a large scale and have many diverse offerings to enable wider reach. These
enhanced offerings have led to the upward trend in the revenue of the U.S. third-party logistics service provider
industry over the period 1996 to 2008 as shown in Figure 8.2. Revenue has more than quadrupled in that time
period. Such a growth is fostered by a trusting relationship between shippers and 3PL service providers. In the
17th State of Logistics Outsourcing, it is stated that 86 percent of shippers and 94 percent of 3PL service
providers viewed their relationships as successful.
Figure 8.2: 3PL revenue growth in the U.S. [61].
3PLs are mostly exposed to two groups of risks:
Volatility in business demand which results in changes in their clients’ supply chains. All of the risk sources
shown in Figure 8.1 thus affect 3PLs indirectly, and
Vulnerability to factors that jeopardize 3PLs’ abilities to deliver the expected service. These factors include
transport and communication infrastructure, economic factors, environmental factors, and geopolitical
factors.
96 UCPRC-RR-2014-02
8.5.2 Transport Infrastructure
In Section 3.1.2 the freight flows of California were analyzed. It was found that:
72 percent of all commodities that were exported from California to the rest of the world were
transported domestically by road;
44 percent of imports through California were transported domestically by road, and
83.6 percent of regional exports and 77.81 percent of regional imports (to and from other states) were
transported by truck.
The San Joaquin Valley (SJV) Interregional Goods Movement Plan also estimated that 93 percent of all
commodities will be transported by truck in the SJV in 2040.
Thus road infrastructure is critical in California and one of the primary modes used by 3PLs. The study by
McKinnon [51], Life without Trucks: The Impact of a Temporary Disruption of Road-Freight Transport on a
National Economy, is a detailed narrative on how a temporary disruption in road-freight services can completely
cripple the economy. The interested reader is referred to this article that analyzes the domino-effect that would
occur in each of the major goods movement-dependent sectors.
Although it is obvious that a complete disruption of road freight would be detrimental to 3PLs and their clients,
partial disruptions or even just short-term delays could also prove detrimental. Logistics trends such as
Inventory-pull systems (Section 5.3.3) place a premium on transport reliability and speed. If a 3PL cannot
deliver within specific lead times or adhere to certain delivery or pickup appointments due to road works,
congestion, or unplanned inspections it would affect their business performance.
Relevance to Company B: The intrastate pickups and deliveries of Company B fall prey to urban congestion on
a daily basis. The continuous road-works on the highways surrounding the Bay Area also impact their trips.
Although the operational managers felt that there is enough flexibility in their schedules to work around these
disruptions, the act of “working around” causes a lot of extra work for Company B. In cases where Company B
did not have forewarning of a disruption, drivers need to seek alternatives. The transport infrastructure is a major
source of vulnerability to Company B.
Relevance to California: Congestion (a result of inadequate road capacity) and road works (a result of the aging
Californian road network) seem to be the two major elements that cause delay and disruption in California.
Earthquakes and targeted terror attacks could disable entire portions of the network but the occurrence of these
events is highly uncertain.
UCPRC-RR-2014-02 97
8.5.3 Communications Infrastructure
Supply chains depend increasingly on information technology (IT) to optimize operations, communicate,
coordinate and collaborate between supply chain partners and to provide visibility and system intelligence on
the supply chain operations. Consequently, 3PLs are also becoming more tech-savvy, employing systems that
not only manage and optimize their own systems, but can also interface with client systems. For instance, some
3PLs create cloud-based functionality for shippers to enter their shipment data and obtain an automatic quote for
the transportation of the goods. The 3PL uses this information in turn to consolidate multiple shippers’
shipments. IT has truly revolutionized supply chain performance, but the heavy reliance on these systems for the
execution of even the smallest tasks leave supply chains vulnerable to failure or attack. Natural or man-made
disasters or terrorist attacks could disable the physical infrastructure while hacker activity can infiltrate and
harm the systems themselves.
Relevance to Company B: Company B depends on an automated internal system to sort and consolidate
shipments and to communicate with drivers en route. Customers are also able to submit order requests online.
Although operations would be disrupted somewhat by a failure in the system, there are a number of points of
human interaction in the process that would firstly allow the company to detect the failure and secondly enable
the operations to recover despite system failure. This is not a major source of vulnerability to Company B.
Relevance to California: In general, supply chains in California are highly dependent on IT and communications
infrastructure. Given California’s prominence in terms of U.S. trade and its propensity to experience
earthquakes, this is a high-level vulnerability.
8.5.4 Economic Volatility
Commodity price volatility places strain on companies; among the factors are those of recessions, fuel price
fluctuations, and excessive inventory. To overcome the effect of these factors on the bottom line, companies
utilize 3PLs to increase flexibility. Sudden demand shocks also open the door for the use of 3PLs, especially if a
company cannot accommodate higher capacities. Conversely, 3PLs can lose business quite quickly when
demand plummets and companies only use in-house capabilities. 3PLs are thus vulnerable to significant changes
in commodity prices
Supply chains have also become increasingly global – exposing them to exchange rate fluctuations and a whole
host of uncertainties related to import and export taxes. International Commercial Terms (Incoterms) as defined
by the International Chamber of Commerce (ICC) are used in trade to specify which parties pay for (and thus
accept the risk related to) certain legs of the transport process. These terms are used to eliminate any
98 UCPRC-RR-2014-02
uncertainties when dealing with international customers or suppliers. For instance, Ex Works (EXW) states that
the seller should make the goods available for pickup at his own facility, transferring the risks and obligation of
uploading and transporting the goods to the buyer. Free on board (FOB) states that the seller is responsible to
load the goods on a vessel specified by the buyer. All costs and the associated transport risks are shared while on
board. Different Incoterms shift the risks and costs to different parties in the supply chain. 3PLs are just as
exposed to exchange rate fluctuations and Incoterms as the supply chains they serve.
Relevance to Company B: Company B’s participation in global supply chains is limited to Canada which poses
a relatively limited threat in terms of exchange rate volatility.
Relevance to California: California is the gateway of the continental U.S., thus most major 3PLs will be faced
with vulnerabilities posed by exchange rate fluctuations.
8.5.5 Environmental Regulation
Environmental sustainability and safety are becoming increasingly important. Road freight is notorious for its
disproportionate contribution to harmful emissions and road accidents and is becoming increasingly more
regulated in this regard. 3PLs are highly dependent on road freight and thus ever-stricter regulations make them
vulnerable to increasing costs and operational delays. Although 3PLs do not disagree with the principles and
intent of the regulations, the uncertainty regarding the implementation of regulation is the greater risk.
The vulnerability resulting from natural disasters is primarily related to the consequent destruction of
infrastructure and has been discussed in Sections 8.5.2 to 8.5.3.
Relevance to Company B: Company B is very vulnerable to any changes in regulations relating to the
environmental “friendliness” of their trucks and route restrictions.
Relevance to California: California has by far the most stringent environmental regulations when it comes to
freight transport. It is not the principle or content of the regulations that pose the biggest threat to 3PLs but
rather the uncertainty around their implementation.
8.5.6 Geopolitical Unrest
Among the most profound geopolitical risks are those of social conflict, political unrest, and terrorism. As the
global nature of supply chains exposes them to social conflict and political unrest in other countries, so also can
the operations of 3PLs can also be hampered by social conflict and political unrest affecting its clients.
UCPRC-RR-2014-02 99
Terrorist or targeted attacks could pose a great threat to 3PLs. If general transport or communication
infrastructure is targeted, the impact will be widespread, affecting many companies. But the nature of 3PLs –
consolidating large shipments for high-volume shippers using a network of large terminals and fleets – could
make individual 3PLs targets for attack as well.
Relevance to Company B: Geopolitical factors were not mentioned as a specific vulnerability to Company B.
However, a change in the Canadian cabotage laws could drastically change their business model.
Relevance to California: As a gateway for U.S. trade, California is a prime target for infrastructure attacks.
8.6 Supply Chain Network Design
Klibi et al. [2] define Supply Chain Network (SCN) design as the “strategic decisions on the number, location,
capacity and mission of production-distribution facilities in a company, or of a set of collaborating companies, in
order to provide goods to a predetermined, but possibly evolving, customer base. It also involves decisions
related to the selection of suppliers, subcontractors and 3PLs, and to the offers to make to product-markets.”
These decisions are made as part of the long-term planning of a new SCN or during the process of re-
engineering or expanding an existing SCN. It is estimated that redesigning an SCN frequently can result in a
logistics cost reduction between 5 percent and 15 percent, while maintaining or improving the customer service
levels of the supply chain [62].
Some of the strategic decisions typically considered during SCN design include the number, location and
capacity of supply chain facilities (warehouses or storage sites, plants or manufacturing sites, distribution
centers, retail outlets, etc.); the type of products handled at the different supply chain facilities; the way in which
these facilities serve customers; the markets to target; the activities and products to externalize; the selection of
suppliers and partners; as well as the means of transportation in the network [2, 63, 64].
In addition to these strategic questions other factors that contribute to the complexity of SCN design are the
industry structure, the global coverage of the network, the long-term impact of design decisions, and uncertainty
[2]. During the design of the SCN it is imperative to anticipate future product flows in the network and their
associated costs and service levels, as the actual impact of these strategic decisions will only be realized after
implementation.
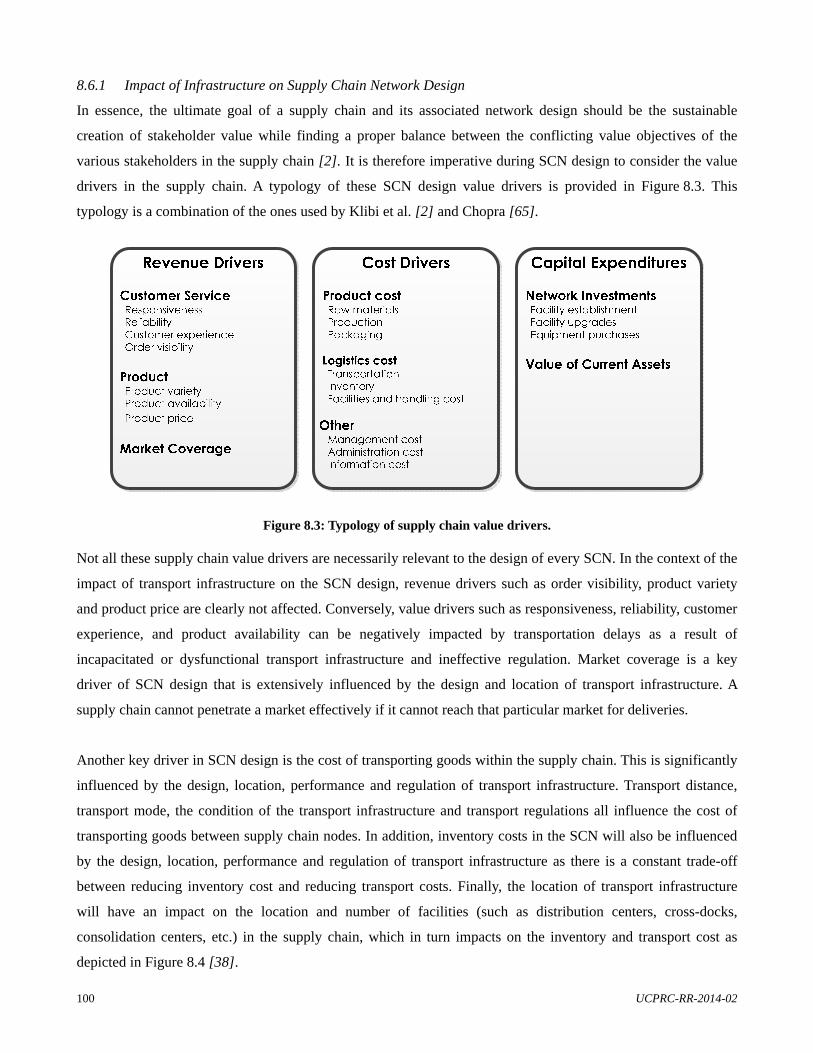
100 UCPRC-RR-2014-02
8.6.1 Impact of Infrastructure on Supply Chain Network Design
In essence, the ultimate goal of a supply chain and its associated network design should be the sustainable
creation of stakeholder value while finding a proper balance between the conflicting value objectives of the
various stakeholders in the supply chain [2]. It is therefore imperative during SCN design to consider the value
drivers in the supply chain. A typology of these SCN design value drivers is provided in Figure 8.3. This
typology is a combination of the ones used by Klibi et al. [2] and Chopra [65].
Figure 8.3: Typology of supply chain value drivers. Not all these supply chain value drivers are necessarily relevant to the design of every SCN. In the context of the
impact of transport infrastructure on the SCN design, revenue drivers such as order visibility, product variety
and product price are clearly not affected. Conversely, value drivers such as responsiveness, reliability, customer
experience, and product availability can be negatively impacted by transportation delays as a result of
incapacitated or dysfunctional transport infrastructure and ineffective regulation. Market coverage is a key
driver of SCN design that is extensively influenced by the design and location of transport infrastructure. A
supply chain cannot penetrate a market effectively if it cannot reach that particular market for deliveries.
Another key driver in SCN design is the cost of transporting goods within the supply chain. This is significantly
influenced by the design, location, performance and regulation of transport infrastructure. Transport distance,
transport mode, the condition of the transport infrastructure and transport regulations all influence the cost of
transporting goods between supply chain nodes. In addition, inventory costs in the SCN will also be influenced
by the design, location, performance and regulation of transport infrastructure as there is a constant trade-off
between reducing inventory cost and reducing transport costs. Finally, the location of transport infrastructure
will have an impact on the location and number of facilities (such as distribution centers, cross-docks,
consolidation centers, etc.) in the supply chain, which in turn impacts on the inventory and transport cost as
depicted in Figure 8.4 [38].
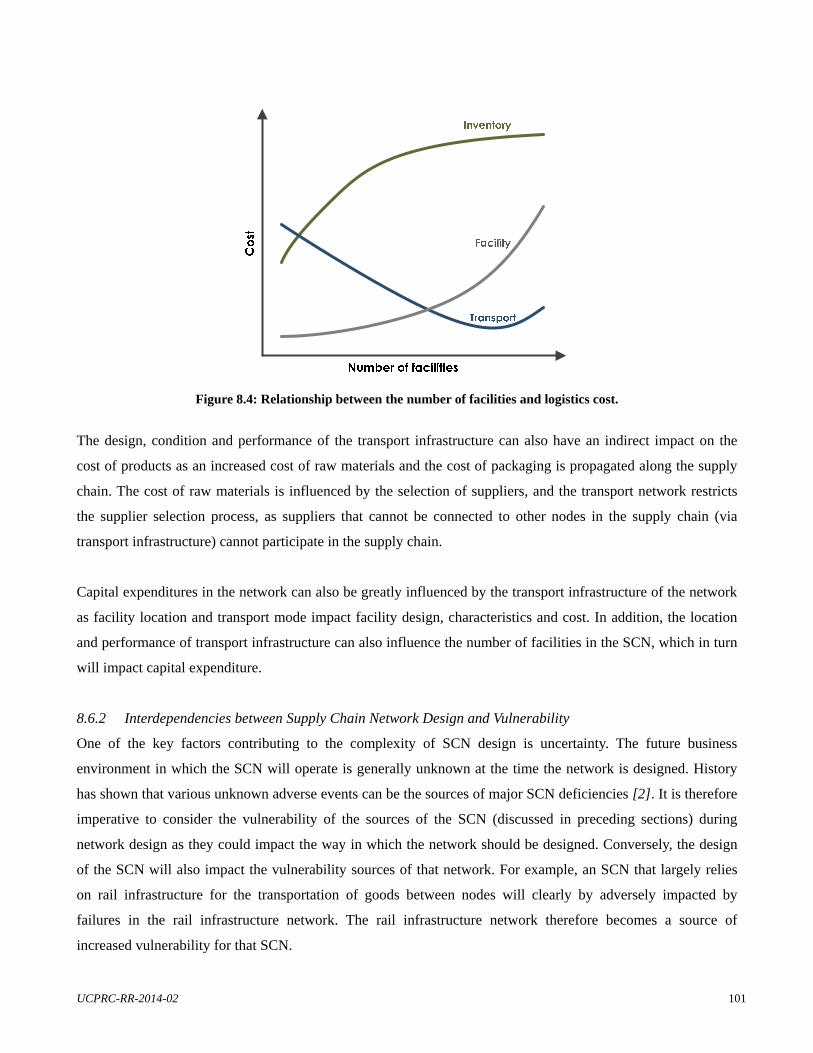
UCPRC-RR-2014-02 101
Figure 8.4: Relationship between the number of facilities and logistics cost.
The design, condition and performance of the transport infrastructure can also have an indirect impact on the
cost of products as an increased cost of raw materials and the cost of packaging is propagated along the supply
chain. The cost of raw materials is influenced by the selection of suppliers, and the transport network restricts
the supplier selection process, as suppliers that cannot be connected to other nodes in the supply chain (via
transport infrastructure) cannot participate in the supply chain.
Capital expenditures in the network can also be greatly influenced by the transport infrastructure of the network
as facility location and transport mode impact facility design, characteristics and cost. In addition, the location
and performance of transport infrastructure can also influence the number of facilities in the SCN, which in turn
will impact capital expenditure.
8.6.2 Interdependencies between Supply Chain Network Design and Vulnerability
One of the key factors contributing to the complexity of SCN design is uncertainty. The future business
environment in which the SCN will operate is generally unknown at the time the network is designed. History
has shown that various unknown adverse events can be the sources of major SCN deficiencies [2]. It is therefore
imperative to consider the vulnerability of the sources of the SCN (discussed in preceding sections) during
network design as they could impact the way in which the network should be designed. Conversely, the design
of the SCN will also impact the vulnerability sources of that network. For example, an SCN that largely relies
on rail infrastructure for the transportation of goods between nodes will clearly by adversely impacted by
failures in the rail infrastructure network. The rail infrastructure network therefore becomes a source of
increased vulnerability for that SCN.

102 UCPRC-RR-2014-02
UCPRC-RR-2014-02 103
9 THE SPREAD OF ECONOMIC SECTORS IN CALIFORNIA AND IMPLICATIONS FOR ROAD INFRASTRUCTURE AND REGULATION
9.1 The Value and Spatial Spread of Goods-Movement Dependent Sectors in California
Supply chain design and vulnerability are influenced by the transportation network along which goods
movement must take place and the regulations that administer this freight flow. The previous chapter presented
an overview of the concepts of supply chain vulnerability and design and discussed how relevant design and
vulnerability factors differ between economic sectors. Extended discourses on vulnerability in the Agriculture,
Forestry and Fishing and the Transportation and Warehousing sectors were presented and linked to findings in
the case studies.
There are ten goods movement-dependent economic sectors identified from the United States Census Bureau
classification of sectors namely:
Mining;
Utilities;
Agriculture, Forestry and Fishing;
Manufacturing;
Transportation and Warehousing;
Retail Trade;
Wholesale Trade;
Waste Management;
Health Care and Social Assistance, and
Accommodation and Food Services.
The San Joaquin Valley Interregional Goods Movement Plan also identifies the first eight sectors above as goods
movement dependent, but classifies Waste Management, Healthcare and social assistance and Accommodation
and food services as consumer goods and service sectors. The authors of this pilot study agree with McKinnon
[51] who noted that if freight transport were to be disrupted, these specific service sectors would grind to a halt
as well and therefore they are, in fact, dependent on goods movement. In addition, these sectors contribute
markedly to quality of life.
The supply chains within these 10 sectors all have distinct characteristics that make some supply chain design
and vulnerability considerations more important than others within different sectors. More importantly to this
pilot study, road infrastructure and regulations influence private sector decisions in various sectors differently,
specifically because of the distinct characteristics of their supply chains. This study does not comment on
104 UCPRC-RR-2014-02
sectors other than the Agriculture, Forestry, and Fishing and Transportation and Warehousing because no case
studies were performed with businesses in those other sectors.
It is critical for Caltrans to be aware of updated information about which sectors are present in which counties
and the size of those sectors. Having this awareness could alert Caltrans to the potential impact of certain road
infrastructure and regulation decisions on the various sectors present and spur collaboration with private
industry to mitigate potential negative effects. An example would be when Caltrans plans road works on a rural
road network in a county with a large agricultural sector. Caltrans would know that the timing of the road works
could have a detrimental effect on seasonal inbound logistics. To mitigate this, Caltrans could interact with local
private industry stakeholders to better time the road works.
The data describing economic activity by sector in the 58 counties of California were sourced from the United
States Census Bureau [66], using the American Fact Finder tool. Data are presented on both a sector and county
level. It is important to note that some data of industries and counties are withheld to avoid the disclosure of data
for individual companies. In particular, the values of the county-level agricultural sectors as represented by this
data source were much smaller than what could be found in other selected studies. Potential reasons are the
number of data points withheld for the sake of confidentiality and differing definitions of economic value. For
consistency’s sake, one data source is used throughout. The analysis that follows is based on available data.
It should also be kept in mind that the relation between dollar value and tons transported differs for each sector.
Therefore, for example, although more tons of agricultural product may be transported in a certain county, the
dollar value of a higher yielding industry (such as retail trade) may be greater than that of agriculture in that
county. In this section, economic contribution is analyzed instead of tons to ascertain a better picture of the
economic impact of sector supply chains.
Figure 9.1 presents the economic contribution of the 58 Californian counties in terms of the 10 goods movement
dependent sectors. The counties are shaded according to their relative contribution. Economic value is here
defined as “employer value of sales, shipments, receipts, revenue, or business done.” The five most prominent
counties were: Los Angeles, Orange, Alameda, Santa Clara, and San Diego. Los Angeles topped all counties
with 30.44 percent of economic value in California. The major ports of Los Angeles and Long Beach, which
allow for large-scale exports and imports, contribute to this high percentage. Figure 9.2 shows a detailed
breakdown of the economic contribution of Los Angeles and Orange counties by sector. It is clear that the
wholesale trade, manufacturing and retail trade sectors are the greatest contributors to these counties’ economic
well-being among the 10 goods movement dependent sectors. The detailed breakdown of the remaining 56
counties are provided in Figure F.1 through Figure F.8 in Appendix F.
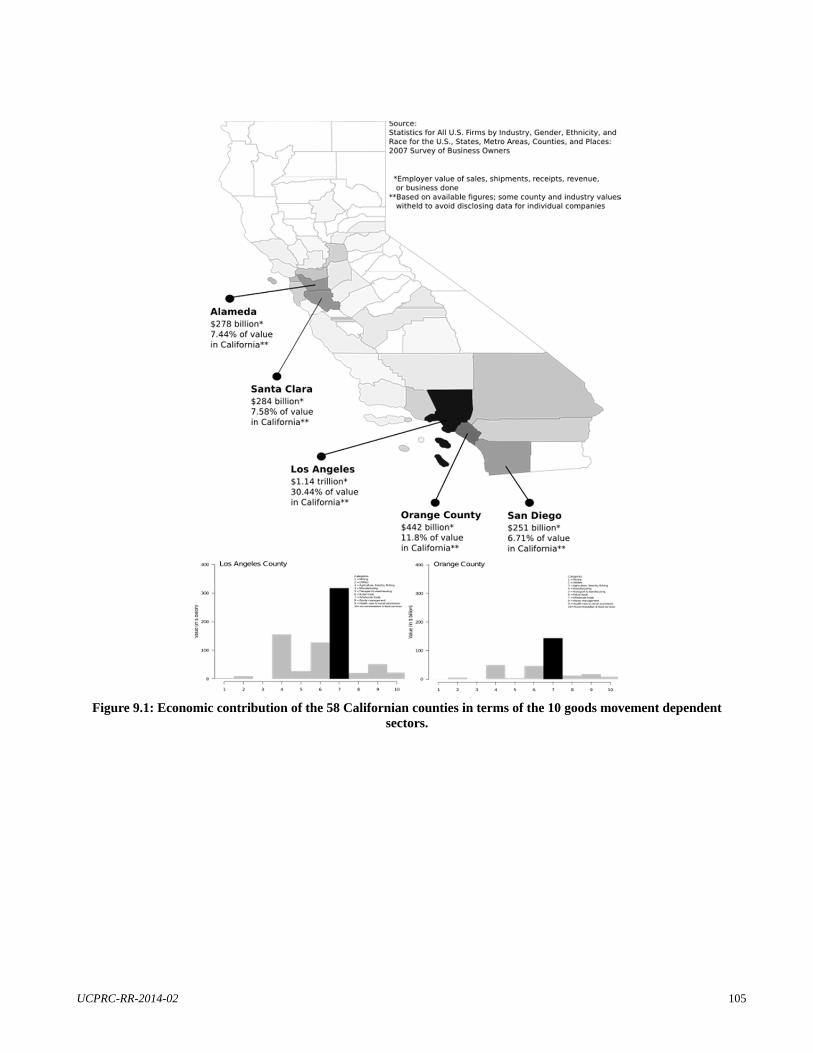
UCPRC-RR-2014-02 105
Figure 9.1: Economic contribution of the 58 Californian counties in terms of the 10 goods movement dependent sectors.
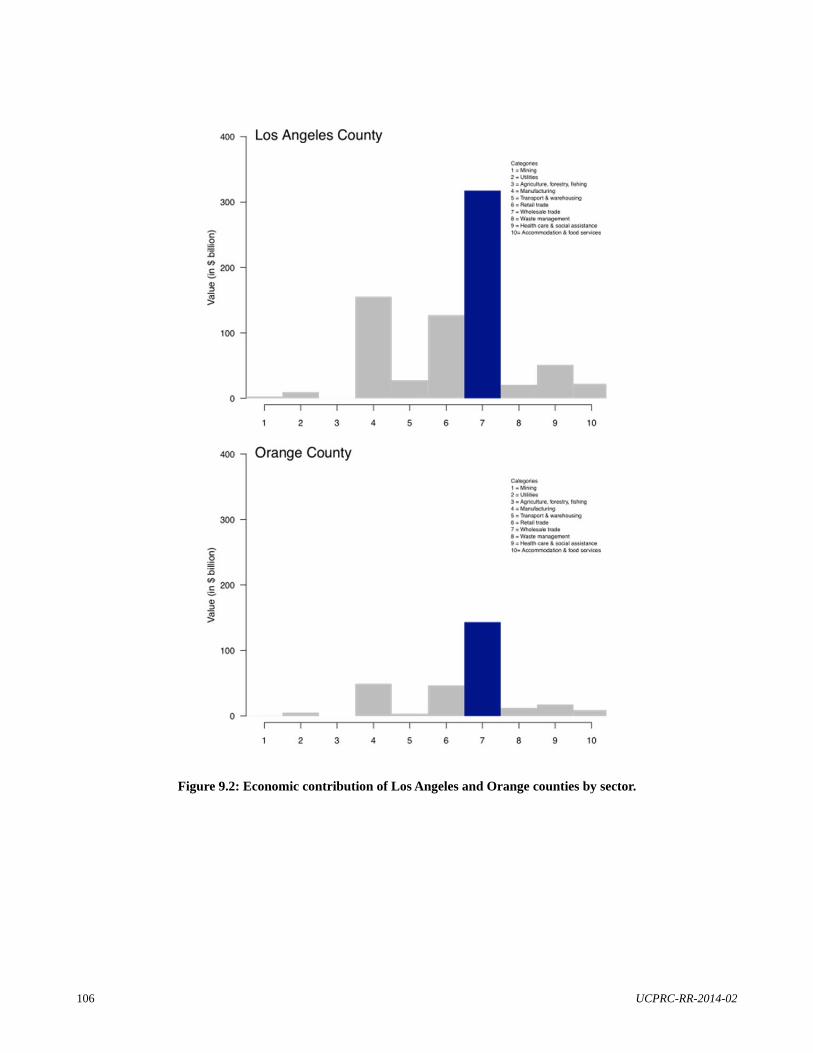
106 UCPRC-RR-2014-02
Figure 9.2: Economic contribution of Los Angeles and Orange counties by sector.
UCPRC-RR-2014-02 107
10 CONCLUSION AND WAY FORWARD
10.1 Implications of the Findings of the Logistics Augmentation Pilot Study for Caltrans
This study has shown through desktop studies, qualitative analysis and case studies that road infrastructure and
regulation, as managed by Caltrans, has a marked impact on supply chain operations and strategies. This is one
instance where public sector decision making greatly influences private sector decision making. The analysis has
shown that, in this instance, the reciprocal influence of private sector decision making on public sector decision
making is not as significant. Given the critical role that supply chains play in the economic well-being of and
quality of life in California and the dependence of these supply chains on the road infrastructure and regulation,
it is imperative that the public sector (Caltrans) and the private sector engage throughout the planning and
construction of road infrastructure as well as during the drafting and implementation of policy. There have been
a few successful efforts in this regard, for example the recent establishment of the California Freight Advisory
Committee and the deliberate and interactive inclusion of private sector stakeholders during the drafting of the
San Joaquin Valley (SJV) Interregional Good Movement Plan. “Shippers, receivers and transportation providers
will adapt to future transportation and land-use conditions, planned or unplanned. How, where, and, how well
they adapt will depend on how and when they are brought into the planning process. In the stakeholder meetings
for this project, consistent with consultant team experience elsewhere, the quality and insightfulness of the
goods movement strategies offered improved as direct public-private communications increased.” [16].
The first step in more meaningful engagement between Caltrans and the private sector is an adequate
understanding of how and when road infrastructure and regulations influence supply chains. In this pilot study it
has been identified that road infrastructure and regulations have a direct effect on supply chain vulnerability and
design, and that private companies make decisions while taking these two elements into consideration. However,
supply chain vulnerability and design are different for each economic goods movement-dependent sector and
therefore a blanket approach will not suffice.
This pilot study presented the methodology for a sector-by-sector analysis that could inform Caltrans regarding
the intricacies and considerations regarding supply chain vulnerability and design in different sectors. The scope
of the pilot study was limited in the following terms:
Only two of the ten identified goods movement dependent sectors were analyzed, namely Agriculture,
Forestry and Fishing, and Transportation and Warehousing, and
Case studies were only conducted at one company in each of the sectors mentioned above.
108 UCPRC-RR-2014-02
In order for this study to be comprehensive enough to form part of Caltrans’ routine decision making regarding
road infrastructure and regulation, the scope needs to be expanded to cover all goods movement-dependent
sectors and the study needs to be deepened by conducting a representative ensemble of case studies in each
sector.
10.2 Expanding the Scope and Depth of the Logistics Augmentation Pilot Study
10.2.1 Expanding the Scope of the Study
For this study to significantly inform routine Caltrans decision making regarding road infrastructure and
regulation, it needs to be comprehensive, covering all goods movement-dependent economic sectors. Therefore
the following sectors should be included:
Mining;
Utilities;
Agriculture, Forestry and Fishing (additional case studies required);
Manufacturing;
Transportation and Warehousing (additional case studies required);
Retail Trade;
Wholesale Trade;
Waste Management;
Health Care and Social Assistance, and
Accommodation and Food Services.
The Central Coast California Commercial Flows Study [17] presents a practical methodology to identify and
analyze the major goods movement-dependent industries in a region of counties, and a similar approach could
be followed. Appendix G outlines a preliminary sector segmentation as a starting point for future studies.
10.2.2 Developing Representative Case Study Ensembles
Section 7.2 discussed the validity and value of the case study method in qualitatively researching topics in the
logistics and supply chain arena. The nature of the research question investigated in this pilot study necessitated
a detailed and qualitative understanding that required extensive inputs from private sector stakeholders.
Section 7.2 also discussed the methodological rigor required when generalizing insights and findings from case
studies. The scope and timing of this pilot study only allowed for two case study participants. These two
participants were selected using convenience sampling. Generalizing case study findings to an entire economic
sector would require targeted and deliberate selection of multiple participants to ensure that all subsectors of a
UCPRC-RR-2014-02 109
certain sector are represented. Supply chain consulting companies familiar with California’s economic sectors
can assist Caltrans in segmenting the different sectors and identifying potential participants. A list of potential
participants identified (but not followed up with) during the pilot study is contained in Appendix H.
From the private sector engagement process followed during this pilot study, a few suggestions are made to
facilitate buy-in from private sector participants:
Attend and participate in functions presented by organizational bodies such as the California Trucking
Association to make contacts, to become familiar with sector issues and to create awareness of the
study;
Establish a clear communication plan and format before engaging individual companies, and
Develop brief marketing summaries that describe the purpose of the study as well as the potential
benefits to the individual company if they participate.
10.3 Complex Network Analysis to Analyze Supply Chain Vulnerability Drivers in the Californian Road
Freight Network
The analysis done in this pilot study was primarily qualitative. Metrics and methodologies are currently being
developed by the Department of Industrial and Systems Engineering at the University of Pretoria to quantify the
impact of transport infrastructure vulnerability on supply chain performance using complex network theory and
simulation [67, 68]. Using these metrics and methodologies to conduct a quantitative, statewide study of the
linkages between the Californian road network and supply chain performance would provide very detailed
insight into the cause-and-effect relationships that should be prioritized during planning.
110 UCPRC-RR-2014-02
REFERENCES
1. California Department of Transportation (Caltrans). 2012. Fast Freight Facts: Commercial Vehicles: Trucks.
Available online: www.dot.ca.gov/hq/tpp/offices/ogm/fact_sheets/Fast_Freight_Facts_Trucks_bk_040612.
pdf. (Accessed April 15, 2013.)
2. Klibi, W., Martel, A. and Guitouni, A. 2010. The design of robust value-creating supply chain networks: A
critical review, European Journal of Operations Research, Vol. 203, pp. 283 – 293.
3. World Bank. 2012. Connecting to Compete: Trade Logistics in the Global Economy. Washington DC.
4. Council of Supply Chain Management Professionals (CSCMP). 2012. 23rd Annual State of Logistics
Report®: The Long and Winding Recovery. National Press Club. Washington, D.C.
5. Council for Industrial and Scientific Research (CSIR). 2012. 8th State of LogisticsTM survey for South Africa
2011. Available online: www.csir.co.za/sol.
6. National Cooperative Freight Research Program (NCFRP). 2009. Public and Private Sector Interdependence
in Freight Transportation Markets. NCFRP Report 1. ISBN 978-0-309-11790-6. Transportation Research
Board, National Academy of Sciences, Washington, D,C.
7. California Department of Transportation (Caltrans). 2006. California Transportation Plan 2025.
www.ca.dot.gov. Sacramento, California.
8. Strategic Highway Research Program (SHRP 2). 2013. Freight Demand Modeling and Data Improvement
Strategic Plan. SHRP 2 Report S2-C20-RW-2. ISBN: 978-0-309-12943-5. Transportation Research Board,
National Academy of Sciences, Washington, D.C.
9. California Department of Transportation (Caltrans). 2008. California State Rail Plan 2007-08 to 2017-18.
www.ca.dot.gov. Sacramento, California.
10. California Department of Finance. 2013. New population projections: California to surpass 50 million in
2049. Press release: 31 January 2013. Sacramento, California.
11. Center for Transportation Analysis. 2013. Freight Analysis Framework Version 3 (FAF3). Available online:
http://faf.ornl.gov/fafweb/Extraction0.aspx. (Accessed April 2013.) Federal Highway Administration.
12. U.S. Department of Transportation. 2011. Federal Highway Administration, Office of Freight Management
and Operations, Freight Analysis Framework, version 3.1.2.
13. Golob, T.F., and Regan, A.C. 2000. Impacts of Highway Congestion of Freight Operations: Perceptions of
Trucking Industry Managers. 79th Annual Meeting of the Transportation Research Board. January 9-13,
2000. Washington, D.C.
14. Business, Transportation and Housing Agency (BTH) and California Environmental Protection Agency
(CalEPA). 2005. Goods Movement Action Plan: Phase I: Foundations.
UCPRC-RR-2014-02 111
15. Business, Transportation and Housing Agency (BTH) and California Environmental Protection Agency
(CalEPA). 2007. Goods Movement Action Plan.
16. Cambridge Systematics, Inc. 2013. San Joaquin Valley Interregional Goods Movement Action Plan, Task 9:
Final Report. Prepared for: San Joaquin Valley Regional Transportation Planning Agencies.
17. Cambridge Systematics, Inc. 2012. Central Coast California Commercial Flows Study. Prepared for:
Association of Monterey Bay Area of Governments (AMBAG).
18. California Transportation Commission (CTC). 2010. 2010 Regional Transportation Plan Guidelines.
Sacramento, California.
19. Southern California Association of Governments (SCAG). 2012. Regional Transportation Plan 2012–2035,
Sustainable Community Strategy. Page 764 – 776. www.scag.ca.gov.
20. Metropolitan Transportation Commission (MTC). 2009. Transportation 2035 Plan for the San Francisco
Bay Area. www.mtc.ca.gov.
21. Sacramento Area Council of Governments (SACOG). 2012. Metropolitan Transportation Plan/Sustainable
Communities Strategy 2035. www.sacog.org/2035.
22. Regional Transportation Commission (RTC). 2013. 2035 Regional Transportation Plan.
www.rtcwashoe.com.
23. Merced County Association of Governments (MCAG). 2012. Fiscal year 2012-2013 Overall Work Program.
www.mcagov.org.
24. Colusa County Transport Commission (Colusa CTC). 2009. Overall Work Program for Transportation
Planning, Fiscal year 2009 – 2010. Available online: www.dot.ca.gov/hq/tpp/offices/orip/owp/index_files/
OWP%20pdf%20files/Colusa%20Final%20OWP%2009_10.pdf
25. Andreoli, D., Goodchild, A., and Jessup, E. 2012. Estimating truck trips with product specific data: a
disruption case study in Washington potatoes. Transportation Letters: The International Journal of
Transportation Research. Vol. 4, pp. 153-166.
26. National Cooperative Freight Research Program (NCFRP). 2013. Freight Data Cost Elements. NCFRP
Report 22. ISBN 978-0-309-25899-9. Transportation Research Board, National Academy of Sciences,
Washington, D.C.
27. Council of Supply Chain Management Professionals (CSCMP). 2013. 2013 Third - Party Logistics Study.
The state of Logistics Outsourcing. Results and findings of the 17th Annual Study. Council of Supply Chain
Management Professionals (CSCMP).
28. Carbone, L. and Soifer D. 2009. Third-Party Logistics: Keeping America’s Economy Moving. Lexington
Institute.
29. Logistics Quarterly, 2011. LQ’s Top 40 3PL in North America Report.
lqtoday.com/digital_publication/spring_2013/lqonlinemarch/ (Accessed April 23, 2013.)
112 UCPRC-RR-2014-02
30. MacIvor, Doug. 2013. Personal interview. California Department of Transportation, Sacramento. March 28,
2013.
31. American Trucking Association. 2011. American Trucking Trends 2011. ISBN 978-0-88711-432-8.
32. Ellram, L.M. 1996. The use of the case study method in logistics research. Journal of Business Logistics,
17(2), pp. 93-138.
33. Eisenhardt, K.M. 1989. Building theories from case study research. Academy of Management review. 14(4),
pp. 532-550.
34. Aitken, J. 1998. Supply chain integration within the context of a supplier association. PhD thesis, Cranfield
University.
35. Christopher, M. 1998. Logistics and Supply Chain Management: Strategies for Reducing Costs and
Improving Services. Pittman: London.
36. Wagner, S.M., and Neshat, N. 2010. Assessing the vulnerability of supply chains using graph theory.
International Journal of Production Economics. 126:121-129.
37. Wagner, S.M., and Bode, C. 2006. An empirical investigation into supply chain vulnerability. Journal of
Purchasing & Supply Management. 12(6):301-312.
38. Chopra, S., and Sodhi, M.S. 2004. Managing risk to avoid supply-chain breakdown. Sloan Management
Review. 46(1):53-61.
39. Christopher, M., and Peck, H. 2004. Building the resilient supply chain. International Journal of Logistics
Management. 34(5):388-396.
40. Hallikas, J., Karvonen, I., Pulkinnen,U. and Virolainen, V.M. 2004. Risk management processes in supplier
networks. International Journal of Production Economics. 90(1):47-58.
41. Jüttner, U. 2005. Supply chain risk management – understanding the business requirements from a
practitioner perspective. International Journal of Logistics Management. 16(1):120-141.
42. Jüttner, U., Peck, H., and Christopher, M. 2003. Supply chain risk management: outlining an agenda for
future research. International Journal of Logistics: Research and Applications. 6(4):197-210.
43. Kleindorfer, P.R., and Saad, G.H. 2005. Managing disruption risks in supply chains. Production and
Operations Management. 12(3/4):387-396.
44. Manuj, I., and Mentzer, J.T. 2008. Global supply chain risk management. Journal of Business Logistics.
29(1):133-156.
45. Norrman, A., and Lindroth, R. 2004. Categorization of supply chain risk and risk management. In: Brindley,
C. (Ed.), Supply Chain Risk. Ashgate, Hampshire. pp. 14-27.
46. Rao, S., and Goldsby, T.J. 2009. Supply chain risks: a review and typology. International Journal of
Logistics Management. 20(1):97-123.
UCPRC-RR-2014-02 113
47. Spekman, R.E., and Davis, E.W. 2004. Risky business: expanding the discussion on risk and the extended
enterprise. International Journal of Physical Distribution & Logistics Management. 34(5):414-433.
48. Svensson, G. 2000. A conceptual framework for the analysis of vulnerability in supply chains. International
Journal of Physical Distribution & Logistics Management. 30(9):731-749.
49. Wu, T., Blackhurst, J., and Chidambaram, V. 2006. A model for inbound supply risk. Computers in
Industry. 57(4):350-365.
50. Peck, H. 2005. Drivers of supply chain vulnerability: an integrated framework. International Journal of
Physical Distribution & Logistics Management. 35(4):210-232.
51. McKinnon, A. 2006. Life without trucks: The impact of a temporary disruption of road freight transport on a
national economy. Journal of Business Logistics. 27(2):227-248.
52. Jaffee, S., Siegel, P., and Andrews, C. 2010. Rapid agricultural supply chain risk assessment – a conceptual
framework. The World Bank. Agriculture and rural development discussion paper 47.
53. Roland-Holst, D., and Zilberman, D. 2006. How vulnerable is California agriculture to higher energy
prices? Agricultural and Resource Economics Update, Vol 9(5), May/June 2006. University of California
Giannini Foundation of Agricultural Economics.
54. USDA. 2004. Guide for Security Practices in Transporting Agricultural and Food Commodities.
55. Brewster, R. 2005. Identifying vulnerabilities and security management practices in agricultural and food
commodity transport. American Transportation Research Institute.
56. Thompson, J. F., Rumsey, F. G., Kasmire, R. F. and Crisosto, C. H. 2008. Commercial Cooling of Fruits,
Vegetables, and Flowers. Oakland: University of California - Agriculture and Natural Resources.
57. Ngcobo, M. E. K. 2008. Cooling and Shipping Studies on Table Grapes. Unpublished Master’s thesis.
Stellenbosch: Stellenbosch University.
58. Guide to food transport – fruit and vegetables. 1989. Copenhagen: Mercantila Publishers.
59. Capgemini. 2013. 2013 Third-Party Logistics Study. The State of Logistics Outsourcing.
www.capgemini.com/sites/default/files/resource/pdf/2013_Third-Party_Logistics_Study.pdf.
60. Selviaridis, K., and Spring, M. 2007. Third party logistics: a literature review and research agenda.
International Journal of Logistics Management. Vol. 18(1):125 – 150.
61. Armstrong and Associates, Inc. 2013. U.S. and Global Third-Party Logistics Market Analysis.
3plogistics.com/PR_3PL_Financial-2009.htm.
62. Ballou, R. H. 2001. Unresolved Issues in Supply Chain Network Design, Information Systems Frontiers,
Vol. 3(4), pp. 417-426.
63. Watson, M., Cacioppi, P., Jayaraman, J. and Lewis, S. 2012. The Value of Supply Chain Network Design,
Chapter 1 in Supply Chain Network Design: Applying Optimization and Analytics to the Global Supply
Chain, Financial Times Press, ISBN-10 0-13-301737-0.
114 UCPRC-RR-2014-02
64. Meixell, M. J. and Gargeya, V. B. 2005. Global supply chain design: A literature review and critique,
Transportation Research Part E, Vol. 41, pp. 531-550.
65. Chopra, S. 2003. Designing the distribution network in a supply chain, Transportation Research Part E, Vol.
39, pp. 12 – 140.
66. United States Census Bureau. 2007. Statistics for All U.S. Firms by Industry, Gender, Ethnicity, and Race
for the U.S., States, Metro Areas, Counties, and Places: 2007. Available:
factfinder2.census.gov/faces/nav/jsf/pages/searchresults.xhtml?refresh=t. (Accessed July 9, 2013.)
67. Joubert, J.W., and Axhausen, K.W. 2013. A complex network approach to understand commercial vehicle
movement. Transportation, pp. 1-22.
68. Van Heerden, Q., and Joubert, J.W. 2013. Generating intra- and inter-provincial commercial vehicle activity
chains. In proceedings of the 8th International Conference on City Logistics.
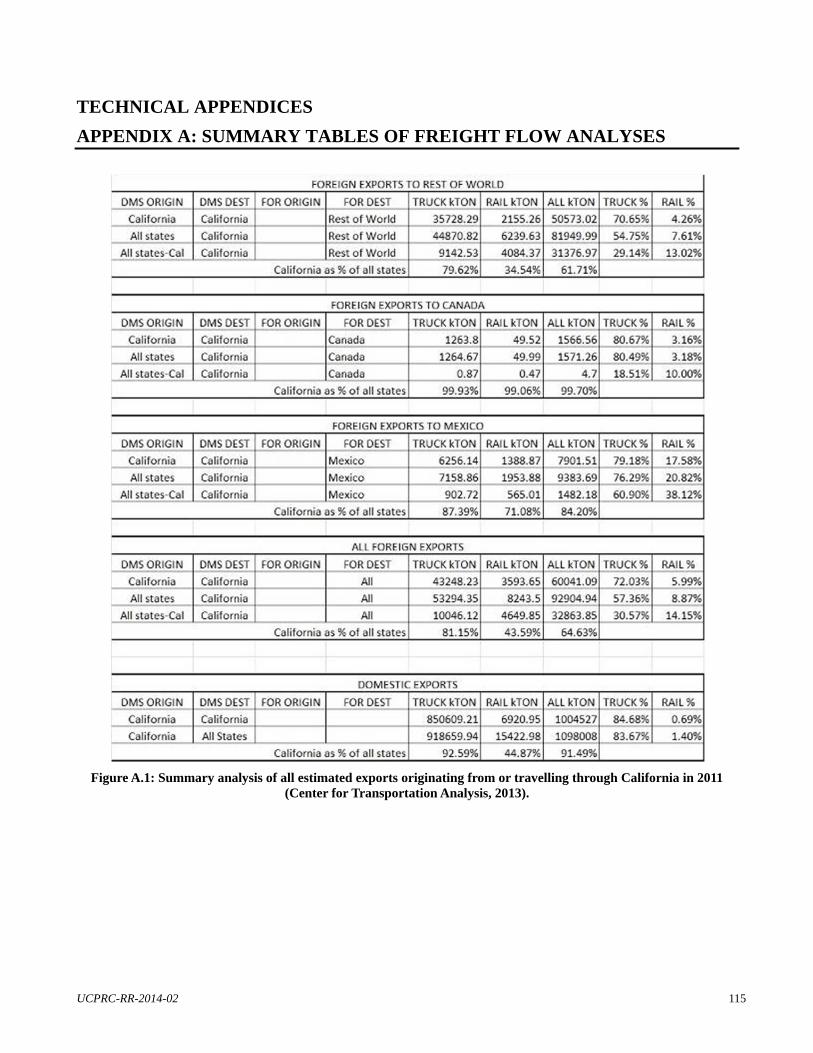
UCPRC-RR-2014-02 115
TECHNICAL APPENDICES
APPENDIX A: SUMMARY TABLES OF FREIGHT FLOW ANALYSES
Figure A.1: Summary analysis of all estimated exports originating from or travelling through California in 2011 (Center for Transportation Analysis, 2013).
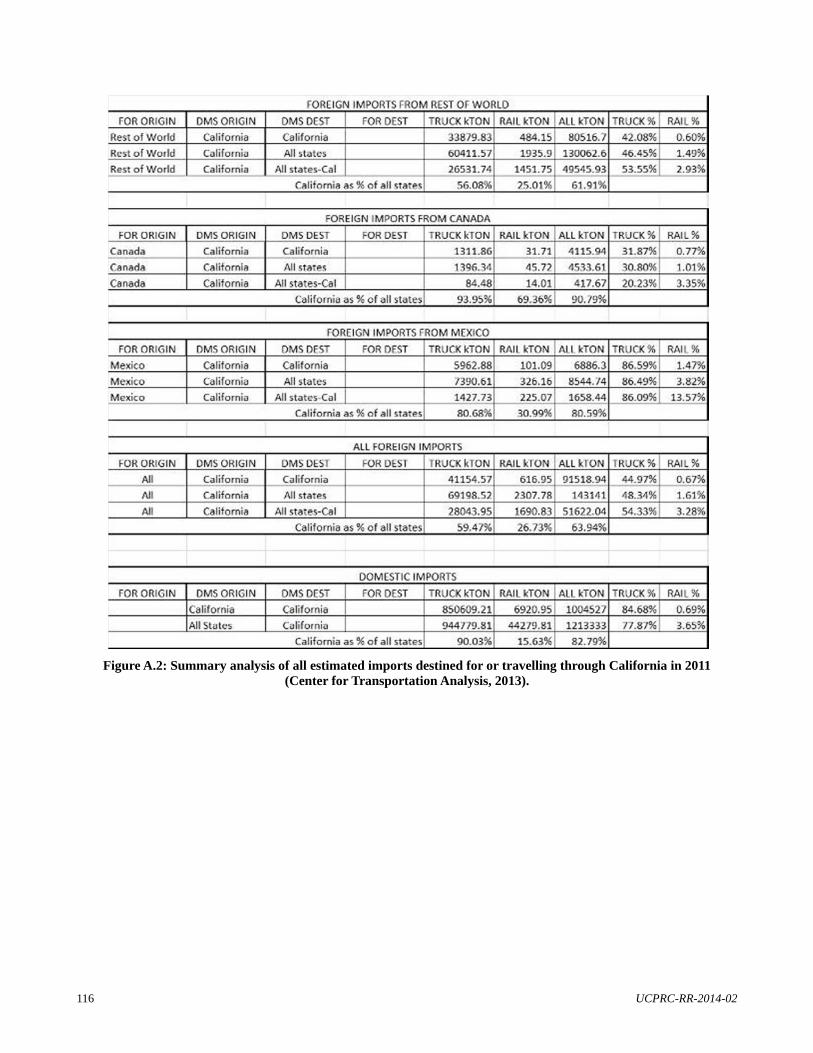
116 UCPRC-RR-2014-02
Figure A.2: Summary analysis of all estimated imports destined for or travelling through California in 2011 (Center for Transportation Analysis, 2013).
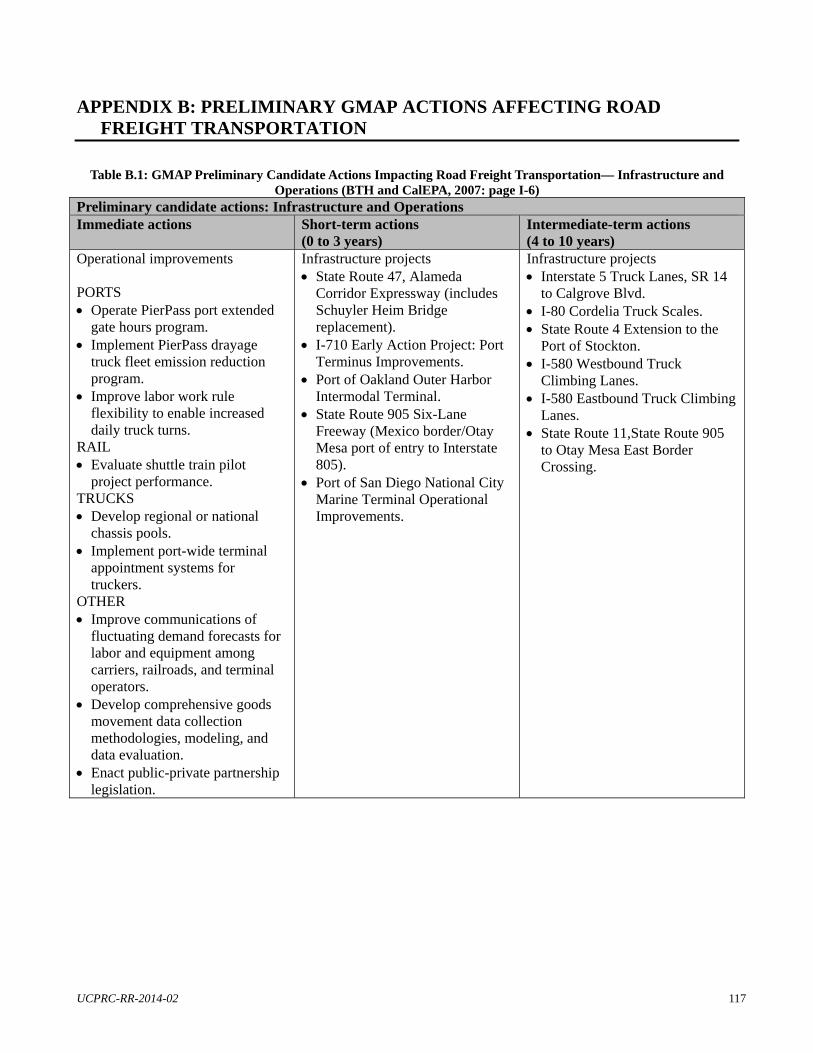
UCPRC-RR-2014-02 117
APPENDIX B: PRELIMINARY GMAP ACTIONS AFFECTING ROAD FREIGHT TRANSPORTATION
Table B.1: GMAP Preliminary Candidate Actions Impacting Road Freight Transportation— Infrastructure and Operations (BTH and CalEPA, 2007: page I-6)
Preliminary candidate actions: Infrastructure and Operations Immediate actions Short-term actions
(0 to 3 years) Intermediate-term actions (4 to 10 years)
Operational improvements PORTS Operate PierPass port extended
gate hours program. Implement PierPass drayage
truck fleet emission reduction program.
Improve labor work rule flexibility to enable increased daily truck turns.
RAIL Evaluate shuttle train pilot
project performance. TRUCKS Develop regional or national
chassis pools. Implement port-wide terminal
appointment systems for truckers.
OTHER Improve communications of
fluctuating demand forecasts for labor and equipment among carriers, railroads, and terminal operators.
Develop comprehensive goods movement data collection methodologies, modeling, and data evaluation.
Enact public-private partnership legislation.
Infrastructure projects State Route 47, Alameda
Corridor Expressway (includes Schuyler Heim Bridge replacement).
I-710 Early Action Project: Port Terminus Improvements.
Port of Oakland Outer Harbor Intermodal Terminal.
State Route 905 Six-Lane Freeway (Mexico border/Otay Mesa port of entry to Interstate 805).
Port of San Diego National City Marine Terminal Operational Improvements.
Infrastructure projects Interstate 5 Truck Lanes, SR 14
to Calgrove Blvd. I-80 Cordelia Truck Scales. State Route 4 Extension to the
Port of Stockton. I-580 Westbound Truck
Climbing Lanes. I-580 Eastbound Truck Climbing
Lanes. State Route 11,State Route 905
to Otay Mesa East Border Crossing.
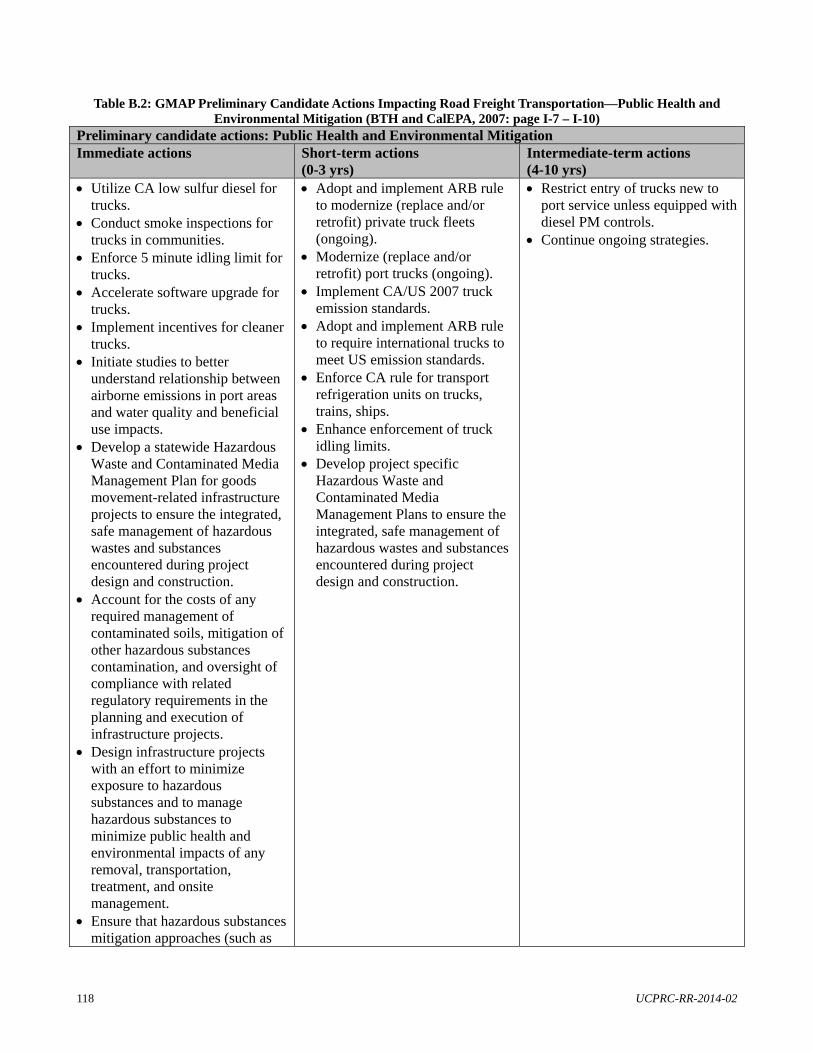
118 UCPRC-RR-2014-02
Table B.2: GMAP Preliminary Candidate Actions Impacting Road Freight Transportation—Public Health and Environmental Mitigation (BTH and CalEPA, 2007: page I-7 – I-10)
Preliminary candidate actions: Public Health and Environmental Mitigation Immediate actions Short-term actions
(0-3 yrs) Intermediate-term actions (4-10 yrs)
Utilize CA low sulfur diesel for trucks.
Conduct smoke inspections for trucks in communities.
Enforce 5 minute idling limit for trucks.
Accelerate software upgrade for trucks.
Implement incentives for cleaner trucks.
Initiate studies to better understand relationship between airborne emissions in port areas and water quality and beneficial use impacts.
Develop a statewide Hazardous Waste and Contaminated Media Management Plan for goods movement-related infrastructure projects to ensure the integrated, safe management of hazardous wastes and substances encountered during project design and construction.
Account for the costs of any required management of contaminated soils, mitigation of other hazardous substances contamination, and oversight of compliance with related regulatory requirements in the planning and execution of infrastructure projects.
Design infrastructure projects with an effort to minimize exposure to hazardous substances and to manage hazardous substances to minimize public health and environmental impacts of any removal, transportation, treatment, and onsite management.
Ensure that hazardous substances mitigation approaches (such as
Adopt and implement ARB rule to modernize (replace and/or retrofit) private truck fleets (ongoing).
Modernize (replace and/or retrofit) port trucks (ongoing).
Implement CA/US 2007 truck emission standards.
Adopt and implement ARB rule to require international trucks to meet US emission standards.
Enforce CA rule for transport refrigeration units on trucks, trains, ships.
Enhance enforcement of truck idling limits.
Develop project specific Hazardous Waste and Contaminated Media Management Plans to ensure the integrated, safe management of hazardous wastes and substances encountered during project design and construction.
Restrict entry of trucks new to port service unless equipped with diesel PM controls.
Continue ongoing strategies.
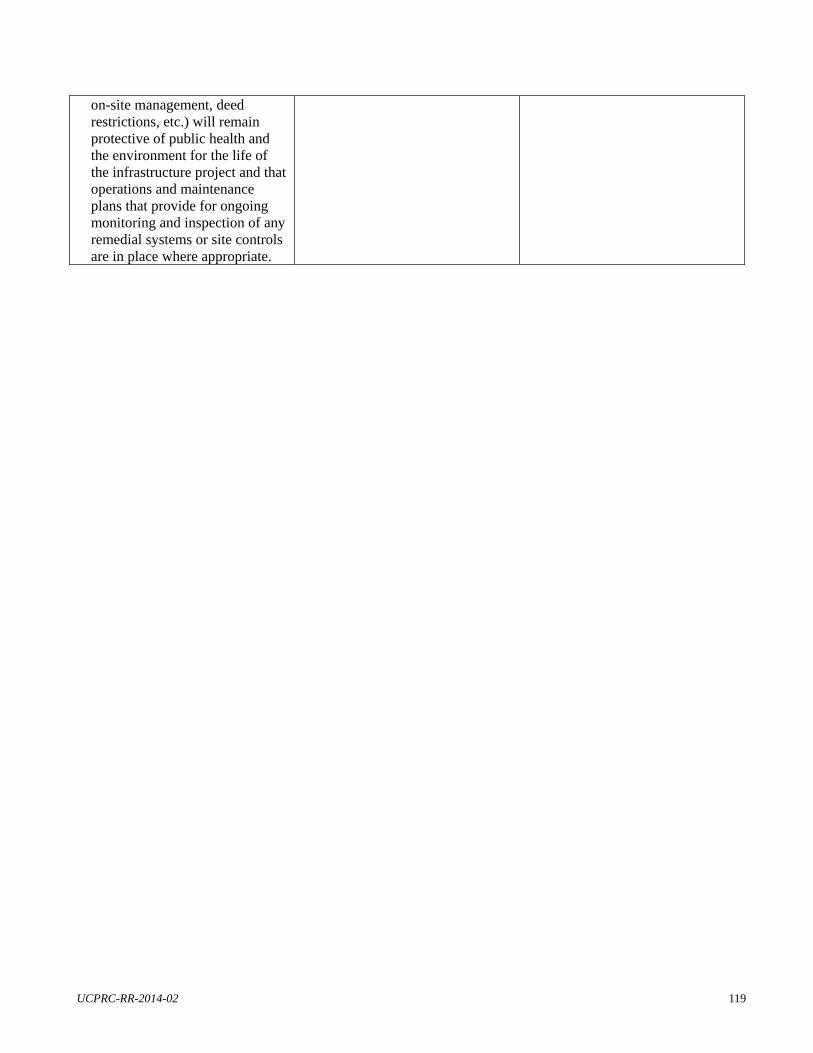
UCPRC-RR-2014-02 119
on-site management, deed restrictions, etc.) will remain protective of public health and the environment for the life of the infrastructure project and that operations and maintenance plans that provide for ongoing monitoring and inspection of any remedial systems or site controls are in place where appropriate.
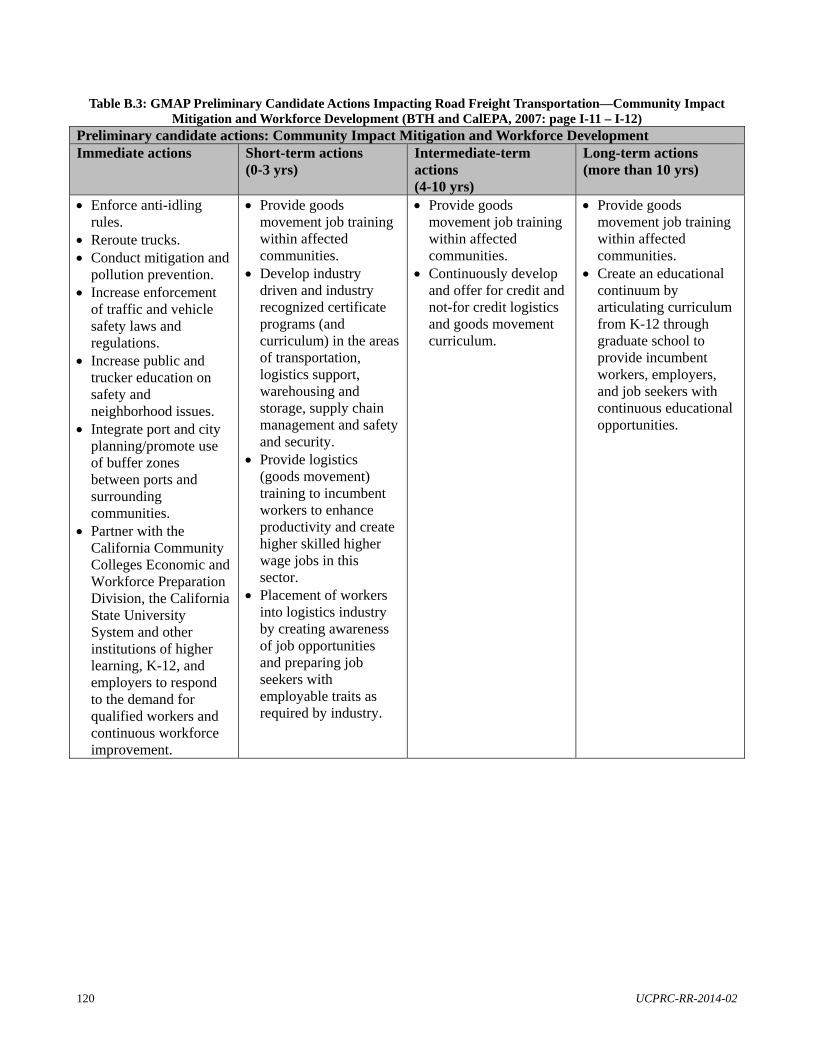
120 UCPRC-RR-2014-02
Table B.3: GMAP Preliminary Candidate Actions Impacting Road Freight Transportation—Community Impact Mitigation and Workforce Development (BTH and CalEPA, 2007: page I-11 – I-12)
Preliminary candidate actions: Community Impact Mitigation and Workforce Development Immediate actions Short-term actions
(0-3 yrs) Intermediate-term actions (4-10 yrs)
Long-term actions (more than 10 yrs)
Enforce anti-idling rules.
Reroute trucks. Conduct mitigation and
pollution prevention. Increase enforcement
of traffic and vehicle safety laws and regulations.
Increase public and trucker education on safety and neighborhood issues.
Integrate port and city planning/promote use of buffer zones between ports and surrounding communities.
Partner with the California Community Colleges Economic and Workforce Preparation Division, the California State University System and other institutions of higher learning, K-12, and employers to respond to the demand for qualified workers and continuous workforce improvement.
Provide goods movement job training within affected communities.
Develop industry driven and industry recognized certificate programs (and curriculum) in the areas of transportation, logistics support, warehousing and storage, supply chain management and safety and security.
Provide logistics (goods movement) training to incumbent workers to enhance productivity and create higher skilled higher wage jobs in this sector.
Placement of workers into logistics industry by creating awareness of job opportunities and preparing job seekers with employable traits as required by industry.
Provide goods movement job training within affected communities.
Continuously develop and offer for credit and not-for credit logistics and goods movement curriculum.
Provide goods movement job training within affected communities.
Create an educational continuum by articulating curriculum from K-12 through graduate school to provide incumbent workers, employers, and job seekers with continuous educational opportunities.
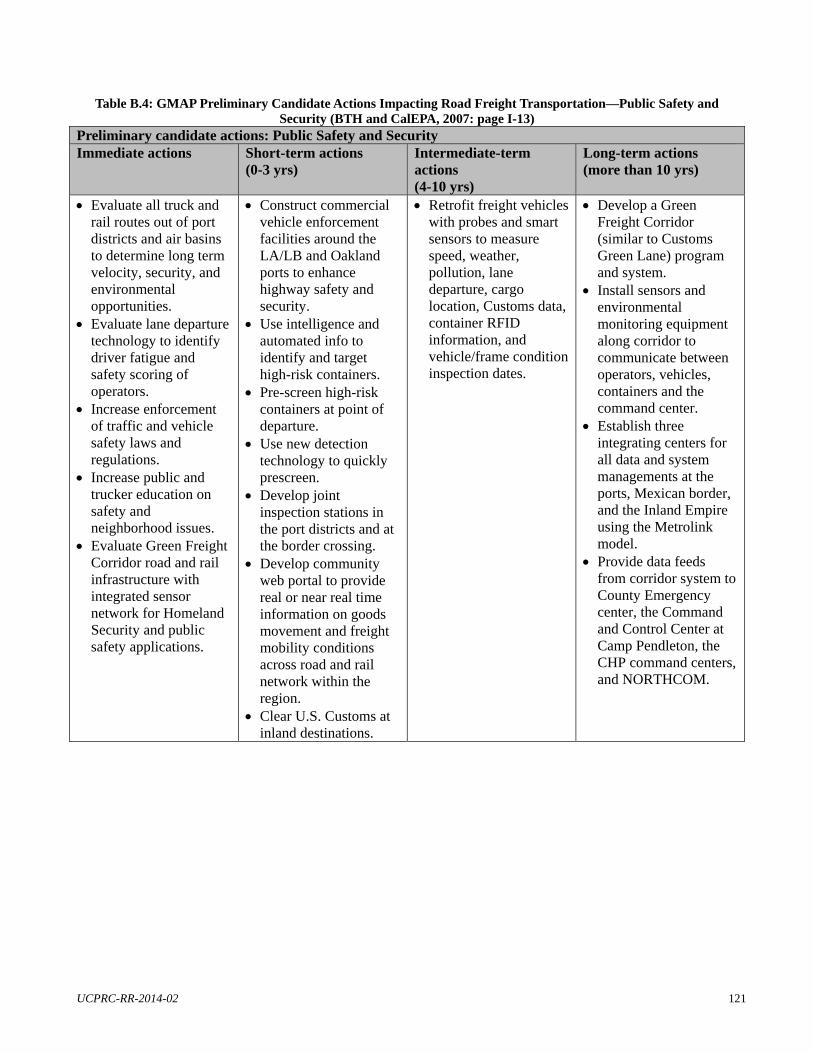
UCPRC-RR-2014-02 121
Table B.4: GMAP Preliminary Candidate Actions Impacting Road Freight Transportation—Public Safety and Security (BTH and CalEPA, 2007: page I-13)
Preliminary candidate actions: Public Safety and Security Immediate actions Short-term actions
(0-3 yrs) Intermediate-term actions (4-10 yrs)
Long-term actions (more than 10 yrs)
Evaluate all truck and rail routes out of port districts and air basins to determine long term velocity, security, and environmental opportunities.
Evaluate lane departure technology to identify driver fatigue and safety scoring of operators.
Increase enforcement of traffic and vehicle safety laws and regulations.
Increase public and trucker education on safety and neighborhood issues.
Evaluate Green Freight Corridor road and rail infrastructure with integrated sensor network for Homeland Security and public safety applications.
Construct commercial vehicle enforcement facilities around the LA/LB and Oakland ports to enhance highway safety and security.
Use intelligence and automated info to identify and target high-risk containers.
Pre-screen high-risk containers at point of departure.
Use new detection technology to quickly prescreen.
Develop joint inspection stations in the port districts and at the border crossing.
Develop community web portal to provide real or near real time information on goods movement and freight mobility conditions across road and rail network within the region.
Clear U.S. Customs at inland destinations.
Retrofit freight vehicles with probes and smart sensors to measure speed, weather, pollution, lane departure, cargo location, Customs data, container RFID information, and vehicle/frame condition inspection dates.
Develop a Green Freight Corridor (similar to Customs Green Lane) program and system.
Install sensors and environmental monitoring equipment along corridor to communicate between operators, vehicles, containers and the command center.
Establish three integrating centers for all data and system managements at the ports, Mexican border, and the Inland Empire using the Metrolink model.
Provide data feeds from corridor system to County Emergency center, the Command and Control Center at Camp Pendleton, the CHP command centers, and NORTHCOM.
122 UCPRC-RR-2014-02
APPENDIX C: SHORT DESCRIPTIONS OF PUBLIC-PRIVATE INTERACTION CASE STUDIES
These case studies were conducted in an NCFRP study [6]. The NCFRP report contains extensive descriptions
of case studies not presented here. This appendix gives brief descriptions of each case study.
A. Alameda Corridor, California
The construction of the Alameda Corridor between the ports of Long Beach and Los Angeles and the Los
Angeles rail yard has reduced the miles of rail in the area by a quarter, cut out 200 rail-highway crossings,
reduced the need for cross-town cargo movement by truck, eased freight and passenger congestion and reduced
air and noise pollution. Although the construction of this corridor started in 1997, the planning of this project
started two decades earlier. This project greatly reduced the negative impact of freight movement on the urban
population.
B. Shellpot Bridge Rehabilitation, Delaware
Rehabilitating the Shellpot Bridge was identified as a priority by the Delaware DOT (DelDOT) to improve
freight movement in the state. In concert with Norfolk Southern Railroad, DelDOT successfully rehabilitated a
bridge that the previous railroad owner, Conrail, has left in disrepair in 1995 when it said that the expense of
rehabilitating the bridge could not be justified.
C. Freight Action Strategy for Seattle-Tacoma Corridor (FAST), Washington
The FAST Corridor is an ambitious portfolio of 25 separate freight-related projects to move freight between the
ports and mainlines more safely and efficiently. One of the projects has been completed and seven more are
underway.
D. Neomodal, Northeast Ohio
The Northeast Ohio Intermodal Railroad (Neomodal) is a 28-acre transfer facility. When the terminal was being
planned three Class 1 railroads served the area, but once the terminal was built (with federal funds) in 1995 it
faced difficulties when Conrail was sold and traffic diverted elsewhere. In 2000, two other railroads signed
agreements with the Stark Development Board to provide service to and from the terminal which is now also a
Foreign Trade Zone.
E. Virginia Inland Port at Front Royals, Virginia
The Virginia Inland Port is an intermodal container transfer facility opened in 1989. It is a designated U.S.
Customs Port of Eentry and a Foreign Trade Zone. The population in the surrounding rural area lobbied that the
UCPRC-RR-2014-02 123
inland port be used as a catalyst for economic development in the area. To achieve this, the Virginia Port
Authority hired a firm to develop a strategic plan and hired marketing and sales personnel to ensure economic
development is vibrant and inclusive in the area.
F. Chicago Area Consolidation Hub, Illinois
United Parcel Service (UPS) initiated the building of a 1.9 million ft2 operating facility in Hodgkins, Illinois to
expedite its east-west operations. It was located near the BNSF rail yard but it soon became clear that additional
infrastructure expansions were required for the successful operation of the facility. A consortium including
BNSF, UPS, two municipalities in the Chicago area, the Illinois DOT and other government agencies shared the
cost of the necessary infrastructure improvements with UPS paying for on-third of the project.
124 UCPRC-RR-2014-02
APPENDIX D: INTERVIEW QUESTIONS PREPARED FOR TASK L3
Company A: Day 1, 15 May 2013 – Interviews with senior management and operational manager
A. Interview with Senior Manager of the transport division – general scope of business
1. What are the different logistics activities that are required during different times of the year (i.e., seasonality
effects)?
2. Characteristics of the customers:
a.What type of companies are typical customers? Big-box retail, local supermarkets, restaurants…etc.
b. Who is responsible for transport of the product from the plants to the customers?
c.How are customers spread out across the state or country? Does the geographic spread of customers impact
logistics activities at all – e.g. bigger orders less frequently?
d. What risks do customer behavior/characteristics pose to the logistics activities – e.g. emergency orders, size of
orders, delayed payment?
e.How frequently do customers send goods back and why?
f.How are reverse logistics managed in the company?
g. How critical is on-time delivery to customers?
h. What are the major road transport difficulties that hinder on-time delivery?
3. Characteristics of suppliers:
a.Who are your typical suppliers? Big corporations with many farms, or smaller single-owner type farms?
b. How far ahead can you plan transportation for the harvesting season? What are the biggest supply-side risks
that can complicate the harvesting plans?
c.How do you deal with damaged loads or loads that are of bad quality?
d. Apart from the fresh produce, what else is transported to the plants and how?
e.How critical is on-time delivery to the processing plants?
f.What are the major road transport issues that hinder on-time delivery?
4. Transport function:
a.What FHWA class of vehicle are the customized trucks?
b. What do you take into account before making decisions regarding fleet size and whether to buy or lease
trucks?
c.What type of repair or maintenance activity: occurs most frequently, takes the longest time, is the most costly?
UCPRC-RR-2014-02 125
5. Interaction with public sector agencies:
a.Which agencies do you interact with and why? (e.g. FMCSA for compliance, RTPA for input to planning?)
b. Has the company ever been formally involved in consultations, forums etc. to give input to the transport
planning process? If yes, how successful has that been? If no, is that something that could improve transport
planning for freight?
c.What would a “successful” private sector engagement process look like? How much time should it require,
who should be involved? What would be the changes that you would like to see?
6. What influence does road transport infrastructure and regulation play in strategic decisions such as facility
location, taking new suppliers or customers on-board?
7. What is the company’s inventory management strategy? Is there a drive towards lowering inventories? If so,
what is required from the road transport function to enable this?
8. What suggestions would you like to make to the public sector regarding:
a.Road maintenance and repair
b. Tolling
c.Congestion
d. Road expansion (width etc.)
e.Provision of roadside services such as rest stops, gas stations, cellphone reception?
f.Vehicle restrictions on routes
B. Interview with Operational Manager in charge of driver management (HR)
1. What type of licenses and training is required by your drivers? Are there any special permits required by virtue
of the types of vehicles used, cargoes carried or routes travelled?
2. How easy is it to recruit properly qualified and licensed drivers? What are the key characteristics you look for
when recruiting drivers?
3. Are there any additional training programs that the company would send the drivers on at its own expense? Is
there requirement for periodic refresher courses or renewals and who pays for these?
4. What are the main issues that affect driver morale? Congestion, lack of rest stops, long routes, remuneration?
126 UCPRC-RR-2014-02
5. What performance incentives and punitive measures does the company use to drive performance?
6. Are employees on permanent or temporary contract? Or a mixture?
7. What activities does the company perform to ensure their drivers adhere to CSA regulations? What activities
does the company enforce to ensure that the company, as an employer, adheres to CSA regulations?
8. Would you say driver turnover is relatively high? And where do the drivers go? To other companies or to other
industries and why?
9. What suggestions would the company make regarding roadside provisions (truck only lanes, rest stops etc.)
that would significantly improve driver working conditions?
10.What driver and employer regulations does the company feel are too restrictive or irrelevant to their business
and actually just impedes performance with no added safety benefit?
11.Do your drivers belong to any unions? How has union activity affected operations in the past? Typically,
what is the impact of unions in the agricultural industry?
C. Interview with Senior Manager regarding fleet management
1. How far ahead are truck trips planned?
2. What systems are used for planning?
3. What are the deciding factors in assigning a certain driver/vehicle combo to a certain shipment?
4. How are plans communicated to drivers?
5. How often do drivers deviate from the planned routes in the field manual? What are the main reasons for this?
6. What are the main reasons for drivers being late for a pickup or a delivery?
7. How is fleet maintenance planned and executed?
UCPRC-RR-2014-02 127
8. What are the most time consuming fleet management issues?
9. How do CSA regulations regarding vehicles and drivers affect planning and scheduling of daily trips, periodic
maintenance and any other inspections?
10.What suggestions do you have regarding road infrastructure and regulation that would make daily planning
and scheduling of trips easier?
11.What suggestions do you have regarding road infrastructure and regulation that would make fleet
management and maintenance easier?
Company B: Day 2, 21 May 2013 – Interviews with senior management and operational manager
1. What is the scope of operations at the terminal?
a.Logistics activities
b. Hours of operation
2. Characteristics of the customers:
a.What type of companies are typical customers?
b. How frequently do customers send shipments?
c.How critical is on-time delivery to customers?
3. Shipment characteristics
a.Typical origins and destinations
b. Typical shipment size
c.Percentage of intermodal container to fixed trailer shipments
d. Percentage split of export/import shipments involving ports
e.Percentage split of export/import shipments bound for Canada
f.Typical commodities moved
4. Supply chain risks
a.What risks does customer behavior pose to the logistics activities – e.g. emergency orders, size of orders,
delayed payment?
b. What risks do road regulations pose to the profitability of the terminal?
c.What risks does road infrastructure pose to operational efficiency and customer service?
128 UCPRC-RR-2014-02
d. What risks are posed by driver turnover/availability or the vehicle fleet?
5. How does road infrastructure and regulation affect strategic decisions related to:
a.Taking on new customers or expanding into markets?
b. Relocating or siting new terminals?
c.Increasing the fleet size or number of drivers?
d. Expanding the terminal facility?
6. Interaction with public sector agencies
a.Which agencies do you interact with and why?
b. Has the company ever been formally involved in consultations, forums etc. to give input to the transport
planning process? If yes, how successful has that been? If no, is that something that could improve transport
planning for freight?
c.What would a “successful” private sector engagement process look like? How much time should it require,
who should be involved? What would be the changes that you would like to see?
7. What suggestions would you like to make to the public sector regarding:
a.Road maintenance and repair
b. Tolling
c.Congestion
d. Road expansion
e.Provision of roadside services such as rest stops, gas stations, cellphone reception?
f.Vehicle restrictions on routes
8. Driver management
a.What type of licenses and training are required by your drivers? Are there any special permits required by
virtue of the types of vehicles used, cargoes carried or routes travelled?
b. How easy is it to recruit properly qualified and licensed drivers? What are the key characteristics you look for
when recruiting drivers?
c.Are there any additional training programs that the company would send the drivers on at its own expense? Is
there requirement for periodic refresher courses or renewals and who pays for these?
d. What are the main issues that affect driver morale?
e.What performance incentives and punitive measures does the company use to drive performance?
f.Are employees on permanent or temporary contract?
UCPRC-RR-2014-02 129
g. What activities does the company perform to ensure their drivers adhere to CSA regulations?
h. Would you say driver turnover is relatively high?
i.What driver and employer regulations does the company feel are too restrictive or irrelevant to their business
and actually just impedes performance with no added safety benefit?
j.Do your drivers belong to any unions?
9. Fleet management
a.How far ahead are truck trips planned?
b. What systems are used for planning?
c.What are the deciding factors in assigning a certain driver/vehicle combo to a certain shipment?
d. How are plans communicated to drivers?
e.How do Customs processes influence the planning and shipping of international shipments?
f.How are driver routes determined? How often do drivers deviate from the planned routes?
g. What are the main reasons for drivers being late for a pickup or a delivery?
h. How is fleet maintenance planned and executed?
i.What are the most time consuming fleet management issues?
j.What suggestions do you have regarding road infrastructure and regulation that would make daily planning and
scheduling of trips easier?
k. What suggestions do you have regarding road infrastructure and regulation that would make fleet management
and maintenance easier?
130 UCPRC-RR-2014-02
APPENDIX E: PRIVACY AND CONFIDENTIALITY PROTOCOLS
A prerequisite for the participation of companies in this pilot study is the assurance that their privacy and
confidentiality of their operations and any other information that could jeopardize their competitive advantage
will be an utmost priority. To ensure this, confidentiality and privacy protocols will be enforced during Task L3:
Operational Investigation. There are two researchers that will be conducting the operational investigations,
Lorina Popescu (UC Berkeley) and Nadia Viljoen (CSIR).
Protocols Regarding Quantitative Information, Especially Financials, Volumes and Forecasts
The information gathered during the company investigations and structured interviews will be qualitative in
nature. In general, no financial information or specific values regarding sales or throughput volumes are
required. In instances where the researcher feels it is essential to view quantitative information (financials,
volumes, forecasts etc.) to understand a qualitative concept, the researcher may request permission from the
senior manager that authorized the investigation or structured interview to view the quantitative information.
Should the researcher be given access to quantitative information for the reason mentioned, the researcher will
not record or keep a copy of said information, but the researcher may write down any qualitative insights arising
from the information.
Protocols for Structured Interviews and Observation Activities
Structured interviews
1. Before each structured interview, the following will be explained to the interviewee:
a.The background and purpose of the pilot study;
b. The reason for conducting the interview;
c.How information from the interview will be analyzed and reported;
d. That the interview is in no way an effort to assess performance; and
e.The voluntary nature of the interview.
2. After explaining the elements, the interviewee is given an option to decline the interview or to proceed
voluntarily.
3. During the interview, the interviewee may decline to answer any one of the questions.
4. No personal information of the interviewee will be requested by the interviewer; and, if the interviewee shares
personal information voluntarily, the interviewer will not record it. Personal information means information that
UCPRC-RR-2014-02 131
can be used to identify the interviewee, including, but is not limited to: age; gender; race; ethnicity; name; and
remuneration details.
5. Interviewees will be identified only according to their official designation within the company, for example:
Logistics Manager, Truck Driver etc.
6. All notes will be recorded in a hardbound notebook. Pages will be numbered and initialed by the researcher to
verify authorship of the notes on that page.
Observation Activities
1. When observing operational activities (such as plant operations, shipment delivery etc.), the interviewer will
take care not to record any information that is regarded as confidential and non-material to the study. This
information includes, but is not limited to: names of customers or suppliers; locations of depots, terminals,
processing plants or warehouses; facility layout plans; and any financial information.
2. The company representative that accompanies the researcher has the right to view any and all information
gathered by the researcher through their observations (this includes all notes, photographs and recordings). Upon
his/her request, the researcher will delete or obscure any information the representative determines is of a
confidential nature.
3. Employees that are being observed should be expressly informed that the observation is not an assessment of
their performance. If the employees are interested, the researcher must also explain to them the purpose of the
pilot study, the reason for the operational investigation, and what type of information is being collected.
4. If the researcher wishes to photograph or record any element of operations, express permission must be
granted by the company representative. Employees reserve the right to refuse to be photographed or recorded.
5. All notes will be recorded in a hardbound notebook. Pages will be numbered and initialed by the researcher to
verify authorship of the notes on that page.
Protocols for handling case study notes and materials
1. All notes will be recorded in a hardbound notebook. Pages are numbered and initialed by the researcher to
verify authorship of the notes on that page. The senior manager that authorized the investigation has the right to
132 UCPRC-RR-2014-02
view all notes taken in this notebook. The senior manager has the right to request that the researcher delete or
obscure notes that contain confidential information.
2. When permitted, the researcher may take digital photographs, video recordings and voice recordings. The
senior manager that authorized the investigation or interview has the right to view all photos and video
recordings and to listen to all voice recordings. The senior manager has the right to request that the researcher
permanently delete any photos or recordings he/she determine to contain confidential information.
3. Only the researchers, senior managers that authorized the investigation or interview and company
representatives that chaperoned the researchers may have access to the notebooks, photos and recordings that are
collected. It is the researcher’s responsibility to ensure that all media is protected against disclosure.
4. Once the pilot study has been completed, the senior manager has right to request that all notebooks be handed
over to the company and that all photos and recordings be deleted. If this is not requested, it is the responsibility
of the researchers to ensure that all media is kept confidential and properly protected against disclosure.
Protocols for Analysis and Reporting
1. Only the researchers that conducted the operational investigation will be allowed to access and analyze
collected data from the operational investigation.
2. During analysis, any reference to the company’s identity; facility locations; the identity or location of the
company’s suppliers, customers or competitors; and identities of any employees or interviewees will be removed
from the data.
3. Any operational data that could be used to identify participating companies will be removed from the data or
replaced with generic terms or references.
4. Under no circumstances will quantitative information regarding financials, volumes or forecasts be analyzed
or reported.
5. Before the researchers share the findings of the operational investigation to Caltrans, a copy will be sent to the
senior manager that authorized the investigation or interview. The senior manager will be given two weeks to
study the findings and request any amendments, additions or deletions that he/she determines necessary to
UCPRC-RR-2014-02 133
protect the company’s confidentiality and privacy. If no such corrections are received from the senior manager
in two weeks, the researchers may deem the findings acceptable and share it with Caltrans.
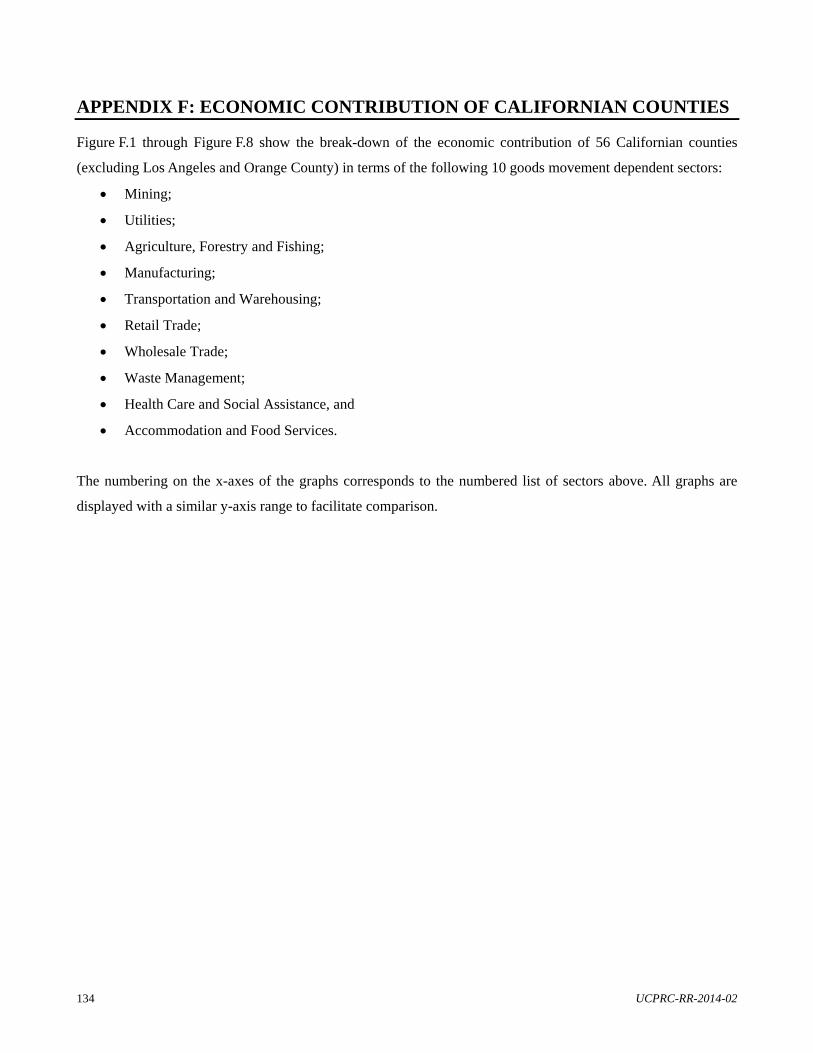
134 UCPRC-RR-2014-02
APPENDIX F: ECONOMIC CONTRIBUTION OF CALIFORNIAN COUNTIES
Figure F.1 through Figure F.8 show the break-down of the economic contribution of 56 Californian counties
(excluding Los Angeles and Orange County) in terms of the following 10 goods movement dependent sectors:
Mining;
Utilities;
Agriculture, Forestry and Fishing;
Manufacturing;
Transportation and Warehousing;
Retail Trade;
Wholesale Trade;
Waste Management;
Health Care and Social Assistance, and
Accommodation and Food Services.
The numbering on the x-axes of the graphs corresponds to the numbered list of sectors above. All graphs are
displayed with a similar y-axis range to facilitate comparison.
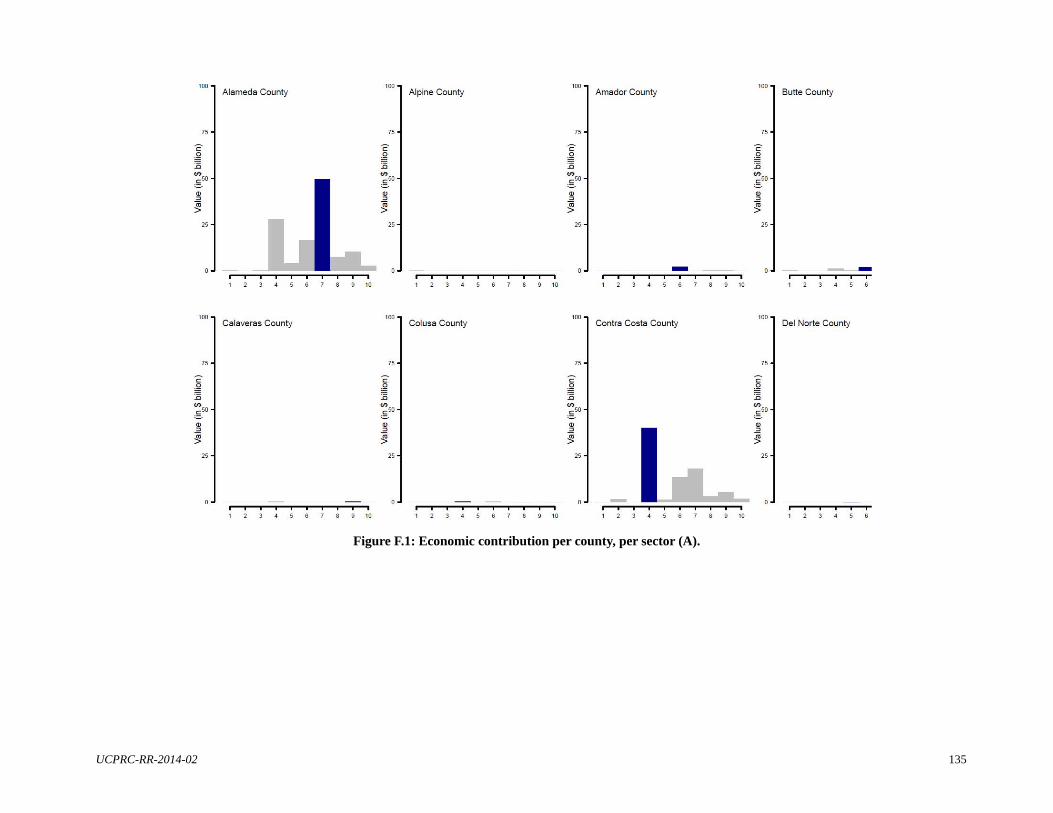
UCPRC-RR-2014-02 135
Figure F.1: Economic contribution per county, per sector (A).
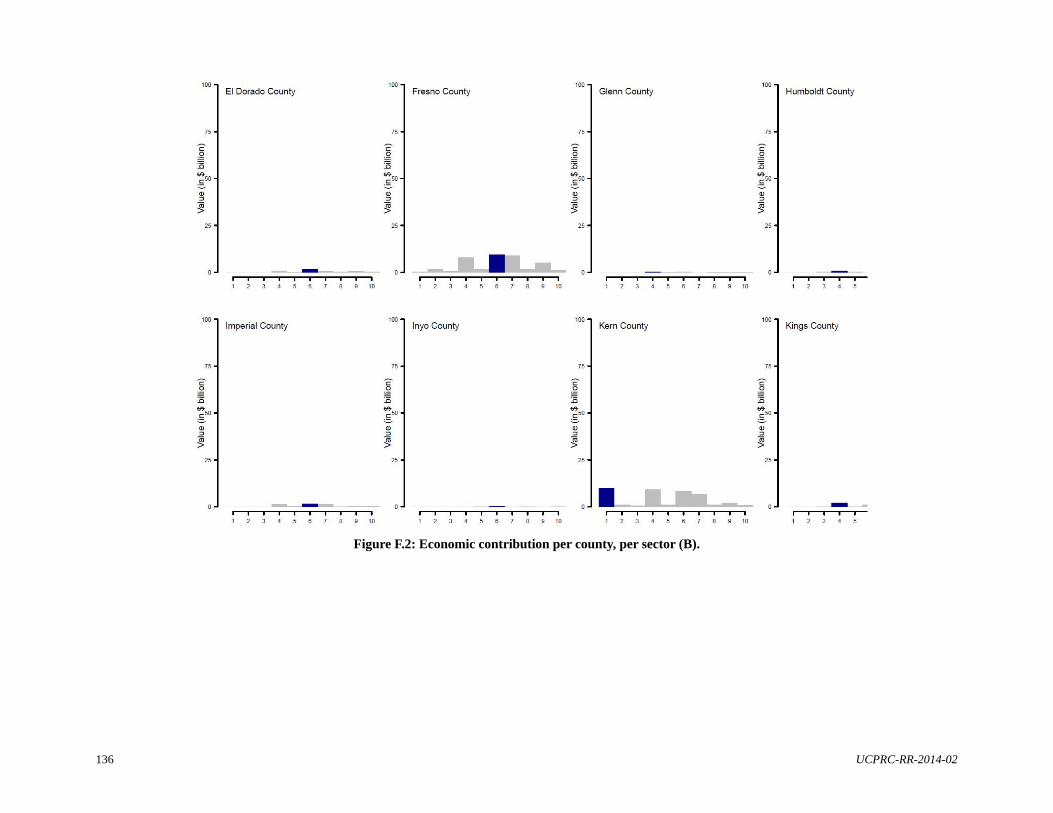
136 UCPRC-RR-2014-02
Figure F.2: Economic contribution per county, per sector (B).
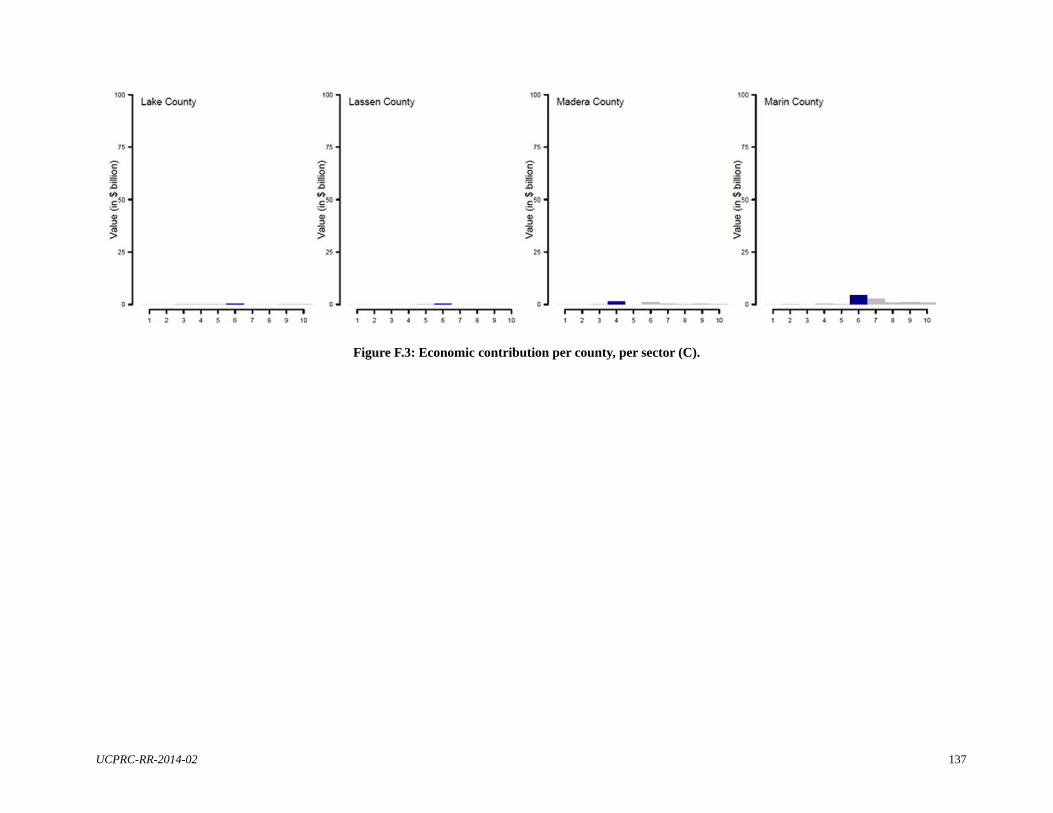
UCPRC-RR-2014-02 137
Figure F.3: Economic contribution per county, per sector (C).
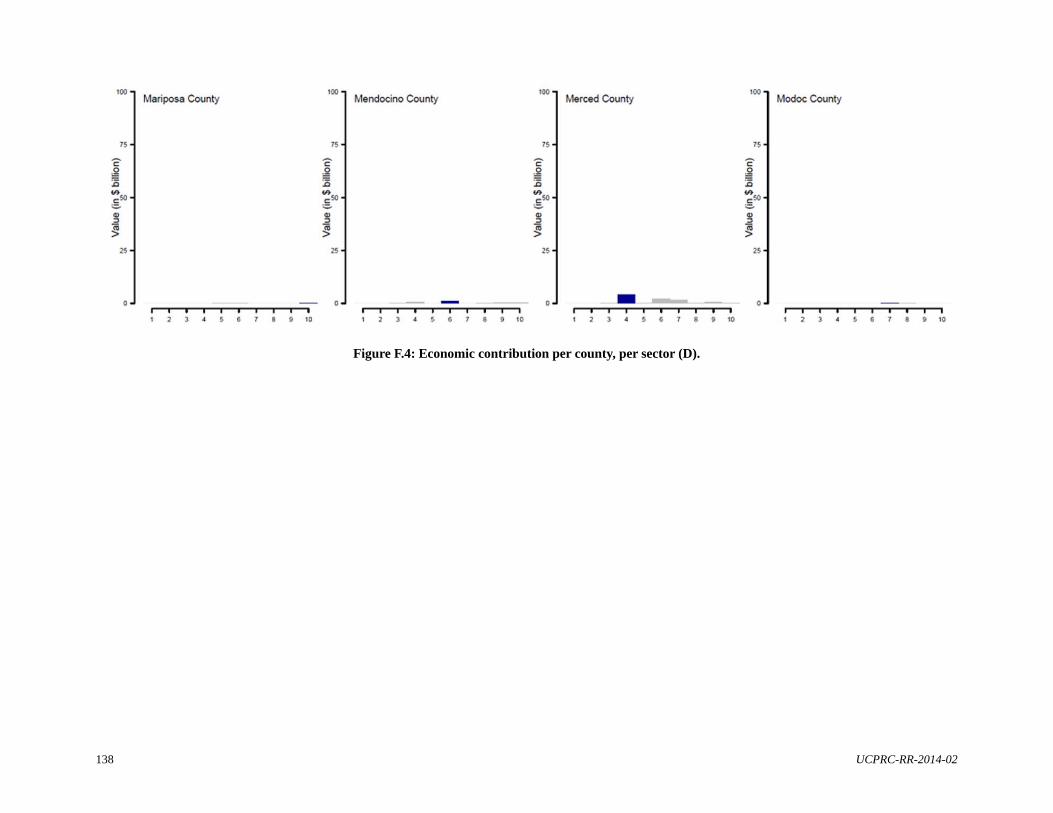
138 UCPRC-RR-2014-02
Figure F.4: Economic contribution per county, per sector (D).
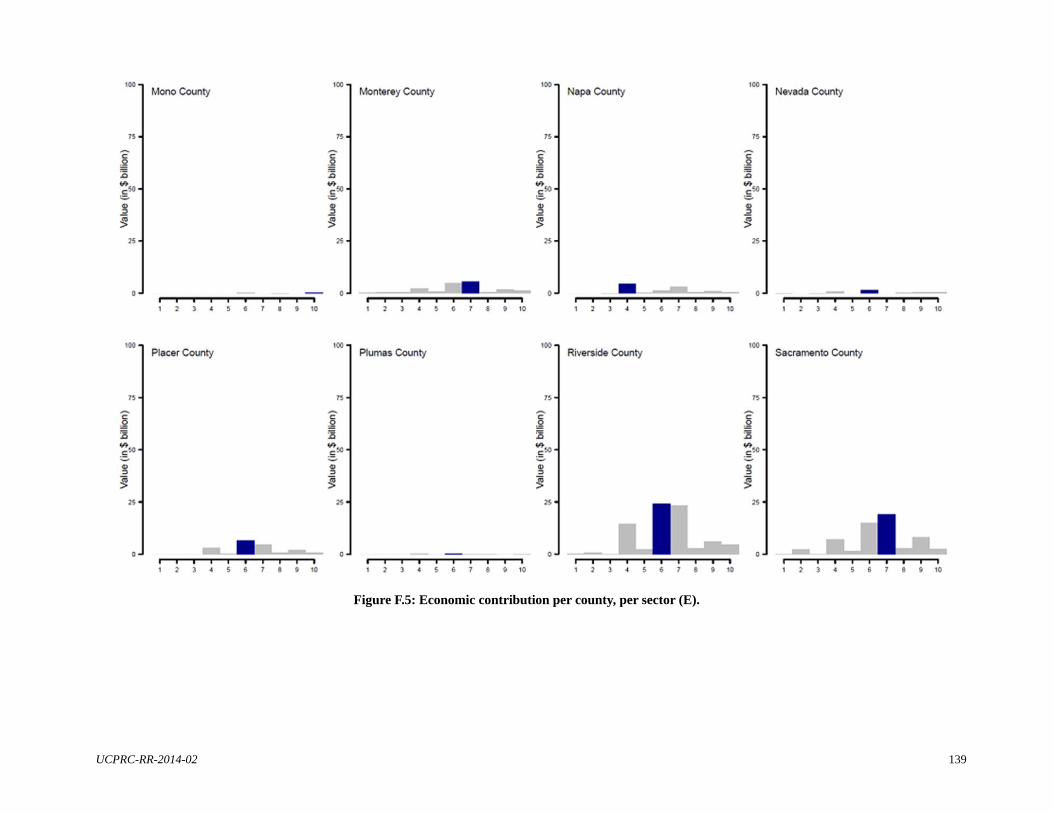
UCPRC-RR-2014-02 139
Figure F.5: Economic contribution per county, per sector (E).
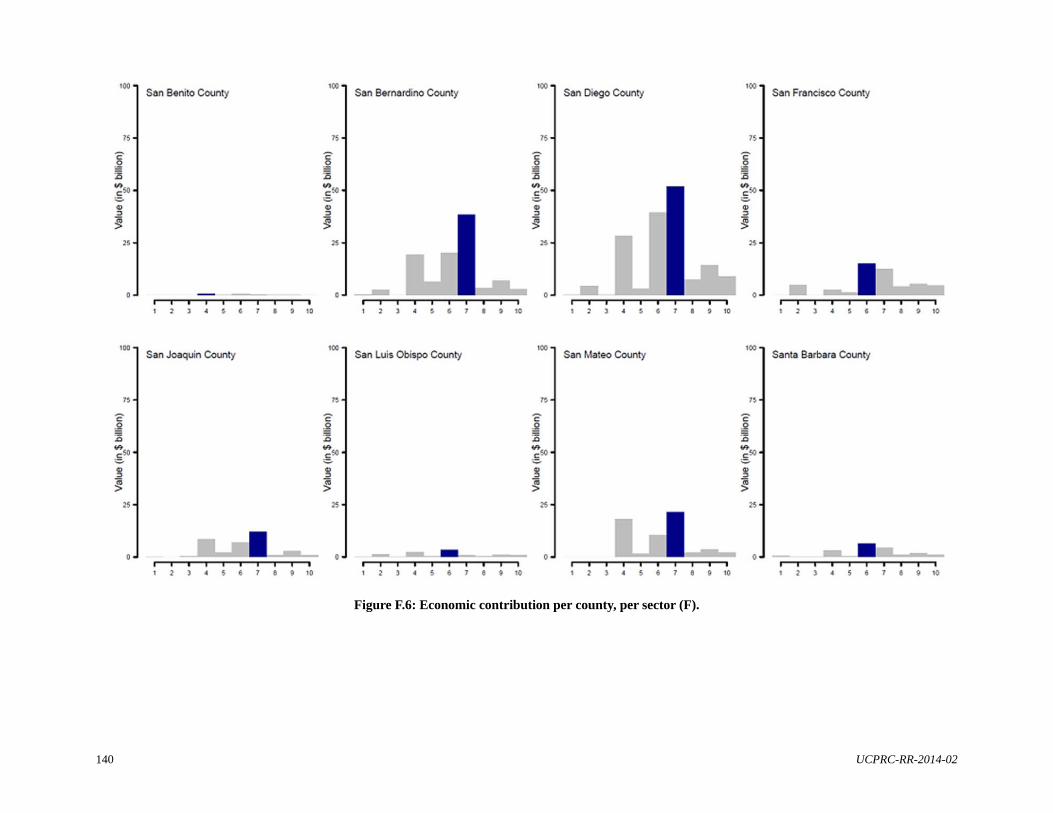
140 UCPRC-RR-2014-02
Figure F.6: Economic contribution per county, per sector (F).
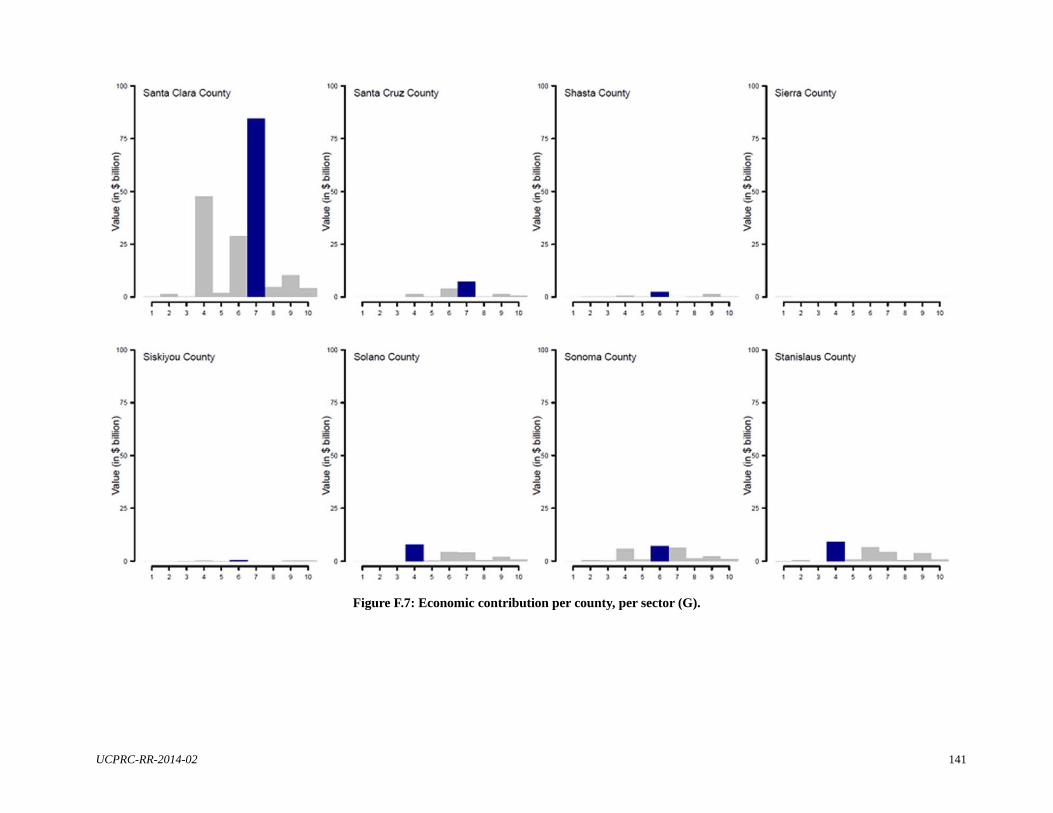
UCPRC-RR-2014-02 141
Figure F.7: Economic contribution per county, per sector (G).
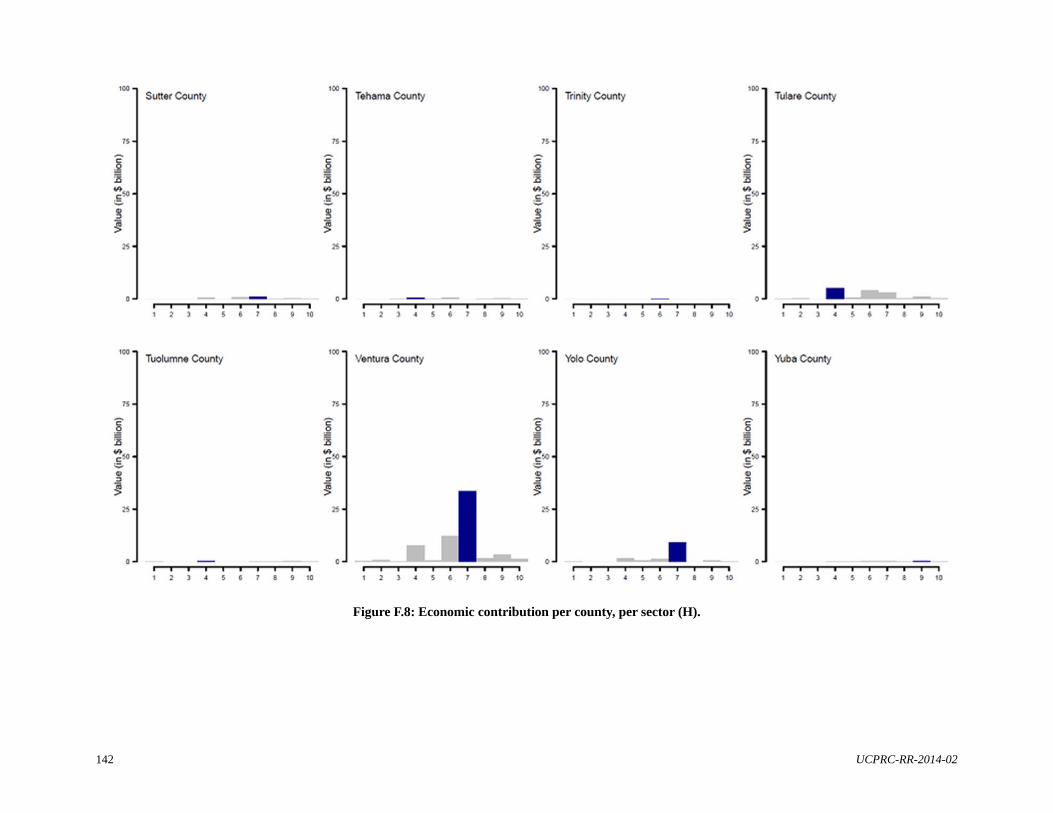
142 UCPRC-RR-2014-02
Figure F.8: Economic contribution per county, per sector (H).
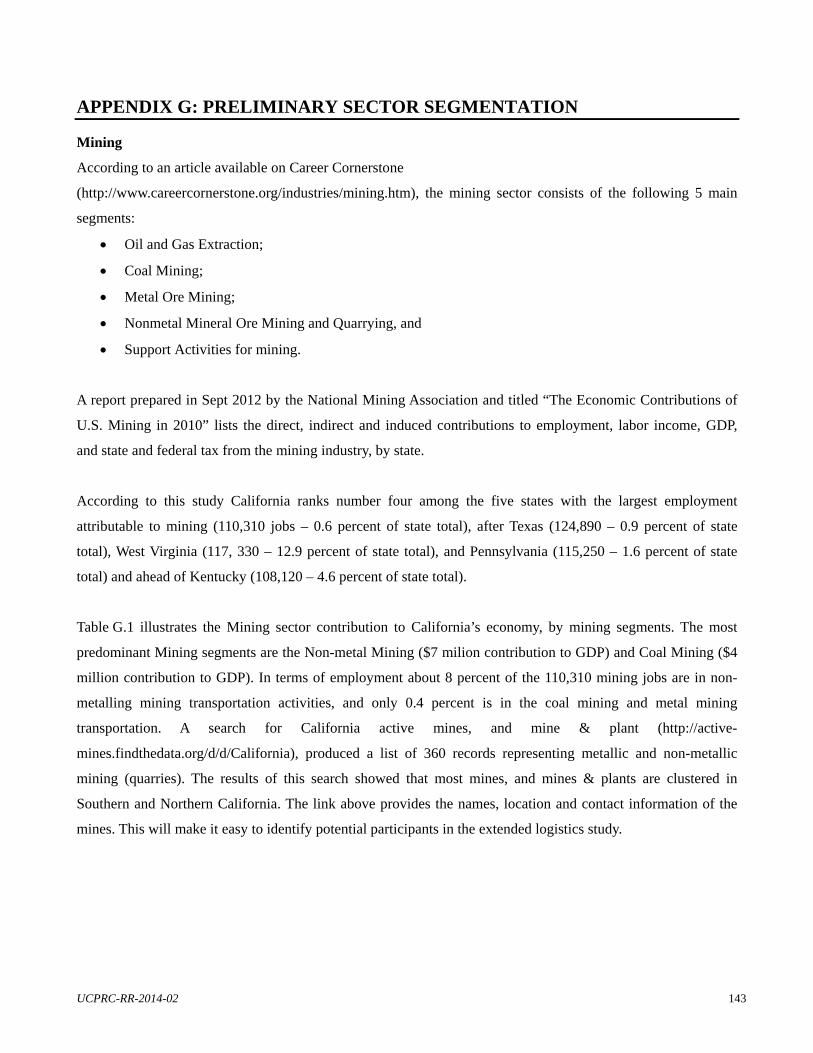
UCPRC-RR-2014-02 143
APPENDIX G: PRELIMINARY SECTOR SEGMENTATION
Mining
According to an article available on Career Cornerstone
(http://www.careercornerstone.org/industries/mining.htm), the mining sector consists of the following 5 main
segments:
Oil and Gas Extraction;
Coal Mining;
Metal Ore Mining;
Nonmetal Mineral Ore Mining and Quarrying, and
Support Activities for mining.
A report prepared in Sept 2012 by the National Mining Association and titled “The Economic Contributions of
U.S. Mining in 2010” lists the direct, indirect and induced contributions to employment, labor income, GDP,
and state and federal tax from the mining industry, by state.
According to this study California ranks number four among the five states with the largest employment
attributable to mining (110,310 jobs – 0.6 percent of state total), after Texas (124,890 – 0.9 percent of state
total), West Virginia (117, 330 – 12.9 percent of state total), and Pennsylvania (115,250 – 1.6 percent of state
total) and ahead of Kentucky (108,120 – 4.6 percent of state total).
Table G.1 illustrates the Mining sector contribution to California’s economy, by mining segments. The most
predominant Mining segments are the Non-metal Mining ($7 milion contribution to GDP) and Coal Mining ($4
million contribution to GDP). In terms of employment about 8 percent of the 110,310 mining jobs are in non-
metalling mining transportation activities, and only 0.4 percent is in the coal mining and metal mining
transportation. A search for California active mines, and mine & plant (http://active-
mines.findthedata.org/d/d/California), produced a list of 360 records representing metallic and non-metallic
mining (quarries). The results of this search showed that most mines, and mines & plants are clustered in
Southern and Northern California. The link above provides the names, location and contact information of the
mines. This will make it easy to identify potential participants in the extended logistics study.
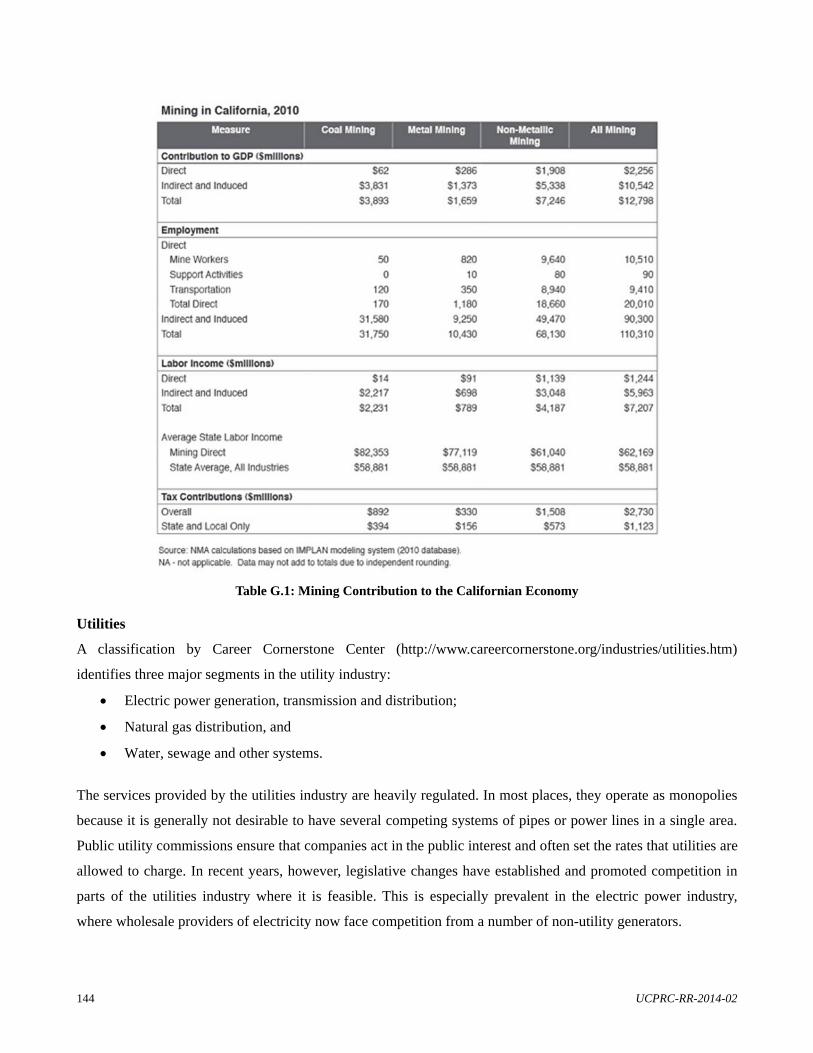
144 UCPRC-RR-2014-02
Table G.1: Mining Contribution to the Californian Economy Utilities
A classification by Career Cornerstone Center (http://www.careercornerstone.org/industries/utilities.htm)
identifies three major segments in the utility industry:
Electric power generation, transmission and distribution;
Natural gas distribution, and
Water, sewage and other systems.
The services provided by the utilities industry are heavily regulated. In most places, they operate as monopolies
because it is generally not desirable to have several competing systems of pipes or power lines in a single area.
Public utility commissions ensure that companies act in the public interest and often set the rates that utilities are
allowed to charge. In recent years, however, legislative changes have established and promoted competition in
parts of the utilities industry where it is feasible. This is especially prevalent in the electric power industry,
where wholesale providers of electricity now face competition from a number of non-utility generators.
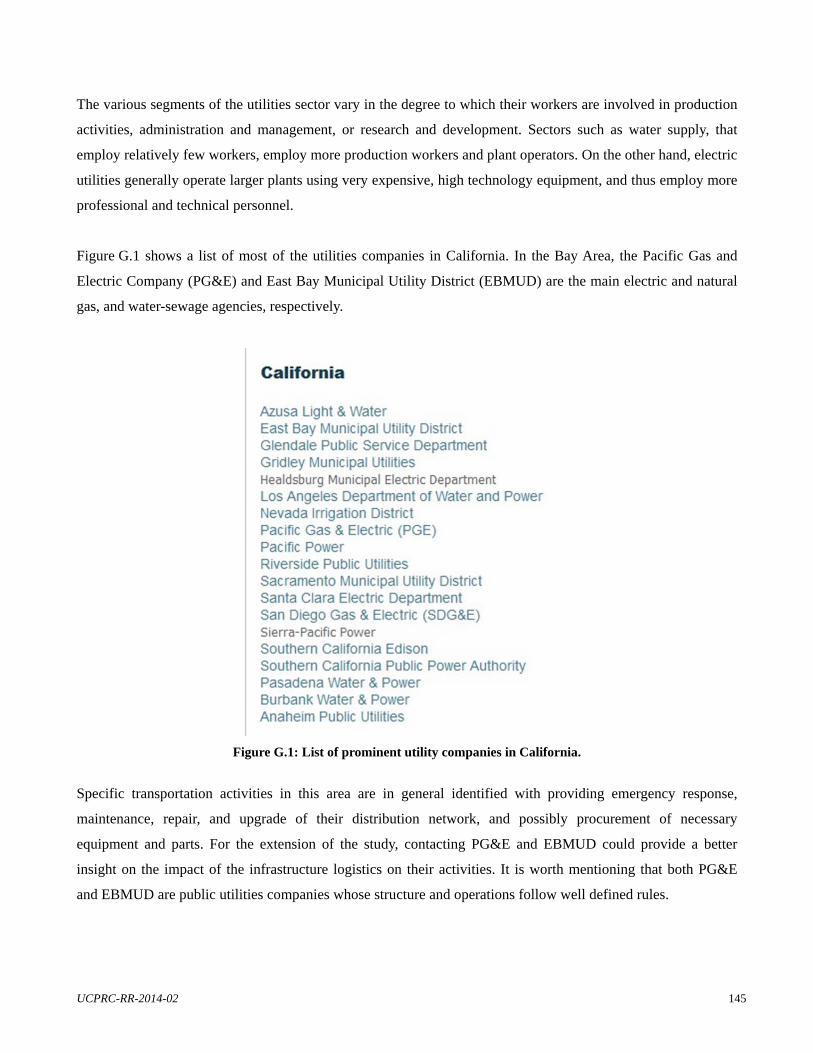
UCPRC-RR-2014-02 145
The various segments of the utilities sector vary in the degree to which their workers are involved in production
activities, administration and management, or research and development. Sectors such as water supply, that
employ relatively few workers, employ more production workers and plant operators. On the other hand, electric
utilities generally operate larger plants using very expensive, high technology equipment, and thus employ more
professional and technical personnel.
Figure G.1 shows a list of most of the utilities companies in California. In the Bay Area, the Pacific Gas and
Electric Company (PG&E) and East Bay Municipal Utility District (EBMUD) are the main electric and natural
gas, and water-sewage agencies, respectively.
Figure G.1: List of prominent utility companies in California.
Specific transportation activities in this area are in general identified with providing emergency response,
maintenance, repair, and upgrade of their distribution network, and possibly procurement of necessary
equipment and parts. For the extension of the study, contacting PG&E and EBMUD could provide a better
insight on the impact of the infrastructure logistics on their activities. It is worth mentioning that both PG&E
and EBMUD are public utilities companies whose structure and operations follow well defined rules.
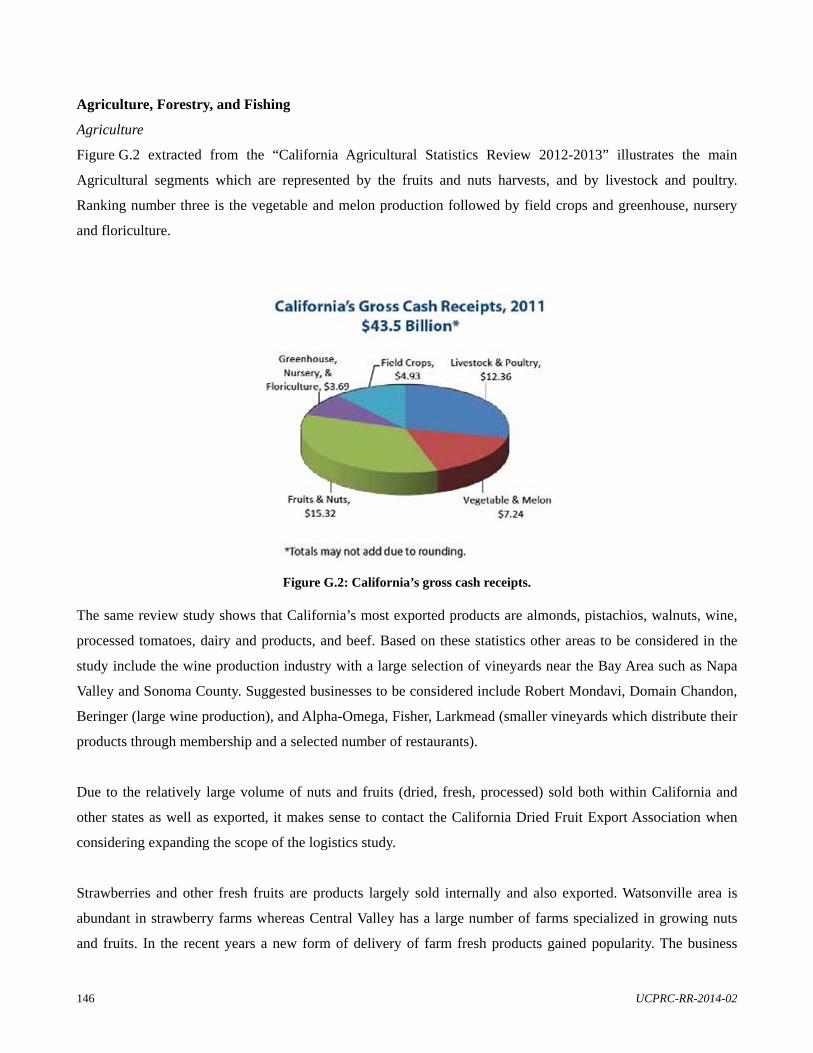
146 UCPRC-RR-2014-02
Agriculture, Forestry, and Fishing
Agriculture
Figure G.2 extracted from the “California Agricultural Statistics Review 2012-2013” illustrates the main
Agricultural segments which are represented by the fruits and nuts harvests, and by livestock and poultry.
Ranking number three is the vegetable and melon production followed by field crops and greenhouse, nursery
and floriculture.
Figure G.2: California’s gross cash receipts. The same review study shows that California’s most exported products are almonds, pistachios, walnuts, wine,
processed tomatoes, dairy and products, and beef. Based on these statistics other areas to be considered in the
study include the wine production industry with a large selection of vineyards near the Bay Area such as Napa
Valley and Sonoma County. Suggested businesses to be considered include Robert Mondavi, Domain Chandon,
Beringer (large wine production), and Alpha-Omega, Fisher, Larkmead (smaller vineyards which distribute their
products through membership and a selected number of restaurants).
Due to the relatively large volume of nuts and fruits (dried, fresh, processed) sold both within California and
other states as well as exported, it makes sense to contact the California Dried Fruit Export Association when
considering expanding the scope of the logistics study.
Strawberries and other fresh fruits are products largely sold internally and also exported. Watsonville area is
abundant in strawberry farms whereas Central Valley has a large number of farms specialized in growing nuts
and fruits. In the recent years a new form of delivery of farm fresh products gained popularity. The business
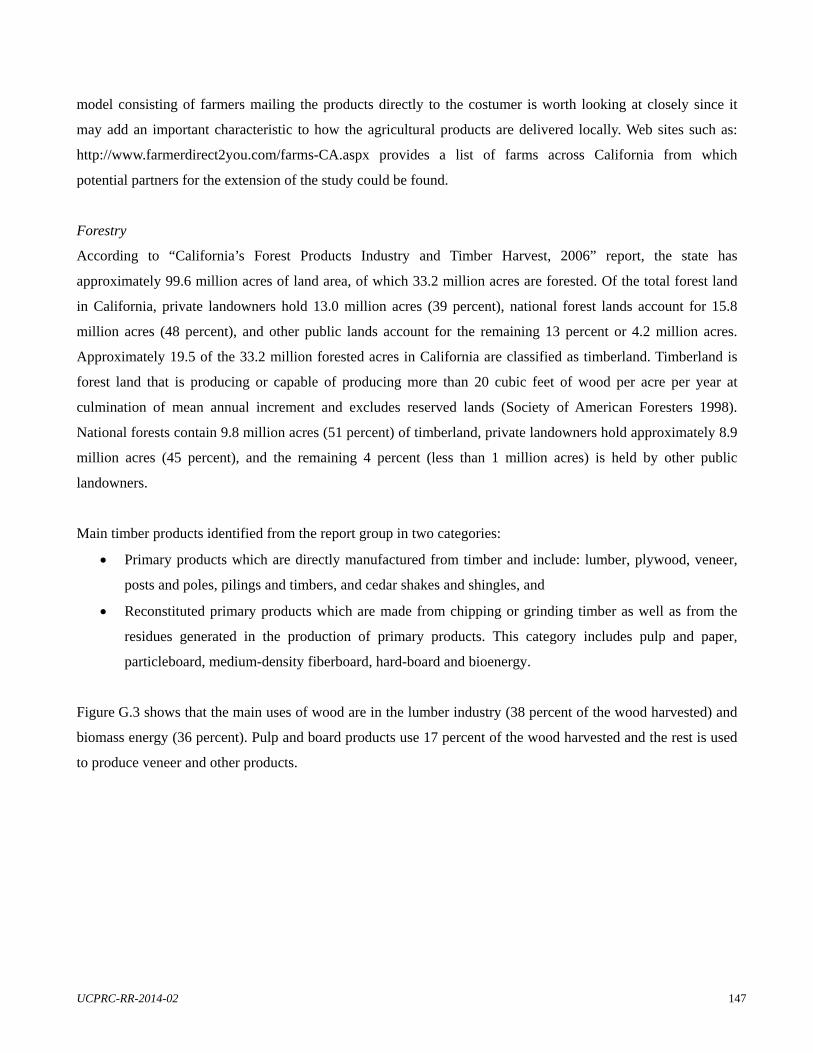
UCPRC-RR-2014-02 147
model consisting of farmers mailing the products directly to the costumer is worth looking at closely since it
may add an important characteristic to how the agricultural products are delivered locally. Web sites such as:
http://www.farmerdirect2you.com/farms-CA.aspx provides a list of farms across California from which
potential partners for the extension of the study could be found.
Forestry
According to “California’s Forest Products Industry and Timber Harvest, 2006” report, the state has
approximately 99.6 million acres of land area, of which 33.2 million acres are forested. Of the total forest land
in California, private landowners hold 13.0 million acres (39 percent), national forest lands account for 15.8
million acres (48 percent), and other public lands account for the remaining 13 percent or 4.2 million acres.
Approximately 19.5 of the 33.2 million forested acres in California are classified as timberland. Timberland is
forest land that is producing or capable of producing more than 20 cubic feet of wood per acre per year at
culmination of mean annual increment and excludes reserved lands (Society of American Foresters 1998).
National forests contain 9.8 million acres (51 percent) of timberland, private landowners hold approximately 8.9
million acres (45 percent), and the remaining 4 percent (less than 1 million acres) is held by other public
landowners.
Main timber products identified from the report group in two categories:
Primary products which are directly manufactured from timber and include: lumber, plywood, veneer,
posts and poles, pilings and timbers, and cedar shakes and shingles, and
Reconstituted primary products which are made from chipping or grinding timber as well as from the
residues generated in the production of primary products. This category includes pulp and paper,
particleboard, medium-density fiberboard, hard-board and bioenergy.
Figure G.3 shows that the main uses of wood are in the lumber industry (38 percent of the wood harvested) and
biomass energy (36 percent). Pulp and board products use 17 percent of the wood harvested and the rest is used
to produce veneer and other products.
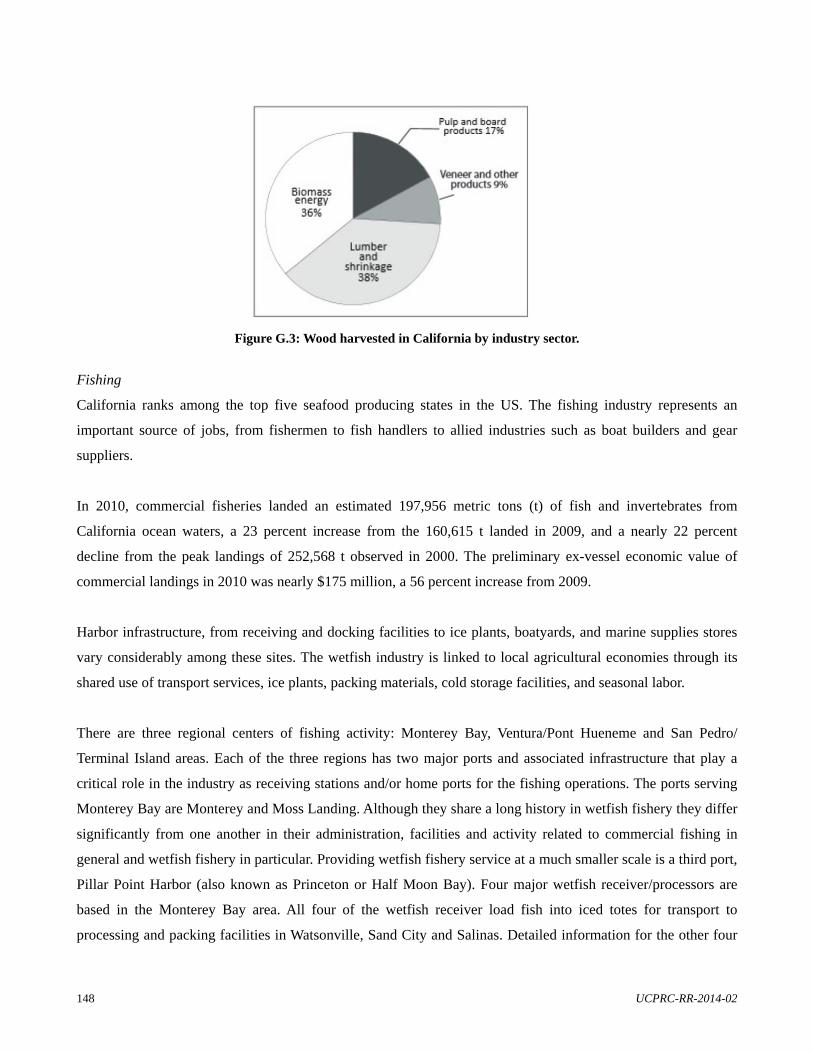
148 UCPRC-RR-2014-02
Figure G.3: Wood harvested in California by industry sector.
Fishing
California ranks among the top five seafood producing states in the US. The fishing industry represents an
important source of jobs, from fishermen to fish handlers to allied industries such as boat builders and gear
suppliers.
In 2010, commercial fisheries landed an estimated 197,956 metric tons (t) of fish and invertebrates from
California ocean waters, a 23 percent increase from the 160,615 t landed in 2009, and a nearly 22 percent
decline from the peak landings of 252,568 t observed in 2000. The preliminary ex-vessel economic value of
commercial landings in 2010 was nearly $175 million, a 56 percent increase from 2009.
Harbor infrastructure, from receiving and docking facilities to ice plants, boatyards, and marine supplies stores
vary considerably among these sites. The wetfish industry is linked to local agricultural economies through its
shared use of transport services, ice plants, packing materials, cold storage facilities, and seasonal labor.
There are three regional centers of fishing activity: Monterey Bay, Ventura/Pont Hueneme and San Pedro/
Terminal Island areas. Each of the three regions has two major ports and associated infrastructure that play a
critical role in the industry as receiving stations and/or home ports for the fishing operations. The ports serving
Monterey Bay are Monterey and Moss Landing. Although they share a long history in wetfish fishery they differ
significantly from one another in their administration, facilities and activity related to commercial fishing in
general and wetfish fishery in particular. Providing wetfish fishery service at a much smaller scale is a third port,
Pillar Point Harbor (also known as Princeton or Half Moon Bay). Four major wetfish receiver/processors are
based in the Monterey Bay area. All four of the wetfish receiver load fish into iced totes for transport to
processing and packing facilities in Watsonville, Sand City and Salinas. Detailed information for the other four
UCPRC-RR-2014-02 149
ports serving the remaining two locations is documented in “Socio-Economic Profile of the California Wetfish
Industry” by Pomeroy, Hunter and Los Huertos. For brevity, the focus on sources for new participants to the
extended study has been kept to the Bay Area, Central Valley and Peninsula.
Legislative bodies with authority over the fishing industry in California are:
The California Legislature or the California Fish and Game Commission which regulates fishing
activity within the state's three-mile limit, based on recommendations of the Department of Fish and
Game (CDFG). The CDFG enforces regulations, collects license fees and use taxes on local seafood
harvested, and performs research on California fish and fisheries, and
The Pacific Fishery Management Council (PFMC), established in 1976 by federal legislation known as
the Magnuson Fisheries Conservation and Management Act (FCMA). This act was passed in response
to growing concern for unregulated foreign fishing in U.S. waters. Commercial and recreational fishing
interests, as well as state and federal officials make up the PFMC. Biologists, economists, and industry
representatives also serve as advisors. Decisions made by the PFMC must be approved by the U.S.
Secretary of Commerce.
Points to initiate contact for the extended study are California Wetfish Producers Association
(http://www.californiawetfish.org/contact.html).
Manufacturing
The Bureau of Labor Statistics lists 21 sub-sectors as part of the manufacturing industry. For more details on
each of the comprising sectors, refer to http://www.bls.gov/iag/tgs/iag31-33.htm. For brevity, only few sub-
sectors will be analyzed in more detail in this document. One of them is the transportation manufacturing sub-
sector which included the following industry groups:
Motor vehicle manufacturing;
Motor vehicle body and trailer manufacturing;
Motor vehicle parts manufacturing;
Airspace product and parts manufacturing;
Railroad rolling stock manufacturing;
Ship and boat building, and
Other transportation equipment manufacturing.
150 UCPRC-RR-2014-02
California leads the electric car manufacturing hosting Tesla Motors in the Bay Area. In the industry group of
motor vehicle body and trailer manufacturing, Bay Area hosts two companies: Gillig, LLC in Hayward and
McLellan Industries, Inc. in South San Francisco.
Transportation and Warehousing
The transportation and warehousing industries provide services that move people and goods around the world
efficiently. As the marketplace becomes increasingly global, reliance on new technologies to better manage
warehousing and expedite transportation is essential. The industry remains an important gateway to
globalization as economic growth is strongly reliant on increased capacity to support it. The transportation and
warehousing groups in the following categories:
Air transportation
Pipeline transportation
Water transportation
Rail transportation
Transit and ground passenger transportation
Truck transportation
Support activities
Couriers and messengers
Warehousing and storage where differentiation is made among farm products, refrigerated products, and
general merchandise.
In the area of truck transportation companies in the transit and ground passenger transportation should also be
contacted. Services such as shuttle, public transportation, taxi, long distance bus services (Greyhound) could
provide a good insight on the impact of infrastructure policies on their logistics.
Retail Trade
The Retail Trade sector comprises establishments engaged in retailing merchandise, generally without
transformation, and rendering services incidental to the sale of merchandise. The retailing process is the final
step in the distribution of merchandise; retailers are, therefore, organized to sell merchandise in small quantities
to the general public. This sector comprises two main types of retailers: store and non-store retailers.
The retail store industry consists of the following sub-sectors:
Motor vehicle and parts dealers;
Furniture and home furnishing stores;
UCPRC-RR-2014-02 151
Building material and garden equipment and supplies dealers;
Food and beverage stores;
Health and personal care stores;
Gasoline stations;
Clothing and clothing accessories stores;
Sporting goods, hobby, books, and music stores;
General merchandise stores;
Miscellaneous store retailers, and
Non-store retailers.
Appendix H provides a list of businesses to contact for expanding the horizon of the data collected.
Wholesale Trade
The Wholesale Trade sector comprises establishments engaged in wholesaling merchandise, generally without
transformation, and rendering services incidental to the sale of merchandise.
The wholesaling process is an intermediate step in the distribution of merchandise. Wholesalers are organized to
sell or arrange the purchase or sale of:
Goods for resale (i.e., goods sold to other wholesalers or retailers);
Capital or durable non-consumer goods, or
Raw and intermediate materials and supplies used in production.
The Bureau of Labor Statistics identifies three sub-sectors in the wholesale trade arena:
Durable goods wholesale merchants. Products in this category include:
o Motor vehicles, parts, and supplies;
o Furniture and home furnishing, and
o Machinery, equipment, and supply.
Nondurable goods wholesale merchants. Products include:
o Chemicals and allied products;
o Petroleum and petroleum products (petroleum bulk stations and terminals);
o Miscellaneous nondurable goods, and
o Electronic markets and agents and brokers.
152 UCPRC-RR-2014-02
In the area of nondurable goods companies such Valero and Chevron, both with branch offices in the Bay Area,
could provide useful information on how the impact of infrastructure policies on their logistics.
Waste Management and Remediation Services
Industries in the Waste Management and Remediation Services subsector group establishments engaged in the
collection, treatment, and disposal of waste materials. This includes establishments engaged in local hauling of
waste materials; operating materials recovery facilities (i.e., those that sort recyclable materials from the trash
stream); providing remediation services (i.e., those that provide for the cleanup of contaminated buildings, mine
sites, soil, or ground water); and providing septic pumping and other miscellaneous waste management services.
It consists of the following industry groups:
Waste collection;
Waste treatment and disposal, and
Remediation and other waste management services.
Sources for identifying potential participants to provide information for the extended study include: the Waste
Management web site (http://www.wm.com/facility-locator.jsp?cat=1&state=CA).
Health Care and Social Assistance
The Health Care and Social Assistance sector comprises establishments providing health care and social
assistance for individuals. The sector includes both health care and social assistance because it is sometimes
difficult to distinguish between the boundaries of these two activities. The industries in this sector are arranged
on a continuum starting with those establishments providing medical care exclusively, continuing with those
providing health care and social assistance, and finally finishing with those providing only social assistance. The
services provided by establishments in this sector are delivered by trained professionals. It consists of the
following sub-sectors:
Ambulatory health care services;
Hospitals;
Nursing and residential care facilities, and
Social assistance.
Possible resources for the study could be obtained by contacting any hospital, nursing/residential care facility,
and by accessing The Community Health Advocacy Project with offices in various locations in Northern
California.
UCPRC-RR-2014-02 153
Leisure and Hospitality
The leisure and hospitality supersector consists of these sectors:
Arts, entertainment, and recreation, and
Accommodation and food services.
In this area, places such as movie theaters, live theaters, museums, hotels and restaurants could be interviewed
to provide information on the impact of infrastructure on their logistics.
References:
FISHERIES REVIEW, CalCOFI Rep., Vol. 52, 2011
“Socio-Economic Profile of the California Wetfish Industry” by Pomeroy, Hunter and Los Huertos
Bureau of Labor Statistics, http://www.bls.gov/iag/tgs/iag31-33.htm
154 UCPRC-RR-2014-02
APPENDIX H: POTENTIAL PARTICIPANTS FOR FUTURE CASE STUDIES
To expand the scope of the pilot study, all of the following 10 goods movement dependent sectors need to be
analyzed by executing a representative ensemble of case studies within each sector. During the pilot study a
number of potential participants were identified, but due to time and scope restrictions they were not pursued.
This list could present a starting point for expanding the study, but care should be taken to appropriately sample
the sectors to ensure that the case studies are representative.
Mining
o Aggregates
GraniteRock: 350 Technology Drive, P.O. Box 50001, Watsonville, CA 95077-5001. 1-
831-576-2300
Other mining products: http://active-mines.findthedata.org/d/d/California
Refineries
o Valero refinery - Benicia, CA
o Chevron refinery - Richmond, CA
o Telfer Oil - Martinez, CA
Utilities
o Pacific Gas and Electric Company (PG&E) – www.pge.com
o East Bay Municipal Utility District (EBMUD) – www.ebmud.com
Agriculture, Forestry and Fishing (additional case studies required)
o Dairy farming and processing
Foster Farms Dairy - Production Facility, Modesto, California 95351. 1-209-576-2300.
http://www.fosterfarmsdairy.com
McClelland's Dairy, Petaluma, California 94952. 1-707-664-0452.
http://www.mcclellandsdairy.com
Meadowsweet Dairy, Corte Madera, California 94925. 1-415-927-8112.
http://meadowsweet-dairy.com
o Forestry
Big Creek (http://www.big-creek.com/lumber-and-building-supplies/)
UCPRC-RR-2014-02 155
o Food processing
California Dried Fruit Export Association. http://www.shipsctc.org/contact-us/
company-contacts/
Watsonville Berry Co-op, 416 Salinas Rd., P.O. Box 825, Watsonville, California
95077-0825. 831 724-5601 Fax 831 761-0237. Email: [email protected]
o Other sources for farm products: http://www.farmerdirect2you.com/farms-CA.aspx
o Fishing
California Wetfish Producers Association
http://www.californiawetfish.org/contact.html
o Wine making
Robert Mondavi, Domain Chandon, Beringer
Alpha-Omega, Fisher, Larkmead
Manufacturing
o Automobile manufacturing
Tesla Factory, 45500 Fremont Blvd. Fremont, CA 94538. (510) 249-2500
o Motor vehicle body and trailer manufacturing
Gillig, LLC. 510-785-1500
McLellan Industries, Inc. (650) 873-8100
Transportation and Warehousing (additional case studies required)
o Trucking service providers
Chavez Trucking. http://www.chaveztrucking.com/index.html
o Transit and ground passenger transportation
Bay Area Transportation Authority, Santa Clara Valley Transportation Authority,
BART shuttle
Super Shuttle, Bay Porter Express
Taxi Bay Area (www.taxybayarea.com)
Retail Trade
o Food and beverage/general merchandise/building/garden
Wal-Mart, Whole Foods, Trader Joes, Big Lots, Home Depot, Costco
o Clothing/clothing accessories
Macy’s, Nordstrom, Khol’s
o Health and personal care stores
156 UCPRC-RR-2014-02
CVS, Walgreens, Rite Aid
o Gasoline stations – select any station that is convenient
Wholesale Trade
o Nondurable goods
Valero (Benicia), Chevron (Richmond)
Waste Management
o Waste management
http://www.wm.com/facility-locator.jsp?cat=1&state=CA
Health Care and Social Assistance
o Social services
The Community Health Advocacy Project, 1735 Telegraph Ave., Oakland, CA 94612.
510-250-5270
o Hospitals
Kaiser, Washington, Sutter Health, etc.
o Nursing and residential care
California Care Homes (http://californiacarehomes.com/)
Accommodation and Food Service
o Arts, entertainment, and recreation
Movie theaters, live theaters, museums, entertainment parks such as Great America
Parkway, Marin World, Zoos
o Accommodation and food services
o Hotels, restaurants, catering businesses
Related Documents