Logarithms and Logarithmic Functions Unit 6.6

Logarithms and Logarithmic Functions Unit 6.6. Warm up… 1. Use a graphing calculator to make a scatter plot for the data in the table. Sketch the graph.
Dec 23, 2015
Welcome message from author
This document is posted to help you gain knowledge. Please leave a comment to let me know what you think about it! Share it to your friends and learn new things together.
Transcript
Logarithms and
Logarithmic Functions
Unit 6.6

Warm up…
1. Use a graphing calculator to make
a scatter plot for the data in the table. Sketch the graph in your
notes including the window.
2. Find an exponential equation to fit this
data.
The Richter scale describes the intensity of an earthquake. It was developed by Charles Richter in 1935. The table shows how the intensity of an earthquake increases as the number increases.
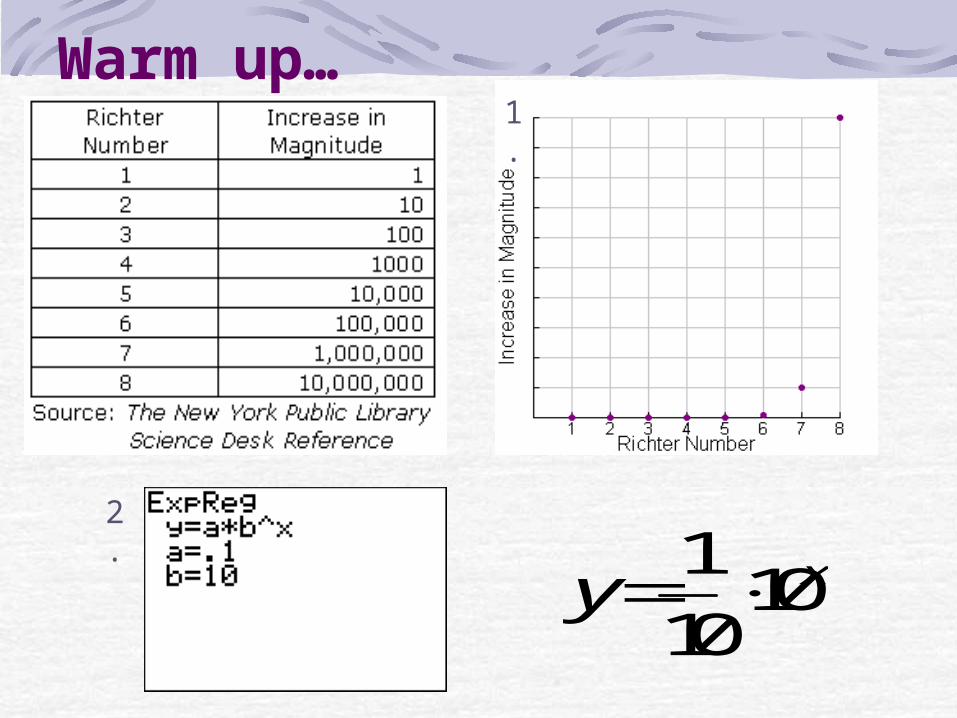
Warm up…1.
110
10xy
2.

Reflecting Exponential Functions
Work and complete the worksheet when you have finished your quiz.

How do I solve x = 3y ? John Napier was a Scottish theologian and
mathematician who lived between 1550 and 1617. He spent his entire life seeking knowledge, and working to devise better ways of doing everything from growing crops to performing mathematical calculations. He invented a new procedure for making calculations with exponents easier by using what he called logarithms. A logarithm can be written as a function y = logbx.
The notation y = logbx is another way of writing x = by.
So x = by and y = logbx represent the same functions.
• y =log3x is simply another way of writing x = 3y.
The notation is read “y is equal to the logarithm, base 3, of x.”

Logarithmic Function(Common)
10( ) logf x x1; 10b b
Calculator: y1= log(x)
Domain: x > 0 or x (0,∞)
Range: y or y (-∞,∞)
Zeros: (1,0) or x = 1
X-Intercept: (1,0)
Y-Intercept: none

Logarithmic Function(Common)
10( ) logf x x1; 10b b
Symmetry: None
Max: None
Min: None
Increasing: x (0,∞)
Decreasing: Never
Vertical Asymptotes: x = 0
Horizontal Asymptotes: None

Logarithmic Function (Natural)
( ) lnf x x
Calculator: y1= ln(x)
Domain: x > 0 or x (0,∞)
Range: y or y (-∞,∞)
Zeros: (1,0) or x = 1
X-Intercept: (1,0)
Y-Intercept: none

Logarithmic Function (Natural)
( ) lnf x x
Symmetry: None
Max: None
Min: None
Increasing: x (0,∞)
Decreasing: Never
Vertical Asymptotes: x = 0
Horizontal Asymptotes: None

Things I should Know about Logarithmic Functions
The output of a log function is an exponent.Log and exp. functions are inverses.Domain: (0, )Range: (-, )x-intercept of the graph: (1,0)Vertical Asymptote at x = 0 (or the y-axis)
( ) logbf x x
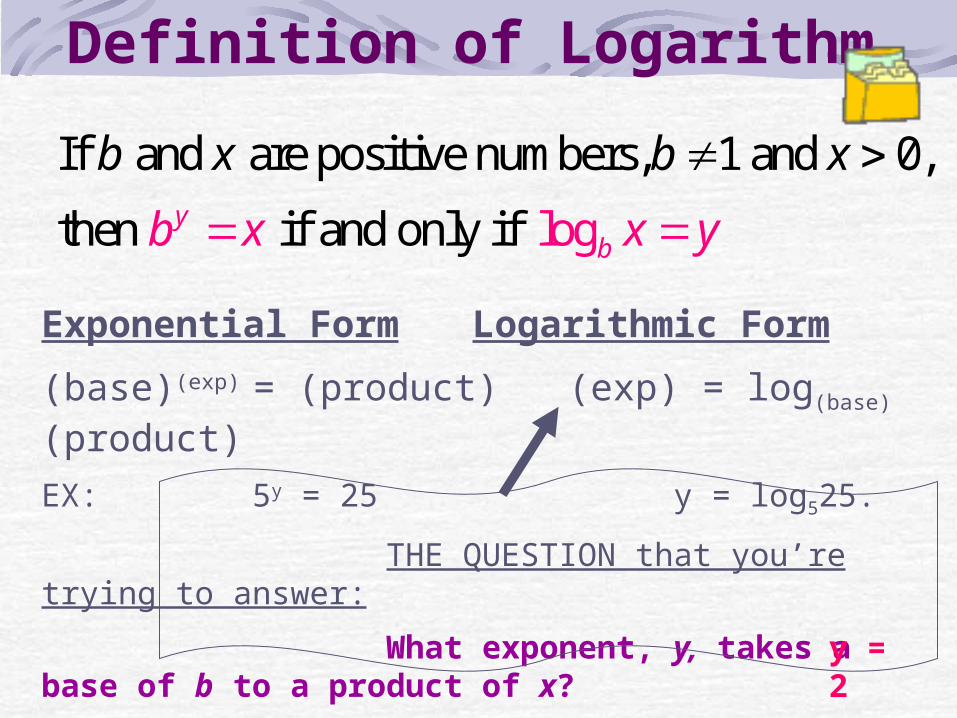
Definition of Logarithm
If and are positive numbers, 1 and 0,
then if and only if logybb x x
x b
y
b x
Exponential Form Logarithmic Form
(base)(exp) = (product) (exp) = log(base)(product)
EX: 5y = 25 y = log525.
THE QUESTION that you’re trying to answer:
What exponent, y, takes a base of b to a product of x?
EX: What exponent, y, takes a base of 5 to 25? y = 2

Example 1….Change from Log notation to Exponential notation or Exponential notation to Log notation.
Logarithmic Form Exponential Form
39 2Log 23 9
8 3xLog 3 8x
81
1
29Log
1
281 9
5 25Log x 5 25x
(___ is the exp. that takes a base of __ to a __.)
(___ is the exp. that takes a base of __ to an __.)
2 3 9
3 x 8
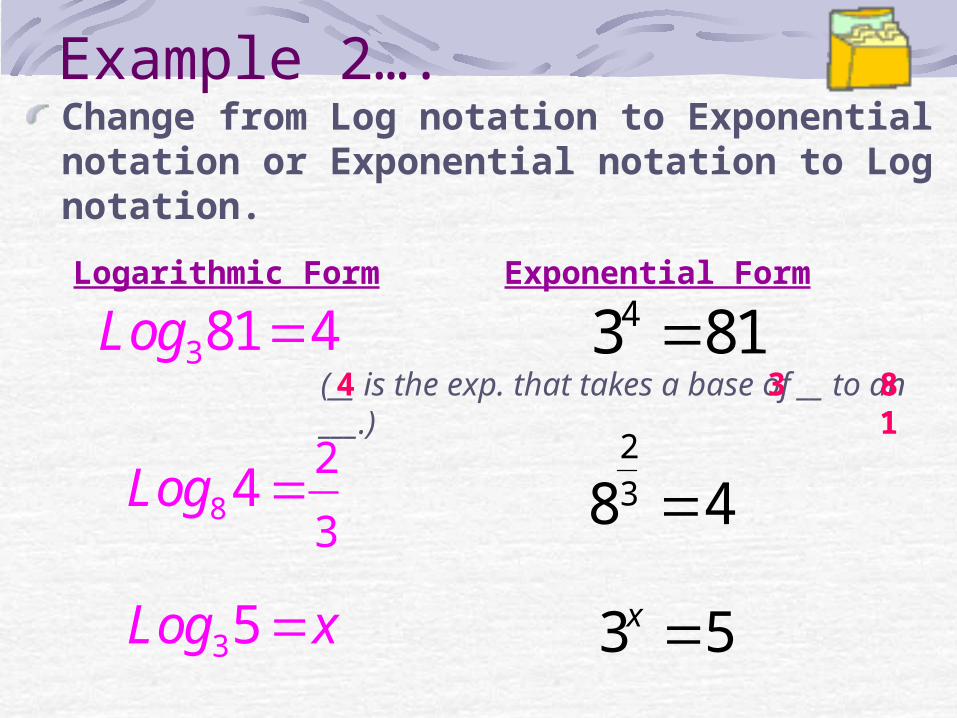
Example 2….Change from Log notation to Exponential notation or Exponential notation to Log notation.Logarithmic Form Exponential Form
381 4Log 43 81
8
2
34Log
2
38 4
35Log x 3 5x
(__ is the exp. that takes a base of __ to an ___.)4 3 81
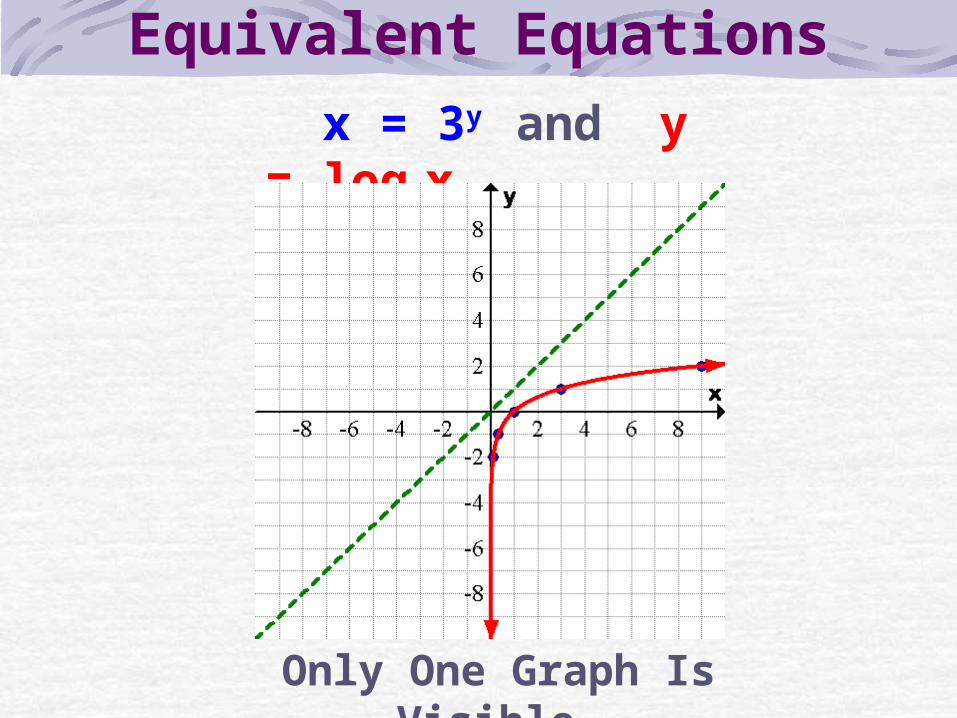
Equivalent Equations
x = 3y and y = log3x
Only One Graph Is Visible.

The inverse of the exponential parent function can be defined as a new function, the logarithmic parent function. The functions are reflections of each other over the line y = x.
Inverse Equations
Two graphs are visible that are reflected over the y = x line.
y = 2x and y = log2x

Finding the inverse algebraically
Example 3: Rewrite the inverse of the exponential function y = 2x + 3 as a logarithmic function.Beginning Equation
Replace x with y and y with x.
Isolate the term containing y.
Rewrite the exponential function as a logarithmic function
2 3xy
2 3yx
3 2yx
2log ( 3)y x
Finding the inverse remember…
When using a table of values to find the inverse of an exponential function the domain will switch with the range like on the beginning activity.
When using a graph to find the inverse of an exponential function, the graph must reflect over the y = x line.
When using algebraic methods to find the inverse of an exponential function, switch x and y in the equation, get the term containing y by itself, and then rewrite in logarithmic form.

Example 4Determine the inverse of the following. Your final answer should be in the equation box
below.
A. y = 4x-2.
x = 4y-2.
x+2 = 4y
y=log(x+2)
B. log2x+3
x = log2y+3
x-3 = log2y
y=2x-3

Example 4Determine the inverse of the following.
C. y = 6x-5
x = 6y-5
log6x= y-5
B. y = log6(x+2)
x = log6(y+2)
6x = y+2
y=6x - 2 log6x+5=y
Ory = log6x+5
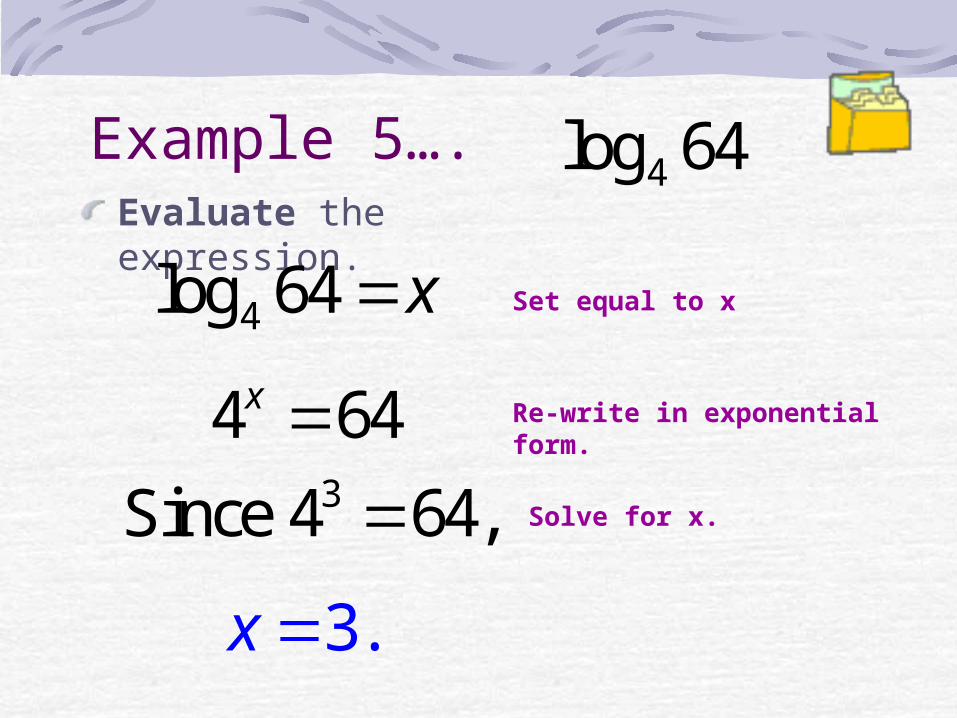
Example 5….Evaluate the expression.
4log 64
3. x
4log 64 x
4 64x Re-write in exponential form.
Set equal to x
3Since 4 64, Solve for x.
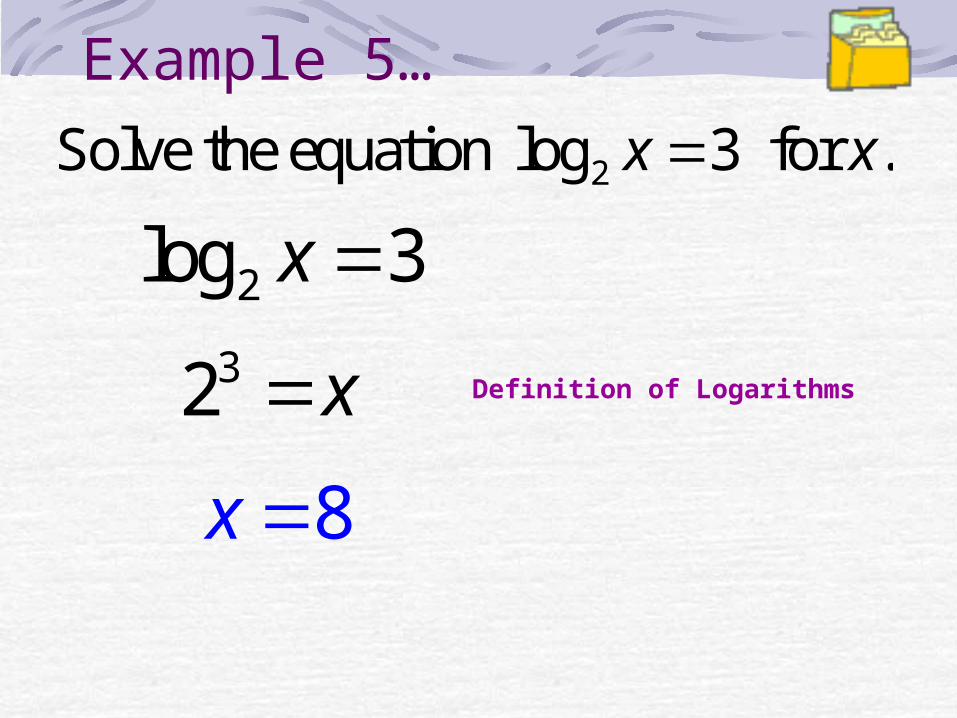
Example 5…
2Solve the equation log 3 for .x x
2log 3x 32 x
8x
Definition of Logarithms
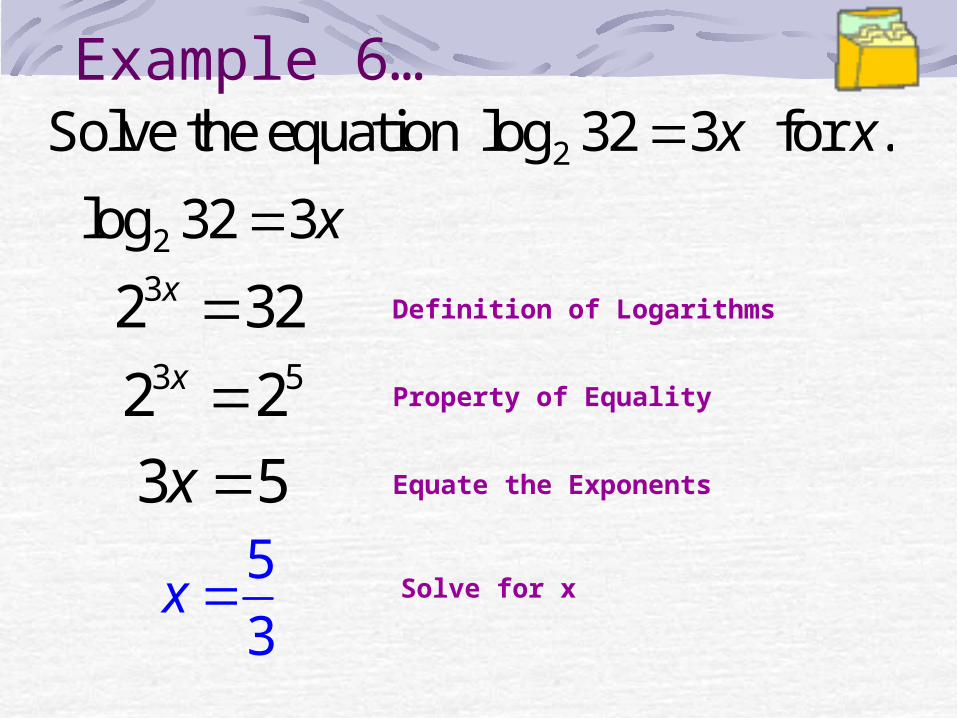
Example 6…2Solve the equation log 32 3 for .x x
2log 32 3x
3 52 2x
5
3x
Definition of Logarithms32 32x
3 5x
Property of Equality
Equate the Exponents
Solve for x
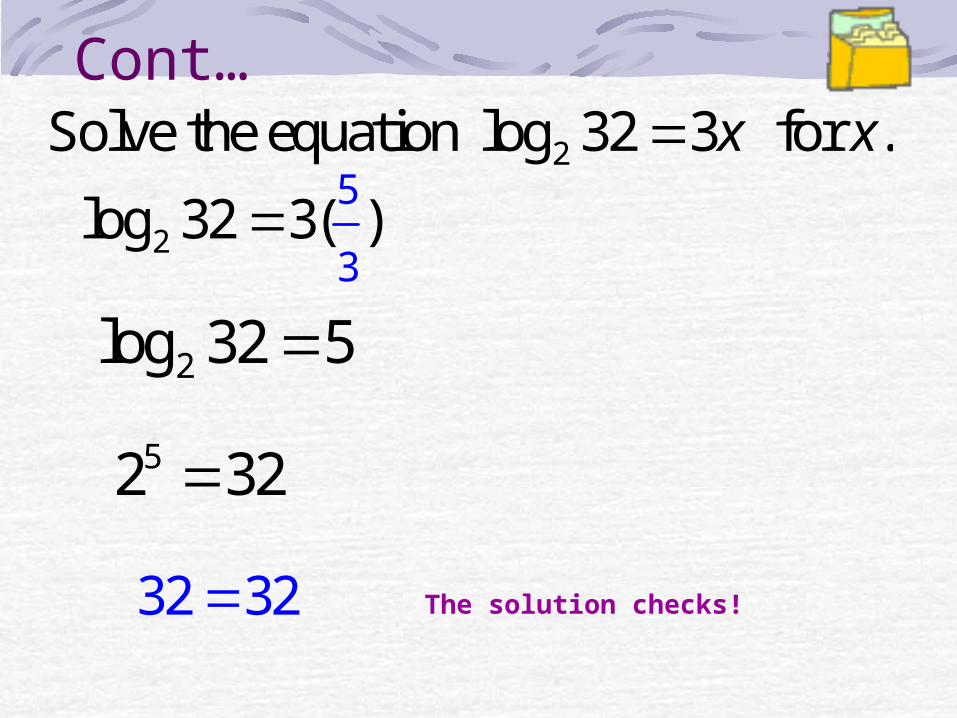
Cont…2Solve the equation log 32 3 for .x x
2
5
3log 32 3( )
2log 32 5
32 32
52 32
The solution checks!

Example 7…1
Solve the equation log 2 for .9
x x
2 2 1(3 ) x
3x
1log 2
9x
2 1
9 x
2 23 x
Definition of Logarithms
Power of Power
Equate the Exponents
Check your solution!
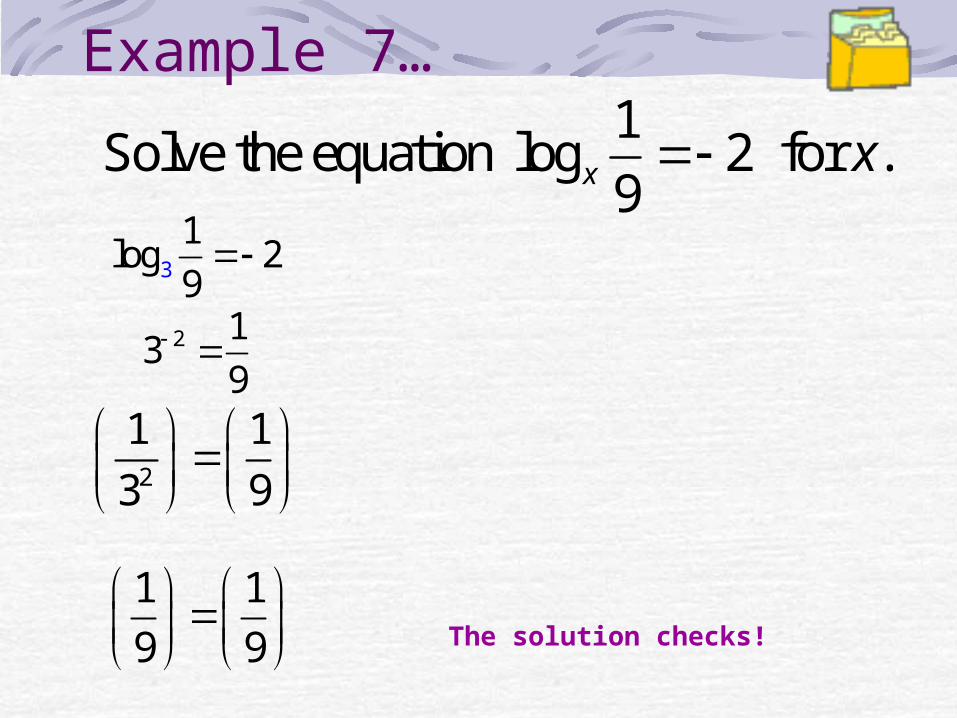
Example 7…1
Solve the equation log 2 for .9
x x
2
1 1
3 9
3
1log 2
9
2 13
9
1 1
9 9 The solution checks!
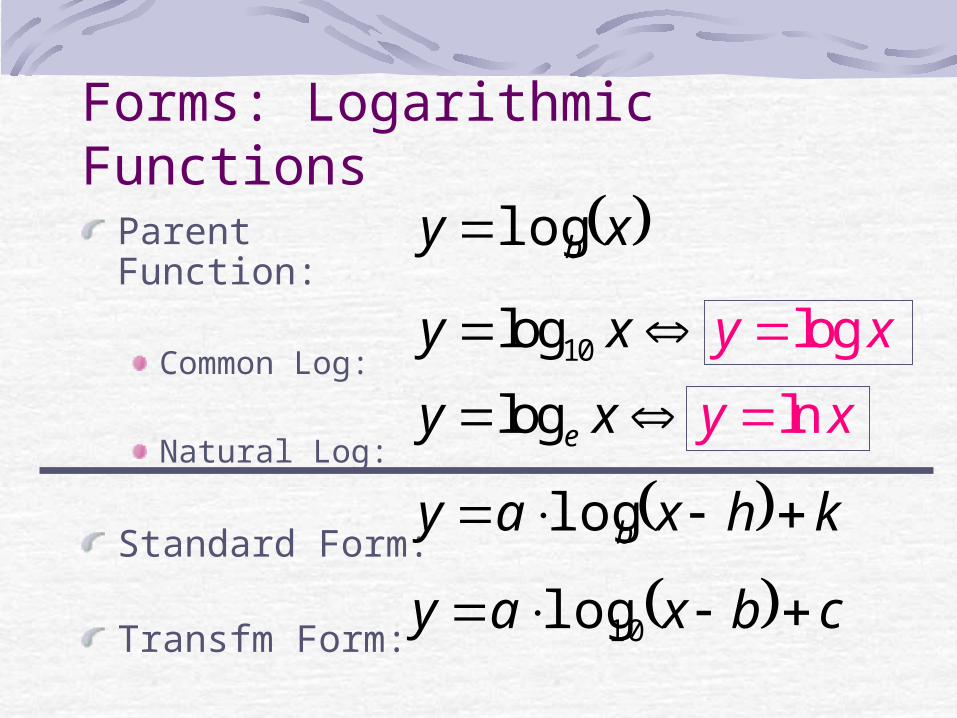
Forms: Logarithmic FunctionsParent Function:
Common Log:
Natural Log:
Standard Form:
Transfm Form:
10log logy x y x
lnlogey x y x
xy blog
khxay b log
cbxay 10log

Absent Students-Notes 6.6
Attach this note page into your notebook
Complete all examples and warm-ups
Be sure to understand the difference between finding the inverse, evaluating, solving and rewriting logs and exponentials
Related Documents