Lockyer Valley Regional Council Annual Report 2018–2019

Welcome message from author
This document is posted to help you gain knowledge. Please leave a comment to let me know what you think about it! Share it to your friends and learn new things together.
Transcript

Lockyer Valley Regional CouncilAnnual Report 2018–2019
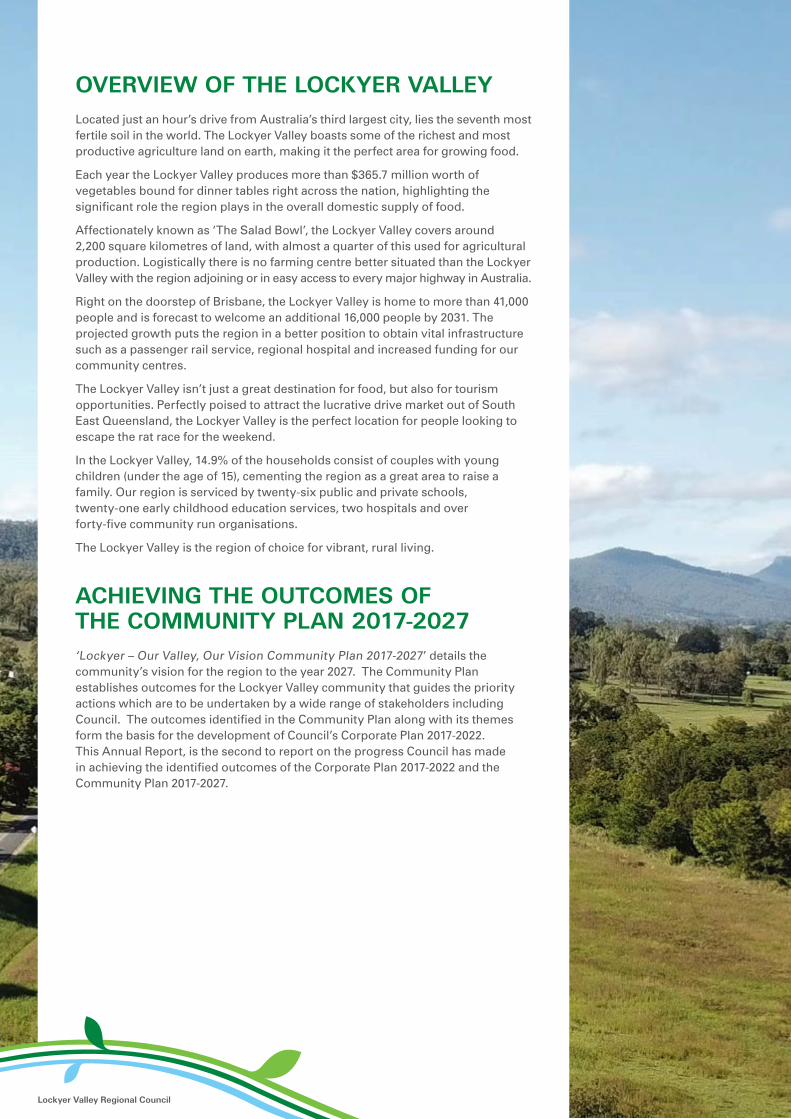
OVERVIEW OF THE LOCKYER VALLEYLocated just an hour’s drive from Australia’s third largest city, lies the seventh most fertile soil in the world. The Lockyer Valley boasts some of the richest and most productive agriculture land on earth, making it the perfect area for growing food.
Each year the Lockyer Valley produces more than $365.7 million worth of vegetables bound for dinner tables right across the nation, highlighting the significant role the region plays in the overall domestic supply of food.
Affectionately known as ‘The Salad Bowl’, the Lockyer Valley covers around 2,200 square kilometres of land, with almost a quarter of this used for agricultural production. Logistically there is no farming centre better situated than the Lockyer Valley with the region adjoining or in easy access to every major highway in Australia.
Right on the doorstep of Brisbane, the Lockyer Valley is home to more than 41,000 people and is forecast to welcome an additional 16,000 people by 2031. The projected growth puts the region in a better position to obtain vital infrastructure such as a passenger rail service, regional hospital and increased funding for our community centres.
The Lockyer Valley isn’t just a great destination for food, but also for tourism opportunities. Perfectly poised to attract the lucrative drive market out of South East Queensland, the Lockyer Valley is the perfect location for people looking to escape the rat race for the weekend.
In the Lockyer Valley, 14.9% of the households consist of couples with young children (under the age of 15), cementing the region as a great area to raise a family. Our region is serviced by twenty-six public and private schools, twenty-one early childhood education services, two hospitals and over forty-five community run organisations.
The Lockyer Valley is the region of choice for vibrant, rural living.
ACHIEVING THE OUTCOMES OF THE COMMUNITY PLAN 2017-2027‘Lockyer – Our Valley, Our Vision Community Plan 2017-2027’ details the community’s vision for the region to the year 2027. The Community Plan establishes outcomes for the Lockyer Valley community that guides the priority actions which are to be undertaken by a wide range of stakeholders including Council. The outcomes identified in the Community Plan along with its themes form the basis for the development of Council’s Corporate Plan 2017-2022. This Annual Report, is the second to report on the progress Council has made in achieving the identified outcomes of the Corporate Plan 2017-2022 and the Community Plan 2017-2027.
Lockyer Valley Regional Council

CONTENTSIntroduction .......................................................................................................................1
Council’s Strategic Planning Framework ..................................................................1
Vision, Mission and Values .............................................................................................2
Message from the Mayor ................................................................................................3
Message from the Chief Executive Officer ...................................................................4
Lockyer Valley Regional Council Highlights 2018-19...................................................5
Our Councillors and their portfolios ..............................................................................7
Organisational Structure .................................................................................................8
Executive Leadership Team ............................................................................................8
Our Employees ..................................................................................................................9
Community Financial Report .......................................................................................11
Delivering the Operational Plan 2018-19 .....................................................................21
Lockyer Community ...................................................................................................21
Lockyer Business Farming and Livelihood .............................................................23
Lockyer Nature ............................................................................................................25
Lockyer Planned ..........................................................................................................26
Lockyer Leadership and Council ..............................................................................27
Statutory Information.................................................................................................... 30
Beneficial Enterprises ............................................................................................... 30
Conduct of Business Activities ............................................................................... 30
Competitive Neutrality Complaints ......................................................................... 30
Particular Resolutions ............................................................................................... 30
Councillors .......................................................................................................................31
Administrative Action Complaints .......................................................................... 33
Right to Information and Information Privacy ........................................................34
Record of Councillor Conduct and Performance Complaints .............................34
Overseas Travel ..........................................................................................................34
Grants to Community Organisations ........................................................................ 35
Councillor Discretionary Funds ....................................................................................37
Commercial Business Units ........................................................................................ 39
Action taken involving special arrangements ........................................................... 39
Changes to Tenders ...................................................................................................... 39
Concessions for rates and charges granted .............................................................. 39
Registers Maintained .................................................................................................... 40
Internal Audit ................................................................................................................. 40
Financial Statements ......................................................................................................41
Annual Report 2018–2019

INTRODUCTIONThis Annual Report, for the financial year 1 July 2018 to 30 June 2019, describes Lockyer Valley Regional Council’s achievements in providing services to the communities it serves. It displays the progress in delivering the actions in the Corporate and Operational Plans, along with statutory reporting requirements, providing a culmination of regular reports to the community and stakeholders. Council’s 2017-2022 Corporate Plan provided the focus and direction for Council over the twelve-month period to 30 June 2019.
The Annual Report provides the community with operational and financial information about Council’s performance against the outcomes and service delivery commitments set out in the Corporate and Operational Plans which were developed in response to the Lockyer Valley Community Plan 2017-2027.
COUNCIL’S STRATEGIC PLANNING FRAMEWORKThe diagram below represents the strategic planning framework used by Council:
COMMUNITY PLAN (10 Year)
BUDGET (1 Year)
RISK MANAGEMENTBUSINESS UNIT
PLANS (2 – 5 Years)
OPERATIONAL PLAN (1 Year)
CORPORATE PLAN (5 Year)
QUARTERLY PERFORMANCEREPORTS
ANNUAL REPORT
ASSET MANAGEMENT PLANS
(10 Year)
LONG TERM FINANCIAL PLAN
(10 Year)
1 Lockyer Valley Regional Council

VISION, MISSION AND VALUES
VISION:
We will deliver sustainable services to enhance the liveability of our community while embracing our economic, cultural and natural diversity.
MISSION:
Lead, engage and empower.
OUR VALUES:
Values form the basis of our culture. They add meaning to work and they provide a basis for consistent planning and decision making across the organisation. The desired values and behaviours that every employee of Lockyer Valley Regional Council is expected to demonstrate in their daily activities, in the way they behave and in the way they make decisions are:
LEADERSHIP
We lead through excellence and partner with the community to achieve Council’s vision and mission.
ACCOUNTABILITY
We accept ownership of our role and take responsibility for our actions. We are results focused, take pride in our successes and efforts and learn from our mistakes.
INTEGRITY
We strive to be valued and trusted by the Lockyer Valley community. We are respectful, open, transparent and honest in our dealings with the community. At all times we act in the best interests of the community.
COMMUNICATION
We embrace diversity and communicate openly and honestly. We listen actively, consider and value the views of others. Our communication is clear, concise and consistent.
CUSTOMER FOCUS
We strive to engage and communicate with our internal and external customers to meet agreed outcomes. We identify and aim to meet the needs of all customers in a responsive and equitable manner.
TEAMWORK AND COLLABORATION
We value creative thinking and look for opportunities to collaborate and connect to deliver a better Lockyer Valley. We work together by recognising and sharing our talents, skills, experience and knowledge.
2Annual Report 2018–2019

MESSAGE FROM THE MAYOR
STRONG FINANCIAL POSITION
It is again with enormous pride that I acknowledge the strong financial position we are in as a Council. We have continued to reign in debt and make loan repayments at an accelerated rate as we delivered a third consecutive operational surplus in 2018-19.
As an organisation we have continued to get our debts and finances in order and stopped spending on shiny new things and instead continued to focus on maintaining the assets we currently have.
As a result, we have made an additional payment of $500,000 against our debt this financial year and by the end of the current term of Council in 2020, a total of $12 million in debt is planned to be paid. We have $23.1 million in the bank ensuring we are in a better financial position to be able to manage any unforeseen disaster, should one occur.
Our Ten Year Financial Plan has Council in a strong position, being able to continue paying down debt at an accelerated rate while continuing to deliver on genuine operating surpluses.
COLLABORATION
A contributing factor in Council being able to deliver on our promise of financial sustainability has been through our ongoing commitment to being open and transparent and having genuine and honest conversations regardless of how hard they may be.
As a Council, we continue to work with and not against our stakeholders to achieve mutually beneficial outcomes for our region.
We have attracted significant investment including a new state-of-the-art backpacker facility now completed with planning underway for stage two. New accommodation has been provided with both the expansion of existing services and the inclusion of a new motel.
New service stations have been built and we are continuing talks to attract investment with a new high school planned, the inclusion of a new regional hospital now listed on a ten-year master plan, and the announcement of the $600 million stage two expansion of the South East Queensland Correctional Facility.
We fought for and received funding for a $1.4 million business case in securing the region’s long-term water supply as a measure to protect the long-term future of our national and in fact, global agricultural sector.
ACKNOWLEDGEMENT
While as an organisation we have certainly delivered some major achievements, they were only made possible through our close partnerships.
I would like to take this opportunity to thank my fellow Councillors for making the right decisions, and not just the easiest or most popular ones.
We continue to have open, honest and often robust conversations with internal and external stakeholders which is certainly playing a major role in driving the Lockyer Valley forward.
While I certainly acknowledge the good work shown by the CEO, Mr Ian Church, the Executive Leadership Team and all staff, I would like to publicly acknowledge the extraordinary efforts of our local primary producers as we battle worsening drought conditions.
It’s been a tough 12 months and with below average rainfall expected well into next year, things are certainly tough across the board.
As elected members, we have made some very tough but necessary decisions over the past four-year term of this current Council and for that I would like to thank you. We have based those decisions on
what needed to be done for the betterment of the community and not based on election cycles, and for that I am immensely proud.
Councillor Tanya Milligan (Mayor) Community and Council Development
3 Lockyer Valley Regional Council

MESSAGE FROM THE CHIEF EXECUTIVE OFFICERI am very proud of the commitment of Lockyer Valley Regional Council staff to our community. Every achievement highlighted in this Annual Report represents a contribution towards Council’s vision for the region and the organisation.
OUR CUSTOMERS AND COMMUNITY
Several business improvements were implemented during the year, specifically focused on our customers and community. These included enhancing our ability to resolve requests at their first point of contact through our customer contact centre; reducing red tape through our planning and development group and improving our response times when dealing with local laws issues impacting community members.
Council continued its commitment to community consultation throughout the year by seeking the community’s opinion on several important projects, including the Hatton Vale/Kensington Grove recreation facility; changes to the Waste Reduction and Recycling Plan; Gatton Showgrounds Master Plan and the Parks and Open Space Plan, amongst others. In addition, Council continued to recognise the importance of the community and sporting groups in our region by providing them with direct financial assistance in the amount of $491,687, along with significant in-kind support.
ADVOCACY
Council actively lobbied and worked with other levels of Government on behalf of the Lockyer region during the year. The Lockyer and Somerset Water Collaborative, with its objective of augmenting the water supply to the Lockyer and Somerset regions for use by farmers and businesses, has been very successful.
In addition, Council has been actively involved in the Inland Rail project lobbying on behalf of the community for solutions to the adverse impacts that the project will create as it traverses the Lockyer Valley. As well, Council is looking for any opportunities for residents of the Valley that may arise from the project.
OUR STAFF
During the year we started a review of our organisation which will benefit our customers, Councillors and staff. Benefits will be achieved by ensuring that the right organisational structure is in place supported by a culture of innovation and customer focus and skilled leaders. The first phase of the review being a realigned organisation, is intended to be in place during the third quarter of next financial year.
Through our Connected Council Progress Group, we have developed behaviours expected of all staff to align with Council’s corporate values. Living by our corporate values is an essential building block in the innovative and customer focused culture that we are creating as an organisation.
OUR COMMITMENT TO GOOD GOVERNANCE
Council has always been committed to a strong governance framework and ensuring that risks to the organisation are recognised and managed. With that in mind, Council staff identified key corporate risks to inform a Corporate Risk Register, Risk Management Framework and Policy. In addition, each Business Unit within Council developed a Business Plan to identify products and services provided and measure progress in providing same.
OUR FINANCIAL FUTURE
2018-19 saw a continued emphasis on laying the foundations for a strong long term financial future, with the achievement of a genuine operating surplus, positive financial sustainability ratios for the current year and next 10 years, and a significant reduction in overall debt. Council continued its focus on efficiently managing assets with the emphasis on renewing existing assets rather than building new. As an example of the focus on asset renewals, Council resealed 26kms of bitumen roads and refurbished over 18.4kms of gravel roads during the year.
I thank the Mayor, Tanya Milligan, and Councillors for the leadership and vision that you provided during 2018-19 to the Lockyer Valley Regional Council. With your support we moved further towards developing an organisation focused on providing outstanding service to our community. I also thank the committed
staff of Council who dedicated themselves to improving the liveability of this region for our residents, both present and future.
Ian Church Chief Executive Officer
4Annual Report 2018–2019

LOCKYER VALLEY REGIONAL COUNCIL HIGHLIGHTS 2018-19
77LOTS WERE PLAN SEALED IN 2018-19
14,500PLANTS AND TREES HAVE BEEN PLANTED AS PART OF THE RIPARIAN REVEGETATION PROJECTS.
12,105ATTENDEES OF 811 EVENTS HOSTED/HELD AT LOCKYER VALLEY LIBRARIES DURING 2018-19
LVRC RECEIVED
283 PLANNING APPLICATIONS IN 2018-19 AND
262 APPLICATIONS WERE DECIDED IN 2018-19
148,256ITEMS WERE LOANED FROM LOCKYER VALLEY LIBRARIES DURING 2018-19 OF WHICH 18,669 WERE BORROWED DIGITALLY
8,048DOGS WERE REGISTERED IN THE REGION IN 2018-19
ESTIMATED CONSTRUCTION COSTS OF BUILDINGS CONSTRUCTED WITHIN THE REGION FOR THE 2018-19 FINANCIAL YEAR
$71.8m DOMESTIC
$11.6mCOMMERCIAL
326LOTS APPROVED FOR SUBDIVISION IN 2018-19 IN THE REGION
43kmOF CREEK TREATED FOR WEEDS AS PART OF THE DROUGHT COMMUNITIES PROGRAM
IS THE NUMBER OF HECTARES OF THE LOCKYER VALLEY WITHIN THE LAND FOR WILDLIFE PROGRAM
17,162ha
OPERATING SURPLUS ACHIEVED, AND THIRD OPERATING SURPLUS IN SUCCESSION FOR COUNCIL
$2.90m
141,270PEOPLE VISITED THE LOCKYER VALLEY LIBRARIES DURING 2018-19
5 Lockyer Valley Regional Council
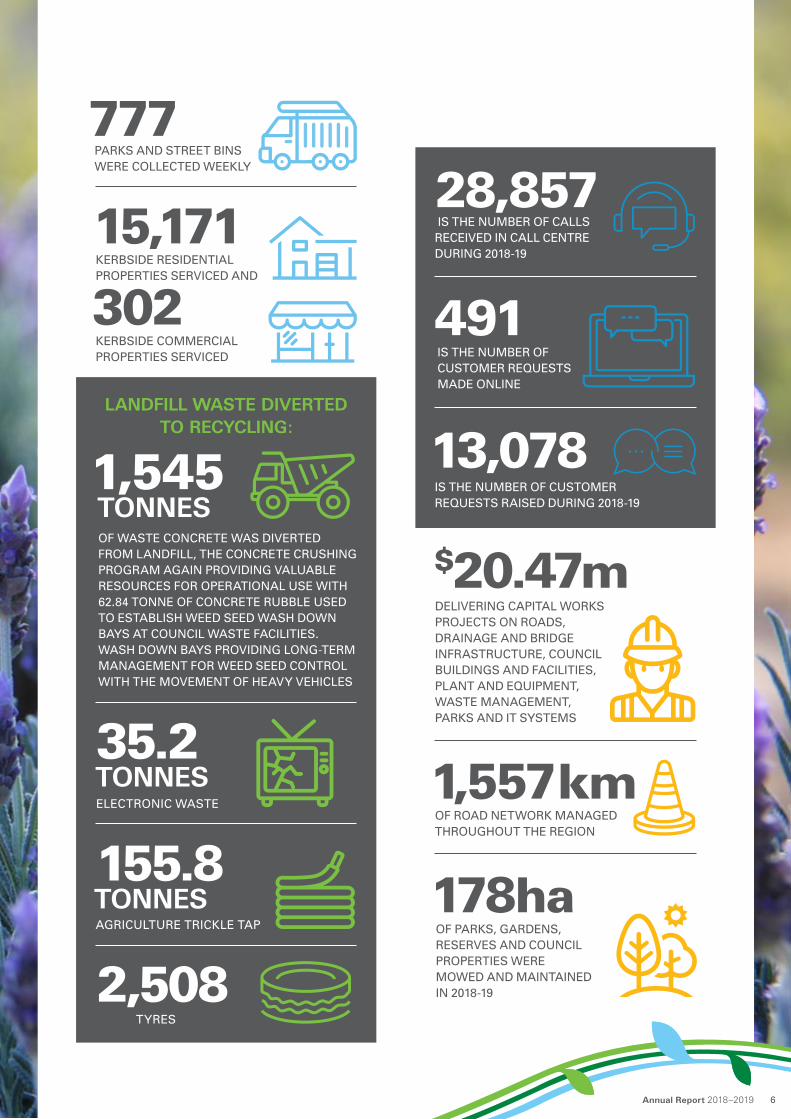
OF WASTE CONCRETE WAS DIVERTED FROM LANDFILL, THE CONCRETE CRUSHING PROGRAM AGAIN PROVIDING VALUABLE RESOURCES FOR OPERATIONAL USE WITH 62.84 TONNE OF CONCRETE RUBBLE USED TO ESTABLISH WEED SEED WASH DOWN BAYS AT COUNCIL WASTE FACILITIES. WASH DOWN BAYS PROVIDING LONG-TERM MANAGEMENT FOR WEED SEED CONTROL WITH THE MOVEMENT OF HEAVY VEHICLES
1,545 TONNES
ELECTRONIC WASTE
35.2 TONNES
2,508TYRES
LANDFILL WASTE DIVERTED TO RECYCLING:
AGRICULTURE TRICKLE TAP
155.8 TONNES
28,857 IS THE NUMBER OF CALLS RECEIVED IN CALL CENTRE DURING 2018-19
491IS THE NUMBER OF CUSTOMER REQUESTS MADE ONLINE
IS THE NUMBER OF CUSTOMER REQUESTS RAISED DURING 2018-19
13,078
OF ROAD NETWORK MANAGED THROUGHOUT THE REGION
1,557km
DELIVERING CAPITAL WORKS PROJECTS ON ROADS, DRAINAGE AND BRIDGE INFRASTRUCTURE, COUNCIL BUILDINGS AND FACILITIES, PLANT AND EQUIPMENT, WASTE MANAGEMENT, PARKS AND IT SYSTEMS
$20.47m
OF PARKS, GARDENS, RESERVES AND COUNCIL PROPERTIES WERE MOWED AND MAINTAINED IN 2018-19
178ha
PARKS AND STREET BINS WERE COLLECTED WEEKLY
777
15,171
302KERBSIDE RESIDENTIAL PROPERTIES SERVICED AND
KERBSIDE COMMERCIAL PROPERTIES SERVICED
6Annual Report 2018–2019
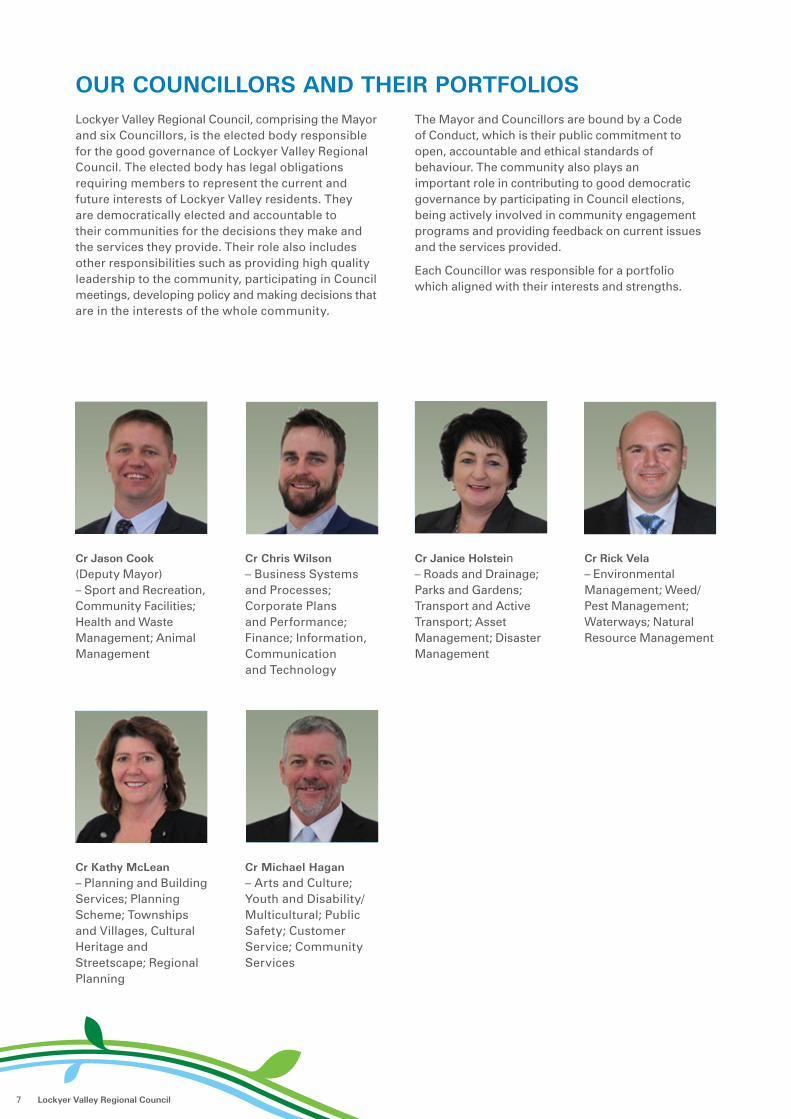
OUR COUNCILLORS AND THEIR PORTFOLIOSLockyer Valley Regional Council, comprising the Mayor and six Councillors, is the elected body responsible for the good governance of Lockyer Valley Regional Council. The elected body has legal obligations requiring members to represent the current and future interests of Lockyer Valley residents. They are democratically elected and accountable to their communities for the decisions they make and the services they provide. Their role also includes other responsibilities such as providing high quality leadership to the community, participating in Council meetings, developing policy and making decisions that are in the interests of the whole community.
The Mayor and Councillors are bound by a Code of Conduct, which is their public commitment to open, accountable and ethical standards of behaviour. The community also plays an important role in contributing to good democratic governance by participating in Council elections, being actively involved in community engagement programs and providing feedback on current issues and the services provided.
Each Councillor was responsible for a portfolio which aligned with their interests and strengths.
Cr Jason Cook (Deputy Mayor) – Sport and Recreation, Community Facilities; Health and Waste Management; Animal Management
Cr Chris Wilson – Business Systems and Processes; Corporate Plans and Performance; Finance; Information, Communication and Technology
Cr Janice Holstein – Roads and Drainage; Parks and Gardens; Transport and Active Transport; Asset Management; Disaster Management
Cr Rick Vela – Environmental Management; Weed/Pest Management; Waterways; Natural Resource Management
Cr Kathy McLean – Planning and Building Services; Planning Scheme; Townships and Villages, Cultural Heritage and Streetscape; Regional Planning
Cr Michael Hagan – Arts and Culture; Youth and Disability/Multicultural; Public Safety; Customer Service; Community Services
7 Lockyer Valley Regional Council

MAYOR EXECUTIVE SUPPORT COUNCIL SUPPORT
INFRASTRUCTURE WORKS & SERVICES
Responsible Officer: Mr Angelo Casagrande
Acting Responsible Officer: Ms Seren McKenzie
• Asset Management• Roads & Drainage• Parks & Open Spaces• Capital Works• Technical Design & Survey• Fleet, Plant & Depots• Works Planning &
Programming
• Inter Government Relations• Corporate Governance &
Planning• Corporate Communications• Events Coordination• Major Projects• Regional Collaboration• Legal Services• Council Meetings Support• Elected Members Support• Visitor Information Centre
& Queensland Transport Museum
• Tourism & Marketing• Community Engagement
& Development• Youth & Multicultural• Sport & Recreation• Regional Development• Staging Post & Functions• Corporate Policy
Development• Internal Audit• Risk Management
• Information Technology• Information Management• GIS• Finance, Rates & Payroll• Procurement & Stores• Customer Service and
QGAP• Childcare• Environmental Health• Local Laws & Animal
Control• Libraries, Arts and Cultural
Services• Waste Management• Corporate Software• Facilities Management
& Maintenance• Disaster Management
• Land Use Compliance• Building & Plumbing• Development Engineering
& Assessment• Strategic Land Use Planning• Environment• Pest Management• Human Resource Services• Work Health & Safety /
Rehabilitation• Learning & Development• Workforce Planning• Organisational
Development• Employee Relations
EXECUTIVE OFFICE / CEO
Responsible Officer: Mr Ian Church
CORPORATE & COMMUNITY
SERVICES Responsible Officer:
Mr David Lewis
ORGANISATIONAL DEVELOPMENT &
PLANNING SERVICES Responsible Officer: Mr Dan McPherson
CHIEF EXECUTIVE OFFICER
Mr Ian Church
Dan McPherson Executive Manager Organisational Development and Planning Services
David Lewis Executive Manager Corporate and Community Services
Angelo Casagrande Executive Manager Infrastructure Works and Services
Seren McKenzie Acting Executive Manager Infrastructure Works and Services
ORGANISATIONAL STRUCTURE
EXECUTIVE LEADERSHIP TEAM
8Annual Report 2018–2019

OUR EMPLOYEESORGANISATIONAL EFFECTIVENESS REVIEW
An internal project team was formed to undertake an Organisational Effectiveness Review across Council to understand how Council’s services, functions and business units fit together; and to identify suggestions for improving the way that Council does business. This review is about being proactive and getting ahead of the challenges faced by a modern local government, such as financial downturns, changes to legislation, cost shifting from other levels of government, fraud and corruption risks and extreme weather events; whilst capitalising on upcoming opportunities. These opportunities can arise from those wishing to develop sustainably in our region, competitive grant funding schemes and new and innovative ways of doing our jobs.
VALUES-BASED BEHAVIOURS
To take Council’s values to the next level and gain a shared understanding of what our values look like in action, a list of value-based behaviours were initially developed by the Connected Council Progress Group. Employees were then provided with an opportunity to participate in this project by nominating their top five behaviours under each value, with the top collective values-based behaviours to be launched across Council. The purpose of this project is to develop some common language around the behaviours that we want to see in one another, which is a foundation of the culture we are creating at Council.
CONNECTED COUNCIL PROGRESS GROUP
The Connected Council Progress Group has continued to work collaboratively across Council to share information; actively listen to employees; and feed their views back to the Progress Group. The Progress Group has actioned several initiatives to build trust, improve communication and put our vision, mission and values into action.
LEADERSHIP DEVELOPMENT PROGRAM
The Leadership Development Program has continued to improve leadership practices to all levels of leaders across Council. The purpose of this program is to boost leadership capability, enhance employee engagement and provide support to leaders and teams to better deliver positive outcomes and services to our community.
SAFETY AND WELLBEING
Council’s Safety Management Plan drives the future direction of Work Health and Safety within Council providing fundamental actions to keep up to date with legislative change and preparedness to achieve injury free workplace in an environment with an increased focus on hard compliance. An essential element of Council’s safety management system is the consultative structure through which we strive to embed health and safety as a priority throughout the workforce with the adoption, communication and promotion of Council’s safety logo “Our Goal Zero Harm”.
Council continues to maintain the recognition of responsibility for the contractors engaged by Council. As Council engages contractors from a wide range of industries, contractor safety management is key to ensuring high safety standards and expectations are being achieved.
Senior Council staff continue to demonstrate safety leadership through the completion of Monthly Action Plans. Management take time to systematically conduct regular safety inspections, identify potential hazards and propose corrective actions to ensure the safety of workers, volunteers, and visitors to Council facilities and worksites.
Much of Council’s operational work involves work on roads. The Safety Team have partnered with the relevant business units to prepare for the rapidly changing requirements for workers conducting traffic control and working on or adjacent to roads. This preparedness ensures Council workers and contractors can conduct what is regarded as a particularly hazardous activity safely and in accordance with Councils safe systems of work.
Council’s Wellbeing Committee plays a valuable role in the promotion of a healthy workplace for Council staff, promoting and coordinating various initiatives such as Lapping Round the Lake, fun runs such as the “Mother’s Day Classic”, the “Laidley Spring Festival Colour Run”, flu vaccination programs and the continuing awareness of the importance of maintaining sound mental health and general wellbeing.
9 Lockyer Valley Regional Council

EMPLOYEES AT A GLANCE AS AT 30 JUNE 2019As at 30 June 2019, Council employed a total of 351 staff. The following table identifies the breakdown of full time equivalent (FTE) positions by employment type as at 30 June 2019, excluding vacant positions:
EMPLOYMENT TYPE HEADCOUNTFTE NUMBER
AT 30 JUNE
Permanent full-time 225 225.0000
Permanent part-time 31 21.0229
Temporary contract of service full-time 32 32.0000
Temporary contract of service part-time 3 1.5659
Contract of service (executive) 24 24.0000
Casual (based on hours worked) 36 12.5918
TOTAL 351 316.1806
EXECUTIVE LEADERSHIP TEAMThe total remuneration packages for senior executives including base salary, vehicle allowance and superannuation for 2018-19 was $1,011,478.16.
REMUNERATION RANGE NUMBER OF EXECUTIVE LEADERSHIP TEAM PAID
$200,000 - $300,000 3
$300,000 - $400,000 1
10Annual Report 2018–2019

COMMUNITY FINANCIAL REPORT
WHAT IS A COMMUNITY FINANCIAL REPORT?The Community Financial Report is a simplified version of Council’s official Financial Statements (pg 42).
As Financial Statements are often difficult for people other than accountants to understand, the Community Financial report simplifies the Statements so that everyone can get a better understanding of Council’s financial position.
Each report in Council’s Financial Statements provides information on a specific aspect of our performance and collectively provides a detailed profile on the financial performance and health of Council.
Council’s Financial Statements consists of the following five key elements:
The Statement of Comprehensive Income measures how Council performed in relation to income and expenses during the financial year. This statement illustrates how money received from Council operations is spent.
The Statement of Financial Position measures what we own (our assets), what we owe (our liabilities) and our net worth (equity) at the end of the financial year.
The Statement of Changes in Equity measures the changes in our net wealth and shows the movements in our retained earnings, reserves and asset revaluation surplus.
The Statement of Cash Flows outlines how much cash was received and spent throughout the year and whether or not Council is spending more than it is receiving. The closing balance reflects how much cash Council had at year end.
The Notes to the Financial Statements provide a more detailed breakdown of the information contained in the individual statements.
11 Lockyer Valley Regional Council

SUMMARY OF KEY RESULTS During the 2018-19 financial year, Lockyer Valley Regional Council continued to deliver its program of services to the community while consolidating its base for improved financial sustainability. Continuing the success of previous financial years, the results for the current year once again include the achievement of an operating surplus, completion of a significant capital works program, and an additional repayment on Council’s debt.
These results can be highlighted through the following:
• Achievement of an operating surplus for the third consecutive year.
• Significant operational expenditures:
– $21.31 million on roads, drains, bridges, and associated transport infrastructure.
– $8.05 million on community facilities, libraries and parks.
– $7.02 million on health, waste and regulatory services.
• Completion of $19.29 million in capital works including $10.01 million on roads, drains and bridge infrastructure, $3.31 million on plant and other equipment, $4.68 million on parks and other facilities, with the remainder spent on disaster management, planning and flood studies, and information technology systems.
• An additional loan repayment of $0.50 million to reduce Council’s debt levels and save on long term interest costs.
• Maintenance of adequate cash balances to provide flexibility in the future.
CASH FLOWS 2019 FINANCIAL SUSTAINABILITY RATIOS
2019 OPERATING RESULT
2019 FINANCIAL POSITION
Operating Surplus
Financial Liabilities
Asset Sustainability
4.74% 58.95% 113.67%
Target 0 - 10% Target < 60% Target > 90%
OPERATING REVENUE $61.26M
OPERATING EXPENSES $58.36M
OPERATING SURPLUS $2.90M=
=
–
–
Net Cash Inflow from Operations
Net Cash Outflow for Capital
Net Cash Outflow for Debt payments
Cash at end of Year
$14.52M
($9.44M)
($1.82M)
$23.10M
ASSETS $654.84M
LIABILITIES$68.13M
EQUITY $586.71M
12Annual Report 2018–2019

STATEMENT OF COMPREHENSIVE INCOME The Statement of Comprehensive Income measures how Council performed in relation to income and expenses during the financial year. This statement illustrates how money received from Council operations is spent.
COMPARATIVE TREND ANALYSIS
$140M
$120M
$100M
$80M
$60M
$40M
$20M
–
($20m)
($40M)2011/12 2012/13 2013/14 2014/15 2015/16 2016/17 2017/18 2018/19
($16.89M) ($7.55M) ($9.75M) ($9.32M) ($2.74M) $5.30M $3.18M $2.91M
$98.41M $97.04M $83.41M $62.21M $55.12M $60.26M $61.21M $61.26M
$115.29M $104.59M $93.16M $71.53M $57.87M $54.97M $58.03M $58.36M
EMPLOYEE COSTS$24.28M
MATERIALS & SERVICES$18.24M
DEPRECIATION$12.61M
FINANCE COSTS$2.63M
RATES$39.75M
GRANTS$6.75M
FEES & CHARGES$5.41M
OTHERREVENUE$5.13M
INTEREST & INVESTMENT REVENUE$4.22M
2019 OPERATING REVENUE 2019 OPERATING EXPENSES
TOTAL $61.26M
TOTAL $57.76M
For the 2018-19 financial year, Council had budgeted for an operating surplus of $2.24 million, and additional planning and development fees, grant revenues, and recoverable works has delivered a higher than expected surplus of $2.90 million.
The achievement of the third operating surplus in a row indicates that the long-term sustainability of the organisation is on track to achieve Council’s long term financial goals. It shows that the commitment made by Council to operate within its means, is being followed through, providing flexibility for its future operations and an improved ability to withstand unexpected financial shocks.
Operating Surplus/Deficit
Operating Revenue
Operating Expenditure
13 Lockyer Valley Regional Council

REVENUE SOURCES – WHERE DOES THE MONEY COME FROM?
REVENUE
For the 2018-19 financial year, Council received $61.21 million in operating revenue and $4.92 million in capital revenue.
While revenue from rates and charges is the main source of income, fees and charges revenues exceed budgeted expectations with some large payments received towards the end of the financial year for development applications. Increased operating grants also contributed to the increase in revenue while the investment in Queensland Urban Utilities continues to provide strong returns with Council’s share of profit
supplemented by interest on the shareholder loan and payments for income tax equivalents required under National Competition Policy.
Capital revenues include grants and subsidies from the State and Federal Governments for the construction of assets as well as the value of assets contributed to Council from developers in the form of road works, stormwater drainage, and park equipment. For 2018-19, the contributed assets totalled $1.76 million.
0
$5M
$10M
$15M
$20M
$25M
$30M
$35M
$40M
RATES, LEVIES & CHARGES
$39.75M2019 ACTUAL
FEES & CHARGES
$5.41M
INTEREST & INVESTMENT
REVENUE
$4.22M
OTHER INCOME
$5.13M
GRANTS & CONTRIBUTIONS
- OPERATING
$6.75M
GRANTS & CONTRIBUTIONS
- CAPITAL
$4.92M
14Annual Report 2018–2019

EXPENDITURE – WHERE DOES THE MONEY GO?Council incurs both operating and capital expenditure in the provision of services to our local community.
During the 2018-19 financial year, total operational expenditure increased by $0.33 million or 0.57 per cent on the prior year. Employee costs increased because of adjustments to the mix of operating and capital works, as well as the annual enterprise bargaining increase. Materials and services increased due to the use of expert consultants in relation to the Toowoomba Second Range Crossing, waste planning, and flood mitigation studies, and increased maintenance on roads
and facilities. These increases were offset by a reduction in finance costs through the early repayment of loans and lower adjustments to the restoration provisions.
Depreciation continues to be a significant cost and is constantly under review through the asset revaluation process.
The largest category of Council’s operational expenditure is on roads, drains, and bridges which accounts for 34 per cent of the total expenditure. A further 13 per cent is spent on maintaining community facilities, buildings, parks and libraries.
REGIONALADMIN
$15.16M2019 ACTUAL
HEALTH, WASTE &
REGULATORY
$7.02M
COMMUNITY & REGIONAL
DEVELOPMENT
$5.78M
PLANNING & ENVIRONMENT
$3.53M
BUILDING &PLUMBING
REGULATION
$1.05M
COMMUNITYFACILITIES,LIBRARIES,
PARKS
$8.05M
ROADSDRAINS & BRIDGES
$21.31M
DISASTERMANAGEMENT
$0.78M
0
5
10
15
20
25
EXPENSES BY SERVICE
15 Lockyer Valley Regional Council

STATEMENT OF FINANCIAL POSITION The Statement of Financial Position measures what we own (our assets), what we owe (our debts) and our net worth at the end of the Financial Year.
ASSETS – WHAT WE OWN
Council’s total cash and investments decreased by $2.84 million with reduced operating and capital cash outflows offsetting the additional loan repayment made in June 2019. Council’s cash balance at the end of 2019 was $23.10 million (in 2018 the figure was $25.94 million). Other current assets have increased through a higher level of rates debtors due to transfers of charges against the land and the timing of the contract recoverable works.
Non-current assets have decreased from 2018 as a result of the revaluation of Council’s infrastructure assets which decreased in line with their condition assessments and normal wear and tear.
For the 2018-19 financial year, Council completed $19.29 million in capital works with a further $1.76 million in developer contributed assets. Works in progress at year end, totalled $6.09 million. The level of completed works was around 86 per cent of the budgeted amount and was mostly renewal works in accordance with Council’s Service Management Plans.
CASH & EQUIVALENTS$23.10M
PROPERTY, PLANT & EQUIPMENT$569.25M
INVESTMENT IN QUU$31.34M
LOAN TO QUU$14.73M
INTANGIBLE ASSETS$5.49M
INVESTMENT PROPERTY$2.01M
TRADE & OTHER RECEIVABLES$6.45M
HELD FOR SALE ASSETS$2.09M
INVENTORY$0.37M
CURRENT ASSETS
NON-CURRENT ASSETS
TOTAL $32.01M
TOTAL $622.82M
16Annual Report 2018–2019

LIABILITIES – WHAT WE OWEDuring the 2018-19 financial year, our liabilities increased by a net amount of $1.18 million or 1.76 per cent mainly due to the adjustments to Council’s provisions and the recognition of an additional payable for funds received in advance to offset the effects of the waste levy.
Council’s largest liability continues to be the provisions for the rehabilitation of land fill and quarry sites across the region in accordance with environmental requirements. These provisions are generated to recognise the estimated future costs of restoring and maintaining Council’s quarries and landfills throughout the region and are reviewed and adjusted annually.
BORROWINGS$1.43M
TRADE & OTHER PAYABLES$8.23M
PROVISIONS$5.74M
PROVISIONS$23.08M
BORROWINGS$29.65M
CURRENT LIABILITIES
NON-CURRENT LIABILITIES
TOTAL $52.73M
TOTAL $15.40M
17 Lockyer Valley Regional Council

OUR DEBT Like most other local governments throughout Australia, Lockyer Valley Regional Council utilises loan borrowing to fund the construction of new infrastructure to service the needs of our growing community.
Council’s Debt Policy is based on sound financial management practices with borrowings restricted as follows:
• Council will not utilise loan funds to finance operational activities
• Council will endeavour to fund all capital renewal works from operating cash flows and borrow only for new or upgrade projects.
During 2018-19, Council did not borrow any new funds, and made repayments of $1.82 million which included a one-off additional payment of $0.50 million.
At 30 June 2019 the amount of debt was 4.40 per cent of Council’s total assets.
STATEMENT OF CHANGES IN EQUITY The Statement of Changes in Equity measures the changes in our net wealth and shows the movements in our retained earnings, reserves and asset revaluation surplus.
In the 2018-19 financial year, our net worth decreased by $9.69 million or 1.62 per cent mostly due to decreases of $13.12 million in our asset revaluation surplus, offset by the net result for the year of $3.43 million. The decrease in the asset revaluation surplus is due to the revaluation of infrastructure assets identified in the above section on assets.
At the end of the year Council’s equity balance is $586.71 million.
0
$5
$10
$15
$20
$25
$30m
$35m
$40m
2011 2012 2013 2014 2015 2016 2017 2018 2019
0
$100m
$200m
$300m
$400m
$500m
$600m
2011 2012 2013 2014 2015 2016 2017 2018 2019
ASSET REVALUATION SURPLUS
RESERVES
RETAINED SURPLUS
COMPARATIVE DEBT LEVELS
COMPARATIVE EQUITY BALANCES
18Annual Report 2018–2019
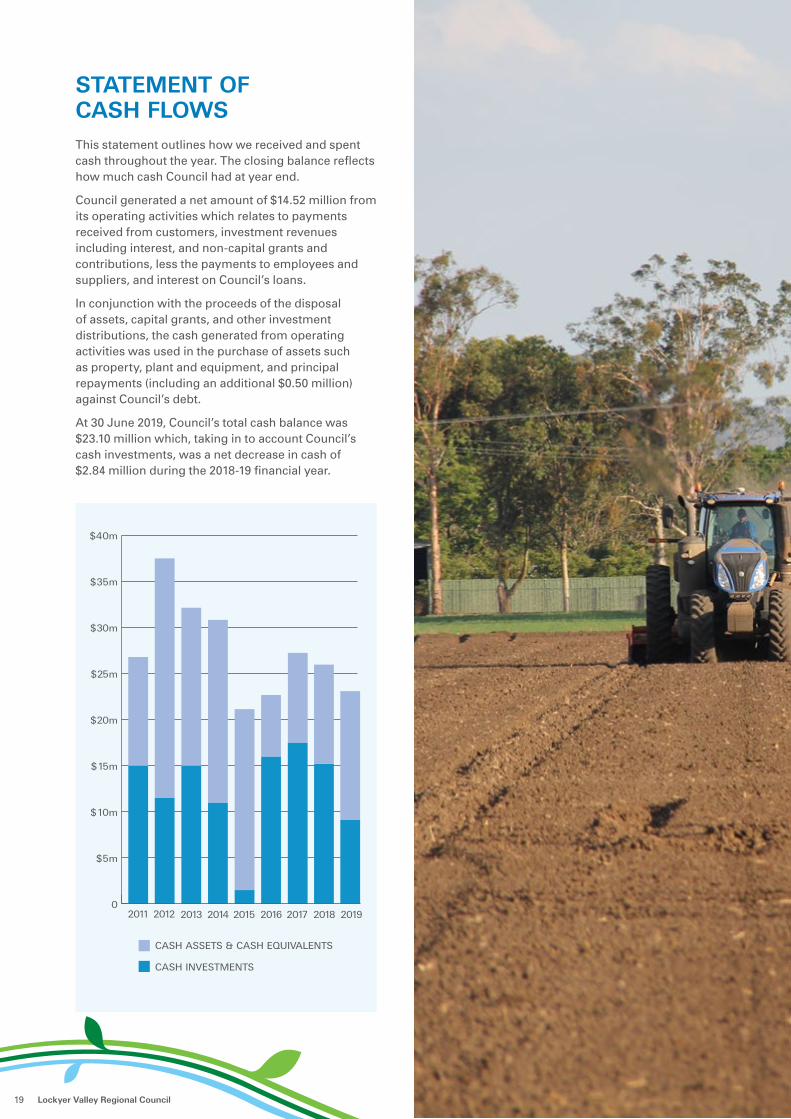
CASH INVESTMENTS
CASH ASSETS & CASH EQUIVALENTS
0
$5m
$10m
$15m
$20m
$25m
$30m
$35m
$40m
2011 2012 2013 2014 2015 2016 2017 2018 2019
STATEMENT OF CASH FLOWS This statement outlines how we received and spent cash throughout the year. The closing balance reflects how much cash Council had at year end.
Council generated a net amount of $14.52 million from its operating activities which relates to payments received from customers, investment revenues including interest, and non-capital grants and contributions, less the payments to employees and suppliers, and interest on Council’s loans.
In conjunction with the proceeds of the disposal of assets, capital grants, and other investment distributions, the cash generated from operating activities was used in the purchase of assets such as property, plant and equipment, and principal repayments (including an additional $0.50 million) against Council’s debt.
At 30 June 2019, Council’s total cash balance was $23.10 million which, taking in to account Council’s cash investments, was a net decrease in cash of $2.84 million during the 2018-19 financial year.
19 Lockyer Valley Regional Council

FINANCIAL SUSTAINABILITY RATIOSSection 178 (1) of the Local Government Regulation 2012, requires Council to calculate and disclose financial sustainability indicators. The ratios and targets are sourced from the Financial Management (Sustainability) Guideline issued by the Department of Local Government, Racing and Multicultural Affairs.
Council’s performance as at 30 June 2019 against these measures is shown in the following table.
RATIO EXPLANATION CALCULATION TARGET 2019TARGET
METCOMMENT
Operating surplus ratio
Measures the extent to which revenues raised cover operational expenses only or are available for capital funding purposes or other purposes.
Operating Surplus (Net result excluding all capital items) divided by total operating revenue (excluding capital items).
Between 0% and
10%
4.74% ✓ This ratio is within the target range as operating revenues have exceeded operating expenditures.
Higher than expected planning and development fees, and government grants have contributed to the result.
Asset sustainability ratio
This ratio reflects the extent to which infrastructure assets managed by Council are being replaced as they reach the end of their useful lives.
Capital expenditure on the replacement of assets (renewals) divided by depreciation expense.
>90% 113.67% ✓ This ratio is over the target amount due to a focus on renewal capital works and Council’s commitment to the Asset Service Management Plans.
Net financial liabilities ratio
Measures the extent to which net financial liabilities of Council can be repaid from operating revenue.
Total liabilities less current assets divided by total operating revenue.
< 60% 58.95% ✓ This ratio has remained within the target range due to an increase in revenues from planning and development fees, and other income sources offsetting the change in relativities between current assets and total liabilities.
The long term financial forecast shows surpluses for the upcoming ten years as well as significant improvements in the net financial liabilities ratio. The forecast for the Asset Sustainability Ratio is derived from the adopted Service Management Plans for each asset class. While the forecast shows that there will be years when the ratio is lower than the target level, the average ratio over the life of the forecast meets the threshold set by the Department.
CONCLUSIONThe results for the 2018-19 financial year show that Council has continued to deliver on its promise to achieve operating surpluses and further improve its financial position. The high level of completed capital works and a clear focus on renewing existing assets is further evidence of Council’s determination to achieve a financially sustainable future.
20Annual Report 2018–2019

DELIVERING THE OPERATIONAL PLAN 2018-19
LOCKYER COMMUNITY
Our healthy community welcomes the spirited diversity found within our region. Times of hardship highlight our resilience. Our high standards support our quality of life and vibrancy while providing a dynamic and safe place full of opportunity. We strive to build on who we are and all that our region has to offer by connecting business, the community and government.
CORPORATE PLAN 2017-2022 OUTCOMES 2018-19 PERFORMANCE
1.1 A Community with fair and reasonable access to services. • Provided child care facilities in the region.
• Regularly distributed the Community Connect newsletter to inform the community on the variety human and social services available throughout the region.
• Conducted a number capacity building workshops such as assistance in grant writing workshops.
1.2 Council optimises the use of its open spaces and facilities by improving access to and the quality of the facilities for individuals and groups for cultural, recreational and community activities.
• Reviewed and adopted the Lockyer Valley Public Parks Strategy 2019 that will inform the future investment plan for the region’s parks.
• Enabled the library user’s ability to utilise the self-service options available at the region’s Libraries.
• Conducted several events and activities for all ages at the region’s Libraries.
• Establishment of off-leash dog parks in Gatton and Laidley.
1.3 Enhanced wellbeing and safety of the community. • Completed the annual food establishment licencing and inspection program.
• Adopted an amendment to sub-ordinate animal management local law to enable the establishment of dog off-leash parks in the region.
• Selective inspection program undertaken to identify unregistered dogs within the region.
• Commenced flood modelling work on various catchments in the region.
• Councils flood warning systems tested, and any anomalies rectified to ensure reliability of system.
• 353 plumbing applications and 191 building applications were completed during the year.
1.4 Council seek to understand community needs, resulting in partnerships that realise long-term benefits for the community in a timely manner.
• Assistance provided to community and sporting groups in the region to secure federal and state government grants.
• Two rounds of funding provided $81,998.32 in grants for community groups. A record number of applications were received.
• Introduced a school leadership program in partnership with Somerset Regional Council that enables the region’s youth to discuss relevant issues.
21 Lockyer Valley Regional Council

CORPORATE PLAN 2017-2022 OUTCOMES 2018-19 PERFORMANCE
1.5 Events and activities that bring together and support greater connectivity in the community.
• Successful delivery of the Multicultural Festival and NAIDOC week activities.
• Council adopted an event strategy that will inform future development and promotion events coordinated by Council for the community.
• Council conducted and assisted with 66 events in the Region including the Laidley Spring Festival, Lights on the Hill Convoy, Australia Day Festivities, Senior’s Week Festivities and the Gatton Christmas Carnival.
1.6 The community’s preparedness for disasters is improved through community education, training and strong partnerships between Council and other agencies.
• Participated in the annual assessment of the District Disaster Plan.
• Hosted disaster management business forum in Laidley and a school education session in the Lockyer Disaster Coordination Centre.
• Conducted flood scenario Exercise “ONNA” with the Coordination Centre Staff and the Local Disaster Management Group.
• Commenced the development of an annual disaster exercise plan that will identify disaster exercises that will be conducted with Council Staff, State Emergency Services and the community.
22Annual Report 2018–2019

LOCKYER BUSINESS FARMING AND LIVELIHOOD
Lockyer Business: Our business community is a thriving and inclusive network where it is easy to do business. We create opportunities and encourage innovation that inspires business confidence and collaborative partnerships.
Lockyer Farming: As custodians we manage our water and land assets to ensure our farming future. We pride ourselves on our innovation and clean, green reputation. We work together to support our farmers of current and future generations.
Lockyer Livelihood: We are a community where lifelong learning opportunities exist. Our quality education facilities are highly regarded and provide diverse career pathways. We look to develop skills and generate job opportunities for all.
CORPORATE PLAN 2017-2022 OUTCOMES 2018-19 PERFORMANCE
2.1 Encourage opportunities for the Lockyer Valley to drive economic and community outcomes.
• $1.4 million in funding received for the preparation of a strategic business case to secure water supply to the region.
• The Lockyer and Somerset Water Collaborative conducted monthly meetings to collaboratively advocate for water security for the Lockyer and Somerset Regions.
• Information and guidance provided on economic development in the region was provided to individuals, businesses and developers.
2.2 Maximise opportunities through engagement and partnership with stakeholders to achieve a strong resilient economy.
• Council developed a position paper to articulate Council’s and the Community concerns in relation to impacts that may occur as a result of the Inland Rail Project and submitted it to Australian Rail Track Corporation, Federal Member for Wright and the State Member for Lockyer.
• Participated in monthly meetings of the Lockyer Valley Regions Technical Working Group with the Australian Rail Track Corporation to provide input into the Inland Rail Project.
• Matters of strategic significance to Council and the community were advocated for through submission of motions to the Australian Local Government Association, Local Government Association of Queensland and through other key advocacy channels including the Council of Mayors (South East Queensland).
• Council hosted and participated in forums, meetings and networking opportunities with the region’s business and industry groups including Lockyer Growers Group, Lockyer Chamber of Industry and Commerce and Lockyer Valley Tourism.
23 Lockyer Valley Regional Council

CORPORATE PLAN 2017-2022 OUTCOMES 2018-19 PERFORMANCE
2.3 Promote and market the Lockyer Valley as a destination for commerce, tourism and lifestyle.
• The region was marketed through active displays at the Brisbane Exhibition and Regional Flavours events and through the SEQ Food Trails marketing channels.
• Conducted a series of cooking master classes in collaboration with Faith Lutheran College using regional produce.
• Engaged the services of Alistair McLeod as a food ambassador for the region in a series of events using regional produce, including an Evening Under the Stars and at the Brisbane Good Food and Wine Festival.
2.4 Attract and Support Education and Employment Opportunities for the Community.
• Regional Skills Investment Strategy was launched to improve training, education and employment opportunities throughout the region.
• Council co-facilitated nine Bringing Employers Students Together (BEST) meetings.
• Opportunities were provided for students to undertake work experience with Council through the GenR8 Program.
2.5 Foster a flexible, supportive and inclusive business environment.
• Provided information and advice to 91 business proponents throughout the financial year.
• Completed a review on the use and requirements of the Business Incubator and formed a sub-group to assist in improving the occupancy and use of the Business Incubator.
• Provided support for local businesses in the Town Proud Shop Local campaign and shop local Queensland Week promotion.
24Annual Report 2018–2019
LOCKYER NATURE
Our natural assets are valued and protected to sustain our unique rural lifestyle.
CORPORATE PLAN 2017-2022 OUTCOMES 2018-19 PERFORMANCE
3.1 Lockyer Valley’s natural assets are managed, maintained and protected.
• Council continued implementation of the Lockyer Creek Sediment Stabilisation and Tenthill Catchment Community Resilience initiatives of the Lockyer Catchment Action Plan including conducting a tree planting day on the Lockyer Creek with 400 trees planted and establishing a taskforce for future resilience planning in the Tenthill Catchment.
• Council significantly progressed in the development of the Natural Resource Management Plan including the preparation of a project plan, engagement strategy and the establishment of a Plan working group with an initial workshop held on the Plan.
3.2 Council’s policies and plans support environmentally sustainable development.
• Continued development of the Lockyer Valley Planning Scheme that includes a range of provisions which seek to achieve environmentally sustainable development outcomes was submitted for a State Interest Review.
3.3 Community and private landholders’ stewardship of natural assets increases.
• 5.07% increase in identified habitat land has been included in the Land for Wildlife program.
• Workshops, education program and information sessions conducted with land for wildlife landholders.
• Provision of free native plants to the community.
• Delivered the Community Environment Grants program.
• Council successfully delivered the environment and pest programs throughout the region.
3.4 Locals and visitors experience our natural assets. • Committed to a joint initiative with Toowoomba Regional Council to develop a masterplan that identifies regional linkage trails for recreational purposes on the escarpment.
3.5 Council and the community actively reduce waste, recycle and reuse more.
• Waste and recycling services were delivered throughout the region.
• Waste education programs delivered.
• Waste Reduction and Recycling Plan re-developed and adopted by Council.
• 96% of the waste management capital works program was completed.
3.6 Council and the community actively reduce consumption of non-renewable resources.
• Delivered phase 2 of Council’s solar initiative program.
25 Lockyer Valley Regional Council

LOCKYER PLANNED
We have unique, well connected communities. We have places and spaces that bring together people. Local services match the needs of the community. Our built infrastructure is designed and constructed to enable access for all.
CORPORATE PLAN 2017-2022 OUTCOMES 2018-19 PERFORMANCE
4.1 Growth and development in the region is sustainably managed through the adoption and implementation of the Lockyer Valley Planning Scheme.
• The Lockyer Valley Region Planning Scheme was submitted to the Minister for State Development, Manufacturing, Infrastructure and Planning for State Interest Review.
4.2 Provision of fit-for-purpose infrastructure which meets the current and future needs of the region.
• A management plan for the region’s cemeteries was adopted by Council.
• Commenced the strategic planning of the Plainland transport network.
• 100% of the roads maintenance program and 94% roads capital works program were delivered within 10% of budget.
• 100% of Council’s external funded roads projects were delivered.
• A forward capital works program has been developed for the region which includes consideration of projects in the Gatton North and Laidley areas.
• A road signage replacement program developed, and priority signs replaced.
4.3 A development assessment process that delivers quality development that is consistent with legislation, best practice and community expectations.
• All development applications received were assessed within statutory timeframes with an average of 17 days to complete the decision phase of the process.
4.4 Regional collaboration and targeted advocacy that drives external funding, for timely delivery of key infrastructure and enhanced community outcomes.
• Collaboration with key stakeholders of the Toowoomba Second Range crossing project to ensure quality associated local infrastructure outcomes were achieved.
4.5 An integrated approach to the planning of all communities that strengthens local identity and lifestyle.
• The Lockyer Valley Planning Scheme, including provision of locally specific policy content to address the identity of the Lockyer Valley’s diverse communities and lifestyle aspirations was submitted for State Interest Review.
26Annual Report 2018–2019

LOCKYER LEADERSHIP AND COUNCIL
Lockyer Leadership: Our leaders are visionary and seek coordinated outcomes for the benefit of the whole community.
Lockyer Council: A well-managed, transparent and accountable organisation that gives the community confidence, demonstrates financial sustainability, where customers are satisfied with our services and our employees are proud to work.
CORPORATE PLAN 2017-2022 OUTCOMES 2018-19 PERFORMANCE
5.1 Undertake robust and accountable financial, resource and infrastructure planning and management to ensure affordable and sustainable outcomes for our community.
• Monthly reporting was provided to Council on its financial position.
• An additional repayment of $500,000 was made on Council’s debt.
• The annual financial statements and external audit were completed in required timeframes and no significant deficiencies reported.
• Utilisation review of Council’s heavy plant and fleet was conducted identifying items of plant no longer optimally utilised and suitable for disposal.
• Business review of operations at the Staging Post Café and Function Centre was conducted achieving a 11.8% increase in revenue and 7.2% reduction in expenses.
5.2 Excellence in customer service to our community. • 83.96% of calls were answered within 25 seconds.
• 80.02% of enquires were answered at first point of contact (phone and face to face).
• Abandoned calls were 2.45% (target was <15%).
5.3 Actively engage with the community to inform council decision making processes.
• A variety of engagement activities were undertaken in the community by Council in relation to key Council projects such as the Hatton Vale Park: the Waste Reduction and Recycling Plan; Regional Parks Strategy and the Gatton Showground Masterplan.
5.4 Commit to open and accountable governance to ensure community confidence and trust in council and our democratic values.
• Council identified its key corporate risks and adopted a key corporate risk register, risk management framework and policy.
• Each Business Unit within Council developed a business unit plan to assist in identifying the products and services it provides.
• Annual program of meetings including all council meetings, workshops and tours conducted.
• A review to rationalise the reporting to Council commenced with identified improvements implemented.
• Report writing training provided to report authors.
5.5 Promote a values-based culture that appreciates and empowers its workforce.
• Council’s Connected Council working group developed and implemented actions to improve the organisation’s culture including identifying behaviour statements that underpin the organisational values.
• Enterprise Bargaining Agreements were made with both office and field based staff.
• Appointment of a Joint Consultative Committee.
• Legislative training requirements completed.
27 Lockyer Valley Regional Council

CORPORATE PLAN 2017-2022 OUTCOMES 2018-19 PERFORMANCE
5.6 Provide leadership and contemporary management systems that drive a coordinated and connected organisation.
• A training needs analysis of members of the management team was conducted.
5.7 Compliant with relevant legislation. • The annual review of the Local Disaster Management Plan was conducted.
• Commenced reviewing Council’s priority Local Laws and the repealing of current Local Laws that are no longer required.
• Compliance reporting completed on Work Health and Safety monthly action plans and conducted required hazard inspections.
• Development of an accurate reporting method for Work Health and Safety rectification action plans completed.
5.8 Deliver reliable internal support services. • Council’s internal and external communication requirements were delivered including media releases, Valley Voice updates, advertising, website updates and staff newsletters.
• Council’s legal and property services were delivered.
28Annual Report 2018–2019

29 Lockyer Valley Regional Council
STATUTORY INFORMATION
BENEFICIAL ENTERPRISES Council did not have any partnership arrangements, or conduct any business with beneficial enterprises under section 41 of the Local Government Act 2009 during the reporting period.
CONDUCT OF BUSINESS ACTIVITIES Council did not conduct any business activities under section 43 of the Local Government Act 2009 during the 2018-19 financial year.
COMPETITIVE NEUTRALITY COMPLAINTSCouncil did not receive any competitive neutrality complaints during the 2018-19 financial year.
PARTICULAR RESOLUTIONS
RESOLUTIONS MADE DURING THE FINANCIAL YEAR UNDER SECTION 206(2):
In accordance with section 185 (b) of the Local Government Regulation 2012, there were no resolutions made by Council during the 2018-19 year under section 206(2) setting the amount for each different type of non-current physical asset below which the value of an asset of the same type must be treated as an expense.
RESOLUTIONS MADE DURING THE FINANCIAL YEAR UNDER SECTION 250(1):
In accordance with section 185 (b) of the Local Government Regulation 2012 there were no resolutions made by Council during the 2018-19 under section 250.
30Annual Report 2018–2019

COUNCILLORSATTENDANCE AT COUNCIL MEETINGS
As required under section 186(d) of the Local Government Regulation 2012, the table below details the number of local government meetings each Councillor attended during the financial year ending 30 June 2019.
NAMEORDINARY MEETINGS
(21 HELD)SPECIAL MEETINGS
(2 HELD)TOTAL
Cr Tanya Milligan (Mayor) 19 2 21
Cr Jason Cook (Deputy Mayor) 21 2 23
Cr Chris Wilson 21 2 23
Cr Janice Holstein 20 2 22
Cr Kathy McLean 19 2 21
Cr Michael Hagan 21 2 23
Cr Rick Vela 21 2 23
COUNCILLOR REMUNERATION
Increases in remuneration for Councillors are automatically linked to respective increases to the remuneration levels of Queensland Members of the Legislative Assembly.
Mayor: $127,843.79 Deputy Mayor: $79,902.13 Councillor: $67,916.26
NAME REMUNERATION ALLOWANCES SUPERANNUATION TOTAL
Cr Tanya Milligan (Mayor) $127,843.79 $4,000.09 $15,341.31 $147,185.19
Cr Jason Cook (Deputy Mayor) $79,902.13 $12,500.03 $9,588.13 $101,990.29
Cr Chris Wilson $67,916.26 $12,500.03 $8,149.89 $88,566.18
Cr Janice Holstein $67,916.26 $12,500.03 $8,149.89 $88,566.18
Cr Kathy McLean $67,916.26 $12,500.03 $8,149.89 $88,566.18
Cr Michael Hagan $67,916.26 $12,500.03 $8,149.89 $88,566.18
Cr Rick Vela $67,916.26 $12,500.03 $8,149.89 $88,566.18
31 Lockyer Valley Regional Council

COUNCILLOR EXPENSES
NAMEPHONE & ICT
COSTSMOTOR
VEHICLES
TRAINING, CONFERENCES &
FUNCTIONS TOTAL
Cr Tanya Milligan (Mayor) $1,695.61 $9,504.02 $12,109.98 $23,309.61
Cr Jason Cook (Deputy Mayor) $878.05 - $1,229.55 $2,107.60
Cr Chris Wilson $878.07 - $2554.07 $3,432.14
Cr Janice Holstein $920.15 - $293.80 $1,213.95
Cr Kathy McLean $878.89 - $1,096.70 $1,975.59
Cr Michael Hagan $918.56 - $824.18 $1,742.74
Cr Rick Vela $719.12 - $597.24 $1,316.36
EXPENSES REIMBURSEMENT AND PROVISION OF FACILITIES FOR COUNCILLORS
In accordance with section 250 of the Local Government Regulation 2012, Council must have an Expenses Reimbursement Policy for Councillors. The objective of the Policy is to ensure the payment of legitimate and reasonable expenses incurred by Councillors for discharging their duties and responsibilities as Councillors; and to provide facilities to Councillors for those purposes. This is to ensure that Councillors are not financially disadvantaged because of carrying out their official duties.
The Policy is also aimed at reflecting the community’s expectations about the extent of a Councillor’s duties and responsibilities and its expectations about the resources and reimbursement provided to Councillors from public funds. This Policy does not deal with the provision of remuneration, nor does it cover non-business-related expenses or facilities incurred by other people, including a Councillor’s partner. Council’s Expenses Reimbursement & Provision of Facilities for Councillors Policy is available on Council’s website and is supported by the Expenses Reimbursement and Provision of Facilities for Councillors Guideline.
32Annual Report 2018–2019

ADMINISTRATIVE ACTION COMPLAINTSCouncil is committed to dealing fairly with administrative action complaints by receiving, enabling, responding and reviewing customer complaints in a professional and cost-effective manner. By reviewing, reflecting and learning from the complaints, Council is able to improve services to the community.
The administrative action complaints that were received by Council in 2018-19 were either of a minor or negligible nature. Investigations were conducted, with a majority of the responses were provided within the identified timeframe.
One of the common causes for complaints submitted included a lack of awareness by the customer, of all in the information in relation to their matter. As a result, further advice was provided as part of the outcome into the investigation of their complaint to assist with providing a better understanding of Council’s processes and practices, this also identified process and system improvements for the organisation.
ADMINISTRATIVE ACTION COMPLAINTS 2018-19 REPORTABLE ITEMS UNDER SECTION 187 OF THE LOCAL GOVERNMENT REGULATION 2012
REPORTABLE ITEM NUMBER
Number of administrative action complaints received 13
Number of administrative action complaints upheld 0
Number of administrative action complaints partially resolved 2
Number of administrative action complaints not upheld 8
Number of complaints still in progress/unresolved 3
Number of administrative action complaints that were made in the previous financial year (2017-18)
13
33 Lockyer Valley Regional Council

RIGHT TO INFORMATION AND INFORMATION PRIVACYThe Right to Information Act 2009 and the Information Privacy Act 2009 provide the community with access to information balanced by appropriate protection for individuals’ privacy. The public can apply for access to documents held by a council, subject to statutory exemptions, unless it is contrary to the public interest to provide that information. The legislation also allows individuals to apply for amendments to be made to documents concerning their personal affairs, where it is believed the information is incomplete, out of date, inaccurate or misleading.
Applications received under the Right to Information Act 2009 (RTI) 3
Applications received under the Information Privacy Act 2009 (IP) 0
Total applications received 3
No applications were withdrawn, and four decisions were issued to applicants, all within legislative timeframes. No application/s remained on hand as at 30 June 2019.
No applications were subject to an external review by Office of Information Commissioner.
RECORD OF COUNCILLOR CONDUCT AND PERFORMANCE COMPLAINTS There were no reportable items applicable to the following sections of the Local Government Act 2009 or associated Regulations, dealing with complaints made concerning the misconduct of a Councillor.
OVERSEAS TRAVEL Section 188 of the Local Government Regulation 2012 requires the disclosure of information relating to the overseas travel of both elected members and Council officers. The following table provides details on all overseas travel during the 2018-19 financial year:
ATTENDEE DESTINATION PURPOSE COST
Councillor Tanya Milligan Japan Sister City delegation $1,882.42
Ian Church, Chief Executive Officer
Japan Sister City delegation $1,771.51
34Annual Report 2018–2019

GRANTS TO COMMUNITY ORGANISATIONS
The following grants were made to community organisations under Council’s Community Grants and Assistance Policy and Procedure.
ORGANISATION NAME PURPOSE AMOUNT
Gatton Camp Draft Association Equipment for camp draft operations $2,000.00
Gatton Scout Group Upgrade fire safety within building $1,000.00
Gatton Soccer Club Aluminium seating $2,000.00
Ingoldsby Recreation Club Install stainless steel kitchen $2,000.00
Laidley Kindergarten Association Shade sail for playground $2,000.00
Lions Club of Withcott -Helidon Internal fit out of community shed $1,000.00
Lockyer Information & Neighbourhood Centre Community Sensory Garden $3,000.00
Lockyer Valley Cheerleader Association Training equipment $2,500.00
Lockyer Valley Something to Sign About Choir Equipment for performances $1,970.00
Lockyer Waters Halls Committee Lockable storage $4,000.00
Our Lady of the Valley Catholic Parish Gatton Laidley
Centenary Garden design and seating $1,000.00
Returned & Services League of Australia (Queensland Branch) Laidley Sub-Branch Inc
Installation of utilities $3,000.00
Ropehill Community Sports Centre Incorporated Information signage/directory $3,560.00
Southern Lockyer Junior Cricket Club Equipment $3,923.00
St Mary’s Playgroup, cl- Playgroup Queensland Limited
Playgroup improvement $3,454.55
Withcott Pony Club INC. Safety upgrades $3,036.55
Withcott Primary P&C Association Cycle safety for withcott students $555.27
Forest Hill Cricket Club Synthetic wicket replacement $2,000.00
Gatton Jubilee Golf Club Water connect to maintenance shed $2,000.00
Gatton Kindergarten Association Upgrade tables and chairs $2,500.00
Gatton State School P&C STEM makerspace equipment $2,300.00
Gatton Table Tennis Association Notice board $2,500.00
35 Lockyer Valley Regional Council

ORGANISATION NAME PURPOSE AMOUNT
Gatton Tennis Association Repairs to tennis courts $2,500.00
Helidon Cricket Association Canteen upgrade $2,500.00
Laidley Bowls Club First aid equipment $2,200.00
Laidley State High School P & C Undercover lunch area $2,500.00
Lockyer Equestrian Group Dressage championships promotion $1,650.00
Lockyer Race Club Portable shade structures $2,000.00
Lockyer Valley Camera Club Photography exhibition $2,300.00
Lockyer Veteran Cricket Association Construction of boundary fence $2,500.00
Papua New Guinea Lockyer Valley Community Office equipment $1,548.95
Peace Lutheran Church Gatton Refurbishment of church hall $2,500.00
Peace Lutheran Outside School Hour Care Sun safety $2,500.00
Stockyard Creek Community Hall Play area and floor coverings $3,000.00
The Scout Association of Australia QLD Branch Inc - Glenore Grove
Upgrade equipment $3,000.00
TOTAL $81,998.32
Assistance was also provided for:
• Regional Ambassador Support and School Dux Bursary Program - $9,100.00
• School Chaplaincy Program - $10,000.00
• Public Halls Assistance Program - $22,100.00
• ANZAC Day Remembrance Program - $6,600.00
• Sporting Grounds Assistance Program - $152,006.00
• 93 fee waivers for the use of Council’s facilities were granted at a total cost of $195,873.60
36Annual Report 2018–2019

COUNCILLOR DISCRETIONARY FUNDS
The following donations were made from the Mayoral Donation Program.
ORGANISATION NAME PURPOSE AMOUNT
Ma Ma Creek Exhibition 2018 Kids rides 500.00
Faith Lutheran College Year 5 science challenge 250.00
Community Reflection & Thanksgiving Service Media costs for event (including social media) 282.19
Lockyer Valley Breast Cancer Support Group Relay for Life afternoon tea 200.00
Watoto Children’s Choir Community Event Hire fees for Gatton Shire Hall 410.00
Carinity Baptist Community Services Karinya Place - nursing homes donations 250.00
Tabeel Lutheran Home Nursing homes donations 250.00
Gatton Kindergarten Association Advertising for the 2018 Bike-a-thon 181.82
Laidley Lions Junior Rugby League Sports clinic 500.00
Laidley and District State School Term 2 Legends Medallions 177.73
Laidley and District State School Term 4 Legends Medallions 177.70
Amaroo Aged Care Gatton Nursing homes donations 250.00
Regis Aged Care Nursing homes donations 250.00
Lockyer Antique Motor Association 2018 Tractor Trek 200.00
Lockyer Chamber of Commerce Laidley Christmas Carnival banner 500.00
Mayoral Chaplaincy Dinner Venue hire and chaplaincy gift 680.41
Anuha and EndeavourCatering for morning tea for Disability Action Week
147.32
University of Queensland Gatton Campus Products for the UQ Gatton back to college raffle 84.95
Forest Hill Festival Association Face painting Forest Hill Christmas Festivities 200.00
Lockyer Valley Growers GroupVenue hire costs for the water meeting – landowners and irrigators
454.55
Gatton Swimming ClubSponsorship of Gatton Swimming Club – Australia Day 800 Classic 2019
500.00
International Women’s Day Breakfast Venue hire and gift pack for guest speaker 659.95
Ropeley State School ANZAC Day wreath 150.00
Peace Lutheran School P & F AssociationContribution to Christmas in the Country art & craft show
227.27
37 Lockyer Valley Regional Council

ORGANISATION NAME PURPOSE AMOUNT
Laidley Bowls Club Men’s Prestige Fours Bowls Carnival 250.00
Laidley and District State School Term 1 Legends Medallions 200.90
Lockyer UplandsLockyer in the Wild Photography Comp – return of unused donation
-93.66
Laidley Bowls Club Mayoral Donation for Ladies Carnival 250.00
Ma Ma Creek Exhibition 2019 Kids rides 500.00
Lockyer Valley Growers IncMayoral Donation to support Horticultural Community BBQ’s
909.09
Lions Club of LaidleyPurchase of Outdoor Furniture at the Lions Club of Laidley Shed in Lions Park Laidley
909.09
Emu Gully Adventure Education Mateship fund 1,000.00
Lockyer Chamber of Commerce Business Recognition Dinner 2019 1,000.00
Mt Sylvia State School P&C 2019 Up the Creek Festival 500.00
Gatton Quarter Horse & Performance Assoc. State show 200.00
Lockyer Veteran’s Cricket United Kingdom match against QVC Country XI 1,000.00
Lockyer Uplands Lockyer in the Wild Photography Comp 2019 300.00
SE QLD Special Children’s Christmas Party Advertising 272.73
Gatton Kindergarten Association 2019 Bike-a-thon 200.00
TOTAL $14,009.31
38Annual Report 2018–2019

COMMERCIAL BUSINESS UNITS Council did not maintain any Commercial Business Units during the 2018-19 financial year.
ACTION TAKEN INVOLVING SPECIAL ARRANGEMENTSCouncil was not supplied with any services, facilities or activities by another local government under any agreements or joint activities and for which any special rates or charges were levied, during the financial year.
CHANGES TO TENDERS Council did not issue invitations to change any tenders under section 228(7) of the Local Government Regulation 2012 during 2018-19.
CONCESSIONS FOR RATES AND CHARGES GRANTEDPart 10 of the Local Government Regulation 2012 provides Council with the ability to grant concessions to property owners in certain circumstances.
For the 2018-19 financial year the following concessions were granted:
• PID 253510 & 159170 – concession granted due to financial hardship to allow an extended time for payment including an interest free period of six months.
• Faith Lutheran College – rebate of general rates of $4,796.44 under Council’s Community Grant Policy for Not-For-Profit Organisations.
• Toowoomba Motorcycle Club - rebate of general rates of $6,145.80 under Council’s Community Grant Policy for Not-For-Profit Organisations.
• Council Pension Subsidy – rebate of up to $60 for eligible pensioners totalling $172,435.50 for 3,149 properties.
39 Lockyer Valley Regional Council

REGISTERS MAINTAINEDRegisters maintained by Council:
• Register of Councillor Interests
• Register of Related Parties
• Register of Delegations Council to Chief Executive Officer
• Register of Delegations Chief Executive Officer to Officer
• Register of Roads
• Register of General Charges and Regulatory Fees
• Register of Local Laws and Subordinate Local Laws
• Asset Register
• Fraud and Corruption Allegation Register
• Gift Register
• Loss Register
• Land Record
• Lobbyist Register
• Key Corporate Risk Register
• Policy Register
• Register of Infrastructure Charges.
INTERNAL AUDIT Internal Audit activities for Council are performed by a qualified internal audit consultant on a wholly outsourced basis. For the 2018-19 financial year, BDO Pty Ltd provided this service for Council.
The Audit and Risk Management Committee endorsed the 2018-19 Internal Audit Plan at the 22 March 2018 meeting and Internal Audit Progress Reports were presented to the Audit and Risk Management Committee meetings in August 2018, December 2018, March 2019 and May 2019.
Internal audit projects for the financial year included:
• Infrastructure Charges Process Review.
• Tendered Contracts Review.
• Business unit key risk focus sessions were conducted for Waste Management, Plumbing and Building Services, Organisational Development, Financial Services and Work Health and Safety to identify what Council’s key corporate risks were in these areas.
The Internal Audit Progress Report provided to the Audit and Risk Management Committee in May 2019 presented an overview of the work performed by the Internal Auditor from July 2018 - June 2019 in accordance with s.207(3), Local Government Regulation 2012.
40Annual Report 2018–2019

Financial Statements 2019
Lockyer Valley Regional Council GENERAL PURPOSE FINANCIAL STATEMENTS for the year ended 30 June 2019
Our Mission:Lead, engage, empower.
2 FINANCIAL STATEMENTS
Lockyer Valley Regional Council41

Financial Statements 2019
Lockyer Valley Regional Council
General Purpose Financial Statements for the year ended 30 June 2019
Table of Contents
1. Primary Financial Statements:Statement of Comprehensive IncomeStatement of Financial PositionStatement of Changes in EquityStatement of Cash Flows
2. Notes to the Financial StatementsSummary of Significant Accounting PoliciesCouncil Functions - Component DescriptionsCouncil Functions - Analysis of Results by FunctionRevenue AnalysisGrants, Subsidies, Contributions and DonationsEmployee BenefitsMaterials and ServicesFinance CostsCapital ExpensesCash, Cash Equivalents and InvestmentsTrade and Other ReceivablesNon-Current Assets Classified as "Held for Sale"Investment PropertyProperty, Plant and EquipmentFair Value MeasurementsIntangible AssetsTrade and Other PayablesBorrowingsProvisionsAsset Revaluation SurplusRetained SurplusReservesCommitments for ExpenditureContingent LiabilitiesSuperannuationAssociated EntitiesTrust Funds
Reconciliation of Liabilities arising from Finance ActivitiesEvents Occurring After Balance Sheet DateFinancial InstrumentsTransactions with Related Parties
Additional DisclosuresCouncil Information and Contact Details
3. Management Certificate
4. Independent Auditor's Report
5. Current Year Financial Sustainability StatementCertificate of Accuracy - Current Year Financial Sustainability StatementIndependent Auditor's Report - Current Year Financial Sustainability Statement
6. Long Term Financial Sustainability StatementCertificate of Accuracy - Long Term Financial Sustainability Statement
48
Reconciliation of Net Result for the year to NetCash from Operating Activities
32
3031
28 43
2627
29
181920
12(a)2(b)
34567
30
35
89101112
39
43
42
1314151617
3736
2122232425
33
32
Page
34
2
5
51
12
10
13
11
9
33
13
6
14
16
1415
17
56
61
54
57
59
52
29
1918
28
2328
50
42
43
page 1
Financial Statements 2018–2019

Financial Statements 2019
Lockyer Valley Regional Council
Statement of Comprehensive Income for the year ended 30 June 2019
IncomeRevenueRecurrent RevenueRates, Levies and ChargesFees and ChargesRental IncomeInterest and Investment RevenueSales Revenue
Other IncomeGrants, Subsidies, Contributions and DonationsTotal Recurrent Revenue
Capital RevenueGrants, Subsidies, Contributions and Donations
Total Revenue
Capital Income
Total Income
ExpensesRecurrent ExpensesEmployee BenefitsMaterials and ServicesFinance CostsDepreciation and AmortisationTotal Recurrent Expenses
Capital Expenses
Total Expenses
Net Recurrent Result
Net Result
Other Comprehensive IncomeAmounts which will not be reclassified subsequently to the Net Result(Loss)/Gain on Revaluation of Property, Plant and Equipment
Total Other Comprehensive Income
Total Comprehensive Income
2019 2018
4,389
12,172
66,183
19,1181,718
190
25,349
3,437
8
19
58,357
62,746
Net Share of Interests in Associated Entities
5
(13,127)
2,905
2,331
71,586
2,752
10,377
24,276
5,223
61,209
1,349
3,0677,3566,748
72,935
61,262
1,684
4,731
65,993
6,436
2,539
2,625
58,026
3,897
61,923
3,183
(5,789)
18,242
11,012
12,883
(9,690)
5
4b
79
6
1,9341,7491,776
39,7485,410
317 324
38,300
$'000$'000Notes
3b3c3d
25
3a
3e
3c4a
(5,789)(13,127)
X2A0T
page 2
43 Lockyer Valley Regional Council

Financial Statements 2019
Lockyer Valley Regional Council
Statement of Financial Position as at 30 June 2019
ASSETSCurrent AssetsCash and Cash EquivalentsInvestmentsTrade and Other ReceivablesInventoriesNon-Current Assets classified as "Held for Sale"Total Current Assets
Non-Current AssetsTrade and Other ReceivablesAssociated EntitiesInvestment PropertyProperty, Plant and EquipmentIntangible AssetsTotal Non-Current AssetsTOTAL ASSETS
LIABILITIESCurrent LiabilitiesTrade and Other PayablesBorrowingsProvisionsTotal Current Liabilities
Non-Current LiabilitiesBorrowingsProvisionsTotal Non-Current LiabilitiesTOTAL LIABILITIESNet Community Assets
COMMUNITY EQUITYAsset Revaluation SurplusRetained SurplusReservesTotal Community Equity
2019 2018
9910
Notes
15,200
30,27314,735
1,850
3722,091
32,018
6,4479,100
596,397
53,91166,954
3,243380,111213,043
596,397
5,212576,734
4,9371,390
13,043
24,94028,971
6,716
628,804
586,707
68,13552,734
3,200383,591
586,707
199,916
17
12
10
2,01025
21
1817
1315
20
18
16
19
132,48511
34,547
31,34014,735
377
569,246
15,401
23,079
5,493
1,4355,739
10,743
5,747
$'000 $'000
14,003
654,842 663,351
29,655
8,227
622,824
X2A1T
page 3
44Financial Statements 2018–2019

Financial Statements 2019
Lockyer Valley Regional Council
Statement of Changes in Equity for the year ended 30 June 2019
Opening Balance (as per Last Year's Audited Accounts)
a. Net Operating Result for the Year
b. Other Comprehensive Income- Revaluations : Asset Revaluation Surplus
Other Comprehensive Income
Total Comprehensive Income
c. Transfers to Reserves
d. Transfers from Reserves
Equity Balance as at 30 June 2019
Opening Balance (as per Last Year's Audited Accounts)
a. Net Operating Result for the Year
b. Other Comprehensive Income- Revaluations : Asset Revaluation Surplus
Other Comprehensive Income
Total Comprehensive Income
c. Transfers to Reserves
d. Transfers from Reserves
Equity Balance as at 30 June 2018
2121
Surplus Surplus Reserves Equity
213,043
$'000
--
3,884 (3,884)
199,916 383,591
3,841
3,200
3,243213,043
5,223
380,111
-- 2,146
-
(508) 508(2,146) -
-
596,397
(5,789) 11,012
- (5,789)(5,789) -
- 11,012
19 (5,789)--(5,789)
- 11,012
2018218,832 367,461
(13,127)
(13,127) -
3,437
19 -
3,437
Notes $'000
(13,127)
-
AssetRevaluation Retained
596,397
$'000$'000
Other
(13,127)
(9,690)
3,243380,111
3,437
(13,127)
-
-
-
-
4,881 591,174
586,707
--
(3,841)
Total
2019
X3A0T
page 4
45 Lockyer Valley Regional Council

Financial Statements 2019
Lockyer Valley Regional Council
Statement of Cash Flows for the year ended 30 June 2019
Cash Flows from Operating Activities
Receipts from CustomersPayments to Suppliers and Employees
Receipts:Investment and Interest Revenue ReceivedRental IncomeNon Capital Grants and ContributionsOtherPayments:Borrowing Costs
Net Cash - Operating Activities
Cash Flows from Investing ActivitiesReceipts:Sale of Investment SecuritiesProceeds on Disposal of Land Held for ResaleProceeds on Disposal of Property, Plant and EquipmentDistributions Received from Joint Ventures and AssociatesGrants, Subsidies, Contributions and DonationsPayments:Purchase of Property, Plant and EquipmentPayments for Intangible Assets
Net Cash - Investing Activities
Cash Flows from Financing ActivitiesPayments:Repayment of Borrowings and Advances
Net Cash - Financing Activities
Net Increase/(Decrease) for the year
plus: Cash and Cash Equivalents - beginning
Cash and Cash Equivalents - closing
Additional Information:
plus: Investments on hand - end of year
Total Cash, Cash Equivalents and Investments
356317
2018$'000 $'000
6,055
1,835
7,008
(2,093)
7,742
1,697
789
2019
46,972(43,584)(46,243)
47,032
3,388
Notes
2,300
15,493
6,100
14,521
(1,483)
4,403
27
9
9
1,7001,1661,000
2,966 4,1551,472
25,943
15,200
(6,120)
9,741
10,743
(6,120)
(1,333)
1,002
(8,371)
(17,359)
23,103
10,743
14,003
3,260
(1,816)
9,100
(9,445)
(1,816)
(1,204)
420
(19,784)
585
X4A0T
page 5
46Financial Statements 2018–2019

Financial Statements 2019
Lockyer Valley Regional Council Notes to the Financial Statements for the year ended 30 June 2019 Note 1. Summary of Significant Accounting Policies
page 6
(1.a) Basis of preparation These general purpose financial statements are for the period 1 July 2018 to 30 June 2019 and have been prepared in compliance with the requirements of the Local Government Act 2009 and the Local Government Regulation 2012. These general purpose financial statements comply with all accounting standards and interpretations issued by the Australian Accounting Standards Board (AASB) that are relevant to Council's operations and effective for the current reporting period. Because the Council is a not-for-profit entity and the Australian Accounting Standards include requirements for not-for-profit entities which are inconsistent with International Financial Reporting Standards (IFRS), to the extent these inconsistencies are applied, these financial statements do not comply with IFRS. The main impacts are the offsetting of revaluation and impairment gains and losses within a class of assets, and the timing of the recognition of non-reciprocal grant revenue. These financial statements have been prepared under the historical cost convention except for the revaluation of certain non-current assets. (1.b) Date of Authorisation The financial statements were authorised for issue on the date they were submitted to the Auditor-General for final signature. This is the date the management certificate is signed. (1.c) Critical accounting judgements and key sources of estimation uncertainty In the application of Council's accounting policies, management is required to make judgements, estimates and assumptions about carrying values of assets and liabilities that are not readily apparent from other sources. The estimates and associated assumptions are based on historical experience and other factors that are considered to be relevant. Actual results may differ from these estimates. The estimates and ongoing assumptions are reviewed on an ongoing basis. Revisions to accounting estimates are recognised in the period in which the estimate is revised and in future periods as relevant.
Judgements, estimates and assumptions that have a potential significant effect are outlined in the following financial statement notes:
Non-Current Assets Classified as “Held for Sale” – Note 11
Investment Property - Note 12 and Note 14 Valuation and depreciation of Property, Plant
& Equipment - Note 13 and Note 14 Provisions - Note 18 Contingent Liabilities - Note 23 Financial instruments - Note 30.
(1.d) Rounding and Comparatives Amounts included in the financial statements have been rounded to the nearest $1,000 unless otherwise indicated. Comparative information has been restated where necessary to be consistent with disclosures in the current reporting period. (1.e) Taxation Income of local authorities and public authorities is exempt from Commonwealth taxation except for Fringe Benefits Tax and Goods and Services Tax (‘GST’). The net amount of GST recoverable from the ATO or payable to the ATO is shown as an asset or liability respectively. The associated entity of the Council pays an income tax equivalent to the Council in accordance with the requirements of the Local Government Act 2009. The Council does not pay payroll tax to the Queensland Government as its activities are below the threshold. (1.f) Adoption of New and Revised Accounting Standards
In the current year, Council adopted all of the new and revised Standards and Interpretations issued by the Australian Accounting Standards Board (AASB) that are relevant to its operations and effective for the current reporting period. The adoption of the new and revised Standards and Interpretations has not resulted in any material changes to Council's accounting policies.
47 Lockyer Valley Regional Council

Financial Statements 2019
Lockyer Valley Regional Council Notes to the Financial Statements for the year ended 30 June 2019 Note 1. Summary of Significant Accounting Policies (continued)
page 7
This year Council has considered the application of AASB 9 Financial Instruments. AASB 9 replaces AASB 139 and relates to the recognition, classification and measurement of financial assets and financial liabilities. Council has reviewed the standard and based on the assets and liabilities it holds the only impact is in respect of impairment of trade receivables. Council has analysed its bad debts and with consideration of materiality has not considered it necessary to create a provision using the expected credit loss method. For the past six years the average write-off for Council’s general debtors has been $3,745.28 or 0.046% of the average overall charges. Council will continue to analyse its trade receivables and provide for any doubtful debts where specific items are identified. Council will also continue to monitor bad debts and the impact of current and future economic conditions as required by the standard to monitor the adequacy of the provision for impairment of receivables. As the credit risk is assessed as immaterial, the detailed disclosures within Note 30 regarding credit risk are not required. Some Australian Accounting Standards and Interpretations have been issued but are not yet effective. Those standards have not been applied in these financial statements. Council will implement them when they are effective. The standards that are expected to have an impact upon Council's future financial statements are: Effective for annual reporting periods beginning on or after 1 July 2019 AASB 15 Revenue from Contracts with
Customers, AASB 1058 Income of Not-for-Profit Entities and AASB 2016-8 Amendments to Australian Accounting Standards - Australian Implementation Guidance for Not-for-Profit Entities. AASB 1058 clarifies and simplifies the income recognition requirements that apply to not-to-profit (NFP) entities, in conjunction with AASB 15, and AASB 2016-8. These Standards supersede the majority of income recognition
requirements relating to public sector NFP entities, previously in AASB 1004 Contributions. Identifiable impacts at the date of this report are: Some grants received by the Council will be recognised as a liability, and subsequently recognised progressively as revenue as the Council satisfies its performance obligations under the grant. At present, such grants are recognised as revenue upfront. Grants that are not enforceable and/or not sufficiently specific will not qualify for deferral and continue to be recognised as revenue as soon as they are controlled. Council receives several grants from the Federal Government and State Government for which there are no sufficiently specific performance obligations these are expected to continue being recognised as revenue upfront assuming no change to the current grant arrangements. During the 2018-19 financial year Council received $3.38 million in prepaid grants. If the standard had been applied in this reporting period, of the prepaid grants received there would have been a reduction in revenue of $0.30 million and an increase in current liabilities of $0.30 million. Depending on the respective contractual terms, the new requirements of AASB 15 may potentially result in a change to the timing of revenue from sales of the Council's goods and services such that some revenue may need to be deferred to a later reporting period to the extent that the Council has received payment but has not met its associated performance obligations (such amounts would be reported as a liability in the meantime). During the 2018-19 financial year Council received $0.05 million in prepaid leases, private works, and hire of facilities. If the standard had been applied in this reporting period there would have been a reduction in revenue of $0.05 million and an increase in current liabilities of $0.05 million. Prepaid rates will not be recognised as revenue until the relevant rating period starts. Until that time these receipts will be recognised as a liability
48Financial Statements 2018–2019

Financial Statements 2019
Lockyer Valley Regional Council Notes to the Financial Statements for the year ended 30 June 2019 Note 1. Summary of Significant Accounting Policies (continued)
page 8
(unearned revenue). There will be no impact upon the recognition of other fees and charges. During the 2018-19 financial year Council received $2.05 million in prepaid rates. If the standard had been applied in this reporting period there would have been a reduction in revenue of $2.05 million and an increase in current liabilities of $2.05 million. Based on Councils assessment, if Council had adopted the new standards in the current financial year it would have had the following impacts: - Revenue decrease of $2.40 million due to deferral of grant funding, pre-paid rates, and other sales related revenue (based on the facts available to Council at the date of assessment). - There would be a reduction of $2.40 million in the reported equity as the reduced revenue will require an increase in recognition of contract liabilities, and statutory receivables. - Net result would be lower on initial application as a result of decreased revenue. A range of new disclosures will also be required by the new standards in respect of the council's revenue. Transition method The Council intends to apply AASB 15, AASB 1058 and AASB 2016-8 initially on 1 July 2019, using the modified retrospective approach. The recognition and measurement principles of the standards will be retrospectively applied for the current year and prior year comparatives as though the standards had always applied, consistent with AASB 108 Accounting Policies, Changes in Accounting Estimates and Errors. The Council intends to apply the practical expedients available for the full retrospective method. Where revenue has been recognised in full under AASB 1004, prior to 1 July 2019, but where AASB 1058 would have required income to be recognised beyond that date, no adjustment is required. Further, Council is not required to restate income for completed contracts that start and complete within a financial year. This means where income under AASB 1004 was recognised in the comparative financial year (i.e. 2018-19), these also do not require restatement.
AASB 16 Leases
The Council has assessed the impacts of the new standard that initial application of AASB will have on its financial statements, however, the actual impacts may differ as the new accounting policies are subject to change until the Council presents its first financial statements that include the date of initial application. AASB 16 introduces a single, on-balance sheet lease accounting model for lessees. A lessee recognises a right-of-use asset representing its right to use the underlying asset and a lease liability representing its obligation to make lease payments. There are recognition exemptions for short-term leases and leases of low-value items. Lessor accounting remains similar to the current standard – i.e. lessors continue to classify leases as finance or operating leases. Leases in which the Council is a lessee The Council has elected not to recognise IT leases under the AASB 16 as they have been assessed as being low-value assets under the standard.
Peppercorn Leases Council is the leasee of a number of Deed of Grant in Trust leases, for which no or little lease payments are made. These have been identified as peppercorn leases which are currently not recognised in Council's financial statements. Council does not intend to elect to apply the fair value measurement requirements to these leases until such time as this requirement is mandated. Based on Councils assessment, it is expected that the first-time adoption of AASB 16 for the year ending 30 June 2020 will have no material impact on the financial statements. Other amended Australian Accounting Standards and Interpretations which were issued at the date of authorisation of the financial report but have future commencement dates are not likely to have a material impact on the financial statements.
49 Lockyer Valley Regional Council

Financial Statements 2019
Lockyer Valley Regional Council
Notes to the Financial Statements for the year ended 30 June 2019
Note 2(a). Council Functions - Component Descriptions
Details relating to the Council's functions / activities as reported in Note 2(b) are as follows:
General Public Services
Public Order and Safety
Economic Affairs
Environmental Protection
Housing and Community Amenities
Recreation, Culture and Religion
Social ProtectionThe objective of this function is to conduct the operation of Council's childcare centres and youth developmentprogram.
The objective of this function is to provide activities that are concerned with support to community groups,community development initiatives, the provision of community facilities such as halls and other communitybuildings. This function also covers disaster recovery programs including the rebuilding of Council's flood affectedinfrastructure as well as town planning and approvals.
The objective of this function is to provide programs that deal with the natural environment and waste management.It includes activities such as pest and weed management and other environmental programs and the collection,disposal and/or recycling of commercial and domestic waste.
The objective of this function is the provision of sporting, recreation and cultural facilities such as sports grounds,swimming pools, parks and gardens, libraries and art gallery.
The objective of this function is to provide internal governance, organisational and administrative services. Itincludes legislative and executive programs to implement policy, coordinate activities and provide support toElected Members. It also includes the administrative programs to support effective service delivery to all internaland external customers. All programs not classified elsewhere are aggregated under this function.
The objective of this function is to provide programs and services that deal with nuisance, safety and publicbehaviour. It includes programs for the control of domestic animals, administration and enforcement of locals lawsand disaster management, and support for local Rural Fire Service and State Emergency Services groups.
The objective of this function is to provide support for programs and services that generate economic activity withinthe Region. This includes support to the local economy, development and implementation of business andinvestment strategies, and local business promotion. This function also includes road transport and associatedservices to maintain and deliver infrastructure such as roads, bridges, drains and footpaths.
X6A0T
page 9
50Financial Statements 2018–2019

Fi
nanc
ial S
tate
men
ts 2
019
Lock
yer V
alle
y R
egio
nal C
ounc
il
Not
es to
the
Fina
ncia
l Sta
tem
ents
for t
he y
ear e
nded
30
June
201
9
Not
e 2(
b). A
naly
sis
of R
esul
ts b
y Fu
nctio
n
8666-
Cap
ital
Inco
me
Gro
ss P
rogr
am
Func
tions
$'00
0G
rant
sO
ther
Oth
er$'
000
Gra
nts
201
8
Rec
urrin
g
$'00
0
1,93
9(1
,887
)
$'00
0G
ener
al P
ublic
Ser
vice
s
2,30
8
3,21
5
page xx
Pub
lic O
rder
& S
afet
y35
Eco
nom
ic A
ffairs
Env
ironm
enta
l Pro
tect
ion
224
5,16
1
2,76
81,
818
35,3
34$'
000
195
3,10
9
-
(58,
026)
2,90
5
$'00
0$'
000
208,
573
Rec
urrin
gO
pera
tions
from
Net
Res
ult
Tota
l A
sset
s
24,5
03
654,
842-
3,43
7
418,
907
8,11
0
15,5
06(9
,187
)
-(8
67)
(4,3
27)
(251
)
Tota
lEx
pens
es
$'00
0
119
(3,1
84)
(1,7
54)
(7,8
36)
(23,
356)
(15,
180)
(5,9
00)
(7,6
37)
(6,7
76)
(4,4
38)
-
753
212,
319
16,9
84
Tota
l A
sset
s
$'00
0$'
000
Rec
urrin
gO
pera
tions
124
961
$'00
0
Net
Res
ult
16,6
82-
$'00
0
Expe
nses
Rec
urrin
g
from
Net
Res
ult
Gro
ss P
rogr
am
(23,
356)
Cap
ital
$'00
0
8,79
7
(5,9
00)
(7,6
37)
- -1,
573
1,87
85,
993
(4,3
89)
(7,8
36)
(10,
791)
-
(1,7
54)
-40
,340
$'00
0
Tota
lIn
com
e
-4,
453
249
6,77
0
190
4,73
1
1,14
311
1 -
$'00
0
1,97
8
-
54,5
14S
ocia
l Pro
tect
ion
Eco
nom
ic A
ffairs
2,21
0
3,55
4
Rec
reat
ion,
Cul
ture
& R
elig
ion
583
6,74
8
319
Tota
l
-
112
$'00
0
Pub
lic O
rder
& S
afet
yG
ener
al P
ublic
Ser
vice
s
2,31
744
78,
142
2085
1,80
5
190 --
Hou
sing
& C
omm
unity
Am
eniti
es
201
9
Env
ironm
enta
l Pro
tect
ion
$'00
0
Func
tions
36,4
84
Gro
ss P
rogr
am
401,
833
Oth
er$'
000
Rec
urrin
gG
rant
s
Inco
me G
rant
sO
ther
Cap
ital
Tota
lIn
com
e
(14,
307)
Tota
lEx
pens
es
(13,
774)
Net
Res
ult
Expe
nses
Gro
ss P
rogr
am Cap
ital
Rec
urrin
g
(533
)$'
000
38,8
10
-83
266
,183
--
(1,0
83)
(13,
752)
$'00
0
(1,8
87)
$'00
0
(58,
357)
(4,3
89)
(1,0
83)
-24
,775
(62,
746)
(251
)
(34)
(3,7
99)
883
(7,2
82)
(2,8
10)
(18,
828)
(9,1
28)
(21,
638)
(98)
(9,5
83)
433,
083
7,51
8-
663,
351
Hou
sing
& C
omm
unity
Am
eniti
es-
61,
154
9,33
9
168
7,84
312
,414
7,08
58,
073
(7,1
84)
(455
)
(190
)-
(1,0
82)
Financial Statements 2015
(190
)-
2,83
152
11,0
12
-
791
(12,
299)
(4,6
76)
$'00
0
14,1
77
53,8
5372
,935
Tota
l7,
356
Rec
reat
ion,
Cul
ture
& R
elig
ion
-37
41,
069
-25
Soc
ial P
rote
ctio
n57
2-
320
892
(1,0
82)
1,34
910
,377
(4,7
00)
(61,
923)
(1)
(6,1
44)
(3,8
97)
3,18
3
(6,1
43)
1,46
8
X7A0T
page
10
51 Lockyer Valley Regional Council

Financial Statements 2019
Lockyer Valley Regional Council
Notes to the Financial Statements for the year ended 30 June 2019
Note 3. Revenue Analysis
(a). Rates, Levies and Charges
General RatesSeparate RatesSpecial ChargesWaste Collection ChargesTotal rates and utility charge revenue
Less: DiscountsLess: Pensioner remissions
TOTAL RATES, LEVIES AND CHARGES
(b). Fees and Charges
Animal ControlBuilding and Development FeesRefuse Tip and RecyclingChildcareFinance and Corporate GovernanceUser Fees and Charges
TOTAL FEES AND CHARGES
(c). Other Income
Other IncomeIncome Tax Equivalent ReceivedSale of Sundry Small Value ItemsFuel and Diesel RebateRates Legal Costs RecoveredSales and Hire
TOTAL OTHER INCOME
Rates, levies, grants, rental income, interest, dividends, sales revenue and other revenue are recognised asrevenue on receipt of funds or earlier upon unconditional entitlement to the funds.
541
Notes
136206
6,436
2,7523,067
1,003
717
$'000$'000
30,87731,975
87
2019 2018
4,634 4,491
4,2534,524303 302
3,182527
757
(172)
41,436 39,923
(1,516) (1,453)
5,410
39,748
85320
763
(170)
38,300
594249
174
203211157
920
316541
4,024
891
1,061
X8A2T
X8A14T
X8A15T
X8A16T
page 11
52Financial Statements 2018–2019

Financial Statements 2019
Lockyer Valley Regional Council
Notes to the Financial Statements for the year ended 30 June 2019
Note 4. Grants, Subsidies, Contributions and Donations
(a) Recurrent
General Purpose GrantsState Government Subsidies and GrantsCommonwealth Government Subsidies and GrantsContributionsTOTAL RECURRENT GRANTS, SUBSIDIES, CONTRIBUTIONS AND DONATIONS
(b) Capital
Monetary Capital RevenueState Government Subsidies and GrantsCommonwealth Government Subsidies and GrantsContributionsNon-Monetary Capital RevenueDeveloper Assets Contributed by Developers at Fair ValueTOTAL CAPITAL GRANTS, SUBSIDIES, CONTRIBUTIONS AND DONATIONS
Physical assets contributed to Council by developers in the form of road works, stormwater and park equipment,are recognised when the development becomes "on maintenance", and there is sufficient information in the formof plans and drawings to determine the approximate specifications and fair value of such assets.
Disposal of non-current assets, discount rate adjustments to restoration provisions and revaluations of investmentproperty, and plant and equipment are recognised as either capital income or capital expenses depending onwhether they result in accounting gains or losses.
Capital Revenue includes grants and subsidies received which are tied to specific projects for the replacement or upgrade of existing non-current assets and/or investment in new assets. It also includes non-cashcontributions which are usually infrastructure assets received from developers. All other revenue has beenclassified as recurrent.
13
Notes
4,298
7,356
$'000$'000
10,377
2,103716
400
4,684
1,166
2019
1,765
4,731
555
6,748
2018
3,543
182
356
6,222
4762,610
- 136
X8A3T
X8A17T
X8A18T
page 12
53 Lockyer Valley Regional Council

Financial Statements 2019
Lockyer Valley Regional Council
Notes to the Financial Statements for the year ended 30 June 2019
Note 5. Employee Benefits
Wages and SalariesAnnual, Sick and Long Service Leave EntitlementsSuperannuationCouncillor RemunerationOther
Less: Capitalised Employee Expenses
TOTAL EMPLOYEE BENEFITS
Additional information:
Total Employees at year end:
Administration StaffDepot and Outdoors StaffTotal full time equivalent employees
Total Elected members
Note 6. Materials and Services
AdvertisingAdministration Supplies and ConsumablesAudit of Annual Financial Statements by the Auditor-General of QueenslandCommunications and ITConsultancy ServicesContractorsDonations PaidFuelInsuranceInvestment Property ExpensesPowerRepairs and MaintenanceSubscriptions and RegistrationsTravelOther
TOTAL MATERIALS AND SERVICES
92
345
27,395
7
27,874
25,349
19,118
47
2019
5,1772,706
121
2018
626
18,163
24,276
7
(2,525)
592
$'000
(3,119)
316
18,242
748
2,238
507
286
380346
1,009 928
1,475
54
6,926
786
436
1,0291,425
195
24
Notes $'000
1,646
2019
184
4,524
587
1,773
6,458
900
2018
681
329
2,872
18,541
145
1,076
90
836
2,587
857
1,202 1,151
527
X8A4T
X8A5T
X8A6T
page 13
54Financial Statements 2018–2019

Financial Statements 2019
Lockyer Valley Regional Council
Notes to the Financial Statements for the year ended 30 June 2019
Note 7. Finance Costs
Finance costs - Queensland Treasury CorporationBank ChargesImpairment of Receivables and Bad Debts Written OffQuarry RehabilitationRefuse Restoration
TOTAL FINANCE COSTS
All borrowing costs are expensed in the period in which they are incurred.No borrowing costs are capitalised on qualifying assets.
Note 8. Capital Expenses
Loss on disposal of non-current assets
Proceeds from the Disposal of Plant and Other EquipmentLess: Book Value of Plant and Other Equipment Disposed
Proceeds from Disposal of Land and BuildingsLess: Book Value of Land and Buildings Disposed
Proceeds from the Disposal of Road & Drainage NetworkLess: Book Value of Road & Drainage Network Disposed
Proceeds from the Disposal of Other AssetsLess: Book Value of Other Assets Disposed
Proceeds from Land Held for Resale Less: Book Value of Land Held for Resale Disposed
TOTAL CAPITAL EXPENSES
The book value of assets disposed is shown as the gross value less accumulated depreciation.
(641)(238)
(651)
1,718
(928)
(4,265)
(31)
-
(153)
(2,822)
-
(2,822)
2018
(56)
403
2019
(401)585 1,000
(1,006)
-
(4,265)
(39)
503
12
17
(6)
(3,897)
2,625
(928)
2
1,969
663
-
120 1223
$'0002019
184
(31)
-
(656)
11
13
13
18
13
13
18
Notes
1,331
53220
$'000
244
2018
(4,389)
X8A0T
X8A1T
X8A7T
X8A22T
page 14
55 Lockyer Valley Regional Council

Financial Statements 2019
Lockyer Valley Regional Council
Notes to the Financial Statements for the year ended 30 June 2019
Note 9. Cash, Cash Equivalents and Investments
Cash and Cash Equivalents
Cash at Bank and on HandCash Equivalent Assets1
- Deposits at CallTotal Cash and Cash Equivalents
Investments - Current
Term DepositsTotal Current Investments
TOTAL CASH ASSETS, CASH EQUIVALENTS AND INVESTMENTS
1 Those Investments where time to maturity (from date of purchase) is < 3 mths.
Restricted Cash, Cash Equivalents and Investments
Council's Cash and Cash Equivalents are subject to a number of Internal and External Restrictions that limit amounts available for discretionary or future use.These include:
Externally imposed Expenditure Restrictions at the reporting date relate to the following cash assets:
Unspent Government Grants and SubsidiesWaste Levy Refund Received in AdvanceTotal External Restrictions
Internally imposed Expenditure Restrictions at the reporting date:
Future Capital WorksFuture Recurrent ExpenditureTotal Internal Restrictions
Total Unspent Restricted Cash, Cash Equivalents and Investments
Cash and cash equivalents includes cash on hand, all cash and cheques receipted but not banked at the year end,deposits held at call with financial institutions, other short-term, highly liquid investments with original maturities ofthree months or less that are readily convertible to known amounts of cash and which are subject to an insignificantrisk of changes in value, and bank overdrafts.
Cash at bank is held with the National Australia Bank and Heritage Building Society in normal business chequeaccounts. Cash at call is held with Queensland Treasury Corporation. Interest rates are determined on a dailybasis. Short and long term deposits are held with various banking institutions with maturities ranging up to twelvemonths and interest rates from 2.20% to 2.85%.
15,200
$'000
9,100
582
2,564
4,238 3,243
1,038 -
15,200
25,943
10,743
1,184
2,18097
1,010
9,100
1,020
2,180-
9,73314,003
Notes
23,103
2019$'0002018
12,819
2,058
2,661
582
X8A8T
page 15
56Financial Statements 2018–2019

Financial Statements 2019
Lockyer Valley Regional Council
Notes to the Financial Statements for the year ended 30 June 2019
Note 10. Trade and Other Receivables
Current
Rateable Revenue and Utility ChargesOther DebtorsGST RecoverableAccrued Revenues - Interest on Investments (incl. Q.U.U.)PrepaymentsTotal
less: Provision for ImpairmentOther DebtorsTotal Provision for Impairment - Receivables
TOTAL CURRENT TRADE AND OTHER RECEIVABLES
Non-Current
Loans and Advances to AssociatesTotal
TOTAL NON-CURRENT TRADE AND OTHER RECEIVABLES
Trade and other receivables are recognised at the amounts due at the time of sale or service delivery.
Interest is charged on outstanding rates at a rate of 11% per annum. Debtors invoiced during the 2019 financialyear and which remain outstanding for greater than 30 days, bear interest at the rate of 11%.
Because Council is empowered under the provisions of the Local Government Act 2009 to sell an owner's propertyto recover outstanding rate debts, Council does not impair any rates receivables.
The collectability of other receivables is assessed periodically. The amount is calculated as a percentage ofreceivables with consideration of past history of actual defaults, and an assessment of the likelihood of futuredefaults.
965499
497
14,735
(7)
Notes
6,454
1,116
2,790
$'000
2,422
$'0002019
3431,703
5,751
14,735
5,747
14,735
6,447
(4)
2018
1,356
14,735
14,735
(7)(4)
14,735
514
X8A9T
X8A19T
X8A20T
X8A21T
page 16
57 Lockyer Valley Regional Council

Financial Statements 2019
Lockyer Valley Regional Council
Notes to the Financial Statements for the year ended 30 June 2019
Note 11. Non-Current Assets Classified as "Held for Sale"
Non-Current Assets "Held for Sale"Land
TOTAL NON-CURRENT ASSETS CLASSIFIED AS "HELD FOR SALE"
Council holds land at Philps Road, Grantham, and Smithfield Road, Gatton. Negotiations for the sale of this landis being undertaken.
Council sold two parcels of land at Philps Road, Grantham during the financial year.
Council sold land at Victoria Street, Forest Hill during the financial year.
Note 14 describes the valuation techniques that were used to determine the fair value of the land, which iscategorised as a Level 2 valuation.
Reconciliation of Non-Current Assets "Held for Sale"
Assets "Held for Sale"
Opening Balanceless: Carrying Value of Assets SoldBalance still unsold after 12 months:plus Net Transfer in/(out):Assets "Held for Sale" from Property, Plant and Equipmentplus Revaluation adjustmentsRevaluation of Assets "Held for Sale"Adjustment to costClosing Balance of Non-Current Assets "Held for Sale"
(34) -
$'0002018
439
2,084
11
2,091
2019$'000
2,046(1,006)
2,485 3,052
2,485
2,485
-
2,4852,091
30
Notes
8
13
(401)
2,091
X8A10T
X8A11T
X8A23T
page 17
58Financial Statements 2018–2019

Financial Statements 2019
Lockyer Valley Regional Council
Notes to the Financial Statements for the year ended 30 June 2019
Note 12. Investment Property
Revaluation Adj to the Statement of Comprehensive Income
TOTAL INVESTMENT PROPERTY
Investment Property comprises land at Tryhorn Street, Grantham. Lease contracts are in negotiations.
Investment Property does not include Community Housing.
The 30 June 2019 investment property and land was valued at fair value by: Kim Adams, Certified Practicing Valuer,Registration Number 2124 of Pickles Valuation Services. Pickles Valuation Services have extensive experience invaluing properties of this nature in surrounding areas. Fair Value was determined by reference to market basedevidence including observable historical sales data in the relevant market for properties of a similar nature.
Gains or losses arising from changes in the fair value of investment property are recognised as income orexpenses respectively for the period in which they arise. Investment property is not depreciated and is not tested for impairment.
2,010
1,850
$'000$'000
3160
1,850
2019 2018
1,847Fair value at Beginning of Financial Year
Notes
X8A12T
X8A13T
page 18
59 Lockyer Valley Regional Council

Fi
nanc
ial S
tate
men
ts 2
019
Lock
yer V
alle
y R
egio
nal C
ounc
il
Not
es to
the
Fina
ncia
l Sta
tem
ents
for t
he y
ear e
nded
30
June
201
9
Not
e 13
. Pro
perty
, Pla
nt a
nd E
quip
men
t
$'0
00
$'00
0$'
000
$'00
0$'
000
$'00
0$'
000
$'00
0$'
000
$'0
00
Mea
sure
men
t Bas
isN
ote
Fair
Val
ueFa
ir V
alue
Cos
tFa
ir V
alue
Cos
tC
ost
Fair
Val
ueFa
ir V
alue
Fair
Val
ue
Ope
ning
Gro
ss B
alan
ce -
at C
ost
--
24,6
34-
7,70
55,
956
--
-38
,295
Ope
ning
Gro
ss B
alan
ce -
at F
air V
alue
45,3
5783
,253
-51
8,98
0-
-24
610
,874
15,0
3367
3,74
3 O
peni
ng G
ross
Bal
ance
45,3
5783
,253
24,6
3451
8,98
07,
705
5,95
624
610
,874
15,0
3371
2,03
8 A
dditi
ons*
--
--
-19
,297
--
-19
,297
Con
tribu
ted
Ass
ets
at V
alua
tion
4-
--
1,76
5-
--
--
1,76
5 D
ispo
sals
8-
(196
)(2
,952
)(6
,862
)(3
8)-
--
-(1
0,04
8) R
eval
uatio
n D
ecre
men
ts to
Equ
ity (A
RS
)19
--
-(5
,110
)-
--
--
(5,1
10)
Rev
alua
tion
Incr
emen
ts to
Equ
ity (A
RS
)19
3,22
83,
983
--
--
--
-7,
211
Wor
k in
Pro
gres
s Tr
ansf
ers
13,
660
3,58
49,
718
362
(19,
151)
191,
031
776
- T
rans
fers
from
/(to)
Hel
d fo
r Sal
e ca
tego
ry11
(11)
--
--
--
--
(11)
Tra
nsfe
rs fr
om/(t
o) In
tang
ible
Ass
ets
15-
--
--
(10)
--
-(1
0) A
djus
tmen
t Due
to C
hang
es in
Pro
visi
on fo
r Reh
abilit
atio
n18
--
--
--
--
827
827
Tota
l Gro
ss V
alue
of P
rope
rty, P
lant
and
Equ
ipm
ent -
at C
ost
--
25,2
66-
8,02
96,
092
--
-39
,387
Tota
l Gro
ss V
alue
of P
rope
rty, P
lant
and
Equ
ipm
ent -
at F
air V
alue
48,5
7590
,700
-51
8,49
1-
-26
511
,905
16,6
3768
6,57
3To
tal G
ross
Val
ue o
f Pro
perty
, Pla
nt a
nd E
quip
men
t48
,575
90,7
0025
,266
518,
491
8,02
96,
092
265
11,9
0516
,637
725,
960
Ope
ning
Acc
umul
ated
Dep
reci
atio
n-
31,3
3012
,372
85,8
971,
491
--
3,35
685
713
5,30
3 D
epre
ciat
ion
Exp
ense
9-
1,43
91,
532
7,29
825
9-
-43
827
311
,239
Dis
posa
ls8
-(1
40)
(2,3
11)
(2,5
97)
(7)
--
--
(5,0
55)
Rev
alua
tion
Dec
rem
ents
to E
quity
(AR
R)
19-
6,24
3-
8,98
5-
--
--
15,2
28To
tal A
ccum
ulat
ed D
epre
ciat
ion
of P
rope
rty, P
lant
and
Equ
ipm
ent
-38
,871
11,5
9399
,583
1,74
3-
-3,
794
1,13
015
6,71
4
Tota
l Net
Boo
k Va
lue
of P
rope
rty, P
lant
and
Equ
ipm
ent
48,5
7551
,829
13,6
7341
8,90
86,
286
6,09
226
58,
111
15,5
0756
9,24
6
Oth
er In
form
atio
n R
esid
ual V
alue
Inde
finite
0%-1
0%15
%-3
0%0%
0%-
Inde
finite
0%0%
Ran
ge o
f Est
imat
ed U
sefu
l Life
(yea
rs)
Inde
finite
20-8
03-
2010
-100
3-10
0-
Inde
finite
2540
*Ass
et A
dditi
ons
Com
pris
e A
sset
Ren
ewal
s-
1,46
63,
613
8,46
513
2-
-65
631
314
,645
Oth
er A
dditi
ons
11,
286
213
1,89
124
6-
1967
232
44,
652
Tota
l Ass
et A
dditi
ons
12,
752
3,82
610
,356
378
-19
1,32
863
719
,297
Par
k an
d C
emet
ery
Equ
ipm
ent
Was
te30
Jun
e 20
19La
ndB
uild
ings
Pla
nt a
nd O
ther
E
quip
men
t
Roa
d an
d D
rain
age
Net
wor
kTo
tal
page xx
Oth
er A
sset
sW
orks
In
Pro
gres
sA
rtwor
ks
Financial Statements 2015
X9A0T
page
19
60Financial Statements 2018–2019

Fi
nanc
ial S
tate
men
ts 2
019
Lock
yer V
alle
y R
egio
nal C
ounc
il
Not
es to
the
Fina
ncia
l Sta
tem
ents
for t
he y
ear e
nded
30
June
201
9
Not
e 13
. Pro
perty
, Pla
nt a
nd E
quip
men
t (co
ntin
ued)
$'0
00
$'00
0$'
000
$'00
0$'
000
$'00
0$'
000
$'00
0$'
000
$'0
00
Mea
sure
men
t Bas
isN
ote
Fair
Val
ueFa
ir V
alue
Cos
tFa
ir V
alue
Cos
tC
ost
Fair
Val
ueFa
ir V
alue
Fair
Val
ue
Ope
ning
Gro
ss B
alan
ce -
at C
ost
--
24,2
03-
22,7
037,
814
--
-54
,720
Ope
ning
Gro
ss B
alan
ce -
at F
air V
alue
42,2
9493
,391
-51
2,56
5-
-24
79,
735
-65
8,23
2 O
peni
ng G
ross
Bal
ance
42,2
9493
,391
24,2
0351
2,56
522
,703
7,81
424
79,
735
-71
2,95
2 A
dditi
ons*
--
--
-17
,665
--
-17
,665
Con
tribu
ted
Ass
ets
at V
alua
tion
417
5-
-6,
047
--
--
-6,
222
Dis
posa
ls8
(61)
(796
)(1
,864
)(4
,222
)(1
,148
)-
(1)
-(1
14)
(8,2
06)
Rev
alua
tion
Dec
rem
ents
to E
quity
(AR
R)
19-
(9,6
84)
-(6
,983
)-
--
--
(16,
667)
Rev
alua
tion
Incr
emen
ts to
Equ
ity (A
RS
)19
721
--
--
--
--
721
Wor
k in
Pro
gres
s Tr
ansf
ers
2,56
034
22,
262
11,5
7316
1(1
8,08
3)-
1,00
318
2-
Tra
nsfe
rs fr
om/(t
o) H
eld
for S
ale
cate
gory
11(3
32)
--
--
(107
)-
--
(439
) T
rans
fers
from
/(to)
Inta
ngib
le A
sset
s15
--
--
-(1
,333
)-
--
(1,3
33)
Adj
ustm
ent D
ue to
Cha
nges
in P
rovi
sion
for R
ehab
ilitat
ion
--
--
--
--
1,12
31,
123
Tra
nsfe
rs fr
om/(t
o) O
ther
Ass
ets
--
33-
(14,
011)
--
136
13,8
42-
Tota
l Gro
ss V
alue
of P
rope
rty, P
lant
and
Equ
ipm
ent -
at C
ost
--
24,6
34-
7,70
55,
956
--
-38
,295
Tota
l Gro
ss V
alue
of P
rope
rty, P
lant
and
Equ
ipm
ent -
at F
air V
alue
45,3
5783
,253
-51
8,98
0-
-24
610
,874
15,0
3367
3,74
3To
tal G
ross
Val
ue o
f Pro
perty
, Pla
nt a
nd E
quip
men
t45
,357
83,2
5324
,634
518,
980
7,70
55,
956
246
10,8
7415
,033
712,
038
Ope
ning
Acc
umul
ated
Dep
reci
atio
n-
33,9
5311
,882
85,2
062,
820
--
2,91
5-
136,
776
Dep
reci
atio
n E
xpen
se9
-1,
395
1,69
67,
714
275
--
406
353
11,8
39 D
ispo
sals
8-
(202
)(1
,212
)(1
,401
)(3
23)
--
-(1
5)(3
,153
) R
eval
uatio
n In
crem
ents
to E
quity
(AR
S)
19-
(3,8
16)
-(5
,622
)-
--
-(7
20)
(10,
158)
Tra
nsfe
rs fr
om/(t
o) O
ther
Ass
ets
--
6-
(1,2
81)
--
351,
239
-To
tal A
ccum
ulat
ed D
epre
ciat
ion
of P
rope
rty, P
lant
and
Equ
ipm
ent
-31
,330
12,3
7285
,897
1,49
1-
-3,
356
857
135,
304
Tota
l Net
Boo
k Va
lue
of P
rope
rty, P
lant
and
Equ
ipm
ent
45,3
5751
,923
12,2
6243
3,08
36,
214
5,95
624
67,
518
14,1
7657
6,73
4
Oth
er In
form
atio
n R
esid
ual V
alue
Inde
finite
0%15
%-3
0%0%
0%-
Inde
finite
0%0%
Ran
ge o
f Est
imat
ed U
sefu
l Life
(yea
rs)
Inde
finite
20-8
03-
2010
-100
3-10
0-
Inde
finite
2540
*Ass
et A
dditi
ons
Com
pris
e A
sset
Ren
ewal
s-
--
--
11,5
47-
--
11,5
47 O
ther
Add
ition
s-
--
--
6,11
8-
--
6,11
8To
tal A
sset
Add
ition
s-
--
--
17,6
65-
--
17,6
65
30 J
une
2018
Land
Bui
ldin
gsP
lant
and
Oth
er
Equ
ipm
ent
Roa
d an
d D
rain
age
Net
wor
kO
ther
Ass
ets
Wor
ks In
P
rogr
ess
Artw
orks
Par
k an
d C
emet
ery
Equ
ipm
ent
Was
teTo
tal
page xx
Financial Statements 2015
page
20
61 Lockyer Valley Regional Council

Financial Statements 2019
Lockyer Valley Regional Council
Notes to the Financial Statements for the year ended 30 June 2019
Note 13. Property, Plant and Equipment (continued)
Valuations - defined by reference to:
Land - Basis of valuation: Fair Value - Date of valuation: 30 June 2019 - Valuer: Pickles Valuation Services - Kim Adams, AAPI, CPV 2124
Buildings - Basis of valuation: Fair Value - Date of valuation: 30 June 2019 - Valuer: Pickles Valuation Services - Kim Adams, AAPI, CPV 2124
Plant and Other Equipment - Basis of valuation: Cost less accumulated depreciation
Road and Drainage Network - Basis of valuation: Fair Value - Date of valuation: 30 June 2019 - Valuer: Pickles Valuation Services - Kim Adams, AAPI, CPV 2124
Other Assets - Basis of valuation: Cost less accumulated depreciation
Works In Progress - Basis of valuation: Cost
Artworks - Basis of valuation: Fair Value - Date of valuation: 30 June 2016 - Valuer: Pickles Valuation Services - Kim Adams, AAPI, CPV 2124
page 21
62Financial Statements 2018–2019

Financial Statements 2019
Lockyer Valley Regional Council
Notes to the Financial Statements for the year ended 30 June 2019
Note 13. Property, Plant and Equipment (continued)
Valuations - defined by reference to: (continued)
Park and Cemetery Equipment - Basis of valuation: Fair Value - Date of valuation: 30 June 2017 - Valuer: Pickles Valuation Services - Kim Adams, AAPI, CPV 2124
Waste - Basis of valuation: Fair Value - Date of valuation: 30 June 2018 - Valuer: Pickles Valuation Services - Kim Adams, AAPI, CPV 2124
Each class of property, plant and equipment is stated at cost or fair value less, where applicable, any accumulateddepreciation and accumulated impairment loss. Items of plant and equipment with a total value of less than $5,000,and infrastructure assets and buildings with a total value of less than $10,000, are treated as an expense in the yearof acquisition. All other items of property, plant and equipment are capitalised.
Capital Work In Progress is the cost of property, plant and equipment being constructed by the Council whichincludes the cost of purchased services, materials, direct labour and an appropriate proportion of labour overheads.
Land and artworks is not depreciated as it has an unlimited useful life. Depreciation on other property, plant and equipment assets is calculated on a straight-line basis so as to write-off the net cost or revalued amount of each depreciable asset, less its estimated residual value, progressively over its estimated useful life to the Council. Management believe that the straight-line basis appropriately reflects the pattern of consumption of all Councilassets.
Assets are depreciated from the date of acquisition or, in respect of internally constructed assets, from the time an asset is completed and commissioned ready for use.
Where assets have separately identifiable components that are subject to regular replacement, these componentsare assigned useful lives distinct from the asset to which they relate. Any expenditure that increases the originallyassessed capacity or service potential of an asset is capitalised and the new depreciable amount is depreciatedover the remaining useful life of the asset to the Council.
Depreciation methods, estimated useful lives and residual values of property, plant and equipment assets are reviewed at the end of each reporting period and adjusted where necessary to reflect any changes in the pattern of consumption, physical wear and tear, technical or commercial obsolescence, or management intentions. The condition assessments performed as part of the annual valuation process for assets measured at depreciated current replacement cost are used to estimate the useful lives of these assets at each reporting date.
page 22
63 Lockyer Valley Regional Council

Financial Statements 2019
Lockyer Valley Regional Council
Notes to the Financial Statements for the year ended 30 June 2019
Note 14. Fair Value Measurements
The fair value of assets and liabilities must be estimated in accordance with various Accounting Standards foreither recognition and measurement requirements or for disclosure purposes.
AASB 13 requires disclosure of fair value measurements by level of the following fair value measurementhierarchy:Level 1: Quoted prices (unadjusted) in active markets for identical assets or liabilities,Level 2: Inputs other than quoted prices included within Level 1 that are observable for the asset or liability either directly or indirectly,Level 3: Inputs for the asset or liability that are not based on observable market data (unobservable inputs).
(1) The following table presents all assets and liabilities that have been measured and recognised at fair values:
2019Assets Held for Sale- LandTotal Assets Held for Sale
Investment Properties- LandTotal Investment Properties
Property, Plant and Equipment- Land- Buildings- Road and Drainage Network- Artworks- Park and Cemetery Equipment- WasteTotal Property, Plant and Equipment
2018Assets Held for Sale- LandTotal Assets Held for Sale
Investment Properties- LandTotal Investment Properties
Property, Plant and Equipment- Land- Buildings- Road and Drainage Network- Artworks- Park and Cemetery Equipment- WasteTotal Property, Plant and Equipment
$'000
- 42,728 500,467 543,19530/06/18 - - 15,507 15,507
51,82930/06/19 6,112
30/06/19 -
- 8,111 8,11130/06/17 -
- 418,908 418,90830/06/16 - 265
2,010
-
- 265
30/06/19 - - 51,829
inputs
$'000 $'000
Fair Value Measurement using:Level 3
Significantunobservable
inputs
Level 2Significantobservable
$'000
2,010
-
- 42,463
- 2,010
48,575
2,01030/06/19
30/06/19
Dateof latestvaluation
-2,091
-
2,091
Level 1Quoted
prices inactive mkts
-
-
Total
2,091
-
2,091
$'000 $'000 $'000 $'000
30/06/18 - 2,485 - 2,485- 2,485 - 2,485
30/06/18 - 1,850 - 1,850- 1,850 - 1,850
30/06/18 - 37,605 5,157 42,76230/06/18 - - 51,923 51,92330/06/18 - - 433,083 433,08330/06/16 - 246 - 24630/06/17 - - 7,518 7,518
NA - - 14,176 14,176- 37,851 511,857 549,708
X10A0T
page 23
64Financial Statements 2018–2019

Financial Statements 2019
Lockyer Valley Regional Council
Notes to the Financial Statements for the year ended 30 June 2019
Note 14. Fair Value Measurements (continued)
(2) Transfers between Level 1 and Level 2 Fair Value Hierarchies
During the year, there were no transfers between Level 1 and Level 2 Fair Value hierarchies for recurring fairvalue measurements.
(3) Valuation techniques used to derive Level 2 and Level 3 Fair Values
Where Council is unable to derive Fair Valuations using quoted market prices of identical assets (ie. Level 1 inputs)Council instead utilises a spread of both observable inputs (Level 2 inputs) and unobservable inputs (Level 3 inputs).
The Fair Valuation techniques Council has employed while utilising Level 2 and Level 3 inputs are as follows:
Investment PropertiesCouncil obtains independent valuations at least every three years for all investment properties. The last valuation wasundertaken by Pickles Valuation Services, Registered Valuers, as at 30 June 2019.
Council's investment properties are all vacant land in areas with regular sales of comparable properties. Thereforethey were valued using the direct comparison approach. Sales of properties with similar features have been analysedon a basis of a rate per square metre of land area and compared to the subject properties having regard to value influencing factors such as location, site area, zoning and relativity of market conditions at the time of sale. Noallowance has been made for realisation expenses.
LandWhere there is an active and liquid market as evidenced by sales transactions of similar property types, a MarketApproach by way of Direct Comparison or Income methods can be utilised, and are accepted valuationmethodologies under AASB 13. If a Market Approach is adopted, the valuation is deemed to be a Level 2 input.
Direct Comparison method which is considered a Level 2 input on the Fair Value Hierarchy, involves the analysisof sales evidence and comparisons with the subject land taking into account matters such as area, location and other general site characteristics. The Direct Comparison approach has been utilised in the valuer's assessment for all LVRC Land Assets, however the fair value measurement has been either a Level 2 or 3, depending ontheir assumptions as to:
- Whether the land is subject to restrictions as to use and/or sale;- Whether there is no active market.
If these assumptions apply to the land as per the better practice guidelines in Queensland Treasury NCAP 3, theValuers have measured the expected Fair Value as a Level 3. However if an active market can be established andthere are no unreasonable restrictions as to use and/or sale, the Valuers have deemed the measurement to be aLevel 2. Land that is utilised for footpath or access restriction purposes, land that is a volumetric title, or due to itsgeneral characteristics land that has no observable active market, have been assessed as a Level 3.
The valuation techniques used to measure fair value maximise the use of observable data where it is available and relies as little as possible on entity specifics. The disclosure of valuation estimates is designed to provideusers with an insight into the judgements that have been made in the determination of fair values.
page 24
65 Lockyer Valley Regional Council

Financial Statements 2019
Lockyer Valley Regional Council
Notes to the Financial Statements for the year ended 30 June 2019
Note 14. Fair Value Measurements (continued)
(3) Valuation techniques used to derive Level 2 and Level 3 Fair Values (continued)
BuildingsDue to the predominantly specialised nature of Local Government Assets, building valuations are undertakenon a Cost Approach (Current Replacement Cost). The cost approach is deemed a Level 3 Input. Under thisapproach, the following process have been adopted.
Where there is no market, the net current value of an asset is the gross current value less accumulated depreciation to reflect the consumed or expired service potential of the asset. Published/available market data for recent projects,and/or published cost guides are utilised to determine the estimated replacement cost (gross value) of the asset, including allowances for preliminaries and professional fees.
A condition assessment is applied, which is based on factors such as the age of the asset, overall condition asnoted by the Valuer during inspection, economic and/or functional obsolescence. The condition assessment directly translates to the level of depreciation applied.
The majority of Buildings and Facilities have been inherited from two previous Shires in the amalgamationprocess. This has created some duplication of facilities and a surplus asset inventory particularly inregard to buildings. Lockyer Valley Regional Council created a Building and Facilities Service Management Planin May 2017 and created a list of underutilised or non-utilised buildings in the Plan.
The utilisation of these buildings is low or being used for purposes other than the building design intention simplybecause they are available. The detailed disposal plan for each of these facilities has not yet been decided. Untilsuch a decision is made the intention is not to replace any of these facilities at the end of their useful lives, andkeep maintenance to a minimum. The non-replacement buildings have been valued on this basis and have beendepreciated based on both physical deterioration and obsolescence as they have limited alternative uses.
In determining the level of accumulated depreciation for major assets, we have disaggregated into significant components which exhibit different patterns of consumption (useful lives). Residual value, which is the value at thetime the asset is considered to be no longer available, is also factored in. The condition assessment is appliedon a component basis.
While the replacement cost of the assets could be supported by market supplied evidence (level 2), the other unobservable inputs (such as estimates of residual value, useful life, and asset condition) were also required (level 3).
The Condition rating inputs can be defined in the following table.
Rating Description % of Life Remaining1 As New 71-1002 Good 51-703 Fair 11-504 Poor 4-105 Failed asset 0-3
The valuation techniques used in the determination of fair values maximise the use of observable data where it is available and relies as little as possible on entity specifics. The disclosure of valuation estimates isdesigned to provide users with an insight into the judgements that have been made in the determination of fair values.
page 25
66Financial Statements 2018–2019
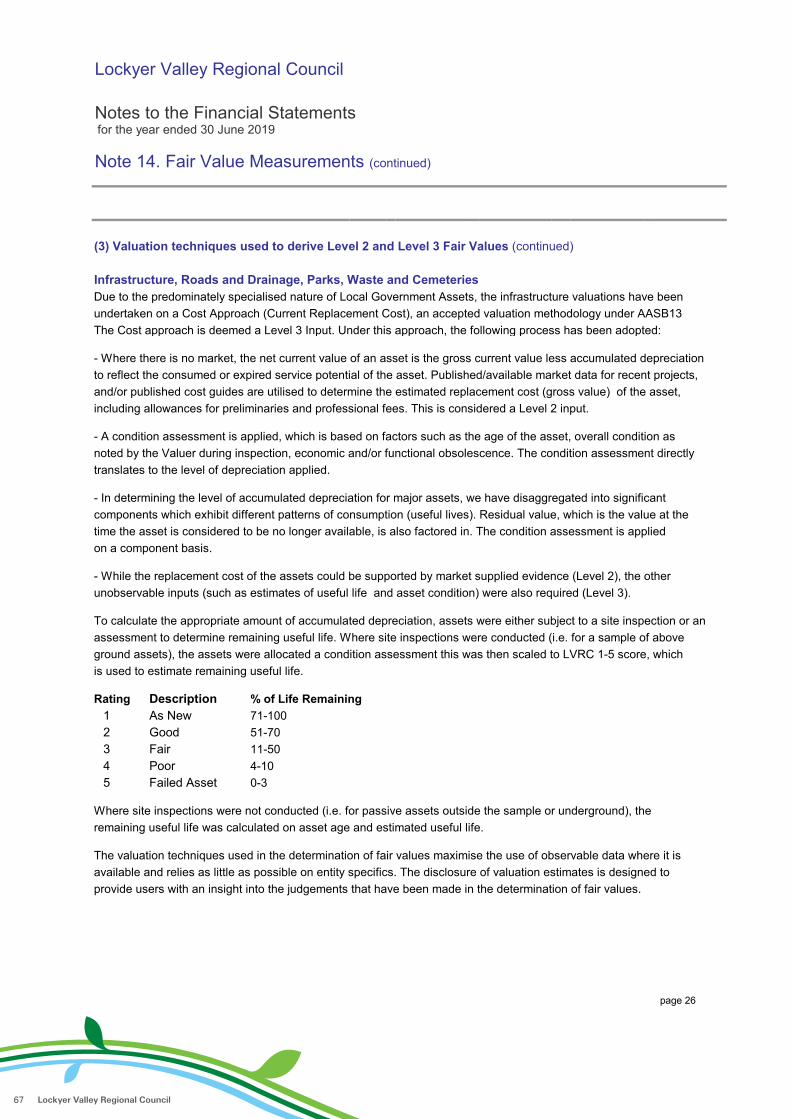
Financial Statements 2019
Lockyer Valley Regional Council
Notes to the Financial Statements for the year ended 30 June 2019
Note 14. Fair Value Measurements (continued)
(3) Valuation techniques used to derive Level 2 and Level 3 Fair Values (continued)
Infrastructure, Roads and Drainage, Parks, Waste and CemeteriesDue to the predominately specialised nature of Local Government Assets, the infrastructure valuations have beenundertaken on a Cost Approach (Current Replacement Cost), an accepted valuation methodology under AASB13The Cost approach is deemed a Level 3 Input. Under this approach, the following process has been adopted:
- Where there is no market, the net current value of an asset is the gross current value less accumulated depreciationto reflect the consumed or expired service potential of the asset. Published/available market data for recent projects,and/or published cost guides are utilised to determine the estimated replacement cost (gross value) of the asset,including allowances for preliminaries and professional fees. This is considered a Level 2 input.
- A condition assessment is applied, which is based on factors such as the age of the asset, overall condition asnoted by the Valuer during inspection, economic and/or functional obsolescence. The condition assessment directlytranslates to the level of depreciation applied.
- In determining the level of accumulated depreciation for major assets, we have disaggregated into significantcomponents which exhibit different patterns of consumption (useful lives). Residual value, which is the value at thetime the asset is considered to be no longer available, is also factored in. The condition assessment is appliedon a component basis.
- While the replacement cost of the assets could be supported by market supplied evidence (Level 2), the other unobservable inputs (such as estimates of useful life and asset condition) were also required (Level 3).
To calculate the appropriate amount of accumulated depreciation, assets were either subject to a site inspection or anassessment to determine remaining useful life. Where site inspections were conducted (i.e. for a sample of aboveground assets), the assets were allocated a condition assessment this was then scaled to LVRC 1-5 score, whichis used to estimate remaining useful life.
Rating Description % of Life Remaining1 As New 71-1002 Good 51-703 Fair 11-504 Poor 4-105 Failed Asset 0-3
Where site inspections were not conducted (i.e. for passive assets outside the sample or underground), the remaining useful life was calculated on asset age and estimated useful life.
The valuation techniques used in the determination of fair values maximise the use of observable data where it is available and relies as little as possible on entity specifics. The disclosure of valuation estimates is designed to provide users with an insight into the judgements that have been made in the determination of fair values.
page 26
67 Lockyer Valley Regional Council

Financial Statements 2019
Lockyer Valley Regional Council
Notes to the Financial Statements for the year ended 30 June 2019
Note 14. Fair Value Measurements (continued)
(4). Fair value measurements using significant unobservable inputs (Level 3)
The Valuation Process for Level 3 Fair Value Measurements
Roads & Road StructuresThe Roads and Road Structures assets were classified as passive assets; passive assets were further componentised and consisted of Formation, Base and Sub-base Pavement, and Seal for Roads assets and Substructure, Superstructure, Retaining Works, Deck and others for Road Structures. Unit rates were applied based on similar recent project costs, unit rate databases, indices, Rawlinson's Construction rates and quotations.
Roads are segmented based on the Department of Transport & Main Roads standards and these are classifiedas Formed, Unformed, and then further by sealed and unsealed types.
The Current Replacement Cost (CRC) was calculated by reference to asset length and width for Formation and Seal and depth for Pavements.Location factors, soil type, weather conditions, raw material access and service level standards were assumed tobe uniform across the Council area.
Urban InfrastructureThe Urban infrastructure assets were classified as passive assets; passive assets were further componentisedand consisted of Assorted Stormwater Pits, Stormwater Gravity Pipework, Footpaths and Kerb and Channel. Unitrates were applied based on similar recent project costs, unit rate databases, indices, Rawlinson's Constructionrates and quotations.
The CRC was calculated by reference to asset length for Pipework and, length, width, number of connections anddepth for Pits.
Location factors, soil type, weather conditions, raw material access and service level standards were assumed tobe uniform across the Council area.
Percentage of Assets Inspected by the Valuer- Infrastructure Assets including Road Network 5% to 20% (Bridges 100%)- Land 40%- Buildings 50%
Review of ValuationsAll valuations were subjected to review by Council engineering, facilities and finance staff including: - unit rates- condition ratings- useful lives- depreciation- written down values- residual values
page 27
68Financial Statements 2018–2019

Financial Statements 2019
Lockyer Valley Regional Council
Notes to the Financial Statements for the year ended 30 June 2019
Note 15. Intangible Assets
Intangible Assets represent identifiable non-monetary assets without physical substance.
Intangible Assets are as follows;
SoftwareOpening Gross Carrying ValueAdditions (including in development assets)DisposalsIn DevelopmentClosing Gross Carrying Value
Opening Accumulated AmortisationAmortisationAccumulated Amortisation charges written offClosing Accumulated Amortisation
Net Carrying Value
TOTAL INTANGIBLE ASSETS - NET BOOK VALUE 1
1. The Net Book Value of Intangible Assets represent:- Software
Software assets have a finite life estimated at between 3 and 10 years.Straight line amortisation has been used with no residual value. Intangible assets with a cost or other value exceeding $10,000 are recognised in the financial statements. Items with a lesser value are expensed.Amortisation methods, estimated useful lives and residual values are reviewed at the end of each reporting period and adjusted where appropriate.
Note 16. Trade and Other Payables
Current
Creditors and AccrualsGST PayableWaste Levy Received in AdvanceState Fire LevyAnnual LeaveOther Employee Entitlements
TOTAL CURRENT TRADE AND OTHER PAYABLES 6,716
2,115168
114
8,227
91
146 1562,061
2018
4,723
5,2125,4935,212
851,038
4,196
50
(4,581)
2019
-
5,493
-
10,074
(1,044)88
5,493
2019
1,0808,860
$'000
(933)
$'000
7,618
2018
9
5,212
8,860
(3,648)
Notes
(91)-1,333
134
(2,692)(3,648)
5,493 5,212
X11A0T
X11A1T
X11A11T
page 28
69 Lockyer Valley Regional Council

Financial Statements 2019
Lockyer Valley Regional Council
Notes to the Financial Statements for the year ended 30 June 2019
Note 16. Trade and Other Payables (continued)
Trade payables are recognised upon receipt of the goods or services ordered, and are measured at the agreedpurchase/contract price. Amounts owing are unsecured, and generally settled on 30 day terms.
A liability for salaries and wages is recognised and measured as the amount unpaid at the reporting date at current pay rates in respect of employees' services up to that date. This liability represents an accrued expense.
Annual leave and other employee entitlements are measured at the present value of the estimated future cashoutflows to be made in respect of services provided by employees up to the reporting date. The value of the current liability is calculated using current pay rates, employee on-costs, and discounted to present values.
Council has no obligation to pay sick leave on termination of employees. No liability is recognised for sick leave.
Superannuation is paid within three days of a pay period. No liability is recognised for superannuation.
Note 17. Borrowings
Current
Loans - Queensland Treasury Corporation
TOTAL CURRENT BORROWINGS
Non-current
Loans - Queensland Treasury Corporation
TOTAL NON-CURRENT BORROWINGS
Reconciliation of Loan Movements for the yearLoans - Queensland Treasury Corporation
Opening Balance at Beginning of Financial YearPrincipal RepaymentsBook value at end of financial year
The QTC loan market value at the reporting date was $29,021,652. This represents the value of the debt if Councilrepaid it at that date. Additional principal payments have been made (2019: $500,000, 2018: $5,000,000)however the loan term remains unchanged. As such no provision for early repayment has been madein these accounts.
2019
$'000 $'000
1,3901,435
$'0002018
(6,120)
23,079
Notes
24,940
1,435
26,330
2019Notes
24,514
2018
(1,816)
23,079
24,940
1,390
$'000
32,450
26,330
X11A2T
X11A12T
X11A14T
X11A15T
page 29
70Financial Statements 2018–2019
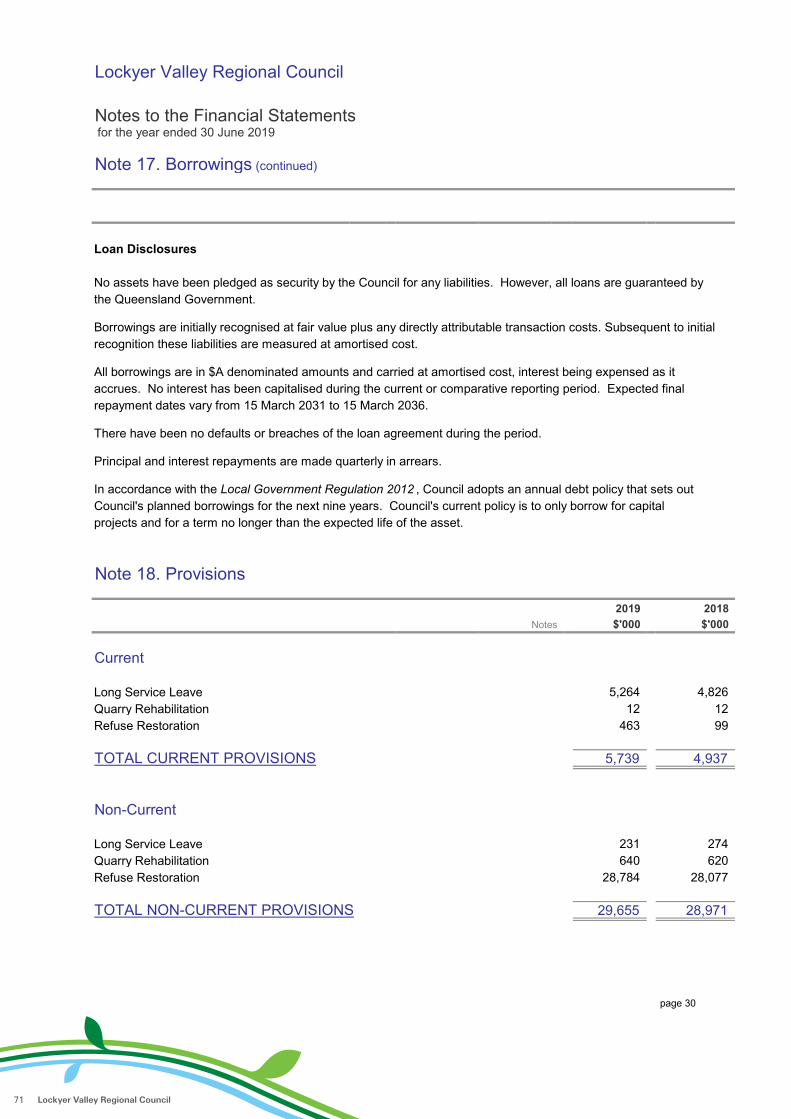
Financial Statements 2019
Lockyer Valley Regional Council
Notes to the Financial Statements for the year ended 30 June 2019
Note 17. Borrowings (continued)
Loan Disclosures
No assets have been pledged as security by the Council for any liabilities. However, all loans are guaranteed by the Queensland Government.
Borrowings are initially recognised at fair value plus any directly attributable transaction costs. Subsequent to initial recognition these liabilities are measured at amortised cost.
All borrowings are in $A denominated amounts and carried at amortised cost, interest being expensed as itaccrues. No interest has been capitalised during the current or comparative reporting period. Expected final repayment dates vary from 15 March 2031 to 15 March 2036.
There have been no defaults or breaches of the loan agreement during the period.
Principal and interest repayments are made quarterly in arrears.
In accordance with the Local Government Regulation 2012 , Council adopts an annual debt policy that sets outCouncil's planned borrowings for the next nine years. Council's current policy is to only borrow for capital projects and for a term no longer than the expected life of the asset.
Note 18. Provisions
Current
Long Service LeaveQuarry RehabilitationRefuse Restoration
TOTAL CURRENT PROVISIONS
Non-Current
Long Service LeaveQuarry RehabilitationRefuse Restoration
TOTAL NON-CURRENT PROVISIONS
Notes $'000
12
640
29,655
5,739
2019$'000
231
99
274620
28,077
463
2018
5,264
28,971
28,784
4,826
4,937
12
X11A3T
X11A13T
X11A16T
page 30
71 Lockyer Valley Regional Council

Financial Statements 2019
Lockyer Valley Regional Council
Notes to the Financial Statements for the year ended 30 June 2019
Note 18. Provisions (continued)
Details of movements in Provisions:
Long Service LeaveQuarry RehabilitationRefuse Restoration
Provisions are measured at the expected cost of the work required, discounted to current day values using the interest rates attaching to Commonwealth Government guaranteed securities with a maturity date corresponding tothe anticipated date of the payment.
Quarry rehabilitationThe provision represents the present value of the anticipated future costs associated with the closure of the fivequarries, refilling the basin, and reclamation and rehabilitation of these sites. The calculation of this provision requiresassumptions such as application of environmental legislation, site closure dates, available technologies and engineering cost estimates. These uncertainties may result in future actual expenditure differing from amounts currently provided. Because of the long-term nature of the liability, the most significant uncertainty in estimatingthe provision is the costs that will be incurred. The provision recognised for quarry rehabilitation is reviewed at leastannually and updated based on the facts and circumstances available at the time. Restoration costs are already beingincurred.
The projected cost is $642,082 and this cost is expected to be incurred between 2014 and 2072.
Refuse restorationThe provision represents the present value of the anticipated future costs associated with the closure of the eightrefuse sites, decontamination and monitoring of historical residues and leaching on these sites. The calculation of thisprovision requires assumptions such as application of environmental legislation, site closure dates, availabletechnologies and engineering cost estimates. These uncertainties may result in future actual expenditure differing from amounts currently provided. Because of the long-term nature of the liability, the most significant uncertainty inestimating the provision is the costs that will be incurred. The provision recognised for refuse sites is reviewed at leastannually and updated based on the facts and circumstances available at the time. Restoration costs are alreadybeing incurred.
The projected cost is $27,929,772 and this will be incurred periodically from 2014 to 2076.
Long Service LeaveA liability for long service leave is measured as the present value of the estimated future cash outflows to be madein respect of services provided by employees up to the reporting date. The value of the liability is calculated usingcurrent pay rates, future pay increases, employee on-costs, and the probability of the employee remaining inCouncil's employment which would result in the Council being required to meet the liability. The interest rates attaching to Commonwealth Government guaranteed securities at the reporting date are used to discount theestimated future cash outflows to their present value.
2,01928,176
-29,247
33,908
- 20(797)
$'000
-$'000
244827264
Notes
Opening Balance
as at 01/07/2018
$'000
1,1925,100$'000
632
Remeasure -ment due to
Discounting
652
$'000
Class of ProvisionChange in Provisions
Decrease due to
Payments
(797)TOTAL 35,394
Closing Balance
as at 30/06/2019
5,495
-
page 31
72Financial Statements 2018–2019

Financial Statements 2019
Lockyer Valley Regional Council
Notes to the Financial Statements for the year ended 30 June 2019
Note 18. Provisions (continued)
Long Service Leave (continued)Where employees have met the prerequisite length of service and council does not have an unconditional right todefer this liability beyond 12 months long service leave is classified as a current liability. Otherwise it is classifiedas non-current.
Note 19. Asset Revaluation Surplus
Movements in the asset revaluation surplus:Balance at beginning of financial yearNet adjustment to non-current assets at end of period to reflect achange in current fair value:LandBuildingsRoad and Drainage NetworkWaste
Balance at end of financial year
Asset revaluation surplus analysisThe closing balance of the Asset Revaluation Surplus comprises the followingasset categories:LandBuildingsRoad and Drainage NetworkArtworksWaste
Balance at end of financial year
The asset revaluation surplus comprises adjustments relating to changes in value of property, plant and equipmentthat do not result from the use of those assets. Increases and decreases on revaluation are offset within a class of assets. Any decreases on revaluation in excess of the asset revaluation surplus are treated as an expense.There are no adjustments to the asset revaluation surplus on the disposal of assets.
213,043
16,711
199,916
(1,362)
721
(13,127)
$'000
(2,260)
Notes
(14,095)
13
2018
(5,868)3,228
(5,789)199,916
720126
191,481
720
19,9391,745
2019
720-
213,043
126
218,832
$'000
4,005177,386
213,043
X11A4T
X11A17T
X11A18T
page 32
73 Lockyer Valley Regional Council

Financial Statements 2019
Lockyer Valley Regional Council
Notes to the Financial Statements for the year ended 30 June 2019
Note 20. Retained Surplus
Movements in the retained surplus:
Retained Surplus at Beginning of Financial Year
Net Result Attributable to Council
Restricted Capital Works Reserve - Grants & SubsidiesRoads Infrastructure ReserveRoadworks Extractive Industry Reserve
Rates Levies ReservePrepaid Grants Reserve
Retained surplus at end of financial year
Note 21. Reserves
Council's Cash, Cash Equivalents and Investments are subject to a number of External and Internal Restrictionsthat limit the amount that is available for discretionary or future use. In prior years, Council accounted for these Restrictions using a system of Reserves.
Restricted Capital Works Reserve - Grants & SubsidiesThis corresponds to the amount of cash which has been received in respect of capital works where the requiredcapital works have not yet been carried out.
Roads Infrastructure ReserveThis represents the future development of roads across the region from specific contributions.
Rates Levies ReserveThis represents the unspent funds from the Emergency Preparedness, Rural Fire and Waste Management Levies.These funds will provide disaster management, SES, rural fire, environmental and waste functions as needed.This reserve has now been fully expended.
Prepaid Grants ReserveThis corresponds to the amount of cash which has been received in respect of operational works where therequired operations have not yet been carried out.
Reserves held for funding future capital exp:Restricted Capital Works Reserve - Grants & SubsidiesRoads Infrastructure Reserve 2,180
(270)2,074
383,591
367,461
380,111
21
2,885
197
3,437
380,111
$'000
Transfers (to)/from Capital Reserves for Future Capital Project Funding, or from Reserves Funds that have been Expended or Closed:
Notes
Transfers (to)/from Recurrent Reserves for Future Project Funding, or from Reserves funds that have been Expended or Closed: 21
384
2019 2018$'000
(193)
11,012
20182019
591 3212,564
- 72
2,771
(268) (118)(197)
X11A5T
X11A6T
page 33
74Financial Statements 2018–2019
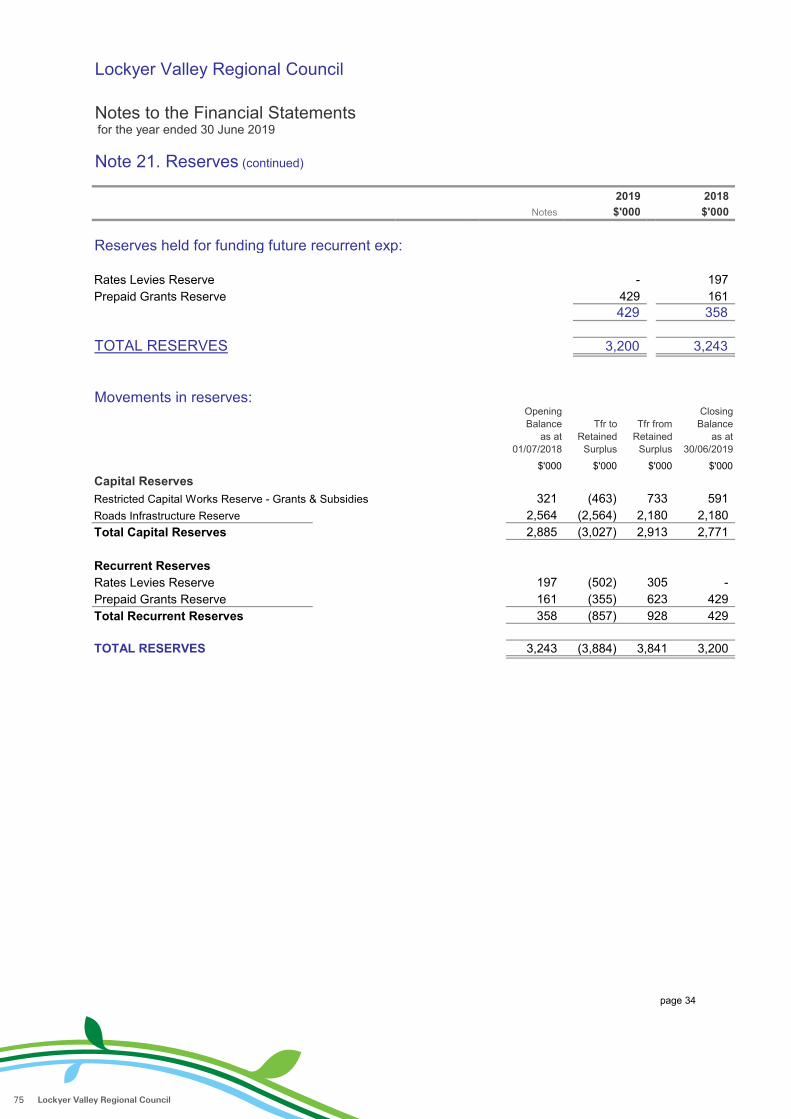
Financial Statements 2019
Lockyer Valley Regional Council
Notes to the Financial Statements for the year ended 30 June 2019
Note 21. Reserves (continued)
Reserves held for funding future recurrent exp:
Rates Levies ReservePrepaid Grants Reserve
TOTAL RESERVES
Movements in reserves:
Capital ReservesRestricted Capital Works Reserve - Grants & SubsidiesRoads Infrastructure ReserveTotal Capital Reserves
Recurrent ReservesRates Levies ReservePrepaid Grants ReserveTotal Recurrent Reserves
TOTAL RESERVES
2019
161
Opening Balance
as at 01/07/2018
Tfr to Retained
Surplus
$'000
161 623
2,180
-
429429
197
321 (463)2,5642,885
(2,564)
(857)
(3,884)
928
305
3,243
(3,027)
3,243
3,841 3,200
429
$'000
429
2,913
(355)
-
$'000 $'000
197
Notes
3,200
2018
358
(502)
$'000
2,771
591
Closing Balance
as at 30/06/2019
733
Tfr from Retained
Surplus
$'000
358
2,180
page 34
75 Lockyer Valley Regional Council

Financial Statements 2019
Lockyer Valley Regional Council
Notes to the Financial Statements for the year ended 30 June 2019
Note 22. Commitments for Expenditure
(a) Capital Commitments (exclusive of GST)
Capital expenditure committed for at the reporting date but not recognised in the financial statements as liabilities:
Property, Plant and EquipmentFacility, Buildings, Plant and Equipment ExpenditureRoad Operations & Bridge ConstructionTotal Commitments
These expenditures are payable as follows:Within the next yearTotal Payable
Sources for Funding of Capital Commitments:Restricted ReservesTotal Sources of Funding
(b) Contractual commitments
Contractual commitments at end of financial year but not recognised in the financial statements are as follows:
Garbage Collection ContractWaste Site Supervision ContractComputer Leasing ContractIT Software Contracts
2,1802,180
1,6031,5011,063
2,564
2,180
14,609
613
8,434
2,1802,564
5,392
2,564
15,439
3802,975
2,5642,180
6,392
577
5,862
Notes20182019
$'000 $'000
-
2,564
X11A7T
page 35
76Financial Statements 2018–2019

Financial Statements 2019
Lockyer Valley Regional Council
Notes to the Financial Statements for the year ended 30 June 2019
Note 23. Contingent Liabilities
Details and estimates of maximum amounts of contingent liabilities are as follows:
Local Government Mutual
The Council is a member of the local government mutual liability self-insurance pool, LGM Queensland. In the event of the pool being wound up or it is unable to meet its debts as they fall due, the trust deed and rules provide that any accumulated deficit will be met by the individual pool members in the same proportion as their contribution is to the total pool contributions in respect to any year that a deficit arises.
As at 30 June 2018, the financial statements reported an accumulated surplus totalling $75,834,341. It is not anticipated any liability will arise.
Local Government Workcare
The Council is a member of the Queensland local government worker's compensation self-insurance scheme, Local Government Workcare. Under this scheme the Council has provided an indemnity towards a bank guarantee to cover bad debts which may remain should the self insurance licence be cancelled and there was insufficient funds available to cover outstanding liabilities. Only the Queensland Government’s workers compensation authority may call on any part of the guarantee should the above circumstances arise. The Council's maximum exposure to the bank guarantee is $589,681.
The latest audited financial statements for Local Government Workcare are as at 30 June 2018 and showaccumulated member funds (equity) of $49,693,198.
Legal Claims
The Council is a defendant, or may be called upon to defend claims that arise, as a result of operations of theCouncil and ownership of public assets.
Council is currently defending a legal claim before the courts where the claimed amount is not finally calculated,but is in excess of $2.2 million. Since the proceeding was commenced, the Applicant has amended its claimon three occasions in response to strike-out applications by Council, and the amount claimed has significantly decreased from the original $25 million sought by the Applicant. No substantive steps have been takenby the Applicant to pursue this proceeding, and only those steps which will keep the proceeding 'live' in accordancewith the Court Rules have now been taken. Council is of the opinion that if this claim is progressed it can be successfully defended.
$'000$'000 Council
X11A8T
page 36
77 Lockyer Valley Regional Council

Financial Statements 2019
Lockyer Valley Regional Council
Notes to the Financial Statements for the year ended 30 June 2019
Note 23. Contingent Liabilities (continued)
Council is also aware of the following potential liability risks:
Seven Council assets have not been properly constructed by a particular contractor and now presentrisk to further liability to Council. Steps have been taken to resolve these issues with the contractor but thisprocess has been frustrated. It is considered that Council is unlikely to recover any rectification costs from thecontractor, which are expected to be in excess of $4 million. Council will incur out of pocket costs to rectifythe construction issues and may have liability to third parties in the event of any of these assets failing.
Information in respect of any individual claims has not been disclosed in accordance with AASB137 "Provisions,Contingent Liabilities and Contingent Assets" on the basis that Council considers such disclosures may seriouslyprejudice the outcome of the claim.
Note 24. Superannuation
Council contributes to the LGIAsuper Regional Defined Benefits Fund (the scheme), at the rate of 12% for each permanent employee who is a defined benefit member. This rate is set in accordance with the LGIAsuper trust deed and may be varied on the advice of an actuary. The Regional Defined Benefits Fund is a complying superannuation scheme for the purpose of the Commonwealth Superannuation Industry (Supervision) legislation and is also governed by the Local Government Act 2009 .
The scheme is a defined benefit plan, however Council is not able to account for it as a defined benefit plan in accordance with AASB119 because LGIAsuper is unable to account for its proportionate share of the defined benefit obligation, plan assets and costs.
Any amount by which the scheme is over or under funded may affect future benefits and result in a change to the contribution rate, but has not been recognised as an asset or liability of the Council.
Technically Council can be liable to the scheme for a portion of another local governments’ obligations should that local government be unable to meet them. However the risk of this occurring is extremely low and inaccordance with the LGIAsuper trust deed.
The last completed actuarial assessment of the scheme was undertaken as at 1 July 2018. The actuary indicated that “At the valuation date of 1 July 2018, the net assets of the scheme exceeded the vested benefits and the scheme was in a satisfactory financial position as at the valuation date." The Council is not aware of anything that has happened since that time that indicates the assets of the scheme are not sufficient to meet the vested benefits, as at the reporting date.
Council$'000 $'000
X11A9T
page 37
78Financial Statements 2018–2019

Financial Statements 2019
Lockyer Valley Regional Council
Notes to the Financial Statements for the year ended 30 June 2019
Note 24. Superannuation (continued)
No changes have been made to prescribed employer contributions which remain at 12% of employee wagesand there are no known requirements to change the rate of contributions.
The next triennial actuarial review is not due until 1 July 2021.
The most significant risks that may result in LGIAsuper increasing the contribution rate, on the advice of the actuary, are:
Investment risk - The risk that the scheme's investment returns will be lower than assumed and additional contributions are needed to fund the shortfall.
Salary growth risk - The risk that wages or salaries will rise more rapidly than assumed, increasingvested benefits to be funded.
There are currently 62 entities contributing to the scheme and any changes in contribution rates would apply equally to all 62 entities. Council made less than 4% of the total contributions to the plan in the 2018-19 financial year.
Superannuation contributions made to the Regional Defined Benefits FundOther superannuation contributions for employeesTotal superannuation contributions paid by Council for employees
Contributions council expects to make to the Regional Defined Benefits Fund for 2019-20
5
Notes
2,5872,706
$'000$'0002019 2018
2,603
105
2020
2,475103 112
$'000
X11A10T
page 38
79 Lockyer Valley Regional Council

Financial Statements 2019
Lockyer Valley Regional Council
Notes to the Financial Statements for the year ended 30 June 2019
Note 25. Associated Entities
Council's objectives can and in some cases are best met through the use of separate entities and operations.
These operations and entities range from 100% ownership and control through to lower levels of ownershipand control via co-operative arrangements with other Councils, Bodies and other Outside Organisations.
The accounting and reporting for these various entities, operations and arrangements varies in accordancewith accounting standards, depending on the level of Councils (i) interest and (ii) control and the type (form) ofentity/operation, as follows:
Associated Entities Note 34(b)Arrangements in the form of a Separate Entity that deploys the resources of the operation itself.Under Associated Entities, Council significantly influences the operations but does not control them.
Accounting Recognition:Associated Entities are accounted for using the Equity Accounting Method and are disclosed as a one line entryin the Statement of Comprehensive Income and Statement of Financial Position
Associated EntitiesTotal
Associated Entities
Council has incorporated the following Associated Entities into its Financial Statements.
(a) Net Carrying Amounts - Council's ShareNature of Measurement
Name of Entity Relationship Method
Total Carrying Amounts - Associated Entities
Council of Mayors South East Queensland Shareholder Equity Accounting
Shareholder Equity Accounting 66 65
Queensland Urban Utilities Shareholder Equity Accounting 31,060 29,917
SEQ Regional Recreational Facilities Pty Ltd
$'000 $'0002019 2018
214 291
30,27331,340
Council's Share of Net Income
$'0002019 2018
Council's Share of Net Assets 2019 2018
31,340
$'000
30,27330,273
2,3312,331
$'000$'0002,539 31,3402,539
X12A0T
page 39
80Financial Statements 2018–2019
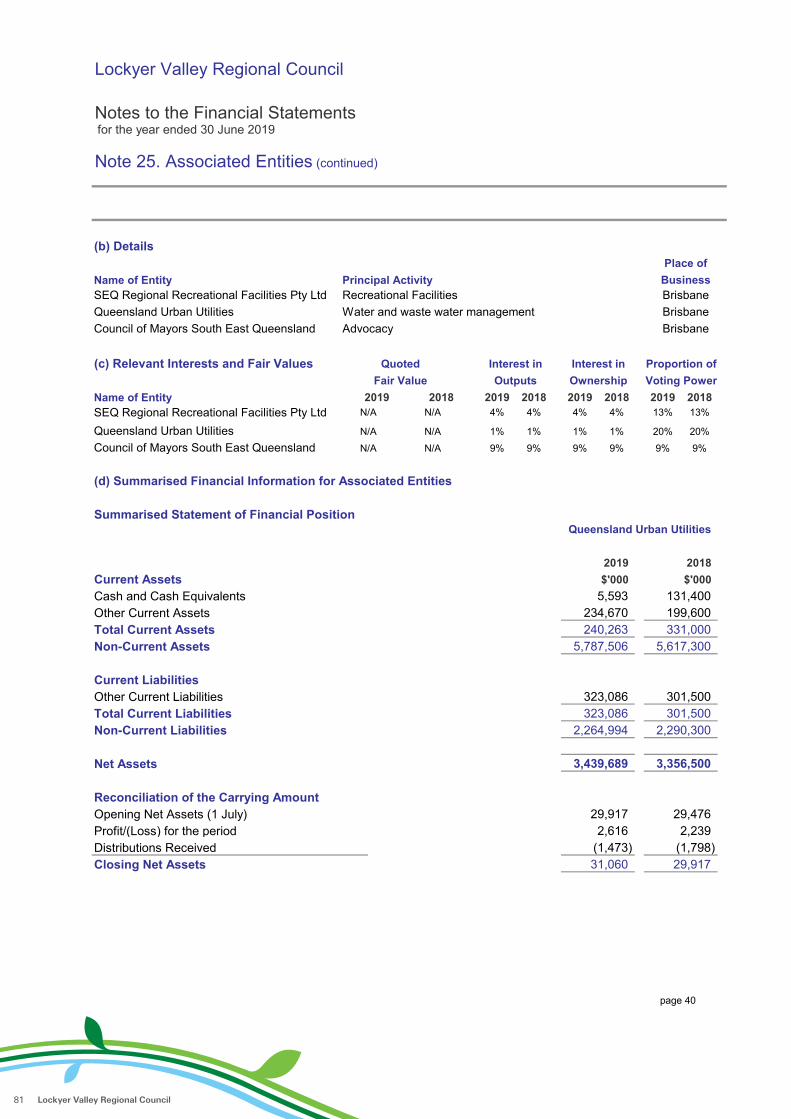
Financial Statements 2019
Lockyer Valley Regional Council
Notes to the Financial Statements for the year ended 30 June 2019
Note 25. Associated Entities (continued)
(b) Details
Name of Entity Principal Activity
(c) Relevant Interests and Fair Values
Name of Entity
(d) Summarised Financial Information for Associated Entities
Summarised Statement of Financial Position
Current AssetsCash and Cash EquivalentsOther Current AssetsTotal Current AssetsNon-Current Assets
Current LiabilitiesOther Current LiabilitiesTotal Current LiabilitiesNon-Current Liabilities
Net Assets
Reconciliation of the Carrying AmountOpening Net Assets (1 July)Profit/(Loss) for the periodDistributions ReceivedClosing Net Assets
SEQ Regional Recreational Facilities Pty Ltd
SEQ Regional Recreational Facilities Pty Ltd
31,060 29,917(1,473) (1,798)
29,917 29,4762,616 2,239
3,439,689 3,356,500
2,264,994
2019
Queensland Urban Utilities
2018
131,400$'000
199,600240,263 331,000
Quoted Interest in Interest in Proportion ofFair Value Outputs Ownership Voting Power
20182019 201820194%
2019 2018 2018N/A N/A 4% 4% 4%
Recreational Facilities BrisbaneQueensland Urban Utilities Water and waste water management BrisbaneCouncil of Mayors South East Queensland Advocacy Brisbane
$'0005,593
5,787,506 5,617,300
323,086 301,500
BusinessPlace of
2019
301,500323,086
2,290,300
13%13%
20% 20%
Council of Mayors South East Queensland N/A N/A 9% 9% 9% 9% 9% 9%
1% 1%Queensland Urban Utilities N/A N/A 1% 1%
234,670
page 40
81 Lockyer Valley Regional Council

Financial Statements 2019
Lockyer Valley Regional Council
Notes to the Financial Statements for the year ended 30 June 2019
Note 25. Associated Entities (continued)
Summarised Statement of Comprehensive Income
IncomeDepreciation and AmortisationInterest ExpenseIncome Tax ExpenseOther ExpensesProfit/(Loss) for Period
Other Comprehensive IncomeTotal Comprehensive Income
Dividends received by Council
(e) Summarised Financial Information for Individually Immaterial Associated Entities
In addition to the Associated Entities disclosed individually above, Council has interests in two individually immaterial Associated Entities that are accounted for using the Equity Method.
Individually Immaterial Associates
Aggregate carrying amount of individually immaterial Associates
Aggregate amounts of Council's share of individually immaterial Associates:Profit/(Loss) from Continuing OperationsTotal Comprehensive Income - individually immaterial Associates (76) 92
280 356
(76) 92
$'000 $'0002019 2018
1,473 1,798
226,723 247,946
226,555 247,946
168 -
(98,596) (106,262)(767,849) (710,430)
(187,839) (183,326)(96,820) (97,025)
1,377,659 1,344,989
Queensland Urban Utilities
2019 2018$'000 $'000
page 41
82Financial Statements 2018–2019

Financial Statements 2019
Lockyer Valley Regional Council
Notes to the Financial Statements for the year ended 30 June 2019
Note 26. Trust Funds
Trust funds held for outside parties
Security Deposits
The Council performs only a custodial role in respect of these monies. As these funds cannot be used by the Council, they are not brought to account in these financial statements.
Note 27. Reconciliation of Net Result for the year to NetCash from Operating Activities
Net result
Adjust for Non-cash itemsDepreciation and Amortisation
Losses/(Gains) recognised on fair value re-measurements through the P&L
Unwinding of Discount Rates on Reinstatement Provisions
Investing and development activitiesNet Losses/(Gains) on Disposal of AssetsCapital Grants
Capital Contributions
Changes in operating assets and liabilities:(Increase)/Decrease in ReceivablesIncrease/(Decrease) in Provision for Doubtful Debts(Increase)/Decrease in InventoriesIncrease/(Decrease) in Payables and AccrualsIncrease/(Decrease) in Other LiabilitiesIncrease/(Decrease) in Employee Leave EntitlementsIncrease/(Decrease) in Other Provisions
Net cash from Operating Activities
2019 2018Notes
2019 2018
(2,331)
11,012
$'000
1,452 1,328
$'000
(190)
1,452 1,328
12,883
3,437
264 532(3)
12,172
(2,539)
1
96
218
(2,881)
(26)
(769)
3,897
74
14,521
(120)
(2,966)
(1,765)
15,493
(4,155)
1,719
529
(6,222)
Investment Properties
Share of Net (Profits)/Losses of Associates
(8,811)
(5)3
591
827
18
(31)
(703)
984395
12,172 12,883
4,389
X13A0T
X13A1T
page 42
83 Lockyer Valley Regional Council

Financial Statements 2019
Lockyer Valley Regional Council
Notes to the Financial Statements for the year ended 30 June 2019
Note 28. Reconciliation of Liabilities arising from Finance Activities
Loans
Loans
Note 29. Events Occurring After Balance Sheet Date
Council is unaware of any material or significant events occurring after balance date that should be disclosed.
Note 30. Financial Instruments
Council has exposure to the following risks arising from financial instruments; (i) interest rate risk, (ii) credit risk,and (iii) liquidity risk.
This note provides information (both qualitative and quantitative) to assist statement users to evaluate the significance of financial instruments on the Council's financial position and financial performance,including the nature and extent of risks and how the Council manages these exposures.
Financial Risk ManagementCouncil is responsible for the establishment and review of the risk management framework, together with developing and monitoring risk management policies.
Council's Audit and Risk Management Committee (ARMC) has oversight of policies for overall risk management.
The Council's risk management policies are established to identify and analyse the risks faced, to set appropriate limits and controls and to monitor these risks and adherence against limits. The Council aims to manage volatilityto minimise potential adverse effects on the financial performance of the Council.
The ARMC oversees how management monitors compliance with the Council's risk management policiesand procedures, and reviews the adequacy of the risk managements framework in relation to the risks facedby the Council. The ARMC is assisted in its oversight role by internal audit. Internal audit undertakes both regularand ad hoc reviews of risk management controls and procedures, the results of which are reported to the ARMC.
Council does not enter into derivatives.
30-Jun-19ChangesCashflows30-Jun-18As atNon-CashAs at
$'000$'000$'000$'000
24,51426,330 (1,816) - 24,514
(1,816)26,330
Council
-
As at Non-Cash As at30-Jun-17 Cashflows Changes 30-Jun-18
$'000 $'000 $'000 $'000
32,450 (6,120) - 26,33032,450 (6,120) - 26,330
X13A2T
X13A3T
X13A4T
X13A5T
page 43
84Financial Statements 2018–2019

Financial Statements 2019
Lockyer Valley Regional Council
Notes to the Financial Statements for the year ended 30 June 2019
Note 30. Financial Instruments (continued)
Credit Risk ExposureCredit risk is the risk of financial loss if a counterparty to a financial instrument fails to meet its contractual obligations. These obligations arise principally from the Council's investments and receivables from customers.
Exposure to credit risk is managed through regular analysis of credit counterparty ability to meet payment obligations. The carrying amount of financial assets represents the maximum credit exposure.
Investments in financial instruments are required to be made with Queensland Treasury Corporation (QTC) or similar State/Commonwealth bodies or financial institutions in Australia, in line with the requirements of the Statutory Bodies Financial Arrangements Act 1982.
No collateral is held as security relating to the financial assets held by the Council.
The carrying amounts of financial assets at the end of the reporting period represent the maximum exposure to credit risk for the Council.
Cash and Cash EquivalentsThe Council may be exposed to credit risk through its investments in the QTC Cash Fund and QTC Working Capital Facility. The QTC Cash Fund is an asset management portfolio that invests with a wide range of high credit rated counterparties. Deposits with the QTC Cash Fund are capital guaranteed. Working Capital Facility deposits have a duration of one day and all investments are required to have a minimum credit rating of "A-", therefore the likelihood of the counterparty having capacity to meet its financial commitments is strong.
Other Financial AssetsOther investments are held with financial institutions, which are rated AA+ to BBB- based on rating agencyStandard and Poors ratings, and whilst not capital guaranteed, the likelihood of a credit failure is assessedas remote.
Trade and Other ReceivablesIn the case of rate receivables, the Council has the power to sell the property to recover any defaulted amounts. In effect this power protects the Council against credit risk in the case of defaults.
In other cases, the Council assesses the credit risk before providing goods or services and applies normal business credit protection procedures to minimise the risk.
By the nature of the Councils operations, there is a geographical concentration of risk in the Council's area. Because the area is largely residential and agricultural, there is also a concentration in the residential andagricultural sectors.
The Council does not require collateral in respect of trade and other receivables. The Council does not have trade receivables for which no loss allowance is recognised because of collateral.
page 44
85 Lockyer Valley Regional Council
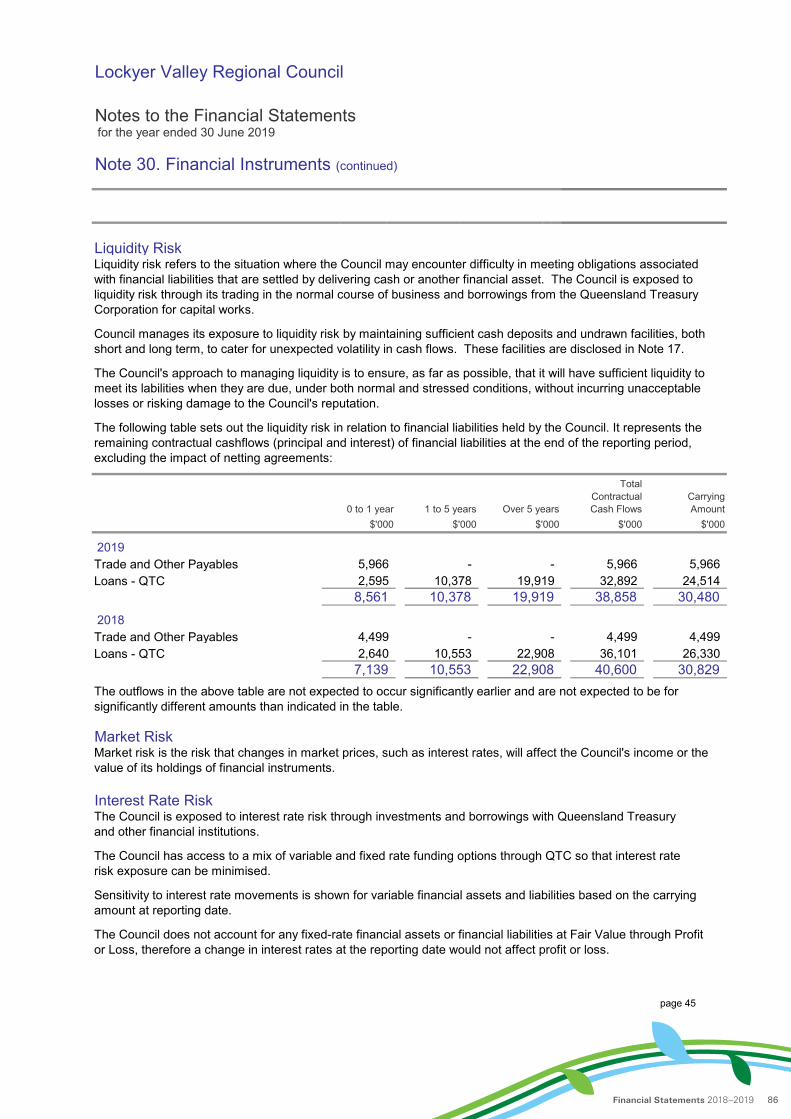
Financial Statements 2019
Lockyer Valley Regional Council
Notes to the Financial Statements for the year ended 30 June 2019
Note 30. Financial Instruments (continued)
Liquidity RiskLiquidity risk refers to the situation where the Council may encounter difficulty in meeting obligations associated with financial liabilities that are settled by delivering cash or another financial asset. The Council is exposed to liquidity risk through its trading in the normal course of business and borrowings from the Queensland Treasury Corporation for capital works.
Council manages its exposure to liquidity risk by maintaining sufficient cash deposits and undrawn facilities, bothshort and long term, to cater for unexpected volatility in cash flows. These facilities are disclosed in Note 17.
The Council's approach to managing liquidity is to ensure, as far as possible, that it will have sufficient liquidity to meet its labilities when they are due, under both normal and stressed conditions, without incurring unacceptable losses or risking damage to the Council's reputation.
The following table sets out the liquidity risk in relation to financial liabilities held by the Council. It represents the remaining contractual cashflows (principal and interest) of financial liabilities at the end of the reporting period, excluding the impact of netting agreements:
Trade and Other PayablesLoans - QTC
Trade and Other PayablesLoans - QTC
The outflows in the above table are not expected to occur significantly earlier and are not expected to be for significantly different amounts than indicated in the table.
Market RiskMarket risk is the risk that changes in market prices, such as interest rates, will affect the Council's income or the value of its holdings of financial instruments.
Interest Rate RiskThe Council is exposed to interest rate risk through investments and borrowings with Queensland Treasuryand other financial institutions.
The Council has access to a mix of variable and fixed rate funding options through QTC so that interest rate risk exposure can be minimised.
Sensitivity to interest rate movements is shown for variable financial assets and liabilities based on the carrying amount at reporting date.
The Council does not account for any fixed-rate financial assets or financial liabilities at Fair Value through Profit or Loss, therefore a change in interest rates at the reporting date would not affect profit or loss.
19,9195,966
$'000 $'000 $'000 $'000
22,908
0 to 1 year
10,37810,378
22,9082,640
8,561
$'000
Carrying Amount
5,966
10,55310,553
4,499
Total Contractual Cash Flows
5,966
Over 5 years1 to 5 years
7,139
2,595- -
4,499
2019
19,919 38,85824,514
36,101- - 4,499
32,892
2018
26,330
30,480
30,82940,600
page 45
86Financial Statements 2018–2019

Financial Statements 2019
Lockyer Valley Regional Council
Notes to the Financial Statements for the year ended 30 June 2019
Note 30. Financial Instruments (continued)
The following interest rate sensitivity analysis depicts what effect a reasonably possible change in interest rates (assumed to be 1%) would have on the profit and equity, based on the carrying values at the end of the reporting period. The calculation assumes that the change in interest rates would be held constant over the period.
QTC Cash FundOther InvestmentsLoans - QTCNet
QTC Cash FundOther InvestmentsLoans - QTCNet
In relation to the QTC loans held by the Council, the following has been applied:
QTC Generic Debt Pool - the generic debt pool products approximate a fixed rate loan. There is a negligible impact on interest sensitivity from changes in interest rates for generic debt pool borrowings.
Fair ValueThe fair value of trade and other receivables and payables is assumed to approximate the value of the original transaction, less any allowance for impairment.
The fair value of borrowings with QTC is based on the market value of debt outstanding. The market value of a debt obligation is the discounted value of future cash flows based on prevailing market rates and represents the amount required to be repaid if this was to occur at balance date. The market value of debt is provided by QTC and is discussed below/ disclosed in Note 17.
QTC applies a book rate approach in the management of debt and interest rate risk, to limit the impact of market value movements to clients' cost of funding. The book value represents the carrying value based on amortised cost using the effective interest method.
Amount 1% increase 1% decrease 1% increase 1% decrease
(14)(263) 263
128(91)91(91)
(97)
$'000
24526
14
Equity
(26)
(152)263
(128)
Net Result
$'000 $'000 $'000
245
152
26(245)
(97)
14
(152) 152
Net Carrying
$'000
15,200
2018
201912,8199,100
(26,330)
97
(24,514) (245)(26)
(263)
91128 (128)
(1,397) (14)
9,733 97
(2,595)
page 46
87 Lockyer Valley Regional Council
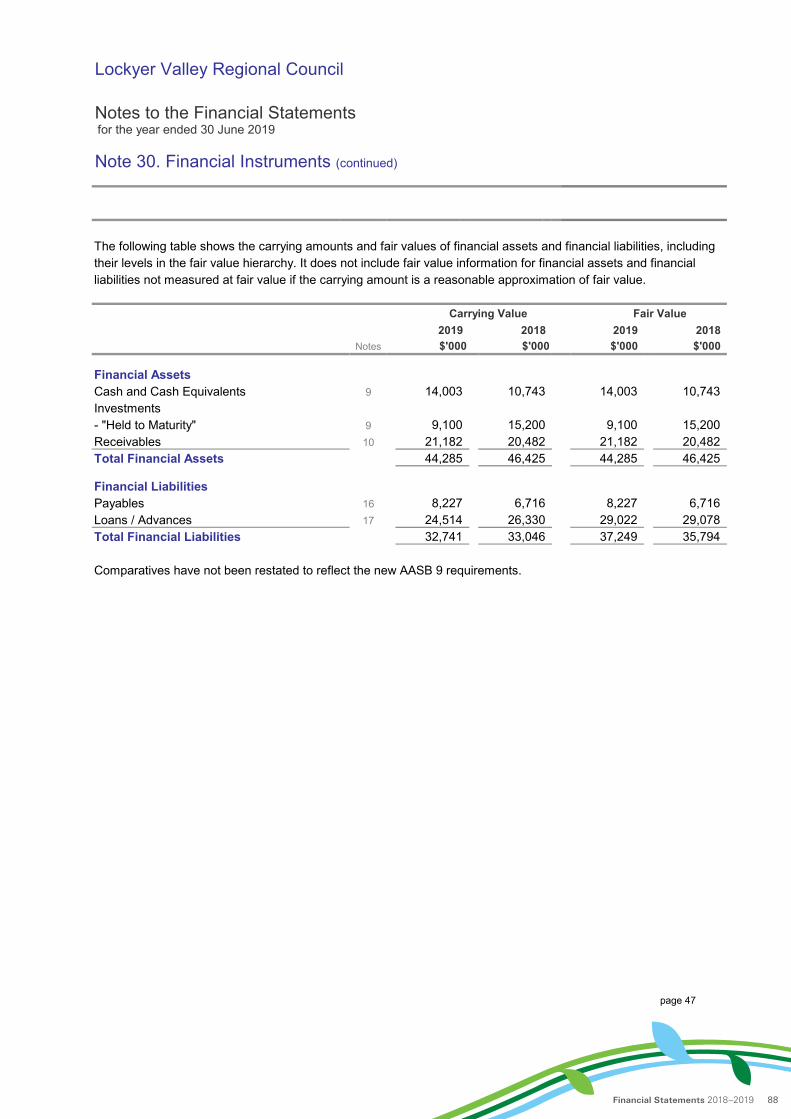
Financial Statements 2019
Lockyer Valley Regional Council
Notes to the Financial Statements for the year ended 30 June 2019
Note 30. Financial Instruments (continued)
The following table shows the carrying amounts and fair values of financial assets and financial liabilities, including their levels in the fair value hierarchy. It does not include fair value information for financial assets and financial liabilities not measured at fair value if the carrying amount is a reasonable approximation of fair value.
Financial AssetsCash and Cash EquivalentsInvestments- "Held to Maturity"ReceivablesTotal Financial Assets
Financial LiabilitiesPayablesLoans / AdvancesTotal Financial Liabilities
Comparatives have not been restated to reflect the new AASB 9 requirements.
29,022
44,285
15,20021,1829,100
46,42520,482
6,71629,078
8,227
2018
44,285
35,794
6,716
9
8,227
Carrying Value2018
10,743
$'000
Fair Value
$'000
14,003
2019
37,24926,33033,046
14,003
15,20020,48246,425
10 21,182
1732,74124,514
10,743
16
9
Notes
9
2019$'000 $'000
9,100
page 47
88Financial Statements 2018–2019

Financial Statements 2019
Lockyer Valley Regional Council
Notes to the Financial Statements for the year ended 30 June 2019
Note 31. Transactions with Related Parties
(a) Associates
Transactions with Associates
Queensland Urban Utilities- Water & Waste Water Charges- Sponsorship Received- Contribution to Water Collaborative- Private Works for QUU- Council Development Costs- Infrastructure ChargesCouncil of Mayors South East Queensland- Annual Membership Levy- SEQ Olympic Bid- Resilient Rivers Contribution- SEQ Regional Food and Agriculture Tourism Platform- Resilient Rivers Initiatives
All of the above transactions were in the normal course of business, and subject to standard terms and conditions.
(b) Other Related Parties
Transactions with Other Related Parties
- Printing- Merchandise- Transport Services
- Sporting Complex- Earthmoving Services
All of the above transactions were in the normal course of business, and subject to standard terms and conditions.
Any contracts with related parties have followed normal procurement and tender processes.
Key management personnel have disclosed any personal interest in relation to decision making around thesetransactions, or absented themselves from the decision making process. Similar transactions have occurred inprevious years, prior to the election or employment of Key Management Personnel.
-
5(180)408
2019
436(6)
(19)54
30
-
33
55
45
10
Amount oftransactionsduring year
$'000
43
-
2019
1 -
-33
15019
213
Purchase of Goods & Services from entities controlled by related parties of Key Management Personnel
88
Purchase of Goods & Services from entities controlled by Key Management Personnel
$'000
transactionsduring year
Amount of
2018
405(132)
3116
186(30)
6
367(6)
(33)
-
-
Amount oftransactionsduring year
$'000
2018$'000
transactionsduring year
Amount of
$'000 $'0002016
X14A0T
X14A2T
page 48
89 Lockyer Valley Regional Council

Financial Statements 2019
Lockyer Valley Regional Council
Notes to the Financial Statements for the year ended 30 June 2019
Note 31. Transactions with Related Parties (continued)
(c) Key Management Personnel
Transactions with Key Management PersonnelKey Management Personnel include the Councillors, Chief Executive Officer, Executive Managers,the Manager of Finance & Customer Services and the Manager of Planning. Other staff acting in those positions during the year have also been included for the period of time they were acting.
The compensation paid to Key Management Personnel comprises:
Short-Term Employee BenefitsPost-Employment BenefitsLong-Term BenefitsTotal
(d) Outstanding Balances
Council holds no contract retentions (2018: Nil) on behalf of a related party.
Included in the balances disclosed at (a) is an amount of $2,321 (2018: $8,674) which was outstanding atyear end. This is in accordance with Council's normal debt collection and creditor payment terms.
Included in the balances disclosed at (b) is an amount of $297 (2018: $59) which was outstanding at year end. This is in accordance with Council's normal creditor payment terms.
(e) Loans and Guarantees to/from Related Parties
Council holds no bank guarantees (2018: Nil) on behalf of a related party.
Council has provided a loan to QUU for $14.7 million (2018: $14.7 million). This is managed by Queensland Treasury Corporation. This loan is at commercial interest rates, and the capacity for QUU to repay this loan is assessed yearly.This loan is disclosed at Note 10.
(f) Commitments to/from Other Related Parties
There are no commitments at the end of the reporting period in relation to transactions with related parties.
(g) Transactions with Related Parties that have not been disclosed
Transactions on the same basis as ordinary citizens with the related parties have not been disclosed.These transactions include rates payment for properties owned within Council boundaries, dog registrations, andreimbursement of expenses for parking and conferences.
There are three related parties which are employees of Council but not Key Management Personnel. Their employmentterms and conditions are in accordance with Council's Enterprise Bargaining Agreement and standard recruitmentpractices and therefore have not been disclosed.
2016$'000 $'000
2,63716
2019$000
2,08521849
2,352
2018$000
2,363258
page 49
90Financial Statements 2018–2019

Financial Statements 2019
Lockyer Valley Regional Council
Notes to the Financial Statements for the year ended 30 June 2019
Note 32. Council Information and Contact Details
Principal Place of Business:26 Railway StreetGatton QLD 4343
Contact DetailsMailing Address: Opening Hours:PO Box 82 8:30am - 4:30pm - GattonGatton QLD 4343 9:00am - 5:00pm - Laidley
Monday to Friday
Telephone: 1300 005 872 Internet:Email:
Officers Elected MembersCHIEF EXECUTIVE OFFICER MAYORIan Church Tanya Milligan
COUNCILLORSJason Cook
AUDITORS Chris WilsonQueensland Audit Office Janice HolsteinPO Box 15396 Rick VelaCity East QLD 4002 Kathy McLean
Michael Hagan
Other InformationABN: 52 673 165 312
X15A0T
X15A1T
page 50
91 Lockyer Valley Regional Council

92Financial Statements 2018–2019

93 Lockyer Valley Regional Council
94Financial Statements 2018–2019

95 Lockyer Valley Regional Council

Financial Statements 2019
Lockyer Valley Regional Council
Current Year Financial Sustainability Statement for the year ended 30 June 2019
Measures of Financial Sustainability
Council's performance at 30 June 2019 against key financial ratios and targets.
Performance Indicators
1. Operating Surplus RatioNet Result (excluding capital items) (1)
Total Operating Revenue (excluding capital items) (2)
An indicator of the extent to which revenues raised cover operational expenses only or are available for capital funding purposes or other purposes.
2. Asset Sustainability RatioCapital Expenditure on the Replacement of Assets (renewals) (3)
Depreciation Expense
An approximation of the extent to which the infrastructure assets managed are being replaced as these reach the end of their useful lives.
3. Net Financial Liabilities RatioTotal Liabilities less Current AssetsTotal Operating Revenue (excluding capital items) (2)
An indicator of the extent to which the net financial liabilities can be serviced by its operating revenue.
Note 1 - Basis of Preparation
The current year financial sustainability statement is a special purpose statement prepared in accordance with the requirements of the Local Government Regulation 2012 and the Financial Management (Sustainability) Guideline2013. The amounts used to calculate the three reported measures are prepared on an accrual basis and are drawnfrom the Council's audited general purpose financial statements for the year ended 30 June 2019.
2019
more than 90%
4.74% 0 - 10%
58.95% less than 60%
113.67%
2019Actual Target
X18A0T
page 54
96Financial Statements 2018–2019

Financial Statements 2019
Lockyer Valley Regional Council
Current Year Financial Sustainability Statement (continued) for the year ended 30 June 2019
Measures of Financial Sustainability (continued)
Notes
(1) Includes only Recurrent Revenue and Recurrent Expenditure disclosed in the Income Statement. Excludes Capital Revenue Grants, Contributions, Donations and Subsidies received for capital acquisitions, Capital Income items such as Profit from the Sale of: Property, Plant and Equipment, Financial Assets, Real Estate and Investment Properties, and any Capital Expenditure such as Write Off of Assets, movements in Provisions for Restoration and Rehabilitation and Revaluation Decrements that hit the Statement of Comprehensive Income.
(2) Includes only Recurrent Revenue disclosed in the Income Statement. Excludes Capital Revenue Grants, Contributions Donations and Subsidies received for capital acquisitions. Also excludes any Capital Income items such as Profit from the Sale of: Property, Plant and Equipment, Financial Assets, Real Estate and Investment Properties.
(3) Asset Renewals are defined as expenditures on existing assets to return the assets to their original service potential (or useful life) while satisfying current construction and required standards. Such expenditure is required periodically to reinstate existing assets and may reduce operating and maintenance costs.
These ratios are the relevant measures of financial sustainability required to be reported under section 178(1) of the Local Government Regulation 2012 .
Definitions are sourced from the Financial Management (Sustainability) Guideline issued by the Department of Local Government, Community Recovery and Resilience.
2019 2019Actual Target
page 55
97 Lockyer Valley Regional Council

98Financial Statements 2018–2019

99 Lockyer Valley Regional Council

100Financial Statements 2018–2019

101 Lockyer Valley Regional Council

Fi
nanc
ial S
tate
men
ts 2
019
Lock
yer V
alle
y R
egio
nal C
ounc
il
Long
-Ter
m F
inan
cial
Sus
tain
abili
ty S
tate
men
t p
repa
red
as a
t 30
June
201
9
Targ
etAc
tual
2019
2019
2020
2021
2022
2023
2024
2025
2026
2027
2028
2029
Mea
sure
s of
Fin
anci
al S
usta
inab
ility
Cou
ncil's
per
form
ance
at 3
0 Ju
ne 2
019
agai
nst k
ey fi
nanc
ial
ratio
s an
d ta
rget
s.
Per
form
ance
Indi
cato
rs
1. O
pera
ting
Surp
lus
Rat
ioN
et R
esul
t (ex
clud
ing
capi
tal i
tem
s) (1
)
Tota
l Ope
ratin
g R
even
ue (e
xclu
ding
cap
ital i
tem
s) (2
)
An in
dica
tor o
f the
ext
ent t
o w
hich
reve
nues
rais
ed
cove
r ope
ratio
nal e
xpen
ses
only
or a
re a
vaila
ble
for c
apita
l fu
ndin
g pu
rpos
es o
r oth
er p
urpo
ses.
2. A
sset
Sus
tain
abili
ty R
atio
Cap
ital E
xpen
ditu
re o
n th
e R
epla
cem
ent o
f Ass
ets
(ren
ewal
s) (3
)
Dep
reci
atio
n Ex
pens
e
An a
ppro
xim
atio
n of
the
exte
nt to
whi
ch th
e in
frast
ruct
ure
asse
ts m
anag
ed a
re b
eing
repl
aced
as
thes
e re
ach
the
end
of th
eir u
sefu
l liv
es.
3. N
et F
inan
cial
Lia
bilit
ies
Rat
ioTo
tal L
iabi
litie
s le
ss C
urre
nt A
sset
sTo
tal O
pera
ting
Rev
enue
(exc
ludi
ng c
apita
l ite
ms)
(2)
An in
dica
tor o
f the
ext
ent t
o w
hich
the
net f
inan
cial
liab
ilitie
s ca
n be
ser
vice
d by
its
oper
atin
g re
venu
e.
Fore
cast
> 90
%
< 60
%
4.79
%0
- 10%
4.74
%4.
57%
4.29
%4.
47%
5.16
%6.
36%
5.71
%
92.5
2%11
3.67
%10
4.96
%10
1.20
%10
2.06
%10
5.32
%95
.09%
97.5
0%96
.25%
97.0
3%90
.58%
4.41
%7.
14%
4.12
%
8.00
%58
.95%
60.5
6%62
.16%
55.4
0%48
.10%
41.2
2%42
.57%
35.6
8%26
.91%
18.0
0%
X19A0T
page
59
102Financial Statements 2018–2019
Fi
nanc
ial S
tate
men
ts 2
019
Lock
yer V
alle
y R
egio
nal C
ounc
il
Long
-Ter
m F
inan
cial
Sus
tain
abili
ty S
tate
men
t (co
ntin
ued)
pre
pare
d as
at 3
0 Ju
ne 2
019
Targ
etAc
tual
2019
2019
00
00
00
00
00
Mea
sure
s of
Fin
anci
al S
usta
inab
ility
(con
tinue
d)
Lock
yer V
alle
y R
egio
nal C
ounc
il Fi
nanc
ial M
anag
emen
t Str
ateg
yTh
e 20
16 Q
ueen
slan
d Tr
easu
ry C
orpo
ratio
n C
redi
t (Q
TC) R
evie
w s
aw th
e C
ounc
il ra
ted
as W
eak
with
a N
eutra
l Out
look
. Thi
s ra
ting
is s
till r
elat
ed to
the
sign
ifica
nt in
crea
se in
op
erat
ing
cost
s an
d ca
pita
l exp
endi
ture
as
a re
sult
of th
e flo
odin
g ev
ents
exp
erie
nced
bet
wee
n 20
11 a
nd 2
013.
As
Cou
ncil
has
com
plet
ed th
e re
stor
atio
n w
orks
and
has
retu
rned
to a
pre
-dis
aste
r lev
el o
f ope
ratio
ns, t
he b
udge
t for
ecas
ts a
re n
ow re
flect
ing
a m
ore
stab
le le
vel o
f ope
ratio
ns. C
ounc
il w
ould
like
to s
ee it
s Q
TC ra
ting
retu
rnto
"mod
erat
e" o
ver t
he s
hort
term
, with
a lo
nger
term
ratin
g go
al o
f "so
und"
how
ever
dis
cuss
ions
with
QTC
hav
e in
dica
ted
that
ther
e is
no
inte
ntio
n to
con
duct
a fu
rther
revi
ew a
t thi
s tim
e. C
ounc
il's b
udge
ts, f
orec
asts
and
ratin
g st
rate
gies
stil
l aim
to a
ddre
ss th
e is
sues
rais
ed b
y Q
TC a
nd d
eliv
er a
fina
ncia
lly s
tabl
e fu
ture
.
Cou
ncil's
ado
pted
Lon
g Te
rm F
inan
cial
Pla
n 20
20 -
2029
pro
vide
s a
fram
ewor
k fo
r sec
urin
g its
fina
ncia
l sus
tain
abilit
y ov
er th
e lif
e of
the
fore
cast
per
iod.
To a
chie
ve th
is, C
ounc
il ai
ms
for:
- Ope
ratin
g su
rplu
ses
for t
he fo
reca
st p
erio
d.- S
moo
ther
incr
ease
s in
rate
s fro
m y
ear t
o ye
ar to
avo
id a
ny 'r
ate
shoc
k'.
- Red
uctio
ns in
deb
t bal
ance
s on
top
of th
e sc
hedu
led
paym
ents
.- R
evie
w o
f ope
ratio
ns a
nd s
ervi
ce le
vels
to fo
cus
on c
ore
serv
ices
.- I
mpr
oved
tran
spar
ency
and
con
sulta
tion
in d
evel
opin
g fu
ture
bud
gets
.
The
curr
ent f
orec
ast h
as th
e le
vels
of i
ncom
e an
d ex
pend
iture
at w
hat s
houl
d be
con
side
red
'nor
mal
' ope
ratio
ns.
It al
so s
ees
oper
atin
g su
rplu
ses
for t
he li
fe o
f the
long
term
pla
n an
d a
mor
e su
stai
nabl
e le
vel o
f cap
ital w
orks
whi
ch is
focu
ssed
on
rene
wal
s.
Cou
ncil
has
adop
ted
Ser
vice
Man
agem
ent P
lans
for i
ts m
ajor
ass
et c
lass
es. I
mpr
oved
ass
et d
ata
and
a pl
anne
d in
spec
tion
regi
me
will
ensu
re th
at C
ounc
il’s u
nder
stan
ding
of th
e co
nditi
on o
f its
ass
ets
is b
ette
r tha
n it
has
ever
bee
n. T
his
will
in tu
rn im
prov
e th
e ou
tput
s fro
m th
e se
rvic
e m
anag
emen
t pla
ns fo
r eac
h cl
ass
of a
sset
s an
d en
sure
am
ore
real
istic
fore
cast
of t
he re
quire
d le
vels
of e
xpen
ditu
re.
Not
es
(1) In
clud
es o
nly
Rec
urre
nt R
even
ue a
nd R
ecur
rent
Exp
endi
ture
dis
clos
ed in
the
Inco
me
Stat
emen
t. Ex
clud
es C
apita
l Rev
enue
Gra
nts,
Con
tribu
tions
, Don
atio
ns a
nd S
ubsi
dies
rece
ived
fo
r cap
ital a
cqui
sitio
ns, C
apita
l Inc
ome
item
s su
ch a
s Pr
ofit
from
the
Sale
of:
Prop
erty
, Pla
nt a
nd E
quip
men
t, Fi
nanc
ial A
sset
s, R
eal E
stat
e an
d In
vest
men
t Pro
perti
es, a
nd a
ny
Cap
ital E
xpen
ditu
re s
uch
as W
rite
Off
of A
sset
s, m
ovem
ents
in P
rovi
sion
s fo
r Res
tora
tion
and
Reh
abilit
atio
n an
d R
eval
uatio
n D
ecre
men
ts th
at h
it th
e St
atem
ent o
f Com
preh
ensi
ve
Inco
me.
(2) In
clud
es o
nly
Rec
urre
nt R
even
ue d
iscl
osed
in th
e In
com
e St
atem
ent.
Excl
udes
Cap
ital R
even
ue G
rant
s, C
ontri
butio
ns D
onat
ions
and
Sub
sidi
es re
ceiv
ed fo
r cap
ital a
cqui
sitio
ns.
A
lso
excl
udes
any
Cap
ital I
ncom
e ite
ms
such
as
Prof
it fro
m th
e Sa
le o
f: Pr
oper
ty, P
lant
and
Equ
ipm
ent,
Fina
ncia
l Ass
ets,
Rea
l Est
ate
and
Inve
stm
ent P
rope
rties
.(3
) Ass
et R
enew
als
are
defin
ed a
s ex
pend
iture
s on
exi
stin
g as
sets
to re
turn
the
asse
ts to
thei
r orig
inal
ser
vice
pot
entia
l (or
use
ful l
ife) w
hile
sat
isfy
ing
curr
ent c
onst
ruct
ion
and
re
quire
d st
anda
rds.
Suc
h ex
pend
iture
is re
quire
d pe
riodi
cally
to re
inst
ate
exis
ting
asse
ts a
nd m
ay re
duce
ope
ratin
g an
d m
aint
enan
ce c
osts
.
T
hese
ratio
s ar
e th
e re
leva
nt m
easu
res
of fi
nanc
ial s
usta
inab
ility
requ
ired
to b
e re
porte
d un
der s
ectio
n 17
8(1)
of t
he L
ocal
Gov
ernm
ent R
egul
atio
n 20
12.
D
efin
ition
s ar
e so
urce
d fro
m th
e Fi
nanc
ial M
anag
emen
t (S
usta
inab
ility
) Gui
delin
e is
sued
by
the
Dep
artm
ent o
f Loc
al G
over
nmen
t, C
omm
unity
Rec
over
y an
d R
esili
ence
.
Fore
cast
pa
Financial Stateme
page
60
103 Lockyer Valley Regional Council

104Financial Statements 2018–2019
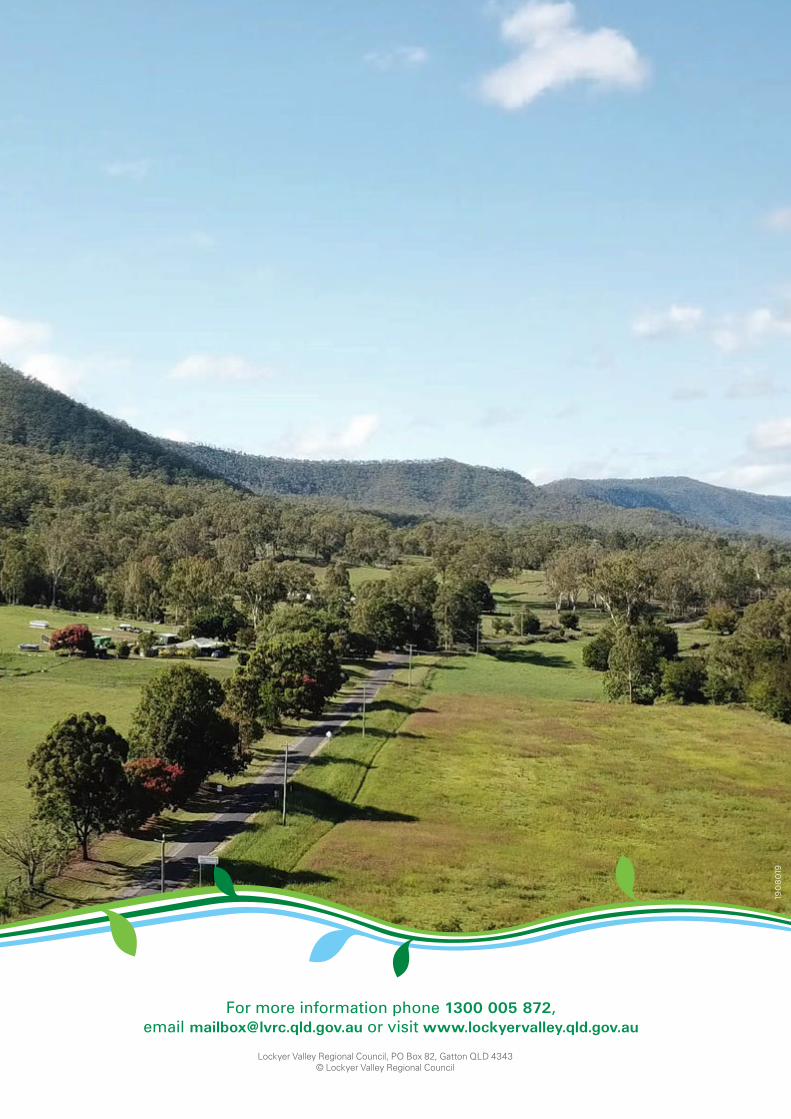
For more information phone 1300 005 872, email [email protected] or visit www.lockyervalley.qld.gov.au
Lockyer Valley Regional Council, PO Box 82, Gatton QLD 4343© Lockyer Valley Regional Council
1908019
Related Documents