Location and travel behaviour An analysis based on geocoded travel surveys and studies of changes in urban land use COST Action 355 – WATCH Working Group 2 ”The Automobile”, Friday 24 June 2005 Centrum Dopravního Výzkumu (CDV) Brno, Czech Republic Øystein Engebretsen Institute of Transport Economics P.O. Box 6110 Etterstad, N-0602 Oslo, Norway

Location and travel behaviour An analysis based on geocoded travel surveys and studies of changes in urban land use COST Action 355 – WATCH Working Group.
Dec 22, 2015
Welcome message from author
This document is posted to help you gain knowledge. Please leave a comment to let me know what you think about it! Share it to your friends and learn new things together.
Transcript

Location and travel behaviour
An analysis based on geocoded travel surveys and studies of changes in urban
land use
COST Action 355 – WATCHWorking Group 2 ”The Automobile”, Friday 24 June 2005
Centrum Dopravního Výzkumu (CDV)Brno, Czech Republic
Øystein EngebretsenInstitute of Transport Economics
P.O. Box 6110 Etterstad, N-0602 Oslo, Norway

2
Location and daily mobility
• The aim of the presentation is to discuss the interaction between location and daily mobility in cities.
• And some consequences of changes in land use.
• The presentation is based on results from an analysis of travel behaviour in three Norwegian cities: Oslo, Bergen, and Trondheim.

3
Photo: Bergen: St. Paul, Oslo: Oslo Havn, Trondheim: Ole P Rørvik, Aune forlag
Oslo 812 000 inhabitants
Bergen 214 000 inhabitants
Trondheim 147 000 inhabitants

4
1. The national travel survey
2. Three local travel surveys
3. Population statistics and employment data for statistical wards
4. Public register of ground properties, addresses, and buildings
5. Former land accounting system
The presentation is mainly based on data from:

5
Institute of Transport Economics has conducted all the national travel surveys; 1985, 1992, 1998 and 2001.
The 2005-survey is in progress.
The results in this presentation are from the 2001-survey.
National travel surveys:

6
Give information on trips made on a certain day (daily mobility), and any long distance trip (> 100 km) undertaken during the last month before the interview.
The objective is to examine travel patterns and travel activities in the population:
- how often people travel
- why people travel
- how they travel
- differences with respect to age, gender, place of residence, income etc.
The 2001-survey: More than 20.000 people 13 years and older (randomly selected).
National travel surveys:

7
Parents home
Home
Day-care centre
Workplace
Shop
12
34
5
6
Trips: Every transfer from one place to another outside the person’s own home, school, workplace or cottage, regardless of distance, purpose or mode of transport.
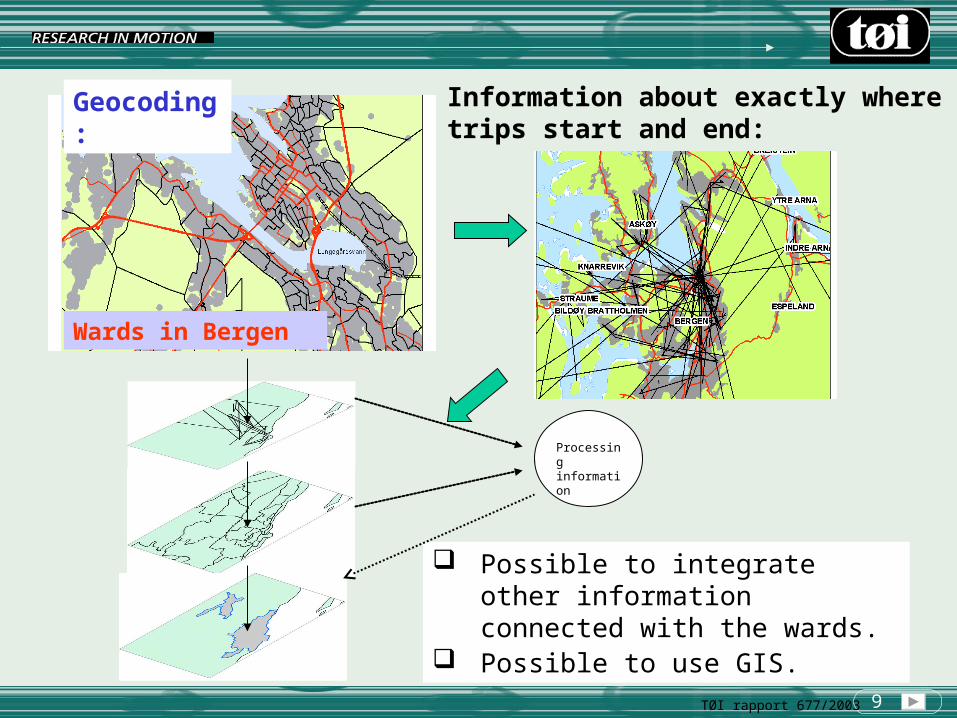
Since 2001: Geocoding, which makes analysis of land use and transport possible. Geocoding means that the origins and destinations of each trip, as well as the locations of people’s homes and workplaces, are located to statistical wards.
Statistical wards
1. Care-related2. To work3. Shopping trip4. Shopping trip5. Private visit6. Private visit

8
Norway is divided into approximately 14 500 wards - areas as homogeneous as possible with respect to population size, communication and building structure.
The units are fairly small. In Oslo, Bergen, and Trondheim (about 2000 wards) the average size is less than 1 sq. km, the mean population 400-600 inhabitants (max 3500 inhabitants).
Statistical wards: Smallest areas for presenting statistics (basic statistical unit).
In rural areas, the extension may be several square kilometres, but the settlement in the wards is still usually relatively concentrated.
N.B different scales
9
Geocoding: Information about exactly where trips start and end:
Wards in Bergen
Possible to integrate other information connected with the wards.
Possible to use GIS.
Processing information
TØI rapport 677/2003

10
The main data source has been:
Database containing merged data from five large travel surveys conducted in 2001:
A. The national travel survey.
B. Local surveys covering - the counties of Oslo and Akershus - the county of Vestfold - the region of Bergen - the region of Trondheim.
Total: 53.000 interviews 177.000 trips
Half of them are applied here.
National travel survey
Vestfold
Oslo and Akershus
The region of Trondheim
The region of Bergen
Local surveys:

11
0123456789
101112
0-5 6 7 8 9 10 11 12 13 14 15 16 17 18 19 20 21 22 23Time
PercentLeisure activities
To/from day-care centre etc
Shopping
To/from work - day-care centre en route
To/from work - shopping en route
To/from work - without stop
Trip purposes Oslo, Bergen and Trondheim. Average workdays
To/from work - without stop 32 % To/from work - shopping en route 10 % 48 % To/from work - day-care centre en route 5 % Shopping 20 % To/from day-care centre etc 7 % Leisure activities 26 %

12
Transport mode: Car use dominates – even on workdays – day and night.
Trip distribution over 24 hours on workdays (Monday-Friday) in Oslo:
13
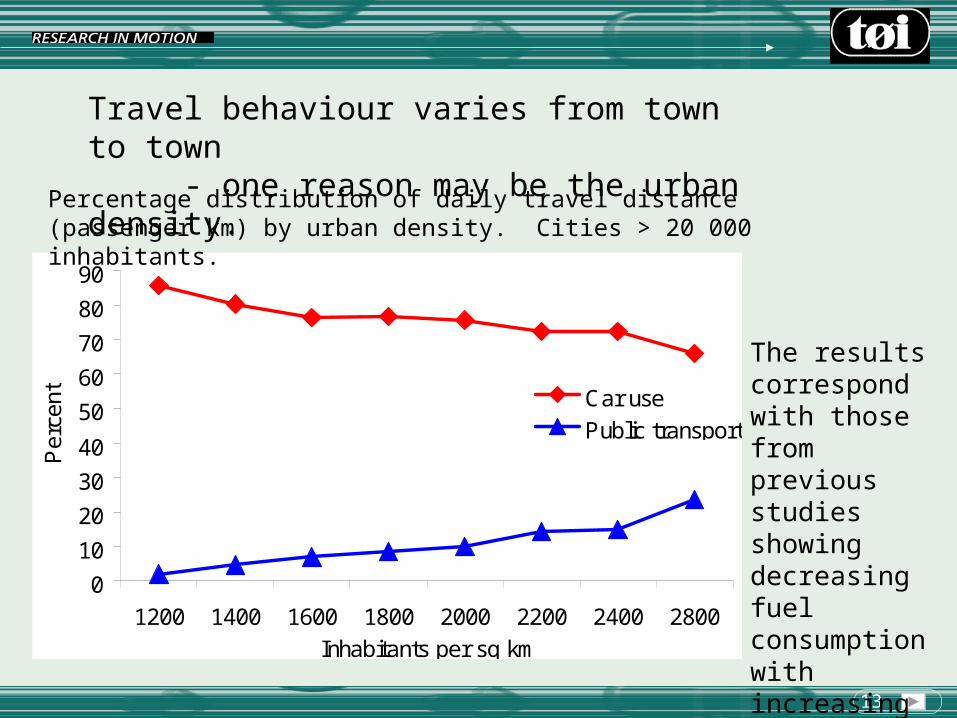
Travel behaviour varies from town to town - one reason may be the urban density.
0
10
20
30
40
50
60
70
80
90
1200 1400 1600 1800 2000 2200 2400 2800
Inhabitants per sq km
Per
cent Car use
Public transport
Percentage distribution of daily travel distance (passenger km) by urban density. Cities > 20 000 inhabitants.
The results correspond with those from previous studies showing decreasing fuel consumption with increasing urban density

14
Travel behaviour varies more within cities than between cities.

15
Travel behaviour varies more within cities than between cities.
Percent travelling by car on trips starting at home. Monday-Friday.

16
Percent travelling by car on trips starting at home. Monday-Friday.

17
0
10
20
30
40
50
60
70
80
90
1 2 3 4 6 8 10 15 20
Km to town centre
By
car
- %
0
5
10
15
20
25
30
35
40
Km
per
day
Oslo - % by car Bergen - % by car Trondheim - % by car
Oslo - mean km Bergen - mean km Trondheim - mean km
% km
People living in central areas use their cars substantially less often than people living in other parts of the city.
In addition people living in central areas travel on average shorter distances during the day.

18
Why are inner city residents so different?
Only about half the respondents in the inner city live in households with access to a car as opposed to 80-90 percent in the rest of the city.
Still, the most important explanation for less car use is that inner city residents have most of their activities in the town centre, thus a preponderance of walking and cycling as a consequence of short distances.
An important observation is that when the residents in these areas travel to destinations in the outer areas of the city, their car use is almost at the average level for the city as a whole.
Location of trip destination is therefore an important factor in the choice of mode of transport.
19
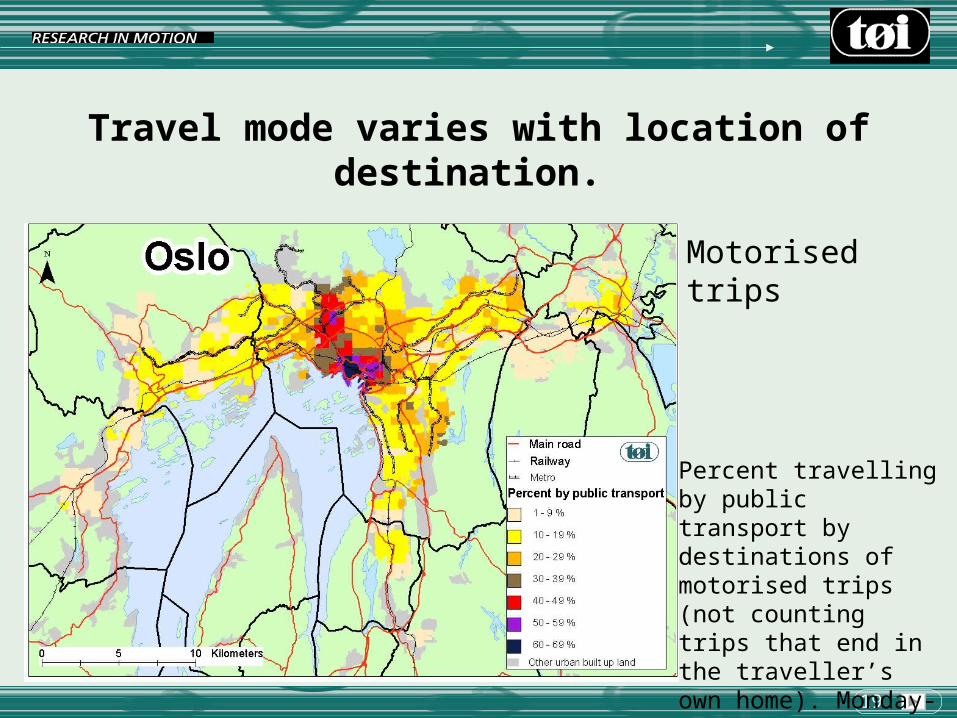
Travel mode varies with location of destination.
Percent travelling by public transport by destinations of motorised trips (not counting trips that end in the traveller’s own home). Monday-
Friday.
Motorised trips

20
Percent travelling by public transport by destinations of motorised trips (not counting trips that end in the traveller’s own home). Monday-
Friday.
21
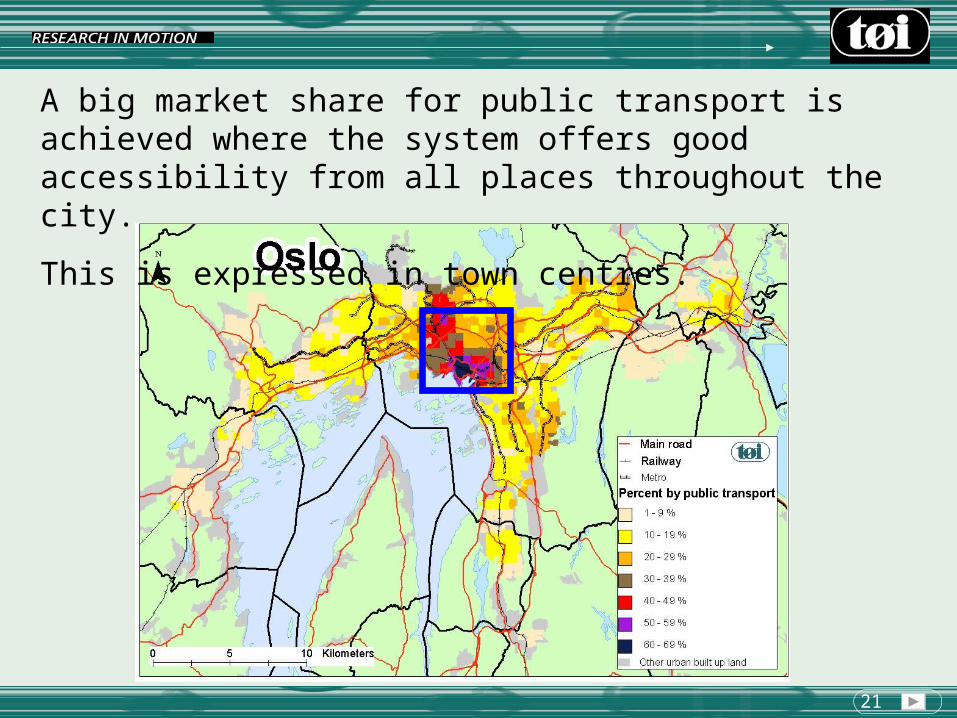
A big market share for public transport is achieved where the system offers good accessibility from all places throughout the city.
This is expressed in town centres.

22
Detail of the town centre of Oslo

23
Public transport plays only a limited role in most areas in the city.
Although accessibility by public transport is fairly good in some areas outside the town centres, car traffic predominates.
Conclusion: Good accessibility by public transport is not a sufficient condition.
It must to some extent be problematic to use the car.
However, the standard of the road system in Norwegian cities is high. And the tolls in the toll-rings are to low.

24
In Oslo for instance you can drive on an underground road network.
Tunnel
The only factors that hinder car use today are lack of parking space and high car parking costs.
Parking problems is mainly concentrated to the town centre and surrounding areas.
25
0 %
10 %
20 %
30 %
40 %
50 %
60 %
70 %
80 %
1,0 1,2 1,4 1,6 1,8 2,0 2,2 2,4 2,6 2,8 3,0Accessibility by public transport
(travelling time by public transport in proportion to travelling time by car)
Percent by public transport
Access to free parking
No access to free parking
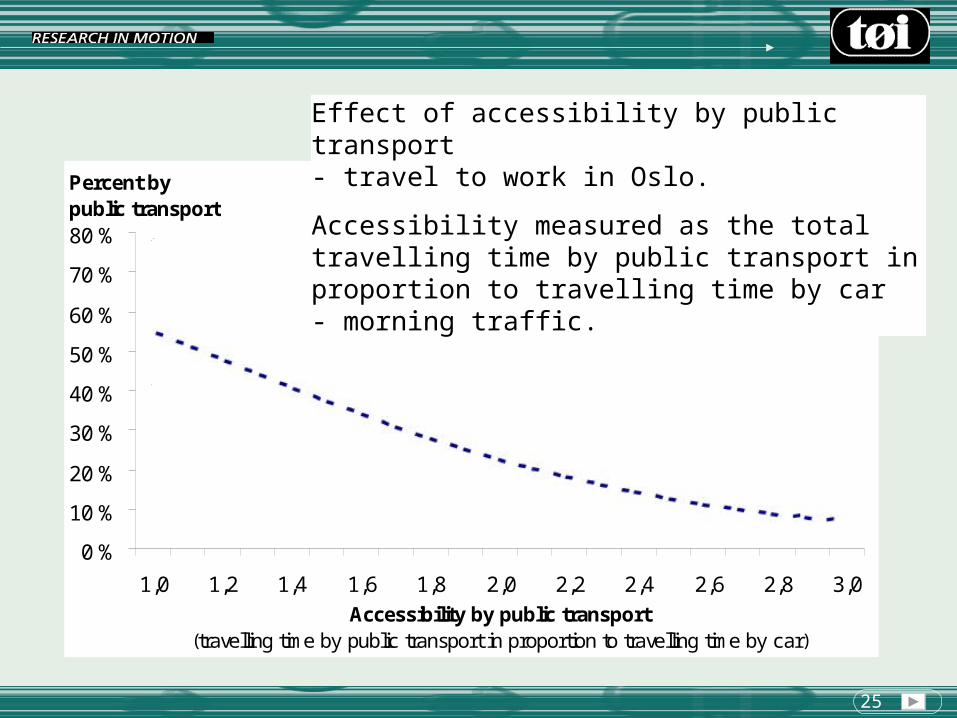
Effect of accessibility by public transport - travel to work in Oslo.
Accessibility measured as the total travelling time by public transport in proportion to travelling time by car - morning traffic.

26
0 %
10 %
20 %
30 %
40 %
50 %
60 %
70 %
80 %
1,0 1,2 1,4 1,6 1,8 2,0 2,2 2,4 2,6 2,8 3,0Accessibility by public transport
(travelling time by public transport in proportion to travelling time by car)
Percent by public transport
Access to free parking
No access to free parking
Effect of accessibility by public transport and access to parking - travel to work in Oslo.
Access to parking is defined as free parking at the workplace.

27
About half of all travel on workdays is commuting, so reducing car dependency among commuters should be an important measure in any sustainable urban transport policy.
Necessary to increase the standard of the public transport system - supplemented by a strict parking policy.
Developing sufficient accessibility by public transport is not feasible everywhere.
Efforts have to be concentrated in certain intersections in the public transport network.
The challenge is therefore to develop a localization policy for concentrating business activities, with many employees and/or many visitors around these nodes.

28
Any strategy designed to reduce dependency on the car in urban traffic should take into consideration at least three elements:
1. increased accessibility by public transport (in given areas),
2. a more restrictive car parking policy (in given areas), and
3. a policy for locating business activities with many employees and/or visitors to areas with high accessibility by public transport.
The same strategy as in the Dutch planning guidelines entitled “The Right Business at the Right Place” or the ABC policy - implemented in 1991.

29
A
C
High
B
CR
Accessibility by carLow
Accessibility by public transport
High
Low
Activities with many employees and/or visitors
Activities with few employees and few visitorsOr businesses with high car dependency
Limited access to parking
“The Right Business at the Right Place” or ABC policy - implemented in 1991. Accessibility profiles of areas and mobility profiles of activities.

30
Increasing the use of public transport in Norwegian cities is difficult. Almost everywhere the car is the fastest mode of transport. Public transport can compete with the car only in town centres.
The problem is that 70-80 percent of the destinations for car trips are in other parts of the city (not counting trips that end in the traveller’s own home).

31
The same pattern in Bergen and Trondheim
Bergen
Trondheim
32
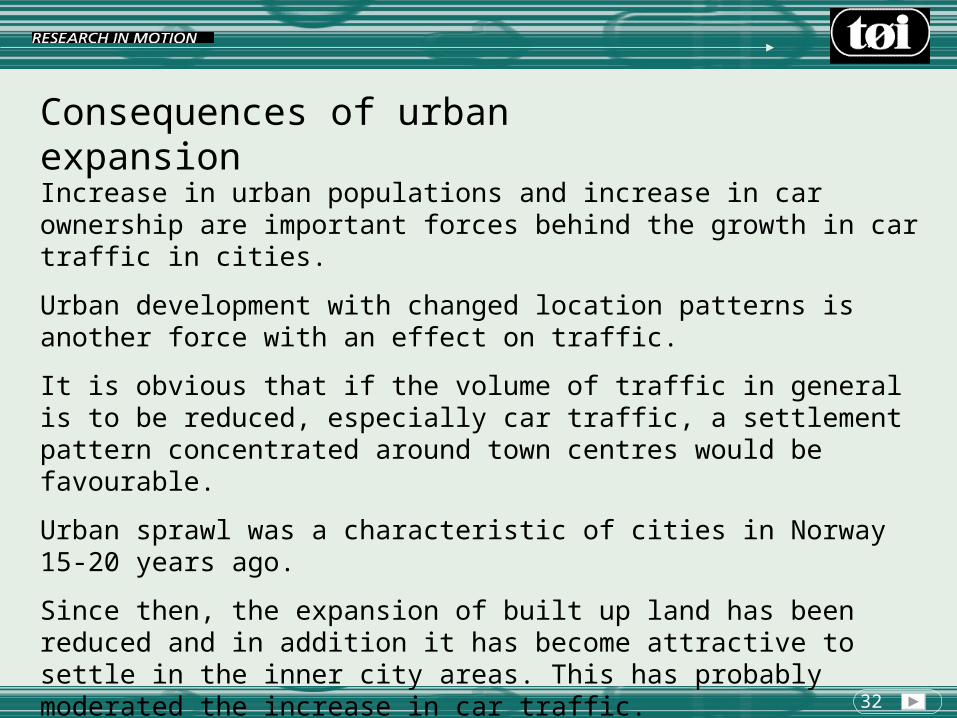
Increase in urban populations and increase in car ownership are important forces behind the growth in car traffic in cities.
Urban development with changed location patterns is another force with an effect on traffic.
It is obvious that if the volume of traffic in general is to be reduced, especially car traffic, a settlement pattern concentrated around town centres would be favourable.
Urban sprawl was a characteristic of cities in Norway 15-20 years ago.
Since then, the expansion of built up land has been reduced and in addition it has become attractive to settle in the inner city areas. This has probably moderated the increase in car traffic.
Consequences of urban expansion
33
0,0
0,5
1,0
1,5
2,0
1960-1980 1980-1992 2000-2005
Ann
ual g
row
th -
per
cent Area Population
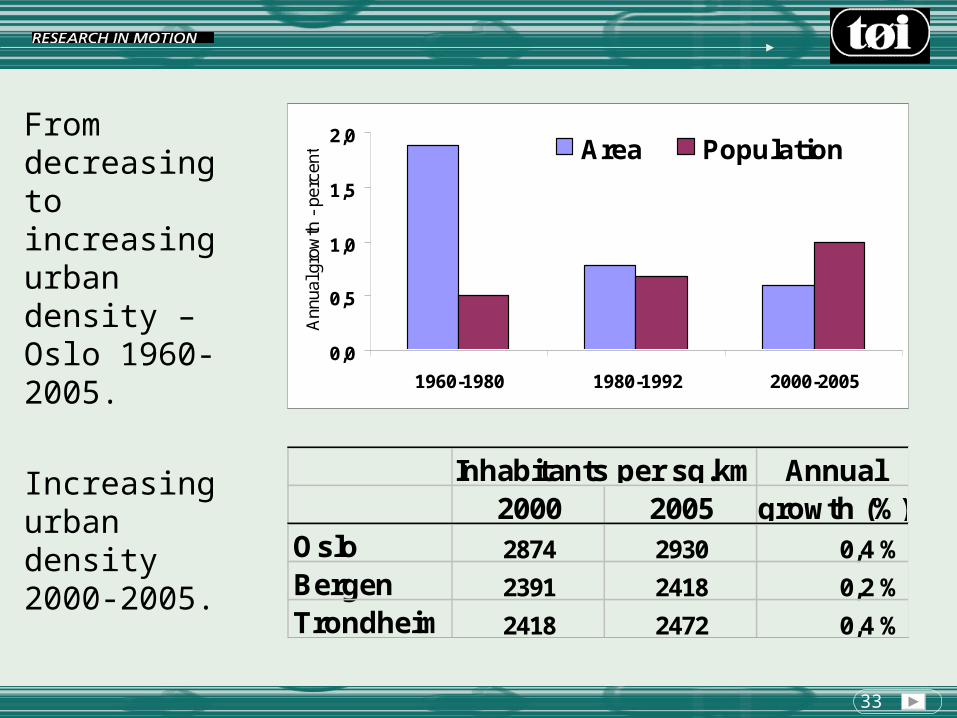
From decreasing to increasing urban density – Oslo 1960-2005.
Annual2000 2005 growth (%)
Oslo 2874 2930 0,4 %
Bergen 2391 2418 0,2 %
Trondheim 2418 2472 0,4 %
Inhabitants per sq.kmIncreasing urban density 2000-2005.

34
Changes in population by distances from town centre 1980-2001
-15000
-10000
-5000
0
5000
10000
15000
20000
0 - 2 - 4 - 6 - 8 - 10 - 15+
Km to town centre
1980-88 1989-94 1995-2001
Oslo
-6000
-4000
-2000
0
2000
4000
6000
0 - 2 - 4 - 6 - 8 - 10 - 15+
Km to town centre
1980-88 1989-94 1995-2001
-6000
-4000
-2000
0
2000
4000
6000
0 - 2 - 4 - 6 - 8 - 10+
Km to town centre
1980-88 1989-94 1995-2001
Trondheim
Bergen

35
The reurbanization has has probably moderated the increase in car traffic.
Nevertheless, car traffic is increasing.
One reason could be the re-location of workplaces and other activities.
We shall use the Oslo region as an example:
20 years ago about half the workplaces in the city of Oslo were located within 3 km of the town centre.
In the years since then, there has been a trend of businesses moving from the central areas to the urban fringes. Often to areas with limited accessibility by public transport.
36
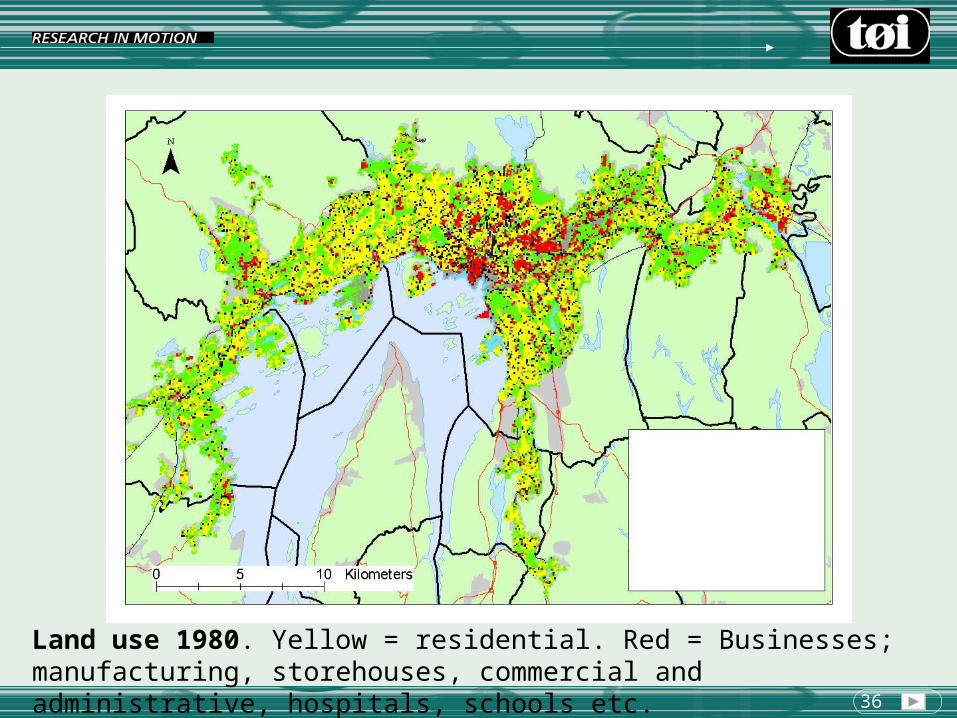
Land use 1980. Yellow = residential. Red = Businesses; manufacturing, storehouses, commercial and administrative, hospitals, schools etc.

37
New business buildings (including hospitals) with at least 500 square metres of floor space built 1985- 2004. Square metres floor space. Oslo.

38
The outcome:
An increasing share of workplaces in car-based areas causing a growing auto dependency among commuters.
0 %
5 %
10 %
15 %
20 %
25 %
30 %
35 %
20-29 30-39 40-49 50-59 60-69 70-79 80 +
Average commuting by car (%) to the zone (2001)
1986 2001
Distribution of work places (%)
Distribution of work places by 1986 and 2001 by zone. Zones defined by average commuting by car by 2001. Oslo. Percent.

39
Changes in localization pattern for workplaces in the city of Oslo may have increased the number of car trips to work by 0.5 percent per year over the past 15-20 years.
In the same period, population growth has been about 1.0 percent per year.
The combined effect of these two components would be an expected growth in commuting by car of approximately 1.7 percent each year.
This corresponds with the increase since 1990 in the number of private cars in the region of about 1.7 percent and the growth in car traffic of 1.9 percent.

40
The results confirm previous findings that travel behaviour is influenced by residential location. An equally important factor is the location of workplaces and other business activities.
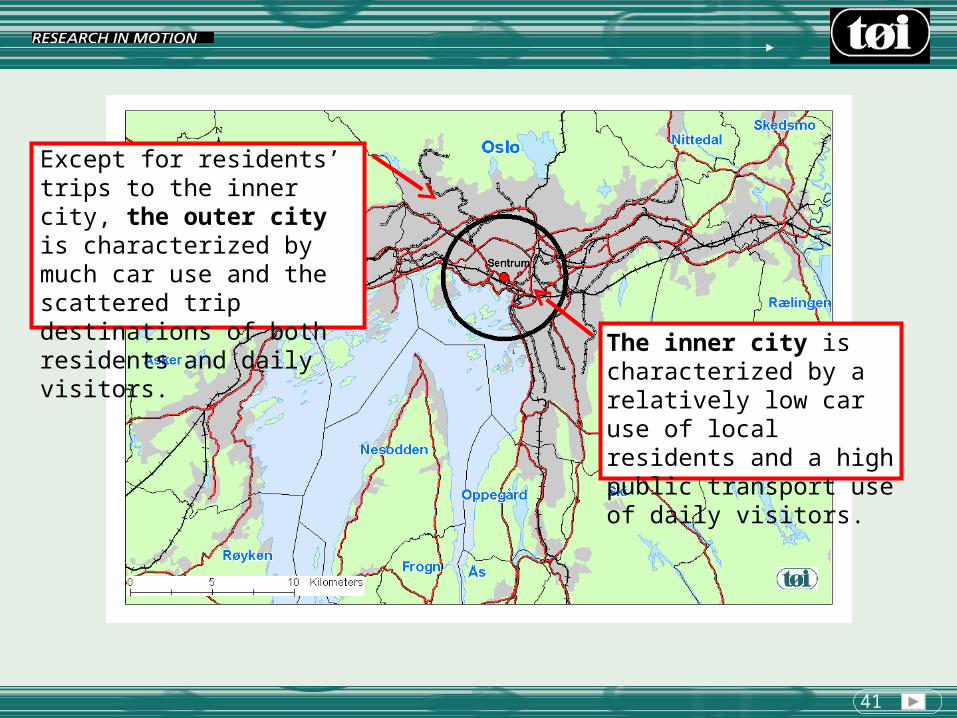
Some conclusions can be drawn associated with possible political measures. The strategies are associated with a division of the cities into two main zones – “the inner city” and “the outer city”.
Conclusions and challenges
41
The inner city is characterized by a relatively low car use of local residents and a high public transport use of daily visitors.
Except for residents’ trips to the inner city, the outer city is characterized by much car use and the scattered trip destinations of both residents and daily visitors.
42
If the measure is to reduce the total volume of car traffic, the focus should be car trips to destinations in the outer city. These represent 40 percent of all trips (all modes).
Because it is difficult to operate a public transport network that can compete with the flexibility of the car for trips to the existing dispersed destinations, the challenge is working out a land-use policy for concentration of business activities and other activities in the outer city to a limited number of nodes that can be more effectively connected by an upgraded public transport system.
Possible political measures:

43
Possible political measures:
If the measure is aimed at reducing local environmental and traffic problems, the focus should be on car trips to the inner city.
Even though public transport has a high market share of travel to this area, most of the traffic is still by car.
Twenty percent of total passenger kilometres in each of the cities is the result of car trips to the inner city.
Many instruments are possible to influence car traffic to the central areas, ranging from improved public transport to restrictions on car use (e.g. road pricing and car parking restrictions).
Related Documents