1 Location and transport effects of high occupancy vehicle and bus lanes in Madrid 45 th Congress of the European Regional Science Association, 23-27/08/2005, Amsterdam Paul Pfaffenbichler Centro de Investigación del Transporte-TRANSyT-UPM E.T.S.I. Caminos, Canales y Puertos Ciudad Universitaria - 28040 Madrid (España) [email protected] Miguel Mateos Centro de Estudios y de Experimentación de Obras Públicas (CEDEX) Alfonso XII, 3-5 - 28014 Madrid (España) [email protected] Abstract: Sustainability is one of today's major challenges. A widely accepted definition of sustainability is based on intergenerational equity. Cities worldwide do not fulfil the requirements of sustainability. The work presented here investigates whether transport policies in Madrid contribute to the objective of sustainability. The “Comunidad de Madrid” is situated in the heart of Spain. It covers an area of 8,000 km 2 . About 5.4 million people live within the whole region. The city of Madrid itself has about 2.9 million inhabitants. The situation is characterised by a rapid development of housing and businesses in the outskirts of the city. Traffic is characterised by a high share of commuting into the core city. Although Madrid has an efficient metro line system, this results in a high level of peak hour congestion. As well land use as transport do not fulfil the requirements of sustainability. Different measures were proposed and realised to remedy the current situation. One of these measures is a bus and high occupancy vehicle (HOV) lane. The existing HOV lane covers a 16 kilometres long stretch of the highway A6. The Spanish ministry of public works furthermore proposes bus lanes on all radial highways. The strategic, dynamic land use and transport interaction model MARS (Metropolitan Activity Relocation Simulator) is used to assess the effects of this proposal. MARS covers the total “Comunidad de Madrid”. Effects on land use and regional travel patterns are predicted with this model. A modified cost-benefit-analysis is used to assess the potential of the bus lanes. Keywords: Sustainability, HOV lanes, bus lanes, land use and transport model, assessment

Welcome message from author
This document is posted to help you gain knowledge. Please leave a comment to let me know what you think about it! Share it to your friends and learn new things together.
Transcript

1
Location and transport effects of high occupancy vehicle and bus lanes in Madrid
45th Congress of the European Regional Science Association, 23-27/08/2005, Amsterdam
Paul Pfaffenbichler
Centro de Investigación del Transporte-TRANSyT-UPM E.T.S.I. Caminos, Canales y Puertos Ciudad Universitaria - 28040 Madrid (España) [email protected]
Miguel Mateos
Centro de Estudios y de Experimentación de Obras Públicas (CEDEX) Alfonso XII, 3-5 - 28014 Madrid (España) [email protected]
Abstract:
Sustainability is one of today's major challenges. A widely accepted definition of
sustainability is based on intergenerational equity. Cities worldwide do not fulfil the
requirements of sustainability. The work presented here investigates whether transport
policies in Madrid contribute to the objective of sustainability. The “Comunidad de Madrid”
is situated in the heart of Spain. It covers an area of 8,000 km2. About 5.4 million people live
within the whole region. The city of Madrid itself has about 2.9 million inhabitants. The
situation is characterised by a rapid development of housing and businesses in the outskirts of
the city. Traffic is characterised by a high share of commuting into the core city. Although
Madrid has an efficient metro line system, this results in a high level of peak hour congestion.
As well land use as transport do not fulfil the requirements of sustainability. Different
measures were proposed and realised to remedy the current situation. One of these measures
is a bus and high occupancy vehicle (HOV) lane. The existing HOV lane covers a 16
kilometres long stretch of the highway A6. The Spanish ministry of public works furthermore
proposes bus lanes on all radial highways. The strategic, dynamic land use and transport
interaction model MARS (Metropolitan Activity Relocation Simulator) is used to assess the
effects of this proposal. MARS covers the total “Comunidad de Madrid”. Effects on land use
and regional travel patterns are predicted with this model. A modified cost-benefit-analysis is
used to assess the potential of the bus lanes.
Keywords: Sustainability, HOV lanes, bus lanes, land use and transport model, assessment

2
Introduction
Sustainability is one of today's major challenges. A widely accepted definition of
sustainability is based on intergenerational equity and a set of sub objectives. Numerous
studies provide evidence that cities worldwide do not fulfil the requirements of sustainability.
The work presented here investigates whether transport policies of the municipality of Madrid
contribute to the high level objective of sustainability.
The “Comunidad de Madrid” is situated in the heart of Spain. It covers an area of about 8,000
km2. About 5.4 million people live within the whole region. The city of Madrid itself has
about 2.9 million inhabitants. The situation is characterised by a rapid development of
housing and businesses in the surroundings of the city. Traffic is characterised by a high share
of people commuting into the core city. Although Madrid has an efficient metro line system,
this results in a high level of peak hour congestion. The bus based public transport is heavily
affected by this congestion. The Madrid land use and transport system does not fulfil the
requirements of sustainability.
To remedy the current situation different instruments and measures have been proposed and
realised. One of these is a bus and high occupancy vehicle (HOV) lane. The HOV lane covers
a 16 kilometres long stretch of the highway A6 and was opened in the year 1995. Recently the
central government suggested to construct more than 100 kilometres bus lanes on all radial
highways entering Madrid. The strategic, dynamic land use and transport interaction model
MARS (Metropolitan Activity Relocation Simulator) is used to assess the effects of this
proposal. MARS covers the whole “Comunidad de Madrid”. Effects on land use and regional
travel patterns are predicted with this model. The potential of the application of the HOV/bus
lanes to all radial highways is assed by using a modified cost benefit analysis.
The objective of sustainability
One of several possible definitions of sustainability is equity between today’s and future
generations (May et al. 2003). That means that the activities of today’s generation should not
limit or hinder the opportunities of future generations. Another definition is that a sustainable
system “does not leave any negative impacts or costs for future generations to solve or bear –
present builders and users of the system should pay such costs today” (Schipper et al. 2005)
p. 621. Basically these two definitions are equivalent. The use of a set of sub-objectives is
suggested to make them operational (May et al. 2003). Two of these sub-objectives are
careful treatment of non-renewable resources and protection of the environment (May et al.

3
2003). The following section “Indicators of sustainability” defines indicators which are
suitable to measure these two sub-objectives. An important aspect in the selection of the sub-
objectives and indicators is that the integrated land use and transport model MARS, employed
later in the case study, has to be able to calculate them in a reasonable way. E.g. the sub-
objective “Contribution to economic growth” cannot be taken into account because modelling
macro-economic development is not within the scope of a regional model like MARS.
Another example is that due to the strategic character of MARS it is not possible to calculate
car noise emissions and imissions. To do so the MARS results would have to be fed into
models on a more detailed level of dis-aggregation.
Indicators of sustainability
(Minken et al. 2003) summarises a wide range of suggestions for indicators to measure
sustainability and its sub-objectives. Consumption of land, consumption of fossil fuels and
atmospheric emissions are amongst them. Land and fossil fuel are non renewable resources.
Their consumption is therefore suitable as an indicator to measure sustainability. Atmospheric
emissions are directly linked to the consumption of fossil fuels and their production endangers
the environment. The model MARS is able to calculate these indicators.
The observation of statistical data for the indicators consumption of land, consumption of
fossil fuels and atmospheric emissions shows that today’s cities are not sustainable. The
instruments which have been applied in the past were not effective enough to achieve the goal
of sustainability. The following section illustrates this observation for Madrid.
The “Comunidad de Madrid”
The “Comunidad de Madrid” is situated in the heart of Spain. It covers an area of about 8,000
km2. About 5.4 million people live within the whole region. The city of Madrid itself has
about 2.9 million inhabitants. The situation is characterised by a rapid development of
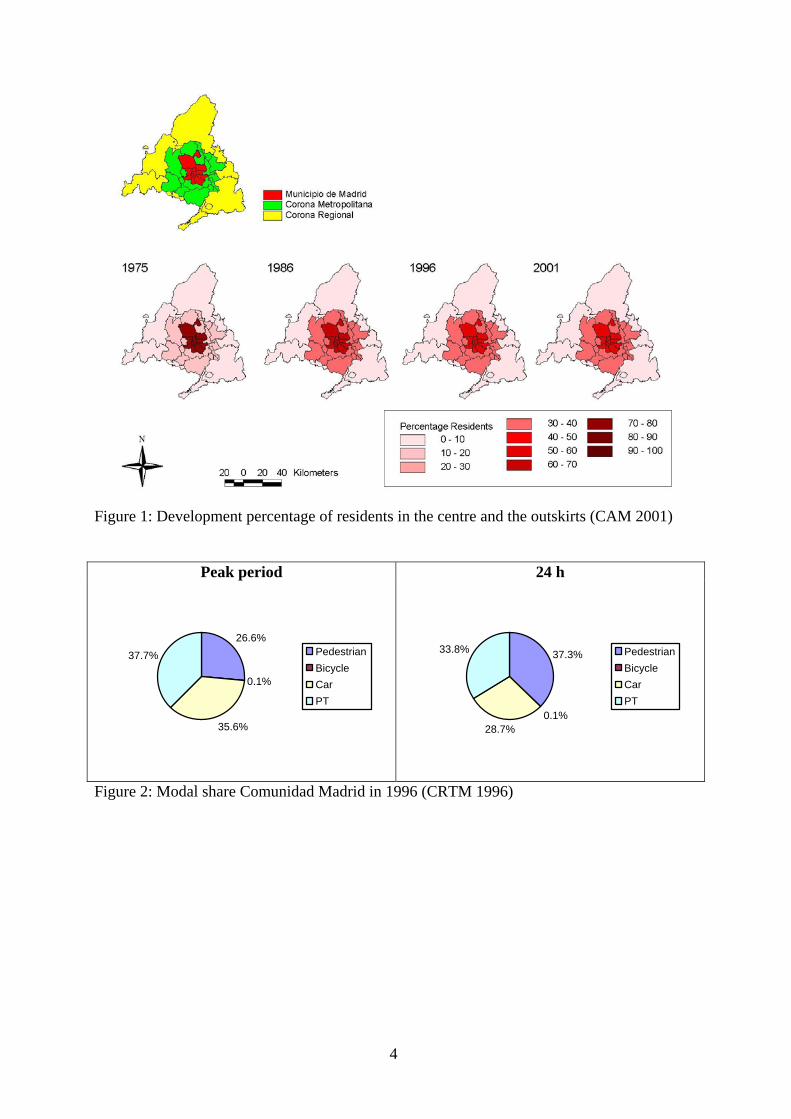
housing and businesses in the surroundings of the city (see Figure 1). Traffic is characterised
by a high number of people commuting into the core city. The share of car trips is high during
the peak period than during the rest of the day (see Figure 2). Although Madrid has an
efficient metro line system and about 55% of the people commuting into the city use public
transport (CRTM 1996), this results in a high level of peak hour congestion. The bus based
part of the public transport system is stuck in congestion and therefore not very attractive. As
well the land use as the transport system do not fulfil the requirements of sustainability.
4
Figure 1: Development percentage of residents in the centre and the outskirts (CAM 2001)
Peak period 24 h
26.6%
0.1%
35.6%
37.7% PedestrianBicycleCarPT
37.3%
0.1%28.7%
33.8% PedestrianBicycleCarPT
Figure 2: Modal share Comunidad Madrid in 1996 (CRTM 1996)
5
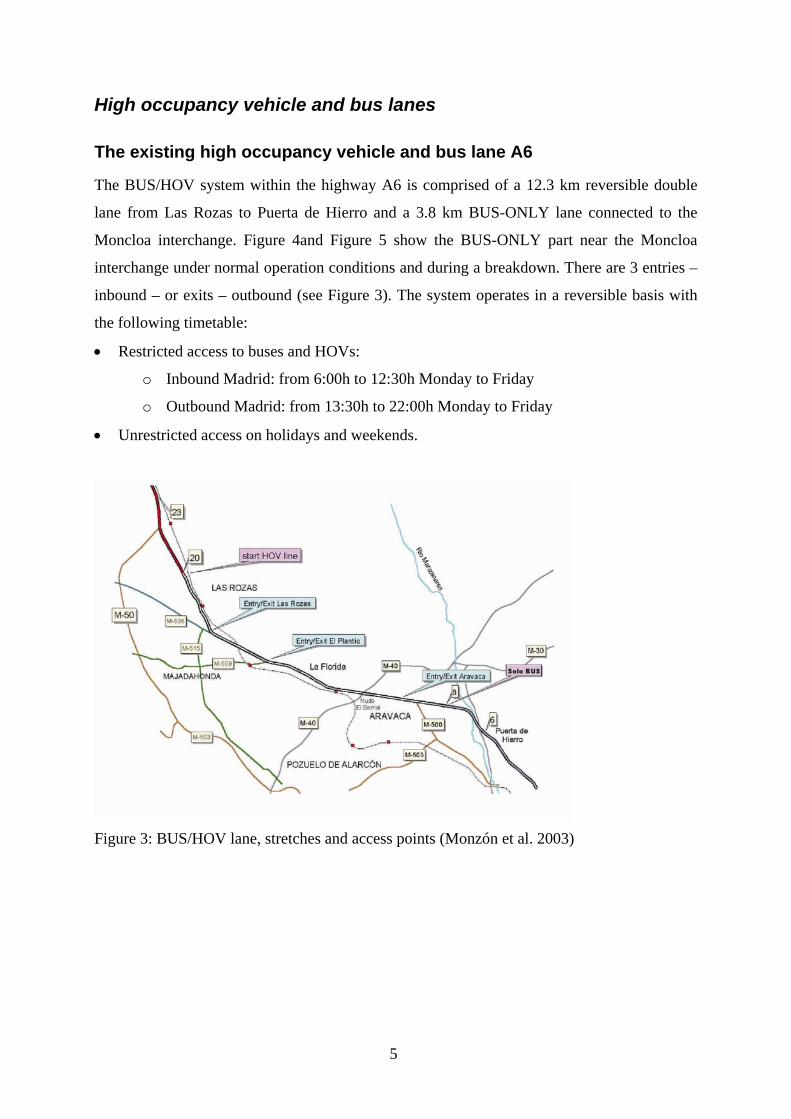
High occupancy vehicle and bus lanes
The existing high occupancy vehicle and bus lane A6
The BUS/HOV system within the highway A6 is comprised of a 12.3 km reversible double
lane from Las Rozas to Puerta de Hierro and a 3.8 km BUS-ONLY lane connected to the
Moncloa interchange. Figure 4and Figure 5 show the BUS-ONLY part near the Moncloa
interchange under normal operation conditions and during a breakdown. There are 3 entries –
inbound – or exits – outbound (see Figure 3). The system operates in a reversible basis with
the following timetable:
• Restricted access to buses and HOVs:
o Inbound Madrid: from 6:00h to 12:30h Monday to Friday
o Outbound Madrid: from 13:30h to 22:00h Monday to Friday
• Unrestricted access on holidays and weekends.
Figure 3: BUS/HOV lane, stretches and access points (Monzón et al. 2003)

6
Figure 4: The bus lane A6 approaching the PT interchange Moncloa during the morning peak
in normal operation (05/011/2004, photo by P. Pfaffenbichler)
Figure 5: The bus lane A6 approaching the PT interchange Moncloa a bus broke down and
blocked several other buses during the morning peak (04/011/2004, photo by P.
Pfaffenbichler)

7
Prior to the implementation of the BUS/HOV facility, the situation in the A6 corridor was
characterised by chronic congestion problems. The opening of the BUS/HOV lane improved
the situation. In addition, the greater reliability achieved for the suburban bus services has
fostered their use through a substantial increase in bus patronage - from 24% in 1991 to 36%
in 2001. The observed changes in transport demand are shown in Table 1. The BUS/HOV
lane A6 has significantly reduced peak travel times for bus and HOV lane users (see Figure 6
and Table 2).
Table 1: Demand evolution, A6 morning peak (7-10h) inbound trips in 2001 (Monzón et al.
2003)
Year HOV lane Conventional lanes BUS HOV BUS Other Vehicles
Total A6
veh. pax. veh. pax. veh. pax. veh. Pax. veh. pax. 11/1991 244 6,602 15,810 21,430 16,054 28,03211/1995 268 10,430 5,640 12,471 92 1,170 9,960 11,371 15,960 35,44211/1996 295 10,905 5,747 11,823 87 1,115 14,976 16,945 21,105 40,78811/1997 334 12,050 4,884 10,979 116 1,865 13,108 15,041 18,442 39,93511/1998 346 12,040 6,245 13,100 80 910 14,004 15,792 20,675 41,84211/2001 478 14,110 6,634 13,059 131 2,260 15,307 16,350 22,550 45,779
Figure 6: Travel time (minutes) for a 15 km access road; A6 morning peak, 2001 (Monzón et
al. 2003)

8
Table 2: Traveltime autobus Las Rozas – Moncloa on an average working day (Pozueta
Echavarri 1997)
Period 1991 March 95 June 95 Nov. 95 (min) (%) (min) (%) (min) (%) 07:00 – 08:00 26 11 -57.7 13 -50.0 16 -38.5 08:00 – 09:00 32 12 -62.5 14 -56.3 17 -46.9 09:00 – 10:00 27 12 -55.6 10 -63.0 11 -59.3
The costs for the construction of BUS/HOV lane A6 were about 56.6 million Euros (Pozueta
Echavarri 1997). This gives costs of about 3.3 million Euro per kilometre.
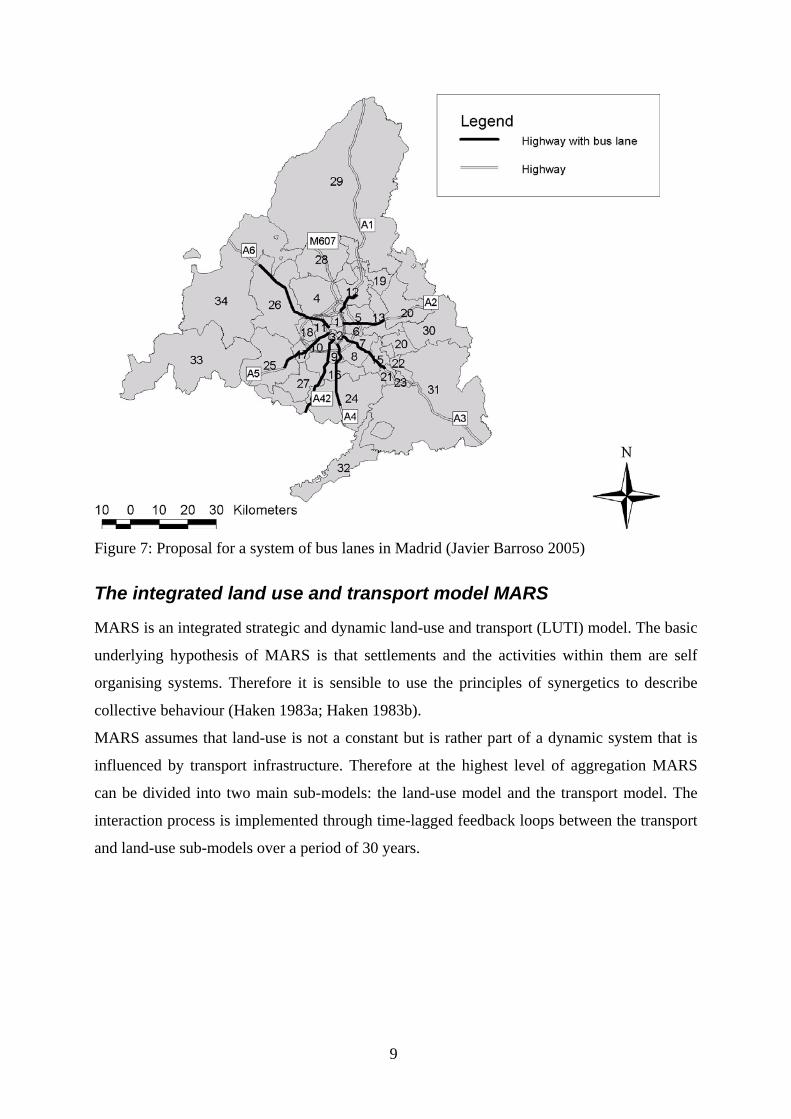
Proposed bus lanes
On the 16th of March 2005 the Spanish minister Magdalena Álvarez presented the plan to
construct more than 100 kilometres of two-way bus lanes within the Comunidad de Madrid
(Javier Barroso 2005). It is planned that all radial highways into the city of Madrid will be
equipped with bus lanes. Details of this plan can be seen in Table 3 and Figure 7.
Table 3: New bus lanes for Madrid (Javier Barroso 2005)
Nr. Name From – To Distance (km) Costs (106 Euro)* A1 Autovía de Burgos M40 – San Sebastian
de los Reyes 7.0 46.2
A2 Autovía de Barcelona M30 - Torrejón 15.0 99.0 A3 Autovía de Valencia M30 - Arganda 19.0 125.4 A4 Autovía de Andalucía M30 - Valdemoro 18.5 122.1 A42 Autovía de Toledo Plaza Elíptica –
Border to Toledo 19.5 128.7
A5 Autovía de Extremadura M40 - Móstoles 13.0 85.8 A6 Autovía de A Coruña Las Rozas - Villalba 17.4 114.8 Total 109.4 722.0 * 3.3 million Euros/kilometre lane as calculated from (Pozueta Echavarri 1997)
9
Figure 7: Proposal for a system of bus lanes in Madrid (Javier Barroso 2005)
The integrated land use and transport model MARS
MARS is an integrated strategic and dynamic land-use and transport (LUTI) model. The basic
underlying hypothesis of MARS is that settlements and the activities within them are self
organising systems. Therefore it is sensible to use the principles of synergetics to describe
collective behaviour (Haken 1983a; Haken 1983b).
MARS assumes that land-use is not a constant but is rather part of a dynamic system that is
influenced by transport infrastructure. Therefore at the highest level of aggregation MARS
can be divided into two main sub-models: the land-use model and the transport model. The
interaction process is implemented through time-lagged feedback loops between the transport
and land-use sub-models over a period of 30 years.

10
Two person groups, one with and one without access to a private car are considered in the
transport model part. The transport model is broken down by commuting and non-commuting
trips, including travel by non-motorised modes. Car speed in the MARS transport sub-model
is volume and capacity dependent and hence not constant. The energy consumption and
emission sub-models of MARS utilise speed dependent specific values. The land-use model
considers residential and workplace location preferences based on accessibility, available
land, average rents and amount of green space available. Decisions in the land-use sub-model
are based on random utility theory. Due to its strategic characteristic a rather high level of
spatial aggregation is used in MARS. In most case studies this means that the municipal
districts are chosen as travel analysis zones. The outputs of the transport model are
accessibility measures by mode for each zone while the land-use model yields workplace and
residential location preferences per zone.
MARS is able to estimate the effects of several demand and supply-sided instruments whose
results can be measured against targets of sustainability. These instruments range from
demand-sided measures, such as with public transport fare (increases or decreases), parking or
road pricing charges to supply-sided measures such as increased transit service or capacity
changes for road or non-motorised transport. These measures, furthermore, could be applied
to various spatial levels and/or to time-of-day periods (peak or off-peak).
To date the model MARS was applied to the following six European case study cities
Edinburgh, Helsinki, Leeds, Madrid, Oslo, Stockholm and Vienna. Currently a MARS model
of Lisbon, Portugal is set up within a PhD-thesis. Within the ongoing project SPARKLE
(Sustainability Planning for Asian cities making use of Research, Know-how and Lessons
from Europe) MARS is adopted and applied to the Asian cities Ubon Ratchasthani, Thailand
and Da Nang, Vietnam (Emberger et al. 2005). To test the model MARS an extensive back
casting exercise was carried out with data of the city Vienna (Pfaffenbichler 2003). A full
description of MARS is given in (Pfaffenbichler 2003).
A well calibrated and tested MARS model covering the “Comunidad Madrid” is available
from an ongoing PhD-thesis (Vieira 2005). As an example for the model testing the
comparison of the MARS results for daily trips by mode with the results of the 1996 Madrid
travel survey is shown in Figure 8 to Figure 11. As well the fit as the slope of the linear
regression between the MARS results and the statistical data are satisfying. This model was
utilised for the case study presented in the following sections.

11
24 hours - Total
y = 0.8297x - 122.92R2 = 0.9507
1
10
100
1,000
10,000
100,000
1,000,000
1 10 100 1,000 10,000 100,000 1,000,000
MARS
Hou
seho
ld s
urve
y 19
96
Figure 8: Comparison of the MARS model results with the results of the 1996 household
survey (CRTM 1996) – daily trips total
24 hours - Slow
y = 0.7627x + 381.64R2 = 0.9276
1
10
100
1,000
10,000
100,000
1,000,000
1 10 100 1,000 10,000 100,000 1,000,000
MARS
Hou
esho
ld s
urve
y 19
96
Figure 9: Comparison of the MARS model results with the results of the 1996 household
survey (CRTM 1996) – daily trips slow modes

12
24 hours - Public Transport
y = 0.9418x - 520.25R2 = 0.8548
1
10
100
1,000
10,000
100,000
1,000,000
1 10 100 1,000 10,000 100,000 1,000,000
MARS
Hou
seho
ld s
urve
y 19
96
Figure 10: Comparison of the MARS model results with the results of the 1996 household
survey (CRTM 1996) – daily trips public transport
24 hours - Car
y = 0.7517x + 111.44R2 = 0.7997
1
10
100
1,000
10,000
100,000
1,000,000
1 10 100 1,000 10,000 100,000 1,000,000
MARS
Hou
seho
ld s
urve
y 19
96
Figure 11: Comparison of the MARS model results with the results of the 1996 household
survey (CRTM 1996) – daily trips car

13
Case study “Comunidad de Madrid”
There are two possibilities two realise the proposed bus lanes: either to build new extra lanes
or to dedicate existing lanes to bus use only. While capacity for cars stays the same with the
first opportunity it is reduced with the second one. Both possibilities were used in the model
calculations presented below. The first possibility is referenced as scenario “New Lanes”, the
second one is referenced as scenario “Replace Car Lanes”. Both scenarios are compared with
a scenario “Do Minimum”.
Transport
Figure 12 and Figure 13 present the results for the daily trips by mode during the peak period
and 24 hours. The total number of trips is growing in all different scenarios due to the overall
growth of population in the study area. As a result of the bus travel time reduction during the
peak period the number of PT users increases significantly compared with the “Do Minimum”
scenario (Figure 12). Due to the additional effect of the road capacity reduction the increases
are higher in the scenario “Replace Car Lanes”.
1,300,000
1,400,000
1,500,000
1,600,000
1,700,000
1,800,000
1,900,000
2,000,000
2,100,000
2,200,000
2005 2010 2015 2020 2025
Year
Trip
s pe
r day
(Pea
k pe
riod)
Do Minimum SlowDo Minimum PTDo Minimum CarNew Lanes SlowNew Lanes PTNew Lanes CarReplace Car Lanes SlowReplace Car Lanes PTReplace Car Lanes Car
Figure 12: Trips per day by mode during the peak period

14
The situation for the off peak period and 24 hours is more complex. No travel time savings for
bus users occur during the off peak period. But as the model MARS is based on the
assumption of constant travel time budgets, the time savings from the peak period will be
spent during the off peak period. Therefore the total number of trips in off peak increases. In
the scenario “Replace Car Lanes” car trips are reduced due to the effect of the reduced road
capacity (Figure 13).
4,600,000
4,800,000
5,000,000
5,200,000
5,400,000
5,600,000
5,800,000
2005 2010 2015 2020 2025
Year
Trip
s pe
r day
Do Minimum SlowDo Minimum PTDo Minimum CarNew Lanes SlowNew Lanes PTNew Lanes CarReplace Car Lanes SlowReplace Car Lanes PTReplace Car Lanes Car
Figure 13: Trips per day by mode (24 h)
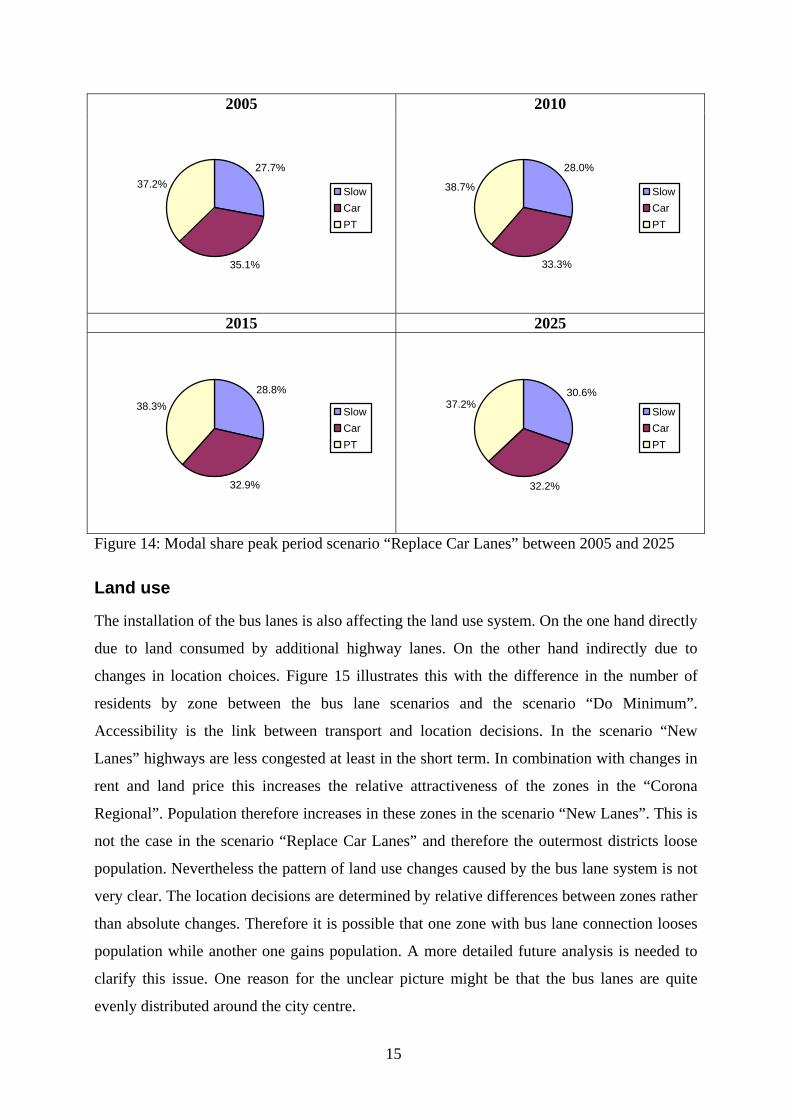
The bus lanes increase the modal share of public transport significantly in the short run
(Figure 14). In the long run the modal share of public transport goes back to about the initial
value (Figure 14). This behaviour coincides with the observations in the aftermath of the
installation of the BUS/HOV system on the A6. Nevertheless the modal share of public
transport remains significantly higher than in the scenario “Do Minimum”.
15
2005 2010
27.7%
35.1%
37.2%SlowCarPT
28.0%
33.3%
38.7% SlowCarPT
2015 2025
28.8%
32.9%
38.3% SlowCarPT
30.6%
32.2%
37.2%SlowCarPT
Figure 14: Modal share peak period scenario “Replace Car Lanes” between 2005 and 2025
Land use
The installation of the bus lanes is also affecting the land use system. On the one hand directly
due to land consumed by additional highway lanes. On the other hand indirectly due to
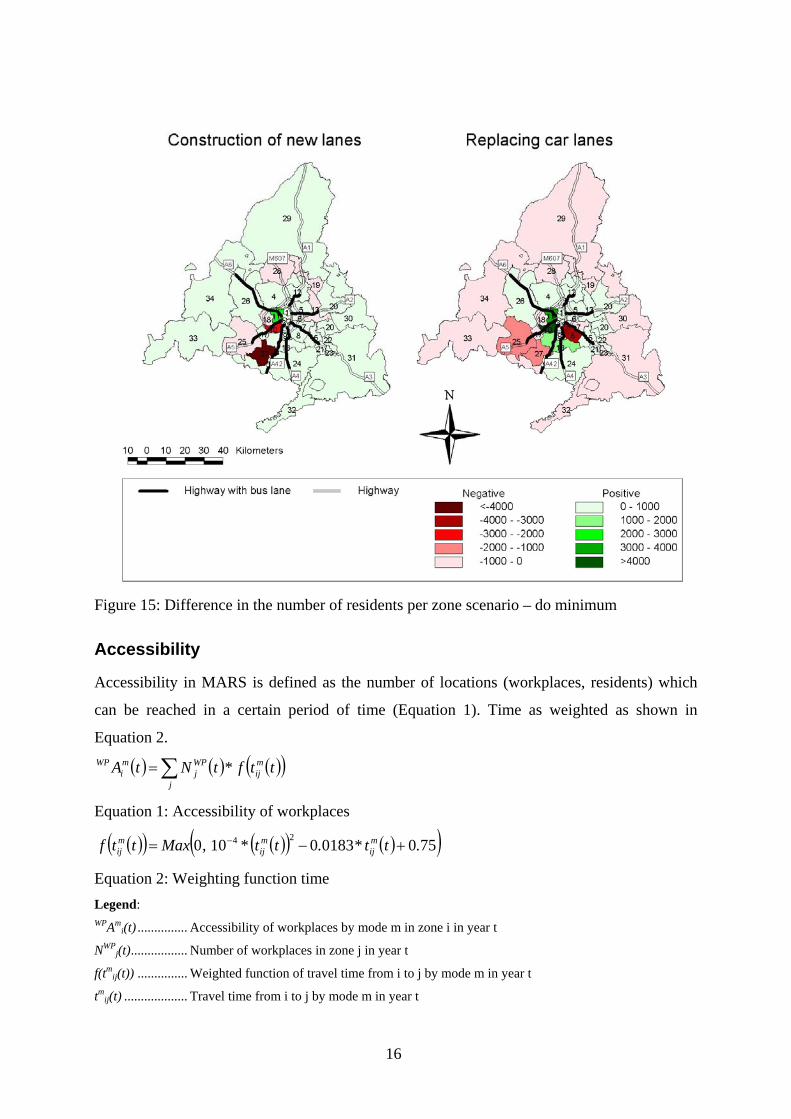
changes in location choices. Figure 15 illustrates this with the difference in the number of
residents by zone between the bus lane scenarios and the scenario “Do Minimum”.
Accessibility is the link between transport and location decisions. In the scenario “New
Lanes” highways are less congested at least in the short term. In combination with changes in
rent and land price this increases the relative attractiveness of the zones in the “Corona
Regional”. Population therefore increases in these zones in the scenario “New Lanes”. This is
not the case in the scenario “Replace Car Lanes” and therefore the outermost districts loose
population. Nevertheless the pattern of land use changes caused by the bus lane system is not
very clear. The location decisions are determined by relative differences between zones rather
than absolute changes. Therefore it is possible that one zone with bus lane connection looses
population while another one gains population. A more detailed future analysis is needed to
clarify this issue. One reason for the unclear picture might be that the bus lanes are quite
evenly distributed around the city centre.
16
Figure 15: Difference in the number of residents per zone scenario – do minimum
Accessibility
Accessibility in MARS is defined as the number of locations (workplaces, residents) which
can be reached in a certain period of time (Equation 1). Time as weighted as shown in
Equation 2.
( ) ( ) ( )( )∑=j
mij
WPj
mi
WP ttf*tNtA
Equation 1: Accessibility of workplaces
( )( ) ( )( ) ( )( )75001830100 24 .tt*.tt*,Maxttf mij
mij
mij +−= −
Equation 2: Weighting function time Legend: WPAm
i(t) ............... Accessibility of workplaces by mode m in zone i in year t
NWPj(t)................. Number of workplaces in zone j in year t
f(tmij(t)) ............... Weighted function of travel time from i to j by mode m in year t
tmij(t) ................... Travel time from i to j by mode m in year t

17
Accessibility changes as expected (Figure 16). Accessibility by public transport increases in
both bus lane scenarios. The increase is highest in the bus lane corridors. In the scenario
“New Lanes” accessibility by car increases in the whole study area. The increase is highest in
the bus lane corridors. In the scenario “Replace Car Lanes” accessibility by car decreases in
the bus lane corridors where road capacity for cars is reduced. Due to the overall reduction in
car trips it increases in the other zones.
Figure 16: Percentage change of accessibility of workplaces in the year 2025 relative to the
scenario “Do Minimum”
CO2-emissions
Both bus lane scenarios reduce the CO2-emissions (Figure 17 and Figure 18). But the relative
amount is very small: about -0.3% for the scenario “New Lanes” and about -0.5% for the
scenario “Replace Car Lanes”. Even these small reductions are in danger of being lost in the
long run years. Especially in the scenario “New Lanes” the additional road capacity is filled
up again and CO2-emissions are above the “Do Minimum” levels in the years 2023 and 2024.
The instrument “bus lanes” is by far not sufficient to achieve the overall CO2-emission
targets.

18
2,600,000
2,650,000
2,700,000
2,750,000
2,800,000
2,850,000
2,900,000
2,950,000
3,000,000
3,050,000
3,100,000
2005
2007
2009
2011
2013
2015
2017
2019
2021
2023
2025
Year
CO
2 em
issi
ons
(t/a)
Do MinimumNew LanesReplace Lanes
Figure 17: Yearly CO2-emissions by scenario
-0.6%
-0.5%
-0.4%
-0.3%
-0.2%
-0.1%
0.0%
0.1%
0.2%
2005 2010 2015 2020 2025
Year
CO
2 New LanesReplace Lanes
Figure 18: Percentage change of CO2-emissions relative to the scenario “Do Minimum”

19
Cost benefit analysis
A cost benefit analysis including the external costs of accidents, CO2-, NOX-, HC- and PM-
emissions was carried out for the two bus lane scenarios. Currently no official cost estimates
for the bus lanes exist. The investment costs for building the bus lanes in the scenario “New
Lanes” was therefore estimated with 722 million Euros (see Table 3). The investment costs
for a scenario “Replace Car Lanes” will be lower and were therefore estimated with 300
million Euros. The interest rate was estimated with 6%. The results are summarised in Table 4
and Table 5. Both scenarios result in a positive value for the objective function. But
nevertheless there are significant differences. Both have in common that the positive result is
driven by a highly positive value for PT user time savings. Car user time savings are positive
in the scenario “New lanes” and negative in the scenario “Replace Car Lanes”. The same is
true for car user costs. In both scenarios PT operators gain about the same amount from the
additional fares. The government has to pay for the investments in both scenarios. The
external costs are negative for the scenario “New Lanes” and positive for the scenario
“Replace Car Lanes”.
Table 4: Cost benefit analysis scenario “New lanes”
User Time savings Revenues and costs PT Car PT Car
Public transport operator
Govern-ment
External costs
Objective function
1181.8 112.7 0 33.3 135.5 -720.7 -29.1 713.5
Table 5: Cost benefit analysis scenario “Replace Car Lanes”
User Time savings Revenues and costs PT Car PT Car
Public transport operator
Govern-ment
External costs
Objective function
1140.8 -255.1 0.0 -81.2 117.9 -282.3 7.2 647.3
20
Conclusions
The dynamic transport and land use interaction model MARS was used to assess the effect of
a current proposal to install bus lanes on all radial highways leading into the city of Madrid
against the overall objective of sustainability. Experience with the existing BUS/HOV system
within the A6 was utilised in this process.
The overall conclusion from the work presented here is that the proposed bus lanes contribute
to the overall objective of sustainability. But nevertheless it has to be mentioned that their
contribution is rather small. The modal share of public transport is increased in the short term
but goes back to initial values in the long term. Which is still higher than in the scenario “Do
Minimum”. The reduction of greenhouse gas emissions is very small for both the “New
Lanes” and “Replace Car Lanes” scenario. The total external costs of the scenario “New
Lanes” are even negative due to increased accident costs caused by higher car speed. The
option “Replace Car Lanes” clearly has to be favoured from a sustainability point of view.
The positive results of the cost benefit analysis are mainly driven by the time savings of
public transport users. The use of time savings is not undisputed (Emberger et al. 2004).
Without time savings both results would be negative. The losses are much higher for the
scenario “New Lanes” than for the scenario “Replace Car Lanes”. The results are furthermore
sensitive to investment costs. These costs should be redefined when more details about the
proposal are publicly available.
There are some issues open for additional research. First of all the current representation of
the instrument bus lanes in the model MARS is rather crude. There is no information about
the positions of entry and exit points or bus stops within the bus lanes. Currently all zones
crossed by bus lanes benefit to a certain extent. If there is no entry/exit point or bus stop in the
zone this will definitely not be true. Therefore it seems useful to revise and refine the model
representation of the instrument bus lanes.
The land use response pattern is a bit unclear. Therefore it would be useful to analyse the
causes for the location choices in detail. To gain more insight it is suggested to model and
analyse each radial highway separately and in combination.

21
References
CAM. (2001). Censos y Padrones oficiales, Consejería de Economía e Innovación Tecnológica, Instituto de Estadística de la Comunidad de Madrid, Madrid.
CRTM. (1996). Encuesta Domiciliaria de Movilidad en la Comunidad Madrid 1996, Consorcio Regional de Transportes de Madrid, Madrid.
Emberger, G., Ibesich, N., and Pfaffenbichler, P. (2005). "Die Entwicklung eines integrierten dynamischen Siedlungsentwicklungs- und Verkehrsmodells für Asiatische Städte." CORP 2005, Wien.
Emberger, G., Pfaffenbichler, P., and Shepherd, S. (2004). "The impact of small time savings in transport appraisal." 10th World Conference on Transport Research, Istanbul.
Haken, H. (1983a). Advanced Synergetics - Instability Hierarchies of Self-Organizing Systems and Devices, Springer-Verlag.
Haken, H. (1983b). Erfolgsgeheimnisse der Natur - Synergetik: Die Lehre vom Zusammenwirken, Deutsche Verlags-Anstalt, Stuttgart.
Javier Barroso, F. (2005). "Fomento construirá 120 kilómetros de carriles bus en las autovías de entrada en la capital". El País, 17/03/2005, Madrid, p. 4.
May, A. D., Karlstrom, A., Marler, N., Matthews, B., Minken, H., Monzon, A., Page, M., Pfaffenbichler, P., and S., S. (2003). Developing Sustainable Urban Land Use and Transport Strategies - A Decision Makers' Guidebook, Institute for Transport Studie, Univerity of Leeds, Leeds.
Minken, H., Jonsson, D., Shepherd, S. P., Järvi, T., May, A. D., Page, M., Pearman, A., Pfaffenbichler, P. C., Timms, P., and Vold, A. (2003). Developing Sustainable Land Use and Transport Strategies - A Methodological Guidebook, Institute of Transport Economics, Oslo.
Monzón, A., Puy, J., Pardillo, J. M., Cascajo, R., and Mateos, M. (2003). "Modelización y evaluación de medidas de gestión en corredores urbanos." CICYT Spanish National R+D Programme, Madrid.
Pfaffenbichler, P. (2003). The strategic, dynamic and integrated urban land use and transport model MARS (Metropolitan Activity Relocation Simulator) - Development, testing and application, Beiträge zu einer ökologisch und sozial verträglichen Verkehrsplanung Nr. 1/2003, Vienna University of Technology, Vienna.
Pozueta Echavarri, J. (1997). "Experiencia Española en carriles de alta ocupación. La Calzada bus/VAO en la N-VI: Balance de un año de funcionamiento." Cuadernos de Investigación Urbanística, Escuela Técnica Superior de Arquitectura, Madrid(16).
Schipper, L., Huizenga, C., and Ng, W. (2005). "Indicators: Reliable signposts on the road to sustainable transportation - The partnership for sustainable transport in Asia." eceee 2005 Summer Study Proceedings, Mandelieu, France.
Vieira, P. (2005). "Modelización de la interación de usos del suelo y transporte. Aplicación al corredor de la A-3 de Madrid," PhD-thesis, ongoing, Universidad Politécnica de Madrid, Madrid.
Related Documents