12 th WCTR, July 11-15, 2010 – Lisbon, Portugal 1 LOCATION AND ACCESSIBILITY MEDIATED INFLUENCES ON OFFICE FIRM CLOSURE RATES: A PROPORTIONAL HAZARD MODEL Gustavo G. Manzato Faculty of Architecture, Building and Planning - Eindhoven University of Technology - P.O. Box 513 - 5600MB Eindhoven - The Netherlands - [email protected] Theo A. Arentze Faculty of Architecture, Building and Planning - Eindhoven University of Technology - P.O. Box 513 - 5600MB Eindhoven - The Netherlands - [email protected] Harry J. P. Timmermans Faculty of Architecture, Building and Planning - Eindhoven University of Technology - P.O. Box 513 - 5600MB Eindhoven - The Netherlands - [email protected] Dick Ettema Faculty of Geosciences - Utrecht University - PO Box 80115 - 3508TC Utrecht - The Netherlands - [email protected] ABSTRACT This paper comprises an exploratory study about the mediated influence of a set of location and accessibility attributes along with firm types on office firm closure. We use a proportional hazard modeling approach, examining the probability that an office firm will go out of business in any given year, conditional on it did not go out of business in the years before. Variables include urbanization levels and regional effects; accessibility to airports, train stations, shopping centers and the roadway network; availability of parking facilities and schools; demographic and economic aspects; effects of agglomeration economies; rent price; and the office firm economic activity type. Most of them presented significance on explaining firm closure. Also, interaction effects between covariates and firm types brought better understanding on firm closure patterns regarding urban characteristics. Assessing firm closure is part of a firm demographic approach to firm dynamics. In turn, this is part of a multi agent system to simulate the co-evolution of firm dynamics and changes in activity-travel patterns. Keywords: office firm closure, hazard models, firm dynamics, Cox regression

Welcome message from author
This document is posted to help you gain knowledge. Please leave a comment to let me know what you think about it! Share it to your friends and learn new things together.
Transcript
12th WCTR, July 11-15, 2010 – Lisbon, Portugal
1
LOCATION AND ACCESSIBILITY MEDIATED INFLUENCES ON OFFICE FIRM
CLOSURE RATES: A PROPORTIONAL HAZARD MODEL
Gustavo G. Manzato Faculty of Architecture, Building and Planning - Eindhoven University of Technology - P.O. Box 513 - 5600MB Eindhoven - The Netherlands - [email protected]
Theo A. Arentze Faculty of Architecture, Building and Planning - Eindhoven University of Technology - P.O. Box 513 - 5600MB Eindhoven - The Netherlands - [email protected]
Harry J. P. Timmermans Faculty of Architecture, Building and Planning - Eindhoven University of Technology - P.O. Box 513 - 5600MB Eindhoven - The Netherlands - [email protected]
Dick Ettema Faculty of Geosciences - Utrecht University - PO Box 80115 - 3508TC Utrecht - The Netherlands - [email protected]
ABSTRACT
This paper comprises an exploratory study about the mediated influence of a set of location and accessibility attributes along with firm types on office firm closure. We use a proportional hazard modeling approach, examining the probability that an office firm will go out of business in any given year, conditional on it did not go out of business in the years before. Variables include urbanization levels and regional effects; accessibility to airports, train stations, shopping centers and the roadway network; availability of parking facilities and schools; demographic and economic aspects; effects of agglomeration economies; rent price; and the office firm economic activity type. Most of them presented significance on explaining firm closure. Also, interaction effects between covariates and firm types brought better understanding on firm closure patterns regarding urban characteristics. Assessing firm closure is part of a firm demographic approach to firm dynamics. In turn, this is part of a multi agent system to simulate the co-evolution of firm dynamics and changes in activity-travel patterns.
Keywords: office firm closure, hazard models, firm dynamics, Cox regression
Location and Accessibility Mediated Influences on Office Firm Closure Rates MANZATO, Gustavo; ARENTZE, Theo; TIMMERMANS, Harry; ETTEMA, Dick
12th WCTR, July 11-15, 2010 – Lisbon, Portugal
2
INTRODUCTION
The spatial distribution of economic activities deeply influences urban organization and development. Specifically office firms, responsible for providing services to the society and offering employment opportunities, determine location patterns of workers’ home, consumers’ behavior seeking such services and location decisions of other firms. As a result, the spatial distribution of companies strongly impacts traffic flows and accessibility due to commute and business trips. In that perspective, interest in areas such as economy, business, geography, urban and transportation studies has been raised. Particularly in transportation research, the spatial distribution of office firms has been recently highlighted in the context of integrated land use-transportation (LUTI) models, as constituting critical input to modeling urban development and travel.
In line with the above mentioned, several models have been developed, e.g., Abraham and Hunt (1999); De Bok and Bliemer (2006); De Bok and Sanders (2005); Edwards (1983); Elgar and Miller (2006, 2007); Elgar et al. (2009); Khan et al. (2002); Maoh et al. (2002); Moeckel (2009); Waddell et al. (2003); Wissen (2000). Increasingly, efforts have been focused on modeling the dynamics in the spatial distribution of economic activity through agent-based representations of firms’ demographic processes. These multi-agent models allow, in a consistent manner, the simulation of start-up, growth, relocation and closure of firms as the co-evolution of firm dynamics and changes in activity-travel patterns. This, however, requires more insights, particularly in the spatial characteristics underlying such firm demography processes.
Presented in this paper, our first analysis involving one of the above mentioned dynamics refers to the (office) firm closure aspect. The underlying hypothesis is that accessibility and other spatially-related urban characteristics mediate the probability of firm closure. To investigate it, we apply the proportional hazard model, a mathematical method for analyzing survival events. Readers that are not familiar with this modeling approach may refer to, for example, Allison, 2004; Collett, 1994; Hosmer and Lemeshow, 1999; Kleinbaum and Klein, 2005; Norušis, 2008; Smith, 2002; Vittinghoff et al., 2005. There have been some applications of this model in economic studies, but mostly considering only firm-related aspects, such as age, size, and type (e.g., Audretsch and Mahmood, 1995; Pérez et al., 2004; Görg and Strobl, 2000). Spatial aspects, when taken into account, have not been examined in much detail, generally referring to few characteristics, such as contrasts between urban/rural or superficial considerations regarding urbanization levels (e.g., Fotopoulos and Louri, 2000; Stearns et al., 1995).
Hence, the objective of this study is to analyze the effects of spatial attributes on closure/survival of office firms. Based on a 10-years time series data from The Netherlands, we analyze the covariation of a set of spatial variables on the probability that an office firm will go out of business in any given year, conditional on it did not go out of business in the years before. Variables include urbanization levels and regional effects; accessibility to airports, train stations, shopping centers and the roadway network; availability of parking facilities and schools; demographic and economic aspects; effects of agglomeration
Location and Accessibility Mediated Influences on Office Firm Closure Rates MANZATO, Gustavo; ARENTZE, Theo; TIMMERMANS, Harry; ETTEMA, Dick
12th WCTR, July 11-15, 2010 – Lisbon, Portugal
3
economies; and rent price. Also, the office firm economic activity type is considered. Although other firm-related attributes (size and whether or not the firms have been involved in relocation before) are available, they were not considered because of their endogenous nature.
This paper is organized as follows. Next section presents an empirical application, along with the description of data and the discussion of results. Finally, some concluding remarks are drawn.
EMPIRICAL APPLICATION
Data
The data used in this study concerns office firms located in The Netherlands. Originally, a time series database, from 1996 to 2006, was obtained from the Ministry of Housing, Spatial Planning and Environment with all business establishments recorded by the LISA (National Information System of Employment) register. The variables included: the LISA unique identification code, the number of employees, the post code at the 6-digit level and the economic sector (represented by the official SBI classification of the Dutch Center of Statistics). Merging the data from all the periods through the LISA code, there was a total of 1.618.846 business establishments. From this, we selected the records that were interesting for our study, i.e., i) SBI code related to an office firm, and ii) office firms with a known start-up period. The SBI classification used comprises 15 firm types: 1) agriculture; 2) industry; 3) basic infrastructures (energy, gas and water); 4) building industry; 5) retail and horeca (hotels, restaurants and cafes); 6) traffic and communication; 7) financial institutions; 8) social security; 9) real estate; 10) business service; 11) computer and information technology; 12) research and development; 13) public administration; 14) education and health; and 15) environment services, culture and recreation. Firms with a known start-up period results in records between 1997 and 2006, as we did not know when firms recorded in 1996 had started. Hence, this subset resulted in a database of 286.874 records. Next, spatial data was added to the office firm database, as described hereafter.
1. Distance (m) to the closest airport, measured through the roadway network.
2. Distance (m) to Schiphol (international level) airport, measured through the roadway network.
3. Distance (m) to the closest high speed train (HST) station, measured through the roadway network.
Location and Accessibility Mediated Influences on Office Firm Closure Rates MANZATO, Gustavo; ARENTZE, Theo; TIMMERMANS, Harry; ETTEMA, Dick
12th WCTR, July 11-15, 2010 – Lisbon, Portugal
4
4. Distance (m) to the closest intercity train (IC) station, measured through the roadway network.
5. Distance (m) to the closest shopping center, measured through the roadway network.
6. Distance (m) to the closest highway junction, measured through the roadway network.
7. Urbanization level at the municipality level. It is defined in 5 classes: 1) very high urbanized area (more than 2500 address/km²); 2) high urbanized area (between 1500 and 2500 address/km²); 3) moderate urbanized area (between 1000 and 1500 address/km²); 4) low urbanized area (between 500 and 1000 address/km²); and 5) not urbanized area (less than 500 address/km²).
8. Urbanization level at the 4-digit post code area. It follows the same classification as at municipality level.
9. Regional effects, represented by the Dutch provinces: 1) Drenthe; 2) Flevoland; 3) Friesland; 4) Gelderland; 5) Groningen; 6) Limburg; 7) Noord-Brabant; 8) Noord-Holland; 9) Overijssel; 10) Utrecht; 11) Zeeland; and 12) Zuid-Holland.
10. Population (number of inhabitants) measured at both municipality and 4-digit post code area levels.
11. Number of households measured at the 4-digit post code area.
12. Labor force (number of people) measured at the 4-digit post code area.
13. Average income (Euro) measured at the 4-digit post code area.
14. Number of places in schools measured at the 4-digit post code area.
15. Number of parking places measured at the 4-digit post code area.
16. Effects of agglomeration economies. It was measured by the number of firms belonging to the same type within a COROP area (COROP areas refer to a statistical classification designed by the Coordinating committee Regional Research-
Location and Accessibility Mediated Influences on Office Firm Closure Rates MANZATO, Gustavo; ARENTZE, Theo; TIMMERMANS, Harry; ETTEMA, Dick
12th WCTR, July 11-15, 2010 – Lisbon, Portugal
5
programme dividing The Netherlands into 40 regions. It matches with the so-called NUTS-III classification, often used within the European Union).
17. Office rent price in Euro/m². It was calculated using a digital elevation model based on another database containing values of rent price (per m²) for offices across the country. The model creates a (GIS-based) continuous surface using a triangulated irregular network (TIN) method representing rent prices. Hence, by overlaying and tagging functions, the values of rent price were estimated for the office firm database.
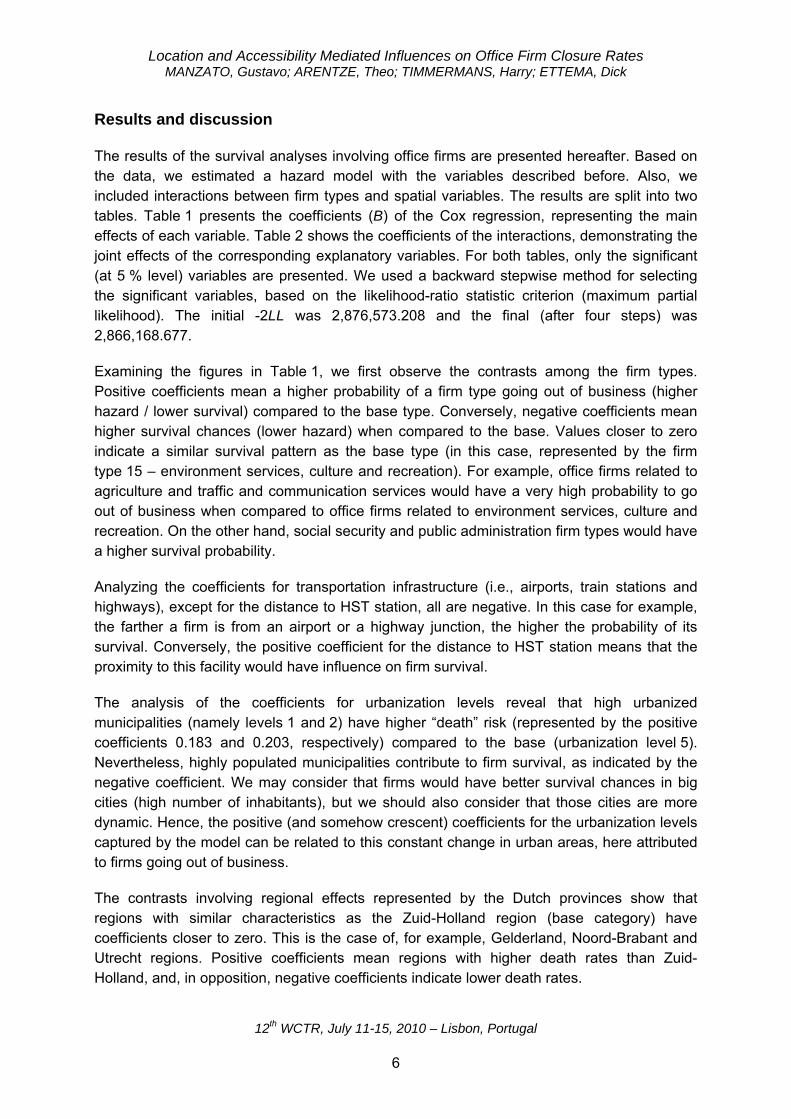
Finally, to carry out the survival analyses, two additional variables were computed: 1) the duration (in years) that each firm was present between 1997 and 2006; and 2) a status variable (binary) defining whether a firm “died” or not (if the firm existed in 2006, its value equals to zero, i.e., right-censored case). These are considered the dependent variables in the hazard model. Figure 1 presents the spatial configuration of the office firms used in this study. Each dot represents one of the 286.874 firms and embeds the variables described before.
Figure 1 – Spatial distribution of office firms
Location and Accessibility Mediated Influences on Office Firm Closure Rates MANZATO, Gustavo; ARENTZE, Theo; TIMMERMANS, Harry; ETTEMA, Dick
12th WCTR, July 11-15, 2010 – Lisbon, Portugal
6
Results and discussion
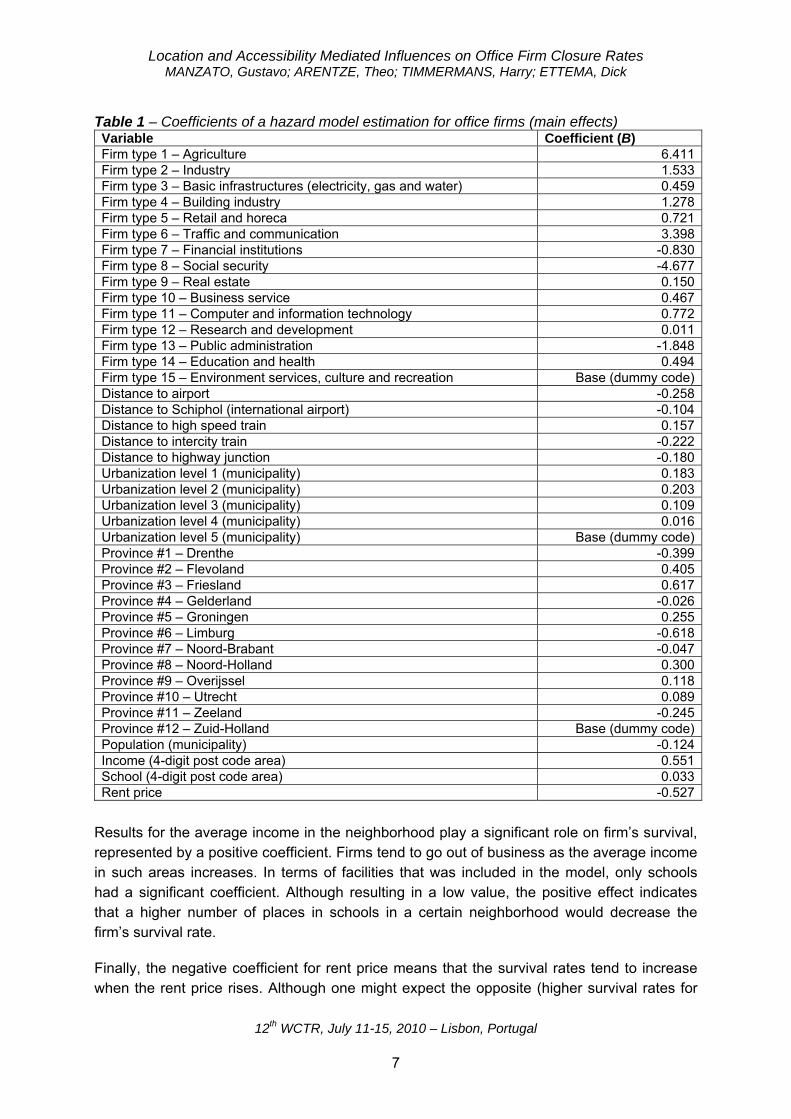
The results of the survival analyses involving office firms are presented hereafter. Based on the data, we estimated a hazard model with the variables described before. Also, we included interactions between firm types and spatial variables. The results are split into two tables. Table 1 presents the coefficients (B) of the Cox regression, representing the main effects of each variable. Table 2 shows the coefficients of the interactions, demonstrating the joint effects of the corresponding explanatory variables. For both tables, only the significant (at 5 % level) variables are presented. We used a backward stepwise method for selecting the significant variables, based on the likelihood-ratio statistic criterion (maximum partial likelihood). The initial -2LL was 2,876,573.208 and the final (after four steps) was 2,866,168.677.
Examining the figures in Table 1, we first observe the contrasts among the firm types. Positive coefficients mean a higher probability of a firm type going out of business (higher hazard / lower survival) compared to the base type. Conversely, negative coefficients mean higher survival chances (lower hazard) when compared to the base. Values closer to zero indicate a similar survival pattern as the base type (in this case, represented by the firm type 15 – environment services, culture and recreation). For example, office firms related to agriculture and traffic and communication services would have a very high probability to go out of business when compared to office firms related to environment services, culture and recreation. On the other hand, social security and public administration firm types would have a higher survival probability.
Analyzing the coefficients for transportation infrastructure (i.e., airports, train stations and highways), except for the distance to HST station, all are negative. In this case for example, the farther a firm is from an airport or a highway junction, the higher the probability of its survival. Conversely, the positive coefficient for the distance to HST station means that the proximity to this facility would have influence on firm survival.
The analysis of the coefficients for urbanization levels reveal that high urbanized municipalities (namely levels 1 and 2) have higher “death” risk (represented by the positive coefficients 0.183 and 0.203, respectively) compared to the base (urbanization level 5). Nevertheless, highly populated municipalities contribute to firm survival, as indicated by the negative coefficient. We may consider that firms would have better survival chances in big cities (high number of inhabitants), but we should also consider that those cities are more dynamic. Hence, the positive (and somehow crescent) coefficients for the urbanization levels captured by the model can be related to this constant change in urban areas, here attributed to firms going out of business.
The contrasts involving regional effects represented by the Dutch provinces show that regions with similar characteristics as the Zuid-Holland region (base category) have coefficients closer to zero. This is the case of, for example, Gelderland, Noord-Brabant and Utrecht regions. Positive coefficients mean regions with higher death rates than Zuid-Holland, and, in opposition, negative coefficients indicate lower death rates.
Location and Accessibility Mediated Influences on Office Firm Closure Rates MANZATO, Gustavo; ARENTZE, Theo; TIMMERMANS, Harry; ETTEMA, Dick
12th WCTR, July 11-15, 2010 – Lisbon, Portugal
7
Table 1 – Coefficients of a hazard model estimation for office firms (main effects) Variable Coefficient (B) Firm type 1 – Agriculture 6.411Firm type 2 – Industry 1.533Firm type 3 – Basic infrastructures (electricity, gas and water) 0.459Firm type 4 – Building industry 1.278Firm type 5 – Retail and horeca 0.721Firm type 6 – Traffic and communication 3.398Firm type 7 – Financial institutions -0.830Firm type 8 – Social security -4.677Firm type 9 – Real estate 0.150Firm type 10 – Business service 0.467Firm type 11 – Computer and information technology 0.772Firm type 12 – Research and development 0.011Firm type 13 – Public administration -1.848Firm type 14 – Education and health 0.494Firm type 15 – Environment services, culture and recreation Base (dummy code)Distance to airport -0.258Distance to Schiphol (international airport) -0.104Distance to high speed train 0.157Distance to intercity train -0.222Distance to highway junction -0.180Urbanization level 1 (municipality) 0.183Urbanization level 2 (municipality) 0.203Urbanization level 3 (municipality) 0.109Urbanization level 4 (municipality) 0.016Urbanization level 5 (municipality) Base (dummy code)Province #1 – Drenthe -0.399Province #2 – Flevoland 0.405Province #3 – Friesland 0.617Province #4 – Gelderland -0.026Province #5 – Groningen 0.255Province #6 – Limburg -0.618Province #7 – Noord-Brabant -0.047Province #8 – Noord-Holland 0.300Province #9 – Overijssel 0.118Province #10 – Utrecht 0.089Province #11 – Zeeland -0.245Province #12 – Zuid-Holland Base (dummy code)Population (municipality) -0.124Income (4-digit post code area) 0.551School (4-digit post code area) 0.033Rent price -0.527
Results for the average income in the neighborhood play a significant role on firm’s survival, represented by a positive coefficient. Firms tend to go out of business as the average income in such areas increases. In terms of facilities that was included in the model, only schools had a significant coefficient. Although resulting in a low value, the positive effect indicates that a higher number of places in schools in a certain neighborhood would decrease the firm’s survival rate.
Finally, the negative coefficient for rent price means that the survival rates tend to increase when the rent price rises. Although one might expect the opposite (higher survival rates for
Location and Accessibility Mediated Influences on Office Firm Closure Rates MANZATO, Gustavo; ARENTZE, Theo; TIMMERMANS, Harry; ETTEMA, Dick
12th WCTR, July 11-15, 2010 – Lisbon, Portugal
8
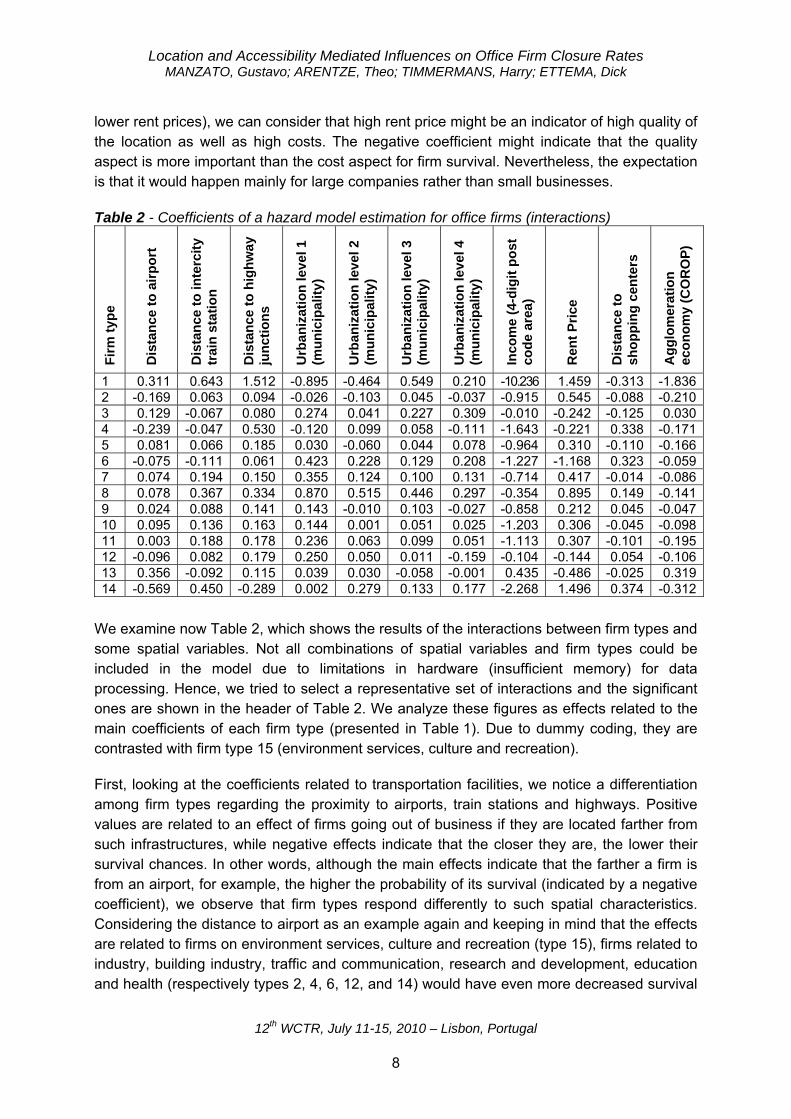
lower rent prices), we can consider that high rent price might be an indicator of high quality of the location as well as high costs. The negative coefficient might indicate that the quality aspect is more important than the cost aspect for firm survival. Nevertheless, the expectation is that it would happen mainly for large companies rather than small businesses.
Table 2 - Coefficients of a hazard model estimation for office firms (interactions)
Fir
m t
ype
Dis
tan
ce t
o a
irp
ort
Dis
tan
ce t
o in
terc
ity
trai
n s
tati
on
Dis
tan
ce t
o h
igh
way
ju
nct
ion
s
Urb
aniz
atio
n le
vel 1
(m
un
icip
alit
y)
Urb
aniz
atio
n le
vel 2
(m
un
icip
alit
y)
Urb
aniz
atio
n le
vel 3
(m
un
icip
alit
y)
Urb
aniz
atio
n le
vel 4
(m
un
icip
alit
y)
Inco
me
(4-d
igit
po
st
cod
e ar
ea)
Ren
t P
rice
Dis
tan
ce t
o
sho
pp
ing
cen
ters
Ag
glo
mer
atio
n
eco
no
my
(CO
RO
P)
1 0.311 0.643 1.512 -0.895 -0.464 0.549 0.210 -10.236 1.459 -0.313 -1.8362 -0.169 0.063 0.094 -0.026 -0.103 0.045 -0.037 -0.915 0.545 -0.088 -0.2103 0.129 -0.067 0.080 0.274 0.041 0.227 0.309 -0.010 -0.242 -0.125 0.0304 -0.239 -0.047 0.530 -0.120 0.099 0.058 -0.111 -1.643 -0.221 0.338 -0.1715 0.081 0.066 0.185 0.030 -0.060 0.044 0.078 -0.964 0.310 -0.110 -0.1666 -0.075 -0.111 0.061 0.423 0.228 0.129 0.208 -1.227 -1.168 0.323 -0.0597 0.074 0.194 0.150 0.355 0.124 0.100 0.131 -0.714 0.417 -0.014 -0.0868 0.078 0.367 0.334 0.870 0.515 0.446 0.297 -0.354 0.895 0.149 -0.1419 0.024 0.088 0.141 0.143 -0.010 0.103 -0.027 -0.858 0.212 0.045 -0.04710 0.095 0.136 0.163 0.144 0.001 0.051 0.025 -1.203 0.306 -0.045 -0.09811 0.003 0.188 0.178 0.236 0.063 0.099 0.051 -1.113 0.307 -0.101 -0.19512 -0.096 0.082 0.179 0.250 0.050 0.011 -0.159 -0.104 -0.144 0.054 -0.10613 0.356 -0.092 0.115 0.039 0.030 -0.058 -0.001 0.435 -0.486 -0.025 0.31914 -0.569 0.450 -0.289 0.002 0.279 0.133 0.177 -2.268 1.496 0.374 -0.312
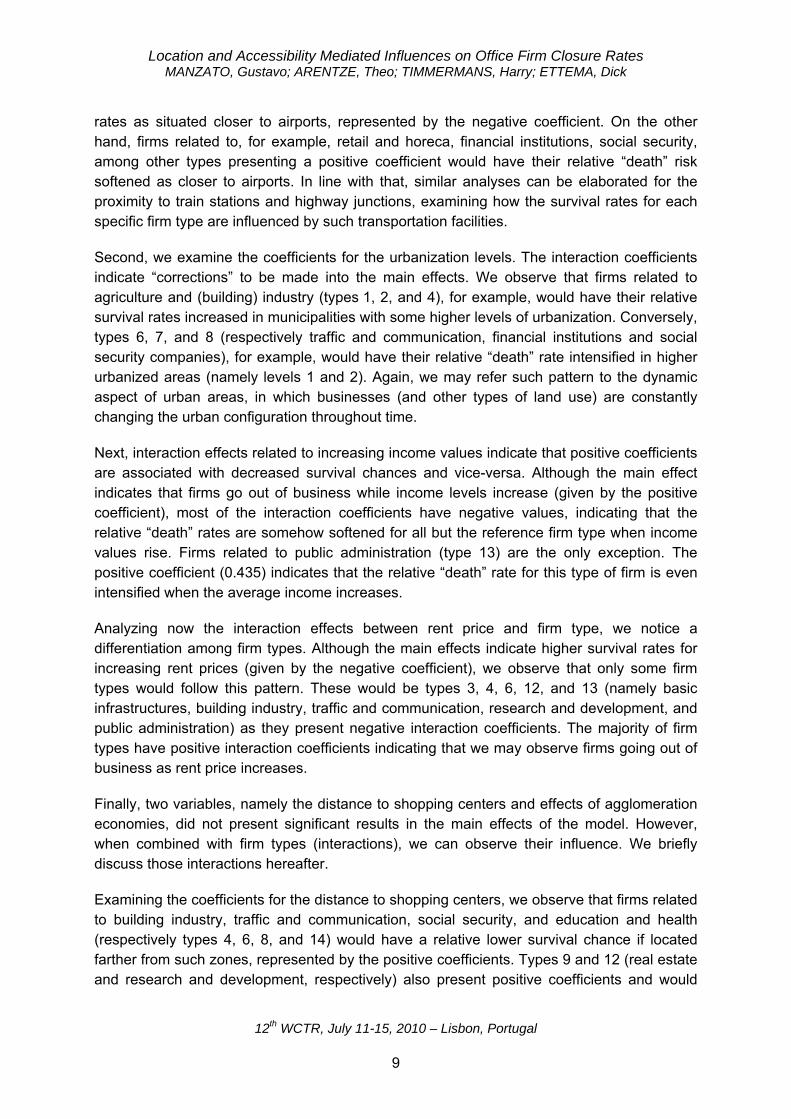
We examine now Table 2, which shows the results of the interactions between firm types and some spatial variables. Not all combinations of spatial variables and firm types could be included in the model due to limitations in hardware (insufficient memory) for data processing. Hence, we tried to select a representative set of interactions and the significant ones are shown in the header of Table 2. We analyze these figures as effects related to the main coefficients of each firm type (presented in Table 1). Due to dummy coding, they are contrasted with firm type 15 (environment services, culture and recreation).
First, looking at the coefficients related to transportation facilities, we notice a differentiation among firm types regarding the proximity to airports, train stations and highways. Positive values are related to an effect of firms going out of business if they are located farther from such infrastructures, while negative effects indicate that the closer they are, the lower their survival chances. In other words, although the main effects indicate that the farther a firm is from an airport, for example, the higher the probability of its survival (indicated by a negative coefficient), we observe that firm types respond differently to such spatial characteristics. Considering the distance to airport as an example again and keeping in mind that the effects are related to firms on environment services, culture and recreation (type 15), firms related to industry, building industry, traffic and communication, research and development, education and health (respectively types 2, 4, 6, 12, and 14) would have even more decreased survival
Location and Accessibility Mediated Influences on Office Firm Closure Rates MANZATO, Gustavo; ARENTZE, Theo; TIMMERMANS, Harry; ETTEMA, Dick
12th WCTR, July 11-15, 2010 – Lisbon, Portugal
9
rates as situated closer to airports, represented by the negative coefficient. On the other hand, firms related to, for example, retail and horeca, financial institutions, social security, among other types presenting a positive coefficient would have their relative “death” risk softened as closer to airports. In line with that, similar analyses can be elaborated for the proximity to train stations and highway junctions, examining how the survival rates for each specific firm type are influenced by such transportation facilities.
Second, we examine the coefficients for the urbanization levels. The interaction coefficients indicate “corrections” to be made into the main effects. We observe that firms related to agriculture and (building) industry (types 1, 2, and 4), for example, would have their relative survival rates increased in municipalities with some higher levels of urbanization. Conversely, types 6, 7, and 8 (respectively traffic and communication, financial institutions and social security companies), for example, would have their relative “death” rate intensified in higher urbanized areas (namely levels 1 and 2). Again, we may refer such pattern to the dynamic aspect of urban areas, in which businesses (and other types of land use) are constantly changing the urban configuration throughout time.
Next, interaction effects related to increasing income values indicate that positive coefficients are associated with decreased survival chances and vice-versa. Although the main effect indicates that firms go out of business while income levels increase (given by the positive coefficient), most of the interaction coefficients have negative values, indicating that the relative “death” rates are somehow softened for all but the reference firm type when income values rise. Firms related to public administration (type 13) are the only exception. The positive coefficient (0.435) indicates that the relative “death” rate for this type of firm is even intensified when the average income increases.
Analyzing now the interaction effects between rent price and firm type, we notice a differentiation among firm types. Although the main effects indicate higher survival rates for increasing rent prices (given by the negative coefficient), we observe that only some firm types would follow this pattern. These would be types 3, 4, 6, 12, and 13 (namely basic infrastructures, building industry, traffic and communication, research and development, and public administration) as they present negative interaction coefficients. The majority of firm types have positive interaction coefficients indicating that we may observe firms going out of business as rent price increases.
Finally, two variables, namely the distance to shopping centers and effects of agglomeration economies, did not present significant results in the main effects of the model. However, when combined with firm types (interactions), we can observe their influence. We briefly discuss those interactions hereafter.
Examining the coefficients for the distance to shopping centers, we observe that firms related to building industry, traffic and communication, social security, and education and health (respectively types 4, 6, 8, and 14) would have a relative lower survival chance if located farther from such zones, represented by the positive coefficients. Types 9 and 12 (real estate and research and development, respectively) also present positive coefficients and would
Location and Accessibility Mediated Influences on Office Firm Closure Rates MANZATO, Gustavo; ARENTZE, Theo; TIMMERMANS, Harry; ETTEMA, Dick
12th WCTR, July 11-15, 2010 – Lisbon, Portugal
10
follow the same pattern regardless of their low values (respectively, 0.045 and 0.054). These would better indicate a similar pattern as environment services, culture and recreation related companies (type 15), the base firm type. Conversely, we observe the firm types that would have (relatively to firm type 15) better survival rates if located more distant to shopping centers, represented by the negative coefficients. Examples comprise firm types 1, 3, 5, and 11 (agriculture, basic infrastructure, retail and horeca, and computer and information technology, respectively). Companies related to industry, financial institutions, business service, and public administration (respectively types 2, 7, 10, and 13) also would have better survival chances if shopping centers are situated distant. However, their low values also indicate a similar pattern as firm type 15.
Lastly, except for two types of firms (3 and 13), effects of agglomeration economies represent an influencing factor on firm survival. The negative coefficients found in most of firm types indicate that the higher the number of firms (of the same type) around, the better the survival chances. We can observe some examples of firm types that benefit from the agglomeration economies effect, such as: agriculture, (building) industry, retail and horeca, social security, computer and information technology, and education and health related-companies (respectively, types 1, 2, 4, 5, 8, 11, and 14).
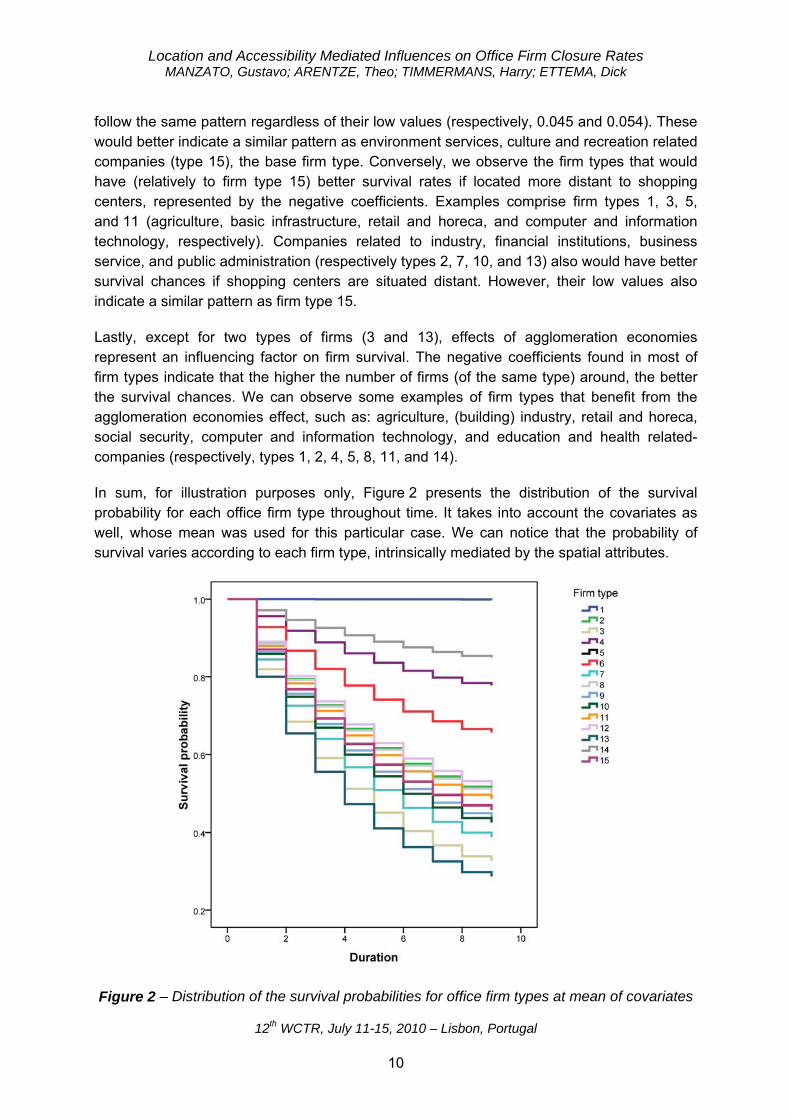
In sum, for illustration purposes only, Figure 2 presents the distribution of the survival probability for each office firm type throughout time. It takes into account the covariates as well, whose mean was used for this particular case. We can notice that the probability of survival varies according to each firm type, intrinsically mediated by the spatial attributes.
Figure 2 – Distribution of the survival probabilities for office firm types at mean of covariates
Location and Accessibility Mediated Influences on Office Firm Closure Rates MANZATO, Gustavo; ARENTZE, Theo; TIMMERMANS, Harry; ETTEMA, Dick
12th WCTR, July 11-15, 2010 – Lisbon, Portugal
11
CONCLUSIONS
In this paper, we have examined the implications of accessibility and other urban characteristics mediating the probability of firm closure. We have assessed the closure/survival of office firms using a proportional hazard model based on a 10-years time series data from The Netherlands.
Firstly, we observe the set of covariates used to estimate the model. Of the variables considered, most of them presented significance on explaining firm closure. The selected set of covariates covers the urban characteristics in a plausible way, comprising accessibility, urbanization, facilities services, socio-economic and pricing aspects. Also, regional effects are captured by the model, explaining the pattern of firm closure across the country. Furthermore, the behavior regarding survival rates of each office firm type is demonstrated by specific coefficients.
Secondly, the interaction effects between covariates and firm types brought better understanding on firm closure patterns regarding urban characteristics. We notice that office firm types respond differently to the set of urban characteristics delineated, specifying the adjustments on the main effects. That is, for each type we observed a specific trend on firm closure. Additionally, two covariates (proximity to shopping centers and effects of agglomeration economies) did not present significance on the main effects but when combined with firm types, we observe their relevance in the model.
In sum, our focus is on a firm demographic approach to firm dynamics and the findings delineated here will compose a model to predict the probability of firm closure. Alternatively to the proportional hazard modeling approach, parametric survival models will be examined, allowing such predictions of firm closure. Along with other aspects such as firm start-ups, relocations and growth, which findings will be reported in the near future, these are in turn part of a multi agent system to simulate the co-evolution of firm dynamics and the changes in activity-travel patterns.
ACKNOWLEDGEMENTS
Supported by the Programme Alβan (the European Union Programme of High Level Scholarships for Latin America, scholarship no. E07D400519BR). The authors also would like to thank The Environmental Assessment Agency (PBL) for providing the data about firms used in this study.
Location and Accessibility Mediated Influences on Office Firm Closure Rates MANZATO, Gustavo; ARENTZE, Theo; TIMMERMANS, Harry; ETTEMA, Dick
12th WCTR, July 11-15, 2010 – Lisbon, Portugal
12
REFERENCES
Abraham, J.; Hunt, J. (1999). Firm location in the MEPLAN model of Sacramento. Transportation Research Record: Journal of the Transportation Research Board, 1685, 187-198.
Allison, P. D. (2004). Event history analysis. In: Handbook of Data Analysis (A. E. Bryman; M. Hardy, eds.), pp. 369-386. Sage, Thousand Oaks, CA.
Audretsch, D. B.; Mahmood, T. (1995). New firm survival: new results using a hazard function. The Review of Economics and Statistics, 77, 97-103.
Bok, M. d.; Sanders, F. (2005). Firm location and the accessibility of locations: empirical results from The Netherlands. In: Proceedings of the 84th Annual Meeting of the Transportation Research Board.
Bok, M. d.; Bliemer, M. C. J. (2006). Land use and transportation interaction: calibration of a micro simulation model for firms in The Netherlands. In: Proceedings of the 85th Annual Meeting of the Transportation Research Board.
Collett, D. (1994). Modelling Survival Data in Medical Research. Chapman & Hall, London. Edwards, L. (1983). Towards a process model of office-location decision making.
Environment and Planning A, 15, 1327-1342. Elgar, I.; Miller, E. (2006). Conceptual model of location of small office firms. Transportation
Research Record: Journal of the Transportation Research Board, 1977, 190-196. Elgar, I.; Miller, E. (2007). Office location decisions: analysis of the results of SOLD. In:
Proceedings of the 86th Annual Meeting of the Transportation Research Board. Elgar, I.; Farooq, B.; Miller, E. (2009). Modeling location decisions of office firms: introducing
anchor points and constructing choice-sets into the model system. In: Proceedings of the 88th Annual Meeting of the Transportation Research Board.
Fotopoulos, G.; Louri, H. (2000). Location and survival of new entry. Small Business Economics, 14, 311-321.
Görg, H.; Strobl, E. (2000). Multinational companies, technology spillovers and firm survival: evidence from Irish manufacturing. Research paper. Centre for Research on Globalization and Labour Markets. Available on-line at: www.gep.org.uk/shared/shared_levpublications/Research_Papers/2000/00_12.pdf
Hosmer Jr, D. W.; Lemeshow, S. (1999). Applied Survival Analysis: Regression Modeling of Time to Event Data. Wiley & Sons Inc., USA.
Khan, A. S.; Abraham, J. E.; Hunt, J. D. (2002). A system for microsimulating business establishments: analysis, design and results. In: International Colloquium on the Behavioural Foundations of Integrated Land-Use and Transportation Models (Quebec City).
Kleinbaum, D. G.; Klein, M. (2005). Survival Analysis: A Self-Learning Text. Springer, USA. Maoh, H. F.; Kanaroglou, P. S.; Buliung, R. N. (2002). Modelling the location of firms within
an integrated transport and land-use model for Hamilton, Ontario. In: International Colloquium on the Behavioural Foundations of Integrated Land-Use and Transportation Models (Quebec City).
Moeckel, R. (2009). Simulation of firms as a planning support system to limit urban sprawl of jobs. Environment and Planning B: Planning and Design, 36, 883-905.
Location and Accessibility Mediated Influences on Office Firm Closure Rates MANZATO, Gustavo; ARENTZE, Theo; TIMMERMANS, Harry; ETTEMA, Dick
12th WCTR, July 11-15, 2010 – Lisbon, Portugal
13
Norušis, M. J. (2008). SPSS 16.0 Advanced Statistical Procedures Companion. Prentice Hall Inc., Upper Saddle River.
Perez, S. E.; Llopis, A. S.; Llopis, J. A. S. (2004). The determinants of survival of Spanish manufacturing firms. Review of Industrial Organization, 25, 251-273.
Smith, P. J. (2002). Analysis of Failure and Survival Data. Chapman & Hall, USA. Stearns, T. M.; Carter, N. M.; Reynolds, P. D.; Williams, M. L. (1995). New firm survival:
industry, strategy, and location. Journal of Business Venturing, 10, 23-42. Vittinghoff, E.; Glidden, D. V.; Shiboski, S. C.; McCulloch, C. E. (2005). Regression Methods
in Biostatistics: Linear, Logistic, Survival, and Repeated Measures Models. Springer, USA.
Wissen, L. v. (2000). A micro-simulation model of firms: applications of concepts of the demography of the firm. Papers in Regional Science, 79, 111-134.
Waddell, P.; Borning, A.; Noth, M.; Freier, N.; Becke, M.; Ulfarsson, G. (2003). Microsimulation of urban development and location choices: design and implementation of UrbanSim. Networks and Spatial Economics, 3, 43-67.
Related Documents