Annals of Operations Research 132, 301–322, 2004 2004 Kluwer Academic Publishers. Manufactured in The Netherlands. Locating Hybrid Fuel Cell–Turbine Power Generation Units under Uncertainty LAURA A. SCHAEFER [email protected] Mechanical Engineering Department, University of Pittsburgh, 643 Benedum Hall, Pittsburgh, PA 15261, USA ANDREW J. SCHAEFER [email protected] Department of Industrial Engineering, University of Pittsburgh, 1048 Benedum Hall, Pittsburgh, PA 15261, USA Abstract. Hybrid gas turbine–solid oxide fuel cell power generation has the potential to create a positive economic and environmental impact. Annually, the U.S. spends over $235 billion on electricity, and elec- tric utilities emit 550 million metric tons of carbon. The integration of distributed hybrid generation can reduce these emissions and costs through increased efficiencies. In this paper, a model is presented that minimizes the costs of distributed hybrid generation while optimally locating the units within the existing electric infrastructure. The model utilizes data from hybrid generation modules, and includes uncertainty in customer demand, weather, and fuel costs. Keywords: distributed generation, LCA, stochastic programming, integer programming 1. Introduction In recent years, distributed generation has received increasing attention from both the engineering and business communities. Distributed generation is defined as the place- ment of power generating modules of 30 MegaWatts (MW) or less near the end user (OFE, 2002). These modules can be used to entirely replace larger central power plants, or can be used for peak shaving and stand-by power. Distributed generation power modules may either be connected to the power grid or operated in isolated condi- tions. Many of the technologies being considered for distributed generation applications are attractive both economically and environmentally. Some common distributed gen- eration technologies are reciprocating internal combustion engines, for applications of less than 10 MW; combustion turbines, for applications larger than 5 MW; microtur- bines, which can produce between 30 and 200 KiloWatts (kW); and fuel cells, which have the potential to generate power in the MW range (Kincaid, 1999). When solid oxide fuel cells (SOFCs) and turbines are combined into hybrid power generating systems, unprecedented levels of efficiency can be achieved. Within the past year, Siemens Westinghouse has produced a 220-kW hybrid power system that is ca- pable of generating electric power at55% efficiency. Additionally, by 2002, the EPA’s

Welcome message from author
This document is posted to help you gain knowledge. Please leave a comment to let me know what you think about it! Share it to your friends and learn new things together.
Transcript
Annals of Operations Research 132, 301–322, 2004 2004 Kluwer Academic Publishers. Manufactured in The Netherlands.
Locating Hybrid Fuel Cell–Turbine Power GenerationUnits under Uncertainty
LAURA A. SCHAEFER [email protected] Engineering Department, University of Pittsburgh, 643 Benedum Hall, Pittsburgh, PA 15261,USA
ANDREW J. SCHAEFER [email protected] of Industrial Engineering, University of Pittsburgh, 1048 Benedum Hall, Pittsburgh,PA 15261, USA
Abstract. Hybrid gas turbine–solid oxide fuel cell power generation has the potential to create a positiveeconomic and environmental impact. Annually, the U.S. spends over $235 billion on electricity, and elec-tric utilities emit 550 million metric tons of carbon. The integration of distributed hybrid generation canreduce these emissions and costs through increased efficiencies. In this paper, a model is presented thatminimizes the costs of distributed hybrid generation while optimally locating the units within the existingelectric infrastructure. The model utilizes data from hybrid generation modules, and includes uncertaintyin customer demand, weather, and fuel costs.
Keywords: distributed generation, LCA, stochastic programming, integer programming
1. Introduction
In recent years, distributed generation has received increasing attention from both theengineering and business communities. Distributed generation is defined as the place-ment of power generating modules of 30 MegaWatts (MW) or less near the end user(OFE, 2002). These modules can be used to entirely replace larger central powerplants, or can be used for peak shaving and stand-by power. Distributed generationpower modules may either be connected to the power grid or operated in isolated condi-tions.
Many of the technologies being considered for distributed generation applicationsare attractive both economically and environmentally. Some common distributed gen-eration technologies are reciprocating internal combustion engines, for applications ofless than 10 MW; combustion turbines, for applications larger than 5 MW; microtur-bines, which can produce between 30 and 200 KiloWatts (kW); and fuel cells, whichhave the potential to generate power in the MW range (Kincaid, 1999).
When solid oxide fuel cells (SOFCs) and turbines are combined into hybrid powergenerating systems, unprecedented levels of efficiency can be achieved. Within the pastyear, Siemens Westinghouse has produced a 220-kW hybrid power system that is ca-pable of generating electric power at 55% efficiency. Additionally, by 2002, the EPA’s
302 SCHAEFER AND SCHAEFER
Environmental Science Center at Fort Meade will be powered by a 1-MW hybrid fuelcell–turbine plant. These prototypes already show great promise in increasing efficiencyand lowering global warming gas emissions. It has been predicted that hybrid systemswill be able to achieve efficiencies of 70–80%, and that hybrid plants will produce 50times less nitrous oxide than current conventional gas turbines and 75% less carbondioxide than coal-fired power plants (NETL, 2001).
While it is likely that hybrid systems will indeed greatly reduce greenhouse gasemissions while producing economical power generation, the estimated savings that arecommonly published do not account for the total economic impact of implementingdistributed hybrid generation systems. The research outlined in this paper will focuson the analyses that must be performed in order to examine the economic feasibility andconsequences of implementing hybrid fuel cell–turbine systems as distributed generationunits.
First, the optimal placement of the hybrid power modules must be consideredso that they can be effectively interconnected with the existing electric infrastructure.Through data collection and mathematical modeling techniques, we have replicated acity, with its various industrial, commercial, and residential power needs, and its sur-rounding region for an urban area similar to Pittsburgh, PA. Pittsburgh is a medium-sized American city that traditionally generates much of its power using coal, but thathas a well-established natural gas infrastructure. Additionally, many Pittsburgh electriccustomers are already exploring alternative power generation sources, including localgeneration and low-impact wind farms. The power needs of the various sectors (whichare realistically distributed geographically) have been evaluated, and plants have beenassigned a variety of generation potentials, and then placed so as to minimize costs (and,incidentally, transmission losses).
Since the operation of power generation systems involves a significant amount ofuncertainty, any model for optimally designing these systems must address this issue.Uncertainty can include varying supply and demand as well as factors such as the reg-ulatory environment. The demand for different types of energy is also uncertain, anddepends on factors such as economic growth, availability, and price relative to othertypes of energy. Other uncertain aspects include environmental impact, technologicalchange, and available raw materials. Clearly, uncertainty is pervasive in the design andoperation of power systems.
Stochastic programming is an appropriate tool for many problems arising in theoptimal design of power systems, including facility location and network design. Addi-tionally, scenarios can represent various combinations of the uncertain aspects of energyproblems. The model outlined above includes a variety of uncertain factors, such aspower demand, raw fuel costs, and weather patterns.
Energy security and network reliability issues have also been considered. As thedemand for electricity grows, and as homeland security becomes a higher priority, theissue of energy security will become increasingly important. When distributed genera-tion units fail due to either natural causes or deliberate actions, the integrity of the power
LOCATING HYBRID FUEL CELL–TURBINE 303
grid must be maintained. It is possible that the use of distributed generation will be ableto increase energy security without increasing electricity costs.
Although the current model focuses on minimizing the economic impact, it is pos-sible to adapt the model to also incorporate environmental factors. This adaptation couldbe implemented through the incorporation of a life-cycle assessment of a hybrid gener-ation unit. This assessment must focus not only on the fuel cell and the gas turbine, butalso on the complete system. During the operating life of the hybrid plant, fuel resourceusage costs and waste disposal costs should also be incorporated.
Whether evaluating hybrid generation solely on an economic or also on an environ-mental basis, the results from the model can be used to not only compare hybrid distrib-uted generation with conventional power generation techniques, but also with “cutting-edge” technologies, such as photovoltaics and wind farms.
2. Distributed generation and the electric industry
2.1. Deregulation
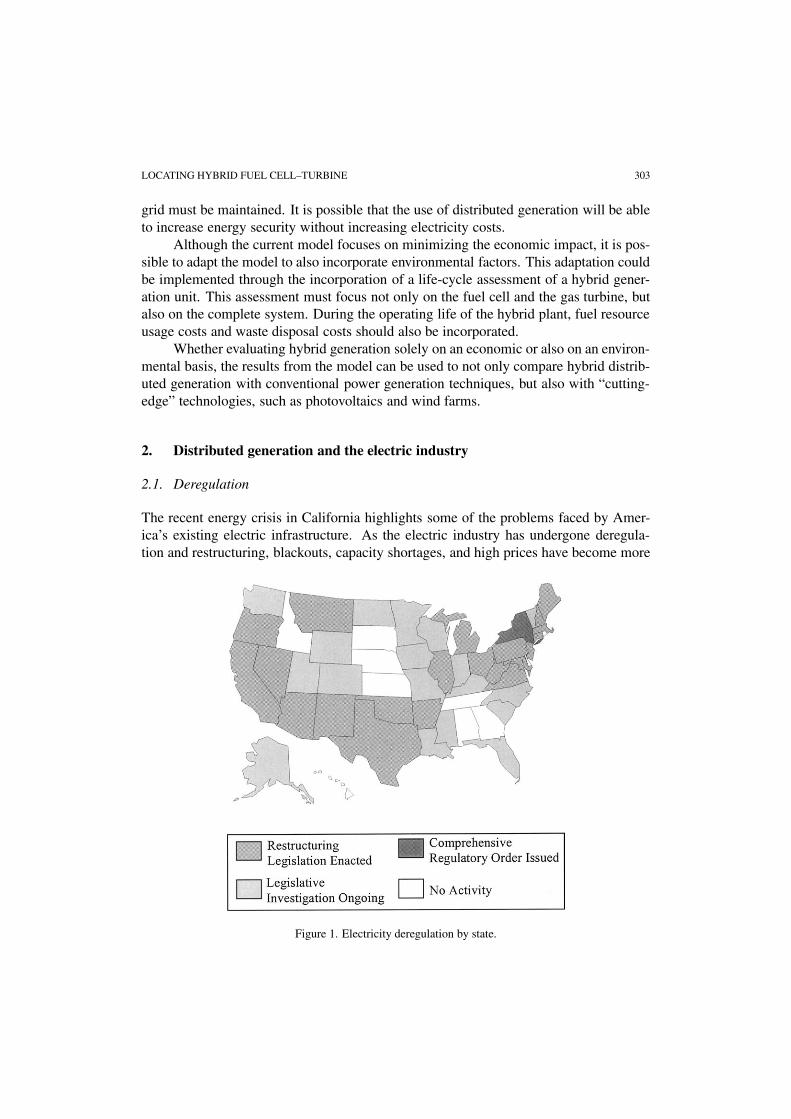
The recent energy crisis in California highlights some of the problems faced by Amer-ica’s existing electric infrastructure. As the electric industry has undergone deregula-tion and restructuring, blackouts, capacity shortages, and high prices have become more
Figure 1. Electricity deregulation by state.

304 SCHAEFER AND SCHAEFER
common, as have fears about power reliability. Figure 1 shows the current status ofderegulation in the United States (Carner, 2001).
Under deregulation, the transmission, generation, and distribution functions of theutilities are divided into separate and distinct businesses. This has the potential to cre-ate an active power trading market, and increase the attractiveness of distributed powergeneration (Hoffman et al., 1999).
2.2. Distributed generation
When implemented in a partially or fully deregulated environment, distributed genera-tion can be used to provide an alternative power source, reliable back-up power, or peakshaving. As an alternative power source, it is assumed that distributed hybrid generationwould take the place of conventional high-emission central power plants that would oth-erwise be built. Distributed hybrid generation is also attractive as a source of stand-bypower for companies that would incur large costs from the losses of productivity andprofits that occur during blackouts.
Utilizing distributed hybrid generation for peak shaving is attractive both econom-ically and environmentally. As outlined in the previous subsection, not only do the high-est electrical rates occur at peak times, but peak usage can also determine fixed chargesfor an entire year. Additionally, it is often the oldest and least efficient generators thatmust be utilized in order to meet peak power demands, thereby increasing emissions.
3. Hybrid fuel cell–turbine power generation
As stated in the introduction, when SOFCs and turbines are combined, very high levelsof efficiency can result. The properties of each of these units and the means by whichthey are integrated will be briefly explained.
A SOFC operates at 800–1000◦C, so it can utilize any hydrocarbon fuel (due tointernal reformation) to produce electricity. A hybrid system operates by placing stacksof SOFCs on the high-pressure side of a cycle while a gas turbine operates as a bottomingengine. A simplified diagram of this interaction is given in figure 2 (Lundberg et al.,2001). Fuel is supplied to the fuel cell, a pre-fuel cell air heater, and a post-fuel cellexhaust combustor. If the fuel is natural gas, it must first pass through a desulfurizer.The turbine can directly generate AC power by means of an air-cooled generator, but thefuel cell’s DC power output must first be passed through a matrix of inverters. Althoughthe electrochemical direct energy conversion that occurs in the fuel cell is more efficientthan the combustion in the turbine section of the cycle, recent work suggests that reducedfuel utilization may have a negligible effect on the system efficiency while reducing costs(Haynes and Wepfer, 2000).
Additional balance-of-plant components include the interconnecting piping, a pro-grammable logic controller, backup fuel storage tanks, internal thermal insulation, waterstorage tanks, a startup boiler, an entering air filter, and an inert gas (usually nitrogen)safety system. The air filter is used to clean the air before it enters the compressor, and

LOCATING HYBRID FUEL CELL–TURBINE 305
Figure 2. A hybrid power system.
the startup boiler is used to bring the fuel cell subsystem up to its operating temperature.For an accurate analysis, all of these components must be included with the fuel cellstack and turbine to determine the total system cost.
Currently, directed research initiatives such as the Solid State Energy ConversionAlliance (SECA) have focused on the development of solid-state fuel cells. Throughapplication flexibility and mass production, SECA aims to lower the cost of SOFCs to$400/kW within the next decade (Williams and Surdoval, 2000). Research is also beingconducted through other programs into advanced turbine technology.
4. Optimal power network design
Several issues regarding distributed power generation remain unexamined. One is theoptimal location of the power plants. Power plants should be located near customers tominimize transmission losses. Transmission losses are proportional to the distance thepower is transmitted. If power generators are close to customers, transmission losseswill be smaller. Certain locations may not be permitted due to zoning restrictions, ormay be prohibitively expensive. Closely related to the question of locating power plantsis determining where each type of plant should be located. Different types of plants havedifferent power generation capacities, different environmental impacts, and so on. Forinstance, a small generator may be desirable for a residential neighborhood, whereas alarger generator might be appropriate adjacent to an industrial park.

306 SCHAEFER AND SCHAEFER
Another issue is energy security and reliability. Distributed power systems shouldbe at least as reliable as the existing power infrastructure. The goal is to minimize thefixed cost of constructing power generators plus the expected cost of delivering power tocustomers. This methodology could also consider the possibility of multiple generatorsfailing. The result is a network design that can recover from individual power failureswithout a corresponding power disruption. The model presented in this paper can easilybe extended to consider this case.
Customer demand varies over time. Demand for power varies by time of day, dayof the week, and time of year. In addition, random factors such as weather contributeuncertainty. The methodology we are proposing can consider uncertain and dynamiccustomer demand, minimizing the expected cost of generating and distributing electric-ity.
Given the enormous costs of new power plants, the need for methods that can op-timally determine a distributed power network and the best way to deliver power to cus-tomers is clear. One goal of this project is to demonstrate the advantages of distributedpower generation. Using fuel cell technology, the efficiency of hybrid power systemsincreases dramatically. By making distributed power more reliable and efficient, thisresearch will yield environmental benefits as well. We believe that by considering lowertransmission losses and reliability the benefits of distributed power may be even greaterthan current expectations. We will demonstrate that it is possible to design reliable powernetworks that can meet uncertain and changing demands for power.
4.1. Deterministic power network design
We first consider the case where customer demand is known with certainty, and eachpower generator is always available. Let I = {1, . . . , |I |} be the set of all possiblelocations for power plants, let J = {1, . . . , |J |} be a set of customers, and let K ={1, . . . , |K|} be a set of possible power plant configurations. Let xik be 1 if a plant oftype k is located at i, and let it be 0, otherwise, and let cik be the cost of building aplant of type k at location i. This cost will include the initial construction cost, and thepresent value of any fixed operating costs. We assume that only one power plant typeis allowed at any location. Let yij be the amount of power supplied from the plant atlocation i to customer j . Let dij be the per-unit cost of supplying power from a plant ati to customer j . This cost includes the present value of any variable operating costs andtransmission losses. Let gk be the power capacity of a plant of type k, and let hj be thedemand of customer j .
The goal is to minimize the sum of the fixed costs plus the variable costs, i.e.,
min∑i∈I
∑k∈K
cikxik +∑i∈I
∑j∈J
dij yij . (1)
LOCATING HYBRID FUEL CELL–TURBINE 307
This objective function is to be minimized subject to several sets of constraints. Eachcustomer demand must be satisfied, so
∑i∈I
yij = hj , ∀j ∈ J. (2)
Only one type of power plant may be built at any location, so
∑k∈K
xik � 1, ∀i ∈ I. (3)
A power plant may only supply power if it has been built. Furthermore, it may not supplymore power than its total capacity, so
∑j∈J
yij �∑k∈K
gkxik, ∀i ∈ I. (4)
The variables yij must be nonnegative.This is a capacitated facility location problem, which is well studied in the opti-
mization literature. The major difficulty is that the x variables are required to be either0 or 1. However, it is possible to solve large-scale instances to optimality using in-teger programming techniques. In addition, many heuristics have been developed forcapacitated facility location problems (Bramel and Simchi-Levi, 1997; Mirchandani andFrancis, 1990).
4.2. Considering uncertain power demand
The demand for power is not constant, and it is not known with certainty. Residentialpower demand is usually higher in the summer than in the spring. Industrial powerdemand may depend on regional economic growth. However, the vast majority ofpower network design models do not consider this inherent uncertainty. We believethat deterministic planning models are insufficient for long-range power planning prob-lems.
In such cases, the objective should be to minimize the current cost of constructingpower facilities, plus the expected cost of delivering power to customers. Let ξ1, . . . , ξr
be a set of possible scenarios. A scenario is a complete description of a possible out-come of the randomness in the system. Initially we consider the case where a scenariodescribes each customer’s power demand. For any scenario ξ�, with 1 � � � r, let p�
be the probability that scenario ξ� occurs. We assume that these scenarios are mutuallyexclusive, and together describe all possible states, so that sum of the p� probabilitiesis 1.
308 SCHAEFER AND SCHAEFER
For any scenario ξ�, let yij (ξ�) be the amount of power supplied from the powerplant located at i to the customer located at j , let dij (ξ�) be the per-unit cost, and lethj(ξ�) be the demand of customer j under scenario ξ�. The model then becomes
min∑i∈I
∑k∈K
cikxik +r∑
�=1
p�
∑i∈I
∑j∈J
dij (ξ�)yij (ξ�), (5)
subject to
∑i∈I
yij (ξ�) = hj(ξ�), ∀j ∈ J, 1 � � � r, (6)
∑j∈J
yij (ξ�) �∑k∈K
gkxik, ∀i ∈ I, 1 � � � r, (7)
∑k∈K
xik � 1, ∀i ∈ I, (8)
xik ∈ {0, 1}, ∀i ∈ I, ∀k ∈ K, (9)
yij (ξ�) � 0, ∀i ∈ I, ∀j ∈ J, 1 � � � r. (10)
This model minimizes the fixed cost plus the expected power distribution cost sub-ject to several constraints. Constraints (6) require that each customer receive enoughpower to satisfy demand. Constraints (7) allow power to be generated by a generator oftype k located at i only if such a generator was actually built. Constraints (8) require atmost one generator to be placed at any location.
This model is a two-stage stochastic integer program, and the formulation given in(5)–(10) is called the extensive form formulation. This problem can be solved by a Ben-ders’ decomposition approach, called the L-shaped method (Benders, 1962; Van Slykeand Wets, 1969). This method decomposes the problem into two stages. The first stagedetermines where the generators are to be located. The second stage is solved for everyscenario, and optimally delivers power for that scenario given the location of the genera-tors. Information about the cost of this arrangement flows back to the first-stage problem.This procedure is iterated until an optimal decision is found.
We illustrate this decomposition approach using the L-shaped method of Van Slykeand Wets (Van Slyke and Wets, 1969). Let θ represent the second-stage cost. Therestricted master problem is as follows:
min∑i∈I
∑k∈K
cikxik + θ, (11)
subject to
∑k∈K
xik � 1, ∀i ∈ I, (12)
LOCATING HYBRID FUEL CELL–TURBINE 309
∑k∈K
∑i∈I
gkxik � max1���r
(∑j∈J
hj (ξ�)
), (13)
∑k∈K
∑i∈I
Ehikxik + θ � eh, h = 1, . . . , H, (14)
xik ∈ {0, 1}, ∀i ∈ I, ∀k ∈ K. (15)
Constraint (13) forces any solution to this restricted master problem to allow fea-sible solutions in the second stage. Clearly, any solution satisfying (13) must allowsufficient power to be generated for every scenario. This constraint eliminates the needfor the feasibility cuts that are typically required in the L-shaped method. Let x̄ be asolution to this restricted master problem on iteration H . For every scenario 1 � � � r,the following subproblem is solved:
min∑i∈I
∑j∈J
dij (ξ�)yij (ξ�), (16)
subject to ∑i∈I
yij (ξ�) = hj(ξ�), ∀j ∈ J, 1 � � � r, (17)
∑i∈I
yij (ξ�) �∑k∈K
gkx̄ik, ∀i ∈ I, 1 � � � r, (18)
yij (ξ�) � 0, ∀i ∈ I, ∀j ∈ J, 1 � � � r. (19)
Let πj� be the dual variables on constraints (17) and let σi� be the dual variableson constraints (18). Then for all i ∈ I , all k ∈ K, and all scenarios �, let Eik =∑r
�=1 p�(−σi�gk) and let e� = ∑r�=1
∑j∈J p�πj�hj (ξ�). If the constraint in (14) cuts
off the current solution, it is added to the restricted master. Otherwise, the solution isoptimal and the algorithm terminates.
The multi-cut version of Birge and Louveaux (1988) creates a theta variable forevery scenario, and then creates a cut similar to (14) for every scenario. These cuts areadded for those scenarios for which they are binding. Numerical experiments for sto-chastic linear programs indicate that the multi-cut version is preferred when the num-ber of realizations r is not significantly larger than the number of first-stage constraints(Birge and Louveaux, 1988, 1997; Gassmann, 1990). However, Smith, Schaefer, andYen (2002) found that when the first-stage problem is an integer program, the singlecut version was preferable even with many fewer scenarios relative to the number offirst-stage constraints.
5. Data collection and generation
Our formulated city is based on a real urban area, and our model considers historical dataas well as projections as to hybrid power generation capabilities. The model evaluatesdifferent network node placements, random power demands, and customer distributions,
310 SCHAEFER AND SCHAEFER
and considers how the system functions for each of these scenarios. Our belief is thatpower networks that explicitly consider these random factors will perform better thanthose that do not.
5.1. Fuel cell costs and capabilities
Ten types of hybrid generation modules were selected, ranging from 250 kW to 10 MWin size. For each of these sizes, it is assumed that the gas turbine provides less than25% of the power. It is also assumed that the generation capability of the units does notsignificantly decrease over the life of the plant. This is a reasonable assumption sinceindividual fuel cells have been found to degrade at a rate of 0.1% for 1000 hours of life,and faulty or cracked cells can be replaced through routine maintenance (Forbes, 2001).
Cost and efficiency estimates for hybrid power generation modules vary widely.The Solid State Energy Conversion Alliance (SECA) predicts that fuel cells will cost$400/kW by 2010 (Williams and Surdoval, 2000). After incorporating a gas turbine andbalance of plant components, this cost rises to approximately $825/kW. Other sourcespredict hybrid unit costs of $1491/kW and $2236/kW (Khandkar, Hartvigsen, and Elan-govan, 2000; MacKerron, 2000). One source predicted a cost of ¥526,000/kW (approx-imately $4015/kW), but this value has been treated as an outlying point and ignoredfor the purpose of this analysis (Tanaka, Wen, and Yamada, 2000). Maintenance costsshould also be included in the first cost estimates, and have been calculated to have apresent worth of 22% of the first costs (Riensche, Stimmung, and Unverzagt, 1998).
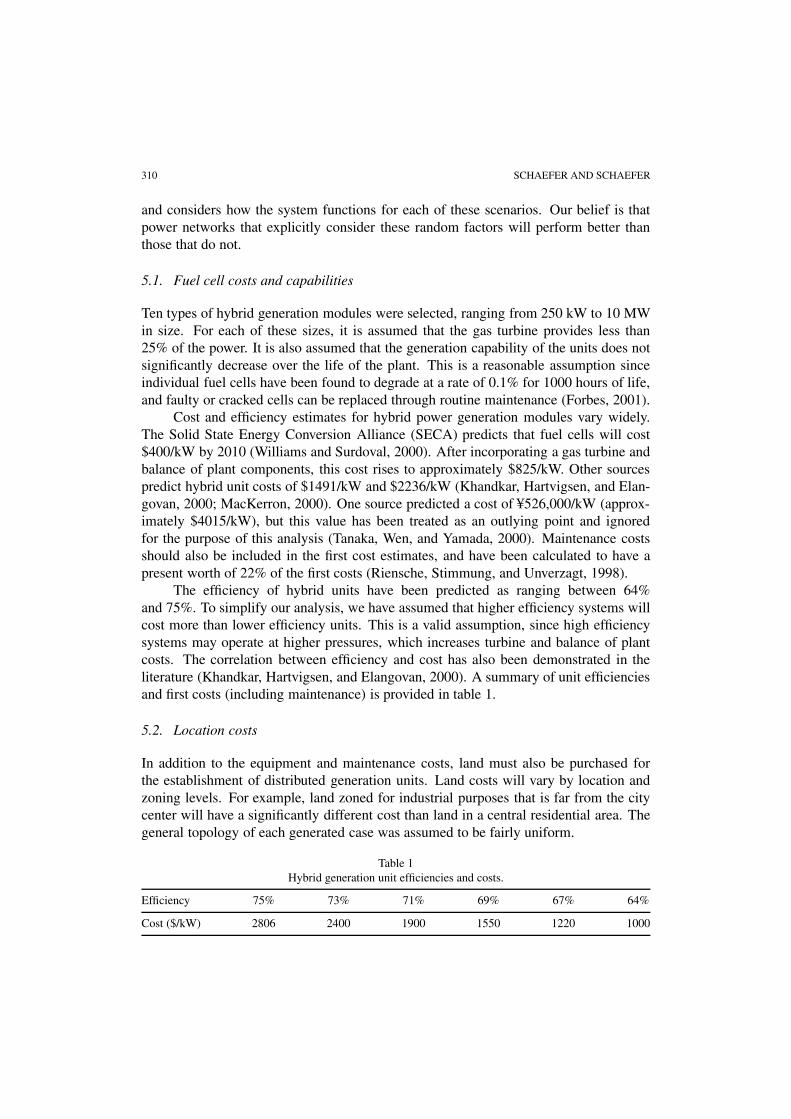
The efficiency of hybrid units have been predicted as ranging between 64%and 75%. To simplify our analysis, we have assumed that higher efficiency systems willcost more than lower efficiency units. This is a valid assumption, since high efficiencysystems may operate at higher pressures, which increases turbine and balance of plantcosts. The correlation between efficiency and cost has also been demonstrated in theliterature (Khandkar, Hartvigsen, and Elangovan, 2000). A summary of unit efficienciesand first costs (including maintenance) is provided in table 1.
5.2. Location costs
In addition to the equipment and maintenance costs, land must also be purchased forthe establishment of distributed generation units. Land costs will vary by location andzoning levels. For example, land zoned for industrial purposes that is far from the citycenter will have a significantly different cost than land in a central residential area. Thegeneral topology of each generated case was assumed to be fairly uniform.
Table 1Hybrid generation unit efficiencies and costs.
Efficiency 75% 73% 71% 69% 67% 64%
Cost ($/kW) 2806 2400 1900 1550 1220 1000

LOCATING HYBRID FUEL CELL–TURBINE 311
Furthermore, it is unlikely that potential residential, commercial, and industrialsites will overlap geographically. To account for this variation, a three-level staggeredgrid was developed for the placement of the possible hybrid generation units. The gridlength scale was designed so that the maximum potential transmission loss from a plantto a consumer is 4% (Rastler, 2002). Recent real estate sales in the Pittsburgh areawere examined, and representative land values were assigned to the grid points. Landsizes were selected based on current technology, in which a Siemens–Westinghouse 250-kW hybrid generation unit has a footprint of 37.8 ft × 11.7 ft (Forbes, 2001). Industriallocations were found to range in value from $25,000 to $150,000, commercial sites from$65,000 to $350,000, and residential areas from $40,000 to $300,000.
5.3. Raw fuel costs
Currently, hybrid power generation units are designed to be primarily fueled by naturalgas. Over the past three years, natural gas prices in the United States have fluctuatedwidely. Gas prices in Pennsylvania have followed this national trend. In October 1999,an average residential customer in Pennsylvania paid $9.07 for a thousand cubic feet ofgas. In October 2001, the same customer paid $12.06 (Kass, 2002). Gas prices alsovary during the course of a year. During 2001, Pennsylvania residential consumers paidbetween $10.09 and $16.83 per thousand cubic feet. Different types of consumers alsopay different rates. Residential users pay the highest rates, followed by commercial andthen industrial customers. Electric utilities pay the lowest rate. (Electric utility costsoccasionally rise above industrial rates.)
Because of the large power generation levels that can be provided by hybrid gen-eration, it will be assumed that hybrid units in residential areas can purchase power forcommercial rates, units in commercial areas can purchase power for industrial rates, andunits in industrial areas can purchase power at utility rates. Furthermore, using historicaldata, ten scenarios have been developed that will each occur with a given probability thatdetermine the level of each rate (Perritt, 2002). These rates vary depending on the seasonand on the likelihood of a regular, inexpensive, or expensive natural gas market duringeach season. The probability of each scenario is directly correlated to these variations inthe price of natural gas. These values are given in table 2.
Table 2Natural gas costs (dollars per thousand cubic feet). I = inexpensive, R = regular, E = expensive.
Winter Spring Summer FallI R E I E I R E R E
Residential rate 6.77 8.67 10.1 6.98 12.14 7.92 8.99 12.05 7.08 11.55Commercial rate 4.07 6.04 8.99 4.19 9.19 3.51 4.43 6.89 3.71 6.14Industrial rate 2.94 6.67 10 3.1 7.29 2.36 5.09 7 2.95 6Probability 0.05 0.15 0.1 0.2 0.1 0.025 0.1 0.025 0.15 0.1Scenario number 1 2 3 4 5 6 7 8 9 10

312 SCHAEFER AND SCHAEFER
5.4. Power costs
To calculate the cost of generating electricity, a number of factors must be considered.These include the heating value of the natural gas, the efficiency of the hybrid module,the fuel utilization factor, and the transmission losses between the hybrid generationunit and each customer. The heating value of natural gas varies by location and by thenature of the reforming process. An average value of 1019 Btu per thousand cubic feetof natural gas was used for this analysis. Additionally, it is physically impossible for anycycle to perfectly convert one form of energy into another. This is quantified through thecycle efficiency η, which is given in table 1.
The fuel utilization factor (FU) can be considered to be a design parameter in thecreation of hybrid power modules. For every thousand cubic feet of natural gas thatis provided to a hybrid power unit, only a fraction of that gas will actually be utilized(Appleby, 1993). In this analysis, a fuel utilization factor of 85% has been selected(Haynes and Wepfer, 2000). Finally, the distance between the generation unit and thecustomer also affects the cost of power. The transmission level varies between 95–99%of the generated power as a function of distance from the hybrid plant:
TL = 0.99 − 0.01414 dist(i, j), (20)
where TL is the transmission level and dist(i, j) is the normalized distance between planti and customer j .
Bringing all of these factors together, the cost of generating electricity for a givenplant, scenario, and customer is:
Transmission Cost
= ((Natural Gas Cost · 3412 Btu/kWh)/(1000 ft3 · 1019 Btu/ft3))
TL · η · FU. (21)
So for a 71% efficient plant located at (0.2, 1.2) in a commercial zone operating underscenario 7, the cost of delivering power to a customer located at (1.9, 1.7) is 2.55 �c/kWh.This cost includes fuel, maintenance, and time-averaged capital costs. Additional fac-tors, such as profitability and the ability to remain competitive in an active market willfurther affect the final price that customers will pay. In 2000, the average U.S. residentialcustomer paid 8.22 �c/kWh, the average commercial customer paid 7.22 �c/kWh, and theaverage industrial customer paid 4.46 �c/kWh (Schnapp and Quade, 2001).
5.5. Additional costs
In addition to economic costs, future work could also incorporate environmental emis-sions. These costs could be integrated through the assignment of carbon trading permitprices, or through environmental cost accounting. Life-cycle assessment (LCA) is auseful tool for evaluating the total environmental impact of a system. Instead of sim-ply examining the emissions generated during a system’s working life, LCA also looksat the issues associated with the creation and disposal of the structure. Coupling LCA
LOCATING HYBRID FUEL CELL–TURBINE 313
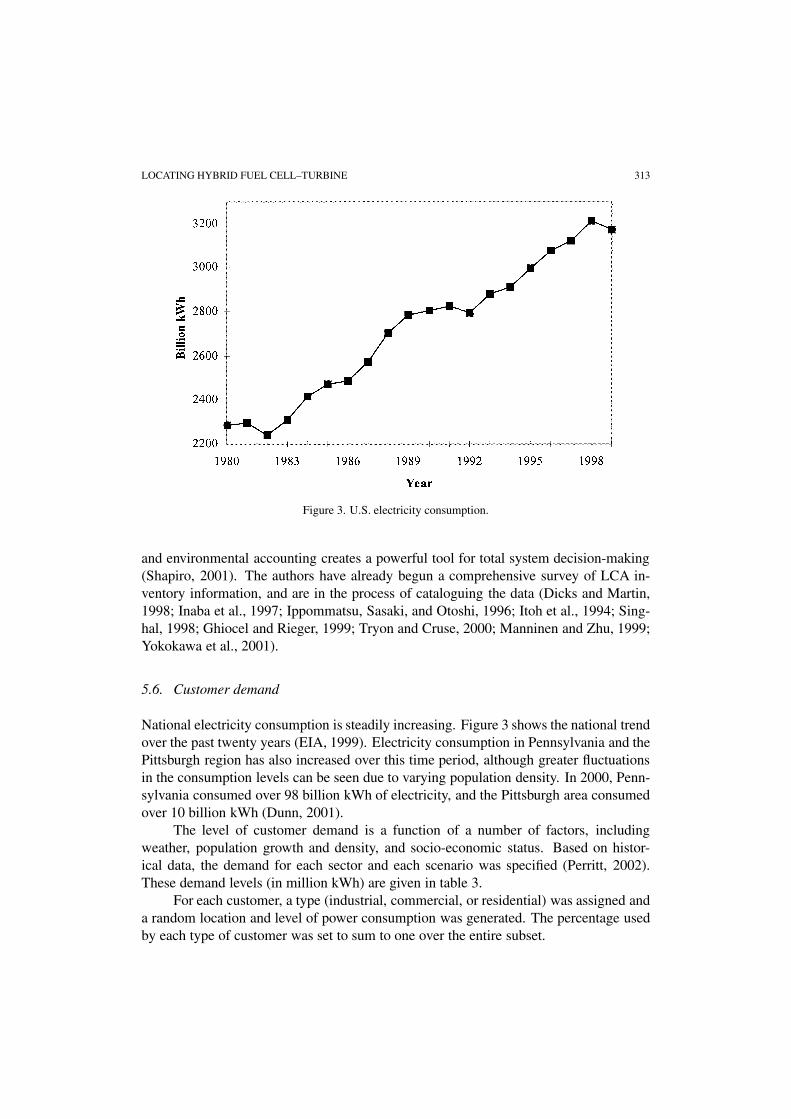
Figure 3. U.S. electricity consumption.
and environmental accounting creates a powerful tool for total system decision-making(Shapiro, 2001). The authors have already begun a comprehensive survey of LCA in-ventory information, and are in the process of cataloguing the data (Dicks and Martin,1998; Inaba et al., 1997; Ippommatsu, Sasaki, and Otoshi, 1996; Itoh et al., 1994; Sing-hal, 1998; Ghiocel and Rieger, 1999; Tryon and Cruse, 2000; Manninen and Zhu, 1999;Yokokawa et al., 2001).
5.6. Customer demand
National electricity consumption is steadily increasing. Figure 3 shows the national trendover the past twenty years (EIA, 1999). Electricity consumption in Pennsylvania and thePittsburgh region has also increased over this time period, although greater fluctuationsin the consumption levels can be seen due to varying population density. In 2000, Penn-sylvania consumed over 98 billion kWh of electricity, and the Pittsburgh area consumedover 10 billion kWh (Dunn, 2001).
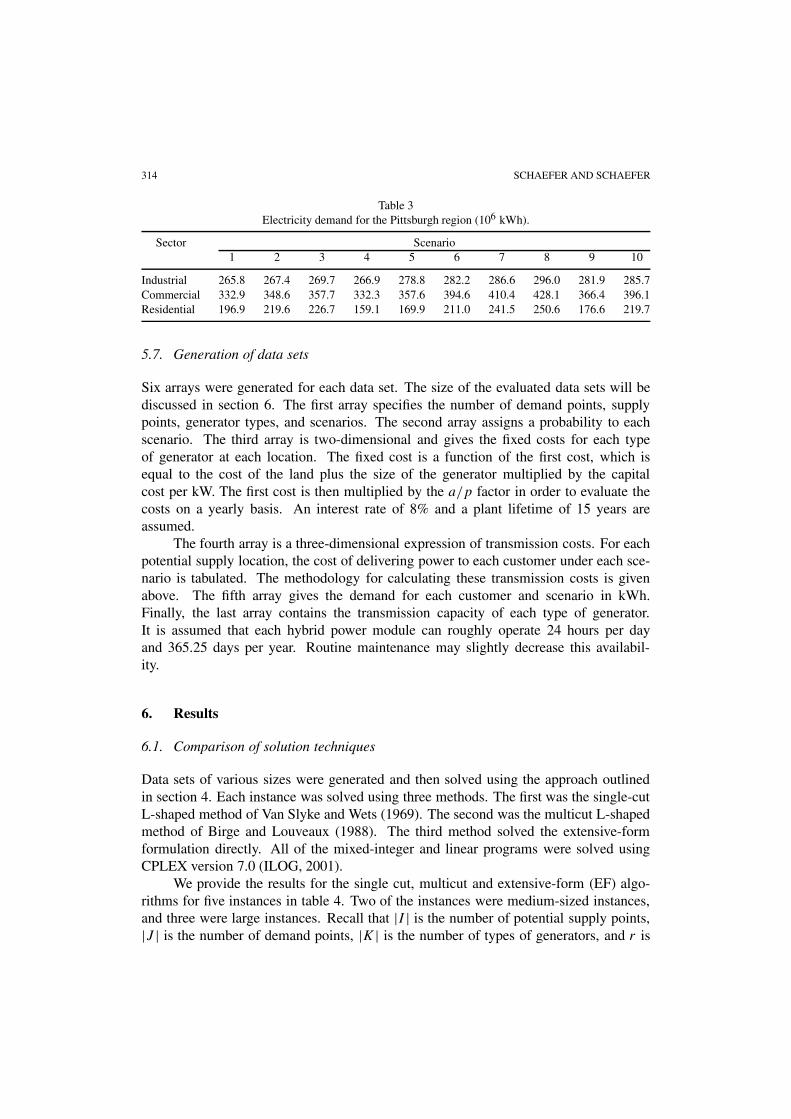
The level of customer demand is a function of a number of factors, includingweather, population growth and density, and socio-economic status. Based on histor-ical data, the demand for each sector and each scenario was specified (Perritt, 2002).These demand levels (in million kWh) are given in table 3.
For each customer, a type (industrial, commercial, or residential) was assigned anda random location and level of power consumption was generated. The percentage usedby each type of customer was set to sum to one over the entire subset.
314 SCHAEFER AND SCHAEFER
Table 3Electricity demand for the Pittsburgh region (106 kWh).
Sector Scenario1 2 3 4 5 6 7 8 9 10
Industrial 265.8 267.4 269.7 266.9 278.8 282.2 286.6 296.0 281.9 285.7Commercial 332.9 348.6 357.7 332.3 357.6 394.6 410.4 428.1 366.4 396.1Residential 196.9 219.6 226.7 159.1 169.9 211.0 241.5 250.6 176.6 219.7
5.7. Generation of data sets
Six arrays were generated for each data set. The size of the evaluated data sets will bediscussed in section 6. The first array specifies the number of demand points, supplypoints, generator types, and scenarios. The second array assigns a probability to eachscenario. The third array is two-dimensional and gives the fixed costs for each typeof generator at each location. The fixed cost is a function of the first cost, which isequal to the cost of the land plus the size of the generator multiplied by the capitalcost per kW. The first cost is then multiplied by the a/p factor in order to evaluate thecosts on a yearly basis. An interest rate of 8% and a plant lifetime of 15 years areassumed.
The fourth array is a three-dimensional expression of transmission costs. For eachpotential supply location, the cost of delivering power to each customer under each sce-nario is tabulated. The methodology for calculating these transmission costs is givenabove. The fifth array gives the demand for each customer and scenario in kWh.Finally, the last array contains the transmission capacity of each type of generator.It is assumed that each hybrid power module can roughly operate 24 hours per dayand 365.25 days per year. Routine maintenance may slightly decrease this availabil-ity.
6. Results
6.1. Comparison of solution techniques
Data sets of various sizes were generated and then solved using the approach outlinedin section 4. Each instance was solved using three methods. The first was the single-cutL-shaped method of Van Slyke and Wets (1969). The second was the multicut L-shapedmethod of Birge and Louveaux (1988). The third method solved the extensive-formformulation directly. All of the mixed-integer and linear programs were solved usingCPLEX version 7.0 (ILOG, 2001).
We provide the results for the single cut, multicut and extensive-form (EF) algo-rithms for five instances in table 4. Two of the instances were medium-sized instances,and three were large instances. Recall that |I | is the number of potential supply points,|J | is the number of demand points, |K| is the number of types of generators, and r is
LOCATING HYBRID FUEL CELL–TURBINE 315
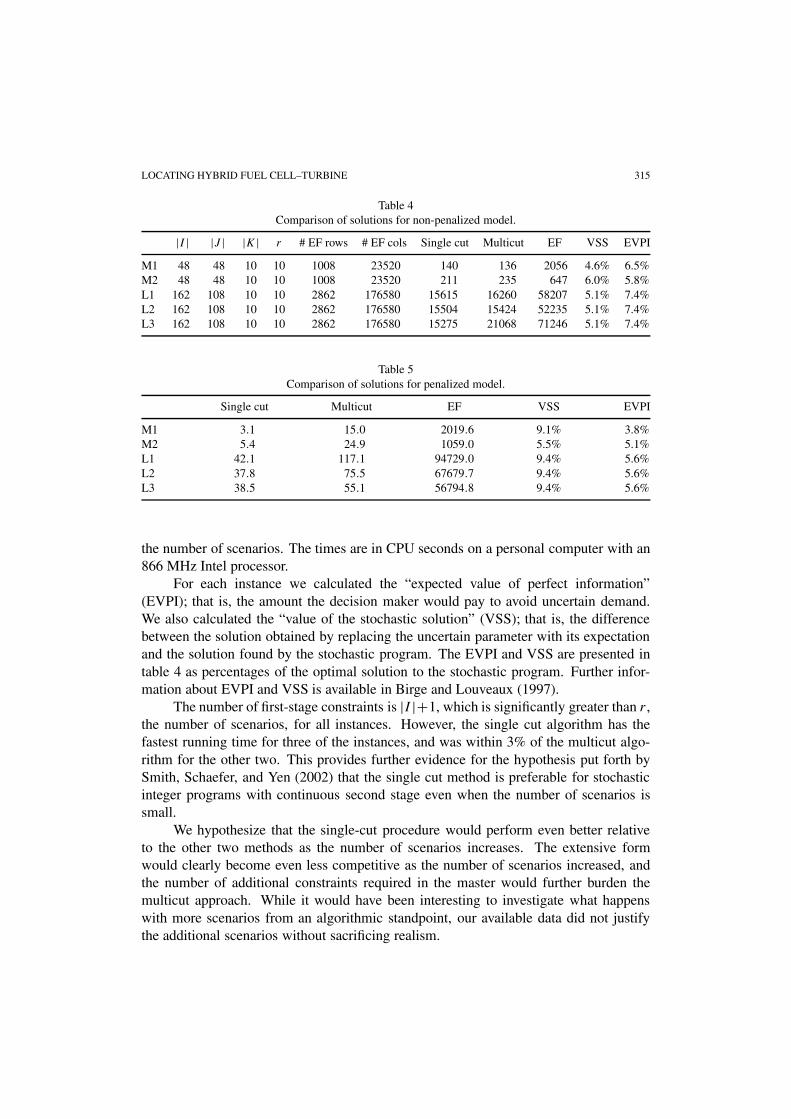
Table 4Comparison of solutions for non-penalized model.
|I | |J | |K| r # EF rows # EF cols Single cut Multicut EF VSS EVPI
M1 48 48 10 10 1008 23520 140 136 2056 4.6% 6.5%M2 48 48 10 10 1008 23520 211 235 647 6.0% 5.8%L1 162 108 10 10 2862 176580 15615 16260 58207 5.1% 7.4%L2 162 108 10 10 2862 176580 15504 15424 52235 5.1% 7.4%L3 162 108 10 10 2862 176580 15275 21068 71246 5.1% 7.4%
Table 5Comparison of solutions for penalized model.
Single cut Multicut EF VSS EVPI
M1 3.1 15.0 2019.6 9.1% 3.8%M2 5.4 24.9 1059.0 5.5% 5.1%L1 42.1 117.1 94729.0 9.4% 5.6%L2 37.8 75.5 67679.7 9.4% 5.6%L3 38.5 55.1 56794.8 9.4% 5.6%
the number of scenarios. The times are in CPU seconds on a personal computer with an866 MHz Intel processor.
For each instance we calculated the “expected value of perfect information”(EVPI); that is, the amount the decision maker would pay to avoid uncertain demand.We also calculated the “value of the stochastic solution” (VSS); that is, the differencebetween the solution obtained by replacing the uncertain parameter with its expectationand the solution found by the stochastic program. The EVPI and VSS are presented intable 4 as percentages of the optimal solution to the stochastic program. Further infor-mation about EVPI and VSS is available in Birge and Louveaux (1997).
The number of first-stage constraints is |I |+1, which is significantly greater than r,the number of scenarios, for all instances. However, the single cut algorithm has thefastest running time for three of the instances, and was within 3% of the multicut algo-rithm for the other two. This provides further evidence for the hypothesis put forth bySmith, Schaefer, and Yen (2002) that the single cut method is preferable for stochasticinteger programs with continuous second stage even when the number of scenarios issmall.
We hypothesize that the single-cut procedure would perform even better relativeto the other two methods as the number of scenarios increases. The extensive formwould clearly become even less competitive as the number of scenarios increased, andthe number of additional constraints required in the master would further burden themulticut approach. While it would have been interesting to investigate what happenswith more scenarios from an algorithmic standpoint, our available data did not justifythe additional scenarios without sacrificing realism.

316 SCHAEFER AND SCHAEFER
6.2. Modeling electricity demand with soft constraints
We performed another set of computational experiments in which the energy require-ments at the various demand points were relaxed, and any unmet demand was penal-ized. The penalties were set so that any additional electricity requirements could bepurchased at the seasonal average price for each sector. These penalty costs are likelyto be even higher during actual operation. The computational results are summarized intable 5.
Several interesting observations about the penalty models can be made. The ex-istence of penalties makes the decomposition approaches easier to solve, but not theextensive form. Furthermore, the single-cut approach always outperformed the multicutapproach, providing further evidence that in stochastic integer programs, the single cutapproach is generally preferable. For the three largest instances, in both the penalizedand non-penalized cases, the VSS and EVPI did not differ much across instances. Thisis due to the fact that the instances only differed in network topology, and that the otherunderlying data were similar.
6.3. Hybrid generator placement
For all of the data sets, the output level of the optimal solution closely matched themaximum total power requirement across scenarios. Furthermore, the majority of thehybrid generation units were chosen to be 10 MW in size, with the remaining sizesselected to equal the total power need. Upon examination, it was found that the first costs(including land and equipment costs) dominated the total cost, so the plant placementsuggested by the algorithm is logical.
Additionally, the least efficient plants were generally selected over more efficientunits. Again, this is because the $/kW cost overshadowed the $/kWh cost of transmittingpower. Interestingly, in some of the cases, industrial and commercial sites were chosenfor the plant locations even when residential sites were available for less money. How-ever, land costs were one to two orders of magnitude less than equipment costs, so thisresult could simply come from rounding within the optimization program.
To further illustrate these results, two representative cases will be examined. Incase 1, 48 supply points, 48 demand points, 10 scenarios, and 10 generator sizes werespecified. This is considered to be a medium-sized case. The supply and demand pointswere evenly split between the industrial, commercial, and residential sectors. For thecustomer distribution shown in figure 4, where the most expensive land is assigned topoint (0, 0), the optimal number and types of plants to build is shown in table 6. Themaximum total demand across sectors is 9.7469 · 108 kWh, and occurs during scenario 8.As can be seen from the table, the total amount of power provided by the solution is111.25 MW, or 9.7522 · 108 kWh per year, which closely matches the simulated city’srequirements.
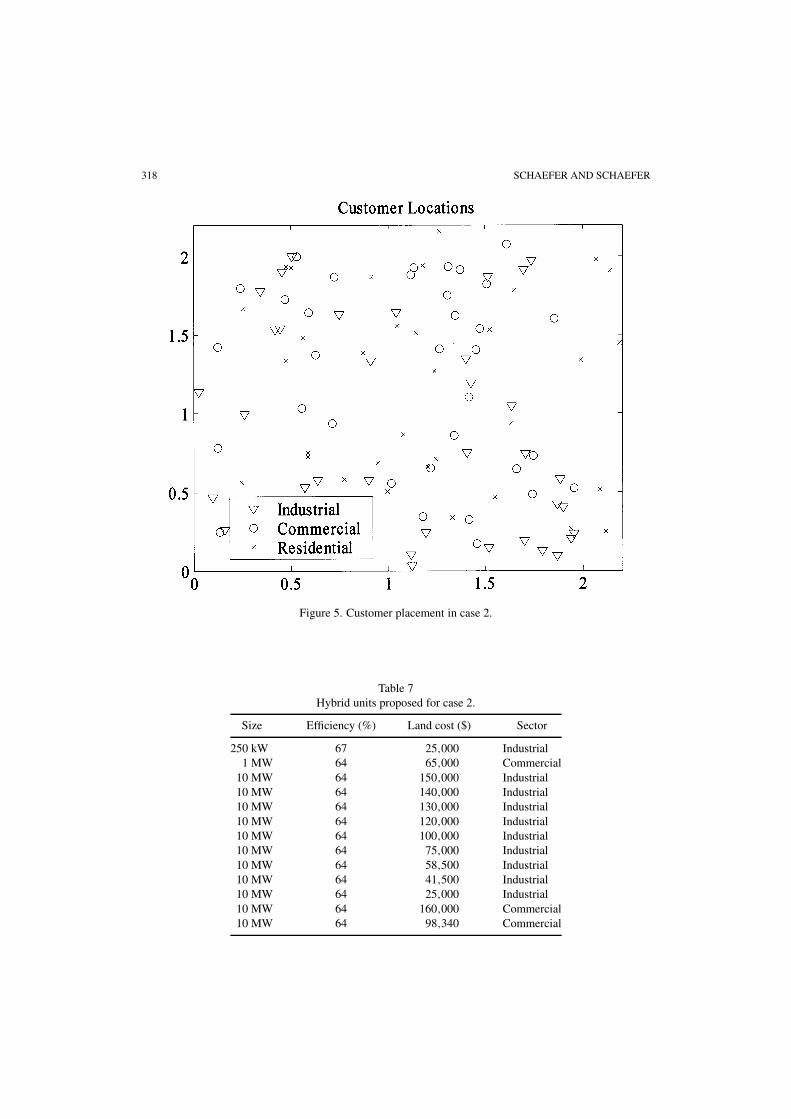
In case 2, a much larger number of supply and demand points were selected (thenumber of scenarios and generator types remained the same): 162 supply points and108 customer sets were created. (This is considered to be a large instance.) Again, the

LOCATING HYBRID FUEL CELL–TURBINE 317
Figure 4. Customer placement in case 1.
Table 6Hybrid units proposed for case 1.
Size Efficiency (%) Land cost ($) Sector
250 kW 64 80,000 Residential1 MW 67 150,000 Industrial4 MW 64 40,000 Residential6 MW 67 120,000 Industrial
10 MW 64 150,000 Industrial10 MW 64 120,000 Industrial10 MW 67 58,500 Industrial10 MW 64 58,500 Industrial10 MW 67 25,000 Industrial10 MW 64 25,000 Industrial10 MW 64 300,000 Commercial10 MW 64 200,000 Commercial10 MW 64 98,340 Commercial10 MW 64 65,000 Commercial
318 SCHAEFER AND SCHAEFER
Figure 5. Customer placement in case 2.
Table 7Hybrid units proposed for case 2.
Size Efficiency (%) Land cost ($) Sector
250 kW 67 25,000 Industrial1 MW 64 65,000 Commercial
10 MW 64 150,000 Industrial10 MW 64 140,000 Industrial10 MW 64 130,000 Industrial10 MW 64 120,000 Industrial10 MW 64 100,000 Industrial10 MW 64 75,000 Industrial10 MW 64 58,500 Industrial10 MW 64 41,500 Industrial10 MW 64 25,000 Industrial10 MW 64 160,000 Commercial10 MW 64 98,340 Commercial
LOCATING HYBRID FUEL CELL–TURBINE 319
supply and demand points were evenly split between the industrial, commercial, andresidential sectors. The locations of the customers are shown in figure 5. Thirteen plantlocations were selected, ten of which were placed in industrial areas, and three of whichwere placed in commercial locations, as shown in table 7. Twelve of the thirteen plantsoperated at the lowest specified efficiency, while the remaining plant operated at thesecond to lowest efficiency. As in case 1, the total amount of power provided by thesolution is 111.25 MW, which slightly exceeds the maximum amount of power requiredacross the scenarios.
7. Potential impact
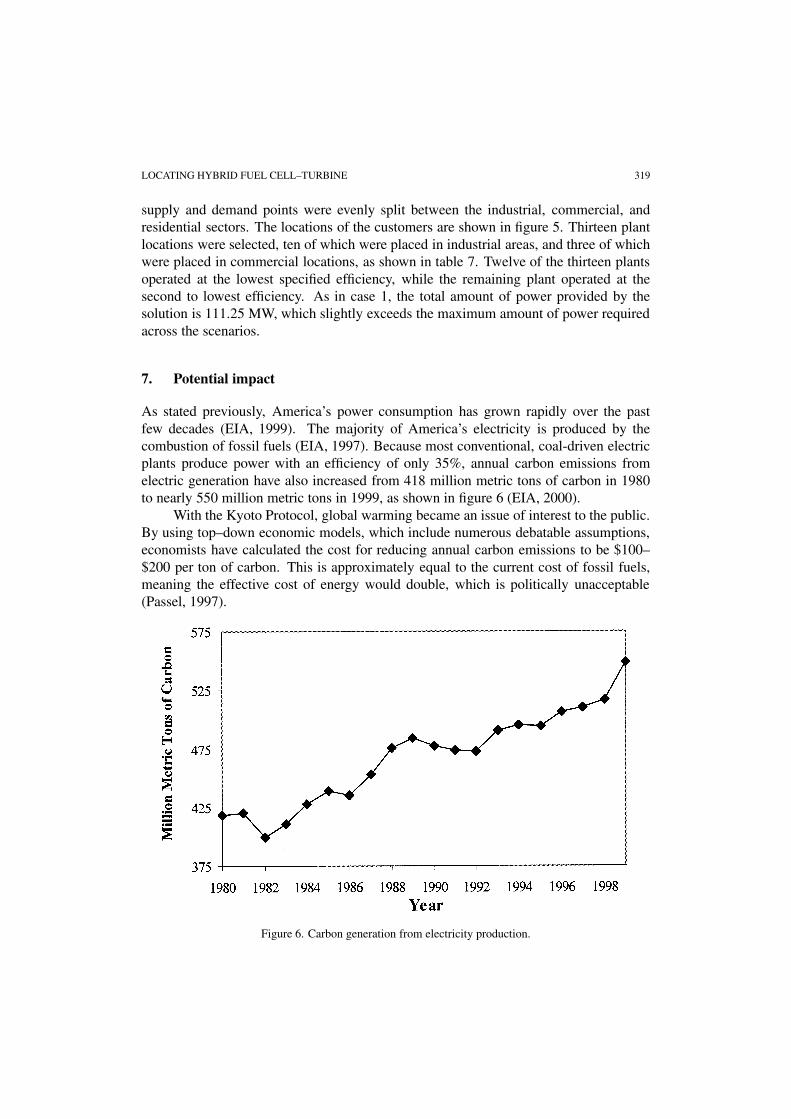
As stated previously, America’s power consumption has grown rapidly over the pastfew decades (EIA, 1999). The majority of America’s electricity is produced by thecombustion of fossil fuels (EIA, 1997). Because most conventional, coal-driven electricplants produce power with an efficiency of only 35%, annual carbon emissions fromelectric generation have also increased from 418 million metric tons of carbon in 1980to nearly 550 million metric tons in 1999, as shown in figure 6 (EIA, 2000).
With the Kyoto Protocol, global warming became an issue of interest to the public.By using top–down economic models, which include numerous debatable assumptions,economists have calculated the cost for reducing annual carbon emissions to be $100–$200 per ton of carbon. This is approximately equal to the current cost of fossil fuels,meaning the effective cost of energy would double, which is politically unacceptable(Passel, 1997).
Figure 6. Carbon generation from electricity production.

320 SCHAEFER AND SCHAEFER
Conversely, a bottom-up analysis that looks at high efficiency technology showsthat the use of such technology can give a neutral or positive economic payoff (Jacard,Bailie, and Nyboer, 1996). Hybrid distributed power generation is one example of thistype of technology. If the cost targets for SOFCs are met, hybrid systems will be able toproduce electricity at a price equal to or less than current conventional power generationelectric rates. Even a cost-neutral result would provide environmental benefits, sincehybrid systems can greatly reduce greenhouse gas emissions. Furthermore, if carbontrading is enacted, a hybrid system’s lower emissions would also produce economiccredits.
8. Conclusions
This paper discusses a method for optimizing the placement of distributed hybrid fuelcell–turbine power generation. In order to address the challenges to distributed gen-eration that may arise, it is important to understand hybrid generation’s true economicand environmental costs and benefits. It is also important to develop a flexible modelfor the optimal placement of distributed generation units so that they can be quicklyimplemented once the technology reaches a feasible cost and efficiency level.
Distributed power systems have vast potential since they may have a smaller ad-verse environmental impact than current power systems. The potential reduction ingreenhouse gas emissions is enormous, and it is likely that this reduction can be ac-complished while decreasing consumer costs. The economic and environmental savingsof distributed generation are not its only advantages, however. The research that thispaper outlines also shows that such systems have further benefits. By placing powergeneration closer to customers transmission losses are reduced. Additionally, a distrib-uted power network may be designed so that it can absorb the temporary loss of onegenerator without losing its ability to serve its customers.
The research described in this paper can also serve as the basis for future work. Onepotential direction for future research is the exploration of more sophisticated fuel cell–turbine hybrid systems. These systems include pairing a SOFC with a low-temperaturepolymer electrolyte fuel cell (PEFC) such that either the SOFC acts as a reformer forthe PEFC or the PEFC acts as a chemical bottomer for the SOFC (NETL, 2001). Ad-ditionally, using the fuel cell to produce hydrogen during minimal load times could beinvestigated. Finally, analyses could be performed to compare hybrid generation withtechnology that is currently considered marginal or cutting-edge, such as wind farmsand photovoltaics.
Acknowledgments
This work was supported in part by NSF grant DMI-0217190 and by a grant from theUniversity of Pittsburgh Central Development Fund. The authors wish to thank twoanonymous referees, who have improved the clarity and content of this paper.

LOCATING HYBRID FUEL CELL–TURBINE 321
References
Appleby, A.J. (1993). “Characteristics of Fuel Cell Systems.” In L. Blomen and M. Mugerwa (eds.), FuelCell Systems. New York: Plenum Press.
Benders, J.F. (1962). “Partitioning Procedures for Solving Mixed Variables Programming Problems.” Nu-merische Mathematics 4, 238–252.
Birge, J.R. and F.V. Louveaux. (1988). “A Multicut Algorithm for Two-Stage Stochastic Linear Programs.”European Journal of Operational Research 34(3), 384–392.
Birge, J.R. and F.V. Louveaux. (1997). Introduction to Stochastic Programming. New York: Springer.Bramel, J. and D. Simchi-Levi. (1997). The Logic of Logistics. New York: Springer.Carner, C. (2001). “Status of State Electric Industry Restructuring Activity as of May 2001.” Energy
Information Administration, Department of Energy, http://www.eia.doe.gov/cneaf/electricity/chg_str/regmap.html
Dicks, A.L. and P.A. Martin. (1998). “A Fuel Cell Balance of Plant Test Facility.” Journal of Power Sources71(1–2), 321–327.
Dunn, R. (2001). “Table 17.” In Annual Electric Utility Data. Energy Information Administration, http://www.eia.doe.gov/cneaf/electricity/esr/esrtl7pl6.html
Energy Information Administration. (1997). “Emissions of Greenhouse Gases.” DOE/EIA-0573(96), Wash-ington, DC.
Energy Information Administration. (1999). “Annual Energy Review.” DOE/EIA-0384(99), Washington,DC.
Energy Information Administration. (2000). “Emissions of Greenhouse Gases in the United States.”DOE/EIA-0573(99), Washington, DC.
Forbes, C.A. (2001). “Siemens Westinghouse Power Corporation.” Personal communication.Gassmann, H.I. (1990). “MSLiP: A Computer Code for the Multistage Stochastic Linear Programming
Problem.” Mathematical Programming 47, 407–423.Ghiocel, D.M. and N.F. Rieger. (1999). “Probabilistic High Cycle Fatigue Life Prediction for Gas Turbine
Engine Blades.” In Proceedings of the 1999 Structures, Structural Dynamics, and Materials Confer-ence, Vol. 4, pp. 2980–2989.
Haynes, C. and W. Wepfer. (2000). “Enhancing Fuel Cell/Gas Turbine Hybrid Power Systems via ReducedFuel Utilization.” In Proceedings of the ASME AESD, Vol. 40, pp. 311–328. AES.
Hoffman, P., D. Haught, T. Sebestyen, and T. King. (1999). “Distributed Generation.” Office of IndustrialTechnologies, Department of Energy.
ILOG Corporation. (2001). “CPLEX7.0.” Incline Village, NV: ILOG Corporation.Inaba, M., A. Mineshige, T. Maeda, S. Nakanishi, T. Ioroi, T. Takahashi, A. Tasaka, K. Kikuchi, and
Z. Ogumi. (1997). “Growth Rate of Yttria-Stabilized Zirconia Thin Films Formed by Electrochemi-cal Vapour-Deposition Using NiO as an Oxygen Source.” Solid State Ionics, Diffusion and Reactions104(3–4), 303–310.
Ippommatsu, M., H. Sasaki, and S. Otoshi. (1996). “Evaluation of the Cost Performance of the SOFC Cellin the Market.” International Journal of Hydrogen Energy 21(2), 129–135.
Itoh, H., M. Mori, N. Mori, and T. Abe. (1994). “Production Cost Estimation of Solid Oxide Fuel Cells.”Journal of Power Sources 49(1–3), 315–332.
Jacard, M., A. Bailie, and J. Nyboer. (1996). “CO2 Emission Reduction Costs in the Residential Sector.”Energy 17(4), 107–134.
Kass, R. (2002). “Tables 21–24.” In Natural Gas Monthly, DOE/EIA-0130. Energy Information Adminis-tration, http://www.eia.doe.gov/emeu/states/main_pa.html
Khandkar, A., J. Hartvigsen, and S. Elangovan. (2000). “A Techno-Economic Model for SOFC PowerSystems.” Solid State Ionics 135, 325–330.
Kincaid, D.E. (1999). “The Role of Distributed Generation in Competitive Energy Markets.” In DistributedGeneration Forum, Gas Research Institute.

322 SCHAEFER AND SCHAEFER
Lundberg, W.L., R.A. Holmes, J.E. King, G.A. Israelson, P.R. Zafred, R.E. Kothmann, M.D. Moeckel,and S.E. Veyo. (2001). “A High Efficiency PSOFC/ATC-Gas Turbine Power System: Final Report.”PD-99-118A, Department of Energy.
MacKerron, G. (2000). “Financial Considerations of Exploiting Fuel Cell Technology.” Journal of PowerSources 86, 28–33.
Manninen, J. and X.X. Zhu. (1999). “Optimal Gas Turbine Integration to the Process Industries.” Industrialand Engineering Chemistry Research 38, 4317–4329.
Mirchandani, P.B. and R.L. Francis. (1990). Discrete Location Theory. New York: Wiley.National Energy Technology Laboratory. (2001). “Hybrid Fuel Cell Technology Overview.” DOE/NETL-
2001/1145, Department of Energy.Office of Fossil Energy. (2002). “Distributed Power Systems.” Electric Power R&D, http://www.fe.
doe.gov/coal_power/distributed_power.htmlPassel, P. (1997). “How Fast to Cut Back.” New York Times 12/1, GW.8.Perritt, D. (2002). “Monthly Energy Review.” Energy Information Administration, http://www.eia.
doe.gov/emeu/mer/Rastler, D. (2002). “Market Assessment and Opportunities for Fuel Cell Hybrids.” In 2nd DOE/UN Inter-
national Conference and Workshop on Hybrid Power Systems, Charlotte, NC.Riensche, E., U. Stimmung, and G. Unverzagt. (1998). “Optimization of a 200 kW SOFC Cogeneration
Power Plant: Part I.” Journal of Power Sources 73, 251–256.Schnapp, R.M. and B. Quade. (2001). “Table A.6.” In Electric Power Annual, Vol. 1, http://www.eia.
doe.gov/cneaf/electricity/epavl/ta6pl.htmlShapiro, K.G. (2001). “Incorporating Costs in LCA.” International Journal of Life Cycle Assessment 6(2),
121–123.Singhal, S.C. (1998). “Application of Ionic and Electronic Conducting Ceramics in Solid Oxide Fuel
Cells.” In Proceedings of the 3rd International Symposium on Ionic and Mixed Conducting Ceramics,pp. 125–136.
Smith, J.C., A.J. Schaefer, and J. Yen. (2002). “A Stochastic Intra-Ring Synchronous Optical NetworkDesign Problem.” Stochastic Programming E-Print Series.
Tanaka, K., C. Wen, and K. Yamada. (2000). “Design and Evaluation of Combined Cycle System with SolidOxide Fuel Cell and Gas Turbine.” Fuel 79, 1493–1507.
Tryon, R.G. and T.A. Cruse. (2000). “Probabilistic Mesomechanics for High Cycle Fatigue Life Prediction.”Journal of Engineering Materials and Technology 122(2), 209–214.
Van Slyke, R. and R.J.-B. Wets. (1969). “L-Shaped Linear Programs with Applications to Optimal Controland Stochastic Programming.” SIAM Journal on Applied Mathematics 17, 638–663.
Williams, M.C. and W. Surdoval. (2000). “SECA: Mass Produced Fuel Cells for Low Cost Power.”Program Brochure, http://www.netl.doe.gov/products/powerl/fuelcells/-seca_bro.pdf
Yokokawa, H., N. Sakai, T. Horita, and K. Yamaji. (2001). “Recent Developments in Solid Oxide Fuel CellMaterials.” Fuel Cells 1(2), 117–131.
Related Documents