1604 IEEE TRANSACTIONS ON IMAGE PROCESSING, VOL. 13, NO. 12, DECEMBER 2004 Locally Optimum Nonlinearities for DCT Watermark Detection Alexia Briassouli and Michael G. Strintzis, Fellow, IEEE Abstract—The issue of copyright protection of digital multi- media data has attracted a lot of attention during the last decade. An efficient copyright protection method that has been gaining popularity is watermarking, i.e., the embedding of a signature in a digital document that can be detected only by its rightful owner. Watermarks are usually blindly detected using correlating structures, which would be optimal in the case of Gaussian data. However, in the case of DCT-domain image watermarking, the data is more heavy-tailed and the correlator is clearly suboptimal. Nonlinear receivers have been shown to be particularly well suited for the detection of weak signals in heavy-tailed noise, as they are locally optimal. This motivates the use of the Gaussian-tailed zero-memory nonlinearity, as well as the locally optimal Cauchy nonlinearity for the detection of watermarks in DCT transformed images. We analyze the performance of these schemes theoreti- cally and compare it to that of the traditionally used Gaussian correlator, but also to the recently proposed generalized Gaussian detector, which outperforms the correlator. The theoretical analysis and the actual performance of these systems is assessed through experiments, which verify the theoretical analysis and also justify the use of nonlinear structures for watermark detection. The performance of the correlator and the nonlinear detectors in the presence of quantization is also analyzed, using results from dither theory, and also verified experimentally. Index Terms—Alpha-stable distributions, locally optimal detec- tion, Neyman–Pearson, statistical modeling, watermarking. I. INTRODUCTION I N THE LAST decade, significant advances have been made in the technology of acquisition, representation, distribution, and storage of multimedia information in digital format. Dig- ital processing and transmission offers significant advantages, but problems can arise because of the facility with which high- quality digital information may be reproduced and distributed. An effective method for copyright protection, which has been gaining great popularity lately, is the watermarking of digital data. The basic principle of watermarking is to embed informa- tion directly into the data, which serves as a host or a cover for that information. In this manner, the watermark travels with the Manuscript received September 13, 2002; revised January 26, 2004. This work was supported by the European Program ASPIS: An Authentication and Protection Innovative Software System for DVDROM and Internet (IST: Infor- mation Society Technologies). The associate editor coordinating the review of this manuscript and approving it for publication was Dr. Gaurav Sharma. A. Briassouli is with the Department of Electrical and Computer Engineering, Beckman Institute, University of Illinois at Urbana-Champaign, Urbana, IL 61801 USA (e-mail: [email protected]). M. G. Strintzis is with the Informatics and Telematics Institute (CERTH), Thessaloniki, Greece, and also with the Department of Electrical and Com- puter Engineering, University of Thessaloniki, Thessaloniki, Greece (e-mail: [email protected]). Digital Object Identifier 10.1109/TIP.2004.837516 data, which thus remains protected until its intended receiver re- moves it. An important characteristic of watermarking, which differen- tiates it from other data hiding methods, such as steganography, is the fact that it must be robust against intentional attacks by knowledgeable but unauthorized users. In order to achieve maximum robustness, a watermark needs to be resilient against attacks even if the attacker knows more than just its existence. According to Kerkhoff’s Law, the security of a data hiding system should not rely on the secrecy of the algortithm but on the secrecy of the key [1]. Consequently, the keys used in the watermark embedding and extraction processes need to be cryptographic and known only to the intended users of the marked data. Most current watermark detection methods aim to extract the watermark without use of the original host signal, em- ploying only the secret key. These blind detection methods usually perform correlation detection, which is very common in communications. However, the correlator is not optimal for non-Gaussian data, especially those of a more impulsive nature, as high-magnitude data values cause its performance to deteriorate significantly [2]. Recently, theoretical and more sys- tematic approaches to the problem of watermark detection have been developed [3]–[5]. The use of optimal or nearly optimal detectors based on the signal statistics has been proposed and has already been shown to yield significantly better detection results than the correlator in various transform domains. A detector based on the generalized Gaussian model has been designed in [3] and the Cauchy model has been used to improve detection performance in [5], [6]. We propose a novel approach to the watermark detection problem for still images in the DCT domain, which employs locally optimum and nonlinear detectors. Locally optimum detectors are particularly well suited for the detection of weak signals in non-Gaussian noise [7] and can be well approxi- mated by nonlinear structures. The resulting systems are very efficient, both in terms of error probability and simplicity of implementation. We examine the use of such schemes in the context of still-image watermarking in the DCT domain. The robustness of these processors in the presence of quantization is also analyzed using results from dither theory. This paper is organized as follows. In Section II, spread spectrum (SS) watermarking in the DCT domain is described. In Section III, the image DCT coefficients are modeled by heavy tailed distributions, that are more appropriate than the Gaussian model. Section IV presents the method of statistical watermark detection in the transform domain using linear and nonlinear processors. The performance of the examined 1057-7149/04$20.00 © 2004 IEEE

Welcome message from author
This document is posted to help you gain knowledge. Please leave a comment to let me know what you think about it! Share it to your friends and learn new things together.
Transcript

1604 IEEE TRANSACTIONS ON IMAGE PROCESSING, VOL. 13, NO. 12, DECEMBER 2004
Locally Optimum Nonlinearitiesfor DCT Watermark Detection
Alexia Briassouli and Michael G. Strintzis, Fellow, IEEE
Abstract—The issue of copyright protection of digital multi-media data has attracted a lot of attention during the last decade.An efficient copyright protection method that has been gainingpopularity is watermarking, i.e., the embedding of a signaturein a digital document that can be detected only by its rightfulowner. Watermarks are usually blindly detected using correlatingstructures, which would be optimal in the case of Gaussian data.However, in the case of DCT-domain image watermarking, thedata is more heavy-tailed and the correlator is clearly suboptimal.Nonlinear receivers have been shown to be particularly well suitedfor the detection of weak signals in heavy-tailed noise, as theyare locally optimal. This motivates the use of the Gaussian-tailedzero-memory nonlinearity, as well as the locally optimal Cauchynonlinearity for the detection of watermarks in DCT transformedimages. We analyze the performance of these schemes theoreti-cally and compare it to that of the traditionally used Gaussiancorrelator, but also to the recently proposed generalized Gaussiandetector, which outperforms the correlator. The theoreticalanalysis and the actual performance of these systems is assessedthrough experiments, which verify the theoretical analysis and alsojustify the use of nonlinear structures for watermark detection.The performance of the correlator and the nonlinear detectors inthe presence of quantization is also analyzed, using results fromdither theory, and also verified experimentally.
Index Terms—Alpha-stable distributions, locally optimal detec-tion, Neyman–Pearson, statistical modeling, watermarking.
I. INTRODUCTION
I N THE LAST decade, significant advances have been madein the technology of acquisition, representation, distribution,
and storage of multimedia information in digital format. Dig-ital processing and transmission offers significant advantages,but problems can arise because of the facility with which high-quality digital information may be reproduced and distributed.An effective method for copyright protection, which has beengaining great popularity lately, is the watermarking of digitaldata. The basic principle of watermarking is to embed informa-tion directly into the data, which serves as a host or a cover forthat information. In this manner, the watermark travels with the
Manuscript received September 13, 2002; revised January 26, 2004. Thiswork was supported by the European Program ASPIS: An Authentication andProtection Innovative Software System for DVDROM and Internet (IST: Infor-mation Society Technologies). The associate editor coordinating the review ofthis manuscript and approving it for publication was Dr. Gaurav Sharma.
A. Briassouli is with the Department of Electrical and Computer Engineering,Beckman Institute, University of Illinois at Urbana-Champaign, Urbana, IL61801 USA (e-mail: [email protected]).
M. G. Strintzis is with the Informatics and Telematics Institute (CERTH),Thessaloniki, Greece, and also with the Department of Electrical and Com-puter Engineering, University of Thessaloniki, Thessaloniki, Greece (e-mail:[email protected]).
Digital Object Identifier 10.1109/TIP.2004.837516
data, which thus remains protected until its intended receiver re-moves it.
An important characteristic of watermarking, which differen-tiates it from other data hiding methods, such as steganography,is the fact that it must be robust against intentional attacksby knowledgeable but unauthorized users. In order to achievemaximum robustness, a watermark needs to be resilient againstattacks even if the attacker knows more than just its existence.According to Kerkhoff’s Law, the security of a data hidingsystem should not rely on the secrecy of the algortithm buton the secrecy of the key [1]. Consequently, the keys usedin the watermark embedding and extraction processes needto be cryptographic and known only to the intended users ofthe marked data.
Most current watermark detection methods aim to extractthe watermark without use of the original host signal, em-ploying only the secret key. These blind detection methodsusually perform correlation detection, which is very commonin communications. However, the correlator is not optimalfor non-Gaussian data, especially those of a more impulsivenature, as high-magnitude data values cause its performance todeteriorate significantly [2]. Recently, theoretical and more sys-tematic approaches to the problem of watermark detection havebeen developed [3]–[5]. The use of optimal or nearly optimaldetectors based on the signal statistics has been proposed andhas already been shown to yield significantly better detectionresults than the correlator in various transform domains. Adetector based on the generalized Gaussian model has beendesigned in [3] and the Cauchy model has been used to improvedetection performance in [5], [6].
We propose a novel approach to the watermark detectionproblem for still images in the DCT domain, which employslocally optimum and nonlinear detectors. Locally optimumdetectors are particularly well suited for the detection of weaksignals in non-Gaussian noise [7] and can be well approxi-mated by nonlinear structures. The resulting systems are veryefficient, both in terms of error probability and simplicity ofimplementation. We examine the use of such schemes in thecontext of still-image watermarking in the DCT domain. Therobustness of these processors in the presence of quantizationis also analyzed using results from dither theory.
This paper is organized as follows. In Section II, spreadspectrum (SS) watermarking in the DCT domain is described.In Section III, the image DCT coefficients are modeled byheavy tailed distributions, that are more appropriate than theGaussian model. Section IV presents the method of statisticalwatermark detection in the transform domain using linearand nonlinear processors. The performance of the examined
1057-7149/04$20.00 © 2004 IEEE
BRIASSOULI AND STRINTZIS: LOCALLY OPTIMUM NONLINEARITIES FOR DCT WATERMARK DETECTION 1605
detection schemes is analyzed theoretically in Section V. InSection VI, the effects of quantization on these detectionschemes is analyzed. Section VII contains experimental resultsand finally conclusions are drawn in Section VIII.
In the sequel, we will denote random variables with cap-ital letters and their individual values with small letters
. Similarly, we denote length- random vectors byand their values by : each ele-
ment of the random vector is a random variable that takesthe value . Also, the probability density function (p.d.f.) of arandom variable will be denoted and its expectationwill be written as .
II. DCT-DOMAIN WATERMARKING
Many watermarking systems, including the ones consideredhere, are inspired by the SS modulation schemes used in dig-ital communications in jamming environments [8], [9]. The roleof the jammer in the watermarking problem is assumed by thecover signal (additive noise) and by an attacker who may try todestroy or extract the embedded watermark [10], while the wa-termark is the hidden information signal. An advantage of SStechniques that has made them attractive for information hidingis the ability to reliably transmit signals at low power, whichresults in a low probability of intercept (LPI) [11]. In water-mark embedding, properties of the human visual system (HVS)are also taken into account to guarantee imperceptibility of thehidden signal. The anti-jamming properties of these systemsguarantee increased robustness, while the pseudorandom modu-lation of the watermark, described analytically in Section II-A,adds to their security, since knowledge of this sequence is re-quired for successful watermark retrieval [10].
A. Watermark Generation and Embedding
Indices in boldface typesetting will be used to represent thecorresponding two-dimensional (2-D) indices, i.e.,for the DCT domain and for the spatial domain.In the sequel we describe a SS watermark generation and em-bedding process like the one described by Hernandez et al. [3],where a pseudorandom sequence is multiplied with a perceptualmask to generate the watermark. All quantities described hereare denoted by small letters because they are either determin-istic (like the values of the DCT coefficients of an image) or thevalues taken by a random variable (the values of the pseudo-random sequence described in the sequel).
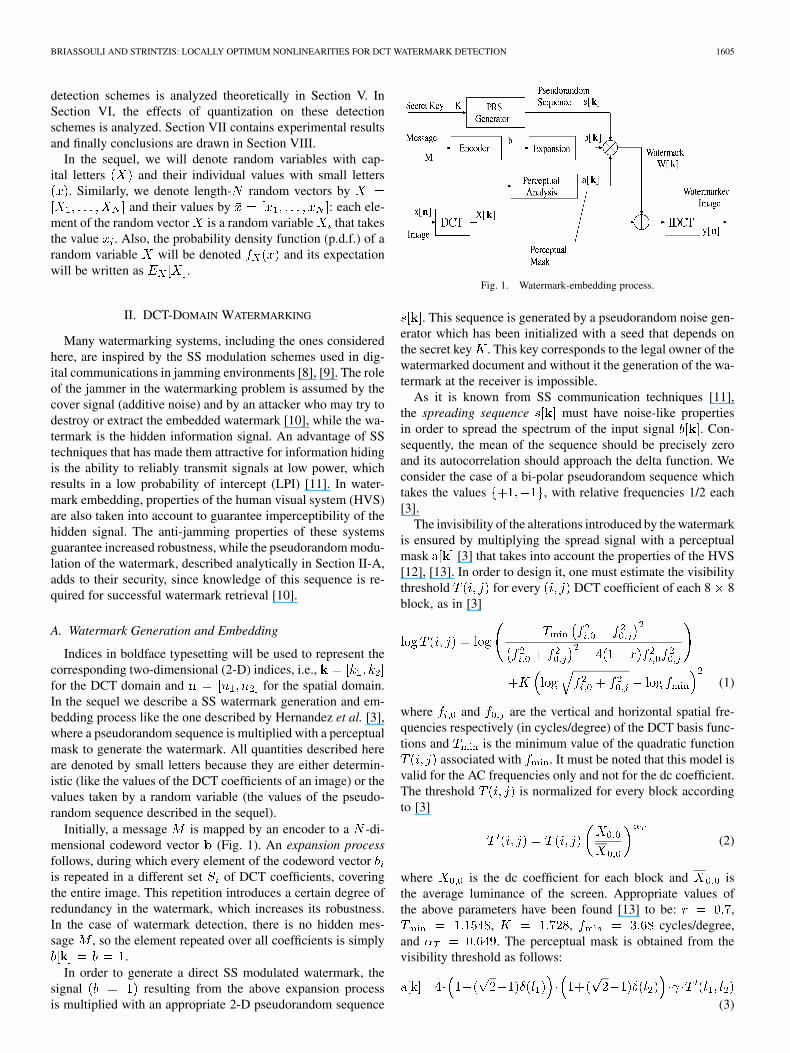
Initially, a message is mapped by an encoder to a -di-mensional codeword vector (Fig. 1). An expansion processfollows, during which every element of the codeword vectoris repeated in a different set of DCT coefficients, coveringthe entire image. This repetition introduces a certain degree ofredundancy in the watermark, which increases its robustness.In the case of watermark detection, there is no hidden mes-sage , so the element repeated over all coefficients is simply
.In order to generate a direct SS modulated watermark, the
signal resulting from the above expansion processis multiplied with an appropriate 2-D pseudorandom sequence
Fig. 1. Watermark-embedding process.
. This sequence is generated by a pseudorandom noise gen-erator which has been initialized with a seed that depends onthe secret key . This key corresponds to the legal owner of thewatermarked document and without it the generation of the wa-termark at the receiver is impossible.
As it is known from SS communication techniques [11],the spreading sequence must have noise-like propertiesin order to spread the spectrum of the input signal . Con-sequently, the mean of the sequence should be precisely zeroand its autocorrelation should approach the delta function. Weconsider the case of a bi-polar pseudorandom sequence whichtakes the values , with relative frequencies 1/2 each[3].
The invisibility of the alterations introduced by the watermarkis ensured by multiplying the spread signal with a perceptualmask [3] that takes into account the properties of the HVS[12], [13]. In order to design it, one must estimate the visibilitythreshold for every DCT coefficient of each 8 8block, as in [3]
(1)
where and are the vertical and horizontal spatial fre-quencies respectively (in cycles/degree) of the DCT basis func-tions and is the minimum value of the quadratic function
associated with . It must be noted that this model isvalid for the AC frequencies only and not for the dc coefficient.The threshold is normalized for every block accordingto [3]
(2)
where is the dc coefficient for each block and isthe average luminance of the screen. Appropriate values ofthe above parameters have been found [13] to be: ,
, , cycles/degree,and . The perceptual mask is obtained from thevisibility threshold as follows:
(3)

1606 IEEE TRANSACTIONS ON IMAGE PROCESSING, VOL. 13, NO. 12, DECEMBER 2004
where , , , is theKronecker function and is a scaling factor. This mask en-sures that the watermark will remain imperceptible to the humaneye, but at the same time it will alter the pixel intensity values asmuch as possible, to ensure robustness and detectability of thewatermark [14].
The resulting watermark, for is andis added to the original DCT coefficients , giving the wa-termarked signal (Fig. 1). The only wayto retrieve the hidden signal is to have a copy of the pseudo-random sequence , in other words its seed and the proce-dure through which it is generated. As a result, the attacker isnot able to extract the watermark without knowledge of the se-cret key, even if the entire watermark generation and embeddingprocess is known. Thus, the dependence of the generated water-mark on the secret key and the SS embedding procedure result ina particularly robust watermark, which is resilient against stan-dard signal processing and manipulation, such as scale modifi-cation and noise addition. Alhough this watermark has not beenspecifically designed to resist geometric attacks, the fact that itsinformation has been spread over the entire image improves, upto a degree, its chances to survive such an attack.
III. MODELING OF DCT-DOMAIN IMAGE DATA
It is well known from the relevant literature that the low-and mid-frequency image DCT coefficients, which carry mostof the image information, are not adequately modeled bythe Gaussian distribution [15], [16]. The probability densityfunctions (p.d.f.s) of these coefficients bear a similarity to theGaussian model as they remain bell-shaped, but their tails aresignificantly heavier [17].
A. Heavy-Tailed Distributions for DCT-Domain Data
A model sometimes used for DCT coefficients [16] is that ofthe Laplacian distribution
(4)
where is its mean and is defined as . Its tailsdecay exponentially with rather than , but they are still notheavy enough to describe the tails of DCT coefficients. A moreaccurate representation is given by the generalized Gaussianmodel [16], [17]
(5)
where and can be expressed in terms of the shape parameterand the standard deviation as follows:
(6)
For , the generalized Gaussian distribution reduces to theLaplacian, while the Gaussian distribution can be obtained with
. Many images are reasonably well modeled by a con-stant value of such as [18]. However, as noted in[3], the DCT coefficients often contain values that cannot be
accurately modeled even by the generalized Gaussian distribu-tion. The authors of [3] use what they refer to as “point elimina-tion” to overcome the anticipated loss in performance caused byhigh-magnitude samples in the data tails. This technique simplyconsists of removing the samples whose magnitude is abovea certain threshold and cannot be modeled by the generalizedGaussian p.d.f. However, this method is quite heuristic and itsperformance cannot be evaluated objectively, since the thresholdfor each data set is determined in an ad-hoc manner. Equallygood, if not even better, results can be obtained by using a moreheavy-tailed statistical model for the data, which accounts forthese high-magnitude samples, instead of eliminating them. Theperformance of improved detection schemes designed particu-larly for such heavy-tailed data sets can be assessed using ob-jective criteria, so the results obtained with such methods can beconsidered generally applicable and reliable.
The symmetric alpha-stable family [19], [20] is oftenused to describe non-Gaussian signals characterized by an im-pulsive nature [21], which exhibit heavy-tailed p.d.f.s. It is bestdescribed by its characteristic function
(7)
This distribution is completely described by the following pa-rameters: the location , the scale or disper-sion and the characteristic exponent or stability index
. The location gives the distribution mean for, while for it gives its median. The
dispersion can be any positive number and corresponds to thespread around , supplying roughly the same information as thevariance. The characteristic exponent determines the shapeof the distribution as it measures the “thickness” of the tails ofthe p.d.f. In particular, the tail probabilities of an alpha-stablerandom variable follow inverse power laws [22]
(8)
where and is the Gamma func-tion. For smaller values of , the tails of the distribution areheavier and the corresponding random process displays high im-pulsiveness, while larger values of correspond to distributionswith more rapidly decaying tails that approach the Gaussianmodel. There exist closed form expressions for the p.d.f. ofrandom variables only when and , corresponding tothe Gaussian and Cauchy distributions, respectively. The p.d.f.of the latter is given by
(9)
We will focus on this distribution for the modeling of the dataand the design of a locally optimal detector, although othermembers of the alpha-stable family may give an even betterfit. The fact that the Cauchy p.d.f. might provide a slightlysuboptimal fit, when compared to other, even more accurate,
models, does not play an important role in the perfor-mance of the resulting detectors. The detection systems basedon this p.d.f. will be shown to significantly outperform existingschemes, as the Cauchy p.d.f. gives a good enough fit to theheavy-tailed data to ensure that samples in its tails are not

BRIASSOULI AND STRINTZIS: LOCALLY OPTIMUM NONLINEARITIES FOR DCT WATERMARK DETECTION 1607
“missed,” leading to losses in detection performance [3]. Thesefindings are compatible and corroborate the findings in [19].
B. Experimental Modeling of DCT-Domain Data
In order to model the low– and mid–frequency DCT coeffi-cients, one can examine their so-called Amplitude ProbabilityDensity, . The APD for Gaussian data is given by
(10)
where , are the data mean and standard deviation respec-tively and is given by
(11)
The Laplacian APD is
forotherwise
(12)
and the Cauchy APD is given by
(13)
To find the most appropriate model for the DCT coefficientsof interest, i.e., the low– and mid–frequency ones, their ex-perimental APD is compared with the APD of data followingGaussian, Laplacian and Cauchy distributions. The parametersfor the Laplacian and the Gaussian distribution are derived di-rectly from the data. In [23], [24], the Cauchy parameters and
are computed using the ML method, which gives very accu-rate estimates with tight 95% confidence intervals.
An important point is that in blind watermark detection con-sidered here, the receiver must estimate the parameters of eachp.d.f. from the received data which may or may not contain awatermark. However, this does not prove to be a problem, asthe embedded signal has low power and consequently does notsignificantly alter the parameters of the p.d.f. used for the mod-eling. We verified this experimentally for the Cauchy parame-ters and which basically remain the same, whether they arederived from marked or unmarked data. Similarly, the param-eters of the Gaussian, Laplacian and generalized Gaussian dis-tributions depend on the actual data statistics, which might bederived from marked samples and not the original data. Table Ishows that the variance of the data estimated from watermarkedsamples is indeed very close to its actual values.
We verify the accuracy of the Cauchy model experimentallyby examining a set of low– and mid–frequency zigzag scannedDCT coefficients of the “Lena” image. These coefficients areconsidered over all the 8 8 blocks of the DCT-transformedimage, i.e., blocks for the 256 256 image.
Fig. 2 shows the modeling results obtained for this data. Itis clear that the Gaussian distribution is not appropriate fortheir representation. The Laplacian APD is somewhat closerto the experimental one. However, the Cauchy APD obviouslyachieves the best fitting for the data, since it captures bothits mode and the tail much more accurately than the other
TABLE IACTUAL AND ESTIMATED VALUES OF THE VARIANCE OF WATERMARKED
DATA FOR LENA, WOMAN, BOAT, AND BABOON IMAGES: THE VARIANCE
OF THE DATA ESTIMATED FROM MARKED DATA IS VERY CLOSE TO ITS
ACTUAL VALUES, DERIVED FROM THE ORIGINAL UNMARKED SAMPLES
Fig. 2. Amplitude probability density comparison. The Gaussian model isclearly inappropriate for the low- and mid-frequency DCT coefficients. TheLaplacian model is closer to the data, but the Cauchy p.d.f. provides the closestfit to the empirical distribution.
two models and gives an APD very similar to the actual (ex-perimental) one. Similar results have been obtained for otherstandard test images [5], verifying that the alpha-stable distri-bution is an appropriate model for low– and mid–frequencyDCT coefficients.
IV. WATERMARK DETECTION
A. Detection Based on Hypothesis Testing
The known or approximated statistical properties of the DCTcoefficients may lead to a blind watermark detection method. Asoften mentioned in the literaure [3], [25], watermark detectionresembles the communications problem of reliably transmittinga weak signal through a noisy channel (in our case the host data)and detecting its presence at the receiver. Thus, the watermarkdetection problem can be formulated as a binary hypothesis test[2], where the two hypotheses concern the existence of a water-mark. This technique is blind since the detection is performedwithout knowledge of the original, unwatermarked data. Thetwo hypotheses for the test are formulated as follows:
(14)
In (14), we use small letters as they represent the valuesand of the random variables and or the deterministicvalue of each DCT coefficient. The watermark detector

1608 IEEE TRANSACTIONS ON IMAGE PROCESSING, VOL. 13, NO. 12, DECEMBER 2004
bases its decision on the ratio test that uses the valuesof DCT coefficients
(15)
In this test, there can be two types of errors [2], namely the falseacceptance of when is true, more commonly known asa “false alarm,” and the acceptance of under , i.e., the“miss” of the transmitted signal. The threshold of (15) canbe determined by the Neyman–Pearson (N–P) criterion, whichminimizes the probability of missing a watermark for a boundedfalse alarm probability . The resulting test guarantees thatthe power of the test, i.e., the probability of detection, will bemaximized for a predetermined false alarm [2].
The likelihood ratio test is performed using DCT coef-ficients which can be treated as independent identically dis-tributed (i.i.d.) random variables, since the DCT approximatesthe Karhunen-Loève transform, and the test (15) can be writtenas [2]
(16)In this setup, the value of the watermark at each pixel is givenby (see Section II-A) and the intended re-ceiver can reproduce the PRS by using the secret key. Thestrength at each DCT coefficient can be estimated from thereceived data by reproducing the perceptual mask according toSection II-A. Naturally, at this stage, the receiver cannot yet de-termine whether or not the received data is watermarked andmay reproduce using watermarked data , in-stead of the original . However, the embedded signal isweak, so the error in the estimate of will not be significant.For the same reason, the estimate of parameters of the originaldata such as the variance is reliable, even if, in practice, itmight be estimated using watermarked data. Table I depicts theactual data variance and its values that are estimated fromwatermarked data, which indeed are very similar. This reasoningshows that the detector can re-create the embedded signalquite accurately, so we are actually dealing with a coherent de-tection problem, where the transmitted signal is known or canbe accurately estimated at the receiver.
B. Gaussian Detector
In current practice, watermark detection is often carried outusing the correlator detector [8], [26], which is optimal whenthe signal distributions under and are Gaussian. In thatcase the likelihood ratio
(17)
reduces to the well-known correlation detector [27]
(18)
where is the variance, is the threshold of (15) and. The correlator is often used in watermark
detection schemes [14], [25] because of the simplicity of its im-plementation. However, it is optimal in terms of detection prob-ability only for Gaussian data and not for the more heavy tailedprobability densities of image DCT coefficients [2], [3]. Whenthe received data contains components of high magnitude, itsperformance degrades significantly as outliers may contaminatethe likelihood ratio, either by increasing its value under orby decreasing it under , leading to more false alarms or de-tection errors [2], [7].
C. Nonlinear Watermark Detectors
As mentioned above, the conventional Gaussian watermarkdetector unaided performs poorly for DCT data, since in thatcase the noise data contains components of high magnitude notpredicted by the normal distribution. Several approaches to sta-tistical detection for non-Gaussian data have been proposed inthe literature [7], [28]. Hernandez et al. proposed the use of adetector designed according to more accurate statistical mod-eling of the data by the generalized Gaussian distribution in [3]and showed the superiority of this scheme to the correlator. Fora similar problem, but for multiplicative watermarks in the DFTdomain, Barni et al. designed [4] a detector that also uses a moreaccurate statistical model of the data (the Weibull distribution)and that performs much better than the Gaussian correlator.
The power of these detectors is maximized for a givenprobability of false alarm and a specific watermark. In theseapproaches the resulting test depends on the strength of theembedded signal, which can be viewed as a parameter in acomposite hypothesis testing problem [2]. Since the detectionregions depend on the value of this “parameter,” these testsare not Uniformly Most Powerful (UMP), i.e., they are notnecessarily optimal for watermarks of arbitrary strength.
It is well known from detection theory [2] that a test that max-imizes the detection probability for any possible under ,i.e., a UMP test, is quite rare and can be found only for very par-ticular noise models (e.g. Gaussian data with a signal that takesonly positive values [2]). Nevertheless, for the detection of sig-nals in non-Gaussian noise environments, a detector that is op-timal in the Neyman–Pearson (N–P) sense can be designed forweak signals. This detector is known as a locally optimal (LO)or locally most powerful (LMP) test, since it achieves asymp-totically optimum performance for low signal levels [7].
In the watermarking problem the strength of the embeddedsignal is small, so a Locally Most Powerful (LMP) test isappropriate for it. For the log-likelihood ratio of (16), we havethe following Taylor series approximation
(19)

BRIASSOULI AND STRINTZIS: LOCALLY OPTIMUM NONLINEARITIES FOR DCT WATERMARK DETECTION 1609
In this equation, is the “locally optimum nonlinearity”[2], [7], defined by
(20)
where is the p.d.f. of the image data. The resultingdetection scheme of (19) basically consists of the nonlinearpreprocessor , followed by the linear correlator [28],[29]. Such nonlinearities are often encountered in communica-tion systems that operate in the presence of non-Gaussian noise[28], as they suppress the observations with high magnitudethat cause the correlator’s performance to deteriorate.
As seen in Section III, the heavy-tailed DCT coefficients arequite accurately modeled by the Cauchy distribution. In thatcase, the locally optimum nonlinearity of (20) reduces to
(21)
where and are the parameters of the Cauchy distribution andis the input data [23]. This LO nonlinearity is expected to lead
to satisfactory results, as it limits the high-magnitude DCT co-efficients by taking into account a quite accurate approximationof the data distribution.
In practice suboptimum nonlinearities are often used tohandle the difficulties caused by heavy-tailed data. Thesepreprocessors are generally chosen to be linear near the originand bounded in the tails. Standard nonlinearities [2], [30]are the “hole puncher,” the “soft limiter” examined here, thegeneralized Gaussian and the Gaussian-tailed nonlinearity. Inthis paper we shall concentrate on the Cauchy LO nonlinearityand the Gaussian-tailed zero memory nonlinearity (ZMNL).If the input data is a sequence of elements , the ZMNLoutput will be
(22)
where the parameters , can be tuned appropriately. For analpha-stable process [29], these parameters are given by
median median
(23)
where as in [29]. Note that these parameters dependonly on the values of the data and only its median needs to becomputed, whereas for the LO nonlinearity of (21), the parame-ters and of the Cauchy distribution need to be estimated fromthe data by ML methods [23], [24]. Fig. 3 depicts the nonlinear-ities (21), (22): both structures lead to relatively similar results,as the output values are approximately equal to the input data
when its magnitude is not very high. It also shows that theGaussian ZMNL has more rapidly decaying tails than the LOCauchy nonlinearity, deemphasizing slightly more samples ofthe highly valued data than the latter.
Fig. 3. Locally optimum Cauchy nonlinearity and Gaussian ZMNL. TheGaussian ZMNL has tails that decay more rapidly, so it eliminates moresamples than the LO Cauchy nonlinearity.
Although the use of the zero mean nonlinearities (ZMNL)is intuitively justified, their design is not based on any theoret-ical optimality criterion, in contrast to the the LO nonlinearities,which are shown to provide the LMP (LO) test for the detec-tion of a low-power signal. Nevertheless, the ZMNL can lead toimproved detection results, while remaining very simple to im-plement and without adding excessive computational cost to thereceiver. Naturally, they are particularly useful in the often en-countered practical case where the noise statistics are not knownor cannot be easily approximated with accuracy.
V. PERFORMANCE ANALYSIS OF THE GAUSSIAN CORRELATOR
WITH AND WITHOUT USE OF NONLINEARITIES
The performance of the conventional correlator can be mea-sured in terms of the detection and error probabilities, both forthe maximum likelihood (ML) and the N–P detector. The MLdetector aims to minimize the error probability given by
(24)
where we have assumed equal priors .The N–P detector maximizes the detection probability for agiven false alarm probability. Therefore, its performance canbe measured in terms of and , which lead to thereceiver operating characteristic (ROC) curves. In order toanalyze the performance of the detector (17), we note thatthis test statistic consists of the sum of a large number ofindependent random variables. By the Central Limit Theoremand for sufficiently many data samples, it may be assumed tobe normally distributed as in [3], [4]. To generate the ROCcurves, we first need to estimate its mean and variance under
and .The watermark values at each pixel are given by
, where is the watermark strength at DCT coeffi-cient and is the corresponding value of the pseudorandomsequence. We consider (as in [3]) that takes the equiprob-able values 1, 1, so can be equal either to or .

1610 IEEE TRANSACTIONS ON IMAGE PROCESSING, VOL. 13, NO. 12, DECEMBER 2004
Note that in this setup, which is very common in watermarkingapplications [3], [8], [31], the only random variables are thevalues of the pseudorandom sequence, since are the deter-ministic values of the DCT coefficients and are the valuesof the perceptual mask, which depends only on the (determin-istic) data values (see Section II).
A. Statistics of the Gaussian Likelihood Ratio
The value of each DCT coefficient that is input to the corre-lator is under and under
. Thus, the mean of the Gaussian likelihood ratio (17) underis
(25)
since the pseudorandom sequence is zero mean and the obser-vations are i.i.d. The variance of the likelihood ratio underis given by
(26)
while under the mean is
(27)Following a similar procedure, it can be easily proven [3] thatunder the variance does not change, i.e., . Theseresults will be used in Section V-D to measure the performanceof the correlator for the original input data and the data
that has been passed through a ZMNL.
B. Statistics of the Gaussian Likelihood Ratio After Using aLO Cauchy Nonlinearity
The performance of the correlator detector can be evaluatedtheoretically when the data values are passed through the LOCauchy nonlinearity presented in Section IV-C. The detector of(18) can be written as
(28)
where is the vector of DCT coefficients that are input tothe LO nonlinearity and is its output. Thus, using (21),we obtain
(29)
We consider, as before, that the pseudorandom sequence cantake the values 1, 1 with equal probabilities 1/2, so the meanof (29) under is
(30)
Under we have , and the mean is
(31)
In order to simplify the notation in the equations that follow, weset
(32)
so (31) becomes
(33)
The variance under is given by
(34)
When a watermark is present, we have
(35)
so, after some algebra, the variance under is found to be
(36)

BRIASSOULI AND STRINTZIS: LOCALLY OPTIMUM NONLINEARITIES FOR DCT WATERMARK DETECTION 1611
In this case, , which is expected since the data has beenpreprocessed by a nonlinearity.
C. Statistics of the Gaussian Likelihood Ratio After Using aZMNL
When the data is preprocessed by a ZMNL, the mean andvariance of the correlation statistic can be evaluated theoreti-cally by taking into account the form of the ZMNL [(22)]. Under
, we have
(37)
which gives since . Under we have
.(38)
Then
.(39)
After some algebra, we also get the variance of the likelihoodratio
(40)
and
(41)
where in (40) and (41), we sum over (the varianceis zero elsewhere).
D. Performance Analysis
With the mean and variance of the normally distributed like-lihood ratio known, the detection and false alarm probabilitiesare respectively given by
(42)
where is the threshold against which the data are compared andis defined as in (11). For a given probability of false alarm
, we can compute the required threshold for a watermark tobe detected
(43)
Fig. 4. (a) Additive noise model of a quantizer. (b) Nonsubtractively ditheredquantizer. (c) Subtractively dithered quantizer.
By predefining this threshold we can find the relation betweenand , which leads to the ROC
(44)
These curves can be used to measure the effects of the nonlinearpreprocessing on the Gaussian correlator and compare the per-formance results to those of the Gaussian and the generalizedGaussian detector [3]. The ZMNL and the LO Cauhcy prepro-cessors are expected to lead to much better detection results thanthe traditional correlator, since they shape the observations ap-propriately, reducing the detrimental effects of high-magnitudedata values.
Another measure of performance often used in detectionproblems is the efficacy of the tests, defined by
(45)
If the test statistic is normally distributed, as in our case, thetests can be compared using only their efficacies, where a highervalue of efficacy corresponds to a better test [7].
VI. QUANTIZATION ATTACKS
In this section, we analyze the performance of the examineddetectors under quantization, since this nonmalicious attack isencountered in practically all modern applications. It is expectedthat performance will be affected by the error introduced by thequantization process, but that the proposed detectors will stillperform better than the correlator. In this section, denotesthe th sample of a random variable X and , denote dif-ferent types of quantization errors, which are also random vari-ables and shall be described in the sequel.
A. Dithered Quantization
The simplest type of quantizer [Fig. 4(a)] is the uniform quan-tizer, which maps the input to a collection of equally spacedoutput levels, giving the quantized output . Despite itssimplicity, it has proven difficult to analyze theoretically, be-cause of its inherent nonlinearity [32]. A common misconcep-tion is that the quantization error con-sists of a sequence of independent, identically distributed (i.i.d.)

1612 IEEE TRANSACTIONS ON IMAGE PROCESSING, VOL. 13, NO. 12, DECEMBER 2004
random variables, uncorrelated with each other and with theinput signal. Actually, this approximation, known as the Ben-nett approximation [33], approaches accuracy only when the thenumber of quantizer levels is very large, or the quantization stepsize is very small. In many modern applications this condi-tion is definitely not met.
A way to force the Bennett conditions and thus temperthe statistical properties of the error signal is to use a dithersignal, which is added to the host signal before quantization to“break up” the pattern of the quantization noise and render thereconstructed signal perceptually more pleasing. In this way,the output signal becomes more smooth, leading to a smootherquantization error. More importantly, the resulting quantizationerror is independent of the input signal and consequently be-comes less audible or visible [34]. The addition of a watermarkbefore quantization is very similar to this procedure [35], soit can indeed be considered as a case of dithered quantization[36]. We shall examine the effects of quantization attacks onthe proposed nonlinear detectors, while [35] and [36] deal withthe quantization effects of the Gaussian correlator and Cauchydetectors respectively.
Dithered quantizing systems are shown in Fig. 4(b) and (c). Inboth schemes, the system input is the original signal whilethe quantizer input is . The dither signal is con-sidered to be a strict-sense stationary random process [32], inde-pendent of . Fig. 4(b) represents a nonsubtractively ditheredsystem (NSD), while a subtractively dithered (SD) system ispresented in Fig. 4(c), in which the dither signal is subtractedfrom the output of the dithered quantizer. The total error ofthese schemes is defined as the difference between the originalsystem input and the final output, while the quantization error
is the difference between the quantizer input and output. Thetotal error of a SD system is the difference of the original inputand the final output
(46)
and is identical to the quantization error of a NSD system, a veryuseful result for our problem. The total error for a NSD systemis
(47)
which is obviously different from the total error of an SDsystem.
The dithered quantization error is uniformly distributed andindependent of the input signal under Schuchman’s Conditions[37], i.e., provided that the quantizer does not overload (thequantization error never exceeds ) and the characteristicfunction of the dither signal satisfies
for . If these conditions are met,Schuchman has proven in [37] that the total error of a SDquantizing system is uniformly distributed on ,i.i.d. and statistically independent of the original input .
The quantization error of a watermarking system is thequantization error of a NSD quantizer, since the watermark (thedither signal), is not subtracted from the output
(48)
Fig. 5. (a) Auto correlation of watermarking quantization error. Thecorrelation values are high only for a zero shift, so the quantization errorcan indeed be considered a sequence of i.i.d. random variables. (b) Crosscorrelation of watermarking quantization error and watermarked Lena data.The correlation is higher for small shifts, near zero, so the quantization errorcan be considered independent of the input signal.
Fig. 6. Effect of watermark (dither) on the quantization error distribution formoderate quantization. (a) Quantization error distribution for original Lena data.(b) Quantization error distribution for watermarked Lena data. The distributionof the quantization error becomes more “uniform” for the watermarked data.
We see here that is identical to the total error of an SDquantizer given in (46). Thus, Schuchman’s Conditions can beapplied to the watermark quantization error that is of in-terest to us, since it is equal to the total error of an SDsystem. These conditions are satisfied if the p.d.f.s of the em-bedded signal are approximately constant in each quantizationbin [38]. As mentioned in [38], this is essentially true when thequantization is not coarse. Indeed, we are interested in moderatequantization only, since coarse quantization leads to poor imagequality and a virtually useless watermarked document.
We empirically verify that Schuchman’s Conditions hold forour problem by performing experiments with the Lena image.Specifically, the DCT is applied to Lena and a watermark is de-signed for it as in Section II-A. The original and the markedLena images are then quantized using a moderate quantizationstep. The autocorrelation of the quantization error for the wa-termarked data is shown in Fig. 5(a): it is evident that the errorvalues are i.i.d., since they display low correlation for nonzeroshifts. Similarly, the cross correlation between the watermarkingquantization error and the original data in Fig. 5(b) indicates thatthese quantities can be considered uncorrelated. In Fig. 6(a) and(b) we also show the behavior of the quantization error distri-bution before and after the watermark embedding. Indeed, forwatermarked data [in Fig. 6(b)], the quantization error’s distri-bution tends to become more uniform that for the original datashown in Fig. 6(a).
Therefore, the watermarking quantization error will bevalidly considered in the sequel as a sequence of i.i.d. uniformly

BRIASSOULI AND STRINTZIS: LOCALLY OPTIMUM NONLINEARITIES FOR DCT WATERMARK DETECTION 1613
distributed random variables in , independent ofthe input signal and white [36].
B. Performance of the Correlator Under Quantization
The hypothesis test for quantized data is
(49)
where is the value of the quantization error for each DCTcoefficient, shown to be a uniformly distributed random vari-able in , independent of the deterministic value ofthe host DCT coefficient , and white. The random quantitiesin this setup are the pseudorandom sequence, consequently thewatermark with values , as well as the quanti-zation error with the value at each DCT coefficient. Thusthe expectations that follow are with respect to these two quan-tities. The correlation statistic becomes
(50)
Following a similar procedure as in Section V-A, its mean underis determined to be
(51)
and under
(52)The variance under is given by
(53)
where we use
(54)
Similarly, we easily get under
(55)
If these results are compared to those of Section V-A, we notethat quantization does not affect the mean of the Gaussian like-lihood ratio, since it depends only on the watermark magnitude.The variance, however, is increased, since under a posi-tive term is added to of (26). From (43) we see that in thatcase the probability of detection decreases for a fixed , sincethe threshold increases with . The efficacy (45) is also de-creased by the increase of . Thus there will be a degradationof the detection performance under quantization, which natu-rally worsens as the quantization step increases.
C. Performance of the Gaussian Likelihood Ratio After Usinga LO Cauchy Nonlinearity Under Quantization
The detector of (18), with given by (21), hasunder quantization and under . The corre-
sponding likelihood ratio can then be written as
(56)
Similarly to Section V-B, we get
(57)since is zero mean. Under , the mean is as in (33), but alsoincludes the quantization error, so
(58)
where
(59)
The components of (58) are estimated as
(60)
(61)

1614 IEEE TRANSACTIONS ON IMAGE PROCESSING, VOL. 13, NO. 12, DECEMBER 2004
Fig. 7. Receiver operating characteristics for (a) boat, (b) Lena, and(c) woman. The Cauchy locally optimum nonlinear scheme has the bestperformance, but both the generalized Gaussian and the very simple ZMNLalso significantly outperform the correlator.
The variance under is given by
(62)
which, after some algebra, leads to
(63)
where
(64)
D. Performance of the Correlator With a ZMNL UnderQuantization
We also derive the statistics of the correlator with the ZMNLunder quantization. The likelihood ratio under and quanti-zation is , where
(65)and for it is given by (38), but with instead of
. We see that remains the same for underboth hypotheses, so—for that data range—its mean is the sameas that of the simple correlator (i.e., without the ZMNL), underquantization. Under , for we have
(66)since is zero mean. Similarly, the mean is still zero for
, so we always have . Under , the tail data of theZMNL correlator gives
(67)
so again, because is zero mean. Thus the mean of theoutput of the correlator with the ZMNL under quantization isthe same as in (39), i.e., it remains unchanged after quantization.

BRIASSOULI AND STRINTZIS: LOCALLY OPTIMUM NONLINEARITIES FOR DCT WATERMARK DETECTION 1615
The variance under for the ZMNL correlator under quanti-zation is the same as for the simple correlator for[see (53)]. For , the variance without quantizationis zero (see end of Section V-C), and remains zero after quan-tization as well. Thus, the ZMNL correlator under quantizationgives
(68)
for and zero elsewhere. As explained in Sec-tion VI-B, the performance of this scheme under quantizationis also expected to worsen, since the variance of the test statistichas increased with the quantization.
VII. EXPERIMENTAL RESULTS
A. Detection Performance: Receiver Operating CharacteristicCurves, Efficacies
In our experiments we compare the performance of thetraditional correlator without preprocessing, the generalizedGaussian detector, the correlator preceded by a GaussianZMNL and the correlator after the Cauchy nonlinearity interms of the ROC curves and the corresponding efficacies. Thetheoretical curves are derived using the results of Section V.Monte Carlo tests are performed to experimentally validatethem: 1000 pseudorandomly generated watermarks are addedto three standard test images (Boat, Lena and Woman) at everyrun and the corresponding likelihood ratios are calculatedfor varying watermark to document ratios (WDRs), definedaccording to [39]
(69)
where
(70)
represent the watermark and host signal powers, respectively.Fig. 7(a) shows the detection results for the 30th DCT coeffi-cient of Boat and for dB. The ZMNL improvesthe performance of the correlator and achieves detection re-sults nearly as good as the generalized Gaussian detector. TheCauchy nonlinearity, on the other hand, gives much betterresults than all the other detectors. Fig. 7(b) shows the de-tection results for dB and for the fifth DCTcoefficient of the Lena image. In this case both nonlinearitieslead to much better detection results than the correlator andthe generalized Gaussian detector, while the correlator hasthe worst performance, as expected. In Fig. 7(c), the detectionresults for dB are displayed for the fifth DCTcoefficient of Woman: once again the nonlinear locally optimaldetectors outperform the correlator and even the generalizedGaussian detector. In Fig. 7(a)–(c), the lines (solid, dash, dotand dashdot) represent the theoretical ROC curves while the“points” (crosses, triangles etc.) represent the experimental
TABLE IIEFFICACIES OF THE EXAMINED DETECTORS FOR UNQUANTIZED AND
QUANTIZED DATA. THE EFFICACY OF THE GENERALIZED GAUSSIAN
AND NONLINEAR STRUCTURES IS MUCH HIGHER THAN THAT OF THE
CORRELATOR. THE CAUCHY LO DETECTOR USUALLY OUTPERFORMS
ALL SCHEMES, BUT EVEN THE SIMPLE ZMNL LEADS TO
SIGNIFICANT IMPROVEMENT IN THE DETECTION RESULTS
ROCs. Clearly, the experimental ROC curves coincide with thetheoretical ones, verifying the analysis of Section V. Finally,Table II displays the efficacies of all the detectors, whichvalidate the results of the ROC curves.
These experiments show that, although the correlator iswidely used in practice, it is definitely not the best possiblechoice for non-Gaussian data, such as the heavy tailed DCTimage coefficients. The generalized Gaussian detector is moreappropriate, as it is based on a more accurate statistical modelof the data. However, even this structure cannot always cap-ture the high-magnitude values of the DCT coefficients. TheCauchy LO nonlinearity leads to the best detection resultssince it is a locally optimal detector that also models the heavytailed data accurately by the Cauchy p.d.f.. The use of a verysimple ZMNL before the correlator also leads to significantimprovement in the detection results, without adding additionaloverhead to the detector or requiring the estimation of the noisestatistics, as in the case of the Cauchy LO detectors, whereand need to be estimated from the data.
B. Detector Robustness Under Quantization
To measure the detection performance under quantization,ROC curves are derived for all four processors for unquantizedas well as quantized data, with , which correspondsto reasonably good image quality (JPEG quality factor ap-proximately 80). For reasons of space economy, we displayonly the ROC curves for Woman with dB inFig. 8. Fig. 8(a) shows that the quantization attack worsensthe detection performance of all schemes, as expected fromSection VI-B. The correlator’s performance becomes unac-ceptable, since it didn’t perform as well as the other schemesin the first place. For this particular image, the performance ofthe ZMNL is not affected by the quantization as much as thegeneralized Gaussian detector and the Cauchy LO nonlinearity.This is evident in Fig. 8(b), which displays the performanceof all four schemes under quantization. The ZMNL still per-forms quite well even for low values of ( for
), while the generalized Gaussian and LO Cauchydetectors give acceptable detection results for higher values of
. This can be explained by the fact that, afterquantization, there are fewer high-magnitude samples in thedata tails, so they are not as heavy as before the quantization at-tack. However, the detection results also depend on the specific

1616 IEEE TRANSACTIONS ON IMAGE PROCESSING, VOL. 13, NO. 12, DECEMBER 2004
Fig. 8. Effects of quantization on detection performance for Lena withquantization step � = 20 and WDR = �31 dB. (a) ROCs for unquantizedand quantized data: There is loss in detection performance for all the schemesexamined. On the top row, the first ROC is for the simple correlator andthe second is for the generalized Gaussian detector. The second row showsthe ROCs for the ZMNL correlator and the Cauchy LO detector. (b) ROCsfor quantized data and all four detectors: The correlator has unacceptableperformance and the Cauchy LO detector and generalized Gaussian detectorsstill outperform it. The ZMNL suffers the least from quantization as thequantized data does not have as many high-magnitude samples in this case.
characteristics of each image, as noted in [3], so for other im-ages the LO nonlinearity and the generalized Gaussian detectoroutperform the ZMNL under quantization. In all the cases weexamined, after quantization the generalized Gaussian detectorstill outperforms the correlator and the nonlinear processorslead to better detection results than these two systems.
The detrimental effects of quantization on all schemes canalso be seen in Table II which displays the efficacies of all de-tectors for unquantized and unquantized data. Here we see that,even under quantization, the efficacy of the nonlinear detectorsand the generalized Gaussian detector is still higher than that ofthe correlator and the nonlinear structures often outperform thegeneralized Gaussian detector as well.
VIII. CONCLUSION
In this paper, we examine the performance of nonlinearlocally optimal blind watermark detection schemes forDCT-transformed images. The most important DCT coef-ficients (the low– and mid–frequency ones) do not follow theGaussian distribution, as they exhibit heavy tails that can bemore accurately modeled by the generalized Gaussian or theCauchy distribution. These heavy tails degrade the performanceof the Gaussian detector, which is optimal for normally dis-tributed data. We examine the effect of preprocessing usingthe Gaussian ZMNL and the LO Cauchy nonlinearities on theperformance of the correlator both theoretically and experi-mentally, by comparing the corresponding ROC curves andefficacies. It is shown that the use of nonlinearities can lead toperformance as good as, or even better than, that of the optimalgeneralized Gaussian detector. The nonlinear detectors havethe additional advantage of great simplicity of implementation.
The performance of the proposed schemes is also examined inthe presence of quantization. The effects of quantization on thedetectors are analyzed using results from the theory of ditheredquantization. The comparison of the corresponding ROC curvesand efficacies of these processors shows that under quantizationthe nonlinear structures still lead to better detection results.
REFERENCES
[1] B. Schneider, Applied Cryptography, 2nd ed. New York: Wiley, 1996.[2] H. V. Poor, An Introduction to Signal Detection and Estimation, 2nd
ed. New York: Springer-Verlag, 1994.[3] J. R. Hernandez, M. Amado, and F. Perez-Gonzalez, “DCT-domain wa-
termarking techniques for still images: detector performance analysisand a new structure,” IEEE Trans. Image Processing, vol. 9, pp. 55–68,Jan. 2000.
[4] M. Barni, F. Bartolini, A. D. Rosa, and A. Piva, “A new decoder forthe optimum recovery of nonadditive watermarks,” IEEE Trans. ImageProcessing, vol. 10, pp. 755–766, May 2001.
[5] A. Briassouli, P. Tsakalides, and A. Stouraitis, “Hidden messagesin heavy-tails: DCT-domain watermark detection using alpha-stablemodels,” IEEE Trans. Multimedia, to be published.
[6] J. Vidal and E. Sayrol, “Optimum watermark detection and embeddingin digital images,” in Proc. IEEE Workshop on Multimedia Signal Pro-cessing, Los Angeles, CA, 1998.
[7] S. A. Kassam, Signal Detection in Non-Gaussian Noise. New York:Springer-Verlag, 1988.
[8] I. J. Cox, J. Kilian, F. T. Leighton, and T. Shamoon, “Secure spreadspectrum perceptual watermarking for images, audio and video,” IEEETrans. Image Processing, vol. 6, pp. 1673–1687, Nov. 1997.
[9] J. R. Hernandez, F. Perez-Gonzalez, J. M. Rodriguez, and G. Nieto,“Performance analysis of a 2-D-multipulse modulation scheme fordata hiding and watermarking of still images,” IEEE J. Select. AreasCommun., vol. 16, pp. 510–524, Apr. 1998.
[10] F. Hartung and M. Kutter, “Multimedia watermarking techniques,” Proc.IEEE, vol. 87, pp. 1079–1107, Aug. 1999.
[11] J. G. Proakis, Digital Communications. New York: McGraw-Hill,1995.
[12] J. A. Solomon, A. B. Watson, and A. J. Ahumada, “Visibility of DCTbasis functions: effects of contrast masking,” in Proc. Data CompressionConf., Snowbird, UT, 1994, pp. 361–370.
[13] A. J. Ahumada and H. A. Peterson, “Luminance-model-based DCTquantization for image compression,” Proc. SPIE, vol. 1666, pp.365–374, 1992.
[14] R. B. Wolfgang, C. I. Podilchuk, and E. J. Delp, “Perceptual watermarksfor digital images,” Proc. IEEE, vol. 87, pp. 1108–1126, Aug. 1999.
[15] K. A. Birney and T. R. Fischer, “On the modeling of DCT and subbandimage data for compression,” IEEE Trans. Image Processing, vol. 4, pp.186–193, Feb. 1995.
[16] F. Müller, “Distribution shape of two-dimensional DCT coefficients ofnatural images,” Electron. Lett., vol. 29, pp. 1935–1936, Oct. 1993.

BRIASSOULI AND STRINTZIS: LOCALLY OPTIMUM NONLINEARITIES FOR DCT WATERMARK DETECTION 1617
[17] R. C. Reininger and J. D. Gibson, “Distributions of the two-dimensionalDCT coefficients for images,” IEEE Trans. Commun., vol. COMM-31,pp. 835–839, June 1983.
[18] R. J. Clarke, Transform Coding of Images. New York: Academic,1985.
[19] G. A. Tsihrintzis and C. L. Nikias, “Performance of optimum and sub-optimum receivers in the presence of impulsive noise modeled as analpha-stable process,” IEEE Trans. Commun., vol. 43, pp. 904–914, Mar.1995.
[20] C. L. Nikias and M. Shao, Signal Processing With Alpha-Stable Distri-butions and Applications. New York: Wiley, 1995.
[21] M. Shao and C. L. Nikias, “Signal processing with fractional lower ordermoments: stable processes and their applications,” Proc. IEEE, vol. 81,pp. 986–1010, Aug., 1993.
[22] G. Samorodnitsky and M. S. Taqqu, Stable Non-Gaussian Random Pro-cesses: Stochastic Models With Infinite Variance. New York: Chapman& Hall, 1994.
[23] J. P. Nolan, “Maximum likelihood estimation and diagnostics for stabledistributions,” Dept. of Math. and Stat., American Univ., Washington,DC, June 1999.
[24] , “Numerical calculation of stable densities and distribution func-tions,” Commun. Statist.-Stochastic Models, vol. 13, pp. 759–774, 1997.
[25] I. J. Cox, M. L. Miller, and A. McKellips, “Watermarking as commu-nications with side information,” Proc. IEEE, vol. 87, pp. 1127–1141,Aug. 1999.
[26] W. Zeng and B. Liu, “A statistical watermark detection techniquewithout using original images for resolving rightful ownerships ofdigital images,” IEEE Trans. Image Processing, vol. 8, pp. 1534–1548,Nov. 1999.
[27] J. C. Hancock and P. A. Wintz, Signal Detection Theory. New York:McGraw-Hill, 1966.
[28] K. R. Kolodziejski and J. W. Betz, “Detection of weak random signals ini.i.d. nongaussian noise,” IEEE Trans. Commun., vol. 48, pp. 222–230,Feb. 2000.
[29] A. Swami and B. Sadler, “TDE, DOA and related parameter estimationproblems in impulsive noise,” in Proc. IEEE Signal Processing Work-shop on Higher-Order Statistics, 1997, pp. 273–277.
[30] S. Ambike, J. Ilow, and D. Hatzinakos, “Detection for binary transmis-sion in a mixture of gaussian noise and impulsive noise modeled as analpha-stable process,” IEEE Signal Processing Lett., vol. 1, pp. 55–57,Mar. 1994.
[31] V. Capellini, M. Barni, F. Bartolini, and A. Piva, “A DCT-domain systemfor robust watermarking,” Signal Process., vol. 66, pp. 357–372, 1998.
[32] R. A. Wannamaker, S. P. Lipshitz, J. Vanderkooy, and J. N. Wright, “Atheory of nonsubtractive dither,” IEEE Trans. Signal Processing, vol. 48,pp. 499–516, Mar. 2000.
[33] W. R. Bennett, “Spectra of quantized signals,” Bell Syst. Tech. J., vol.27, pp. 446–472, July 1948.
[34] R. M. Gray, “Dithered quantizers,” IEEE Trans. Inform. Theory, vol. 39,pp. 805–812, June 1993.
[35] J. J. Eggers and B. Girod, “Watermark detection after quantization at-tacks,” in Proc. 3rd Workshop on Information Hiding, Dresden, Ger-many, Sept./Oct. 1999.
[36] A. Briassouli and M. G. Strintzis, “Optimal watermark detection underquantization in the transform domain,” IEEE Trans. Circuits Syst. VideoTechnol., to be published.
[37] L. Schuchman, “Dither signals and their effect on quantization noise,”IEEE Trans. Commun. Technol., vol. COMM-12, pp. 162–165, 1964.
[38] J. J. Eggers and B. Girod, “Quantization watermarking,” Proc. SPIE,Jan. 2000.
[39] , “Quantization effects on digital watermarks,” Signal Process., vol.81, no. 3, 2001.
Alexia Briassouli received the Diploma in electricalengineering from the National Technical Universityof Athens (NTUA), Athens, Greece, in 1999 and theM.S. degree in image and signal processing from theUniversity of Patras, Patras, Greece, in 2000. She iscurrently pursuing the Ph.D. degree in electrical engi-neering at the University of Illinois at Urbana-Cham-paign, Urbana.
From 2000 to 2001, she was a Research Assistantat the Informatics and Telematics Institute, Thessa-loniki [Center of Research and Technology Hellas
(CERTH)], Greece, participating in a European-funded research project. Shehas worked on the design of optimal watermark embedding and detectionsystems for images and video that are robust to various attacks. Her currentresearch interests lie in the areas of statistical signal processing, image pro-cessing, statistical image processing, and computer vision, including problemslike motion estimation and segmentation for video.
Michael G. Strintzis (S’68–M’70–SM’80–F’03)received the Diploma in electrical engineering fromthe National Technical University of Athens, Athens,Greece, in 1967 and the M.A. and Ph.D. degreesin electrical engineering from Princeton University,Princeton, NJ, in 1969 and 1970, respectively.
He joined the Electrical Engineering Department,University of Pittsburgh, Pittsburgh, PA, where heserved as an Assistant Professor from 1970 to 1976and an Associate Professor from 1976 to 1980.During that time, he worked in the area of stability of
multidimensional systems. Since 1980, he has been a Professor of electrical andcomputer engineering at the Aristotle University of Thessaloniki, Thessaloniki,Greece. He has worked in the areas of multidimensional imaging and videocoding. Over the past ten years, he has authored over 100 journal publicationsand over 200 conference presentations. In 1998, he founded the Informatics andTelematics Institute, currently part of the Center of Research and TechnologyHellas, Thessaloniki.
Dr. Strintzis was awarded the Centennial Medal of the IEEE in 1984 and theEmpirikeion Award for Research Excellence in Engineering in 1999.
Related Documents