Localized high abundance of Marine Group II archaea in the subtropical Pearl River Estuary: implications for their niche adaptation Wei Xie, 1 * Haiwei Luo, 2 Senthil K. Murugapiran, 3,4 Jeremy A. Dodsworth, 5 Songze Chen, 1 Ying Sun, 2 Brian P. Hedlund, 3 Peng Wang, 1 Huaying Fang, 6 Minghua Deng 6 and Chuanlun L. Zhang 7 ** 1 State Key Laboratory of Marine Geology, Tongji University, Shanghai, 200092, China. 2 Simon F. S. Li Marine Science Laboratory, School of Life Sciences and Partner State Key Laboratory of Agrobiotechnology, The Chinese University of Hong Kong, Shatin, Hong Kong, China. 3 School of Life Sciences, University of Nevada, Las Vegas, Las Vegas, NV 89154, USA. 4 MetaG enoPolis, Institut National de la Recherche Agronomique (INRA), Universit e Paris-Saclay, Jouy-en-Josas, 78350, France. 5 Department of Biology, California State University, San Bernardino, CA 92407, USA. 6 School of Mathematical Sciences, Peking University, Beijing, 100871, China. 7 Department of Ocean Science and Engineering, Southern University of Science and Technology, Shenzhen, 518055, China. Summary Marine Group II archaea are widely distributed in global oceans and dominate the total archaeal com- munity within the upper euphotic zone of temperate waters. However, factors controlling the distribution of MGII are poorly delineated and the physiology and ecological functions of these still-uncultured organ- isms remain elusive. In this study, we investigated the planktonic MGII associated with particles and in free-living forms in the Pearl River Estuary (PRE) over a 10-month period. We detected high abundance of particle-associated MGII in PRE (up to 10 8 16S rRNA gene copies/l), which was around 10-fold higher than the free-living MGII in the same region, and an order of magnitude higher than previously reported in other marine environments. 10& salinity appeared to be a threshold value for these MGII because MGII abun- dance decreased sharply below it. Above 10& salinity, the abundance of MGII on the particles was positively correlated with phototrophs and MGII in the surface water was negatively correlated with irra- diance. However, the abundances of those free-living MGII showed positive correlations with salinity and temperature, suggesting the different physiological characteristics between particle-attached and free- living MGIIs. A nearly completely assembled metage- nome, MGIIa_P, was recovered using metagenome binning methods. Compared with the other two MGII genomes from surface ocean, MGIIa_P contained higher proportions of glycoside hydrolases, indicat- ing the ability of MGIIa_P to hydrolyse glycosidic bonds in complex sugars in PRE. MGIIa_P is the first assembled MGII metagenome containing a catalase gene, which might be involved in scavenging reactive oxygen species generated by the abundant photo- trophs in the eutrophic PRE. Our study presented the widespread and high abundance of MGII in the water columns of PRE, and characterized the determinant abiotic factors affecting their distribution. Their asso- ciation with heterotrophs, preference for particles and resourceful metabolic traits indicate MGII might play a significant role in metabolising organic matters in the PRE and other temperate estuarine systems. Introduction Marine planktonic archaea were first reported over two decades ago (DeLong, 1992; Fuhrman et al., 1992) and are now recognized as major players in global oceanic ecosystems (e.g. Zhang et al., 2015). Planktonic archaea include four major groups, with Marine Group I (MGI) being currently recognized as marine Thaumarchaeota, and Marine Group II (MGII), Marine Group III (MGIII) and Marine Group IV (MGIV) (L opez-Garcı ´a et al., 2001) being the uncultured groups of Euryarchaeota. While MGII are Received 19 July, 2017; revised 18 November, 2017; accepted 19 November, 2017. For correspondence. *E-mail [email protected]. cn; Tel. 186-21-65982012; Fax 186-21-65988888. **E-mail [email protected]; Tel. 186-755-88018785; Fax 186-755- 88018785. V C 2017 Society for Applied Microbiology and John Wiley & Sons Ltd Environmental Microbiology (2017) 00(00), 00–00 doi:10.1111/1462-2920.14004

Welcome message from author
This document is posted to help you gain knowledge. Please leave a comment to let me know what you think about it! Share it to your friends and learn new things together.
Transcript
Localized high abundance of Marine Group II archaeain the subtropical Pearl River Estuary: implications fortheir niche adaptation
Wei Xie,1* Haiwei Luo,2 Senthil K. Murugapiran,3,4
Jeremy A. Dodsworth,5 Songze Chen,1 Ying Sun,2
Brian P. Hedlund,3 Peng Wang,1 Huaying Fang,6
Minghua Deng6 and Chuanlun L. Zhang7**1State Key Laboratory of Marine Geology, Tongji
University, Shanghai, 200092, China.2Simon F. S. Li Marine Science Laboratory, School of
Life Sciences and Partner State Key Laboratory of
Agrobiotechnology, The Chinese University of Hong
Kong, Shatin, Hong Kong, China.3School of Life Sciences, University of Nevada, Las
Vegas, Las Vegas, NV 89154, USA.4MetaG�enoPolis, Institut National de la Recherche
Agronomique (INRA), Universit�e Paris-Saclay,
Jouy-en-Josas, 78350, France.5Department of Biology, California State University,
San Bernardino, CA 92407, USA.6School of Mathematical Sciences, Peking University,
Beijing, 100871, China.7Department of Ocean Science and Engineering,
Southern University of Science and Technology,
Shenzhen, 518055, China.
Summary
Marine Group II archaea are widely distributed in
global oceans and dominate the total archaeal com-
munity within the upper euphotic zone of temperate
waters. However, factors controlling the distribution
of MGII are poorly delineated and the physiology and
ecological functions of these still-uncultured organ-
isms remain elusive. In this study, we investigated
the planktonic MGII associated with particles and in
free-living forms in the Pearl River Estuary (PRE) over
a 10-month period. We detected high abundance of
particle-associated MGII in PRE (up to �108 16S rRNA
gene copies/l), which was around 10-fold higher than
the free-living MGII in the same region, and an order
of magnitude higher than previously reported in other
marine environments. 10& salinity appeared to be a
threshold value for these MGII because MGII abun-
dance decreased sharply below it. Above 10&
salinity, the abundance of MGII on the particles was
positively correlated with phototrophs and MGII in
the surface water was negatively correlated with irra-
diance. However, the abundances of those free-living
MGII showed positive correlations with salinity and
temperature, suggesting the different physiological
characteristics between particle-attached and free-
living MGIIs. A nearly completely assembled metage-
nome, MGIIa_P, was recovered using metagenome
binning methods. Compared with the other two MGII
genomes from surface ocean, MGIIa_P contained
higher proportions of glycoside hydrolases, indicat-
ing the ability of MGIIa_P to hydrolyse glycosidic
bonds in complex sugars in PRE. MGIIa_P is the first
assembled MGII metagenome containing a catalase
gene, which might be involved in scavenging reactive
oxygen species generated by the abundant photo-
trophs in the eutrophic PRE. Our study presented the
widespread and high abundance of MGII in the water
columns of PRE, and characterized the determinant
abiotic factors affecting their distribution. Their asso-
ciation with heterotrophs, preference for particles
and resourceful metabolic traits indicate MGII might
play a significant role in metabolising organic matters
in the PRE and other temperate estuarine systems.
Introduction
Marine planktonic archaea were first reported over two
decades ago (DeLong, 1992; Fuhrman et al., 1992) and
are now recognized as major players in global oceanic
ecosystems (e.g. Zhang et al., 2015). Planktonic archaea
include four major groups, with Marine Group I (MGI) being
currently recognized as marine Thaumarchaeota, and
Marine Group II (MGII), Marine Group III (MGIII) and
Marine Group IV (MGIV) (L�opez-Garcı́a et al., 2001) being
the uncultured groups of Euryarchaeota. While MGII are
Received 19 July, 2017; revised 18 November, 2017; accepted 19November, 2017. For correspondence. *E-mail [email protected]; Tel. 186-21-65982012; Fax 186-21-65988888. **[email protected]; Tel. 186-755-88018785; Fax 186-755-88018785.
VC 2017 Society for Applied Microbiology and John Wiley & Sons Ltd
Environmental Microbiology (2017) 00(00), 00–00 doi:10.1111/1462-2920.14004

more abundant in surface waters (Fuhrman and Davis,
1997; Massana et al., 2000; L�opez-Garcı́a et al., 2001;
Mincer et al., 2007) and were also found in deep-sea water
(Deschamps et al., 2014; Li et al., 2015; Liu et al., 2017),
marine Thaumarchaeota are more abundant in meso- and
bathypelagic waters (Karner et al., 2001; Herndl et al.,
2005; Mincer et al., 2007; Teira et al., 2008; Varela et al.,
2008). MGIII are generally considered to be more
restricted to deeper waters (Massana et al., 2000; Galand
et al., 2009) and, to a lesser extent, the photic zone
(Haro-Moreno et al., 2017). Two major MGII groups, MGIIa
and MGIIb (Martin-Cuadrado et al., 2015), have been iden-
tified by their 16S rRNA gene (Massana et al., 2000;
Martin-Cuadrado et al., 2008). The availability of a number
of MGII genomes has enhanced our understanding of
these groups (Iverson et al., 2012; Li et al., 2015;
Martin-Cuadrado et al., 2015). However, they are still
much less known than the more thoroughly studied marine
Thaumarchaeota.
Studies so far have revealed intermittent blooms of MGII
coinciding with decreases in chlorophyll (Murray et al.,
1999), season-specific growth of different ecotypes of
MGII (Galand et al., 2010; Hugoni et al., 2013) and physi-
cal associations with particles (Orsi et al., 2015), which
were related to the abiotic factors controlling the growth or
distribution of MGII. However, their interactions with other
organisms, the so-called biotic factors (Rohwer and
Thurber, 2009), have not been addressed in detail.
Needham and Fuhrman, (2016) showed that MGII were
correlated with Phaeocystis contemporaneously and with
Chaetoceros and Heterosigma after a 3-day delay during a
spring phytoplankton bloom in southern California.
Through taxon–taxon co-occurrence network analyses
from the Tara Oceans expedition covering 68 stations
across eight oceanic provinces, Lima-Mendez et al. (2015)
revealed that MGII co-occurred with Dinophyta, Chloro-
phyta and Bacillariophyta and predicted that 39 phages
might participate in virus-host interactions with MGII. A
MGII genome from the Red Sea was recently found to
carry a novel family of head-tailed archaeal viruses,
Magroviruses (Marine Group II viruses) (Philosof et al.,
2017). Those reports suggested that the biotic interactions
between MGII and phototrophs or viruses might be critical
factors influencing the distribution of MGII in the ocean.
Estuarine systems are exposed to spatial and temporal
changes in nutrients, temperature, salinity, pH and other
environmental factors, which select for adaptable organ-
isms (Alla et al., 2006). Estuaries also play a crucial role in
influencing the fluxes of silicon, phosphorus and nitrogen
from land to the ocean and are often characterized by high
primary productivity (Harrison et al., 2008). Some photo-
trophs from coastal waters are thought to modulate
the local microbial community allelopathically through the
generation of reactive oxygen species (Tang and
Gobler, 2010). Metatranscriptomic analyses of marine
Thaumarchaeota in the surface water from the mouth of
Doboy Sound showed the overrepresentation of superox-
ide dismutase and peroxiredoxins transcripts, suggesting
that marine Thaumarchaeota may have developed
genetic capability against damage from superoxide
(Hollibaugh et al., 2011). So far, comprehensive research
on MGII in estuaries is limited (Crump and Baross, 2000;
Vieira et al., 2007; Galand et al., 2008; Hao et al., 2010);
particularly poorly known are the abiotic and biotic factors
controlling estuarine MGII populations and the genetic
advantages conferring their ecological success in estua-
rine environments.
By monthly monitoring the abundance and community
structure of Archaea over a 10-month period along a salin-
ity gradient in a highly disturbed estuary, the Pearl River
Estuary (PRE), we examined both abiotic and biotic factors
that influence the abundance and distribution of free-living
and particle-attached MGII. Results showed that abiotic
factors [including salinity, temperature and monthly photo-
synthetically active radiation (PAR)] and biotic interactions
with Cyanobacteria, algae and Bathyarchaeota (first found
as Miscellaneous Crenarchaeota Group and recently
named as a novel phylum Bathyarchaeota; Meng et al.,
2014) intertwined in influencing the distributions of MGII in
the PRE. We also obtained a unique and nearly complete
MGII genome, named MGIIa_P (P represents Pearl River
Estuary). In comparison with the other two MGII genomes
from surface water (Iverson et al., 2012; Martin-Cuadrado
et al., 2015), MGIIa_P contained higher diverse glycoside
hydrolases, suggesting it might involve in the degradation
of complex sugars in PRE. The MGIIa_P represented the
most abundant MGII operational taxonomic unit (OTU) in
the PRE, which encodes bacterially-derived catalase and
high-affinity inorganic phosphate transporters, reflecting
the adaptation of MGIIa_P to oxidative damage and the
variation of phosphate concentration in the PRE. The exis-
tence of these acquired genes in the most abundant MGII
genome from the PRE suggests that horizontal gene trans-
fer (HGT) might be important for the ecological success of
MGII in estuarine environments.
Results
Changes in abundances of particle-associated and free-living MGII and archaea along the salinity gradient
qPCR targeted both MGII and archaea along the salinity
gradient (Fig. S2a–i) over the 10-month period. We consid-
ered MGII collected on a 0.7 mm filter to be particle-
attached and those on a 0.22 mm filter after passage
through the 0.7 mm filter to be free-living (Orsi et al., 2015).
We found both SAR11 OTUs and SAR86 OTUs
(Giovannoni et al., 1990; DeLong et al., 1993) that
are known as free-living species to be more abundant
2 W. Xie et al.
VC 2017 Society for Applied Microbiology and John Wiley & Sons Ltd, Environmental Microbiology, 00, 00–00
in the free-living fraction (Fig. S3), demonstrating that the
0.7 mm fractions reasonably represented particle-attached
populations.
Using these definitions, the abundances of MGII were
different between particle-attached and free-living fractions
and between sampling locations and sampling times along
the PRE salinity gradient (Table S1). The abundances of
particle-attached MGII ranged from 5.7 3 102 copies/l in
the bottom water of site A in February 2013 to 4.2 3 108
copies/l in the bottom water of site C in November 2012,
with an average value of 3.8 6 7.0 3 107 copies/l (n 5 98),
while the free-living MGII ranged from 2.3 3 102 copies/l in
the bottom water of site A in February to 7.6 3 107 copies/
l in the middle water of site C in October 2012, with an
average value of 0.4 6 1.2 3 107 copies/l (n 5 99) (Fig. 1
and Table S1). The abundances of particle-attached MGII
in 71 out of the 98 samples were higher than the corre-
sponding free-living MGII. The average abundance of
particle-attached MGII was around 10-fold higher
(P< 0.001) than that of the free-living MGII (Fig. S4 and
Table S1). The free-living MGII only showed significant
positive correlation with particle-attached MGII at freshwa-
ter site A (Fig. S4), which might be due to their similar
responses to the salinity change at this site. However,
there were no correlations between free-living and particle-
attached MGII at site B, C and D (Fig. S4), suggesting dif-
ferent responses of free-living and particle-attached MGII
to the environmental changes in PRE.
The particle-attached MGII in both surface and bottom
water varied significantly among freshwater site A, low-
salinity site B, high-salinity site C and seawater site D. The
highest abundances of particle-attached MGII in the sur-
face water and bottom water were both found at site C
(3.4 6 5.0 3 107 copies/l (Fig. 2A) and 1.4 6 1.3 3 108
copies/l (Fig. 2B) respectively) over the sampling period.
The average abundance of particle-attached MGII in the
surface water at site C was 77-fold (P 5 0.003), sixfold
(P 5 0.34) and sixfold (P 5 0.04) higher than those at sites
A, B and D respectively (Fig. 2A). The average abundance
of particle-attached MGII in the bottom water at site C was
532-fold (P<0.001), threefold (P 5 0.15) and fourfold
(P 5 0.003) higher than those at sites A, B and D respec-
tively (Fig. 2B). Despite the significant differences in
salinity, temperature, silicate and nitrate between high-
runoff and low-runoff seasons, the abundances of MGII
were not different between the high-runoff and low-runoff
seasons in neither surface water (Fig. S5a) nor bottom
water (Fig. S5b), suggesting minimal impact of terrestrial
runoff on MGII populations in the PRE. The deep samples
were less variable in physicochemical factors throughout
the year. But, the abundances of particle-attached MGII in
the bottom water were sevenfold (P 5 0.04), fourfold
(P 5 0.007) and sixfold (P 5 0.01) higher than those in the
surface water at sites B, C and D (Fig. S6a–d),
respectively, which might be due to greater occurrence of
particles in the bottom water (Zhang et al., 2011).
The X–Y scatter plots of MGII abundances and salinity
showed an inflection point around 10& salinity (Fig. S7).
The Pearson correlation coefficient of MGII-salinity
decreased from 0.52 in < 10& salinity samples to 0.06 in
> 10& salinity samples, indicating �10& salinity is the
threshold value for MGII cells in the PRE. Therefore, those
samples with lower than �10& salinity were not included
in the following Pearson correlation analysis that eliminated
the salinity factor.
All the particle-attached MGII in the three layers showed
significant correlations with phototrophs (R2 5 0.42, 0.36
and 0.78 for surface, middle and bottom water respec-
tively) (Fig. 3A–C and Tables S2–S4), demonstrating the
potential impact of phototrophs on the particle-attached
MGII in the PRE. The particle-attached MGII in the bottom
water (R2 5 0.78) showed a higher determination coeffi-
cient than the middle (R2 5 0.36) and surface water
(R2 5 0.42), which suggested that MGII in deeper waters
are most preferentially dependent on the phototrophs. The
particle-attached MGII in surface water, but not middle or
bottom water, showed significantly negative correlation
(R2 5 0.27, P 5 0.006) with monthly PAR (Fig. 3D–F and
Tables S2–S4), which was consistent with observations in
the northwestern Mediterranean Sea (Galand et al., 2010),
suggesting MGII in surface water were better adapted to
low PAR seasons.
In comparison to the adaptation of particle-attached
MGII to high phototrophic but low PAR environments,
the free-living MGII in surface water were positively cor-
related with salinity (R2 5 0.33, P 5 0.005) but
negatively correlated with silicate (R2 5 0.27, P 5 0.01)
and nitrate (R2 5 0.29, P 5 0.004) for > 10& salinity
samples (Table S2), while those in the middle
(R2 5 0.56, P 5 0.001) and bottom (R2 5 0.32,
P 5 0.002) waters were positively correlated with tem-
perature (Tables S3 and S4). The abundances of free-
living MGII were not significantly different among the
surface, middle or bottom waters and showed no corre-
lation with PAR (Tables S2–S4), suggesting that they
were minimally impacted by PAR.
In contrast with particle-attached MGII showing signifi-
cant different abundances in surface water and bottom
water (Fig. S6a–d), there was no significant difference for
the total particle-attached Archaea in surface and bottom
waters (Fig. S6e–h). Pearson correlation analysis showed
that the abundances of total particle-attached Archaea in
surface and bottom waters were negatively correlated with
salinity but positively correlated with silicate, nitrate and
phototrophs (Tables S2 and S4), suggesting that total
particle-attached Archaea were also sensitive to high salin-
ity and depended on the phototrophs in this region. Similar
with free-living MGII, the abundance of total free-living
High abundance of MGII in an estuary 3
VC 2017 Society for Applied Microbiology and John Wiley & Sons Ltd, Environmental Microbiology, 00, 00–00

Archaea correlated positively with temperature (Fig. S8a
and b and Tables S2–S4), suggesting that they both may
be favoured by increased temperature (from low
temperature season (January, 16.7 6 1.38C) to high tem-
perature seasons (May, July, September, October,
27.7 6 1.98C)).
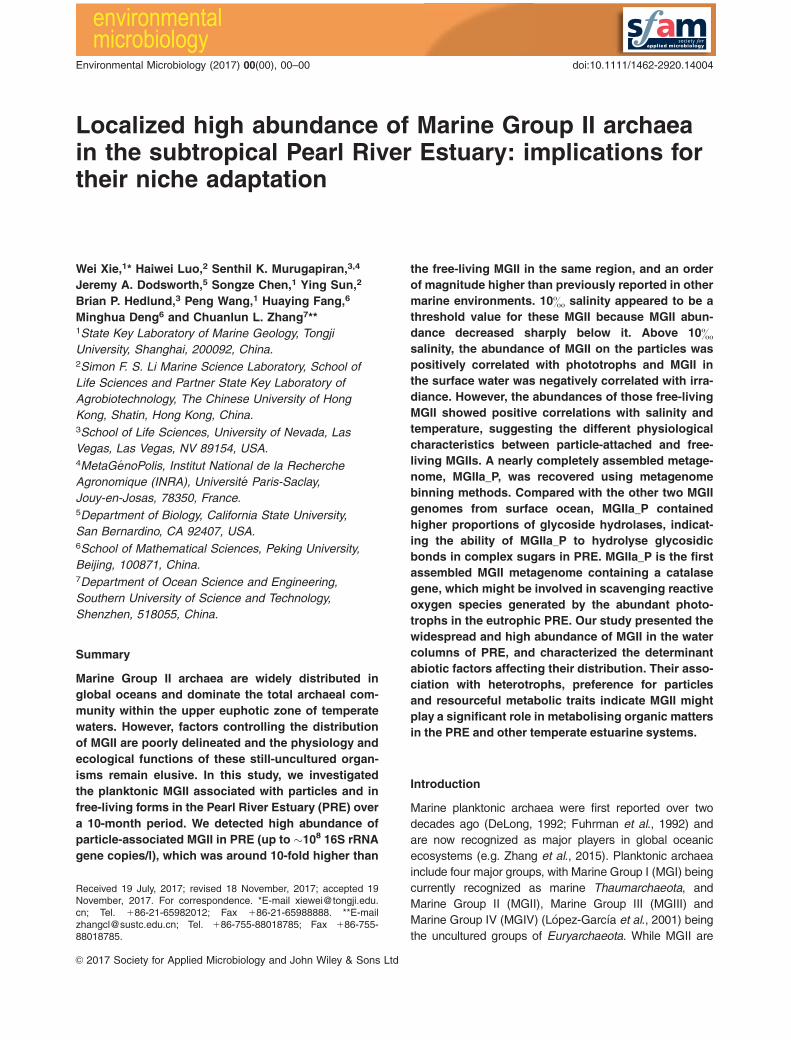
Fig. 1. The monthly changes of particle-attached and free-living MGII abundances along freshwater site A (I and II), low-salinity site B (III andIV), high-salinity site C (V and VI) and seawater site D (VII and VIII).
4 W. Xie et al.
VC 2017 Society for Applied Microbiology and John Wiley & Sons Ltd, Environmental Microbiology, 00, 00–00

Change in archaeal community structure on particlesand of free-living along the salinity gradient
High-throughput amplicon sequencing targeting the
archaeal 16S rRNA gene using the Illumina MiSeq plat-
form was conducted to investigate proportional changes of
MGII in archaeal communities along the salinity gradient
over the sampling period. Based on the taxonomic compo-
sitions of archaeal communities, the 0.7 lm filter samples
and 0.22 lm filter samples could be divided into five
(Fig. 4) and four (Fig. S9) groups respectively. While 0.7
lm and 0.22 lm fractions from the freshwater site A
formed separate clusters based on their archaeal composi-
tions, samples from sites B, C and D could not be resolved
by filter size or sampling season, which might be due to
the dynamic environment in the PRE. However, the propor-
tions of MGII in both 0.7 lm and 0.22 lm fractions
generally increased from nearshore sites to offshore sites
(Figs 4 and S9). The distinctness of archaeal communities
between the freshwater site and the other three sites sug-
gested the salinity boundary was a significant transition
barrier for Archaea in the water column, which was consis-
tent with Archaea from PRE sediments (Xie et al., 2014b).
Only samples with higher than �10& salinity were
included in the following statistical analyses.
RDA analysis showed that only nitrate and nitrite concen-
trations were significantly correlated with the distribution of
the archaeal community in particle-attached samples (Fig.
S10). Both Nitrosopumilus and MGII had narrow angles
with nitrate and nitrite vectors (Fig. S10), suggesting their
close relationships with nitrate and nitrite in the PRE.
A total of ten MGII OTUs were found in the MiSeq data-
set from both 0.7 lm and 0.22 lm filter samples.
Phylogenetic analyses showed that four OTUs were clus-
tered into MGIIb and six OTUs into MGIIa (Fig. S11). Both
MGIIa and MGIIb were found on the 0.7 lm and 0.22 lm
filters. The percentages of MGIIa decreased from 37.3% 6
14.7% at site D, 26.7% 6 9.8% at site C, 20.9% 6 9.0% at
site B, to 1.0% 6 0.8% at site A in 0.7 lm filter samples
and decreased similarly in 0.22 lm filter samples (Fig.
S12). The percentages of MGIIb shifted from 12.5% 6
7.8% at site D, 7.7% 6 7.2% at site C, 7.2% 6 8.8% at site
B, to 0.2% 6 0.2% at site A in 0.7 lm filter samples and
similarly in 0.22 lm filter samples (Fig. S12). The results
suggested that both MGIIa and MGIIb were increased with
salinity. There was no significant difference on the relative
abundance between the 0.7 lm filters and 0.22 lm filters
for either MGIIa or MGIIb at sites B, C and D (Fig. S12),
suggesting both MGIIa and MGIIb were non-selective for
the particle–attached or free-living lifestyle in those sites.
The cluster analysis showed that species variation of
MGII in the 0.22 lm fractions was not significantly different
from that in the 0.7 lm fractions, suggesting the species of
free-living and particle-attached MGII were similar or iden-
tical (Fig. S13). All those samples were clustered into
groups characterized by different seasons (Fig. S13), indi-
cating the season-specific proliferation of different
ecotypes of MGII in PRE.
RDA targeting the ten MGII OTUs in the 0.7 lm fractions
showed that monthly PAR was identified as the most signif-
icant environmental factor contributing to the distinctive
MGII distributions in the surface water (P< 0.001; 1000
Monte Carlo permutations). For example, MGIIa_OTU2
and MGIIb_OTU14 were negatively correlated with PAR
and MGIIb_OTU4, MGIIa_OTU16 and MGIIa_OTU3 posi-
tively correlated with PAR (Figs 5A and S14). Nitrite was
identified as another significant environmental factor con-
tributing to their distributions (Fig. 5A), which showed
positive correlations with three MGIIa (OTUs 7, 15 and 6)
and negative correlations with two MGIIb (OTUs 5 and 8;
Fig. 5A).
Fig. 2. Statistic comparison of MGII abundances in surface water (A) and bottom water (B) at different sites along PRE. Two stars indicate thatthe differences were significant at the 0.01 level. One star indicates that the differences were significant at the 0.05 level. The solid boxindicates the location of the middle 50% of the qPCR data (first to third quartile), with the median marked in the centre as a solid line. Themaximum length of each whisker is 1.5 times the interquartile range. The red cross indicates the average value.
High abundance of MGII in an estuary 5
VC 2017 Society for Applied Microbiology and John Wiley & Sons Ltd, Environmental Microbiology, 00, 00–00

Contrastingly, free-living MGII showed that salinity was
the most significant environmental factor contributing to
their distributions in the surface water (Fig. 5B). Although
no significant difference in ecotypes exists between the
particle-attached and free-living MGII, their different
responses to environmental changes suggested different
physiological characteristics between them.
Possible interactions between phototrophs and archaea
To investigate the impacts of phototrophs on the distribu-
tions of those MGII in PRE, the primers that cover both
algae and Cyanobacteria were used to survey the commu-
nity compositions of phototrophs in the 0.7 lm filter
samples from sites C and D. The results showed that
samples were grouped into a seawater cluster [composed
primarily of marine Cyanobacteria (70% 6 11.7%)] and a
brackish water cluster [composed primarily of Chlorophyta
(29.6% 6 17.9%), marine Cyanobacteria (28.1% 6 30.8%)
and Bacillariophyta (18.9% 6 18.2%; Figs S15–S17)].
CCLasso analysis, which is useful for inferring the
correlation network for latent variables of microbial compo-
sitional data, showed correlations between archaeal OTUs
and phototroph OTUs in the PRE over the sampling
period. After being tested by ALDEx2, 51 phototroph
OTUs (Table S5, representing 78.3% 612.5% of photo-
trophs, n 5 40) and 13 archaeal OTUs (Table S6,
representing 74.2% 6 15.8% of Archaea, n 5 40) showed
statistical differences between different months and were
used for CCLasso analyses. A total of 359 edges (involving
Fig. 3. Scatter diagram of particle-attached MGII 16S rRNA gene vs. phototroph 23S rRNA in surface (A), middle (B), bottom water (C) andMGII 16S rRNA gene vs. PAR in surface (D), middle (E), bottom water (F).
6 W. Xie et al.
VC 2017 Society for Applied Microbiology and John Wiley & Sons Ltd, Environmental Microbiology, 00, 00–00

48 phototroph OTUs and 12 archaeal OTUs) were found
(Table S7). The average edge numbers were 6, 1.6 and 1
for intra-phototroph, intra-archaea and inter-phototroph/
Archaea correlations respectively.
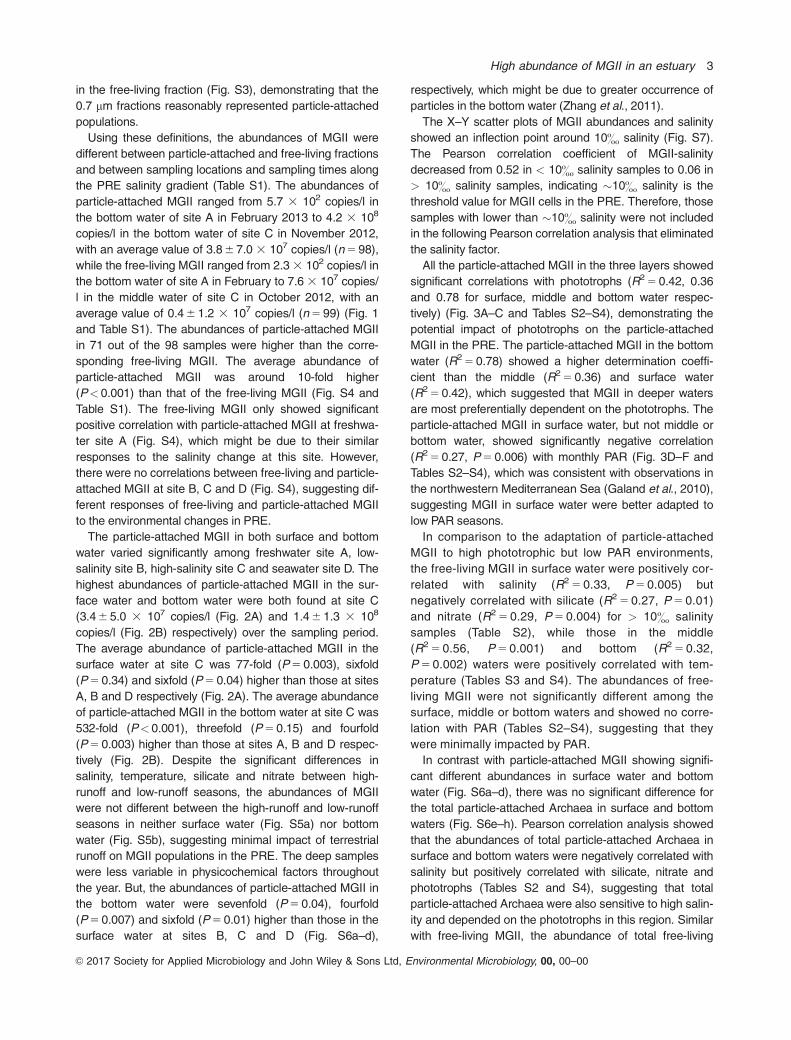
The highest number of interactions involving MGII was
from MGIIa_OTU2, which exhibited 14 edges and was the
second most abundant archaeon and most abundant MGII
(Fig. 6). Its proportion was negatively correlated with the total
proportions of all the Bathyarchaeota OTUs (Fig. S18a,
partial-correlation analysis indicated that the correlation was
real (controlling for salinity, P5 0.003)). MGIIa_OTU2 also
showed positive correlations with nine phototroph OTUs,
Fig. 4. Cluster analysis based on taxonomic composition of Archaea in 0.7 lm fractions that collected monthly from surface (S), middle (M) andbottom water (B) at Site A, B, C and D during July 2012 to May 2013. Sample names representing the sampling months and sites are shown onthe right of the figure (for example, 7A_S represented the surface water sample collected in July 2012). The orders are colour coded and shownat the bottom of the figure. Those samples are majorly clustered into five groups: freshwater Group (Salinity: 0.9& 6 1.2&, n 5 17), brackishwater Group A (Salinity: 12.3& 6 6.8&, n 5 16), brackish water Group B (Salinity: 13.6& 6 6.6&, n 5 13), Marine Group A (Salinity:21.4& 6 8.9&, n 5 13), Marine Group B (Salinity: 24.5& 6 6.0&, n5 20). The samples in corresponding groups are boxed with dash lines.
High abundance of MGII in an estuary 7
VC 2017 Society for Applied Microbiology and John Wiley & Sons Ltd, Environmental Microbiology, 00, 00–00

which included four marine Cyanobacteria, three Bacillario-
phyta, one Chlorophyta and one Dinophyceae (Figs 6 and
S18b). In contrast, MGIIa_OTU3, which was the second
most abundant MGII in this region, only showed correlations
with two phototrophs. MGIIa_OTU7 was positively correlated
with four freshwater Cyanobacteria (controlling for salinity,
P> 0.05 for all the four phototrophs), but MGIIb_OTU8 was
negatively associated with the same Cyanobacteria (control-
ling for salinity, P< 0.01 for phototroph OTU437, OTU337
and OTU159, but P5 0.08 for phototroph OTU268); Fig.
S19a–d). The MGIIa_OTU16 and MGIIb_OTU4 showed
positive correlations with two phototrophs (one marine Cya-
nobacteria and one Bacillariophyta) (Fig. 6). These results
suggested that the composition of the phototrophic commu-
nity might account for diversity and dynamics of MGII
populations, though the mechanisms driving strong correla-
tions between these taxa are unknown.
Genomic analysis of a MGII metagenome bin
Shotgun metagenomic sequencing of the 0.7 lm fraction
from site D was conducted. A total of 6 Gbp of sequences
were generated from this sample. De novo assembly of
metagenomic reads (Table S8) and binning by tetranucleo-
tide signatures resulted in a distinct archaeal metagenome
bin, named MGIIa_P (�1.8Mbp, Figs S20 and S21) con-
taining 136 contigs. This genome bin represented 2.9% of
the metagenome assembly, taking into account sequenc-
ing coverage. The MGIIa_P bin contained 137 single-copy
markers (SCMs) out of 162 total SCMs (Rinke et al.,
2013), leading to an estimate of 93% genome complete-
ness (Table S9). Only two of these SCMs were present in
greater than one copy, PF01896 (DNA primase) and
PF01981 (archaeal-type peptid yl-tRNA hydrolase) (Fig.
S22). PF01981 is also present in two copies as adjacent
genes in the MGII bin reported by Iverson et al. (2012); the
two copies of PF01981 are also adjacent in the MGIIa_P
bin, and both have top BLAST hits to those in the Iverson
et al. (2012) MGII bin. PF01896 was also present in two
copies, but both of these had top BLAST hits to other MGII
metagenome bins. Similar results were obtained using the
program CheckM (Parks et al., 2015), which uses a similar
set of lineage-specific marker genes; 165 out of 188 SCMs
were present in the metagenome bin, with only one marker
present at greater than a single copy.
The Amphora2 was used to identify the best hit for con-
served marker genes (Wu and Scott, 2012). The results
showed that 96 of the total 104 archaeal markers were
also identified in the MGII bin (Table S9). The protein
sequences of the markers were searched against
the NCBI non-redundant (nr) database using BLASTP,
restricting the results to a maximum of five hits (-max_
target_seqs 5). All the top BLASTP hits were against
marine group archaea, Euryarchaeota or other uncultured
archaea sequences in the nr database except in the case
of rpl18p which had a top hit against Flavobacteriaceae_
bacterium_TMED81 (NCBI taxonomy ID: 1986719), possi-
bly because of a slightly higher bitscore (240) when
compared to the second hit (238) to proteins belonging to
MGII (NCBI taxonomy ID: 274854). There were only 4
Fig. 5. RDA ordination diagrams of MGII with environmental variables in 0.7 lm filter samples (A) and 0.22 lm filter samples (B) in thesurface water had > 10% salinities. Correlations between environmental variables and RDA axes are represented by the length and angle ofred arrows (environmental factor vectors). Blue arrows represent the proportions of the 10 MGII OTUs (the number represents the OTU ID asshown in Table S6). The seasons on the samples correspond to the sampling times.
8 W. Xie et al.
VC 2017 Society for Applied Microbiology and John Wiley & Sons Ltd, Environmental Microbiology, 00, 00–00
other hits to Flavobacteriaceae_bacterium_TMED81
(NCBI taxonomy ID: 1986719) and bacterium_TMED221
(NCBI taxonomy ID: 1986656). Thus, based on SCM copy
number and BLAST analyses, MGIIa_P metagenome bin
likely represented a single species, with minimal contami-
nation from non-MGII sequences.
Although phylogenetic analysis revealed that this
genome belonged to MGIIa (Fig. S10), it only had 74.7%
average nucleotide identity (Table S10) with the previously
published MGIIa genome (Iverson et al., 2012), indicating
that it represented a novel species. The 16S rRNA gene of
MGIIa_P (920 bp) shared 190 bp with 100% similarity with
MGIIa_OTU2 (250 bp) and phylogenetically clustered
together, suggesting the representation of MGIIa_OTU2
for MGIIa_P (Fig. S11). Although MGIIa_P was identified
from the metagenome from site D, MGIIa_OTU2 was
highly abundant in samples having > 10& salinity from
sites B, C and D (Fig. S13), suggesting its adaptation in
the wide region of PRE. Comparing with former published
marine Thaumarchaeota and MGII genomes, genes
319
433
455
Arch10 35466
MGIIaMGIIb
MGIBathyarchaeota
Other Algae
Freshwater Cyanobacteria
Marine Cyanobacteria
BacillariophytaCryptophyta ChlorophytaMethanogens
MBGB
10
Arch1(39%)
Arch2(9.8%)
319
514 268
159
337
437
386
10
55
68
173
305
594
309
139
499 398
271
479
317
262
579
452
Arch3(9.7%)
Arch6(2.6%)
Arch4(3.8%)
Arch7(1.9%)Arch8
(1.7%)
Arch5(3.8%)
78
Arch9
Arch11
Arch13
Arch12
Fig. 6. Network interactions revealed relationships between phototrophs and Archaea. Solid lines, positive correlation; dashed lines, negativecorrelation. The circles represent archaeal OTUs. The diamonds represent phototroph OTUs. The number represents the generated OTU IDas shown in Table S5 and Table S6. The sizes of the circles or diamonds represent the average OTU abundances. The percentages of themajor Archaea were shown in the circles.
High abundance of MGII in an estuary 9
VC 2017 Society for Applied Microbiology and John Wiley & Sons Ltd, Environmental Microbiology, 00, 00–00
related to phosphorus metabolism, oxidative stress, carbo-
hydrates and protein degradation were overrepresented
(odds ratios higher than 3, Table S11) in the MGIIa_P
genome, which might be important for its niche adaptation
in the PRE (Table S10).
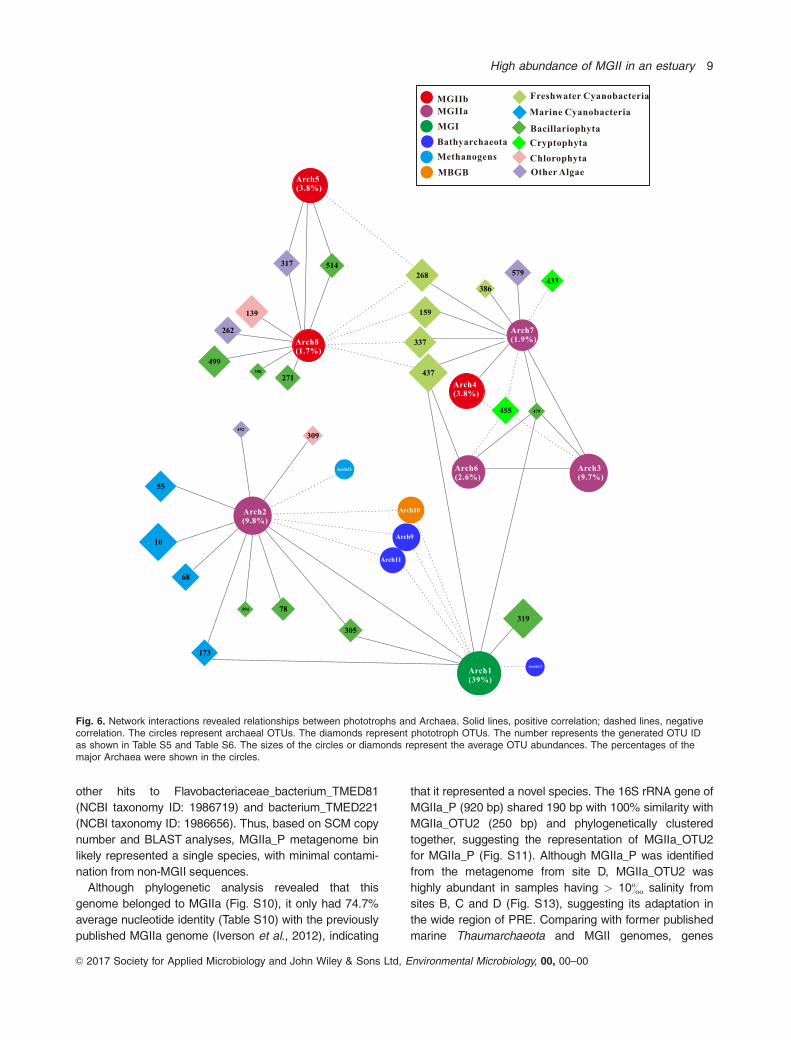
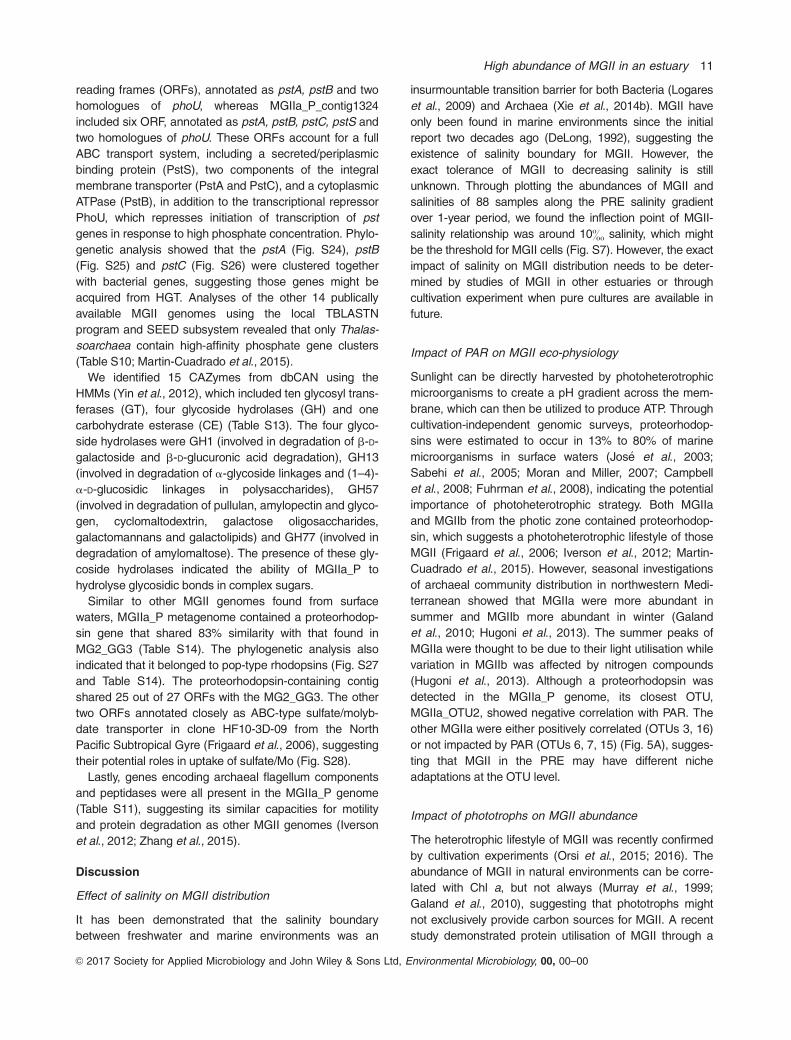
In those analysed genomes, only the MGIIa_P had a cata-
lase gene (Fig. 7 and Table S11), which may play a role in
scavenging reactive oxygen species (Long and Salin, 2001).
The four genes that were co-located with the MGIIa_P cata-
lase gene were the 50S ribosomal protein, thrombospondin,
ABC-type antimicrobial peptide transport protein and ABC-
type lipoprotein transport protein, which were closely related
to proteins in MG2_GG3 from Puget Sound (similarities are
77%, 44%, 58% and 33%, respectively, Table S12), support-
ing the MGII origin of the catalase–containing contig.
However, the catalase from MGIIa_P was phylogenetically
related to the catalase of Bacteria (Fig. 7 and Table S12),
suggesting the catalase of MGIIa_P might have been
acquired through HGT. The catalase acquirement of
MGIIa_P suggested that dealing with oxidative stress could
be important for MGII in PRE, which may be closely associ-
ated with abundant phototrophs that produce reactive
oxygen species. Except for the MGIIa_P catalase, other 13
catalases (Fig. 7 and Table S11) were also found in the
metagenome dataset from the surface water at the site D.
Two of them showed 91% (contig_13418) and 73% (con-
tig_26165) identities and were phylogenetically clustered
with MGIIa_P catalase. The contig_13418 contained a gene
close to catalase and annotated as hypothetical protein from
MG2_GG3 (MG2_0209) nearby catalase, suggesting it
might be from MGIIs in PRE. The other catalases were
assigned into Flavobacterium (4), SAR86 (3), Synechococ-
cus (1), Actinobacteria (2) and Roseobacter (1) respectively.
Two clusters containing genes predicted to encode com-
ponents of a prototypical bacterial high-affinity phosphate
transport system were found in the MGIIa_P metagenome
assembly (Fig. S23; MGIIa_P_contig1175 and MGIIa_P_
contig1324). MGIIa_P_contig1175 included four open
Fig. 7. Maximum-likelihood catalase amino-acid sequences tree showing the relationship of the MGIIa_P catalase with other catalase.
10 W. Xie et al.
VC 2017 Society for Applied Microbiology and John Wiley & Sons Ltd, Environmental Microbiology, 00, 00–00
reading frames (ORFs), annotated as pstA, pstB and two
homologues of phoU, whereas MGIIa_P_contig1324
included six ORF, annotated as pstA, pstB, pstC, pstS and
two homologues of phoU. These ORFs account for a full
ABC transport system, including a secreted/periplasmic
binding protein (PstS), two components of the integral
membrane transporter (PstA and PstC), and a cytoplasmic
ATPase (PstB), in addition to the transcriptional repressor
PhoU, which represses initiation of transcription of pst
genes in response to high phosphate concentration. Phylo-
genetic analysis showed that the pstA (Fig. S24), pstB
(Fig. S25) and pstC (Fig. S26) were clustered together
with bacterial genes, suggesting those genes might be
acquired from HGT. Analyses of the other 14 publically
available MGII genomes using the local TBLASTN
program and SEED subsystem revealed that only Thalas-
soarchaea contain high-affinity phosphate gene clusters
(Table S10; Martin-Cuadrado et al., 2015).
We identified 15 CAZymes from dbCAN using the
HMMs (Yin et al., 2012), which included ten glycosyl trans-
ferases (GT), four glycoside hydrolases (GH) and one
carbohydrate esterase (CE) (Table S13). The four glyco-
side hydrolases were GH1 (involved in degradation of b-D-
galactoside and b-D-glucuronic acid degradation), GH13
(involved in degradation of a-glycoside linkages and (1–4)-
a-D-glucosidic linkages in polysaccharides), GH57
(involved in degradation of pullulan, amylopectin and glyco-
gen, cyclomaltodextrin, galactose oligosaccharides,
galactomannans and galactolipids) and GH77 (involved in
degradation of amylomaltose). The presence of these gly-
coside hydrolases indicated the ability of MGIIa_P to
hydrolyse glycosidic bonds in complex sugars.
Similar to other MGII genomes found from surface
waters, MGIIa_P metagenome contained a proteorhodop-
sin gene that shared 83% similarity with that found in
MG2_GG3 (Table S14). The phylogenetic analysis also
indicated that it belonged to pop-type rhodopsins (Fig. S27
and Table S14). The proteorhodopsin-containing contig
shared 25 out of 27 ORFs with the MG2_GG3. The other
two ORFs annotated closely as ABC-type sulfate/molyb-
date transporter in clone HF10-3D-09 from the North
Pacific Subtropical Gyre (Frigaard et al., 2006), suggesting
their potential roles in uptake of sulfate/Mo (Fig. S28).
Lastly, genes encoding archaeal flagellum components
and peptidases were all present in the MGIIa_P genome
(Table S11), suggesting its similar capacities for motility
and protein degradation as other MGII genomes (Iverson
et al., 2012; Zhang et al., 2015).
Discussion
Effect of salinity on MGII distribution
It has been demonstrated that the salinity boundary
between freshwater and marine environments was an
insurmountable transition barrier for both Bacteria (Logares
et al., 2009) and Archaea (Xie et al., 2014b). MGII have
only been found in marine environments since the initial
report two decades ago (DeLong, 1992), suggesting the
existence of salinity boundary for MGII. However, the
exact tolerance of MGII to decreasing salinity is still
unknown. Through plotting the abundances of MGII and
salinities of 88 samples along the PRE salinity gradient
over 1-year period, we found the inflection point of MGII-
salinity relationship was around 10& salinity, which might
be the threshold for MGII cells (Fig. S7). However, the exact
impact of salinity on MGII distribution needs to be deter-
mined by studies of MGII in other estuaries or through
cultivation experiment when pure cultures are available in
future.
Impact of PAR on MGII eco-physiology
Sunlight can be directly harvested by photoheterotrophic
microorganisms to create a pH gradient across the mem-
brane, which can then be utilized to produce ATP. Through
cultivation-independent genomic surveys, proteorhodop-
sins were estimated to occur in 13% to 80% of marine
microorganisms in surface waters (Jos�e et al., 2003;
Sabehi et al., 2005; Moran and Miller, 2007; Campbell
et al., 2008; Fuhrman et al., 2008), indicating the potential
importance of photoheterotrophic strategy. Both MGIIa
and MGIIb from the photic zone contained proteorhodop-
sin, which suggests a photoheterotrophic lifestyle of those
MGII (Frigaard et al., 2006; Iverson et al., 2012; Martin-
Cuadrado et al., 2015). However, seasonal investigations
of archaeal community distribution in northwestern Medi-
terranean showed that MGIIa were more abundant in
summer and MGIIb more abundant in winter (Galand
et al., 2010; Hugoni et al., 2013). The summer peaks of
MGIIa were thought to be due to their light utilisation while
variation in MGIIb was affected by nitrogen compounds
(Hugoni et al., 2013). Although a proteorhodopsin was
detected in the MGIIa_P genome, its closest OTU,
MGIIa_OTU2, showed negative correlation with PAR. The
other MGIIa were either positively correlated (OTUs 3, 16)
or not impacted by PAR (OTUs 6, 7, 15) (Fig. 5A), sugges-
ting that MGII in the PRE may have different niche
adaptations at the OTU level.
Impact of phototrophs on MGII abundance
The heterotrophic lifestyle of MGII was recently confirmed
by cultivation experiments (Orsi et al., 2015; 2016). The
abundance of MGII in natural environments can be corre-
lated with Chl a, but not always (Murray et al., 1999;
Galand et al., 2010), suggesting that phototrophs might
not exclusively provide carbon sources for MGII. A recent
study demonstrated protein utilisation of MGII through a
High abundance of MGII in an estuary 11
VC 2017 Society for Applied Microbiology and John Wiley & Sons Ltd, Environmental Microbiology, 00, 00–00

high-throughput DNA-SIP method (Orsi et al., 2016), sug-
gesting extracellular protein or peptides might be important
for the growth of MGII.
Significant correlations between MGII and Chl a were
not observed in this study. Instead, abundances of photo-
troph 23S rRNA genes covering most eukaryotic algae
and Cyanobacteria were positively correlated with MGII
16S rRNA genes in 0.7 mm fractions from the PRE. The
increase in abundance of phototrophs from seawater to
brackish water, which resulted from the high nutrient input
from the upper river, might provide increasing protein sour-
ces (e.g. as cell exudates) and account for the high
abundances of partial-attached MGII in the brackish water.
However, free-living MGII were positively correlated with
salinity and temperature rather than with phototroph abun-
dance, suggesting salinity and temperature, rather than
the exudates from phototrophs, may be the dominating fac-
tor controlling the distributions of free-living MGII in PRE.
Although Orsi et al. (2015; 2016) reported that the free-
living MGII were affected by abundances of phototrophs in
the central California Current System, the relationship
between free-living MGII and phototrophs might be
decoupled by the dynamic salinity changes in the estuarine
systems. This hypothesis has yet to be tested by measure-
ments of proteins associated with particles and in
dissolved phases.
Correlations between MGII and other organisms
Network analysis has been used in delineating ecological
interactions between microbes in soils (Barberan et al.,
2012; Lupatini et al., 2014; de Menezes et al., 2015), lakes
(Eiler et al., 2012; Peura et al., 2015), human microbiomes
(Faust et al., 2012; Zhang et al., 2014) and marine environ-
ments (Chow et al., 2013; Fuhrman et al., 2015). Through
network analysis, MGII have been found to be correlated
with Dinophyta, Chlorophyta, Bacillariophyta, Phaeocystis,
Chaetoceros and Heterosigma at different time scales in
the ocean, suggesting complex inter-domain interactions
between phototrophs and MGII (Lima-Mendez et al., 2015;
Needham and Fuhrman, 2016). This study showed that
the high abundance of select MGII species in the PRE
might be stimulated by blooms of phototrophs triggered by
high nutrient input from upper river. Through network anal-
ysis, the relative abundance of a MGIIa (archaeal OTU8)
was positively correlated with four freshwater Cyanobacte-
ria (Fig. 6), suggesting this archaeal OTU8 might depend
on exudates from freshwater Cyanobacteria or they simi-
larly responded to salinity changes in the PRE. The
archaeal OTU2 was positively correlated with three Bacil-
lariophyta, one Chlorophyta and one Dinophyceae, similar
to correlations previously reported in the open ocean
(Lima-Mendez et al., 2015), suggesting the dependence of
some MGII on those phototrophs in both open ocean and
estuarine environments. On the other hand, a MGIIb
(archaeal OTU7) was negatively correlated with four fresh-
water Cyanobacteria (Fig. 6), suggesting they either had
competition or amenalism relationship.
Previous studies suggested that the Bathyarchaeota lin-
eage might be involved in degradation of organic matter
(Webster et al., 2010; Meng et al., 2014; Seyler et al.,
2014). Although Bathyarchaeota were mostly found in the
sediment environment, some planktonic Bathyarchaeota
also were reported recently in freshwater and brackish
water columns (Fillol et al., 2015; Hu et al., 2016). Here, a
high proportion of Bathyarchaeota was found in the 0.7 lm
fraction from brackish water of the PRE. MGIIa_OTU2,
which is the most abundant MGII in the whole water col-
umn, was negatively correlated with those Bathyarchaeota
(Figs 6 and S18a, the correlation was still significant when
controlling the detected parameters), suggesting they may
either compete for organic carbon sources or other limited
nutrients, or show opposite responses to some factors that
had not been detected in the water column in PRE.
The genomic advantages of the MGII
Limited metagenomic studies have indicated that HGT
from distant donors might have been important for the eco-
logical success of planktonic archaea in the ocean (L�opez-
Garcı́a et al., 2004; Brochier-Armanet et al., 2011;
Deschamps et al., 2014). Among genes that have been
horizontally transferred, metabolism-related genes are the
most often acquired by marine planktonic archaea
(Deschamps et al., 2014). One study showed that marine
Thaumarchaeota had multiple copies of horizontally trans-
ferred superoxide dismutase and peroxiredoxins in their
genomes, suggesting that marine Thaumarchaeota might
have evolved to cope with high superoxide in the estuarine
environments (Hollibaugh et al., 2011). Single-cell genome
analyses of some epipelagic Thaumarchaeota ecotypes
also revealed horizontally transferred catalases (Luo et al.,
2014). Although MGII were reported to be highly diverse in
estuarine systems (Crump and Baross, 2000; Vieira et al.,
2007; Galand et al., 2008; Hao et al., 2010), the adapta-
tions of those MGII in estuaries remained largely unknown
because of the lack of genomes. In this study, a MGIIa
genome named MGIIa_P, which represent the most abun-
dant MGII in PRE, was retrieved from the metagenomics.
In comparison with other published MGII genomes,
MGIIa_P contained a unique catalase gene, which was
acquired by HGT from bacteria and might involve in scav-
enging reactive oxygen species. The highly abundant
phototrophs co-occurring with MGII in the PRE likely pro-
vide substrates for heterotrophic growth, but also generate
reactive oxygen species (Oda et al., 1997; Kustka et al.,
2005; Marshall et al., 2005; Rose et al., 2008). The exis-
tence of catalase in MGIIa_P may thus be important for its
12 W. Xie et al.
VC 2017 Society for Applied Microbiology and John Wiley & Sons Ltd, Environmental Microbiology, 00, 00–00

high abundance in PRE brackish water. On the other
hand, Morris et al. (2011) reported that those catalase-
containing heterotrophs were involved in scavenging the
ROS to protect the co-cultured Prochlorococcus. MGIIa_P,
together with other catalase-containing heterotrophs, might
also contribute to ROS scavenging for their attached pho-
totrophs in PRE.
Glycoside hydrolases are the best-characterized
enzymes active on disaccharides, oligosaccharides, poly-
saccharides and chitins. Li et al. (2015) reported that the
MGII from deep sea contained diverse and transcriptionally
active enzymes of a-mannosidase (GH38), amylopullula-
nase (GH57), 4-a-glucanotransferase (GH77) and
chitinases (GH18/CBM5 and GH20/CBM5) in the MGII
transcriptome. Except for the GH57 and GH77, MGIIa_P
also contained a GH1 (b-glucosidase) and a GH13 (a-
amylase) but no chitinases, suggesting the differentiation
of carbohydrate use between MGIIa_P and those deep-
sea MGIIs. There was only one GH1 found in MG2_GG3,
and no Glycoside hydrolase was found in Thalassoarch-
aea, suggesting that the carbohydrate utilisation strategies
of those MGII from surface sea were biogeographically
different.
The Pst system is a high-affinity inorganic phosphate
transporter and has been shown to participate in phos-
phate uptake, cell growth and expression of virulence-
associated traits based on physiological experiments in
some bacteria (Luz et al., 2012). Two pst gene clusters
were found in the genome of MGIIa_P. This pst operon in
MGIIa_P was syntenic to those from marine Thaumarch-
aeota (Walker et al., 2010) and Thalassoarchaea (Martin-
Cuadrado et al., 2015). Although the concentrations of
phosphate in the PRE regularly varied between 0.2 to 1.2
lM (Harrison et al., 2008), which was higher than in most
oligotrophic seas (below 0.1 lM), it was reported to be as
low as 0.03 lM (Zhang et al., 2013), which might be due to
the invasion of P-limited seawater from northeast SCS
(around 0.03 lM; Ma et al., 2017). The presence of pst
genes in MGIIa_P might reflect its adaptation to the
dynamic phosphate concentrations in PRE.
Conclusion
Through the analyses of seasonal changes of abundances
and proportions of MGII along the PRE, we revealed that
the PRE brackish water contained the highest concentra-
tions of particle-attached MGII that have ever been
reported, which might be due to the abundant phototrophs
stimulated by extensive nutrient input from upper river. The
high abundance of phototrophs might not only bring fresh
substrates for MGII, but also generate reactive oxygen
species to inhibit the growth of other heterotroph organ-
isms. In this setting, the unique catalase gene in the
estuarine MGIIa_P genome may be responsible for
scavenging reactive oxygen species and thus important for
their abundances in PRE. Except for the catalase gene,
the overrepresentation of pst operons in MGIIa_P might
also be important for the adaptation of particle-attached
MGII to the dynamic phosphate concentrations in PRE.
MGIIa_P also contained high proportions of glycoside
hydrolases, indicating the ability of MGIIa_P to hydrolyse
glycosidic bonds in complex sugars in PRE. The distribu-
tions of particle-attached MGII were also significantly
impacted by abiotic factors, such as salinity, temperature
and PAR. The correlations between MGII and some photo-
trophs provided some clues about their interactions and
might shed light on inter-domain (e.g. phototrophs-
archaea) interactions in the natural environment.
Experimental procedures
Time-serial sampling and environmental measurements
The Pearl River is the second largest river in China, stretching
for 2214 km and draining an area of 452 000 km2 (Zhao,
1990). The Pearl River discharges �3.26 3 1011 m3 of fresh-
water and �7 3 107 tons of sediment annually to the South
China Sea (SCS) (Zhao, 1990; Tian, 1994; Zhang et al.,
1999). The PRE receives a high load of anthropogenic
nutrients from increasing activities in agriculture (Neller and
Lam, 1994), sewage effluent (Hills et al., 1998) and fish dike
farming (Ruddle and Zhong, 1988) due to the population
increase and economic development in the expanded Pearl
River delta region (Enright et al., 2010), yielding a 100N:1P
ratio (Harrison et al., 2008; Gan et al., 2014) that is about
seven times higher than the Redfield ratio of 16N:1P (Red-
field, 1958).
Surface, middle and bottom water samples were collected
monthly in a 10-month period (12 July 2012 to 11 May 2013)
from freshwater site A (salinity: 0.9& 6 1.1&; total depth:
10 m; sampling depths: 1 m and 10 m), low-salinity site B
(salinity: 14.0& 6 6.1&; total depth: 16 m; sampling depths:
1, 8 and 16 m), high-salinity site C (salinity: 21.1& 6 6.1&;
total depth: 17 m; the sampling depths: 1, 9 and 17 m) and
seawater site D (salinity: 29.7& 6 3.7&;total depth: 17 m;
sampling depths: 1 and 17 m) (Fig. S1). Water samples were
collected using a submersible pump and filtered sequentially
onto 0.7 lm pore size (142 mm diameter) and 0.22 lm pore
size (142 mm diameter) cellulose filters (Shanghai Mosutech,
Shanghai, China). The volumes of those 200 filters ranged
from 7 to 102 l for the 0.7 lm filters and 28 to 382 l for 0.22
lm filters, which were listed in Table S1. In addition, a surface
water sample (36 l) was filtered onto a 0.7 lm pore size cellu-
lose filter on 3 January 2012 for metagenomic analyses. A
total of one hundred 0.7 lm filters and one hundred 0.2 lm fil-
ters were collected.
The pH, temperature and salinity were determined in situ by
a Horiba instrument (W-20XD, Kyoto, Japan) (Table S1). The
monthly PAR data for the surface water in the PRE were
downloaded from the NASA’s OceanColor Web (http://ocean-
color.gsfc.nasa.gov/cms/). The PAR in the middle and bottom
water was estimated through multiplying the surface PAR with
light decay rate in the water column of the PRE (Huang et al.,
High abundance of MGII in an estuary 13
VC 2017 Society for Applied Microbiology and John Wiley & Sons Ltd, Environmental Microbiology, 00, 00–00

2003; Yin et al., 2004). The monthly freshwater runoff data
were retrieved from China’s river sediment communique (Min-
istry of Water Resources, 2012; 2013). Water samples for
chemical analysis were fixed by using saturated HgCl2 (final
concentration: 0.27 mM). NH14 , NO2
2 , SiO223 and NO2
3 were
determined using a Technicon II Auto-Analyzer (AAII, Bran
Luebbe) (Table S1).
DNA extraction and qPCR
A quarter of a filter was used for DNA extraction using the
FastDNA SPIN Kit for Soil (MP Biomedical, OH, USA). The
DNA extracts were preserved at 2808C until further analysis.
Quantitative PCR was performed using primers Arch_334F (50
ACGGGGCGCAGCAGGCGCGA 30 and Arch_518R (50
TACCGCGGCTGCT GG 30) for total Archaea (Bano et al.,
2004) and GII-554F (50 GTCGMTTTTATTG GGCCTAA 30)
and Eury806R (50 CACAGCGTTTACACCTAG 30) for MGII
(Galand et al., 2010). Each reaction mixture contained 5 ll 23
SYBR Green PCR Master Mix (Takara, Ostu, Japan), 0.25
lmol l21 each primer and 1 ll template DNA. The primers for
phototrophs were p23SrV_f1 (50 ACAGAAAGACCCTATGAA
30)/p23SrV_r1 (50 AGCCTGTTATCCCTAGAG 30), which tar-
geted the plastid 23S rRNA gene from algae as well as
Cyanobacteria (Sherwood and Presting, 2007; Hou et al.,
2014). The qPCR analyses of all the three genes were per-
formed at 958C for 30 s and 40 cycles at 948C for 30 s, 558C
for 30 s and 688C for 1 min. Triplicate measurements were run
for each sample and standard. Only data with standard devia-
tions lower than 0.37-fold of mean values were kept for further
analysis (Olvera et al., 2004), which excluded data for the
MGII 16S rRNA abundances of two 0.7 lm filter samples and
one 0.22 lm filter sample respectively. Quantification stand-
ards for the three genes comprised a dilution series of purified
plasmids containing target genes that were amplified from a
0.7 lm filter sample collected in January 2012 at site D (Fig.
S1). The linear correlation coefficient (R2) for the three genes
all ranged from 0.99 to 1.00. Melting curve analysis was per-
formed to demonstrate that the fluorescence signal obtained
in a given reaction was consistent with the expected profile for
specific PCR products based on comparison to standards.
Amplicon sequencing
MiSeq sequencing targeting the archaeal 16S rRNA gene was
performed on those filters (both 0.7 lm and 0.2 lm pore
sizes); the phototroph 23S rRNA gene was sequenced from
the filters (0.7 lm pore size only from Sites C and D). The pri-
mers were Arch_787F (50 ATTAGATACCCSBGTAGTCC 30)and Arch_1059R (50 GCCATGCACCWCCTCT 30) for Archaea
(Yu et al., 2005) and p23SrV_f1 (50 ACAGAAAGACCC
TATGAA30) and p23SrV_r1 (50 AGCCTGTTATCCCTAGAG 30)
for phototrophs, including both algae and Cyanobacteria
(Sherwood and Presting, 2007). Each reaction was conducted
in triplicate with barcoded forward primer per the following pro-
gram: 958C for 3 min, 35 cycles at 958C for 45 s, 558C for 45 s
and 728C for 90 s, and a final extension at 728C for 10 min and
48C until next step. The triplicate amplicons from each sample
were pooled and purified using the MinElute Gel Extraction Kit
(Qiagen, Valencia, CA, USA). Each set of amplicons (the
same gene) from 100 samples was pooled by adding 300 ngof DNA from each pool of PCR products. Pooled amplicons
were then cleaned using the QIAquick PCR purification kit(Qiagen, Valencia CA, USA) and sequenced on the MiSeqplatform (2 3 250 PE, Illumina) at the Shanghai Personalbio
Biotechnology (Shanghai, China).
Raw MiSeq data were processed using Mothur (version1.29.2) following the standard operating procedure (Schlosset al., 2009; 2011) and then analysed using the QIIME standard
pipeline (Caporaso et al., 2010). Specially, sequence readswere first filtered by removing reads shorter than 50 bp andreads containing ambiguous bases (N) and then checked with
ChimeraSlayer (Haas et al., 2011). The chimeric sequenceswere excluded from further analysis. The remaining 16S rRNAgene sequences were then clustered into OTUs using UCLUST
(Edgar, 2010) with 97% sequence identity threshold. Taxonomywas assigned using the Ribosomal Database Project (RDP)classifier 2.2 (minimum confidence of 80%) (Cole et al., 2009).
Then, all the archaeal taxonomies at the rank of order werechosen to recalculate the proportion and clustered by theEuclidean method using the R 2.12.1 software package (free-
ware available at http://cran.r-project.org/) (Maindonald, 2007).Alpha diversity, represented by the number of observed OTUs,was calculated with all datasets subsampled at a uniform depth
of 6030 sequences for the archaeal 16S rRNA gene and33 968 for the phototroph 23S rRNA gene (Table S1).
Metagenomic analyses
DNA of surface water collected on a 0.7 lm pore size filter atSite D on 3 January 2012 (not in the 10-month sampling
period) was extracted using the FastDNA spin kit for soil (MPBiomedicals) according to the manufacturer’s instructions. Atotal of 3 lg DNA from this sample was sheared to 200–300bp using the Covaris E210 (Covaris, USA). The fragmented
DNA was purified using QIAquick columns according to themanufacturer’s instructions. The sheared DNA was end-repaired, A-tailed and ligated to Illumina adaptors to form a
paired-end library according to the Illumina standard protocol.Illumina paired-end library was used for Illumina HiSeq 2000sequencing. After removing reads shorter than 50 bp, adapter
sequences and reads containing ambiguous bases (N), a totalof 6 Gp high-quality data were generated. Whole genome denovo assemblies were performed using Newbler (minimum
overlap length 5 40 bp, minimum overlap identity 5 95%) (deOliveira et al., 2012).
Bins of assembled metagenomic sequences were devel-
oped in Metawatt (Strous et al., 2012), where binning is basedon tetranucleotide frequency and taxonomy is tentativelyassigned by BLASTn of contig fragments to a user-defineddatabase (in this case a set of bacterial and archaeal
genomes were downloaded from ftp.ncbi.nlm.nih.gov/genomems/bacteria). The bin apparently corresponding toMGII was further manually filtered so as to contain only con-
tigs greater than 2 kb with a sequence coverage (read depth)greater than 20 (Fig. S18). Emergent self-organising mapping(ESOM) based on tetranucleotide frequencies (Aziz et al.,
2008; Albertsen et al., 2013) identified a single MGIIa genome(the named MGIIa_P) bin to be distinct in this metagenome(Fig. S19). The contamination control followed Dodsworth
et al. (2013) and Nobu et al. (2016) by setting a high bar of
14 W. Xie et al.
VC 2017 Society for Applied Microbiology and John Wiley & Sons Ltd, Environmental Microbiology, 00, 00–00

coverage (> 203 coverage) in the bin. The Check M (Parks
et al., 2015) and Amphora2 (Wu and Scott, 2012) were then
used to evaluate any possible contamination of MGIIa_P.
This MGIIa_P genome together with other selected
genomes were uploaded to Rapid Annotation using Subsys-
tem Technology platform to conduct the analysis (Glass and
Meyer, 2011). Those genomes included MG2_GG3 from sur-
face waters of Puget Sound (Iverson et al., 2012),
Thalassoarchaea from the Mediterranean deep chlorophyll
maximum (Martin-Cuadrado et al., 2015), 14 metagenome
assembled genomes from deep-sea waters (Li et al., 2015),
Thaumarchaeota isolates or enrichments (K€onneke et al.,
2005; Hallam et al., 2006; Blainey et al., 2011; Kim et al.,
2011; Tourna et al., 2011; Park et al., 2012; Santoro et al.,
2015) and Aciduliprofundum boonei T469 (Reysenbach and
Flores, 2008). The gene distributions in those genomes in dif-
ferent SEED subsystems were generated. We calculated an
odds ratio using (A/B)/(C/D) where A is the number of hits to a
given gene in the MGIIa_P genome, B is the number of hits to
all other genes in this genome, C is the number of hits to a
given gene in the comparison data set (all the selected
genomes as a whole date set here) and D is the number of
hits to all other genes in the comparison data set (Gill et al.,
2006; Xie et al., 2011). The odds ratio can be thought of as
the likelihood of observing a given gene in the sample relative
to the comparison data set. The SEED functional categories
with odds ratio of > 3 for MGIIa_P were chosen and listed in
Table S11.
The predicted proteins from MGIIa_P were screened
against the HMM profile-based database of carbohydrate-
active enzymes (Yin et al., 2012). Results were filtered using
HMMER E-value<1e-18 if length>80aa, E-value< 1e-16
otherwise, and coverage > 35% of protein length, as recom-
mended by dbCAN. The GenBank Sequence Read Project
accession number for the source sequences is SUB3118606.
Statistical analysis
Clustering of samples by archaeal community composition
was performed using the base program in R 2.12.1. The rela-
tive abundance of archaeal phylotypes based on 16S rRNA
gene sequences was imported into R and the distance matrix
was computed with the squared Euclidean distance using the
two-way joining method (Xie et al., 2014a). A hierarchical clus-
tering tree was generated by the Heatmap command in R
(Maindonald, 2007). Pearson correlations between the abun-
dances of archaeal 16S rRNA gene, MGII 16S rRNA gene,
phototroph 23S rRNA gene and environmental parameters
were performed using SPSS software. Partial-correlation anal-
yses of MGII with abiotic and biotic factors were also
performed with SPSS software. The comparisons of environ-
mental parameters, diversity index and qPCR results along
PRE were conducted using the GraphPadVR Instat 3.05 soft-
ware (GraphPad Software, San Diego, CA, USA) and non-
parametric T-test was used to identify the level of significance.
Redundancy analysis (RDA) was conducted by the Canoco
software (version 4.5; Microcomputer Power; Ter and Smila-
uer, 2002).
Correlation inference for Compositional data through Lasso
(CCLasso) was used to infer the correlation network for latent
variables of taxonomic data (Fang et al., 2015). Before the
network construction, ALDex2 package was used to identify
archaeal OTUs or phototroph OTUs having significant
changes over the sampling period. To reduce noise and thus
false-positive predictions, we restricted our analysis to OTUs
that were higher than 0.5% and present in at least 20% of the
samples (Needham et al., 2013; Needham and Fuhrman,
2016). CCLasso correlations having P< 0.001 and coeffi-
cients higher than 0.5 were visualized in Cytoscape 3.2.1
(Shannon et al., 2003).
Acknowledgements
We thank Wang J., and Captain R. Huang for helping with the
sampling for this study, the State Key Laboratory of Marine
Environmental Science at Xiamen University for helping with
the nutrient analyses, X Zhang and J Sun for helping with the
Chl a analysis, and F. Rodriguez-Valera, T. Phelps, D. He and
S. Hou for constructive comments during the preparation of
the manuscript. This research was supported by the State Key
R&D project of China grant No. 2016YFA0601101 (CZ), the
National Science Foundation of China grants No. 41530105
(CZ) and No. 91428308 (CZ), the National Key Basic
Research Program of China grant No. 2013CB955700 (CZ)
and the National Science Foundation for Young Scholars of
China grant No. 41306123 (WX) and the Tongji Interdisciplin-
ary Program grant No. 1350219165 (CZ). This study is also a
contribution to the international IMBER project.
Author contributions
Chuanlun Zhang, Wei Xie and Brian P. Hedlund designed
research; Wei Xie, Senthil K. Murugapiran, Jeremy A.
Dodsworth, Ying Sun, Songze Chen, Peng Wang, Huaying
Fang and Minghua Deng performed research; Wei Xie,
Senthil K. Murugapiran, Haiwei Luo, Ying Sun, Jeremy A.
Dodsworth and Huaying Fang analysed data; Wei Xie,
Chuanlun Zhang, Brian P. Hedlund and Jeremy A. Dods-
worth wrote the paper.
References
Albertsen, M., Hugenholtz, P., Skarshewski, A., Nielsen, K.L.,
Tyson, G.W., and Nielsen, P.H. (2013) Genome sequences
of rare, uncultured bacteria obtained by differential cover-
age binning of multiple metagenomes. Nat Biotechnol 31:
533–538.Alla, A.A., Mouneyrac, C., Durou, C., Moukrim, A., and
Pellerin, J. (2006) Tolerance and biomarkers as useful tools
for assessing environmental quality in the Oued Souss
estuary (Bay of Agadir, Morocco). Comp Biochem Physiol
C Toxicol Pharmacol 143: 23–29.Aziz, R.K., Bartels, D., Best, A.A., DeJongh, M., Disz, T., and
Edwards, R.A. (2008) The RAST Server: rapid annotations
using subsystems technology. BMC Genomics 9: 75.Bano, N., Ruffin, S., Ransom, B., and Hollibaugh, J.T. (2004)
Phylogenetic composition of Arctic Ocean archaeal
assemblages and comparison with Antarctic assemblages.
Appl Environ Microbiol 70: 781–789.
High abundance of MGII in an estuary 15
VC 2017 Society for Applied Microbiology and John Wiley & Sons Ltd, Environmental Microbiology, 00, 00–00

Barberan, A., Bates, S.T., Casamayor, E.O., and Fierer, N.
(2012) Using network analysis to explore co-occurrence
patterns in soil microbial communities. ISME J 6: 343–351.Blainey, P.C., Mosier, A.C., Potanina, A., Francis, C.A., and
Quake, S.R. (2011) Genome of a low-salinity ammonia-oxi-
dizing archaeon determined by single-cell and metage-
nomic analysis. PLoS One 6: e16626.Brochier-Armanet, C., Deschamps, P., L�opez-Garcı́a, P.,
Zivanovic, Y., Rodrı́guez-Valera, F., and Moreira, D. (2011)
Complete-fosmid and fosmid-end sequences reveal fre-
quent horizontal gene transfers in marine uncultured plank-
tonic archaea. ISME J 5: 1291–1302.
Campbell, B.J., Waidner, L.A., Cottrell, M.T., and Kirchman,
D.L. (2008) Abundant proteorhodopsin genes in the North
Atlantic Ocean. Environ Microbiol 10: 99–109.
Caporaso, J.G., Kuczynski, J., Stombaugh, J., Bittinger, K.,
Bushman, F.D., and Costello, E.K. (2010) QIIME allows
analysis of high-throughput community sequencing data.
Nat Methods 7: 335–336.
Chow, C.-E.T., Sachdeva, R., Cram, J.A., Steele, J.A.,
Needham, D.M., Patel, A., et al. (2013) Temporal variability
and coherence of euphotic zone bacterial communities
over a decade in the Southern California Bight. ISME J 7:
2259–2273.Cole, J.R., Wang, Q., Cardenas, E., Fish, J., Chai, B., Farris,
R.J., et al. (2009) The Ribosomal Database Project:
improved alignments and new tools for rRNA analysis.
Nucleic Acids Res 37: D141–D145.Crump, B.C., and Baross, J.A. (2000) Archaeaplankton in the
Columbia River, its estuary and the adjacent coastal ocean,
USA. FEMS Microbiol Ecol 31: 231–239.DeLong, E.F. (1992) Archaea in coastal marine environments.
Proc Natl Acad Sci U S A 89: 5685–5689.DeLong, E.F., Franks, D.G., and Alldredge, A.L. (1993)
Phylogenetic diversity of aggregate-attached vs. free-living
marine bacterial assemblages. Limnol Oceanogr 38:
924–934.Deschamps, P., Zivanovic, Y., Moreira, D., Rodriguez-Valera,
F., and L�opez, G.P. (2014) Pangenome evidence for exten-
sive interdomain horizontal transfer affecting lineage core
and shell genes in uncultured planktonic Thaumarchaeota
and Euryarchaeota. Genome Biol Evol 6: 1549–1563.Dodsworth, J.A., Blainey, P.C., Murugapiran, S.K., Swingley,
W.D., Ross, C.A., Tringe, S.G., et al. (2013) Single-cell and
metagenomic analyses indicate a fermentative and saccha-
rolytic lifestyle for members of the OP9 lineage. Nat Com-
mun 4: 1854.Edgar, R.C. (2010) Search and clustering orders of magnitude
faster than BLAST. Bioinformatics 26: 2460–2461.Eiler, A., Heinrich, F., and Bertilsson, S. (2012) Coherent
dynamics and association networks among lake bacterio-
plankton taxa. ISME J 6: 330–342.Enright, M.J., Scott, E.E., Petty, R., and Enright, S. (2010).
The Greater Pearl River Delta: A report commissioned by
Invest Hong Kong, Invest Hong Kong of the HKSAR
Government.Fang, H., Huang, C., Zhao, H., and Deng, M. (2015)
CCLasso: correlation inference for compositional data
through Lasso. Bioinformatics 31: 3172–3180.Faust, K., Sathirapongsasuti, J.F., Izard, J., Segata, N.,
Gevers, D., Raes, J., et al. (2012) Microbial co-occurrence
relationships in the human microbiome. PLoS Comput Biol
8: e1002606.Fillol, M., S�anchez-Melsi�o, A., Gich, F., and Borrego, C.M.
(2015) Diversity of Miscellaneous Crenarchaeotic Group
archaea in freshwater karstic lakes and their segregation
between planktonic and sediment habitats. FEMS Microbiol
Ecol 91: fiv020.
Frigaard, N.U., Martinez, A., Mincer, T.J., and DeLong, E.F.
(2006) Proteorhodopsin lateral gene transfer between
marine planktonic bacteria and archaea. Nature 439: 847–
850.Fuhrman, J., and Davis, A. (1997) Widespread archaea and
novel bacteria from the deep sea as shown by 16S rRNA
gene sequences. Mar Ecol Prog Ser 150: 275–285.Fuhrman, J.A., McCallum, K., and Davis, A.A. (1992) Novel
major archaebacterial group from marine plankton. Nature
356: 148–149.Fuhrman, J.A., Schwalbach, M.S., and Stingl, U. (2008) Pro-
teorhodopsins: an array of physiological roles?. Nat Rev
Microbiol 6: 488–494.Fuhrman, J.A., Cram, J.A., and Needham, D.M. (2015)
Marine microbial community dynamics and their ecological
interpretation. Nat Rev Microbiol 13: 133–146.Galand, P.E., Lovejoy, C., Pouliot, J., and Vincent, W.F. (2008)
Heterogeneous archaeal communities in the particle-rich
environment of an arctic shelf ecosystem. J Mar Syst 74:
774–782.
Galand, P.E., Casamayor, E.O., Kirchman, D.L., Potvin, M.,
and Lovejoy, C. (2009) Unique archaeal assemblages in the
Arctic Ocean unveiled by massively parallel tag sequencing.
ISME J 3: 860–869.Galand, P.E., Guti�errez-Provecho, C., Massana, R., Gasol,
J.M., and Casamayor, E.O. (2010) Inter-annual recurrence
of archaeal assemblages in the coastal NW Mediterranean
Sea (Blanes Bay Microbial Observatory). Limnol Oceanogr
55: 2117–2125.Gan, J., Lu, Z., Cheung, A., Dai, M., Liang, L., Harrison, P.J.,
et al. (2014) Assessing ecosystem response to phosphorus
and nitrogen limitation in the Pearl River plume using the
Regional Ocean Modeling System (ROMS). J Geophys
Res Oceans 119: 8858–8877.Gill, S.R., Pop, M., Deboy, R.T., Eckburg, P.B., Turnbaugh,
P.J., Samuel, B.S., et al. (2006) Metagenomic analysis of
the human distal gut microbiome. Science 312: 1355–1359.Giovannoni, S.J., Britschgi, T.B., Moyer, C.L., and Field, K.G.
(1990) Genetic diversity in Sargasso Sea bacterioplankton.
Nature 345: 60.Glass, E.M., and Meyer, F. (2011) The metagenomics RAST
server: a public resource for the automatic phylogenetic
and functional analysis of metagenomes. In Handbook of
Molecular Microbial Ecology I: Metagenomics and Comple-
mentary Approaches. de Bruijn F.J. (ed.). Hoboken, NJ:
Wiley-Blackwell, pp. 325–331.
Haas, B.J., Gevers, D., Earl, A.M., Feldgarden, M., Ward, D.V.,
Giannoukos, G., et al. (2011) Chimeric 16S rRNA sequence
formation and detection in Sanger and 454-pyrosequenced
PCR amplicons. Genome Res 21: 494–504.Hallam, S.J., Konstantinidis, K.T., Putnam, N., Schleper, C.,
Watanabe, Y., Sugahara, J., et al. (2006) Genomic analysis
of the uncultivated marine crenarchaeote Cenarchaeum
symbiosum. Proc Natl Acad Sci U S A 103: 18296–18301.
16 W. Xie et al.
VC 2017 Society for Applied Microbiology and John Wiley & Sons Ltd, Environmental Microbiology, 00, 00–00

Hao, D.M., Tashiro, T., Kato, M., Sohrin, R., Ishibashi, T.,
Katsuyama, C., et al. (2010) Population dynamics of Cren-
archaeota and Euryarchaeota in the mixing front of river
and marine waters. Microb Environ 25: 126–132.Haro-Moreno, J.M., Rodriguez-Valera, F., L�opez-Garcı́a, P.,
Moreira, D., and Martin-Cuadrado, A.B. (2017) New insights
into marine group III Euryarchaeota, from dark to light.
ISME J 11: 1102–1117.Harrison, P.J., Yin, K., Lee, J.H.W., Gan, J., and Liu, H. (2008)
Physical–biological coupling in the Pearl River Estuary.
Cont Shelf Res 28: 1405–1415.Herndl, G.J., Reinthaler, T., Teira, E., van Aken, H., Veth, C.,
Pernthaler, A., et al. (2005) Contribution of Archaea to total
prokaryotic production in the deep Atlantic Ocean. Appl
Environ Microbiol 71: 2303–2309.Hills, P., Zhang, L., and Liu, J. (1998) Transboundary pollution
between Guangdong Province and Hong Kong: threats to
water quality in the Pearl River Estuary and their implica-
tions for environmental policy and planning. J Environ Plan
Manage 41: 375–396.
Hollibaugh, J.T., Gifford, S., Sharma, S., Bano, N., and
Moran, M.A. (2011) Metatranscriptomic analysis of
ammonia-oxidizing organisms in an estuarine bacterio-
plankton assemblage. ISME J 5: 866–878.Hou, W., Dong, H., Li, G., Yang, J., Coolen, M.J., Liu, X., et al.
(2014) Identification of photosynthetic plankton communi-
ties using sedimentary ancient DNA and their response to
late-Holocene climate change on the Tibetan Plateau. Sci
Rep 4: 6648. doi:10.1038/srep06648.
Hu, A., Wang, H., Li, J., Liu, J., Chen, N., and Yu, C.-P. (2016)
Archaeal community in a human-disturbed watershed in
southeast China: diversity, distribution, and responses
to environmental changes. Appl Environ Microbiol 100:
4685–4698.Huang, X.P., Huang, L.M., and Yue, W.Z. (2003) The charac-
teristics of nutrients and eutrophication in the Pearl River
estuary, South China. Mar Pollut Bull 47: 30–36.
Hugoni, M., Taib, N., Debroas, D., Domaizon, I., Dufournel, I.J.,
Bronner, G., et al. (2013) Structure of the rare archaeal bio-
sphere and seasonal dynamics of active ecotypes in surface
coastal waters. Proc Natl Acad Sci U S A 110: 6004–6009.Iverson, V., Morris, R.M., Frazar, C.D., Berthiaume, C.T.,
Morales, R.L., and Armbrust, E.V. (2012) Untangling
genomes from metagenomes: revealing an uncultured class
of marine Euryarchaeota. Science 335: 587–590.Jos�e, R., Christianson, L.M., B�eja, O., Suzuki, M.T., Karl,
D.M., Heidelberg, J., et al. (2003) Proteorhodopsin genes
are distributed among divergent marine bacterial taxa. Pro-
ceedings of the National Academy of Sciences 100:
12830–12835.Karner, M.B., DeLong, E.F., and Karl, D.M. (2001) Archaeal
dominance in the mesopelagic zone of the Pacific Ocean.
Nature 409: 507–510.Kim, B.K., Jung, M.Y., Yu, D.S., Park, S.J., Oh, T.K., Rhee,
S.K., et al. (2011) Genome sequence of an ammonia-
oxidizing soil archaeon, “Candidatus Nitrosoarchaeum kore-
ensis” MY1. J Bacteriol 193: 5539–5540.K€onneke, M., Bernhard, A.E., de la Torre, J.R., Walker, C.B.,
Waterbury, J.B., and Stahl, D.A. (2005) Isolation of an auto-
trophic ammonia-oxidizing marine archaeon. Nature 437:
543–546.
Kustka, A.B., Shaked, Y., Milligan, A.J., King, D.W., and
Morel, F.M. (2005) Extracellular production of superoxide by
marine diatoms: contrasting effects on iron redox chemistry
and bioavailability. Limnol Oceanogr 50: 1172–1180.Li, M., Baker, B.J., Anantharaman, K., Jain, S., Breier, J.A.,
and Dick, G.J. (2015) Genomic and transcriptomic evidence
for scavenging of diverse organic compounds by wide-
spread deep-sea archaea. Nat Commun 6: 8933. doi:
10.1038/ncomms9933.Lima-Mendez, G., Faust, K., Henry, N., Decelle, J., Colin, S.,
Carcillo, F., et al. (2015) Determinants of community struc-
ture in the global plankton interactome. Science 348:
1262073. doi:10.1126/science.1262073.Liu, H., Zhang, C.L., Yang, C., Chen, S., Cao, Z., Zhang, Z.,
et al. (2017) Marine group II dominates planktonic archaea
in water column of the Northeastern South China Sea.
Front Microbiol 8: 1098.Logares, R., Brate, J., Bertilsson, S., Clasen, J.L., Shalchian-
Tabrizi, K., and Rengefors, K. (2009) Infrequent marine-
freshwater transitions in the microbial world. Trends Micro-
biol 17: 414–422.Long, S., and Salin, M.L. (2001) Molecular cloning, sequenc-
ing analysis and expression of the catalase-peroxidase
gene from Halobacterium salinarum. DNA Seq 12: 39–51.L�opez-Garcı́a, P., Moreira, D., L�opez-L�opez, A., and
Rodrı́guez-Valera, F. (2001) A novel haloarchaeal-related
lineage is widely distributed in deep oceanic regions. Envi-
ron Microbiol 3: 72–78.L�opez-Garcı́a, P., Brochier, C., Moreira, D., and Rodrı́guez-
Valera, F. (2004) Comparative analysis of a genome frag-
ment of an uncultivated mesopelagic crenarchaeote reveals
multiple horizontal gene transfers. Environ Microbiol 6:
19–34.Luo, H., Tolar, B.B., Swan, B.K., Zhang, C.L., Stepanauskas,
R., Ann Moran, M., and Hollibaugh, J.T. (2014) Single-cell
genomics shedding light on marine Thaumarchaeota diver-
sification. ISME J 8: 732–736.
Lupatini, M., Suleiman, A.K.A., Jacques, R.J.S., Antoniolli,
Z.I., de Siqueira Ferreira, A., Kuramae, E.E., and Roesch,
L.F.W. (2014) Network topology reveals high connectance
levels and few key microbial genera within soils. Front Envi-
ron Sci 2: 10.Luz, D.E., Nepomuceno, R.S., Spira, B., and Ferreira, R.C.
(2012) The Pst system of Streptococcus mutans is impor-
tant for phosphate transport and adhesion to abiotic surfa-
ces. Mol Oral Microbiol 27: 172–181.
Ma, J., Yuan, Y., and Yuan, D. (2017) Underway analysis of
nanomolar dissolved reactive phosphorus in oligotrophic
seawater with automated on-line solid phase extraction and
spectrophotometric system. Anal Chim Acta 950: 80–87.Maindonald, J.H. (2007). Data Analysis and Graphics Using
R: An Example-Based Approach. New York: Cambridge
University Press.Marshall, J.-A., Ross, T., Pyecroft, S., and Hallegraeff, G.
(2005) Superoxide production by marine microalgae. Mar
Biol 147: 541–549.
Martin-Cuadrado, A.-B., Rodriguez-Valera, F., Moreira, D.,
Alba, J.C., Ivars-Martı́nez, E., Henn, M.R., Talla, E., and
L�opez-Garcı́a, P. (2008) Hindsight in the relative abun-
dance, metabolic potential and genome dynamics of uncul-
tivated marine archaea from comparative metagenomic
High abundance of MGII in an estuary 17
VC 2017 Society for Applied Microbiology and John Wiley & Sons Ltd, Environmental Microbiology, 00, 00–00

analyses of bathypelagic plankton of different oceanic
regions. ISME J 2: 865–886.Martin-Cuadrado, A.-B., Garcia-Heredia, I., Molt�o, A.G.,
L�opez-�Ubeda, R., Kimes, N., L�opez-Garcı́a, P., Moreira, D.,
and Rodriguez-Valera, F. (2015) A new class of marine Eur-
yarchaeota group II from the Mediterranean deep chloro-
phyll maximum. ISME J 9: 1619–1634.
Massana, R., DeLong, E.F., and Pedros, A.C. (2000) A few
cosmopolitan phylotypes dominate planktonic archaeal
assemblages in widely different oceanic provinces. Appl
Environ Microbiol 66: 1777–1787.de Menezes, A.B., Prendergast-Miller, M.T., Richardson, A.E.,
Toscas, P., Farrell, M., Macdonald, L.M., et al. (2015) Net-
work analysis reveals that bacteria and fungi form modules
that correlate independently with soil parameters. Environ
Microbiol 17: 2677–2689.Meng, J., Xu, J., Qin, D., He, Y., Xiao, X., and Wang, F. (2014)
Genetic and functional properties of uncultivated MCG
archaea assessed by metagenome and gene expression
analyses. ISME J 8: 650–659.
Mincer, T.J., Church, M.J., Taylor, L.T., Preston, C., Karl, D.M.,
and DeLong, E.F. (2007) Quantitative distribution of pre-
sumptive archaeal and bacterial nitrifiers in Monterey Bay
and the North Pacific Subtropical Gyre. Environ Microbiol 9:
1162–1175.Ministry of Water Resources (2012). Sediment Communique
of Chinese Rivers. Beijing: China Water Resources and
Hydropower Press, 1: 43.Ministry of Water Resources (2013). Sediment Communique
of Chinese Rivers. Beijing: China Water Resources and
Hydropower Press, 1: 51.Moran, M.A., and Miller, W.L. (2007) Resourceful heterotrophs
make the most of light in the coastal ocean. Nat Rev Micro-
biol 5: 792.Morris, J.J., Johnson, Z.I., Szul, M.J., Keller, M., and Zinser,
E.R. (2011) Dependence of the cyanobacterium Prochloro-
coccus on hydrogen peroxide scavenging microbes for
growth at the ocean’s surface. PLoS One 6: e16805.
Murray, A.E., Blakis, A., Massana, R., Strawzewski, S.,
Passow, U., Alldredge, A., and DeLong, E.F. (1999) A times-
eries assessment of planktonic archaeal variability in the
Santa Barbara Channel. Aquat Microb Ecol 20: 129–145.Needham, D.M., and Fuhrman, J.A. (2016) Pronounced daily
succession of phytoplankton, archaea and bacteria follow-
ing a spring bloom. Nat Microbiol 1: 16005. doi:10.1038/
nmicrobiol.2016.1035.Needham, D.M., Chow, C.-E.T., Cram, J.A., Sachdeva, R.,
Parada, A., and Fuhrman, J.A. (2013) Short-term observa-
tions of marine bacterial and viral communities: patterns,
connections and resilience. ISME J 7: 1274–1285.
Neller, R., and Lam, K. (1994). Guangdong: Survey of a Prov-
ince Undergoing Rapid Change. Hong Kong: The Chinese
University of Hong Kong Press.
Nobu, M.K., Dodsworth, J.A., Murugapiran, S.K., Rinke, C.,
Gies, E.A., Webster, G., et al. (2016) Phylogeny and physi-
ology of candidate phylum ‘Atribacteria’ (OP9/JS1) inferred
from cultivation-independent genomics. ISME J 10: 273.Oda, T., Nakamura, A., Shikayama, M., Kawano, I., Ishimatsu,
A., and Muramatsu, T. (1997) Generation of reactive oxy-
gen species by raphidophycean phytoplankton. Biosci Bio-
technol Biochem 61: 1658–1662.
de Oliveira, L., Gregoracci, G., Silva, G.G., Salgado, L., Filho,
G., Alves-Ferreira, M., et al. (2012) Transcriptomic analysis
of the red seaweed Laurencia dendroidea (Florideophyceae,
Rhodophyta) and its microbiome. BMC Genomics 13: 487.
Olvera, A., Sibila, M., Calsamiglia, M., Segal�es, J., and
Domingo, M. (2004) Comparison of porcine circovirus type
2 load in serum quantified by a real time PCR in postwean-
ing multisystemic wasting syndrome and porcine dermatitis
and nephropathy syndrome naturally affected pigs. J Virol
Methods 117: 75–80.Orsi, W.D., Smith, J.M., Wilcox, H.M., Swalwell, J.E., Carini,
P., Worden, A.Z., et al. (2015) Ecophysiology of uncultivated
marine euryarchaea is linked to particulate organic matter.
ISME J 9: 1747–1763.Orsi, W.D., Smith, J.M., Liu, S., Liu, Z., Sakamoto, C.M., and
Wilken, S. (2016) Diverse, uncultivated bacteria and
archaea underlying the cycling of dissolved protein in the
ocean. ISME J 10: 2158–2173.Park, S.J., Kim, J.G., Jung, M.Y., Kim, S.J., Cha, I.T., Kwon,
K., et al. (2012) Draft genome sequence of an ammonia-
oxidizing archaeon, “Candidatus Nitrosopumilus koreensis”
AR1, from marine sediment. J Bacteriol 194: 6940–6941.Parks, D.H., Imelfort, M., Skennerton, C.T., Hugenholtz, P.,
and Tyson, G.W. (2015) CheckM: assessing the quality of
microbial genomes recovered from isolates, single cells,
and metagenomes. Genome Res 25: 1043–1055.Peura, S., Bertilsson, S., Jones, R.I., and Eiler, A. (2015)
Resistant microbial cooccurrence patterns inferred by net-
work topology. Appl Environ Microbiol 81: 2090–2097.Philosof, A., Yutin, N., Flores-Uribe, J., Sharon, I., Koonin,
E.V., and B�ej�a, O. (2017) Novel abundant oceanic viruses
of uncultured marine group II Euryarchaeota. Curr Biol 27:
1362–1368.
Redfield, A.C. (1958) The biological control of chemical fac-
tors in the environment. Am Sci 46: 230A–2221.
Reysenbach, A.L., and Flores, G.E. (2008) Electron micros-
copy encounters with unusual thermophiles helps direct
genomic analysis of Aciduliprofundum boonei. Geobiology
6: 331–336.Rinke, C., Schwientek, P., Sczyrba, A., Ivanova, N.N.,
Anderson, I.J., Cheng, J.F., et al. (2013) Insights into the
phylogeny and coding potential of microbial dark matter.
Nature 499: 431–437.Rohwer, F., and Thurber, R.V. (2009) Viruses manipulate the
marine environment. Nature 459: 207.Rose, A.L., Webb, E.A., Waite, T.D., and Moffett, J.W. (2008)
Measurement and implications of nonphotochemically gen-
erated superoxide in the equatorial Pacific Ocean. Environ
Sci Technol 42: 2387–2393.Ruddle, K., and Zhong, G. (1988). Integrated Agriculture-
Aquaculture in South China: The Dike-Pond System of the
Zhujiang Delta. Cambridge: Cambridge University Press.Sabehi, G., Loy, A., Jung, K.-H., Partha, R., Spudich, J.L.,
Isaacson, T., et al. (2005) New insights into metabolic prop-
erties of marine bacteria encoding proteorhodopsins. PLoS
Biol 3: e273.Santoro, A.E., Dupont, C.L., Richter, R.A., Craig, M.T., Carini,
P., McIlvin, M.R., et al. (2015) Genomic and proteomic char-
acterization of “Candidatus Nitrosopelagicus brevis”: an
ammonia-oxidizing archaeon from the open ocean. Proc
Natl Acad Sci U S A 112: 1173–1178.
18 W. Xie et al.
VC 2017 Society for Applied Microbiology and John Wiley & Sons Ltd, Environmental Microbiology, 00, 00–00

Schloss, P.D., Westcott, S.L., Ryabin, T., Hall, J.R., Hartmann,
M., Hollister, E.B., et al. (2009) Introducing mothur: open-
source, platform-independent, community-supported soft-
ware for describing and comparing microbial communities.
Appl Environ Microbiol 75: 7537–7541.Schloss, P.D., Gevers, D., and Westcott, S.L. (2011) Reducing
the effects of PCR amplification and sequencing artifacts on
16S rRNA-based studies. PLoS One 6: e27310.Seyler, L.M., McGuinness, L.M., and Kerkhof, L.J. (2014)
Crenarchaeal heterotrophy in salt marsh sediments. ISME
J 8: 1534–1543.Shannon, P., Markiel, A., Ozier, O., Baliga, N.S., Wang, J.T.,
Ramage, D., et al. (2003) Cytoscape: a software environ-
ment for integrated models of biomolecular interaction net-
works. Genome Res 13: 2498–2504.Sherwood, A.R., and Presting, G.G. (2007) Universal primers
amplify a 23s rDNA plastid marker in eukaryotic algae and
cyanobacteria1. J Phycol 43: 605–608.Strous, M., Kraft, B., Bisdorf, R., and Tegetmeyer, H.E. (2012)
The binning of metagenomic contigs for microbial physiol-
ogy of mixed cultures. Front Microbiol 3: 410.Tang, Y.Z., and Gobler, C.J. (2010) Allelopathic effects of
Cochlodinium polykrikoides isolates and blooms from the
estuaries of Long Island, New York, on co-occurring phyto-
plankton. Mar Ecol Prog Ser 406: 19–31.Teira, E., Gasol, J.M., Aranguren-Gassis, M., Fern�andez, A.,
Gonz�alez, J., Lekunberri, I., et al. (2008) Linkages between
bacterioplankton community composition, heterotrophic
carbon cycling and environmental conditions in a
highly dynamic coastal ecosystem. Environ Microbiol 10:
906–917.Ter, B.C., and Smilauer, P. (2002). Canoco for Windows Version
4.5. Wageningen: Biometris-Plant Research International.Tian, X. (1994) The distribution characteristics of temperature
in the Lingdingyang, estuary of Zhujiang. Trop Oceanol 13:
76–80.Tourna, M., Stieglmeier, M., Spang, A., Konneke, M.,
Schintlmeister, A., Urich, T., et al. (2011) Nitrososphaera
viennensis, an ammonia oxidizing archaeon from soil. Proc
Natl Acad Sci U S A 108: 8420–8425.
Varela, M.M., Van Aken, H.M., Sintes, E., and Herndl, G.J.
(2008) Latitudinal trends of Crenarchaeota and Bacteria in
the meso- and bathypelagic water masses of the Eastern
North Atlantic. Environ Microbiol 10: 110–124.Vieira, R.P., Clementino, M.M., Cardoso, A.M., Oliveira, D.N.,
Albano, R.M., Gonzalez, A.M., et al. (2007) Archaeal com-
munities in a tropical estuarine ecosystem: Guanabara Bay,
Brazil. Microb Ecol 54: 460–468.Walker, C.B., de la Torre, J.R., Klotz, M.G., Urakawa, H.,
Pinel, N., Arp, D.J., et al. (2010) Nitrosopumilus maritimus
genome reveals unique mechanisms for nitrification and
autotrophy in globally distributed marine crenarchaea. Proc
Natl Acad Sci U S A 107: 8818–8823.
Webster, G., Rinna, J., Roussel, E.G., Fry, J.C., Weightman,
A.J., and Parkes, R.J. (2010) Prokaryotic functional diversity
in different biogeochemical depth zones in tidal sediments
of the Severn Estuary, UK, revealed by stable-isotope prob-
ing. FEMS Microbiol Ecol 72: 179–197.Wu, M., and Scott, A.J. (2012) Phylogenomic analysis of bac-
terial and archaeal sequences with AMPHORA2. Bioinfor-
matics 28: 1033–1034.
Xie, W., Wang, F., Guo, L., Chen, Z., Sievert, S.M., Meng, J.,
et al. (2011) Comparative metagenomics of microbial com-
munities inhabiting deep-sea hydrothermal vent chimneys
with contrasting chemistries. ISME J 5: 414–426.Xie, W., Zhang, C.L., Wang, J., Chen, Y., Zhu, Y., de la Torre,
J.R., et al. (2014a) Distribution of ether lipids and composi-
tion of the archaeal community in terrestrial geothermal
springs: impact of environmental variables. Environ Micro-
biol 17: 1600–1614.Xie, W., Zhang, C.L., Zhou, X., and Wang, P. (2014b) Salinity-
dominated change in community structure and ecological
function of Archaea from the lower Pearl River to coastal
South China Sea. Appl Microbiol Biotechnol 98: 7971–
7982.Yin, K., Song, X., Sun, J., and Wu, M.C. (2004) Potential P
limitation leads to excess N in the Pearl River estuarine
coastal plume. Continent Shelf Res 24: 1895–1907.
Yin, Y., Mao, X., Yang, J., Chen, X., Mao, F., and Xu, Y. (2012)
dbCAN: a web resource for automated carbohydrate-active
enzyme annotation. Nucleic Acids Res 40: W445–W451.Yu, Y., Lee, C., Kim, J., and Hwang, S. (2005) Group-specific
primer and probe sets to detect methanogenic communities
using quantitative real-time polymerase chain reaction. Bio-
technol Bioeng 89: 670–679.Zhang, C.L., Wang, J., Wei, Y., Zhu, C., Huang, L., and Dong,
H. (2011) Production of branched tetraether lipids in the
lower Pearl River and Estuary: effects of extraction methods
and impact on bGDGT proxies. Front Microbiol 2: 274.
Zhang, C.L., Xie, W., Martin-Cuadrado, A.-B., and Rodriguez-
Valera, F. (2015) Marine Group II Archaea, potentially
important players in the global ocean carbon cycle. Front
Microbiol 6: 1108.Zhang, J., Yu, Z., Wang, J., Ren, J., Chen, H., Xiong, H., et al.
(1999) The subtropical Zhujiang (Pearl River) estuary: nutri-
ent, trace species and their relationship to photosynthesis.
Estuar Coast Shelf Sci 49: 385–400.Zhang, X., Huang, X., Shi, Z., Ye, F., and Liu, Q.
(2013) Spatial and temporal variation of picophytoplankton
in the Pearl River Estuary. Acta Ecol Sin 33: 2200–2211 (in
Chinese).Zhang, Z., Geng, J., Tang, X., Fan, H., Xu, J., Wen, X., et al.
(2014) Spatial heterogeneity and co-occurrence patterns of
human mucosal-associated intestinal microbiota. ISME J 8:
881–893.Zhao, H. (1990). Evolution of the Pearl River Estuary. Beijing:
China Ocean, pp. 116–147.
Supporting information
Additional Supporting Information may be found in the
online version of this article at the publisher’s web-site:
Table S1. Information on salinity, pH, temperature, freshwa-
ter runoff, nutrients from different months at sites A, B, C
and D from July 2012 to May 2013. qPCR results are for
total Archaea, MGII and phototrophs. Miseq sequences are
for archaeal 16S rRNA gene and phototroph 23S rRNA
gene (site C and D) in the 0.7 lm and 0.22 lm (excluded
phototrophs 23S rRNA gene) fractions.
Table S2. The Pearson correlation results of particle-
attached Archaea and MGII abundances, freeliving Archaea
and MGII abundances, Phototroph abundances, and
High abundance of MGII in an estuary 19
VC 2017 Society for Applied Microbiology and John Wiley & Sons Ltd, Environmental Microbiology, 00, 00–00

environmental variables for those >10% salinity samples in
surface water.Table S3. The Pearson correlation results of particle-
attached Archaea and MGII abundances, freeliving Archaea
and MGII abundances, Phototroph abundances, and envi-
ronmental variables for those> 10% salinity samples in
middle water.
Table S4. The Pearson correlation results of particle-
attached Archaea and MGII abundances, freeliving Archaea
and MGII abundances, Phototroph abundances, and envi-
ronmental variables for those> 10% salinity samples in bot-
tom water.Table S5. Phototroph OTUs having more than 50 sequen-
ces in at less 15% samples from site C and D.Table S6. Archaeal OTUs having more than 50 sequences
in at less 15% 0.7 lm fractions from site C and D.
Table S7. The CCLasso correlations between archaeal
OTUs and phototroph OTUs.
Table S8. Summary of metagenomic sequences from site
D at January 2012.
Table S9. BLASTP results of Amphora2 markers identified
in the MGII bin against the NCBI nonredundant (nr)
database.Table S10. The statistics results of MGII bin from the meta-
genomic data.Table S11.The SEED L3 categories having relative high
abundant genes within MGIIa_P compared with other refer-
ence genomes and their abundances in metagenome from
the surface water of site D.Table S12. List of genes on catalase containing contig in
MGIIa_P genome (7080bp, 49.2% GC).
Table S13. Genes encoding hydrolytic enzymes aligned to
the CAZy database.
Table S14. List of genes of contig 75142 (40.6kb, 47.7%
GC), which contains proteorhodopsin in MGIIa_P genome.
Figure S1. Map of the lower PRE. Site A was located in
the upstream freshwater region, Site B around the Nanshan
port, Site C in the center part of PRE and Site Din the
Wanshan Island outside the PRE.Figure S2. Comparison of environmental parameters (a:
Salinity; b: Temperature; c: pH; d: SiO32-; e: NO3-; f:
NH41; g: NO2-; h: Chl a; i: Phototrophs) detected in the
low (L) and high runoff seasons (H) at site A, B, C and D.
The significant differences of salinity among low-high runoff
coupled samples were A_L vs A_H (P<0.05), B_L vs B_H
(P<0.01), C_L vs C_H (P< 0.01) and D_L vs D_H
(P<0.05). The significant differences of temperature
among low–high runoff coupled samples were A_L vs A_H
(P<0.05), B_L vs B_H (P< 0.05) and C_L vs C_H
(P<0.05). The significant differences of pH among low-
high runoff coupled samples were A_L vs A_H (P< 0.01).
The significant differences of silicate among low-high runoff
coupled samples were A_L vs A_H (P<0.05), B_L vs B_H
(P<0.01) and C_L vs C_H (P<0.01). The significant differ-
ences of nitrate among low-high runoff coupled samples
were A_L vs A_H (P< 0.01), B_L vs B_H (P< 0.01) and
C_L vs C_H (P<0.01). The significant difference of Chl a
was C_H and D_H. The significant differences of phototroph
23S rRNA gene abundances among all the samples were
A_L vs C_L (P< 0.01), A_L vs D_L (P< 0.01), C_L vs D_L
(P<0.01) and A_H vs D_H (P<0.01). There was no
significant difference of ammonium and nitrite among low–
high runoff coupled samples. The solid box indicates the
location of the middle 50% of the data (1st to 3rd quartile),
with the median marked in the center as a solid line. The
red cross represents the mean value. The maximum length
of each whisker is 1.5 times the interquartile range.Figure S3. The percentages of 6 most abundant SAR11
and SAR86 in different fractions from surface (a and c) and
bottom (b and d) water at site D in April 2013.Figure S4. Scatter diagrams of particle-attached MGII 16S
rRNA gene vs free-living MGII 16S rRNA gene for all the
samples from Site A (blue points), Site B (orange points),
Site C (grey points) and Site D (yellow points).Figure S5. Statistic comparison of particle-attached and
free living MGII abundances in the surface (a) and bottom
water (b) along PRE salinity gradient in different seasons.
L: low runoff seasons; H: High runoff seasons. The solid
box indicates the location of the middle 50% of the data
(1st to 3rd quartile), with the median marked in the center
as a solid line. The red cross represents the mean value.
The maximum length of each whisker is 1.5 times the inter-
quartile range.Figure S6. Statistic comparison of particle-attached and
free living MGII abundances and Archaea in surface, middle
and bottom water along Site A (a and e), B (b and f), C (c
and g) and D (d and h). The solid box indicates the location
of the middle 50% of the data (1st to 3rd quartile), with the
median marked in the center as a solid line. The red cross
represents the mean value. The maximum length of each
whisker is 1.5 times the interquartile range. Two stars indi-
cate that the differences were significant at the 0.01 level.
One star indicates that the differences were significant at
the 0.05 level.Figure S7. Scatter diagram of salinity vs MGII 16S rRNA
gene (copies/L) in the 0.7 lm fractions at Site A, B, C, and D.Figure S8. Scatter diagrams of Temperature vs MGII 16S
rRNA gene (copies/L) (A) and total Archaeal 16S rRNA
gene (copies/L) (B) in the 0.22 lm filter samples having
>10% salinities.Figure S9. Cluster analysis based on taxonomic composi-
tion of Archaea in 0.22 lm fractions that collected monthly
from surface, middle and bottom water at Sites A, B, C and
D during July 2012 to May 2013. Sample names are shown
on the right of the figure. The orders are color coded and
shown at the bottom of the figure. Those samples are
majorly clustered into four groups: freshwater Group (Salin-
ity: 2.5 6 4.2%o, n515), brackish water Group A (Salinity:
17.0 6 8.6%o, n 5 22), brackish water Group B (Sal: 16.8 6
9.8%o, n 5 16), marine group (Sal: 23.6 6 7.4%o, n 5 27)�The samples in corresponding groups are boxed with dash
lines.
Figure S10. RDA ordination diagrams of Archaea with envi-
ronmental variables in 0.7 lm filter samples in the surface,
middle and bottom water had >10% salinities. Correlations
between environmental variables and RDA axes are repre-
sented by the length and angle of dashed arrows (environ-
mental factor vectors). Solid arrows represent the
proportions ofl9 archaeal genera (the generals IDs followed
Fig. 4).Figure S11. Phylogenetic tree of MGII 16S rRNA gene.
Neighbor-joining MGII 16S rRNA gene tree (808
20 W. Xie et al.
VC 2017 Society for Applied Microbiology and John Wiley & Sons Ltd, Environmental Microbiology, 00, 00–00

unambiguously aligned nucleotides) was first built. Those
short high throughput sequences were inserted into the treeusing the parsimony interactive tool in ARB. Sampling loca-tions: MED, Mediterranean Sea; HOT, Hawaii Ocean Time-Series, North Pacific Gyre (ALOHA station); SP, SouthPacific; ETSP, Eastern Tropical South Pacific; WP, western
Pacific; NP: North Pacific; SA, South Atlantic; GM, Gulf ofMexico; NP, North Pacific; ECS, East China Sea; SCS:South China Sea; TSP, Tropical South Pacific; NA, NorthAtlantic.Figure S12. The percentages of MGIIa and MGIIb in the
archaeal communities in the 0.22 lm filter samples and 0.7lm filter samples collected monthly from surface, middle,and bottom water at site A, B, C and D during the 10months period. Two stars indicate that the differences were
significant at the 0.01 level. One star indicates that the dif-ferences were significant at the 0.05 level. The solid boxindicates the location of the middle 50% of the qPCR data(1st to 3rd quartile), with the median marked in the centeras a solid line. The maximum length of each whisker is 1.5
times the interquartile range. The red cross indicates theaverage value.Figure S13. Cluster analysis based on the composition of10 MGII OTUs in both 0.7 lm and 0.22 lm fractions had>10% salinities. Sample names were shown on the right of
the figure. The MGII OTUs were color coded and shown atthe bottom of the figure. Those samples were clustered intofive groups based on their sampling time: October-December cluster; January- February cluster; March clus-ter; April-May cluster; December cluster. This figure showed
that those MGII in 0.22 lm fractions were not significantlydistinguished from those in 0.7 lm fractions, suggestingsimilar ecotypes of those particle-attached and free-livingMGII in >10%o salinity samples. However, those samples
could be divided into 5 clusters as their sampling seasons:October-December cluster (characterized by the relativelyhigh proportions of MGIIa_OTU6, MGIIa_15, MGIIa_7);January-February cluster (characterized by the relativelyhigh proportions of MGIIb_OTU5, MGIIb_8); March cluster
(characterized by the especially high proportions ofMGIIa_OTU3); April-May cluster (characterized by the rela-tively high proportions of MGIIb_OTU4 MGIIb_OTU5 andMGIIa_OTU16); December cluster (characterized by theespecially high proportions of MGIIa_OTU2).
Figure S14. Scatter diagrams of the proportions of particle-attached MGIIa_OTU2 (a) and MGIIa_OTU3 (b) from sur-face water vs PAR.Figure S15. Cluster analysis based on taxonomic composi-tion of phototrophs in 0.7 lm fractions coUected monthly
from surface, middle, and bottom water at Site C and Dbetween July 2012 and May 2013. Sample names areshown on the right of the figure. The phyla are color codedand shown at the bottom of the figure. Samples are clus-
tered into two groups: brackish water cluster (samples aremostly from site C and characterized by diverse phototrophspecies) and marine group (samples are mostly from site D
and characterized by Cyanobacteria dominance). The sam-
ples in corresponding groups are boxed with dash lines.Figure S16. Phylogenetic tree of Cyanobacteria 23S rRNA
gene.. Neighbor-joinin 23S rRNA gene tree (395 unambigu-
ously aligned nucleotides) showing the relationship of the
Cyanobacteria OTUs from the PRE (bold) with references.
Two clades were identified, the marine and freshwater Cya-
nobacteria clades.Figure S17. Cluster analysis based on taxonomic composi-
tion including the different kinds of phototrophs in the
marine group samples as Figure S15 classified. Those
marine group samples could further be divided into marine
group a (having more marine Cyanobacteria) and marine
group b (having more freshwater Cyanobacteria).
Figure S18. Scatter diagrams of MGIIa_OTU2 vs Bathy-
archaeota (a), Scatter diagrams of MGIIa_OTU2 vs.
Synechococcus_OTU10.Figure S19. Scatter diagrams of the proportions of
MGIIa_OTU8 VSthe proportions of Synechococcus_OTU437
(a), Synechococcus_OTU337 (b), Synechococcus_OTU159
(C) and Synechococcus_OTU268 (d). All the four Synecho-
coccus are freshwater Synechococcus.Figure S20. The unfiltered (A) and filtered bin (contigs
greater than 2 kb and coverages higher than 20, B) in
Metawatt, coverage vs. %GC plot.Figure S21. ESOM of Pearl River metagenomics sequence
fragments based on tetranucleotide frequency, showing
contigs in the MGII bin (orange) and other contigs (white).Fig. S22 The CheckM results of the MGIIa_P genome.
Figure S23. Genomic organization of the pst operon from
Nitrospuminus maritimus SCM1, MGIIa_P and two fosmid
clones from Western Mediterranean.Figure S24. Maximum-likelihood PstA amino-acid sequen-
ces tree showing the relationship of the MGIIa_P PstA (bold
and red) with references.Figure S25. Maximum-likelihood PstB amino-acid sequen-
ces tree showing the relationship of the MGIIa_P PstB (bold
and red) with references.Figure S26. Maximum-likelihood PstC amino-acid sequen-
ces tree showing the relationship of the MGIIa_P PstC
(bold and red) with references.Figure S27. Maximum-likelihood rhodopsin gene tree show-
ing the relationship of the MGIIa_P rhodopsins (bold and
red) with other rhodopsins (blue). Pop, Pop-1, Pop-2, Pop-3
and Pop-4 MGII rhodopsins are as previously defined (Mar-
tin-Cuadrado et al., 2015).
Figure S28. Comparison of genomic organization of contig
containing proteorhodopsin genes in MGIIa_P genome (red-
shadowed rectangles) with other genomic fragments con-
taining the MGII proteorhodopsins. The blue rectangles rep-
resent the ORFs close related to MGIIa_P. The yellow
rectangles represent ORFs that are not homologs as in
MGIIa_P.
High abundance of MGII in an estuary 21
VC 2017 Society for Applied Microbiology and John Wiley & Sons Ltd, Environmental Microbiology, 00, 00–00
Related Documents