MAGNETIC RESONANCE IN MEDICINE 3,25 1-26 1 (1986) Localization of Phosphorus Metabolites and Sodium Ions in the Rat Kidney* RONALD T. BOGUSKY,t’$’$ MICHAEL GAR WOOD,^^ GERALD B. MAT SON,^ GALO ACOSTA,I’ LARRY D. COWGILL,# AND THOMAS SCHLEICH$’I”T Departments of ?Internal Medicine, $Biological Chemistry, and gHuman Physiology, School of Medicine, TNMR Facility, #Department of Medicine, School of Veterinary Medicine, University of California. Davis. and the “Department of Chemistry, University o f California, Santa Cruz Received May 15, 1985; revised August 23, 1985 Relative amounts of phosphorus-containing metabolites and sodium ions present in different regions of the in vivo rat kidney were obtained using a surface-coil probe and recently developed NMR rotating-frame methods. During altered physiologicstates, changes in distribution of metabolites and sodium ions within the kidney were identified in one- dimensional metabolite maps. This technique may have important applications to disorders commonly found in clinical medicine. 0 1986 Academic PI=, Inc. INTRODUCTION Nuclear magnetic resonance (NMR) spectroscopy has developed rapidly in the past several years to become a valuable tool in the noninvasive study of tissue metabolism (1). These studies have been further enhanced by the introduction of the surface coil (2) for NMR spectroscopy of localized regions adjacent to the surface coil. Other techniques to better define or localize the region of sample or tissue giving rise to the spectra have recently become available. These techniques include field profiling to limit the region of sample experiencing a homogeneous magnetic field (3), the utili- zation of probes producing a homogeneous BI field to generate selective excitation with switched field gradients (4), or nonselected pulses with incremented, switched field gradients (5, 6). A combination of switched field gradients with surface-coil re- ception can also be used (7). Surface-coil experiments such as depth pulse techniques for selectiveexcitation have been developed which take advantage of the inhomogeneity in the B1 field associated with surface coils (8), and other, related techniques have followed (9.10). More recently introduced techniques include chemical-shiftencoding through a correlation type of pulse experiment (IZ), and spectroscopicimaging utilizing projection reconstruction (12) or echo planar techniques (13). Although each of these techniques has particular advantages, all have limitations as well. The work presented here has utilized yet another experimental technique which is based on Hoult’s rotating-frame experiment (M), but is executed with a surface coil (15, 16). The surface-coil rotating-frame experiment provides topographical discrim- * Supported by the W. M. Keck Foundation and the Estate of M. J. Davidson and United States Public Health Service Grants EY 04033 to T.S. and AM 31531 to R.T.B. 25 I 0740-3 194/86 $3.00 Copyright 0 1986 by Academic Press, Inc. All rights of reproduction in any form reserved.

Welcome message from author
This document is posted to help you gain knowledge. Please leave a comment to let me know what you think about it! Share it to your friends and learn new things together.
Transcript

MAGNETIC RESONANCE IN MEDICINE 3,25 1-26 1 (1986)
Localization of Phosphorus Metabolites and Sodium Ions in the Rat Kidney*
RONALD T. BOGUSKY,t’$’$ MICHAEL GAR WOOD,^^ GERALD B. MAT SON,^ GALO ACOSTA,I’ LARRY D. COWGILL,# AND THOMAS SCHLEICH$’I”T
Departments of ?Internal Medicine, $Biological Chemistry, and gHuman Physiology, School of Medicine, TNMR Facility, #Department of Medicine, School of Veterinary Medicine, University of California. Davis.
and the “Department of Chemistry, University of California, Santa Cruz
Received May 15, 1985; revised August 23, 1985
Relative amounts of phosphorus-containing metabolites and sodium ions present in different regions of the in vivo rat kidney were obtained using a surface-coil probe and recently developed NMR rotating-frame methods. During altered physiologic states, changes in distribution of metabolites and sodium ions within the kidney were identified in one- dimensional metabolite maps. This technique may have important applications to disorders commonly found in clinical medicine. 0 1986 Academic PI=, Inc.
INTRODUCTION
Nuclear magnetic resonance (NMR) spectroscopy has developed rapidly in the past several years to become a valuable tool in the noninvasive study of tissue metabolism (1). These studies have been further enhanced by the introduction of the surface coil (2) for NMR spectroscopy of localized regions adjacent to the surface coil. Other techniques to better define or localize the region of sample or tissue giving rise to the spectra have recently become available. These techniques include field profiling to limit the region of sample experiencing a homogeneous magnetic field (3), the utili- zation of probes producing a homogeneous B I field to generate selective excitation with switched field gradients (4 ) , or nonselected pulses with incremented, switched field gradients (5, 6). A combination of switched field gradients with surface-coil re- ception can also be used (7). Surface-coil experiments such as depth pulse techniques for selective excitation have been developed which take advantage of the inhomogeneity in the B1 field associated with surface coils (8), and other, related techniques have followed (9.10). More recently introduced techniques include chemical-shift encoding through a correlation type of pulse experiment (IZ), and spectroscopic imaging utilizing projection reconstruction (12) or echo planar techniques (13). Although each of these techniques has particular advantages, all have limitations as well.
The work presented here has utilized yet another experimental technique which is based on Hoult’s rotating-frame experiment (M), but is executed with a surface coil (15, 16). The surface-coil rotating-frame experiment provides topographical discrim-
* Supported by the W. M. Keck Foundation and the Estate of M. J. Davidson and United States Public Health Service Grants EY 04033 to T.S. and AM 31531 to R.T.B.
25 I 0740-3 194/86 $3.00 Copyright 0 1986 by Academic Press, Inc. All rights of reproduction in any form reserved.

252 BOGUSKY ET AL.
ination in one dimension to permit localization of phosphorus containing metabolites and sodium ions in the in vivo rat kidney. We use the term “metabolite mapping” to describe the results of this NMR technique. The results show that the resonances present in the renal cortex can be readily distinguished from those present in the renal outer medulla. During altered physiologic states changes in metabolite distribution within the in vivo kidney can also be identified. Application of this technique provides the first nondestructive observation of ATP and sodium ion distributions within the in vivo rat kidney.
METHODS
To achieve a metabolite map of tissue certain unique features of surface-coil tech- nology are exploited. The BI field generated by a surface coil ( I 7) is inhomogeneous and its strength decreases with increasing axial distance from the coil (2). The surface- coil rotating-frame experiment takes advantage of the B1 radiofrequency (rf) field gradient of the surface coil to achieve spatial resolution. The experiment is performed in the presence of a homogeneous Bo field, so that chemical-shift information is pre- served. The experiment is achieved by acquiring data files as a function of equally incremented evolution pulses, and discrimination is accomplished on the basis of the degree of nutation on the magnetization away from the z axis in the rotating frame. For a given evolution pulse, this nutation is invariant over curved surfaces of constant B1 field strength (B, isocontours); thus sequential isocontours define the mapping dimension. Two-dimensional Fourier transformation of the data results in a suite of spectra displayed as a function of the mapping dimension, where each individual spectrum arises from metabolites located within a slice volume described by two ad- jacent BI field isocontour surfaces. Computer simulations of the effective B , field isocontours produced by a surface coil of a defined geometry provide the means for determining the position and curvature of the slices. Figure 1 shows effective B1 field isocontours for the coil used in the experiments presented herein with superimposition of a scaled cross section of rat kidney (see below). The frequency labels along the mapping dimension of the two-dimensional Fourier transform spectrum were con- verted to effective BI values using an experimentally determined scaling factor obtained by positioning a small capillary standard adjacent to the sample at known spatial coordinates relative to the coil.
The free induction decay (FID) signal intensity sensed by the coil from a sample at position ‘i’ for a certain pulse duration tl is given by
S ( t l , t 2 ) a Blisin(Qlitl)exp “) T?’
where t l and t2 are the times of the evolution and detection periods, respectively. Q l i
and Q2 are the corresponding angular frequencies, and Ty’ and TY’ express the decay of the transverse magnetization during tl and t2 , respectively (18). This equation demonstrates that if the evolution pulse width is incremented in an increasing fashion the signal oscillates sinusoidally as a function of t, . Since Q I i is proportional to B l j , oscillation occurs with a frequency dictated by the spatially dependent B, field strength, while each FID retains the chemical shift information in Q2. Thus, the Fourier trans-

SPATIAL LOCALIZATION OF METABOLITES IN KIDNEY 253
form of S(t t , t z ) , with respect to t 2 and t l , results in a two-dimensional spectrum comprising the metabolite map in which the spectra are displayed as a function of the mapping dimension such that each indivdual spectrum arises from metabolites in a separate volume of tissue as defined by successive BI field isocontours. The equation also indicates that the signal strength received is proportional to B l i . In principle, computer simulations of the isocontour surfaces of the surface coil could be used in conjunction with the above equation to produce correction factors, so that peak heights from slices at different positions would reflect metabolite concentrations. However, such correction factors would also recognize knowledge of the volume of tissue com- prising each individual slice, and such correction factors were not calculated for the results presented here.
Tissue metabolism studies require that satisfactory signal-to-noise be achieved in the shortest possible time. Optimal signal collection efficiency is attained with an interpulse delay time that is short in comparison to the time required for the mag- netization along the z axis to fully recover. However, metabolite maps obtained with delays less than the TI longitudinal relaxation time exhibit considerable distortion, or smearing, of the resonances along the mapping dimension which decreases the spatial resolution (16), in addition to differential saturation effects on signal intensities (19). To avoid these adverse smearing effects in the "P metabolite maps, a preparation pulse sequence is applied to eliminate all z-component magnetizations, followed by a short delay to allow for partial recovery of these magnetizations prior to the application of the evolution pulse (16). The preparation pulse is a phase-cycling pulse sequence that effectively saturates the sample magnetization (20). The pulse sequence used to obtain a "P metabolite map of kidney was Low Power (Pl(x') , Pl(y') , Pl(-x') , P ~ ( - Y ' ) ) ~ , D1, High Power, P2( t l ) , ACQ. The P1 pulse controls the saturating field of the preparation pulse and was typically 70 ms in length; D1 is the delay to allow for partial recovery from saturation, and P2( t l ) is the evolution pulse with incremented duration t l used to excite the partially recovered magnetization. It should be clear that, although there may be TI saturation effects (9) in this experiment, the saturation is independent of slice position. A preparation pulse is not required to obtain a map of the sodium ions present in tissue because the TI of sodium is short enough (ap- proximately 45 ms) to permit an interpulse delay of 200 ms to be used without loss of resolution along the mapping dimension.
Experiments were performed on a Nicolet Magnetics spectrometer equipped with an Oxford Instruments 4.7-T wide-bore magnet, a Nicolet 293A' pulse programmer, and a Nicolet 1180 computer. Data reduction was performed with a Nicolet 1280 computer. Typical spectrometer parameters were as follows: pulse width, variable; 2000 data points per FID; sweep width +4000 Hz (quadrature phase detection); rep- etition time, 2.2 s for phosphorus and 328 ms for sodium; number of acquisitions, 500 for phosphorus and 32 for sodium. The number of data sets taken were either 16 or 18, yielding 8 or 9 actual slices through the sample. Because the data was zero filled once or twice, the number of individual spectra comprising a complete map was variable. Scaling of one metabolite map to another was facilitated by placing a capillary on the surface of the kidney containing methylenediphosphonic acid or sodium chloride plus dysprosium tripolyphosphate. Intracellular pH was determined using previously published NMR methods for kidney (21).

254 BOGUSKY ET AL.
Male Sprague-Dawley rats (350-400 g) were obtained from Simonson’s Breeding Laboratories, San Jose, California. Control rats were fed Purina rat chow (0.4% sodium in the whole diet) and water ad libitum. A group of rats were made hypokalemic by feeding them a diet low in potassium for 14 days (<O.l% potassium and containing 1% sodium in the whole diet, ICN Nutritional Biochemicals, Cleveland, OH. Catalog #904665.) These rats also received 1 mg deoxycorticosterone acetate (DOCA) daily by subcutaneous injection. In addition, a solution of 0.9% NaCl was given to them as drinking water. Three days prior to the NMR study the saline drinking water was replaced by tap water. Thus, at the time of study sodium intake of the potassium- depleted and control rats was approximately the same. Under these conditions serum potassium concentrations fell from 5.26 f 0.19 (SEM) to 2.21 k 0.16 mEq per liter (n = 12) after 14 days of depletion (P < 0.001 by Student’s t test). Another group of rats was made acidotic by feeding them 1.5% NH4C1 plus 0.2 M sucrose in their drinking water for 7 days.
The rats were anesthetized with a single intraperitoneal injection of Inactin (100 mg/kg body wt). The left flank of each rat was shaved and the left kidney exposed through a flank incision. The incision was loosely closed around the pedicle of the exteriorized kidney with a single ligature through the skin. Copper Faraday shielding was placed beneath the kidney to diminish resonance signals from the abdominal wall and the kidney was covered with Saran Wrap to prevent drying. The rat was secured with tape to the Plexiglas support of the NMR probe and the exteriorized kidney positioned next to the two-turn surface coil. Ambient temperature within the probe was maintained at 38°C by heated air to keep the rat’s body temperature constant.
Different regions within the kidney were identified from photographs of serial sections of kidney obtained with a microtome. The photographs were then converted into digitized computer images and superimposed on computer simulations of the B , field profiles of the surface coil used in the in vivo rat experiments (Fig. 1). Digitization was performed on a Digital Microsystems Workstation with a GTCO Corporation DIGI- PAD 5 digitizer interfaced to a VAX-11/780 computer. In those circumstances where the digitization resolution proved inadequate, cubic splining was used to interpolate the existing points.
RESULTS
The NMR rotating-frame experiment used to obtain a metabolite map of kidney gave an axial resolution of at least 2 mm which was verified experimentally by use of a capillary tube phantom (results not shown). Thus, this technique can accurately localize resonances present in small anatomical regions within the kidney. The slices giving rise to the spectra in a metabolite map are depicted in Fig. 1. This figure also indicates that slices further from the coil are larger, thus partially canceling the decreased sensitivity of the coil which occurs proportional to the diminished B1 field strength. Phantoms constructed to mimic the shape of the kidney and filled with a single solution showed only slightly diminishing peak heights with slice position further removed from the coil. Thus, the peak heights in the kidney metabolite map roughly monitor metabolite concentrations as a function of the slice position assuming the T, values of the metabolites are not strongly position dependent. However, the data have been taken under conditions of TI discrimination, so that relative levels of the different

SPATIAL LOCALIZATION OF METABOLITES IN KIDNEY 255
2
1
P O
-1
-2 -2 -1 0 1 2
0
FIG. 1. Calculated B, field isocontour lines generated by a two-turn surface coil with superimposed digitized sagittal section of kidney. The large diameter of the coil is 2.2 cm and the second turn (diam 2.0 cm) is 0.3 cm away from the first turn. The radial (p) and axial (a) coordinates are expressed in units of the small-coil radius. The calculated relative B, field magnitudes were experimentally verified by determining the 90" pulse time at selected axial and radial positions by use of a capillary phantom submerged in 120 mM NaCl(3).
metabolites within a particular slice do not follow directly from peak areas. Figure 1 also indicates a disadvantage of the rotating-frame experiment implemented here, wherein the slices extend back to the coil, so that slices penetrating interior regions of the kidney also contain some contamination from more exterior regions. Because the slice thickness becomes more narrow near the coil, the contamination is not large. An indication of the level of contamination is provided below.
Phosphorus-containing resonances observable in the in vivo rat kidney are shown in Fig. 2. A phosphorus metabolite map of normal rat kidney is shown in Fig. 3. The
10 0 -10 -20 PPM
FIG. 2. Phosphorus metabolites present in the in vivo rat kidney. I, Sugar phosphates plus adenosine monophosphate; 11, inorganic phosphate: 111, glyceroylphosphorylcholine (GPC) plus urinary phosphate; IV, phosphocreatine; V, y-phosphate of ATP VI, a-phosphate of A T P VII, &phosphate of ATP. This spectrum of in v ivo kidney was obtained using a surface coil. A 1 2 - p ~ excitation pulse was applied to the kidney and signals were accumulated during the initial 0.128 s of the free induction decay. Five hundred transients with a repetition time of 0.5 s were averaged. The spectrum was referenced to the water resonance positioned on the camer frequency. Phosphocreatine has been assigned the chemical shift of 0 ppm.
256 BOGUSKY ET AL.
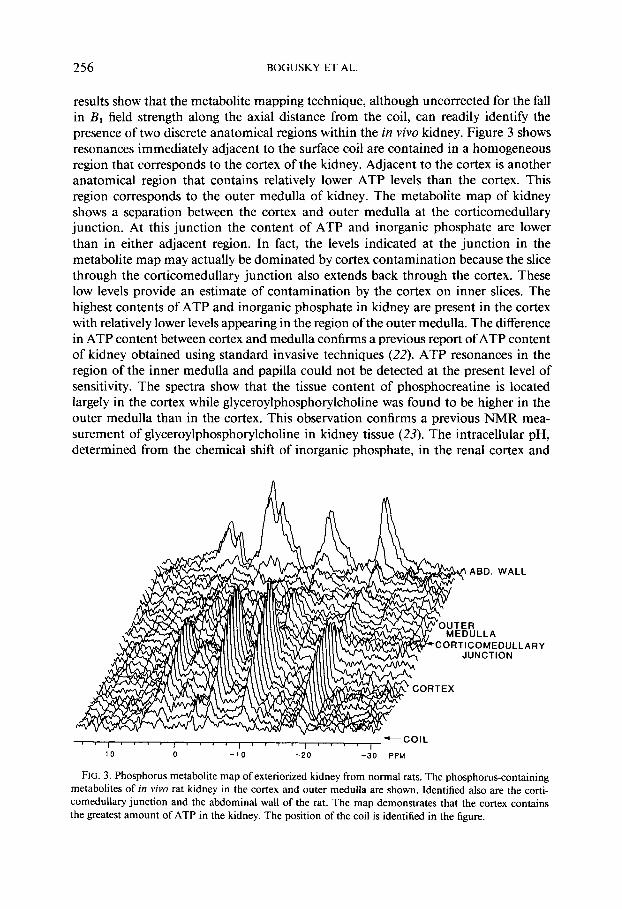
results show that the metabolite mapping technique, although uncorrected for the fall in BI field strength along the axial distance from the coil, can readily identify the presence of two discrete anatomical regions within the in vivo kidney. Figure 3 shows resonances immediately adjacent to the surface coil are contained in a homogeneous region that corresponds to the cortex of the kidney. Adjacent to the cortex is another anatomical region that contains relatively lower ATP levels than the cortex. This region corresponds to the outer medulla of kidney. The metabolite map of kidney shows a separation between the cortex and outer medulla at the corticomedullary junction. At this junction the content of ATP and inorganic phosphate are lower than in either adjacent region. In fact, the levels indicated at the junction in the metabolite map may actually be dominated by cortex contamination because the slice through the corticomedullary junction also extends back through the cortex. These low levels provide an estimate of contamination by the cortex on inner slices. The highest contents of ATP and inorganic phosphate in kidney are present in the cortex with relatively lower levels appearing in the region of the outer medulla. The difference in ATP content between cortex and medulla confirms a previous report of ATP content of kidney obtained using standard invasive techniques (22). ATP resonances in the region of the inner medulla and papilla could not be detected at the present level of sensitivity. The spectra show that the tissue content of phosphocreatine is located largely in the cortex while glyceroylphosphorylcholine was found to be higher in the outer medulla than in the cortex. This observation confirms a previous NMR mea- surement of glyceroylphosphorylcholine in kidney tissue (23). The intracellular pH, determined from the chemical shift of inorganic phosphate, in the renal cortex and
-COIL I " " 1 " " 1 " " 1 " " I 10 0 - 1 0 -20 - 3 0 PPM
FIG. 3. Phosphorus metabolite map of exteriorized kidney from normal rats. The phosphorus-containing metabolites of in vivo rat kidney in the cortex and outer medulla are shown. Identified also are the corti- comedullary junction and the abdominal wall of the rat. The map demonstrates that the cortex contains the greatest amount of ATP in the kidney. The position of the coil is identified in the figure.

SPATIAL LOCALIZATION OF METABOLITES IN KIDNEY 257
outer medulla of control rats was found to be 7.37 k 0.02 (n = 4). A map of the sodium ions distributed within kidney was also obtained. The results show that in control kidneys sodium is concentrated to its highest levels in the outer medulla (Fig. 4).
The phosphorus metabolite map from DOCA treated and potassium-depleted rats is strikingly different from that of control rat kidney (Fig. 5). The proportion of ATP present in the outer medulla versus the cortex in these kidneys was greatly increased when compared to the proportion of ATP in outer medulla versus the cortex in un- treated controls. Also observed was a decrease in tissue inorganic phosphate relative to the ATP content of cortex in kidneys from potassium-depleted rats. Inorganic phos- phate content in the region of the outer medulla was not decreased relative to the ATP content in these kidneys. The cortex probably contributes to the resonance signals present in the region of the outer medulla; however, the level of contribution is probably small because the inorganic phosphate levels demonstrate two distinct and easily rec- ognized anatomical regions present in these kidneys. Intracellular pH of cortex and medulla in kidneys from potassium-depleted rats was 7.15 k 0.02 (n = 4) while systemic pH was 7.61 ? 0.04 and serum bicarbonate was 38 k 0.04 meq/liter (n = 4). The spectra demonstrate that levels of glyceroylphosphorylcholine present in the outer medulla are increased in these kidneys when compared to untreated controls. This confirms a previous study that reported an increase in glyceroylphosphorylcholine synthesis in the medulla of potassium-depleted rat kidney (24) . As indicated in Fig. I , the slices furthest from the coil may have large contributions from the semicircular shaped cortex; therefore, no interpretation of metabolic events occumng in inner medulla and papilla of these kidneys can be made. The absolute sodium content of the outer medulla is lower in kidneys of potassium-depleted rats than that of control
TOM
ABD. WALL
FIG. 4. Distribution of sodium present in the in vivo rat kidney. The figure shows that the highest content of sodium in the kidney can be found in the outer medulla. Identified in the figure is a resonance intensity standard containing I M NaCl plus dysprosium tripolyphosphate. This standard is marked as PHANTOM in the figure. Also identified are the sodium resonances present in the cortex, outer medulla, renal pelvis, and abdominal wall.

258 BOGUSKY ET AL.
,LL
10 0 - 1 0 - 2 0 -30 PPM
FIG. 5 . Phosphorus metabolite map of kidney from potassium-depleted and DOCA-treated rats. The spectra show a decrease in inorganic phosphate content of the cortex of treated rats compared to untreated controls. The spectra also reveal an increase in ATP content of the outer medulla in kidneys of treated rats when compared to controls. Identified in the figure is the cortex, corticomedullary junction (C-M Junction), the outer medulla and the abdominal wall of the rat. The position of the coil is indicated in the figure.
kidneys (Fig. 6). This observation may be related to the well known renal sodium concentrating defect that occurs during potassium depletion.
The phosphorus metabolite map of kidneys from NH,CI-fed rats was also different from controls (Fig. 7). Kidneys from NH4C1-fed rats show an increase in ATP content
COIL A
ABD. WALL
tNTOM
FIG. 6 . Sodium content of regions of kidney in potassium-depleted and DOCA-treated rats. This figure shows the sodium content of the outer medulla of treated rats is less than in untreated controls despite similar sodium intakes at the time of experiment (compare to Fig. 4). Identified in the figure is the position of the coil and a phantom containing the same intensity standard as in Fig. 4.

SPATIAL LOCALIZATION OF METABOLITES IN KIDNEY 259
PHANTOM
-COIL I " " I " ~ ' I " " I " " 1 " ' 20 10 0 - 1 0 -20 PPM
FIG. 7. Phosphorus metabolite map of kidney from NH,CI-fed rats. The spectra show an increase in ATP content of the outer medulla of kidney when compared to normal controls. The spectra show a phantom containing methylenediphosphonic acid placed on the cortical surface of the kidney. The spectra also show the position of the coil, cortex, outer medulla, and the abdominal wall of the rat.
in the region of the outer medulla when compared to untreated control kidneys. In- tracellular pH of the renal cortex was 7.24 k 0.05 while the pH of the outer medulla was 6.95 -+ 0.03 (n = 3). A map of the distribution of sodium ions in kidney of NH&l fed rats was indistinguishable from controls (not shown).
DISCUSSION
The intricate anatomical structure of the kidney not only provides spatial separation of transport processes along the folded loops of tubules but also couples the function of different segments of the tubules by juxtaposing them in specialized regions within the kidney, or cortex and medulla. Micropuncture techniques of renal tubules and their perfusion in vitro have produced detailed information of tubular function, espe- cially in the cortex (25). Microassay techniques have also provided a detailed analysis of enzyme content in different regions of the tubule which have further helped un- derstand the organization of tubule function (26). However, the metabolism of the renal medulla has not been as well studied as the cortex. The renal medulla is not as readily accessible for study as the cortex and its excretory function has been largely deduced by comparing the content of the final urine to that of micropuncture analysis of urine present in the superficial tubules of the renal cortex. Most metabolic studies employ invasive and destructive techniques in which the whole kidney is frozen and the cortex is dissected from the medulla for analysis of metabolites present in these tissues (27). Such methods are time consuming and subject to artifacts due to thawing of the tissue during extraction. We used the nondestructive technique of NMR to examine the metabolism of the renal medulla as well as the cortex by creating metabolite maps of intact in vivo rat kidneys. The results of our studies provide new information on the metabolite content of kidney during two altered physiologic states commonly

260 BOGUSKY ET AL.
encountered in clinical medicine, namely, potassium depletion and chronic metabolic acidosis.
Potassium deficiency results in profound alterations in renal function, including a notable curtailment of urinary concentrating ability (28). The mechanism of this defect is not entirely known; however, a change in cellular energy metabolism of the renal medulla has been implicated (29). The renal medulla is capable of high rates of aerobic glycolysis which decreases in the presence of oxygen. In potassium depletion this difference is absent. This observation suggested to previous investigators (29) that ATP metabolism in the region of the medulla may be impaired and a defect in medullary ATP synthesis may in some way be responsible for the defective transport process involved in the loss of sodium-concentrating ability during potassium depletion. The 23Na NMR map of kidneys from potassium-depleted rats in our study confirms the presence of a defect in sodium concentrating ability compared to normal controls. However, this defect in the kidney's ability to concentrate sodium during potassium depletion does not appear to be due to diminished ATP synthesis as previous researchers have postulated because the 3'P NMR metabolite maps reveal abundant amounts of ATP in renal outer medulla. The results of the present study seem to suggest that ATP production in the outer medulla may be normal but the ATP formed is not utilized for sodium reabsorption. Metabolite maps of kidney from acidotic rats also demonstrate a rise in ATP content of outer medulla. This region of the kidney contains, in addition to other nephron segments, medullary collecting ducts that are responsible for urinary acidification (30). It has been found that the mechanism of urinary acidification in models of this region of the tubule is hydrogen secretion via a H+-ATPase (31). Since the outer medulla of the acidotic kidney demonstrated a more acidic pH than the cortex an increase in ATP content in this region of kidney may be related to the process of urinary acidification.
SUMMARY
An important goal for the biological application of nuclear magnetic resonance is to be able to obtain spectra from known regions of tissue. The one-dimensional me- tabolite mapping experiments presented here represent an important first step toward that goal. The metabolite maps obtained using NMR rotating-frame experiments were accomplished with surface coils. These experiments retain the advantages of high sensitivity inherent with surface coils for in vivo studies and are accomplished without recourse to switched field gradients. In addition, they are capable of high resolution in the mapping dimension. In present experiments with the in vivo rat kidney the anatomical structures observed in the mapping dimension were verified by superim- posing photographs of successive slices through the kidney to computer simulations of the B, field profiles of the coil used to obtain the spectra. Surface-coil rotating- frame experiments have been employed previously to profile the phosphorus metab- olites ofphantoms (15, 16) and the enucleated bovine globe (16). We now demonstrate the first in vivo application of this technique to measure pH, ATP, and sodium content in the kidney of a rat and illustrate its utilization to follow alterations as a result of potassium depletion and chronic metabolic acidosis.

SPATIAL LOCALIZATION OF METABOLITES IN KIDNEY 26 1
REFERENCES
1. R. A. ILES, A. N. STEVENS, AND J. R. GRIFF’ITHS, Progr. NMR Spectrosc. 15,49 (1982). 2. J. J. H. ACKERMAN, T. H. GROVE, G. G. WONG, D. G. GADIAN, AND G. K. RADDA, Nature (London)
3. P. E. HANLEY AND R. E. GORDON, J. Magn. Reson. 45, 520 (1981). 4. K. N. SCOTT, H. R. BROOKER, J. R. FITZSIMMONS, H. F. BENNETT, AND R. C. MICK, J. Magn. Reson.
5 . J. C. HASELGROVE, V. H. SUBRAMANIAN, J. s. LEIGH, JR., L. GYULAI, AND B. CHANCE, Science 220,
6. L. D. HALL, V. RAJANAYAGAM, AND S. SUKUMAR, J. Magn. Reson. 61, 188 (1985). 7. P. A. BOTTOMLEY, T. B. FOSTER, AND R. D. DARROW, J. Magn. Reson. 59, 338 (1984). 8. M. R. BENDALL AND D. T. PEGG, Magn. Reson. Med. 2,91 (1985); M. R. BENDALL, J. Magn. Reson.
9. A. J. SHAKA, J. KEELER, M. B. SMITH, AND R. FREEMAN, J. Magn. Reson. 61, 175 (1985).
283, 167 (1980).
50, 339 (1982).
1170(1983).
59,406 (1984).
10. R. TYCKOAND A. PINES, J. Magn. Reson. 60, 156 (1984). 11. J. F. MARTIN AND C. G. WADE, J. Magn. Reson. 61, 153 (1985). 12. P. C. LAUTERBUR, D. N. LEVIN, AND R. B. MARR, J. Magn. Reson. 59, 536 (1984) and J. HAS-
13. P. MANSFIELD, Magn. Reson. Med. 1, 370 ( 1 984). 14. D. I. HOULT, J. Magn. Reson. 33, 183 (1979). 15. A. HAASE, C. MALLOY, AND G. K. RADDA, J. Magn. Reson. 55, 164 (1983); P. STYLES, C. A. SCOTT,
16. M. GARWOOD, T. SCHLEICH, G. G. MATSON, AND G. ACOSTA, J. Magn. Reson. 60, 268 (1984). 17. D. 1. HOULT AND R. E. RICHARDS, J. Magn. Reson. 24,71 (1976). 18. A. BAX in “Two-Dimensional Nuclear Magnetic Resonance in Liquids.” Reidel, Dordrecht, 1982. 19. T. SCHLEICH, J. A. WILLIS, AND G. B. MATSON, Exp. Eye Res. 39,455 (1984). 20. G. B. MATSON, T. SCHLEICH, C. SERDAHL, G. ACOSTA, AND J. A. WILLIS, J. Magn. Reson. 56, 200
21. J. J. H. ACKERMAN, M. LOWRY, G. K. RADDA, B. D. Ross, AND G. G. WONG, J. Physiol. 319,65
22. B. K. URBAITIS AND R. H. KESSLER, Nephron 6,217 (1969). 23. R. S. BALABAN, D. G. GADIAN, G. K. RADDA, AND G. G. WONG, J. Analyf. Biochem. 116,450 (1981). 24. F. G. TOBACK, N. G. ORDONEZ, S. L. BORTZ, AND B. H. SPARGO, Lab. Invest. 34, 115 (1976). 25. M. KNEPPER AND M. BURG, Am. J. Physiol. 244, F579 (1983). 26. W. G. GUDER AND B. D. Ross, Kidney Int. 26, 101 (1984). 27. N. F. JONES AND L. G. WELT, Am. J. Physiol. 212, 939 (1967). 28. A. MANITIUS, H. LEVITIN, D. BECK, AND F. H. EPSTEIN, J. Clin. Invest. 39, 684 (1960). 29. R. P. DAVIS, in “Renal Metabolism and Epidemiology of Some Renal Diseases” (J. Metcog Ed.), p.
30. Q. AL-AWQATI, Am. J. Physiol. 235, F77 (1978). 31. T. E. DIXON AND Q. AL-AWQATI, J. Biol. Chem. 255, 3237 (1980).
ELGROVE, K. GILBERT, AND J. S. LEIGH, Magn. Reson. Med. 2, 195 (1985).
AND G. K. RADDA, Magn. Reson. Med. 2,402 (1985).
(1984).
( I98 1).
114, National Kidney Foundation, New York, 1960.
Related Documents


![Photovoltaics International Ion implantation for …...continuous flux and dose rate [27]. Heavier ions, such as phosphorus, create more damage per ion and therefore require lower](https://static.cupdf.com/doc/110x72/5ed45766d83ad958f471bc86/photovoltaics-international-ion-implantation-for-continuous-flux-and-dose-rate.jpg)
