1 Local Tax for Local People: geographical variances in Council Tax and the idea of fairness University of Sheffield, Department of Geography Social and Spatial Inequalities Liane Hoogland, [email protected] December 2010

Welcome message from author
This document is posted to help you gain knowledge. Please leave a comment to let me know what you think about it! Share it to your friends and learn new things together.
Transcript
1
Local Tax for Local People:
geographical variances in Council Tax and the idea of fairness
University of Sheffield, Department of Geography Social and Spatial Inequalities Liane Hoogland, [email protected] December 2010
2
Summary The British Coalition Government emphasises the notion of fairness. Yet the system of local taxation, the Council Tax, is regressive and has uneven geographical outcomes, the extent of which only become visible at microgeographic level. Council tax is also an example of the hidden issue of fiscal welfare. This paper argues there is an urgent need for a revision of the system if the government wants to ensure a fairer system of local taxation. The policy debate thus far has been framed in such a way that the regressivity of the tax is not widely acknowledged in the media or politics or maybe even understood. One of the suggestions is to use human cartograms to improve the communication about the fairness of Council Tax and to use micro-simulation models to look at ability to pay. The government of Northern Ireland focused on “Targeting Social Needs” when they introduced a new system of local taxation in April 2007. Such a focus would be welcome for the proposed review of local taxation.
Introduction Local taxation almost by definition produces differences in geographical outcomes1. This paper looks at the English regional and local variations of Council Tax2; and uses the case study of Cardiff in Wales to show how a revaluation and adding of an extra Council Tax band does not necessarily produce a more equal outcome. Ability to pay is closely linked to the idea of fairness, and the planned 10 per cent budget cut in Council Tax Benefit will have an effect3
which could be exacerbated by the expected job losses in 2011. It is estimated that over two million predominantly low income households struggle to pay council tax (Orton 2006).
This paper will first give a brief overview of the history of council tax and its nature. It then discusses the academic critique it has attracted. It will then move to show the impact of the revaluation in Cardiff, Wales and map some of the outcomes, which shows a need for looking at local taxation issues at a “micro-geographical” perspective rather than at e.g. ward-level. In the conclusion, an alternative focus and system is advocated.
A brief history of council tax The Council Tax was introduced in 1993 to replace the highly unpopular and short-lived Community Charge or “poll tax” as it was commonly referred to. The poll tax was a service charge per person and was fiercely contested, culminating in the poll tax riots in 19904. Its predecessor, domestic property rates, was based upon a multiple of the realizable annual private sector rent, the rateable value. The Council Tax is primarily a property tax, but also has personal elements in it and can thus be seen as a hybrid tax5
. I will briefly describe the principles of the system and refer to Appendix A for a fuller explanation.
The Council Tax system in England has its own jargon of banding, gearing, damping, tilting, ratios, rates and local rates6 and almost every element of the system has been criticized, including the initial process of valuation (see for example Longley et al 1996) and the subsequent discussions about the desirability and impact of a revaluation (Plimmer et al 1999, Muellbauer and Cameron 2000, Jones et al 2006). Even before its introduction in 1993, the tax attracted criticism from academics from different disciplines for its regressivity and lack of both horizontal and vertical equity7
.
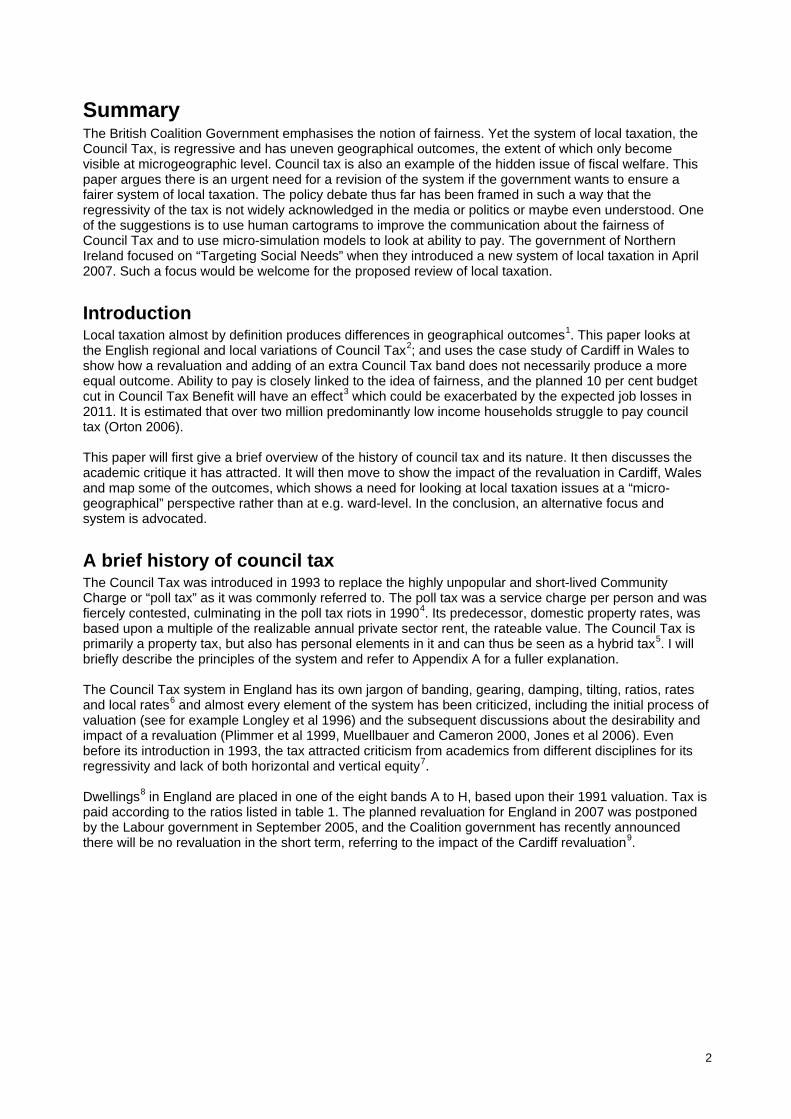
Dwellings8 in England are placed in one of the eight bands A to H, based upon their 1991 valuation. Tax is paid according to the ratios listed in table 1. The planned revaluation for England in 2007 was postponed by the Labour government in September 2005, and the Coalition government has recently announced there will be no revaluation in the short term, referring to the impact of the Cardiff revaluation9
.
3
Band and Ratio
England (based on 1991)
average national council tax per
dwelling
chargeable dwellings per
Band (England)
estimated regional
revenue per band (2010/11)
Band A (6/9) Under £40,000 £796 25.0% £4,375,679,858 Band B (7/9) £40,001-£52,000 £929 19.5% £3,981,868,671 Band C (8/9) £52,001-£68,000 £1,062 21.7% £5,064,120,155 Band D (9/9) £68,001-£88,000 £1,195 15.3% £4,016,874,109 Band E (11/9) £88,001 -£120,000 £1,460 9.4% £3,016,301,982 Band F (13/9) £120,001-£160,000 £1,725 5.0% £1,896,127,938 Band G (15/9) £160,001-£320,000 £1,991 3.5% £1,531,487,950 Band H (18/9) Over £320,000. £2,389 0.6% £315,048,950
Table 1: Council Tax in England. Calculations are based upon CLG information of collection rates and chargeable dwellings as they were known at the end of September 2009. The average national council tax rate per dwelling is calculated by dividing the expenditure by number of dwellings and thus does not reflect regional and local differences in dwellings per band, or costs and uptake of Council Tax Benefit.
Local Tax rates can differ by £ 700 per year10
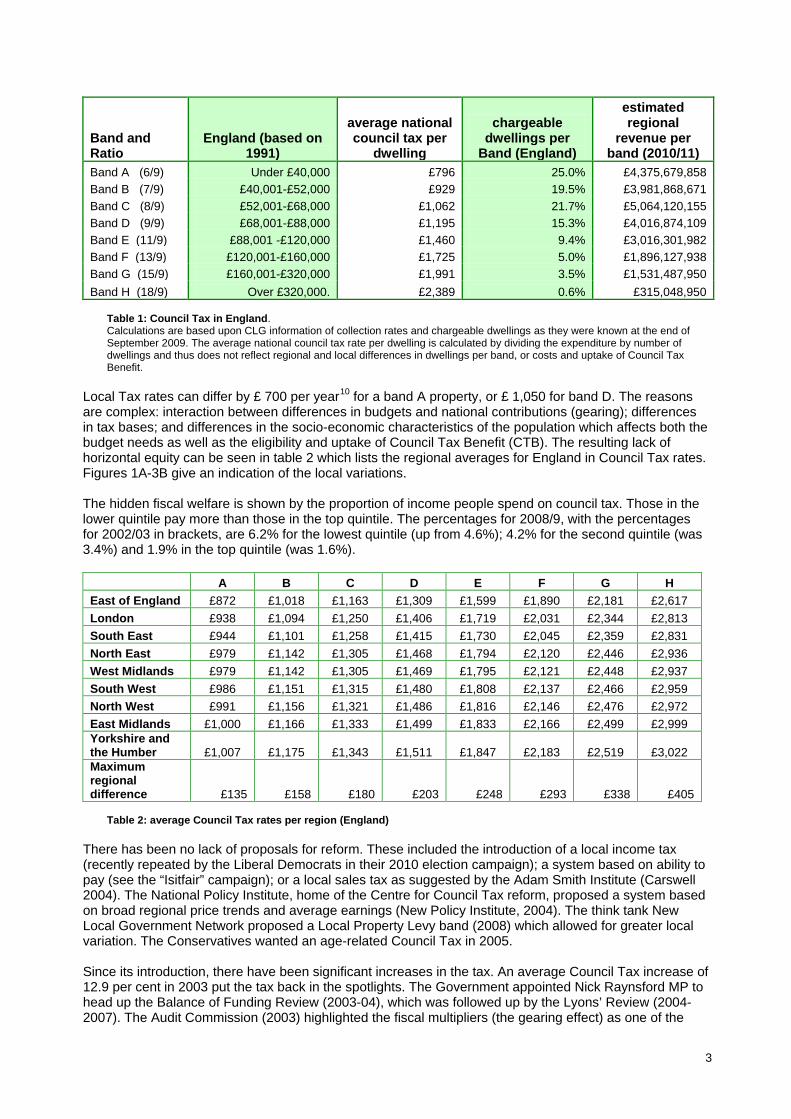
for a band A property, or £ 1,050 for band D. The reasons are complex: interaction between differences in budgets and national contributions (gearing); differences in tax bases; and differences in the socio-economic characteristics of the population which affects both the budget needs as well as the eligibility and uptake of Council Tax Benefit (CTB). The resulting lack of horizontal equity can be seen in table 2 which lists the regional averages for England in Council Tax rates. Figures 1A-3B give an indication of the local variations.
The hidden fiscal welfare is shown by the proportion of income people spend on council tax. Those in the lower quintile pay more than those in the top quintile. The percentages for 2008/9, with the percentages for 2002/03 in brackets, are 6.2% for the lowest quintile (up from 4.6%); 4.2% for the second quintile (was 3.4%) and 1.9% in the top quintile (was 1.6%).
A B C D E F G H East of England £872 £1,018 £1,163 £1,309 £1,599 £1,890 £2,181 £2,617 London £938 £1,094 £1,250 £1,406 £1,719 £2,031 £2,344 £2,813 South East £944 £1,101 £1,258 £1,415 £1,730 £2,045 £2,359 £2,831 North East £979 £1,142 £1,305 £1,468 £1,794 £2,120 £2,446 £2,936 West Midlands £979 £1,142 £1,305 £1,469 £1,795 £2,121 £2,448 £2,937 South West £986 £1,151 £1,315 £1,480 £1,808 £2,137 £2,466 £2,959 North West £991 £1,156 £1,321 £1,486 £1,816 £2,146 £2,476 £2,972 East Midlands £1,000 £1,166 £1,333 £1,499 £1,833 £2,166 £2,499 £2,999 Yorkshire and the Humber £1,007 £1,175 £1,343 £1,511 £1,847 £2,183 £2,519 £3,022 Maximum regional difference £135 £158 £180 £203 £248 £293 £338 £405
Table 2: average Council Tax rates per region (England)
There has been no lack of proposals for reform. These included the introduction of a local income tax (recently repeated by the Liberal Democrats in their 2010 election campaign); a system based on ability to pay (see the “Isitfair” campaign); or a local sales tax as suggested by the Adam Smith Institute (Carswell 2004). The National Policy Institute, home of the Centre for Council Tax reform, proposed a system based on broad regional price trends and average earnings (New Policy Institute, 2004). The think tank New Local Government Network proposed a Local Property Levy band (2008) which allowed for greater local variation. The Conservatives wanted an age-related Council Tax in 2005. Since its introduction, there have been significant increases in the tax. An average Council Tax increase of 12.9 per cent in 2003 put the tax back in the spotlights. The Government appointed Nick Raynsford MP to head up the Balance of Funding Review (2003-04), which was followed up by the Lyons’ Review (2004-2007). The Audit Commission (2003) highlighted the fiscal multipliers (the gearing effect) as one of the
4
main factors that caused the increase. It took until March 2007 for Sir Michael Lyons to present his final report of the Lyons’ Inquiry into Local Government, which was accompanied by the statement: “I have also concluded that council tax is not 'broken', but is seen as unfair and has been put under too much pressure.” (original emphasis). At the time of writing, the Coalition government does not seem to have plans to replace the system but it has announced it will undertake another local taxation review.
Banding and Framing The brief history painted above focuses on ‘public’ critique. Alvanides (2004) provides a useful overview of the academic discussion in the first 10 years of its existence, drawing from fiscal studies, housing studies and more particular property management studies and showed a lack of geographical appreciation in the discussion on Council Tax. A year later, Orton (2005) examined the debate about the reform of local taxation. Working together with Davies, he expanded on the idea of equity, inequality and fairness in 2009. They showed Tudor-Hart’s Inverse Care Law is applicable to Council Tax and used Titmuss’ Social Division of Welfare (SDW) to demonstrate Council Tax is an example of fiscal welfare which is hidden from the public and political debate. Interestingly, they highlighted the issue of ‘framing’ to provide a possible explanation of the lack of reform in the presence of experts’ critique: “concern with regressivity becomes obscured and ceases to be the focus of attention” (2009: 33). Framing refers to the fact that the way a problem or issue is presented, influences the way people perceive it and respond to it (see for example Entman 1993). In geography, this can be ‘translated’ into the idea of human cartograms: showing a map of the UK based on the size of an area therefore depicting London as a small place, will show a different picture than a map based on the number of people that are affected by the shown variable (see for example Ballas and Dorling, 2011). This can be seen in figures 1A to 3C with variables mapped in the conventional way, and using the Gastner and Newman diffusion technique. Many of the concerns mentioned in these recent papers were recognised from the onset. Hills and Sutherland (1991) predicted “the lack of commitment to regular revaluations means that “banding” could become seriously out of line with actual relative prices” (1991: 2, my emphasis). This critique on absence of revaluations and ratios has been repeated over the years. Jones et al analysed Scotland data and convincingly argued the multiplier rate should be challenged (2006a) and there is a “strong equity argument for frequent revaluations” (2006b: 219) even though the potential scale of change caused by such a process would be significant. However, framing the revaluation as the central problem, obscures the fact that a revaluation simply exposes a fundamental flaw in the system (Jones et al 2006b): the banding/tilting structure11
. Perhaps the reason the banding system was introduced in the first place - in an era where multi-level hedonistic price models and GIS where not widely available and time was of the essence - is the traditionally stated strength of its simplicity, although that claim can be contested (see Davis et al 2004 for a discussion).
GIS and multi-level hedonistic price models have developed to such an extent that they could be used to implement a different system. Orford’s research into modelling spatial structures in local housing market dynamics (2000), where he took into account the nature of the housing as well as the urban space context and stressed the importance of place and desirability in the working of (sub)markets; valuing location externalities (2002) and deriving floor-estimates from secondary data sources (2010) are examples of this.

5
Figure 1A: Conventional choropleth map of number of dwellings in England
Figure 1B: Human cartogram of number of dwellings in England
Figure 2A: Conventional choropleth map of number of dwellings in band A to C in England
Figure 2B: Human cartogram of number of dwellings in band A to C in England

6
Figure 3B: Human cartogram of Council Tax rates Figure 3A: Conventional choropleth map of Council Tax rates in England
7
Alternatives Empirical research into a comparison between the rating system in Derry City Council (Northern Ireland), an alternative banding system or a property-specific discrete-value system showed the latter provides for a fairer, more equitable local tax (McCluskey et al, 2007). The research would have to be repeated in England to make any firm claims, but it seems not inconceivable that similar results would be found in England. In Northern Ireland, Targeting Social Need (TSN) was adopted as a specific policy development consideration in 1998. It aims to tackle social exclusion and was used to assess the impact of different valuation systems on areas with high deprivation. As a result, a discrete capital value system was introduced on 1st April 2007. In England, social need and tackling social exclusion has not been a central consideration in the Council Tax discussion. The political focus is on the impact of revaluation and notably on the ‘asset-rich but income-poor’, even though Davies et al (2007) have demonstrated property values are overall a good indicator of the ability to pay taxes. Additionally, the fact that revaluation itself does not automatically lead to higher bills and can create ‘winners’ too, is hardly mentioned. Lastly, the decision to not do a revaluation, also creates winners and losers as the Lyons’ report acknowledged. An important note to make is that a system based on regional price trends and average earnings, as proposed by the New Policy Institute, home of the Centre for Council Tax reform (New Policy Institute, 2004), would not be a solution. Whilst at first glance this looks like an attractive idea which addresses the uneven development in house prices (both geographically and in terms of type of houses) Jones et al (2006) pointed towards limitations in this research approach and the potentially misleading view of the impact of a revaluation: “the major limitations […] lie in the use of regional house prices and the lack of authority resource equalisation model. The use of regional house price trends ignores variations in intra-regional house price trends” (2006a: 211). The body of evidence presented above can make one doubt Sir Michael’s statement that the council tax is not broken. We now turn to the case study of Cardiff to assess the impact of the revaluation and addition of an extra band in Wales.
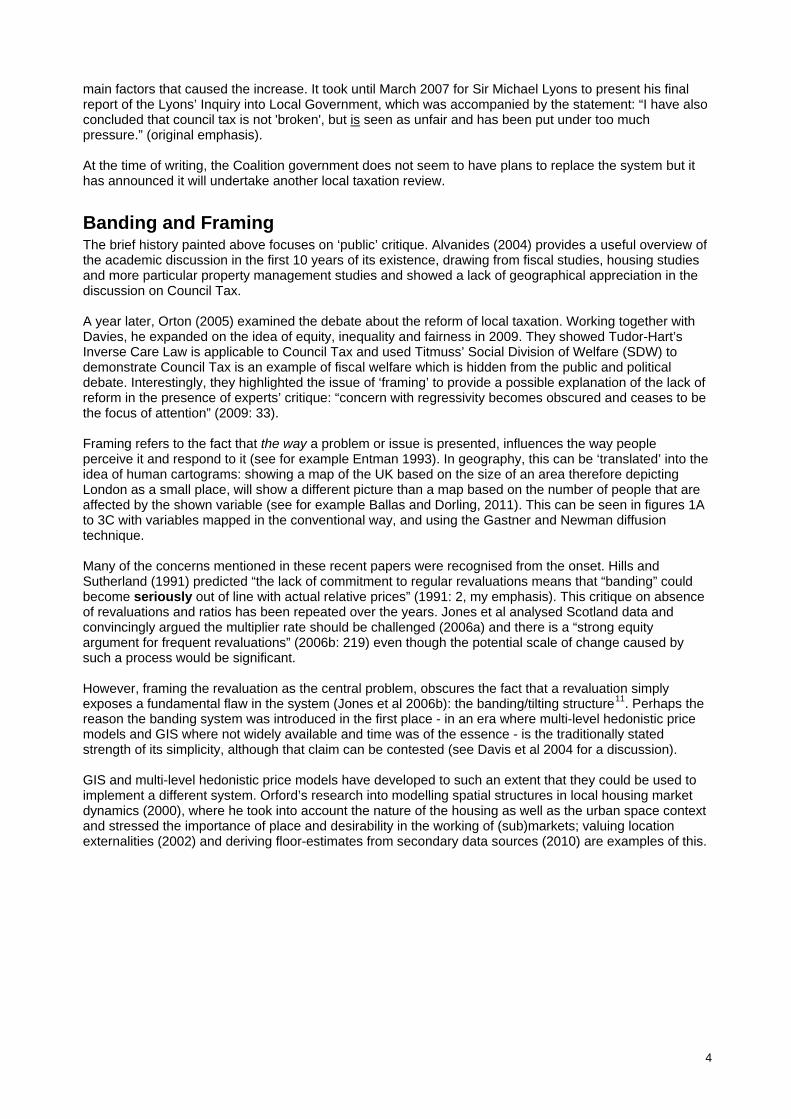
‘Winners’ and ‘losers’ of the Cardiff revaluation Wales introduced new Council Tax bands in April 2007, based upon 2005 revaluations. An extra band was added. Approximately 1 in 4 Welsh properties ended up being reclassified into a higher band. Transitional relief was available for those whose property went up by 2 or more bands. The band-widths for the bands C to G remained the same, and it was slightly widened for Band B. Note how whilst the width remained largely the same, the increases between the bottom and top ends of the bands vary.
Band 2005 1993 Band A Under £44,000 Under £30,000 Band B £44,001-£65,000 £30,001 - £39,000 Band C £65,001-£91,000 £39,001 - £51,000 Band D £91,001-£123,000 £51,001 - £66,000 Band E £123,001 -£162,000 £66,001 - £90,000 Band F £162,001-£223,000 £90,001 - £120,000 Band G £223,001-£324,000 £120,001 - £240,000 Band H £324,001- £424,000 Over £240,001 Band I Over £424,001 n/a Table 3: Wales Council Tax bands, 2005 and 1993

8
Methodology Using data from the original Council Tax register, house price data until 2009, and an extract of 1,000 houses listed on the website Nestoria, I will show the impact of the revaluation and a very rough estimate of the outcomes of an alternative system. The 1993 register contained 136,984 addresses; the 2005 register 148,029. Using an Access query, I matched 135,665 addresses for 1993 to the 2005 list. A small selection could not be matched (1,319), perhaps as a result of demolition. The postcodes CF1, 2, 55, 72 and 83 were excluded as they represent only a small number of addresses. To enable calculations, band A was coded as 100, band B as 200, etcetera. This also highlighted areas with a high standard deviation, signifying a mixture of cheaper and more expensive properties. The most homogenous area was CF24 whilst there were distinct differences in CF23. These are likely to be caused by expensive infill purpose-built flats (see also Longley et al 1996). The remaining dataset with 147,994 addresses were aggregated to postcode level (6,304) and from there to output area (991) using SPSS. Changing boundaries and anomalies meant there was a minor loss of addresses in this process (less than 100). The output areas were consequently aggregated up to the 2001 ward level (30) which allowed me to map ‘winners’ and ‘losers’ on both output area level and ward level. The Council Tax rates in Cardiff are not displayed as they are very similar in all areas, with a difference of only £15.17 per annum between the cheapest (several) and the most expensive area (Pentyrch). The difference between the bands A to D is £119.30 per annum i.e. £ 9.94 per month.
Table 4: changes in number of dwellings in bands (Cardiff)
Band A Band B Band C Band D Band E Band F Band G Band H Band I total 1993 9,881 30,109 36,839 23,140 21,271 8,089 7,013 642 0 136,984 2005 4,026 17,131 30,201 34,122 28,672 20,408 9,592 2,556 1,321 148,029 change -5,855 -12,978 -6,638 10,982 7,401 12,319 2,579 1,914 1,321

9
Figure 4: average distribution of Council Tax bands in Cardiff wards (2001)
The picture of the revaluation impact differs widely, depending on geographical level. In Cardiff, 96,882 properties were upgraded; 3,055 properties got downgraded one band12
.The outer postcode level (table 5) masks important differences, as does the ward level above (figure 4 and 5). Only once you start looking at output area level (figures 6 - 9), the complexity is starting to emerge. This is relevant as it may influence the way politicians perceive the situation when looking at their constituency as a whole, and because many income and deprivation indicators are only available at a higher geographical level and not necessarily at the right personal level (household, benefit unit, individual). This makes it difficult to make any statements about ability to pay by using nationally available data and shows the need for a micro-geographical analysis.
down same up total new CF 3 870 9,691 5,725 16,286 784 CF 5 589 12,301 14,264 27,154 850 CF 10 152 1,501 6,417 8,070 2,690 CF 11 164 1,842 14,133 16,139 2,121 CF 14 542 9,414 22,832 32,788 2,022 CF 15 187 2,275 3,336 5,798 550 CF 23 126 6,780 12,114 19,020 1,220 CF 24 467 4,208 18,061 22,736 2,120 total 3,097 48,012 96,882 147,991 12,357 %change 2.09% 32.44% 65.46% 100.00% 8.35%
Table 5: average band changes after revaluation, postcode district Figure 5: average band changes after revaluation, ward
The Household Below Average Income dataset contains variables such as Council Tax liability, Council Tax Benefit, income and earnings data as well as tenure type and housing costs, yet it is only available at regional level. Income estimates are available at middle super output area level, yet again, this level is inappropriate to highlight the individual differences. The Index of Multiple Deprivation could give a rough indication of where people with ability to pay live – although it does not say anything about income and eligibility for Council Tax Benefit. The same warnings apply to the geodemographic Output Area Classification (OAC). Similarly, it would be too crude to assume that people in work would have ability to pay and people out of work do not. Looking at IMD, OAC and economic status in conjunction can at best give a sense of ability to pay and the tax burden. Given these arguments, I decided to only include a map of OAC. Note how in the Northeast, band increases for ‘Blue Collar Communities’ and the ‘Constrained by Circumstances’ are significant. It falls outside the context of this paper to do complex micro-simulations but this may be an interesting point for further research (see for example Smith et al 2009).

10
Figure 6: average Council Tax band, output area level
Figure 7: average average band changes after revaluation, output area level

11
Figure 9B:
detailed map Council Tax band on output area level
Figure 8: Supergroups in Cardiff
Figure 9A: reference map Council Tax wards

12
Figure 9C: detailed map winners and losers, output area level
Figure 9D: OAC supergroup, output area level
An alternative system In the absence of a full list of exact housing values, I have used Nestoria sales listings in December 2010 to estimate the impact of a discrete-value system. Houseprice data for Cardiff shows the overall change between 2005 and 2009 was 8.65%13
. I have assigned a Council Tax band to the 1,000 listings, applying a 10% increase. The listings are not representative of Cardiff, with a relatively high proportion of properties in the higher bands up for sale, yet it is interesting to look at the potential impact of moving to a different system. In the sample of 1,000 properties, moving to a discrete value system would create 618 ‘winners’ and 382 ‘losers’. The biggest ‘winners’ would be people living in cheaper properties but perhaps surprisingly, there would be winners in the current bands E, F and G as well. The numbers suggest the potential revenue for the city of Cardiff could increase whilst it is likely that the costs on Council Tax Benefit would decrease.
This preliminary calculation indicates that a detailed analysis of current houseprices, Council Tax revenue, and Council Tax Benefit recipients and costs, and comparing these with the outcomes of a discrete-value system, could provide an interesting picture of both the ‘ability to pay’ for individuals and the ‘ability to collect’ for the council.
Assigned band Houseprice Current Council Tax Tax if 0.7% value Difference Number of
properties A 48,225.00 £721.38 £337.58 £383.81 2 B 63,927.50 £841.61 £447.49 £394.12 20 C 93,539.06 £961.84 £654.77 £307.07 65 D 122,342.40 £1,082.07 £856.40 £225.67 156 E 157,939.24 £1,322.52 £1,105.57 £216.95 225 F 214,791.98 £1,562.99 £1,503.54 £59.45 215 G 296,876.55 £1,803.45 £2,078.14 -£274.69 165 H 417,949.87 £2,164.14 £2,925.65 -£761.51 75 I 738,522.66 £2,524.83 £5,169.66 -£2,644.83 77
Estimated current revenue £1,537,498.99 1,000 Estimated potential revenue £1,718,179.22
Table 6: estimated impact of changing to a discrete value system, based upon 1,000 Nestoria sales listings. The assigned bands rather than the postcodes were used as the defining variable as the postcode districts showed high standard deviations. The table suggests there would be 317 ‘losers’ rather than the 382 in the original dataset.
13
Conclusion The Council Tax was introduced in response to riots about another local tax that was widely seen as unfair. This paper has listed many of the earlier claims about the unfairness of Council Tax and shown how a revaluation and/or an adding of a band does not change this intrinsic systematic problem. Framing the discussion about the Council Tax around the idea of revaluation produces a limited view. Multi-level hedonistic price models make it possible to implement a discrete value system. To truly assess the fairness of Council Tax, it is necessary to have a geographical and interdisciplinary outlook on property, places and people. Its impact is only truly visible at a hyperlocal level and lack of income data at that level makes it necessary to use sophisticated models to assess the impact of any local taxation at a national level. In addition, the national-local arrangements need to be taken into account. The estimates suggest that no less than two million households are already struggling to pay council tax, and this number could easily rise with the proposed budget cuts and the cuts in Council Tax Benefit. At the time of the Lyons’ review in 2006, Jones et al commented that “central government appears to be in a state of blissful ignorance judged by its contributions to the recent debate on local government finance” (Jones et al, 2006b: 233). Central government has the chance to put this right in the announced new review of local taxation, and if it is concerned about ‘fairness’, it could do worse than follow the example of Northern Ireland and put Targeting Social Needs at the core of this review.
Acknowledgements The Council Tax data and OAC data used in this paper are Crown Copyright and are produced by the Office for National Statistics. The shapefiles were accesses through UK Borders online, via the Data Archive by EDINA, supported by the University of Edinburgh. The conversion files used were accessed online through GeoConvert (Manchester Information and Associated Services MIMAS, supported by the University of Manchester. Original Cardiff Council Tax data were provided by the Corporate Revenues Section, Cardiff Council. The house price listings were sourced from Nestoria, http://www.nestoria.co.uk. The human cartograms are based on the Gastner and Newman diffusion technique, using the Scapetoad program.
Notes 1 This is not a UK-specific issue. For example, in the Netherlands, the municipality of Zaanstad charges € 698 per annum for an average household, whilst Alkmaar only charges € 480. See http://www.coelo.nl/ondermain.html for a graph which includes 37 municipalities. Please note the Dutch and UK system of local taxation are not comparable as the revenues are used to pay different costs; the system of discounts and rebates works differently; and only owners (not renters) pay the property-tax element in the Netherlands. 2 England, Wales and Scotland charge Council Tax, but with different bands. Northern Ireland introduced a discrete capital value system in April 2007. 3 The exact effects per local authority will vary widely and a detailed calculation falls outside the scope of this paper. Such an exercise needs to take into account factors like the complex nature of local taxation (e.g. differences in national contribution and the Barnett formula) and the potential impact of job losses on number of households eligible for Council Tax Benefit. Tom Clark, the Guardian’s leader writer on social affairs, asked the question: will the coalition unleash new poll tax protest? http://www.guardian.co.uk/society/joepublic/2010/oct/26/coalition-council-tax-protests 4 See for example http://www.youtube.com/watch?v=FRj2K0ulD8Q. 5 It is in part a property tax (it is based upon the value of a property); a poll tax (bills depend on the number of liable adults in a household), a ‘household tax’ (some tax can be payable even if there are no liable adults, for example if a property is empty); and the system of Council Tax Benefits make it partly an income tax. (Hills and Sutherland, 1991) 6 Rates is used to show the tax as a percentage of the value. An example: Council Tax for a Band D property in locality X is £ 900, meaning someone in a band A property which was valued at £ 40,000, is £ 600 per annum, or 1.5% of its value. A person living in a band H property worth £ 400,000, in that same locality, pays £ 1,800 per annum, or 0.45%. ‘Tilting’ refers to the fact the tax is not directly proportional to the property value, but gets ‘tilted’ to a higher rate when it is classified in a higher band and can therefore imply a significant increase in tax. A very basic introduction to local finance can be found on the last two pages of http://www.communities.gov.uk/documents/localgovernment/pdf/1796186.pdf. 7 Horizontal equity means that everyone in the same position pays the same amount of tax. Vertical equity relates to the idea that the strongest shoulders carry the most weight, ie people who are better off pay more than those with less “wealth'”. Plimmer stated in 1999: “It should be evident that the Council Tax fails to reflect both horizontal and vertical equity. Horizontal equity is limited both because of the banding of values, and the breadth of the bands, particularly at

14
the two extremes of high and low value properties; and because of the failure to revalue properties to reflect the relative shifts in property prices since the valuation year of 1991. Vertical equity is similarly restricted and additionally so because of the centrally-imposed relative tax burdens between the bands, taxpayers in Band A paying two thirds of the amount paid by those in Band D who pay only half of the amount paid by those in the highest Band.” 8 A property (house or building) can be split into multiple dwellings (flats, bedsits). For ease of reading, I have chosen to use the word property rather than dwelling. The numbers used throughout will however refer to dwelling unless stated otherwise. 9 Of course the decision not to do a revaluation, has its own winners and losers. The Lyons’ report acknowledged this. 10 A property in band A would attract a low rate in Wandsworth, Manchester and Westminster in the 2010/11 tax year (£ 431, £ 512 and £ 512.33 respectively) whilst someone living in a band A property in Elmbridge, South Bucks or Richmond upon Thames would pay more than double that amount (£ 1,128; 1,136.67 and £ 1,153.33 respectively). I have not been able to find any comments on the spending of the tax (should housing and council tax benefits be paid out of national spending rather than local spending?) and little debate on whether the tax should only be taken from owners and not renters. 11 Perhaps surprisingly, a recurrent finding is that a system with more bands does not produce a much more progressive outcome (Hills and Sutherland 1991; Davis et al 2004; Jones et al 2006a), mostly as there are only few properties at the top end of the scale. 12 This number excludes properties that got downgraded by more than one band as the addresses signified this was usually the result of a property being split up in flats. 13 Land Registry data accessed via http://www.proviser.com/regional/towns/cardiff/property_prices/annual_increase/
References Alvanides S, 2004, “A decade of council tax inequities? Geographical perspectives and a research agenda'' Area 36 (1) 41 - 49 Ballas D., Kingston R., Stillwell J., 2007 “Building a spatial microsimulation-based planning support system for local policy making”. In: Environment and Planning A 39, 2482 -2499 Ballas, D., Dorling, D. (2011), Human Scale Visualisations and Society, in Nyerges, T, Couclelis, H, McMaster, R (eds.), The SAGE Handbook of GIS & Society Research, Sage. Barnard A., 2010, “The effects of taxes and benefits on household income, 2008 - 09'' Economic & Labour Market Review 4 (7) 36 - 47, Office for National Statistics, London Davies, R., Orton, M. and Bosworth, D. (2007) “Local taxation and the relationship between incomes and property values” Environment and Planning C: Government and Policy 25 (5) 756–772 Davis P. T., McCluskey W. J. and Lim L. C., 2004, “Residential property taxation: a capital value banding approach”, Journal of Property Tax Assessment and Administration 1 (3) 51 - 64 Entman, R.M., 1993. "Framing: Toward Clarification of a Fractured Paradigm." Journal of Communication 43 (4): 51-8. Giles G., Ridge M, 1993 Right thisTime? An Analysis of the First Year's Council Tax Figures, Institute for Fiscal Studies London Hills J., Sutherland H.,1991. Banding, Tilting, Gearing, Gaining and Losing: An Anatomy of the Proposed Council Tax Suntory Toyota International Centre for Economics and Related Disciplines, LSE, London Jones C., Leishman C., Orr A. M., 2006a, “The potential impact of reforms to the essential parameters of the Council Tax'' Fiscal Studies 27 (2) 205 - 229 Jones C.., Leishman C., Orr A. M. 2006b, “The revaluation of council tax bands – more than rearranging the deck chairs” Policy & Politics 34 (2) 219 - 239 Kenway P. and Palmer G. 1999, Council Tax: The Case for Reform: New Policy Institute, London Kenway P., Palmer G., 2003, Council Tax: the answer? The Centre for Council Tax Reform, London Longley P. A., Martin D., Higgs G., 1993, “The geographical implications of changing local taxation regimes” Transactions of the Institute of British Geographers, New Series 18 (1) 86 – 101 Longley P. A., Higgs G., Martin D.,1996, “The rates revisited? A geographical reassignment of property valuations and local tax burdens under the council tax'' Environment and Planning C: Government and Policy 14 101 - 120 Lyons M. 2007, Place-shaping: A Shared Ambition for the Future of Local Government’, Report of the Lyons Inquiry into Local Government. Communities and Local Government and HM Treasury; London: Lakin C, 2004, “The effects of taxes and benefits on household income, 2002 - 03'' Economic Trends 607 39 - 84, Office for National Statistics, London
15
McCluskey W. J., Lim L. C., Davis P. T., 2007, "Domestic rate reform in Northern Ireland: a critical review of policy options" Environment and Planning C: Government and Policy 25(1) 131 – 149 McCluskey W. J., Davis P. T., Lim L. C., 2007, “Residential Property Tax Reform in Northern Ireland: Impact Analysis and Spatial Redistribution” Journal of Property Tax Assessment & Administration • 4 (3) 59 - 70 Muellbauer J. and Cameron G. 2000, “Five key council tax reforms and twelve reasons to enact them”, New Economy, vol. 7, no. 2, pp. 88–91 Orford S., 2000, “Modelling spatial structures in local housing market dynamics: a multi-level perspective'' Urban Studies 37 (9) 1643 - 1671 Orford S., 2002, “Valuing locational externalities: a GIS and multilevel modelling approach'' Environment and Planning B: Planning and Design 29 105 - 127 Orford S., 2010, "Towards a data-rich infrastructure for housing-market research: deriving floor-area estimates for individual properties from secondary data sources" Environment and Planning B: Planning and Design 37(2) 248 – 264 Orton, M. 2004 ‘Wealth rich but income poor’? The relationship between household income and property value, Warwick Institute for Employment Research, Coventry. Orton M., 2005, “Inequality and the reform of a regressive local tax: the debate in the UK'' Social Policy and Society 4 (3) 255 - 272 Orton, M. 2006, “Struggling to pay council tax: A new perspective on the debate about local taxation” Joseph Rowntree Foundation, York Orton M, Davies R., 2009 “Exploring Neglected Dimensions of Social Policy: The SDW, Fiscal Welfare and the Exemplar of Local Taxation in England”, Social Policy & Administration 43 (1) 33 – 53 Plimmer F. 1999, “The council tax: the need for a revaluation”, Journal of Property Tax Assessment and Administration, vol. 5 (1), pp. 27–39. Smith D. M., Clarke G. P., Harland K., 2009, "Improving the synthetic data generation process in spatial microsimulation models" Environment and Planning A 41(5) 1251 – 1268 Sorabji D., 2008, Escape from Council Tax. Curing the symptoms of failure. An NLGN Paper, London
Additional Sources Anderson B. 2007, Creating small-area Income Estimates: spatial microsimulation modelling. Chimera, University of Essex, prepared for Department for Communities and Local Government: London Callan T., Keane C., Walsh J.R., 2010 “What Role for Property Taxes in Ireland?” The Economic and Social Review 41 (1) 87 – 107 Department of Finance and Personnel, Northern Ireland Assembly, 2007 Outcome of NI Executive’s 2007 Review of Domestic Rating System, Belfast Institute for Fiscal Studies, 2010 Observations: The Conservative’s party council tax freeze. http://www.ifs.org.uk/publications/4780, accessed 9 December 2010 Martin D., Longley P., Higgs G., 1992 “The geographical incidence of local government revenues: an intra-urban case study” Environment and Planning C, 10 (3) 253 – 265 McCluskey W.J., Plimmer F., Connellan O. P., 1998, “Ad valorem property tax: issues of fairness and equity'' Assessment Journal 5 47 - 55 Rosenthal L., 1999, “House prices and local taxes in the UK'' Fiscal Studies 20 (1) 61 - 76 Sirmans, G. et al, 2006 “The Value of Housing Characteristics: A Meta Analysis”, The Journal of Real Estate Finance and Economics, 33 (3) 215-240

16
Appendix A: Council Tax Council Tax is collected by local authorities with certain proportions (‘precepts’) distributed to other authorities, and based upon dwellings. The Valuation Office Agency is responsible for the valuation of properties. Income from Council Tax varies per authority, and the effects of increases in spend (and presumably the decreases in budget) on the necessary increase in council tax rate, differ. This is called ‘gearing’: a £ 1 increase in spend can lead to an increase in the rate varying from £ 2 to £ 12 (Giles and Ridge, 1993). ‘Damping’ is the mechanism in place to reduce effects of changes from year to year. There are 8 bands, ranging from A to H, which are based on the value of the properties in 1991. Originally, the aim was to undertake a revaluation-exercise every 5 years. However, like the Labour government before, the current Coalition government has decided not to do a revaluation. Band D is the ‘average’ property and this band gets quoted in press releases and yearly updates on the Council Tax. The ratios are derived from this band; with properties in band A paying 6/9 of the band D value, and properties in band H paying 18/9. Thus someone living in a band H property, pays 3 times more than anyone who is liable in a band A property. Local differences in Council Tax rates can be significant, due to a combination of factors. There is a system of discounts (e.g. for single households or disabled people) and people on low incomes can apply for Council Tax Benefit (CTB). Empty properties usually attract 50% of the tax. The term Rate is also used to indicate the tax/property value percentage, which shows a lower rate for the higher valued properties. Up until the Coalition government came into power, local governments were not completely free in setting their council tax rates and there was a system of capping in place. The Coalition government is stimulating local governments to put in a council tax freeze for one year and has suggested to abolish the capping and instead give people the power to veto an increase above a certain treshold13.
Examples of proposed reforms are:
• the New Policy Institute has been active in its appeal for reform since 1999 and has a dedicated Centre for Council Tax reform (http://www.counciltaxreform.org/, supported by PCS, Unison, the Local Government Information Unit and the Joseph Rowntree Reform Trust);
• The campaign group Isitfair (www.isitfair.co.uk) was started in October 2002 as a local action group in Hampshire in response to the proposed increase in Council Tax bills for the year 2003/04.
• the Balance of Funding Review which took place between April 2003 and July 2004 was an almost direct consequence of high increases in Council Tax and looked at the balance of funding for local governments;
• its ‘successor’ the Lyons Review did acknowledge some problems yet concluded the system was not broken and put emphasis on not wanting to penalise asset-rich, income-poor people;
• the Adam Smith Institute advocated replacing it with a local sales tax (Carswell 2004);
• in 2006, the then-Conservative shadow local government secretary Caroline Spelman (now Secretary of State for the Department of Environment, Food and Rural Affairs) slammed the tax as 'the ultimate stealth tax';
• the think tank NLGN published a report with their options for alternatives in 2008 with the telling title “Escape from council tax”;
• before they entered government, the Liberal Democrats proposed to replace the tax with a local income tax.

17
Most of the critique focuses on at least two of the following issues:
1. Valuation: the original valuation was done in a short space of time (referred to as ‘second gear valuation’), using only 1 ‘beacon property’ to set the value for a whole street, and putting relatively modest pre WW1 properties in a higher band than for example council flats (Longley 1993).
2. Revaluation: house prices have changed dramatically since 1991. Changes have varied widely geographically, and different types of property have seen different grow rates (see for example Dorling et al, 2005). The current system does not reflect these changes.
3. Banding widths: the widths of band G and H are clearly less distinctive than those of the other bands. Hills and Sutherland showed that “the addition of bands in this kind of way would have relatively minor effects on the distributional consequences of the tax: too few properties would lie in the additional bands for much to change” (1991: 40) yet Kenway and Palmer (2003) showed this argument has changed.
4. Banding ratios: a steeper progression between the bands has been advocated by almost all academics and criticasters,
5. Regional bandings: the housing market has changed so profoundly since 1991, that these regional differences should be reflected in regional rather than national bands. (see for example Plimmer et at 2002, Kenway and Palmer 2003, Alvanides 2004).
Related Documents