HAL Id: halshs-00459137 https://halshs.archives-ouvertes.fr/halshs-00459137 Submitted on 23 Feb 2010 HAL is a multi-disciplinary open access archive for the deposit and dissemination of sci- entific research documents, whether they are pub- lished or not. The documents may come from teaching and research institutions in France or abroad, or from public or private research centers. L’archive ouverte pluridisciplinaire HAL, est destinée au dépôt et à la diffusion de documents scientifiques de niveau recherche, publiés ou non, émanant des établissements d’enseignement et de recherche français ou étrangers, des laboratoires publics ou privés. Local strength and global weakness: A maritime network perspective on South Korea as Northeast Asia’s logistics hub César Ducruet, S.W. Lee, Stanislas Roussin To cite this version: César Ducruet, S.W. Lee, Stanislas Roussin. Local strength and global weakness: A maritime network perspective on South Korea as Northeast Asia’s logistics hub. International Journal of Maritime Affairs and Fisheries, 2009, 1 (1), pp.32-50. halshs-00459137

Welcome message from author
This document is posted to help you gain knowledge. Please leave a comment to let me know what you think about it! Share it to your friends and learn new things together.
Transcript

HAL Id: halshs-00459137https://halshs.archives-ouvertes.fr/halshs-00459137
Submitted on 23 Feb 2010
HAL is a multi-disciplinary open accessarchive for the deposit and dissemination of sci-entific research documents, whether they are pub-lished or not. The documents may come fromteaching and research institutions in France orabroad, or from public or private research centers.
L’archive ouverte pluridisciplinaire HAL, estdestinée au dépôt et à la diffusion de documentsscientifiques de niveau recherche, publiés ou non,émanant des établissements d’enseignement et derecherche français ou étrangers, des laboratoirespublics ou privés.
Local strength and global weakness: A maritimenetwork perspective on South Korea as Northeast Asia’s
logistics hubCésar Ducruet, S.W. Lee, Stanislas Roussin
To cite this version:César Ducruet, S.W. Lee, Stanislas Roussin. Local strength and global weakness: A maritime networkperspective on South Korea as Northeast Asia’s logistics hub. International Journal of Maritime Affairsand Fisheries, 2009, 1 (1), pp.32-50. �halshs-00459137�

1
Local strength and global weakness:
A maritime network perspective on South Korea as Northeast Asia’s
logistics hub
Published in: KMI International Journal of Maritime Affairs and Fisheries, 1(1): 32-50
César Ducruet1
Researcher French National Centre for Scientific Research (CNRS) University of Paris I Sorbonne UMR 8504 Géographie-cités 13 rue du Four F-75006 Paris France Tel. +33 (0)140-464-007 Fax +33(0)140-464-009 Email: [email protected]
Sung-Woo Lee
Researcher Centre for Shipping, Logistics and Port Research Korea Maritime Institute Bangbae-dong Seoul Republic of Korea Tel: +82(0)2-2105-2830 Fax: +82(0)2-2105-2839 E-mail: [email protected]
Stanislas Roussin
General Manager & Head of Research Department SERIC COREE 1302 Byucksan Digital Valley V, 60-73 Gasan-dong, Geumcheon-gu, Seoul 153-801 Republic of Korea Tel: +82 (0)2-2082-5613 Fax: +82 (0)2-2082-5616 Email: [email protected]
Abstract: Port development in South Korea has taken advantage of the country‟s
remarkable situation and economic growth during the past decades. However, the
governmental „two-hub port strategy‟ is currently at stake because of fierce competition
from Chinese ports. Based on a global database on the daily movements of containerships,
this paper proposes an evaluation of the position of South Korean ports within Northeast
Asian liner networks in 1996 and 2006. Main results show that although Chinese ports
have increased substantially their position in the maritime system, South Korean ports
(notably Busan) still keep a dominant hub function in this region. However, a multi-scalar
analysis shows the limited global radiance of South Korean ports. Implications for policy
and further research are addressed.
Key Words: Asia, Betweenness, Centrality, Hub port, Liner shipping, Network analysis
1 Corresponding author

2
1. INTRODUCTION
Specialized on agricultural activities during the Japanese occupation (1905-1945),
devastated by the Korean War (1950-1953), and wrongly oriented on a import substitution
strategy between 1953 and 1961, the Republic of Korea (ROK, hereafter South Korea) was
at the beginning of the 1960s one of the poorest country in the World. A radical change in
the national economic policy propelled its GDP at the 14th
global rank in 2007. This shift
started in 1961 when the government adopted an outward-looking strategy forged on a
strong alliance between the Army (General Park Chung Hee ruled South Korea from 1961-
1979), and some few rich families, founders of the future chaebols (large Korean
conglomerates). The government collected foreign grants and soft loans, and through its
direct control on the local banks, supported the companies which followed its national
industrial plans and massively exported to developed countries such as United-States. The
authorities invested also a large amount of money in social infrastructures and modern
communication network, guaranteeing to the conglomerates a social peace based on the
repression of trade unions. In return, the ruling class beneficiated of various material
advantages provided by the chaebols. Rebounding with the democratization at the end of
the 1980s, the South Korean model achieved an incredible success. South Korea became
member of OECD in 1996 and its industry dominated several world industries such as
shipbuilding, DRAM or LCD panels.
Nevertheless, this strategy reached its limits in 1997 with the Asian financial crisis that
hardly affected an economy too much depending on loans without any clear control on the
corporate assets. Moreover, South Korea is not anymore a low-cost country. It is an
emerged economy, showing some early signs of maturity (population getting older very
quickly, delocalization of thousands factories to cheap labor countries such as China,
Vietnam, and India). Last but not least, South Korea is sandwiched between a high-tech
advanced Japan, a booming China, and a belt of under-developed states as Mongolia or the
constrained North Korea (KITA, 2006). To challenge this situation, South Korea decided
to improve its regional integration and to depend less on the United-States, which did not
provide strong support during the 1997 crisis. South Korea should recover its historical
role of bridge between China and Japan, but a role sustained by a modern and rich
domestic economy, also able to be a gateway between North-East Asia and the World
(Roussin, 2008). As a result, this paper will focus on this recent strategy of turning South
Korea into Northeast Asia‟s logistics hub (Song and Lee, 2006).
More specifically, this research wishes to verify to what extent South Korea is a hub for
this region. While many official reports have constantly promoted this hub strategy since
the late 1980s (Yoo, 2006), a recent in-depth review of the history and rationale of the
“two-hub port policy” that is based on Busan and Gwangyang ports offers a rather
pessimistic portrait about the competitiveness of South Korean ports (Lee and Kim, 2009).
Their performance in terms of traffic volume and traffic growth has lowered due to fierce
competition with neighbouring Chinese ports and other local ports. For instance, Chinese
ports of the Northeast provinces tend to use Qingdao instead of Busan for transhipping
their cargoes. In addition, some criticism has been expressed about the true potential of the
free-trade zone policy that creates huge development areas around South Korea‟s main
ports of Incheon, Busan, and Gwangyang for manufacturing and light industries (Ducruet,
2009). Such policies cannot avoid the shift of many South Korean manufacturing firms to
Southeast Asia and China, resulting in less local demand for port activities (Lee and Kim,
2006). Nevertheless, South Korean ports are actively engaged in modernisation of their
3
equipments so as to keep their technological advance and solve congestion problems
nearby main coastal cities (Frémont and Ducruet, 2005). It is only in the aeronautic sector
that South Korea seems to increase its position, notably since the realization of Incheon‟s
new international airport in 2001, through the successful „Pentaport‟ strategy (Ducruet,
2007).
Despite the abundance and quality of recent research on Korean ports, this paper proposes
a new contribution through the application of maritime network analysis. It is rather
surprising that despite the rapid and profound changes occurring in the Northeast Asian
port system, there is no comprehensive study of this region throughout the literature on
maritime networks. More likely are studies on the Caribbean (McCalla et al., 2005), the
Mediterranean (Cisic et al., 2007), the North Atlantic (Helmick, 1994), and the world (Joly,
1999; Ducruet et al., 2008a). Other studies have focused on its neighbour North Korea,
showing that South Korea has actually become North Korea‟s main hub in recent years
(Ducruet, 2008; Ducruet et al., 2008b). Approaching South Korea‟s hub position through
the structure of connected maritime networks is relevant since 99% of its international
trade volume is seaborne. The research hypothesizes that although South Korean ports
have lost their position to Chinese ports in terms of total throughput, their relative position
as hubs may have been maintained – or may even have been strengthened. A research
based on network analysis would complement the literature on East Asian containerisation
dynamics in which South Korean ports have been largely neglected compared with China,
Taiwan, Japan, and other ports (Comtois, 1994; Robinson, 1998; Comtois, 1999; Rimmer
and Comtois, 2005; Notteboom, 2006a; Yap et al., 2006).
The remainders of the paper are as follows. Section 2 introduces the source and
methodology for a network analysis of liner shipping networks, together with some
preliminary outcomes based on the data. Section 3 presents the main results of the network
analysis applied to Northeast Asia2. Finally, section 4 proposes some implications of this
study for South Korean port policy and further research.
2. SOURCE AND METHODOLOGY FOR NETWORK ANALYSIS
2.1 A global database on vessel movements
Two main databases exist for analyzing the structure of liner shipping networks. First,
Containerisation International provides annual yearbooks describing the service schedules
of the world‟s main shipping lines. It contains information on vessels (capacity in TEUs),
together with the carrier‟s name, and on the service itself (sequence of ports, and
periodicity). Although it has the advantage of being reliable and financially accessible, its
main problems are the absence of numerous companies, and the probable difference
between theory (service offered) and practice (true circulation).
For such reasons this research has selected another source: Lloyd‟s global database on
vessel movements. Compared to the other source, data from Lloyd’s Marine Intelligence
Unit (LMIU) is based on the effective movements of vessels and concentrates about 98%
2 The software used in this paper was created by the Laboratoire Bordelais de Recherche en Informatique
(LABRI), was initially crated for biology. It is today extensively used for social network analysis and in
transport studies notably on air transport networks, intra and inter-urban commuter flows, and multinational
corporations‟ networks in the SPANGEO project (http://s4.parisgeo.cnrs.fr/spangeo/spangeo11.htm). The
TULIP software is free, opensource and available at: http://tulip.labri.fr/

4
of the world fleet of fully cellular containerships. Data for this research has been extracted
for two years (1996 and 2006) and is limited to one month per year (i.e. October) because
liner services are relatively constant throughout the year despite seasonal effects.
Although there is no consensual geographical definition of Northeast Asia, this paper
includes all Chinese, Japanese, South Korean, Taiwanese, and Far-East Russian ports in
the analysis. Direct linkages between those ports constitute the architecture basing the
analysis of the Northeast Asian liner network. This constitutes in itself a necessary
simplification of the reality of liner shipping. While a line-bundling service calls at
multiple ports through rotations of vessels and spatial continuum of the sequence, this
research chooses to segment the services into a graph of distinct links. In addition, it mixes
together intra and extra-Northeast Asian services. It is a binary approach to the network:
there is or isn‟t a connection between two ports within a given period of time. For instance,
the Busan-Kobe connection is included in the graph regardless of the overlapping of
successive (or even simultaneous) services, should they be different either in terms of scale
(intra or extra) or function (line-bundling or feedering). Every link can be weighted by
various measures such as:
Hierarchy: total traffic, (sum of all vessel capacities), number of movements, vessels,
companies;
Density: total traffic divided by number of vessels, movements, companies, but also
frequency (e.g. movements per week).
The same applies to ports, with the possibility to use graph theory to calculate the relative
position of the ports in the network. While some simple indicators may be calculated
manually, such as the number of connections (i.e. maritime degree) or the traffic
distribution among those connections (e.g. concentration measures such as hub
dependence3), specific software is necessary to calculate the “centrality” of the ports. In
this paper, we limit such possibility to the calculation of the so-called “betweeness
centrality”: it corresponds to the number of shortest paths within the graph on which a
node (i.e. port) is located. When it comes to ports and maritime transport, such measure is
more likely to describe port‟s maritime accessibility or “intermediacy”. Intermediacy as
defined by Fleming and Hayuth (1994) corresponds to the level of insertion of a
transportation hub within carriers‟ networks. It is a vital component of “centrality” that is
the situation of a port with regard to markets and hinterlands. In order to match the concept
of intermediacy with the measure of betweeness centrality, we decide to use the term
“betweeness” that accounts for the equivalent and more classical concept of “in-
betweeness”.
2.2 Preliminary outcomes
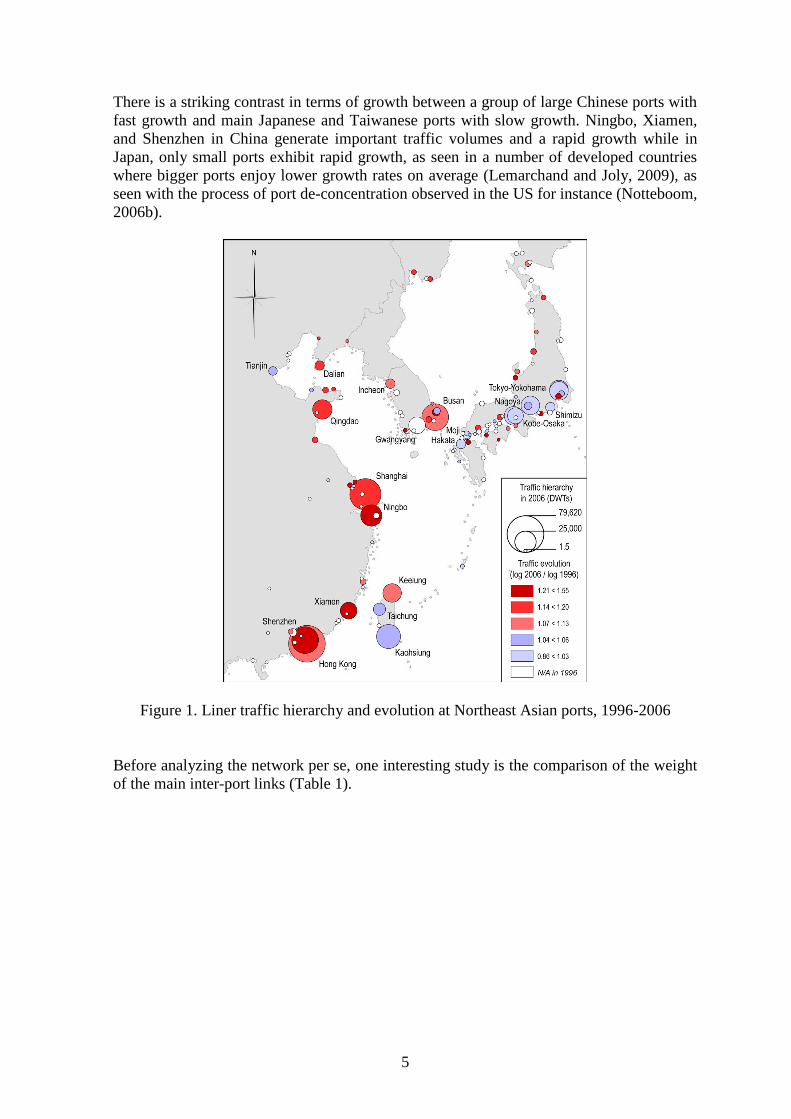
One first approach to understanding the position of ports is the classical map of individual
port traffic (Figure 1). Although it does not account for their relative position, it gives an
indirect but accurate idea of this position, because traffic volume in itself synthesizes a
myriad of dynamics within and between ports.
3 Hub dependence of a port is defined by Ducruet (2008) as the share of the biggest connection in total traffic.
High values (e.g. above 50%) indicate a weakness while low values (e.g. below 50%) reveal a strong position
towards immediate neighbours / competitors. Other measures may be applied to the distribution of traffic
among a port‟s connections, such as entropy and Gini coefficient.
5
There is a striking contrast in terms of growth between a group of large Chinese ports with
fast growth and main Japanese and Taiwanese ports with slow growth. Ningbo, Xiamen,
and Shenzhen in China generate important traffic volumes and a rapid growth while in
Japan, only small ports exhibit rapid growth, as seen in a number of developed countries
where bigger ports enjoy lower growth rates on average (Lemarchand and Joly, 2009), as
seen with the process of port de-concentration observed in the US for instance (Notteboom,
2006b).
Figure 1. Liner traffic hierarchy and evolution at Northeast Asian ports, 1996-2006
Before analyzing the network per se, one interesting study is the comparison of the weight
of the main inter-port links (Table 1).
6
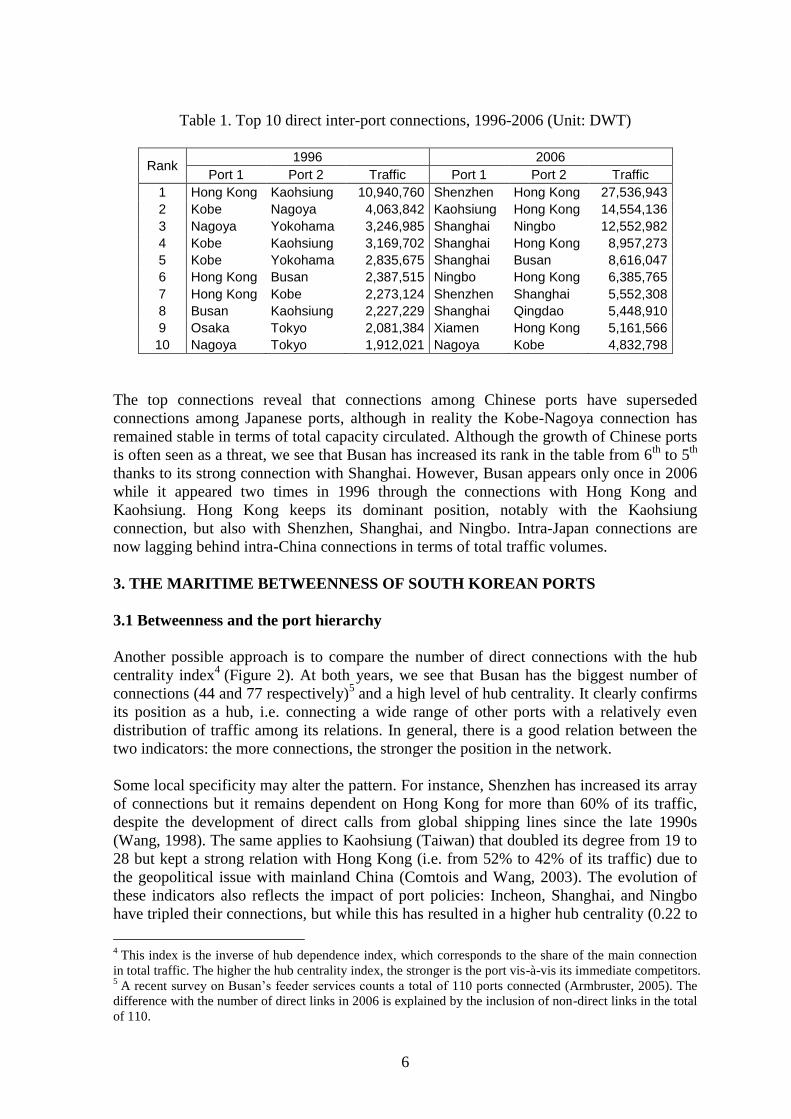
Table 1. Top 10 direct inter-port connections, 1996-2006 (Unit: DWT)
Rank 1996 2006
Port 1 Port 2 Traffic Port 1 Port 2 Traffic
1 Hong Kong Kaohsiung 10,940,760 Shenzhen Hong Kong 27,536,943
2 Kobe Nagoya 4,063,842 Kaohsiung Hong Kong 14,554,136
3 Nagoya Yokohama 3,246,985 Shanghai Ningbo 12,552,982
4 Kobe Kaohsiung 3,169,702 Shanghai Hong Kong 8,957,273
5 Kobe Yokohama 2,835,675 Shanghai Busan 8,616,047
6 Hong Kong Busan 2,387,515 Ningbo Hong Kong 6,385,765
7 Hong Kong Kobe 2,273,124 Shenzhen Shanghai 5,552,308
8 Busan Kaohsiung 2,227,229 Shanghai Qingdao 5,448,910
9 Osaka Tokyo 2,081,384 Xiamen Hong Kong 5,161,566
10 Nagoya Tokyo 1,912,021 Nagoya Kobe 4,832,798
The top connections reveal that connections among Chinese ports have superseded
connections among Japanese ports, although in reality the Kobe-Nagoya connection has
remained stable in terms of total capacity circulated. Although the growth of Chinese ports
is often seen as a threat, we see that Busan has increased its rank in the table from 6th
to 5th
thanks to its strong connection with Shanghai. However, Busan appears only once in 2006
while it appeared two times in 1996 through the connections with Hong Kong and
Kaohsiung. Hong Kong keeps its dominant position, notably with the Kaohsiung
connection, but also with Shenzhen, Shanghai, and Ningbo. Intra-Japan connections are
now lagging behind intra-China connections in terms of total traffic volumes.
3. THE MARITIME BETWEENNESS OF SOUTH KOREAN PORTS
3.1 Betweenness and the port hierarchy
Another possible approach is to compare the number of direct connections with the hub
centrality index4 (Figure 2). At both years, we see that Busan has the biggest number of
connections (44 and 77 respectively)5 and a high level of hub centrality. It clearly confirms
its position as a hub, i.e. connecting a wide range of other ports with a relatively even
distribution of traffic among its relations. In general, there is a good relation between the
two indicators: the more connections, the stronger the position in the network.
Some local specificity may alter the pattern. For instance, Shenzhen has increased its array
of connections but it remains dependent on Hong Kong for more than 60% of its traffic,
despite the development of direct calls from global shipping lines since the late 1990s
(Wang, 1998). The same applies to Kaohsiung (Taiwan) that doubled its degree from 19 to
28 but kept a strong relation with Hong Kong (i.e. from 52% to 42% of its traffic) due to
the geopolitical issue with mainland China (Comtois and Wang, 2003). The evolution of
these indicators also reflects the impact of port policies: Incheon, Shanghai, and Ningbo
have tripled their connections, but while this has resulted in a higher hub centrality (0.22 to
4 This index is the inverse of hub dependence index, which corresponds to the share of the main connection
in total traffic. The higher the hub centrality index, the stronger is the port vis-à-vis its immediate competitors. 5 A recent survey on Busan‟s feeder services counts a total of 110 ports connected (Armbruster, 2005). The
difference with the number of direct links in 2006 is explained by the inclusion of non-direct links in the total
of 110.

7
0.61) and lower hub dependence (46% to 16%) in Incheon and Shanghai (0.31 to 0.46;
32% to 22%); hub centrality has reduced for Ningbo (0.30 to 0.20). Although Ningbo has
successfully and rapidly developed as a rival to Shanghai (Cullinane et al., 2005), its
growth remains dependent on the latter in terms of maritime network design. The same
factor explains the profile of Gwangyang: non-existent as a container port in 1996, it
deploys 35 connections in 2006 but more than 35% goes through Busan as an effect of the
two-hub port system, resulting in a lower hub centrality (0.28) than its size would predict.
Such dynamics suggest that the growth of secondary ports in the vicinity of load centres is
possible only through a stage of hub dependence, as seen for Shenzhen, Ningbo, Incheon,
and Gwangyang.
Figure 2. Connection characteristics of Northeast Asian ports, 1996-2006
Therefore, geographical proximity is one important factor in port development, because it
conditions the degree to which a given port can reach a stage of maturity and
“independence”. Of course, geographical location is not enough explaining port
hierarchies: more likely is the port selection process by shipping lines combined with
national and local port policies (Slack and Wang, 2002). For older ports such as the main
Japanese ports, the connections have remained quite stable between 1996 and 2006.
In terms of betweenness centrality compared with total traffic, Busan is the most central
port in the whole regional network at both years, and one can differentiate ports with
higher traffic than centrality (e.g. Shenzhen, Yokkaichi, and Kaohsiung) from the opposite
profile where centrality is higher than traffic volume (e.g. Pohang, Ulsan, Far-East Russian
ports, and Incheon in 2006). The interplay between network position and port performance
is illustrated by the fact that bigger ports have also the best betweenness: Busan, Hong
Kong, Kobe, Yokohama, Shanghai, and Osaka. Yet, large Japanese ports tend to be less
central in the network compared with their traffic size.
8
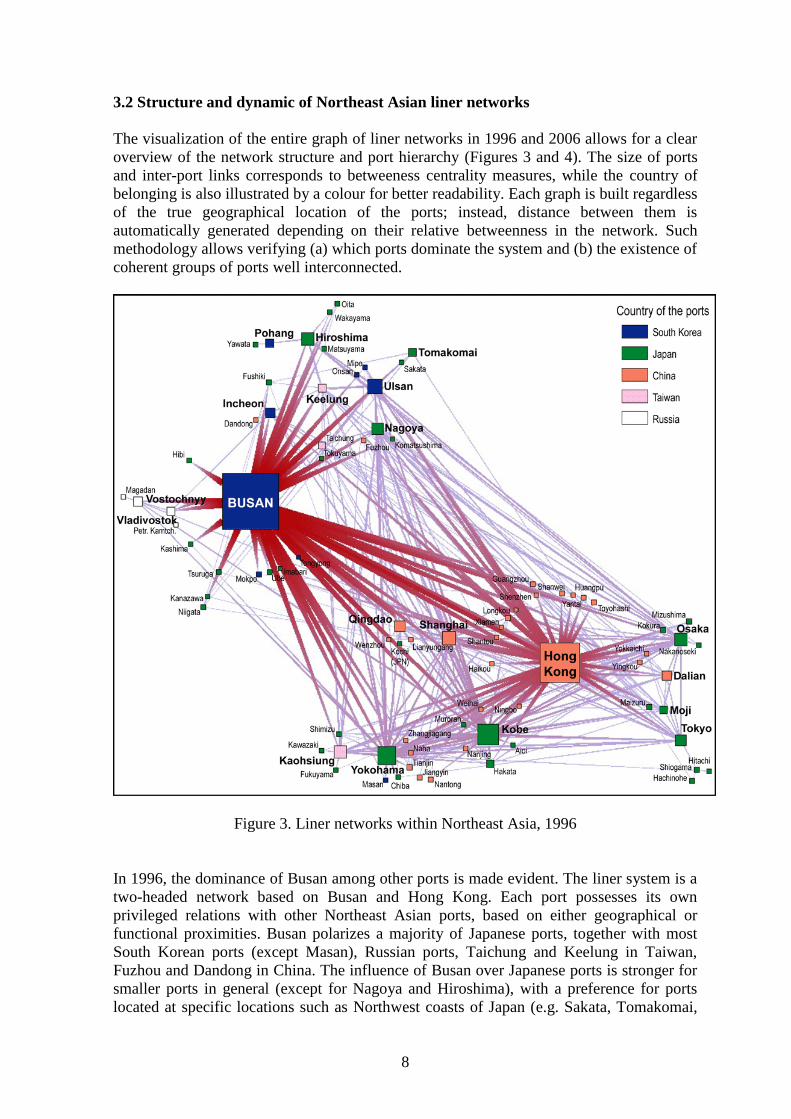
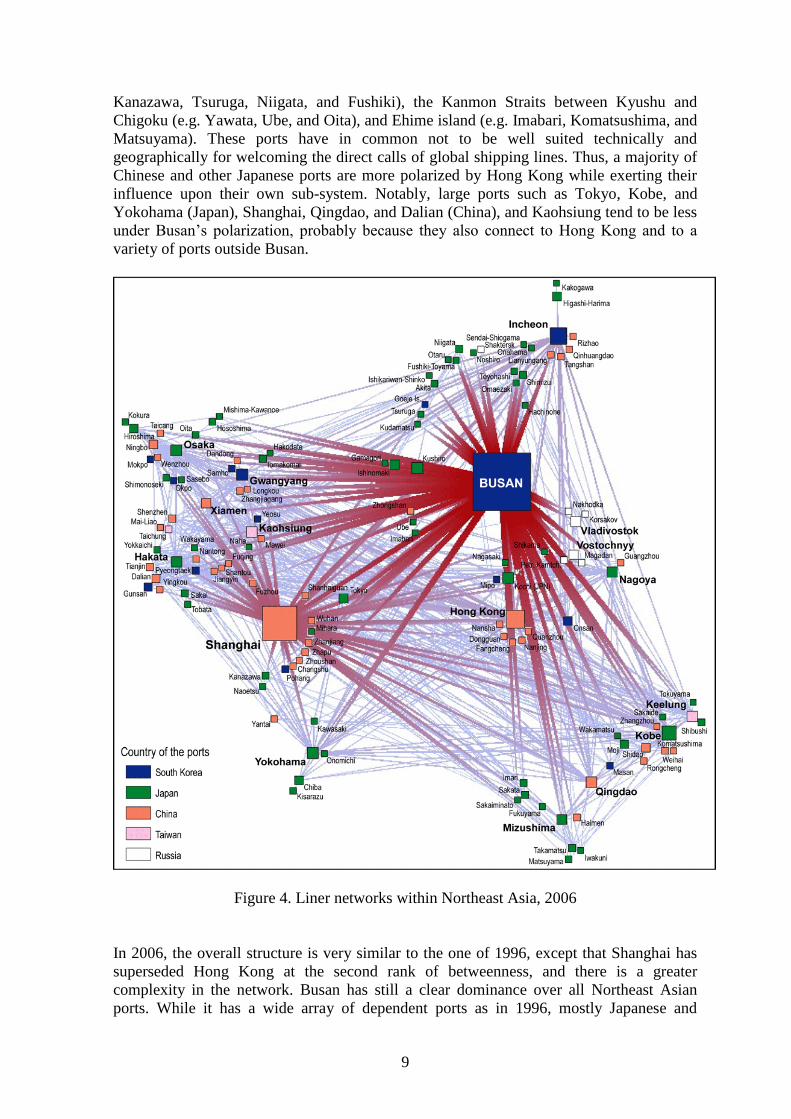
3.2 Structure and dynamic of Northeast Asian liner networks
The visualization of the entire graph of liner networks in 1996 and 2006 allows for a clear
overview of the network structure and port hierarchy (Figures 3 and 4). The size of ports
and inter-port links corresponds to betweeness centrality measures, while the country of
belonging is also illustrated by a colour for better readability. Each graph is built regardless
of the true geographical location of the ports; instead, distance between them is
automatically generated depending on their relative betweenness in the network. Such
methodology allows verifying (a) which ports dominate the system and (b) the existence of
coherent groups of ports well interconnected.
Figure 3. Liner networks within Northeast Asia, 1996
In 1996, the dominance of Busan among other ports is made evident. The liner system is a
two-headed network based on Busan and Hong Kong. Each port possesses its own
privileged relations with other Northeast Asian ports, based on either geographical or
functional proximities. Busan polarizes a majority of Japanese ports, together with most
South Korean ports (except Masan), Russian ports, Taichung and Keelung in Taiwan,
Fuzhou and Dandong in China. The influence of Busan over Japanese ports is stronger for
smaller ports in general (except for Nagoya and Hiroshima), with a preference for ports
located at specific locations such as Northwest coasts of Japan (e.g. Sakata, Tomakomai,
9
Kanazawa, Tsuruga, Niigata, and Fushiki), the Kanmon Straits between Kyushu and
Chigoku (e.g. Yawata, Ube, and Oita), and Ehime island (e.g. Imabari, Komatsushima, and
Matsuyama). These ports have in common not to be well suited technically and
geographically for welcoming the direct calls of global shipping lines. Thus, a majority of
Chinese and other Japanese ports are more polarized by Hong Kong while exerting their
influence upon their own sub-system. Notably, large ports such as Tokyo, Kobe, and
Yokohama (Japan), Shanghai, Qingdao, and Dalian (China), and Kaohsiung tend to be less
under Busan‟s polarization, probably because they also connect to Hong Kong and to a
variety of ports outside Busan.
Figure 4. Liner networks within Northeast Asia, 2006
In 2006, the overall structure is very similar to the one of 1996, except that Shanghai has
superseded Hong Kong at the second rank of betweenness, and there is a greater
complexity in the network. Busan has still a clear dominance over all Northeast Asian
ports. While it has a wide array of dependent ports as in 1996, mostly Japanese and

10
Russian, other South Korean ports tend to have shifted under the control of another hub.
Only Incheon and Gwangyang have developed their betweenness to the point of polarizing
a number of Chinese Yellow Sea ports (e.g. Rizhao, Qinhuangdao, Tangshan, and
Longkou). The geographical coverage of Busan‟s polarization on Japanese ports has
remained rather stable: those are mostly smaller ports and they locate for a large part on the
Northwest coasts of Japan, where big containerships do not anchor due to remoteness,
spatial scattering, lack of nautical accessibility, and to avoid deviation from the main trunk
line (Zohil and Prijon, 1999). In fact, other ports are polarized by other hubs, either due to
simple geographical proximity (e.g. Chinese ports and Shanghai, Hong Kong; Yokohama
and Kawasaki), or to the more complex factor of service coverage by shipping lines. Due
to the mixture of so many services of different kind in the analysis, it is not easy to identify
with precision which service or which company causes the grouping of some
geographically distant ports. A myriad of random forces also cause the changes in the
organization of shipping networks. The main common explanation is that ports having
many connections outside of Busan are grouped together regardless of any geographical
logic. In addition, the increased fluidity of liner shipping and the current reorganization of
services in a changing economic and regional environment cannot be fully explained
rationally. More interesting is the shift of some ports from the influence of certain hubs,
and the possible factors causing this shift. For instance, Hakata that was in the vicinity of
Kobe in 1996 has gained some “independence” and is polarizing a variety of Yellow Sea
ports in 2006. Similarly, Keelung (Taiwan) shifted from Busan‟s influence in 1996 to
Kobe‟s influence in 2006.
3.3 A multi-scalar approach of betweenness
In order to resituate the performance of South Korean and other Northeast Asian ports on a
wider level, two methodologies are proposed and the results are examined successively.
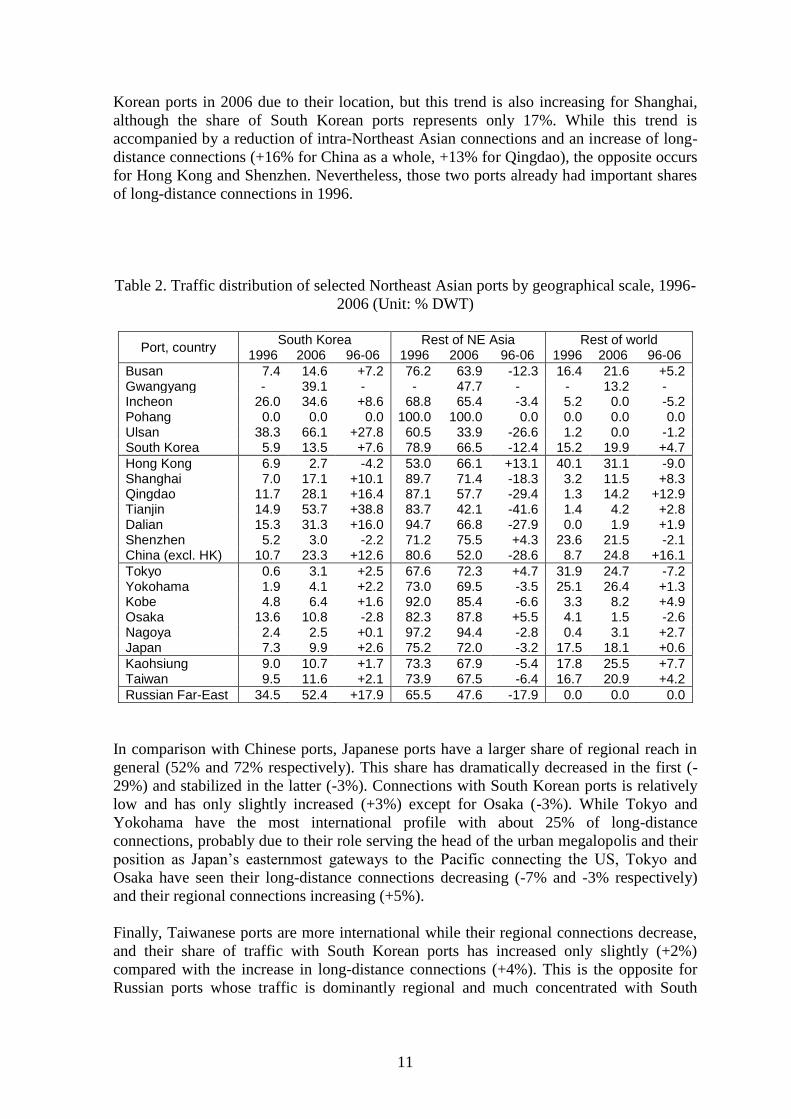
3.3.1 Traffic distribution by main intra-regional and extra-regional connection
This methodology focuses on the degree to which some ports rely on South Korean ports
or on other ports for their overall performance (Table 2). The share of “rest of world” is
very important because it expresses a spatial reach outside Northeast Asia – and therefore a
higher performance, although the precise location of such long-distance connections is not
indicated for better readability. This methodology can be considered as a verification of
previous theoretical research on the geographical functions of container ports (Langen de
et al., 2002).
The first approach brings interesting results about the changes in ports‟ spatial reach. For
South Korean ports, there has been a tendency to increase their traffic with each other, with
fewer connections with other ports except for Busan that slightly increased (+5%) its direct
connection outside Northeast Asia. Busan increasingly concentrates the main connections
of other South Korean ports, and only Gwangyang has an important connection outside
Northeast Asia, despite its 39% traffic realized through Busan hub in 2006. Comparatively,
Incheon has lost its long-distance connection but has maintained its important regional hub
function, with 65% of its traffic connecting Northeast Asian ports.
Chinese ports have all increased their connection with South Korea except Hong Kong and
Shenzhen where this link was already secondary. The three main Yellow Sea ports (i.e.
Tianjin, Qingdao, and Dalian) have one-third to one-half of their traffic polarized by South
11
Korean ports in 2006 due to their location, but this trend is also increasing for Shanghai,
although the share of South Korean ports represents only 17%. While this trend is
accompanied by a reduction of intra-Northeast Asian connections and an increase of long-
distance connections (+16% for China as a whole, +13% for Qingdao), the opposite occurs
for Hong Kong and Shenzhen. Nevertheless, those two ports already had important shares
of long-distance connections in 1996.
Table 2. Traffic distribution of selected Northeast Asian ports by geographical scale, 1996-
2006 (Unit: % DWT)
Port, country South Korea Rest of NE Asia Rest of world
1996 2006 96-06 1996 2006 96-06 1996 2006 96-06
Busan 7.4 14.6 +7.2 76.2 63.9 -12.3 16.4 21.6 +5.2 Gwangyang - 39.1 - - 47.7 - - 13.2 - Incheon 26.0 34.6 +8.6 68.8 65.4 -3.4 5.2 0.0 -5.2 Pohang 0.0 0.0 0.0 100.0 100.0 0.0 0.0 0.0 0.0 Ulsan 38.3 66.1 +27.8 60.5 33.9 -26.6 1.2 0.0 -1.2 South Korea 5.9 13.5 +7.6 78.9 66.5 -12.4 15.2 19.9 +4.7
Hong Kong 6.9 2.7 -4.2 53.0 66.1 +13.1 40.1 31.1 -9.0 Shanghai 7.0 17.1 +10.1 89.7 71.4 -18.3 3.2 11.5 +8.3 Qingdao 11.7 28.1 +16.4 87.1 57.7 -29.4 1.3 14.2 +12.9 Tianjin 14.9 53.7 +38.8 83.7 42.1 -41.6 1.4 4.2 +2.8 Dalian 15.3 31.3 +16.0 94.7 66.8 -27.9 0.0 1.9 +1.9 Shenzhen 5.2 3.0 -2.2 71.2 75.5 +4.3 23.6 21.5 -2.1 China (excl. HK) 10.7 23.3 +12.6 80.6 52.0 -28.6 8.7 24.8 +16.1
Tokyo 0.6 3.1 +2.5 67.6 72.3 +4.7 31.9 24.7 -7.2 Yokohama 1.9 4.1 +2.2 73.0 69.5 -3.5 25.1 26.4 +1.3 Kobe 4.8 6.4 +1.6 92.0 85.4 -6.6 3.3 8.2 +4.9 Osaka 13.6 10.8 -2.8 82.3 87.8 +5.5 4.1 1.5 -2.6 Nagoya 2.4 2.5 +0.1 97.2 94.4 -2.8 0.4 3.1 +2.7 Japan 7.3 9.9 +2.6 75.2 72.0 -3.2 17.5 18.1 +0.6
Kaohsiung 9.0 10.7 +1.7 73.3 67.9 -5.4 17.8 25.5 +7.7 Taiwan 9.5 11.6 +2.1 73.9 67.5 -6.4 16.7 20.9 +4.2
Russian Far-East 34.5 52.4 +17.9 65.5 47.6 -17.9 0.0 0.0 0.0
In comparison with Chinese ports, Japanese ports have a larger share of regional reach in
general (52% and 72% respectively). This share has dramatically decreased in the first (-
29%) and stabilized in the latter (-3%). Connections with South Korean ports is relatively
low and has only slightly increased (+3%) except for Osaka (-3%). While Tokyo and
Yokohama have the most international profile with about 25% of long-distance
connections, probably due to their role serving the head of the urban megalopolis and their
position as Japan‟s easternmost gateways to the Pacific connecting the US, Tokyo and
Osaka have seen their long-distance connections decreasing (-7% and -3% respectively)
and their regional connections increasing (+5%).
Finally, Taiwanese ports are more international while their regional connections decrease,
and their share of traffic with South Korean ports has increased only slightly (+2%)
compared with the increase in long-distance connections (+4%). This is the opposite for
Russian ports whose traffic is dominantly regional and much concentrated with South

12
Korean ports (52%). This confirms the role of Busan as a hub for the East Sea and for
growing Chinese ports.
3.3.2 Relative positioning on multiple geographical levels from local to global
This complementary analysis is proposed because measures of betweenness within
Northeast Asia may hide the fact that some ports are differently positioned by liner
networks on various scales simultaneously. For instance, a given port may be very central
among neighbouring ports while becoming peripheral when the study area enlarges. For
this study we divided the world into four main geographical levels in which the
betweenness of every port has been calculated: world, Asia-Pacific, East Asia, and
Northeast Asia (Figure 5). The number of shortest paths in the graph of the lower level is
divided by the same number on a wider level. In order to standardize the values and order
them hierarchically according to better positioning at the top, we have subtracted the value
from 1. The higher the result, the better the position of the port on the wider level.
One striking fact is that South Korean ports do not appear in the top five scores of any
column, except Busan reaching the 5th
rank for the differential between Northeast Asia and
East Asia. This gives an indication about their limited global radiance compared with their
regional function within Northeast Asia. In addition, the scores of South Korean ports have
either stabilized or decreased between 1996 and 2006. It means that although they rank
high within Northeast Asia in terms of maritime degree, hub centrality, and betweeness
centrality, their main function remains local. Gwangyang is more globalized than Busan,
probably because it has developed more recently, backed by the two-hub port strategy
aiming at connecting principally the main trunk lines. Thus, Gwangyang has fewer
connections than Busan and Incheon, but it is better positioned on a wider level. Yet,
Busan and Incheon have seen their scores lowering in general, indicating a trend of
contraction of their influence as hubs. Conversely, this may underline the fact that due to
the strengthening of their hub functions within Northeast Asia, their position in the rest of
Asia and in the world maritime system has weakened consequently. The exception of the
slight increase of Busan‟s position between East Asia and Asia-Pacific may highlight the
strong role of Busan connecting East Asia with the US across the Pacific. In comparison,
only Kobe, Nagoya, and Osaka have lower scores than Korean ports, probably due to their
dominant gateway function serving local hinterlands of enormous size. Also, the scattering
of Japanese ports and markets along the coast have prevented from the possibility of a load
centring or hub strategy towards other ports in the region (Frémont and Ducruet, 2005).
All other ports are more “global”, but this trend is slightly decreasing for Kaohsiung,
Tokyo, and Yokohama, and dramatically increasing for Hong Kong and Chinese ports.
Within Asia, the position of Shanghai, Tianjin, and Qingdao has also increased but it
remains lower than that of Busan in 2006. The most striking is their huge increase globally,
and notably for Shenzhen that is stronger than Busan also within Asia. Of course,
Shenzhen, as the three-headed port of the world‟s factory (i.e. Chiwan, Shekou, and
Yantian), has been the focus of many investments from Hong Kong firms such as
Hutchinson (Airriess, 2001). The impact of Busan New Port is still limited at the time of
data collection, as it is expected for completion in 2015.
However, the ratios of Tokyo and Yokohama have greatly declined, except for the increase
of World / Asia-Pacific in Yokohama, Asia-Pacific / East Asia and Asia-Pacific / Northeast
Asia in Tokyo, illustrating their roles as important pivots reaching outside Northeast Asia

13
as seen in previous Table 2. In comparison, Chinese ports and Kaohsiung (Taiwan) are
much more globalized than South Korean and Japanese ports, whose function is more
regional in scope. What becomes clear is the rapid increase of such global reach, except for
Tianjin: we have seen in Table 2 that Tianjin had the highest increase of connections with
South Korean ports, probably due to its location. In the same vein, Shanghai has stabilized
its ratios although those remain high in 2006. All Shenzhen‟s ratios of evolution are in the
top three, suggesting that this port has consolidated its position at all geographical levels
and the world. Hong Kong‟s ratios are either increasing or stabilizing. Among other
Chinese ports, Qingdao is the most successful, as seen in its important traffic (Figure 1)
and its most rapid increase of long-distance connections (Table 2).
Figure 5. Multiscalar betweenness of selected Northeast Asian ports, 1996-2006
4. CONCLUSION
The network attributes of South Korean ports put them at the top of the port hierarchy of
Northeast Asian ports. Such competitive position has been achieved in a relatively short
period of time, following the country‟s rapid economic growth, and a successful port
policy based on hub strategy and modernisation.
However, a closer look at the geographical fundaments of the position of South Korean
ports on various scales sheds more light on their true performance. In fact, their role seems
more regional than other major Northeast Asian ports. Also, regionally, Shanghai has
superseded Hong Kong for the second rank of betweenness measures, but Hong Kong and
Shenzhen comfort their global position. In addition, some main Japanese ports that are
often disregarded because of high pricing, congestion, and hub dependence on South Korea
are in fact relatively strong in the Asian and global network (e.g. Yokohama and Tokyo).
Of course, the methodology proposed in this paper tends to lower the global performance
of Busan simply because it has a strong position within Northeast Asia for transhipment.
Ports that rely less on hub functions tend to have a better position globally than regionally.

14
Further analysis shall try to distinguish transhipment functions from other functions among
all vessel movements in order to compare ports based on attributes of same nature.
This analysis confirms that without new strategies strengthening the current position of
South Korean ports, those are likely to see their regional function even threatened by
Shanghai or other Chinese rivals, and their global function disappear. However, the
impacts of the current global crisis are still unpredictable. One main factor to give more
chances to Chinese ports to success in the long run is their role as gateways for reaching
distant continental destinations within and outside China. Yet, recent evidence show that
although Busan‟s trade traffic has diminished due to the impact of the global crisis and
competition from China, its transhipment activities towards Northern Chinese ports (e.g.
Tianjin, Dalian) are increasing as an effect of weather conditions affecting potential
Chinese hub ports (Kang, 2009).
One possible policy direction for South Korean ports is to strengthen their connections
with Chinese ports while increasing the availability and quality of port-related
manufacturing and logistics activities locally through the development of integrated
distriparks and industrial complexes. Further research shall improve the analytical tools of
network analysis applied to maritime transport, while extending to other regions of the
world for a comparative perspective.
REFERENCES
Airriess, C.A. (2001) The regionalization of hutchison port holdings in mainland China.
Journal of Transport Geography 9, 267-278.
Cisic, D., Komadina, P., Hlaca, B. (2007) Network analysis applied to Mediterranean liner
transport system. Paper presented at the International Association of Maritime
Economists Conference, Athens, Greece, July 4-6.
Comtois, C. (1994) The evolution of containerization in East Asia. Maritime Policy and
Management 21, 195-205.
Comtois, C. (1999) The integration of China's port system into global container shipping.
Geojournal 48, 35-42.
Comtois, C., Wang, J.J. (2003) Géopolitique et transport : nouvelles perspectives
stratégiques dans le détroit de Taiwan. Études Internationales 34, 213-226.
Cullinane, K.P.B, Teng, Y., Wang, T.F. (2005) Port competition between Shanghai and
Ningbo. Maritime Policy and Management 32, 331-346.
De Langen, P.W., Lugt van der, L.M., Eenhuizen, J.H.A. (2002). A stylised container port
hierarchy: a theoretical and empirical exploration. Paper presented at the International
Association of Maritime Economists Conference, Panama, November 13-15.
Ducruet, C. (2007) Incheon. In J.B. Hattendorf (ed.), The Oxford Encyclopedia of
Maritime History. Oxford, Oxford University Press.
Ducruet, César (2008) Hub dependence in constrained economies: the case of North Korea
Maritime Policy and Management 35, 374-388.
Ducruet, César (2009) Ports in a world maritime system. In C. Rozenblat (ed.), Multilevel
Analysis and Visualization of Geographical Networks, Springer Geography
(forthcoming).
Ducruet, C., Rozenblat, C., Koenig, P.Y. (2008a) Analyzing the world maritime system: an
approach through graph visualization. Paper presented at the Annual Conference of the
Association of American Geographers (AAG), Boston MA, April 15-17.

15
Ducruet, C., Gelézeau, V., Roussin, S. (2008b) The maritime connections of North Korea:
spatial change in the Korean peninsula and new regional dynamics in Northeast Asia.
L’Espace Géographique 3, 208-224 (in French).
Fleming, D.K., Hayuth, Y. (1994) Spatial characteristics of transportation hubs: centrality
and intermediacy. Journal of Transport Geography 2, 3-18.
Frémont, A., Ducruet, C. (2005) The emergence of a mega-port, the case of Busan, from
the local to the global, Tijdschrift voor Econ. En Soc. Geografie 96, 421-432.
Helmick, J.S. (1994) Concentration and Connectivity in the North Atlantic Liner Port
Network, 1970-1990. Unpublished PhD Dissertation, Miami, University of Miami.
Joly, O. (1999) The structuring of maritime circulation networks. Unpublished PhD
Dissertation in Territorial Planning, Le Havre, Le Havre University.
Kang, J.K. (2009) Weather in China a boon for Busan. Joongang Daily, January 24.
KITA (2006) Change of Intra-Trade and Investment Pattern of Korea, China and
Japan. Seoul, Korea International Trade Association.
Langen de, P.W., Lugt van der, L.M., Eenhuizen, J.H.A. (2002) A stylised container port
hierarchy: a theoretical and empirical exploration, Paper presented at the International
Association of Maritime Economists Conference, Panama, November 13-15.
Lee, S.W. and Kim, C.H. (2006) Performance evaluation of Asian port distriparks using
factor analysis. Ocean Policy Research 21, 52-82.
Lee, S.W. and Kim, G.S. (2009) Port challenge in Northeast Asia: Korea‟s two-hub port
strategy. In T.E. Notteboom, P.W. De Langen, and C. Ducruet (eds.), Ports in Proximity:
Essays on Competition and Cooperation among Adjacent Seaports, Ashgate
(forthcoming).
Lemarchand, A., Joly, O. (2009) Regional integration and maritime range. In T.E.
Notteboom, P.W. De Langen, and C. Ducruet (eds.), Ports in Proximity: Essays on
Competition and Cooperation among Adjacent Seaports, Ashgate (forthcoming).
McCalla, R., Slack, B., Comtois, C. (2005) The Caribbean basin: adjusting to global trends
in containerization. Maritime Policy and Management 32, 245-261.
Notteboom, T.E. (2006a) Container throughput dynamics in the East Asian container port
system. Journal of International Logistics and Trade 4, 31-52.
Notteboom, T.E. (2006b) Traffic inequality in seaport systems revisited. Journal of
Transport Geography 14, 95-108.
Rimmer, P.J. (2004) Global flows, local hubs, platforms, corridors and regional economic
integration in Northeast Asia. Journal of International Logistics and Trade 1, 1-18.
Rimmer, P.J., Comtois, C. (2005) China's extra and intra-Asian liner shipping connections
1990-2000. Journal of International Logistics and Trade 3, 75-97.
Robinson, R. (1998) Asian hub/feeder nets: the dynamics of restructuring. Maritime
Policy and Management 25, 21-40.
Roussin, S. (2008) History of Korean Ports. Confidential Report, Seoul, SERIC COREE
(in French).
Slack, B., Wang, J.J. (2002) The challenge of peripheral ports: an Asian perspective.
Geojournal 56, 159-166.
Song, D.W., Lee, S.W. (2006) Port governance in Korea. Research in Transportation
Economics 17, 357-375.
Wang, J.J. (1998) A container load center with a developing hinterland: A case study of
Hong Kong. Journal of Transport Geography 6: 187-201.
Yap, W.Y., Lam, J.S.L., Notteboom, T.E. (2006) Developments in container port
competition in East Asia. Transport Reviews 26, 167-188.
Yoo, S.J. (2006) New port opens Busan bid as regional hub. The Korea Herald, January
20

16
Zohil, J., Prijon, M. (1999) The MED rule: the interdependence of container throughput
and transhipment volumes in the Mediterranean ports. Maritime Policy and Management
26, 175-193.
Related Documents