/RFDO 6ROLG :DVWH 0DQDJHPHQW 3ODQ 8SGDWH June 1, 2022 3UHSDUHG E\ DRAFT - PENDING CITY COUNCIL CONSIDERATION (6/1/22) DRAFT

Welcome message from author
This document is posted to help you gain knowledge. Please leave a comment to let me know what you think about it! Share it to your friends and learn new things together.
Transcript
June 1, 2022
DRAFT - PENDING CITY COUNCIL CONSIDERATION (6/1/22)
DRAFT
LSWMP Update Table of Contents
City of Dallas, Texas i Burns & McDonnell
TABLE OF CONTENTS
EXECUTIVE SUMMARY ............................................................................................ ES-1
Purpose ...........................................................................................................................ES-1 Stakeholder Engagement ...............................................................................................ES-1 Updated Goals and Objectives .......................................................................................ES-2
Guidance for Reading the LSWMP Update...................................................................ES-5 Key Findings and Priority Next Steps ...........................................................................ES-7
1.0 OVERVIEW, GOALS, AND OBJECTIVES ...................................................... 1-1
1.1 LSWMP Update Overview .................................................................................. 1-1
1.1.1 Purpose .................................................................................................. 1-1
1.1.2 Stakeholder Engagement ...................................................................... 1-2 1.1.3 City Department Collaboration ............................................................. 1-3
1.2 Key Terms ............................................................................................................ 1-3 1.2.1 Material Types ...................................................................................... 1-3
1.2.2 Generator Sectors .................................................................................. 1-5 1.2.3 Generation, Recycling and Disposal ..................................................... 1-6
1.3 Updated Goals and Objectives ............................................................................. 1-7 1.3.1 Goals ..................................................................................................... 1-7 1.3.2 Objectives ............................................................................................. 1-9
1.4 Guidance for Reading the LSWMP Update....................................................... 1-10 1.4.1 Section Layout .................................................................................... 1-12
1.4.2 Case Studies and Benchmarking ......................................................... 1-12
1.4.3 Options Evaluation.............................................................................. 1-12
1.4.4 Implementation and Funding Plan ...................................................... 1-13
2.0 PLANNING STUDIES, REGULATORY, AND TRENDS REVIEW ............... 2-1
2.1 Review of Relevant Planning Studies .................................................................. 2-1
2.2 Regulatory and Policy Review............................................................................. 2-5 2.2.1 Role of the Federal Government in Regulating Solid Waste ................ 2-5 2.2.2 Role of the State Government in Regulating Solid Waste .................... 2-8
2.2.3 Recent State Legislative Trends.......................................................... 2-11 2.2.4 Role of the City of Dallas in Regulating Solid Waste ........................ 2-13
2.3 Solid Waste Material Management Industry Trends ......................................... 2-13
3.0 PLANNING AREA CHARACTERISTICS ......................................................... 3-1
3.1 Demographic and Economic Characteristics ....................................................... 3-1 3.1.1 Historical and Current Population ........................................................ 3-1 3.1.2 Single-Family and Multi-Family Household Distribution .................... 3-2
3.1.3 Changing Collection Environments ...................................................... 3-3 3.1.4 Population Projections .......................................................................... 3-5
3.2 Economic Characteristics..................................................................................... 3-6 3.2.1 Current Regional Employment ............................................................. 3-6
DRAFT
LSWMP Update Table of Contents
City of Dallas, Texas ii Burns & McDonnell
3.2.2 Economic Development ........................................................................ 3-7 3.3 Material Generation, Recycling and Disposal ..................................................... 3-8
3.3.1 Material Generation Rate ...................................................................... 3-8 3.4 Material Generation Forecast ............................................................................... 3-9
3.4.2 Material Generation Forecast by Sector ............................................. 3-10 3.5 Waste Characterization ...................................................................................... 3-12
3.5.1 Statewide MSW Characterization ....................................................... 3-12
3.5.2 Statewide C&D Composition ............................................................. 3-15 3.5.3 Regional Waste Characterization ........................................................ 3-16 3.5.4 Regional Capture Rate ........................................................................ 3-17
4.0 FACILITIES AND INFRASTRUCTURE ............................................................ 4-1
4.1 Current System Review ....................................................................................... 4-1
4.1.1 Landfills ................................................................................................ 4-1
4.1.2 Transfer Stations ................................................................................... 4-6
4.1.3 Material Recovery Facilities ................................................................. 4-9 4.1.4 Organics Processing Facilities ............................................................ 4-12 4.1.5 Construction and Demolition Facilities .............................................. 4-15
4.1.6 Household Chemical Collection Center.............................................. 4-17 4.2 Public-Private Partnerships ................................................................................ 4-18
4.3 Current System Findings Key Findings and Recommendations ....................... 4-19
5.0 TRANSFER STATION SYSTEM ....................................................................... 5-1
5.1 Current System Review ....................................................................................... 5-1
5.2 Evaluation of 2011 LSWMP Recommendations ................................................. 5-4
5.3 Case Studies ......................................................................................................... 5-5
5.3.1 Separating Customers by Type ............................................................. 5-5 5.3.2 Manage Multiple Material Streams ...................................................... 5-6
5.4 Options Evaluation............................................................................................... 5-7 5.4.1 Maximize Existing Capacity ................................................................. 5-8 5.4.2 Upgrade Site Layout and/or Transfer Buildings ................................. 5-11
5.4.3 Separately Receive and Process Brush and Yard Trimmings ............. 5-14 5.4.4 Major Expansion or Rebuild of Bachman .......................................... 5-15
5.5 Key Findings and Recommendations ................................................................ 5-17
5.5.1 Key Findings ......................................................................................... 5-1 5.5.2 Recommendations ................................................................................. 5-2
6.0 REFUSE AND RECYCLING COLLECTION .................................................... 6-1
6.1 Current System Review ....................................................................................... 6-1 6.2 Evaluation of 2011 LSWMP Recommendations ................................................. 6-4
6.3 Case Studies and Benchmarking .......................................................................... 6-5 6.3.1 Alternative Collection Schedule and Frequency ................................... 6-5 6.3.2 Leveraging On-board Vehicle Technology .......................................... 6-7 6.3.3 Alternative Fuel Collection Vehicles .................................................... 6-7 6.3.4 Equipment Backup Ratio ...................................................................... 6-9
DRAFT
LSWMP Update Table of Contents
City of Dallas, Texas iii Burns & McDonnell
6.3.5 Permit Review Process ....................................................................... 6-11 6.4 Options Evaluation............................................................................................. 6-12
6.4.1 Evaluate Potential Efficiencies of Adjusting Collection Schedule ..... 6-14 6.4.2 Minimize Alley Collection and Combined Routes ............................. 6-15 6.4.3 Decrease Use of Diesel Collection Vehicles ...................................... 6-18 6.4.4 Release Procurement for Cart Supplier............................................... 6-19
6.5 Key Findings and Recommendations ................................................................ 6-20
6.5.1 Key Findings ......................................................................................... 6-1 6.5.2 Recommendations ................................................................................. 6-2
7.0 BRUSH AND BULKY ITEM COLLECTION ..................................................... 7-1
7.1 Current System Review ....................................................................................... 7-1 7.1.1 Collection Schedule .............................................................................. 7-7
7.1.2 Operating Procedures ............................................................................ 7-9
7.1.3 Equipment and Personnel ................................................................... 7-12
7.1.4 Processing and Disposal ..................................................................... 7-16 7.2 Brush and Bulky Item Separation Pilot Program ............................................... 7-17 7.3 Evaluation of 2011 LSWMP Recommendations ............................................... 7-21
7.4 Benchmarking .................................................................................................... 7-22 7.5 Options Evaluation............................................................................................. 7-24
7.5.1 Evaluate 10 CY Set Out Limit ............................................................ 7-25 7.5.2 Adjust Mix of Collection Equipment .................................................. 7-27 7.5.3 Implement Separate Brush and Bulky Item Collection ...................... 7-29
7.6 Key Findings and Recommendations ................................................................ 7-32 7.6.1 Key Findings ....................................................................................... 7-34
7.6.2 Recommendations ............................................................................... 7-35
8.0 LANDFILL ............................................................................................................ 8-1
8.1 Current System Review ....................................................................................... 8-1 8.2 Evaluation of 2011 LWMP Recommendations ................................................... 8-2 8.3 Benchmarking ...................................................................................................... 8-3
8.3.1 Landfill Operations ............................................................................... 8-4 8.3.2 Organics Diversion ............................................................................... 8-4 8.3.3 Pricing Strategy ..................................................................................... 8-6
8.4 Options Evaluation............................................................................................. 8-10 8.4.1 Maximize Site Life and Maintain Sufficient Revenues ...................... 8-10 8.4.2 Divert Self-Haul Customers from the Working Face ......................... 8-13
8.4.3 Increase Organics Processing Capacity .............................................. 8-15 8.4.4 Undertake Long-term Operations and Development Planning ........... 8-17
8.5 Key Findings and Recommendations ................................................................ 8-18 8.5.2 Key Findings ....................................................................................... 8-21
8.5.3 Recommendations ............................................................................... 8-22
9.0 RECYCLING PROCESSING .............................................................................. 9-1
9.1 Recycling Processing Agreement Overview ....................................................... 9-1
DRAFT
LSWMP Update Table of Contents
City of Dallas, Texas iv Burns & McDonnell
9.2 Evaluation of 2011 LSWMP Recommendations ................................................. 9-4 9.3 Recycling Processing Agreement Evaluation ...................................................... 9-5
9.4 Key Findings and Recommendations .................................................................. 9-8 9.4.1 Key Findings ......................................................................................... 9-8 9.4.2 Recommendations ................................................................................. 9-9
10.0 ORGANICS MANAGEMENT ........................................................................ 10-10
10.1 Current System Review ................................................................................... 10-10 10.1.1 Organics Material Types ................................................................... 10-10 10.1.2 Food Waste Reduction, Donation and Recycling ............................. 10-11 10.1.3 Processing Infrastructure .................................................................. 10-12
10.2 Generation and Recycling Potential................................................................. 10-13 10.3 Evaluation of 2011 LSWMP Recommendations ............................................. 10-17
10.4 Case Studies ..................................................................................................... 10-18
10.4.1 Source Reduction Initiatives ............................................................. 10-19
10.4.2 Organics Collection and Processing ................................................. 10-20 10.4.3 Organics Disposal Bans .................................................................... 10-21
10.5 Options Evaluation........................................................................................... 10-22
10.5.1 Expand Source Reduction Efforts ..................................................... 10-23 10.5.2 Increase Organics Processing Capacity Across Operations.............. 10-24
10.5.3 Leverage Public-Private Partnership for Third-Party Composting ... 10-26 10.6 Key Findings and Recommendations .............................................................. 10-28
10.6.1 Key Findings ....................................................................................... 10-1
10.6.2 Recommendations ............................................................................... 10-2
11.0 MULTI-FAMILY AND COMMERCIAL ............................................................. 11-1
11.1 Current System Review ..................................................................................... 11-1 11.1.1 Multi-Family Sector ............................................................................ 11-1
11.1.2 Multi-Family Recycling Ordinance .................................................... 11-1 11.1.3 Commercial Sector.............................................................................. 11-5
11.2 Diversion Recycling Potential ......................................................................... 11-10
11.2.2 Processing Infrastructure .................................................................. 11-13 11.3 Evaluation of 2011 LSWMP Recommendations ............................................. 11-14 11.4 Case Studies ..................................................................................................... 11-15
11.4.1 Technical Assistance Programs ........................................................ 11-16 11.4.2 Hauler Permit Requirements ............................................................. 11-17 11.4.3 Universal Recycling Ordinances....................................................... 11-18
11.4.4 Exclusive or Zoned Franchise Systems ............................................ 11-20 11.5 Options Evaluation........................................................................................... 11-22
11.5.1 Adjust Franchise Hauler Permit Requirements................................. 11-24 11.5.2 Expand Green Business Certification Program ................................ 11-26
11.5.3 Implement Targeted Commercial Diversion Requirements ............. 11-28 11.6 Key Findings and Recommendations .............................................................. 11-30
11.6.1 Key Findings ..................................................................................... 11-33 11.6.2 Recommendations ............................................................................. 11-33
DRAFT
LSWMP Update Table of Contents
City of Dallas, Texas v Burns & McDonnell
12.0 HHW AND ELECTRONICS MANAGEMENT ............................................... 12-1
12.1 Current System Review ..................................................................................... 12-1 12.2 Case Studies and Benchmarking ........................................................................ 12-7
12.2.1 Program Types and Participation Rates .............................................. 12-7 12.2.2 Curbside Collection ............................................................................ 12-9
12.2.3 Facility Expansions and Relocations ................................................ 12-10 12.3 Options Evaluation........................................................................................... 12-11
12.3.1 Enter New Agreement with County .................................................. 12-12 12.3.2 Develop New HCCC and/or Satellite Facility .................................. 12-13 12.3.3 Increase Number and Materials Accepted at HHW and BOPA
Collection Events .............................................................................. 12-14 12.4 Key Findings and Recommendations .............................................................. 12-15
12.4.1 Key Findings ....................................................................................... 12-1
12.4.2 Recommendations ............................................................................... 12-1
13.0 PUBLIC EDUCATION, OUTREACH AND COMPLIANCE ......................... 13-1
13.1 Overview of Components of a Successful Program .......................................... 13-1 13.2 Current System Review ..................................................................................... 13-2
13.3 Education, Outreach and Compliance Evaluation ............................................. 13-5 13.3.1 2011 LSWMP Recommendations....................................................... 13-5 13.3.2 Current Programs ................................................................................ 13-6
13.4 Case Studies and Benchmarking ........................................................................ 13-9 13.4.1 Targeted Education, Outreach and Compliance Efforts ..................... 13-9
13.4.2 Compliance Strategies ...................................................................... 13-10 13.4.3 Technology Integration for Program Feedback ................................ 13-11
13.4.4 Interactive Online Learning Modules ............................................... 13-12 13.4.5 Recycling Market Development ....................................................... 13-12
13.5 Key Findings and Recommendations .............................................................. 13-14 13.5.1 Key Findings ..................................................................................... 13-14 13.5.2 Recommendations ............................................................................. 13-16
APPENDIX A STAKEHOLDER ENGAGEMENT SUMMARY .............................. A-1
APPENDIX B REGIONAL FACILITY MAPS ...........................................................B-1
APPENDIX C - TRANSFER STATION SYSTEM REVIEW ..................................... C-1
Methodology ....................................................................................................................C-1
System Overview .............................................................................................................C-1 Hours of Operation ..............................................................................................C-3 Process Flow and Facility Configurations ...........................................................C-4 Inbound Material ................................................................................................C-21 Outbound Material .............................................................................................C-34
Equipment Requirements ...................................................................................C-38 Staffing Requirements .......................................................................................C-42 Capacity 44
DRAFT
LSWMP Update Table of Contents
City of Dallas, Texas vi Burns & McDonnell
APPENDIX D - REFUSE AND RECYCLING COLLECTION .................................. D-1
Methodology ................................................................................................................... D-1 Collection Overview ....................................................................................................... D-1
Collection Schedule ............................................................................................ D-6 Routes ............................................................................................................. D-7
Alley Collection .................................................................................................. D-9 Equipment ......................................................................................................... D-12 Staffing Requirements ...................................................................................... D-18 Customer Service .............................................................................................. D-21
APPENDIX E - LANDFILL OPERATION EVALUATION ........................................ E-1
Methodology .................................................................................................................... E-1
Landfill Operation Overview ........................................................................................... E-1 Comparison of 2011 LSWMP to Actual Disposal Rates ..................................... E-5 Airspace Utilization Factor .................................................................................. E-6 Staffing .............................................................................................................. E-6
Equipment .......................................................................................................... E-12 Waste Acceptance and Traffic Control .............................................................. E-14
Disposal Operations ........................................................................................... E-23 Leachate ............................................................................................................ E-27 Gas Collection and Control System ................................................................... E-29
Stormwater Management ................................................................................... E-31 Ancillary Site Infrastructure .............................................................................. E-31
APPENDIX F IMPLEMENTATION & FUNDING PLAN ......................................... F-1
DRAFT
LSWMP Update Table of Contents
City of Dallas, Texas vii Burns & McDonnell
LIST OF TABLES
Table ES-1: Description of Stakeholder Engagement Approaches ..........................................ES-2
Table ES-2: Description of How LSWMP Update Addresses CECAP Goals .........................ES-4 Table ES-3: Updated Goals by Sector ......................................................................................ES-5 Table ES-4: LSWMP Update Section Organization and Description ......................................ES-6 Table ES-5: Priority Next Steps by Sector .............................................................................ES-10 Table 1-1: Description of Stakeholder Engagement Approaches ............................................ 1-2
Table 1-2: Materials Management-Related CECAP Goal ....................................................... 1-9 Table 1-3: LSWMP Update Section Organization and Description ...................................... 1-11 Table 1-4: Example Summary of Options Evaluation ........................................................... 1-13 Table 2-1: Description of How LSWMP Update Addresses CECAP Goals ........................... 2-4 Table 2-2: Texas Cities with High Diversion or Recycling Goals ........................................ 2-17
Table 2-3: Summary of Texas Cities’ Efforts to Evaluate Conversion Technologies ........... 2-20 Table 2-4: Average Per-ton Landfill Tipping Fees ................................................................ 2-22
Table 2-5: Landfill Rate Policies ............................................................................................... 2-23 Table 2-6: Average Single-Stream Recyclables Processing Fees and Municipal
Revenue Shares .................................................................................................... 2-24 Table 2-7: Comparison Solid Waste Service of 10 Largest Texas Cities1 ............................ 2-27 Table 3-1: Number of Multi-family Properties by Size1 ......................................................... 3-3
Table 3-2: Employees in the DFW Metroplex1 ....................................................................... 3-7 Table 3-3: Generation Rate of Material ................................................................................... 3-8
Table 3-4: Material Generation Forecast ............................................................................... 3-10 Table 3-5: Material Generation Delivered to the Landfill Forecast by Sector and
Material Type ....................................................................................................... 3-11
Table 3-6: Tonnage Disposed in Landfills by Waste Type (2019) ........................................ 3-12
Table 3-7: Composition of MSW Disposed by Material Category (2019) ............................ 3-13 Table 3-8: Composition of MSW Disposed by Material Group/Category in Texas
versus United States (2019) .................................................................................. 3-14
Table 3-9: Composition of C&D Materials Disposed by Material Category (2019) ............ 3-15 Table 3-10: Regional Capture Rate by Individual Recyclable Materials ................................ 3-18 Table 3-11: 2020 Participating City and Dallas Capture Rate ................................................. 3-18
Table 4-1: NCTCOG Type I Landfill Disposal and Remaining Capacities, 2020 .................. 4-1 Table 4-2: Transfer Stations in NCTCOG Region .................................................................. 4-7 Table 4-3: NCTCOG Materials Recovery Facilities and Accepted Materials ...................... 4-10 Table 4-4: Organics Processing Facilities in NCTCOG Region ........................................... 4-13 Table 4-5: Regional Type IV Landfills ................................................................................. 4-16
Table 4-6: Examples of Public-private Partnership Options for Recycling Operations ........ 4-19
Table 5-1: Evaluation of 2011 LSWMP Recommendations ................................................... 5-4
Table 5-2: Transfer Station System Operational Challenges and Recommended
Upgrades ............................................................................................................... 5-12 Table 5-3: Estimated Replacement Cost of Transfer Buildings Systems/ Subsystems ......... 5-13 Table 5-4: High Level Cost Items of Major Transfer Station Expansion or Rebuild ............ 5-17 Table 5-5: Summary of Transfer Station System Options Evaluation .................................. 5-19
Table 6-1: Evaluation of 2011 LSWMP Recommendations ................................................... 6-4 Table 6-2: Single-Family Collection Schedule and Frequency Benchmarking ...................... 6-6
DRAFT
LSWMP Update Table of Contents
City of Dallas, Texas viii Burns & McDonnell
Table 6-3: Frontline and Backup Collection Vehicles ........................................................... 6-10 Table 6-4: Alley and Curbside Refuse Customers by District1 ............................................. 6-16
Table 6-5: Summary of Refuse and Recycling Collection Options Evaluation .................... 6-21 Table 7-1: Accepted Materials and Set Out Requirements ...................................................... 7-2 Table 7-2: Unacceptable Set Out Description and Disposal Instructions ................................ 7-4 Table 7-3: Storm Events Impacting Brush and Bulky Item Collection Operations FY
2018 to FY 20211 ................................................................................................... 7-6
Table 7-4: Customers Serviced by Sanitation District and Week of the Month1 .................... 7-8 Table 7-5: Scheduled Monthly Collection Areas by Sanitation District and Week of
the Month1 .............................................................................................................. 7-8 Table 7-6: Brush and Bulky Item Collection Vehicles1 ........................................................ 7-14 Table 7-7: Staffing Requirement by Equipment Configuration1 ........................................... 7-14
Table 7-8: Current Brush and Bulky Item Collection Staffing1 ............................................ 7-15
Table 7-9: FY 2020 Brush and Bulky Item Tons and Loads Disposed ................................. 7-17 Table 7-10: Previously Evaluated Brush and Bulky Item Collection Frequency
Scenarios1 ............................................................................................................. 7-17
Table 7-11: Brush and Bulky Item Separation Pilot Program ................................................. 7-18 Table 7-12: Separate Brush and Bulky Item Collection Pilot Tons Collected by
MonthResults1 ...................................................................................................... 7-20
Table 7-13: Evaluation of 2011 LSWMP Recommendations ................................................. 7-21 Table 7-14: Brush and Bulky Item Collection Benchmarking ................................................ 7-23
Table 7-15: Average Tonnage Collected per Household per Year1 ........................................ 7-27 Table 7-16: Additional Rotoboom and Rotocombo Comparison ............................................ 7-28 Table 7-17: Summary of Brush and Bulky Item Collection Options Evaluation .................... 7-33
Table 8-1: Evaluation of 2011 LSWMP Recommendations ................................................... 8-2
Table 8-2: City Landfill Pricing Summary and Regional Perspective .................................... 8-6 Table 8-3: Summary of Landfill System Options Evaluation ............................................... 8-19 Table 9-1: Annual Tons Delivered to FCC MRF .................................................................... 9-2
Table 9-2: Evaluation of 2011 LSWMP Recommendations ................................................... 9-4 Table 9-3: Recycling Processing Agreement Evaluation Matrix ............................................ 9-6
Table 10-1: Organic Material Types, Definition and Management ....................................... 10-10 Table 10-2: Projected FY 2021 and FY 2040 City and Non-City Collected Tonnages ........ 10-13 Table 10-3: Estimated FY 2021 and FY 2040 Divertible Organics Tonnage ....................... 10-14
Table 10-4: FY 2021 Potential Divertible Organic Materials by Capture Rate
Efficiency ........................................................................................................... 10-15 Table 10-5: Organics Processing Technologies ..................................................................... 10-15
Table 10-6: Evaluation of 2011 LSWMP Recommendations ............................................... 10-17 Table 10-7: Recycling Potential Based on Increasing Organics Processing Across
Operations .......................................................................................................... 10-25 Table 10-8: Public-Private Partnership Options for Third-Party Composting ...................... 10-27 Table 10-9: Summary of Organics Material Management Options Evaluation .................... 10-29 Table 11-1: Multi-Family Recycling Ordinance Requirements1 ............................................. 11-3 Table 11-2: Aggregated MFRO Reported Information ........................................................... 11-4
Table 11-3: CY 2020 Reported Recycling Processing Facilities ............................................ 11-4 Table 11-4: Historical Annual Franchise Fees Collected ........................................................ 11-8 Table 11-5: Franchise Hauler Reporting Efficiency ................................................................ 11-9
DRAFT
LSWMP Update Table of Contents
City of Dallas, Texas ix Burns & McDonnell
Table 11-6: Projected FY 2021 and FY 2040 Non-City Collected Tons .............................. 11-11 Table 11-7: Estimated FY 2021 and FY 2040 Divertible Tonnage ....................................... 11-11
Table 11-8: FY 2021 Potential Divertible Tons by Capture Rate Efficiency ........................ 11-13 Table 11-9: Evaluation of 2011 LSWMP Recommendations ............................................... 11-14 Table 11-10: Overview of Texas Municipalities’ Franchise Collection Systems and
Requirements ...................................................................................................... 11-21 Table 11-11: Summary of Multi-Family and Commercial Options Evaluation ...................... 11-31
Table 12-1: Participating Member Cities in Dallas County ILA ............................................ 12-3 Table 12-2: HHW and Electronics Collection Events and Participation ................................ 12-4 Table 12-3: Accepted Material Descriptions at HCCC and City-Hosted Events .................... 12-5 Table 12-4: Annual Dallas County HCCC Program Costs1 .................................................... 12-6 Table 12-5: Benchmarking Cities Programs and Days of Service .......................................... 12-7
Table 12-6: Summary of HHW and Electronics Management Options Evaluation .............. 12-16
Table 13-1: Evaluation of 2011 LSWMP Recommendations ................................................. 13-5 Table 13-2: Evaluation Matrix of City’s Education, Outreach and Compliance Efforts......... 13-7
Table 13-3: Challenging Material Types ............................................................................... 13-13
Table C-1: Hours of Operation by Facility1 .............................................................................C-3 Table C-2: Material Types Accepted by Facility ...................................................................C-21 Table C-3: Historical Average Tons per Day and Tons per Load by Facility .......................C-24
Table C-4: FY 2020 Average Inbound Tonnage by Day Delivered by Sanitation
Department ...........................................................................................................C-30
Table C-5: FY 2020 Outbound Transfer Trailer Average Ton per Load ..................................C-34 Table C-6: FY 2020 Outbound Transfer Trailer Average Ton per Load by Material
Type ......................................................................................................................C-34
Table C-7: FY 2020 Average Outbound Refuse Transfer Trailer Loads by Day ..................C-36
Table C-8: FY 2020 Average Outbound Recycling Transfer Trailer Loads by Day .............C-36 Table C-9: Transfer Building Operations Equipment ................................................................C-39 Table C-10: Transfer Load Round Trip Time (min) ................................................................C-40
Table C-11: Estimated Round Trips per Day by Facility .........................................................C-40 Table C-12: Minimum Required Daily Transfer Equipment ...................................................C-41
Table C-13: Transfer Station System Equipment List .............................................................C-41 Table C-14: Current Staffing for Transfer Station System Management and Operations .......C-42 Table C-15: Required HEO Daily Staffing .............................................................................C-43
Table C-16: Required Transfer Trailer Truck Driver Daily Staffing .......................................C-43 Table D-1: Residential Collection Customers by District and Material Type1 ....................... D-3 Table D-2: Commercial Roll Cart Collection Customers1 ...................................................... D-3
Table D-3: Refuse Customers Serviced by District and Day1 ................................................. D-7 Table D-4: Recycling Customers Serviced by District and Day1 ............................................ D-7
Table D-5: Daily Refuse Routes by District and Day ............................................................. D-8 Table D-6: Daily Recycling Routes by District and Day ........................................................ D-9 Table D-7: Alley and Curbside Refuse Customers by District .............................................. D-10 Table D-8: Frontline and Backup Collection Vehicles .......................................................... D-15 Table D-9: Required Daily Collection Equipment by Vehicle Type.................................... D-15
Table D-10: Collection Vehicles by Fuel Type ...................................................................... D-16 Table D-11: Collection Vehicle Storage Locations1 .............................................................. D-16 Table D-12: Average Age and Cost by Vehicle Type ............................................................ D-17
DRAFT
LSWMP Update Table of Contents
City of Dallas, Texas x Burns & McDonnell
Table D-13: Current Collection Operations Staffing1 ............................................................ D-19 Table D-14: Current Collection Operations Staffing by District1 .......................................... D-19
Table D-15: Supervisor Staffing ............................................................................................. D-20 Table D-16: Crew Structure by Collection Vehicle Type ...................................................... D-20 Table D-17: Required Equipment Operating Staff by Vehicle Type ..................................... D-20 Table D-18: FY 2020 Total Service Resolutions by Sanitation District1 ............................... D-21 Table D-19: FY 2020 Service Resolutions per Service Opportunity ..................................... D-21
Table E-1: Regulatory Operating Licenses Issued by TCEQ .................................................. E-2 Table E-2: Historical Annual Disposal Tons, Airspace Consumed and Remaining
Airspace .................................................................................................................. E-3 Table E-3: Historical Landfill Gate Rate ................................................................................ E-4 Table E-4: Landfill Discount Matrix ........................................................................................ E-4
Table E-5: Current Staffing for Landfill Management and Operations ................................... E-7
Table E-6: Required Equipment Operator Daily Staff Hours .................................................. E-8 Table E-7: Required Equipment Operator Staffing .................................................................. E-8
Table E-8: Required Laborer Daily Staff Hours ...................................................................... E-9
Table E-9: Required Laborer Staffing .................................................................................... E-10 Table E-10: Required CSR Daily Staff Hours ......................................................................... E-10 Table E-11: Required CSR Staffing ......................................................................................... E-11
Table E-12: Landfill Equipment List ....................................................................................... E-12 Table E-13: Equipment Replacement ...................................................................................... E-14
Table E-14: Youngblood Scalehouse and Simpson Stuart Scalehouse Single-day
Inbound Traffic Comparison (June 13, 2019) ...................................................... E-19
DRAFT
LSWMP Update Table of Contents
City of Dallas, Texas xi Burns & McDonnell
TABLE OF FIGURES
Figure ES-1: Control of Material by Sector ...............................................................................ES-3 Figure 1-1: Control of Material by Sector ................................................................................. 1-6
Figure 1-2: Pathway to 2030 LSWMP Update Goals in Single-Family Sector ........................ 1-8 Figure 2-1: U.S. EPA’s Waste Management Hierarchy ......................................................... 2-15 Figure 2-2: Circular Economy ................................................................................................ 2-15 Figure 2-3: National Average Landfill Tip Fees by Region, 2018 ............................................ 2-22 Figure 2-4: Single Stream Material Revenue (per Ton)1 ........................................................ 2-25
Figure 3-1: Historical Population Growth (2011-2021) ............................................................ 3-2 Figure 3-2: Population Projection (2021-2040) ........................................................................ 3-6 Figure 3-3: Material Generation Delivered to the Landfill Forecast by Sector ...................... 3-11 Figure 3-4: 2020 Regional Waste Composition of Residential Refuse, North Central
Texas .................................................................................................................... 3-16 Figure 3-5: 2020 Regional Recycling Composition of Residential Recycling, North
Central Texas ........................................................................................................ 3-17
Figure 4-1: Annual Regional Disposal, Type I and IV Landfills (Tons) .................................. 4-4 Figure 4-2: Projected NCTCOG Remaining Regional Types I and IV Landfill
Capacity, 2020-2045 .............................................................................................. 4-5 Figure 4-3: McCommas Bluff Landfill Facility1 ...................................................................... 4-6 Figure 4-4: MRF Building Located at the Landfill ................................................................. 4-11
Figure 4-5: Clean Yard Waste and Wood Processing Area .................................................... 4-14 Figure 4-6: Southside Wastewater Treatment Plant ................................................................ 4-15
Figure 4-7: Champion Construction MRF Materials Processing Line ................................... 4-16 Figure 5-1: Transfer Station Locations and Sanitation Department Collection Districts ......... 5-2
Figure 5-2: Bow Lake Recycling & Transfer Station ............................................................... 5-6 Figure 5-3: Conceptual Rendering of City of Georgetown Transfer Station ............................ 5-7
Figure 6-1: Sanitation Department Collection Districts and Collection Day Boundaries .......... 6-2 Figure 6-2: Annual Inbound Sanitation Department Collected Refuse and Recycling
by Facility1 ............................................................................................................. 6-3
Figure 6-3: Average FY 2016 -FY 2020 Annual Sanitation Department Refuse and
Recycling by Collection District1 ........................................................................... 6-3 Figure 7-1: FY 2021 Oversize Brush and Bulky Item Set Out Violations ............................... 7-3
Figure 7-2: Historical Annual Brush and Bulky Item Collection by Facility ........................... 7-5 Figure 7-3: FY 2020 Brush and Bulky Item Processed at Transfer Stations by Month ........... 7-6 Figure 7-4: Example of Parked Car Blocking Brush and Bulky Item Set Out ....................... 7-10 Figure 7-5: Brush and Bulky Item Collection Crew Measuring Oversize Set Out ................. 7-11 Figure 7-6: Rotoboom and Long Truck Collection ................................................................. 7-12
Figure 7-7: 60 CY Rotocombo Collection ............................................................................. 7-13 Figure 7-8: Average Annual Inbound Tons by Sanitation District and Facility FY
2016 - FY 2020 .................................................................................................... 7-16 Figure 8-1: Reported Average Gate Rates Charged in the NCTCOG Region (2020)1 ............. 8-9 Figure 9-1: FCC MRF and Ancillary Infrastructure and Buildings .......................................... 9-2 Figure 10-1: Food Recovery Hierarchy .................................................................................. 10-11 Figure 12-1: Dallas County HCCC .......................................................................................... 12-2 Figure 12-2: BOPA Event Vehicle ........................................................................................... 12-4 Figure 12-3: Smarter Sorting Scanning and Weighing Equipment........................................... 12-9
DRAFT
LSWMP Update Table of Contents
City of Dallas, Texas xii Burns & McDonnell
Figure 13-1: Social Media and Example Bill Insert from the NCTCOG Regional
Campaign ............................................................................................................. 13-6
Figure C-1: Transfer Station Locations and Sanitation Department Collection Districts .........C-2 Figure C-2: Bachman Facility Layout .......................................................................................C-6 Figure C-3: Dry Gulch Recycling Center Material Collection ..................................................C-7 Figure C-4: Bachman Transfer Building Configuration ............................................................C-8 Figure C-5: Customers Unloading Material at Bachman Facility .............................................C-9
Figure C-6: Recyclables Stored in Front of Direct Load Hopper at Bachman Facility ...........C-10 Figure C-7: Waste Storage Pit Wall Structural Damage at Bachman Facility ........................C-11 Figure C-8: Transfer Trailer Tunnel at Bachman Facility .......................................................C-12 Figure C-9: Fair Oaks Facility Layout .....................................................................................C-13 Figure C-10: Fair Oaks Facility Configuration ..........................................................................C-14
Figure C-11: Fair Oaks Entrance, Exit and Scalehouse .............................................................C-14
Figure C-12: Customers Unloading Material at Fair Oaks Facility ...........................................C-15 Figure C-13: Fair Oaks Facility Tipping Area ...........................................................................C-15
Figure C-14: Fair Oaks Facility Transfer Trailer Truck Pull Through Location .......................C-16
Figure C-15: Westmoreland Facility Layout .............................................................................C-17 Figure C-16: Westmoreland Facility Configuration ..................................................................C-18 Figure C-17: Inbound Scale at Westmoreland Facility..............................................................C-19
Figure C-18: Westmoreland Facility Hoppers ...........................................................................C-20 Figure C-19: Westmoreland Facility Transfer Trailer Truck Pull Through Location ...............C-20
Figure C-20: Recycling Drop off Bins at Westmoreland Facility .............................................C-21 Figure C-21: Historical Annual Transactions in Transfer System ............................................C-22 Figure C-22: Historical Annual Number of Residential Customers at Bachman Facility .........C-23
Figure C-23: Historical Annual Tonnage Disposed in Transfer System ...................................C-24
Figure C-24: Average Annual Transactions by Customer Type ...............................................C-25 Figure C-25: Average Annual Tonnage Disposed by Customer Type ......................................C-26 Figure C-26: Average Annual Tons per Day by Customer Type ..............................................C-26
Figure C-27: Average Tons per Load by Customer Type .........................................................C-27 Figure C-28: Historical Average Annual Tonnage Disposed by Material Type .......................C-28
Figure C-29: Average Historical Tons per Load by Material Type Hauled by Sanitation
Department Customers .........................................................................................C-28 Figure C-30: FY 2020 Inbound Tons and Load by Day Delivered by Sanitation
Department ...........................................................................................................C-30 Figure C-31: FY 2020 Annual Inbound Transactions by Hour and Customer Type ................C-31 Figure C-32: Inbound Transactions by Hour for Select Mondays in FY 2020 .........................C-33
Figure C-33: FY 2020 Outbound Transfer Trailer Tons by Material Type ...............................C-35 Figure C-34: FY 2020 Comparison of Refuse and Recycling Transfer Loads and Tons ..........C-37
Figure C-35: FY 2020 Annual Refuse Outbound Transactions by Hour and Facility ..............C-38 Figure C-36: Peak Historical Inbound Tonnage vs. Design Capacity. ......................................C-44 Figure D-1: Sanitation Department Collection Districts and Collection Day
Boundaries ............................................................................................................. D-2 Figure D-2: Annual Inbound Sanitation Department Collected Refuse and Recycling
by Facility1 ............................................................................................................ D-4 Figure D-3: Average Annual Sanitation Department Refuse and Recycling by
Collection District1 ................................................................................................ D-5
DRAFT
LSWMP Update Table of Contents
City of Dallas, Texas xiii Burns & McDonnell
Figure D-4: ASL and SA Alley Collection ............................................................................. D-10 Figure D-5: Automated Side Load Collection Vehicle ........................................................... D-13
Figure D-6: Semi-Automated Rear Load Collection Vehicle ................................................. D-13 Figure D-7: Alley Cat Collection Vehicle .............................................................................. D-14 Figure D-8: PUP Collection Vehicle ...................................................................................... D-14 Figure E-1: Currently Constructed and Planned Landfill Cells ................................................ E-2 Figure E-2: Historical Landfill Disposal Tons .......................................................................... E-5
Figure E-3: Heavy Equipment Maintenance Shop .................................................................. E-13 Figure E-4: Youngblood Scalehouse ....................................................................................... E-15 Figure E-5: Landfill Scales and Scalehouse Locations ........................................................... E-16 Figure E-6: Overhead Snapshot of Traffic at Youngblood Scalehouse .................................. E-17 Figure E-7: Annual Customer Summary by Total Transactions and Tons, FY 2019 ............. E-18
Figure E-8: Youngblood Scalehouse and Simpson Stuart Scalehouse Single-day
Customer Type Comparison (June 13, 2019) ....................................................... E-20 Figure E-9: Youngblood Scalehouse and Simpson Stuart Scales Single-Day Vehicle
Type Comparison (June 13, 2019)1 ...................................................................... E-20
Figure E-10: Self-Haul Customer Transaction at Youngblood Scalehouse .............................. E-21 Figure E-11: Single-Day Hourly Scalehouse Customers by Vehicle Type at
Youngblood Scalehouse (June 13, 2019) ............................................................. E-22
Figure E-12: Single-Day Hourly Scalehouse Customers at Simpson Stuart scales (June
13, 2019) ............................................................................................................... E-22
Figure E-13: Conventional Collection Vehicle Ejecting Material on Tipping Deck ................ E-23 Figure E-14: Landfill Working Face and Vehicle Queue .......................................................... E-24 Figure E-15: Alternative Daily Cover Tarp ............................................................................... E-26
Figure E-16: ADC Spray Pellets and Hydroseeder ................................................................... E-27
Figure E-17: Historical Leachate and Condensate Managed at Landfill ................................... E-29 Figure E-18: Historical Gas Generation at Landfill .................................................................. E-29 Figure E-19: Landfill Gas-to-Energy Plant ............................................................................... E-30
Figure E-20: CCRC Permanent Pole-Barn Structure ................................................................ E-32 Figure E-21: CCC Transfer Trailer and Metal Recycling Roll-Off Containers ........................ E-32
Figure E-22: Administration Building ....................................................................................... E-33 Figure E-23: Yard Waste Grinding Operation .......................................................................... E-33 Figure E-24: Mobile Litter Control and Secondary Litter Control Fences ............................... E-34
DRAFT
LSWMP Update Table of Contents
City of Dallas, Texas xiv Burns & McDonnell
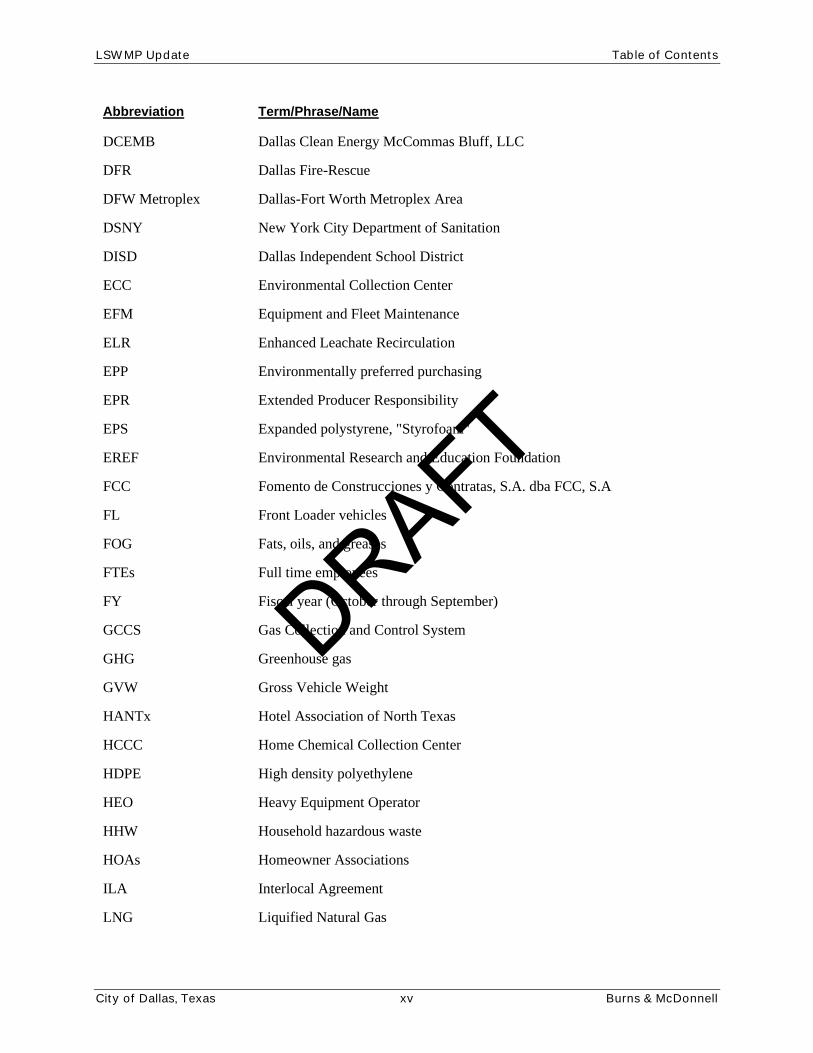
LIST OF ABBREVIATIONS
Abbreviation Term/Phrase/Name
AAGD Apartment Association of Greater Dallas
AC Alley Cat
AD Anaerobic digestion
ADT Articulating Dump Truck
ASL Automated Side Loader vehicles
AUF Airspace Utilization Factor
BEV Battery Electric Vehicle
BIC New York City Business Integrity Commission
BOMA Building Office Managers Association
BOPA Battery, Oil, Paint, and Antifreeze
Burns & McDonnell Burns & McDonnell Engineering Company, Inc.
BTU British Thermal Unit
C&D Construction and Demolition Debris
CAA Clean Air Act of 1976
CCC Customer Convenience Center
CCRC Customer Convenience and Recycling Center
CECAP Comprehensive Environmental and Climate Action Plan
CERCLA Comprehensive Environmental Response, Compensation, and Liability Act
CHP Combined Heat and Power
CIP Capital Improvement Plan
City The City of Dallas
CNG Compressed Natural Gas
COG Council of Governments
CPI Consumer Price Index
CPT Certified power train
CSR Customer Service Representative
CY Cubic Yard
DRAFT
LSWMP Update Table of Contents
City of Dallas, Texas xv Burns & McDonnell
Abbreviation Term/Phrase/Name
DCEMB Dallas Clean Energy McCommas Bluff, LLC
DFR Dallas Fire-Rescue
DFW Metroplex Dallas-Fort Worth Metroplex Area
DSNY New York City Department of Sanitation
DISD Dallas Independent School District
ECC Environmental Collection Center
EFM Equipment and Fleet Maintenance
ELR Enhanced Leachate Recirculation
EPP Environmentally preferred purchasing
EPR Extended Producer Responsibility
EPS Expanded polystyrene, "Styrofoam"
EREF Environmental Research and Education Foundation
FCC Fomento de Construcciones y Contratas, S.A. dba FCC, S.A
FL Front Loader vehicles
FOG Fats, oils, and greases
FTEs Full time employees
FY Fiscal year (October through September)
GCCS Gas Collection and Control System
GHG Greenhouse gas
GVW Gross Vehicle Weight
HANTx Hotel Association of North Texas
HCCC Home Chemical Collection Center
HDPE High density polyethylene
HEO Heavy Equipment Operator
HHW Household hazardous waste
HOAs Homeowner Associations
ILA Interlocal Agreement
LNG Liquified Natural Gas
DRAFT
LSWMP Update Table of Contents
City of Dallas, Texas xvi Burns & McDonnell
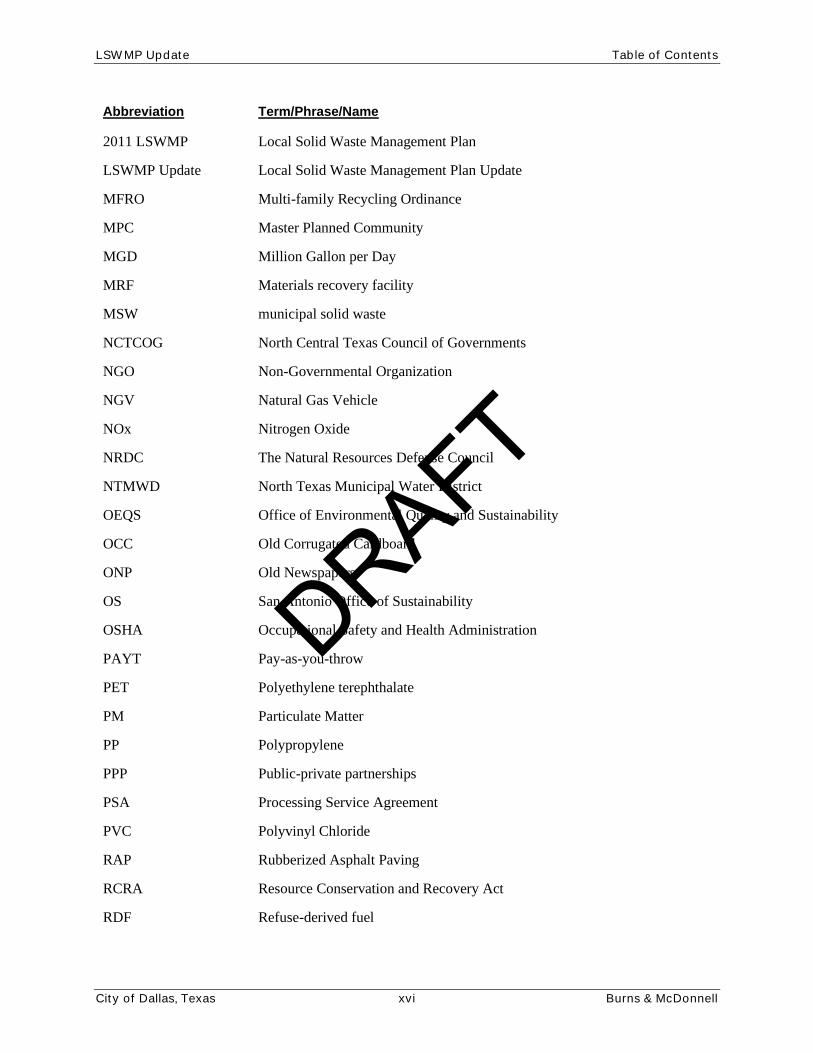
Abbreviation Term/Phrase/Name
2011 LSWMP Local Solid Waste Management Plan
LSWMP Update Local Solid Waste Management Plan Update
MFRO Multi-family Recycling Ordinance
MPC Master Planned Community
MGD Million Gallon per Day
MRF Materials recovery facility
MSW municipal solid waste
NCTCOG North Central Texas Council of Governments
NGO Non-Governmental Organization
NGV Natural Gas Vehicle
NOx Nitrogen Oxide
NRDC The Natural Resources Defense Council
NTMWD North Texas Municipal Water District
OEQS Office of Environmental Quality and Sustainability
OCC Old Corrugated Cardboard
ONP Old Newspapers
OS San Antonio Office of Sustainability
OSHA Occupational Safety and Health Administration
PAYT Pay-as-you-throw
PET Polyethylene terephthalate
PM Particulate Matter
PP Polypropylene
PPP Public-private partnerships
PSA Processing Service Agreement
PVC Polyvinyl Chloride
RAP Rubberized Asphalt Paving
RCRA Resource Conservation and Recovery Act
RDF Refuse-derived fuel
DRAFT
LSWMP Update Table of Contents
City of Dallas, Texas xvii Burns & McDonnell
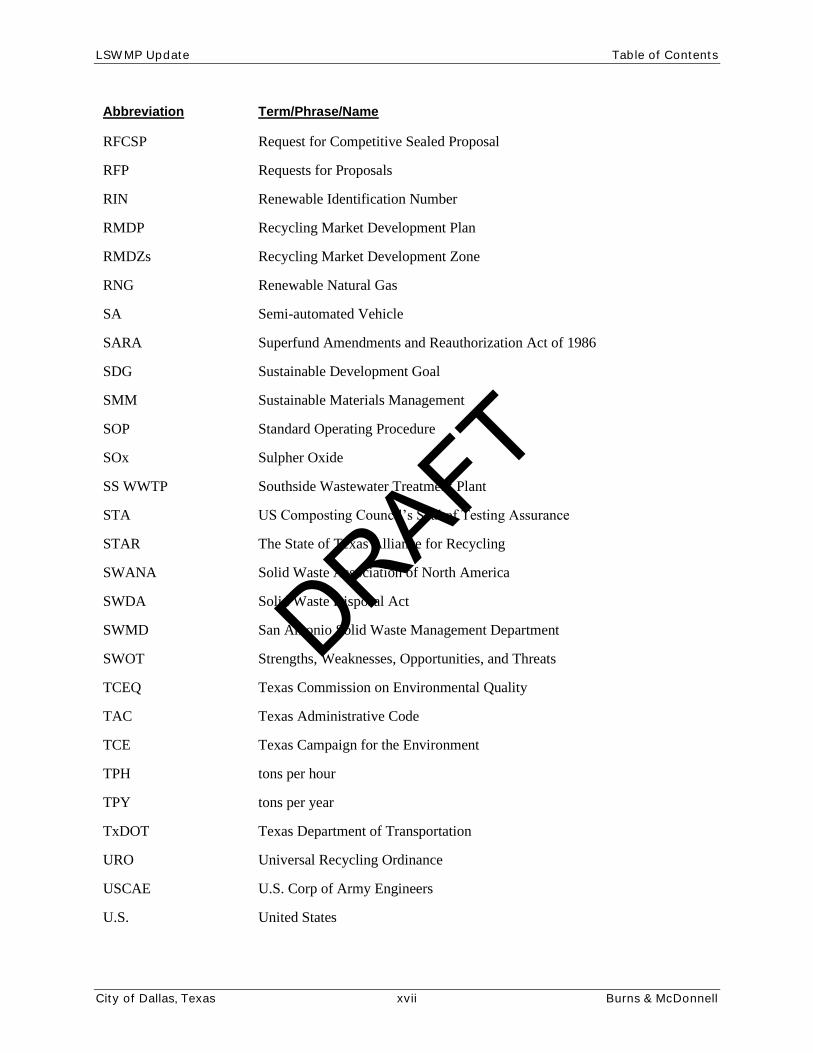
Abbreviation Term/Phrase/Name
RFCSP Request for Competitive Sealed Proposal
RFP Requests for Proposals
RIN Renewable Identification Number
RMDP Recycling Market Development Plan
RMDZs Recycling Market Development Zone
RNG Renewable Natural Gas
SA Semi-automated Vehicle
SARA Superfund Amendments and Reauthorization Act of 1986
SDG Sustainable Development Goal
SMM Sustainable Materials Management
SOP Standard Operating Procedure
SOx Sulpher Oxide
SS WWTP Southside Wastewater Treatment Plant
STA US Composting Council’s Seal of Testing Assurance
STAR The State of Texas Alliance for Recycling
SWANA Solid Waste Association of North America
SWDA Solid Waste Disposal Act
SWMD San Antonio Solid Waste Management Department
SWOT Strengths, Weaknesses, Opportunities, and Threats
TCEQ Texas Commission on Environmental Quality
TAC Texas Administrative Code
TCE Texas Campaign for the Environment
TPH tons per hour
TPY tons per year
TxDOT Texas Department of Transportation
URO Universal Recycling Ordinance
USCAE U.S. Corp of Army Engineers
U.S. United States
DRAFT
LSWMP Update Table of Contents
City of Dallas, Texas xviii Burns & McDonnell
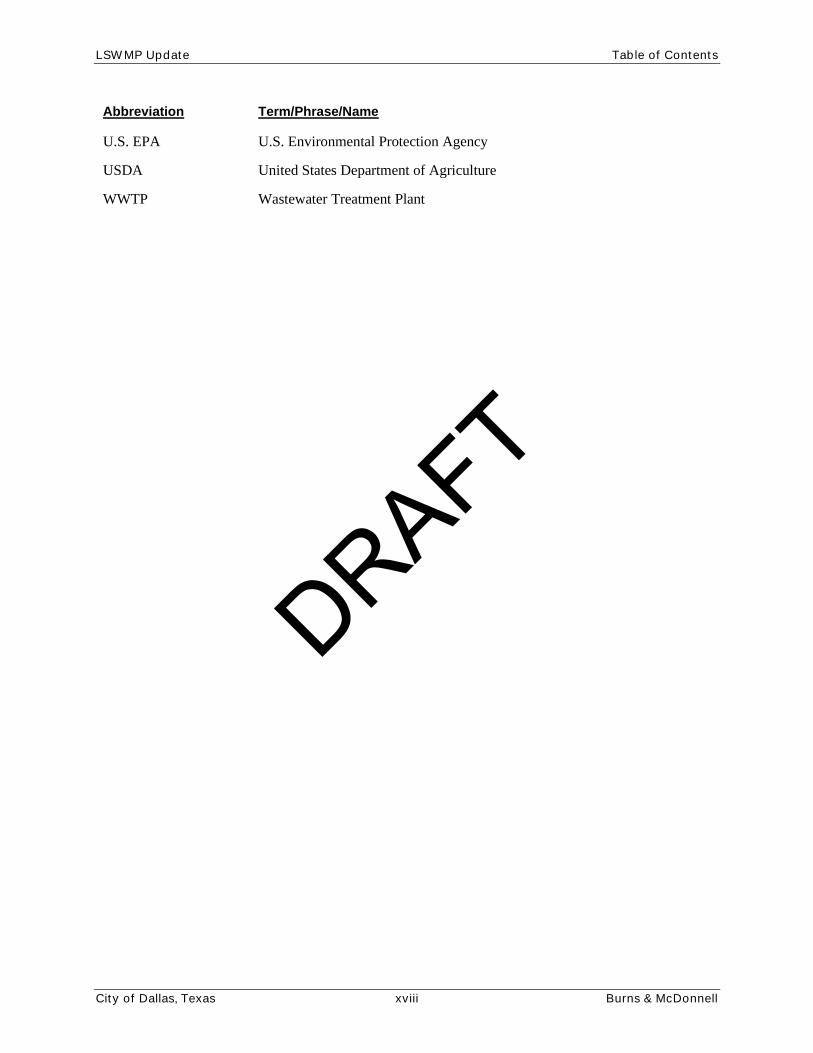
Abbreviation Term/Phrase/Name
U.S. EPA U.S. Environmental Protection Agency
USDA United States Department of Agriculture
WWTP Wastewater Treatment Plant
DRAFT
LSWMP Update Executive Summary
City of Dallas, Texas ES-1 Burns & McDonnell
EXECUTIVE SUMMARY
Purpose
The City of Dallas’ (City) Local Solid Waste Management Plan Update (LSWMP Update) evaluates
progress toward the goals and recommendations in the 2011 LSWMP adopted by City Council in
February 2013. The purpose of the LSWMP Update is to identify current and future material
management needs, evaluate programs, policies, and infrastructure options for meeting these needs, and
to define a course of action for managing future waste generated in the City. The City and its consultant,
Burns & McDonnell Engineering Company, Inc. (Burns & McDonnell), developed the LSWMP Update
by evaluating existing programs, policies and infrastructure and analyzing progress the City has made
over the last decade toward the previously adopted goals and recommendations. The intent is to establish
goals, objectives and recommendations that offer strategic direction for the City to establish a resilient
material management system that provides the ability to continue advancing progress towards Zero Waste
in alignment with the City’s Comprehensive Environmental & Climate Action Plan (CECAP).
Stakeholder Engagement
The LSWMP Update development process engaged stakeholders from the community and multiple City
departments. Community stakeholders included representatives from multiple generator sectors (sectors
include single-family, multi-family and commercial and are further described in the Updated Goals and
Objectives section) for the purpose of gathering insight and opinions regarding the current material
management systems and needs for the future of the system. The City engaged multiple stakeholder
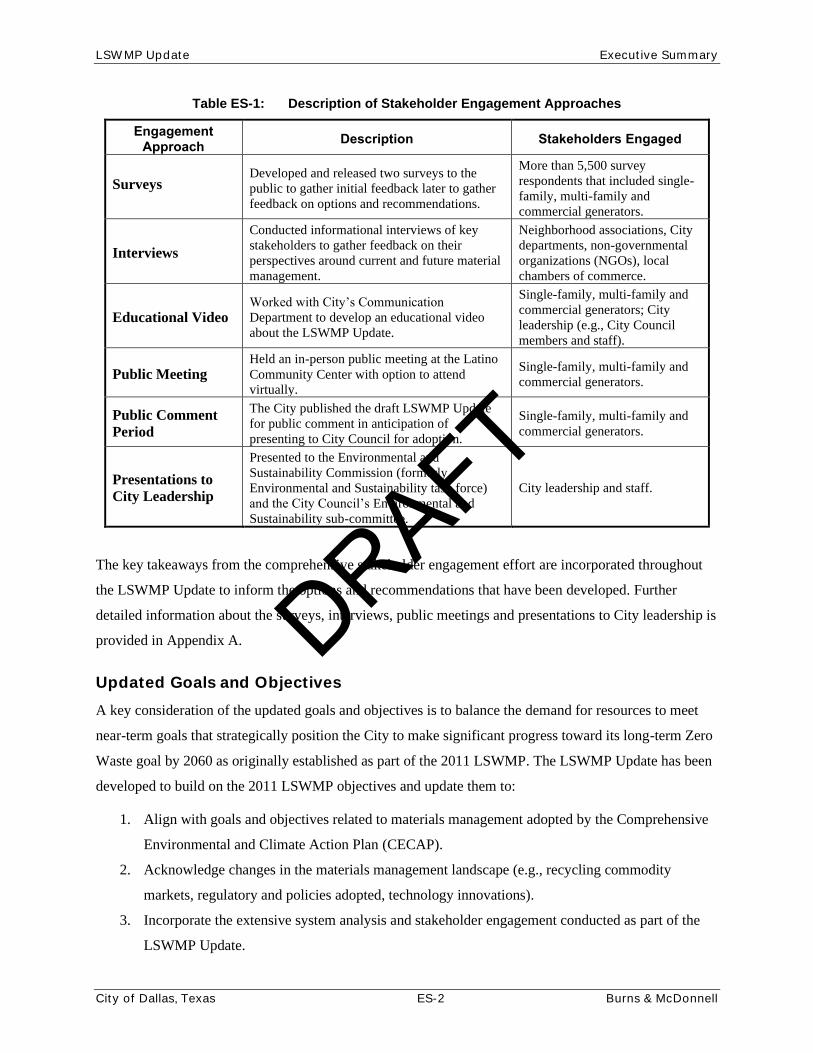
groups throughout the LSWMP Update development process. Table ES-1 describes the City’s
engagement approach and stakeholders.
DRAFT
LSWMP Update Executive Summary
City of Dallas, Texas ES-2 Burns & McDonnell
Table ES-1: Description of Stakeholder Engagement Approaches
Engagement Approach
Description Stakeholders Engaged
Surveys Developed and released two surveys to the
public to gather initial feedback later to gather
feedback on options and recommendations.
More than 5,500 survey
respondents that included single-
family, multi-family and
commercial generators.
Interviews
Conducted informational interviews of key
stakeholders to gather feedback on their
perspectives around current and future material
management.
Neighborhood associations, City
departments, non-governmental
organizations (NGOs), local
chambers of commerce.
Educational Video Worked with City’s Communication
Department to develop an educational video
about the LSWMP Update.
Single-family, multi-family and
commercial generators; City
leadership (e.g., City Council
members and staff).
Public Meeting Held an in-person public meeting at the Latino
Community Center with option to attend
virtually.
Single-family, multi-family and
commercial generators.
Public Comment
Period
The City published the draft LSWMP Update
for public comment in anticipation of
presenting to City Council for adoption.
Single-family, multi-family and
commercial generators.
Presentations to
City Leadership
Presented to the Environmental and
Sustainability Commission (formerly
Environmental and Sustainability task force)
and the City Council’s Environmental and
Sustainability sub-committee.
City leadership and staff.
The key takeaways from the comprehensive stakeholder engagement effort are incorporated throughout
the LSWMP Update to inform the options and recommendations that have been developed. Further
detailed information about the surveys, interviews, public meetings and presentations to City leadership is
provided in Appendix A.
Updated Goals and Objectives
A key consideration of the updated goals and objectives is to balance the demand for resources to meet
near-term goals that strategically position the City to make significant progress toward its long-term Zero
Waste goal by 2060 as originally established as part of the 2011 LSWMP. The LSWMP Update has been
developed to build on the 2011 LSWMP objectives and update them to:
1. Align with goals and objectives related to materials management adopted by the Comprehensive
Environmental and Climate Action Plan (CECAP).
2. Acknowledge changes in the materials management landscape (e.g., recycling commodity
markets, regulatory and policies adopted, technology innovations).
3. Incorporate the extensive system analysis and stakeholder engagement conducted as part of the
LSWMP Update.
DRAFT
LSWMP Update Executive Summary
City of Dallas, Texas ES-3 Burns & McDonnell
The following updated objectives are meant to guide policies, programs and infrastructure to support
progress toward the City’s near- and long-term goals.
1. Empower residents and businesses to reduce the amount of discarded material generated through
proactive education, outreach and compliance efforts.
2. Establish and implement innovative operational best practices to provide efficient, cost effective,
and environmentally responsible service.
3. Provide excellent customer service and support residents and businesses to maximize diversion
from landfill.
4. Operate a clean, green and efficient waste system that seeks to generate energy from organics.
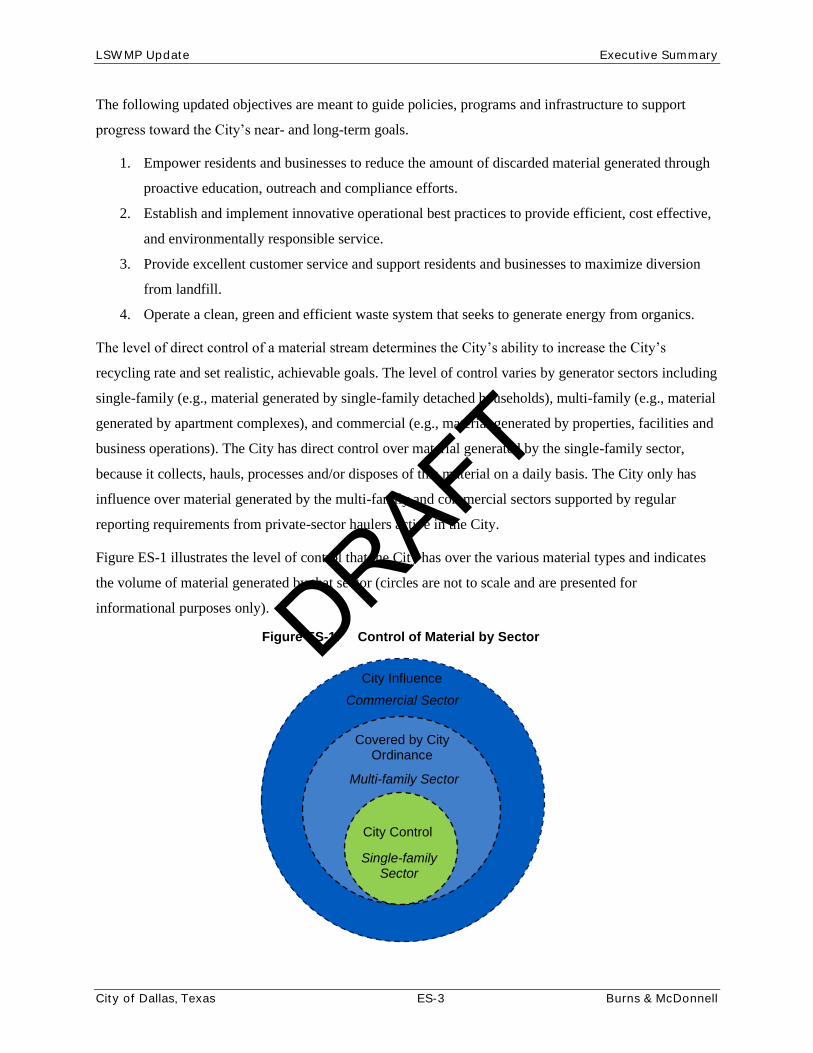
The level of direct control of a material stream determines the City’s ability to increase the City’s
recycling rate and set realistic, achievable goals. The level of control varies by generator sectors including
single-family (e.g., material generated by single-family detached households), multi-family (e.g., material
generated by apartment complexes), and commercial (e.g., material generated by properties, facilities and
business operations). The City has direct control over material generated by the single-family sector,
because it collects, hauls, processes and/or disposes of this material on a daily basis. The City only has
influence over material generated by the multi-family and commercial sectors supported by regular
reporting requirements from private-sector haulers active in the City.
Figure ES-1 illustrates the level of control that the City has over the various material types and indicates
the volume of material generated by that sector (circles are not to scale and are presented for
informational purposes only).
City Influence
City Control
Covered by City Ordinance
Commercial Sector
Multi-family Sector
Single-family Sector
Figure ES-1: Control of Material by Sector DRAFT
LSWMP Update Executive Summary
City of Dallas, Texas ES-4 Burns & McDonnell
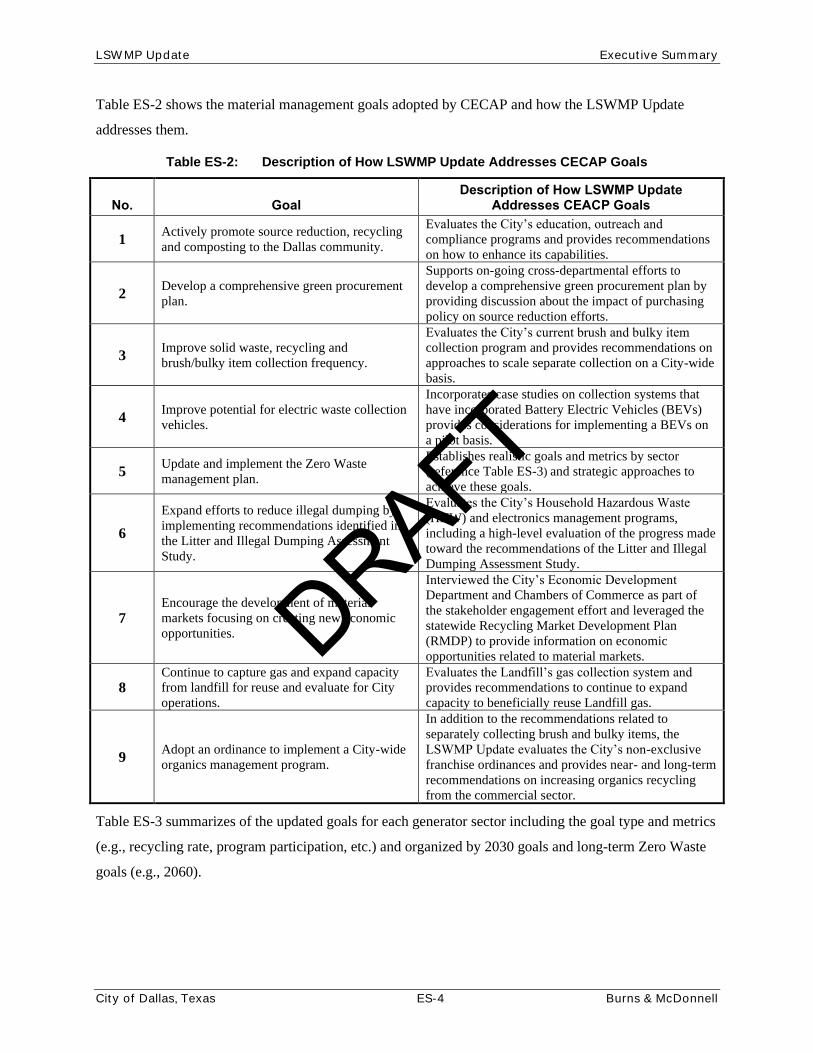
Table ES-2 shows the material management goals adopted by CECAP and how the LSWMP Update
addresses them.
Table ES-2: Description of How LSWMP Update Addresses CECAP Goals
No. Goal Description of How LSWMP Update
Addresses CEACP Goals
1 Actively promote source reduction, recycling
and composting to the Dallas community.
Evaluates the City’s education, outreach and
compliance programs and provides recommendations
on how to enhance its capabilities.
2 Develop a comprehensive green procurement
plan.
Supports on-going cross-departmental efforts to
develop a comprehensive green procurement plan by
providing discussion about the impact of purchasing
policy on source reduction efforts.
3 Improve solid waste, recycling and
brush/bulky item collection frequency.
Evaluates the City’s current brush and bulky item
collection program and provides recommendations on
approaches to scale separate collection on a City-wide
basis.
4 Improve potential for electric waste collection
vehicles.
Incorporates case studies on collection systems that
have incorporated Battery Electric Vehicles (BEVs)
provides considerations for implementing a BEVs on
a pilot basis.
5 Update and implement the Zero Waste
management plan.
Establishes realistic goals and metrics by sector
(reference Table ES-3) and strategic approaches to
achieve these goals.
6
Expand efforts to reduce illegal dumping by
implementing recommendations identified in
the Litter and Illegal Dumping Assessment
Study.
Evaluates the City’s Household Hazardous Waste
(HHW) and electronics management programs,
including a high-level evaluation of the progress made
toward the recommendations of the Litter and Illegal
Dumping Assessment Study.
7 Encourage the development of material
markets focusing on creating new economic
opportunities.
Interviewed the City’s Economic Development
Department and Chambers of Commerce as part of
the stakeholder engagement effort and leveraged the
statewide Recycling Market Development Plan
(RMDP) to provide information on economic
opportunities related to material markets.
8 Continue to capture gas and expand capacity
from landfill for reuse and evaluate for City
operations.
Evaluates the Landfill’s gas collection system and
provides recommendations to continue to expand
capacity to beneficially reuse Landfill gas.
9 Adopt an ordinance to implement a City-wide
organics management program.
In addition to the recommendations related to
separately collecting brush and bulky items, the
LSWMP Update evaluates the City’s non-exclusive
franchise ordinances and provides near- and long-term
recommendations on increasing organics recycling
from the commercial sector.
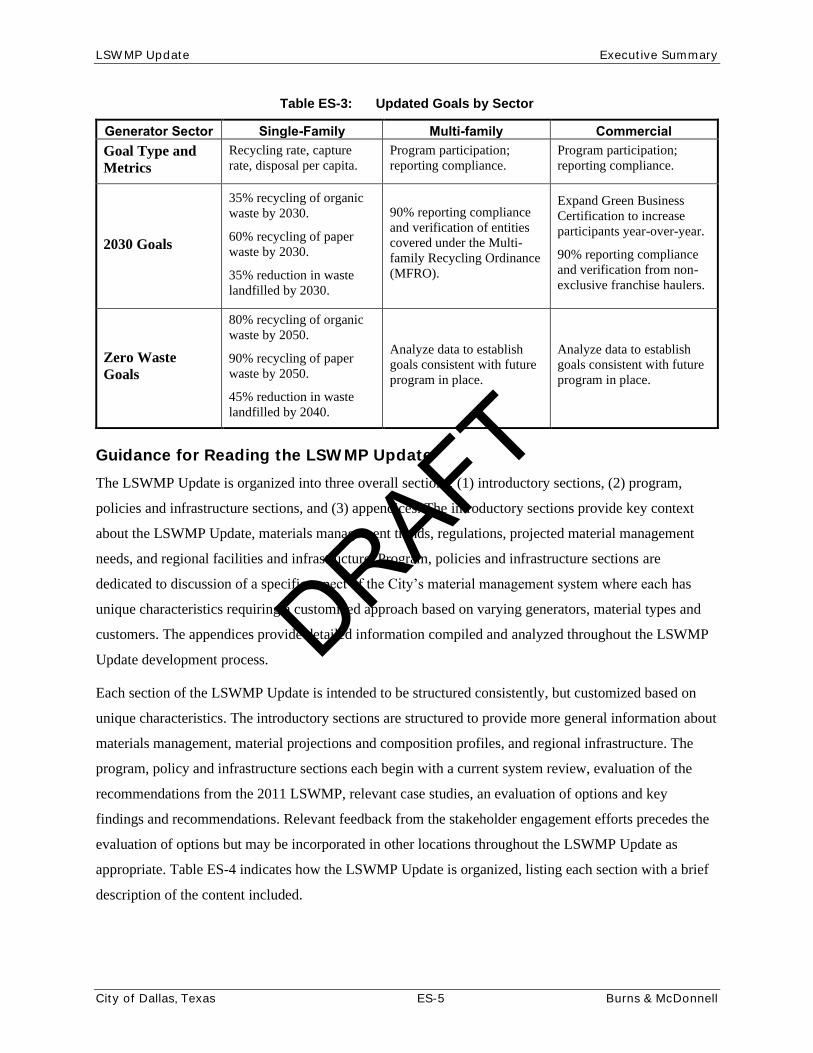
Table ES-3 summarizes of the updated goals for each generator sector including the goal type and metrics
(e.g., recycling rate, program participation, etc.) and organized by 2030 goals and long-term Zero Waste
goals (e.g., 2060).
DRAFT
LSWMP Update Executive Summary
City of Dallas, Texas ES-5 Burns & McDonnell
Table ES-3: Updated Goals by Sector
Generator Sector Single-Family Multi-family Commercial
Goal Type and
Metrics
Recycling rate, capture
rate, disposal per capita.
Program participation;
reporting compliance.
Program participation;
reporting compliance.
2030 Goals
35% recycling of organic
waste by 2030.
60% recycling of paper
waste by 2030.
35% reduction in waste
landfilled by 2030.
90% reporting compliance
and verification of entities
covered under the Multi-
family Recycling Ordinance
(MFRO).
Expand Green Business
Certification to increase
participants year-over-year.
90% reporting compliance
and verification from non-
exclusive franchise haulers.
Zero Waste
Goals
80% recycling of organic
waste by 2050.
90% recycling of paper
waste by 2050.
45% reduction in waste
landfilled by 2040.
Analyze data to establish
goals consistent with future
program in place.
Analyze data to establish
goals consistent with future
program in place.
Guidance for Reading the LSWMP Update
The LSWMP Update is organized into three overall sections: (1) introductory sections, (2) program,
policies and infrastructure sections, and (3) appendices. The introductory sections provide key context
about the LSWMP Update, materials management trends, regulations, projected material management
needs, and regional facilities and infrastructure. Program, policies and infrastructure sections are
dedicated to discussion of a specific aspect of the City’s material management system where each has
unique characteristics requiring a customized approach based on varying generators, material types and
customers. The appendices provide detailed information compiled and analyzed throughout the LSWMP
Update development process.
Each section of the LSWMP Update is intended to be structured consistently, but customized based on
unique characteristics. The introductory sections are structured to provide more general information about
materials management, material projections and composition profiles, and regional infrastructure. The
program, policy and infrastructure sections each begin with a current system review, evaluation of the
recommendations from the 2011 LSWMP, relevant case studies, an evaluation of options and key
findings and recommendations. Relevant feedback from the stakeholder engagement efforts precedes the
evaluation of options but may be incorporated in other locations throughout the LSWMP Update as
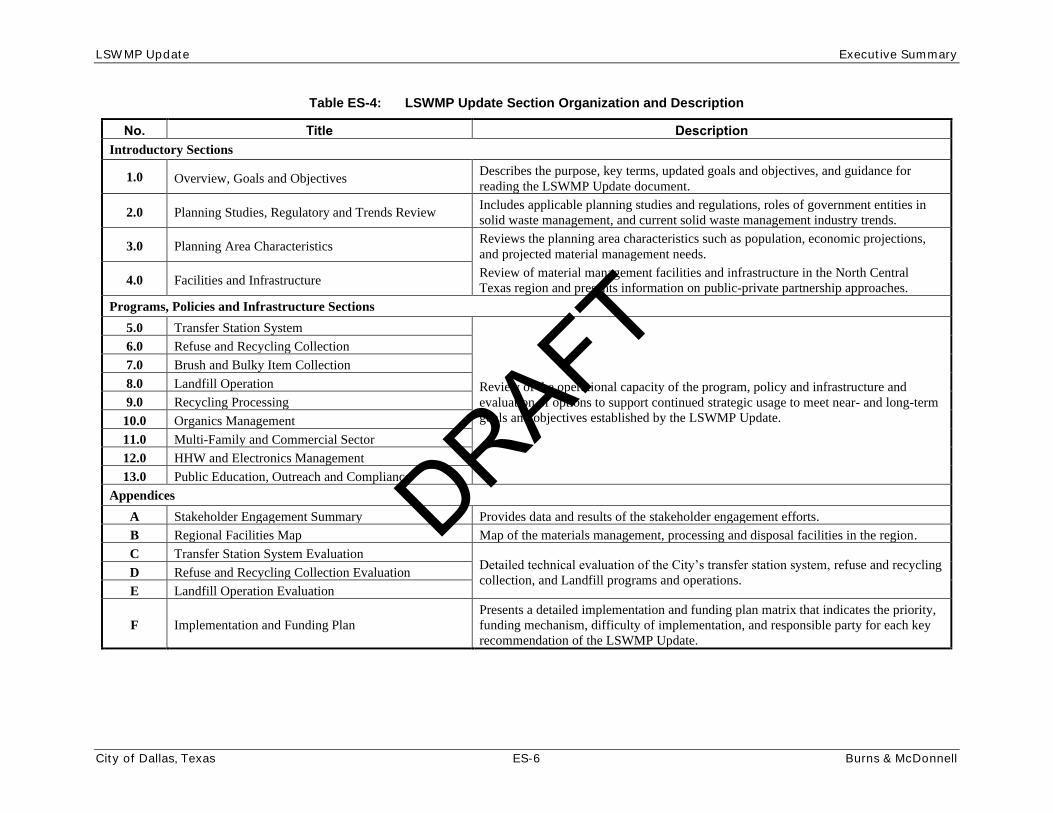
appropriate. Table ES-4 indicates how the LSWMP Update is organized, listing each section with a brief
description of the content included.
DRAFT
LSWMP Update Executive Summary
City of Dallas, Texas ES-6 Burns & McDonnell
Table ES-4: LSWMP Update Section Organization and Description
No. Title Description
Introductory Sections
1.0 Overview, Goals and Objectives Describes the purpose, key terms, updated goals and objectives, and guidance for
reading the LSWMP Update document.
2.0 Planning Studies, Regulatory and Trends Review Includes applicable planning studies and regulations, roles of government entities in
solid waste management, and current solid waste management industry trends.
3.0 Planning Area Characteristics Reviews the planning area characteristics such as population, economic projections,
and projected material management needs.
4.0 Facilities and Infrastructure Review of material management facilities and infrastructure in the North Central
Texas region and presents information on public-private partnership approaches.
Programs, Policies and Infrastructure Sections
5.0 Transfer Station System
Review of the operational capacity of the program, policy and infrastructure and
evaluation of options to support continued strategic usage to meet near- and long-term
goals and objectives established by the LSWMP Update.
6.0 Refuse and Recycling Collection
7.0 Brush and Bulky Item Collection
8.0 Landfill Operation
9.0 Recycling Processing
10.0 Organics Management
11.0 Multi-Family and Commercial Sector
12.0 HHW and Electronics Management
13.0 Public Education, Outreach and Compliance
Appendices
A Stakeholder Engagement Summary Provides data and results of the stakeholder engagement efforts.
B Regional Facilities Map Map of the materials management, processing and disposal facilities in the region.
C Transfer Station System Evaluation Detailed technical evaluation of the City’s transfer station system, refuse and recycling
collection, and Landfill programs and operations. D Refuse and Recycling Collection Evaluation
E Landfill Operation Evaluation
F Implementation and Funding Plan
Presents a detailed implementation and funding plan matrix that indicates the priority,
funding mechanism, difficulty of implementation, and responsible party for each key
recommendation of the LSWMP Update.
DRAFT
LSWMP Update Executive Summary
City of Dallas, Texas ES-7 Burns & McDonnell
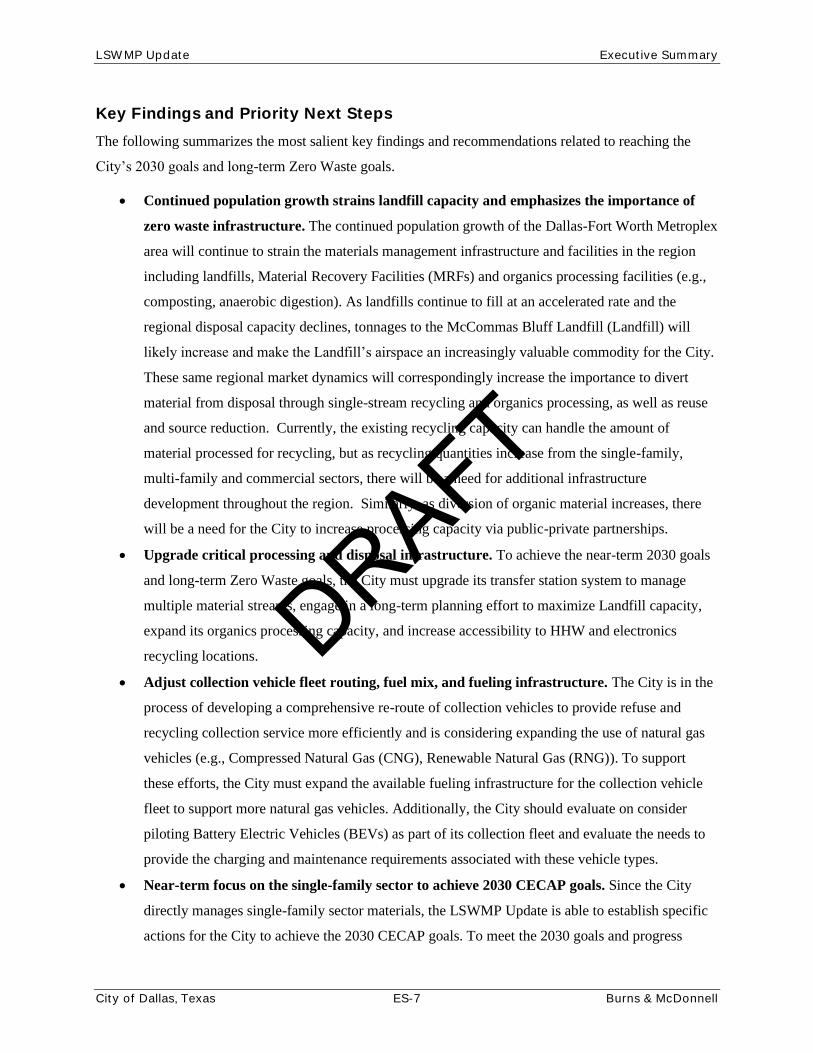
Key Findings and Priority Next Steps
The following summarizes the most salient key findings and recommendations related to reaching the
City’s 2030 goals and long-term Zero Waste goals.
• Continued population growth strains landfill capacity and emphasizes the importance of
zero waste infrastructure. The continued population growth of the Dallas-Fort Worth Metroplex
area will continue to strain the materials management infrastructure and facilities in the region
including landfills, Material Recovery Facilities (MRFs) and organics processing facilities (e.g.,
composting, anaerobic digestion). As landfills continue to fill at an accelerated rate and the
regional disposal capacity declines, tonnages to the McCommas Bluff Landfill (Landfill) will
likely increase and make the Landfill’s airspace an increasingly valuable commodity for the City.
These same regional market dynamics will correspondingly increase the importance to divert
material from disposal through single-stream recycling and organics processing, as well as reuse
and source reduction. Currently, the existing recycling capacity can handle the amount of
material processed for recycling, but as recycling quantities increase from the single-family,
multi-family and commercial sectors, there will be a need for additional infrastructure
development throughout the region. Similarly, as diversion of organic material increases, there
will be a need for the City to increase processing capacity via public-private partnerships.
• Upgrade critical processing and disposal infrastructure. To achieve the near-term 2030 goals
and long-term Zero Waste goals, the City must upgrade its transfer station system to manage
multiple material streams, engage in a long-term planning effort to maximize Landfill capacity,
expand its organics processing capacity, and increase accessibility to HHW and electronics
recycling locations.
• Adjust collection vehicle fleet routing, fuel mix, and fueling infrastructure. The City is in the
process of developing a comprehensive re-route of collection vehicles to provide refuse and
recycling collection service more efficiently and is considering expanding the use of natural gas
vehicles (e.g., Compressed Natural Gas (CNG), Renewable Natural Gas (RNG)). To support
these efforts, the City must expand the available fueling infrastructure for the collection vehicle
fleet to support more natural gas vehicles. Additionally, the City should evaluate on consider
piloting Battery Electric Vehicles (BEVs) as part of its collection fleet and evaluate the needs to
provide the charging and maintenance requirements associated with these vehicle types.
• Near-term focus on the single-family sector to achieve 2030 CECAP goals. Since the City
directly manages single-family sector materials, the LSWMP Update is able to establish specific
actions for the City to achieve the 2030 CECAP goals. To meet the 2030 goals and progress
DRAFT
LSWMP Update Executive Summary
City of Dallas, Texas ES-8 Burns & McDonnell
toward Zero Waste, the City must include organics in its recycling rate and make significant
efforts to increase the amount of material recycled under its direct control (e.g., single-stream
recycling, yard trimmings, brush). The City must implement separate collection of brush and
bulky items to increase its recycling rate and leverage cross-departmental collaboration to expand
education, outreach and compliance efforts to increase the capture rate of single-stream material
(e.g., scaling the “Take-a-Peek” program City-wide).
• Implement mandatory programs in the long term to continue progress toward Zero Waste.
When voluntary programs have been shown to drive up the capture rate from the single-stream
recycling program, the City should implement mandatory programs such as material bans and
residential recycling requirements to increase the capture rate of single-stream recyclables from
60 to 80 percent. Mandatory programs should be considered after the City successfully
implements voluntary approaches.
• Renew interlocal agreement (ILA) with Dallas County to support HHW and electronics
management. The City should extend the current agreement in a similar structure to the existing
ILA on a one-year basis with multiple available extensions to ensure that the short-term needs of
the City will be met but provides the flexibility to explore other options to minimize future costs
as the City continues to grow. As the City considers options for the future of the Household
Chemical Collection Center (HCCC) and Battery Oil Paint and Antifreeze (BOPA) programs,
working with Dallas County to provide an outlet for HHW and electronics serves to minimize the
amount of litter, illegal dumping, and prohibited set outs (e.g., tires) critical to sustaining public
health and community cleanliness.
• Maintain the Multi-family Recycling Ordinance (MFRO) and continue to increase the
percentage of covered entities in compliance year-over-year. The City should continue to
implement and increase the compliance from generators and haulers as part of the MFRO,
monitoring new developments that come online and continuing to support affected entities with
education and outreach. the City must leverage its cross-departmental permit review process to
ensure new developments provide access to recycling.
• Adjust existing requirements on non-exclusive franchise haulers. Material generated by
multi-family and commercial sectors represents the next major opportunity for the City to make
progress toward Zero Waste. In the near-term the City should adjust franchise and permitted
recycling hauler reporting requirements to include more comprehensive tonnage data reports
including refuse, recycling and other divertible tonnages currently collected and the location with
they are processed and disposed. After the requirements of franchise hauler reporting has been
implemented and analyzed, the City will determine the requirements for haulers to offer diversion
DRAFT
LSWMP Update Executive Summary
City of Dallas, Texas ES-9 Burns & McDonnell
services to customers and establish the enforcement mechanisms to ensure that this maintains a
level playing field among franchise haulers. The City should consider incentivizing haulers to
recycle by providing credits on franchise fees for haulers that recycle single-stream and/or
organic materials.
• Long-term implementation of commercial recycling requirements to position the City for
the development of an exclusive or zoned franchise system. As a long-term consideration after
adjusting the franchise and permitted recycling hauler requirements and ensuring that the
available recycling processing capacity supports increased tonnage, the City should implement
requirements to contract with franchise haulers to recycle based on the levels of material
generation quantity, facility size (square footage) or business size (number of employees).
Targeted commercial recycling requirements should be rolled out in a phased approach and
would position the City establish an exclusive or zoned franchise system in the future.
The implementation and funding plan (reference Appendix F) prioritizes recommendations and next steps
developed as part of the LSWMP Update. Table ES-5 presents the highest priority next steps for the City
to continue working toward Zero Waste on a sector-by-sector basis for near-, mid- and long-term
considerations. For the purposes of the implementation and funding plan, near-term is zero to three years,
mid-term is four to eight years (e.g., through 2030), and long-term is eight years and beyond.
DRAFT
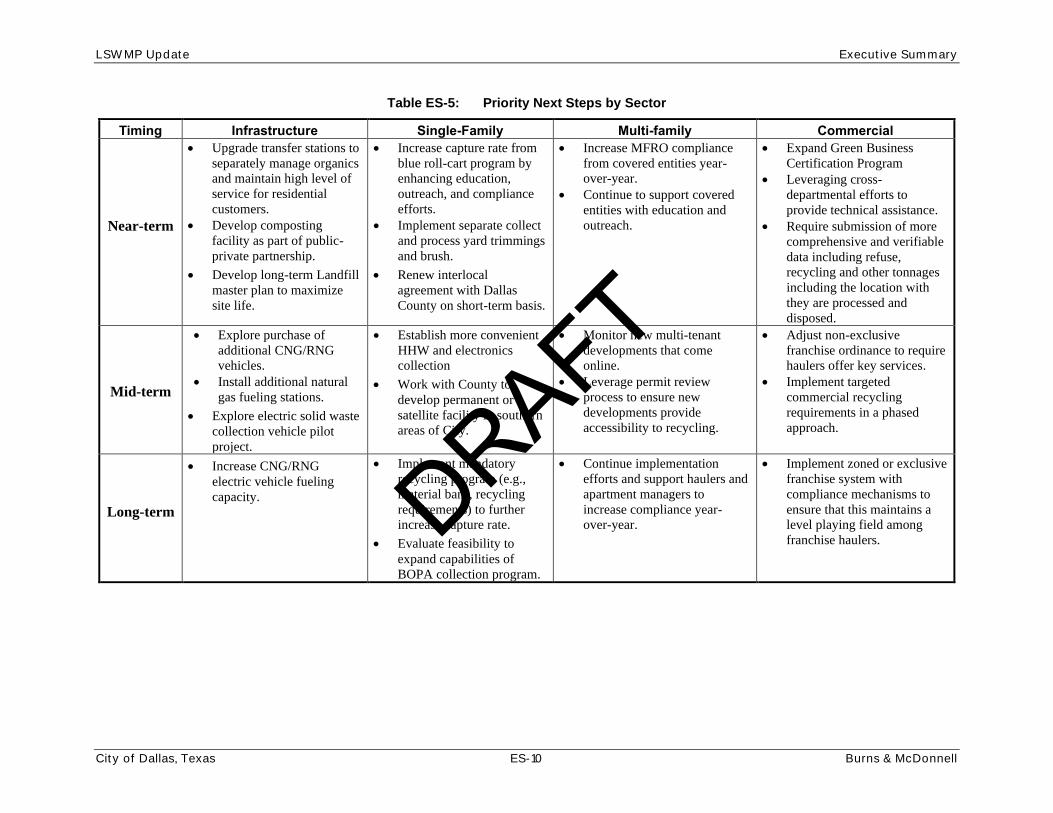
LSWMP Update Executive Summary
City of Dallas, Texas ES-10 Burns & McDonnell
Table ES-5: Priority Next Steps by Sector
Timing Infrastructure Single-Family Multi-family Commercial
Near-term
• Upgrade transfer stations to
separately manage organics
and maintain high level of
service for residential
customers.
• Develop composting
facility as part of public-
private partnership.
• Develop long-term Landfill
master plan to maximize
site life.
• Increase capture rate from
blue roll-cart program by
enhancing education,
outreach, and compliance
efforts.
• Implement separate collect
and process yard trimmings
and brush.
• Renew interlocal
agreement with Dallas
County on short-term basis.
• Increase MFRO compliance
from covered entities year-
over-year.
• Continue to support covered
entities with education and
outreach.
• Expand Green Business
Certification Program
• Leveraging cross-
departmental efforts to
provide technical assistance.
• Require submission of more
comprehensive and verifiable
data including refuse,
recycling and other tonnages
including the location with
they are processed and
disposed.
Mid-term
• Explore purchase of
additional CNG/RNG
vehicles.
• Install additional natural
gas fueling stations.
• Explore electric solid waste
collection vehicle pilot
project.
• Establish more convenient
HHW and electronics
collection
• Work with County to
develop permanent or
satellite facility in southern
areas of City.
• Monitor new multi-tenant
developments that come
online.
• Leverage permit review
process to ensure new
developments provide
accessibility to recycling.
• Adjust non-exclusive
franchise ordinance to require
haulers offer key services.
• Implement targeted
commercial recycling
requirements in a phased
approach.
Long-term
• Increase CNG/RNG
electric vehicle fueling
capacity.
• Implement mandatory
recycling program (e.g.,
material bans, recycling
requirements) to further
increase capture rate.
• Evaluate feasibility to
expand capabilities of
BOPA collection program.
• Continue implementation
efforts and support haulers and
apartment managers to
increase compliance year-
over-year.
• Implement zoned or exclusive
franchise system with
compliance mechanisms to
ensure that this maintains a
level playing field among
franchise haulers.
DRAFT
LSWMP Update Overview, Goals, and Objectives
City of Dallas, Texas 1-1 Burns & McDonnell
1.0 OVERVIEW, GOALS, AND OBJECTIVES
1.1 LSWMP Update Overview
1.1.1 Purpose
Planning for and implementing an integrated solid waste system is a complex and challenging endeavor
requiring a collaborative multi-departmental approach considering technological, institutional, legal, social,
economic, and environmental factors. Developing a Local Solid Waste Management Plan Update (LSWMP
Update) for the City of Dallas (City) is a critical step in determining how effectively the City has worked
toward its goals described in the existing LSWMP and how the City will approach material management
going forward as growth continues and market factors continue to evolve. Title 30 of the Texas
Administrative Code (TAC) provides guidance for local and regional solid waste management plans. The
City’s LSWMP developed in 2011 and adopted by the City Council in February 2013 is in conformance
with 30 TAC §330.
The LSWMP Update has been organized in a manner consistent with the City’s material management
services and programs and substantively addresses the requirements of 30 TAC §330 Subchapter O and
meets the requirements of 30 TAC §330.641(f). This provision allows updates to an approved plan to
provide for changes to data and information contained in the plan which do not substantially change the
scope or content of the goals and recommendations of the plan1. Further description of the LSWMP Update
section layout is provided in Section 1.4.1.
The purpose of the LSWMP Update is to identify current and future solid waste management needs,
evaluate programs, policies, and infrastructure options for meeting these needs, and to define a course of
action for future waste generated in the City. It is the City’s goal to update programs, policies and
infrastructure based on what has been accomplished over the last decade, and to establish an implementation
plan that aligns with the goals established by the Comprehensive Environmental and Climate Action Plan
(CECAP) and maintains progress toward its long-term Zero Waste goal, with as much stakeholder and
community feedback as possible.
As the City pursues solutions to its material management challenges, it is increasingly apparent that there
is no single strategy, technology, or program offers a complete solution; rather, a combination of methods
is needed to provide for appropriate and cost-effective management of the varying types of solid waste in
accordance with the unique properties of these various solid waste stream components. The City and its
1 30 TAC §330 Subchapter O is provided at the following hyperlink:
https://texreg.sos.state.tx.us/public/readtac$ext.ViewTAC?tac_view=5&ti=30&pt=1&ch=330&sch=O&rl=Y
DRAFT
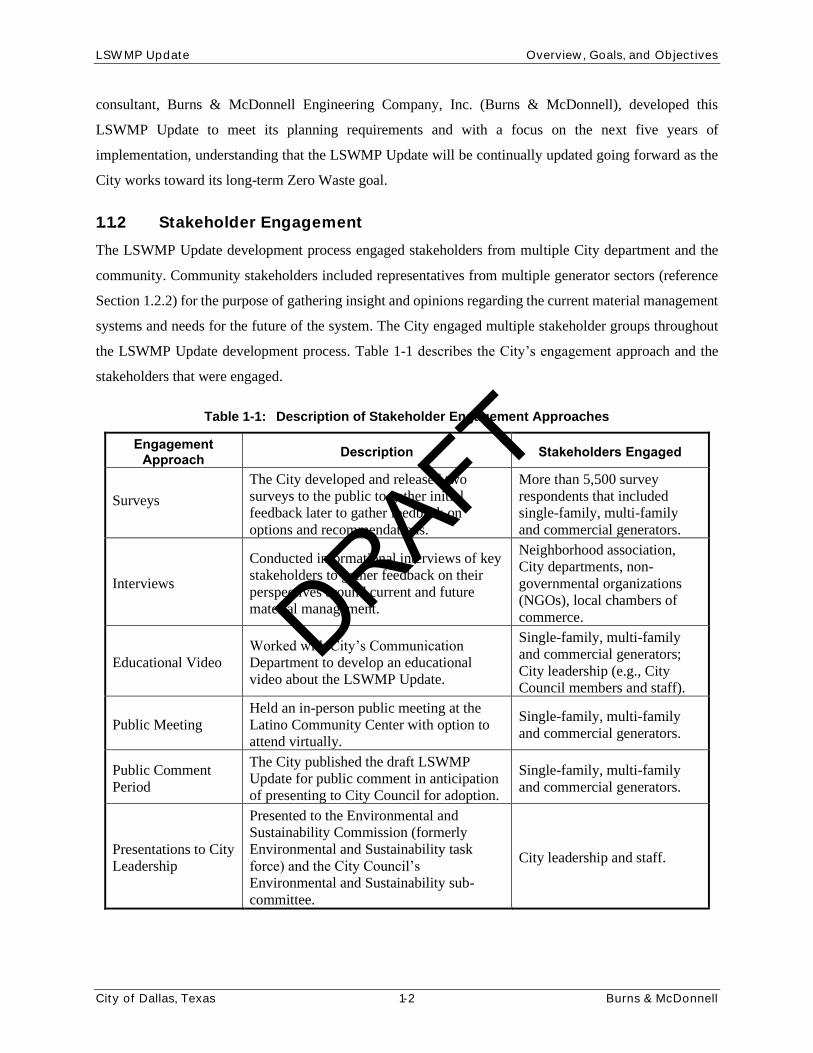
LSWMP Update Overview, Goals, and Objectives
City of Dallas, Texas 1-2 Burns & McDonnell
consultant, Burns & McDonnell Engineering Company, Inc. (Burns & McDonnell), developed this
LSWMP Update to meet its planning requirements and with a focus on the next five years of
implementation, understanding that the LSWMP Update will be continually updated going forward as the
City works toward its long-term Zero Waste goal.
1.1.2 Stakeholder Engagement
The LSWMP Update development process engaged stakeholders from multiple City department and the
community. Community stakeholders included representatives from multiple generator sectors (reference
Section 1.2.2) for the purpose of gathering insight and opinions regarding the current material management
systems and needs for the future of the system. The City engaged multiple stakeholder groups throughout
the LSWMP Update development process. Table 1-1 describes the City’s engagement approach and the
stakeholders that were engaged.
Table 1-1: Description of Stakeholder Engagement Approaches
Engagement Approach
Description Stakeholders Engaged
Surveys
The City developed and released two
surveys to the public to gather initial
feedback later to gather feedback on
options and recommendations.
More than 5,500 survey
respondents that included
single-family, multi-family
and commercial generators.
Interviews
Conducted informational interviews of key
stakeholders to gather feedback on their
perspectives around current and future
material management.
Neighborhood association,
City departments, non-
governmental organizations
(NGOs), local chambers of
commerce.
Educational Video
Worked with City’s Communication
Department to develop an educational
video about the LSWMP Update.
Single-family, multi-family
and commercial generators;
City leadership (e.g., City
Council members and staff).
Public Meeting
Held an in-person public meeting at the
Latino Community Center with option to
attend virtually.
Single-family, multi-family
and commercial generators.
Public Comment
Period
The City published the draft LSWMP
Update for public comment in anticipation
of presenting to City Council for adoption.
Single-family, multi-family
and commercial generators.
Presentations to City
Leadership
Presented to the Environmental and
Sustainability Commission (formerly
Environmental and Sustainability task
force) and the City Council’s
Environmental and Sustainability sub-
committee.
City leadership and staff.
DRAFT
LSWMP Update Overview, Goals, and Objectives
City of Dallas, Texas 1-3 Burns & McDonnell
The key takeaways from the comprehensive stakeholder engagement effort are incorporated throughout the
LSWMP Update to inform the options and recommendations that have been developed. Further detailed
information about the surveys, interviews, public meetings and presentations to City leadership is provided
in Appendix A.
1.1.3 City Department Collaboration
This section describes the City departments that work together to manage the programs and policies related
to materials management.
• Department of Sanitation Services. The Sanitation Department is responsible for provision of
solid waste services including collection of refuse, recycling, brush and bulky items from
residential customers and operation of key infrastructure including the transfer station system and
Landfill. The Sanitation Department also provides education, outreach and compliance services in
coordination with the Office of Environmental Quality and Sustainability and Code Compliance
(OEQS).
• Office of Environmental Quality and Sustainability (OEQS). OEQS provides education,
outreach and compliance efforts related to environmental and sustainability messaging. OEQS
manages several programs including the City’s Multi-family Recycling Ordinance (MFRO), the
Materials Recovery Facility (MRF) agreement with its contract recycling processor the Interlocal
Agreement (ILA) with Dallas County (County) and Batteries, Oil, Paint, and Antifreeze (BOPA)
collection program as part of the Household Hazardous Waste (HHW) and electronics management
program. Additionally, OEQS manages the City’s environmentally preferred purchasing (EPP)
strategies, such as procuring recycled-content products and waste minimization efforts.
• Department of Code Compliance. The Code Compliance Department is responsible for
inspections and data collection related to compliance of the City’s Code of Ordinances. This group
is ancillary to the materials management programs but has the potential to serve a critical role
supporting the City to achieve its long-term Zero Waste goal.
1.2 Key Terms
1.2.1 Material Types
This section presents definitions of a selection of key terms used throughout the LSWMP Update that are
necessary for a comprehensive understanding of the current material management programs, policies and
infrastructure that the City will consider implementing.
DRAFT
LSWMP Update Overview, Goals, and Objectives
City of Dallas, Texas 1-4 Burns & McDonnell
• Municipal solid waste (MSW). MSW is used to refer to the entirety of waste stream that is
generated by everyday activities in homes, institutions such as schools and hospitals, and
commercial sources such as restaurants, offices, and small businesses. MSW can be further
categorized by material types, as described below. Different categories of MSW require different
methods of handling for best management practices. MSW does not include hazardous, industrial,
agricultural, or mining, wastes.
• Refuse. The portion of MSW that cannot practically be recycled, reused, or otherwise diverted is
refuse. Refuse is considered true waste because there are no viable recycling methods other than
disposal. While alternative methods to managing this residual waste stream are commercially
available (e.g., waste-to-energy, chemical recycling), for the purposes of this LSWMP Update the
City is not considering energy recovery from refuse as a viable means of recycling. Further
discussion of the refuse and recycling collection, transfer station system and Landfill operations
are provided in Section 5.0, 6.0 and 8.0, respectively.
• Single-stream recycling. Single-stream recycling refers to materials that are typically accepted
through municipal curbside recycling programs, processed through materials recovery facilities
(MRFs), and sold as commodities to markets where the material is then repurposed. Recyclables
include items such as plastic and glass containers, aluminum and steel cans, cardboard, and other
various paper products accepted in roll carts collected by the City. Further discussion of the refuse
and recycling collection program and recycling processing operation is provided in Section 6.0 and
Section 9.0, respectively.
• Bulky items. Bulky items consist of items generated from households or commercial customers
that are too large to be placed inside a customer’s regular roll cart and are collected by the City’s
brush and bulky item collection program. Further discussion of the brush and bulky item collection
program is provided in Section 7.0.
• Organics. Organics are plant or animal-based materials. Organics have the potential to be recycled
through composting, mulching, or anaerobic digestion processes. Within the category or organics,
there are three sub-categories: yard trimmings, brush and food scraps, used throughout the LSWMP
Update to describe the material stream and associated processing options. Depending on
processing technology, yard trimmings, brush and food waste may be processed together or
separately. Further discussion of organics management is provided in Section 10.0.
o Brush and yard trimmings. Dry leaves, grass clippings, brush, tree branches, stumps,
and other plant trimmings generated by residential customers or commercial landscaping
DRAFT
LSWMP Update Overview, Goals, and Objectives
City of Dallas, Texas 1-5 Burns & McDonnell
contractors are collected from residences comingled with bulky items and disposed. This
material is also delivered directly to the Landfill for grinding and on-site use.
o Food waste. Putrescible fruits, vegetables, meats, dairy, coffee grounds, and food-soiled
paper products generated by residential, multi-family and commercial sector generators.
Pre-consumer food waste is considered kitchen waste from food preparation and post-
consumer food waste is plate waste discarded after food has been served. Some food waste
is collected by private sectors haulers that provide this service and composted at private
sector processing facilities, but most food waste is discarded with refuse.
• Household Hazardous Waste (HHW) and electronics. HHW and electronics refer to common
household chemicals or other materials that should not be disposed of in MSW landfills due to their
potential for environmental contamination, health and safety impacts. For the purposes of the
LSWMP Update, HHW and electronics refer to the materials generated and delivered to the
Household Chemical Collection (HCCC) facility, which is the building operated by the County.
Further description of HHW and electronics management and specific material types are provided
in Section 12.0.
1.2.2 Generator Sectors
This section presents definitions of generator sectors described throughout the LSWMP Update that are
necessary for a comprehensive understanding of the updated goals and objectives described in Section 1.3.
• Single-family sector. The residential sector includes material generated by single-family
households. Material generated by the single-family sector is under direct control of the City as
part of its services provided to residents.
• Multi-family sector. The multi-family sector consists of apartment complexes with three or more
units and covered under the MFRO. The City does not have direct control over this material but
does require that recycling service is provided to multi-tenant complexes. Permitted multi-tenant
recycling haulers are required to provide reporting to the City of recycling activity on an annual
basis.
• Commercial sector. The commercial sector consists of a wide variety of properties, facilities and
business operations including material offices, retail, wholesale establishments, restaurants and
institutional entities such as schools, libraries, and hospitals. The City does not have control of this
material, but non-exclusive franchise haulers are required to provide reporting of refuse collected
from entities in the City.
DRAFT
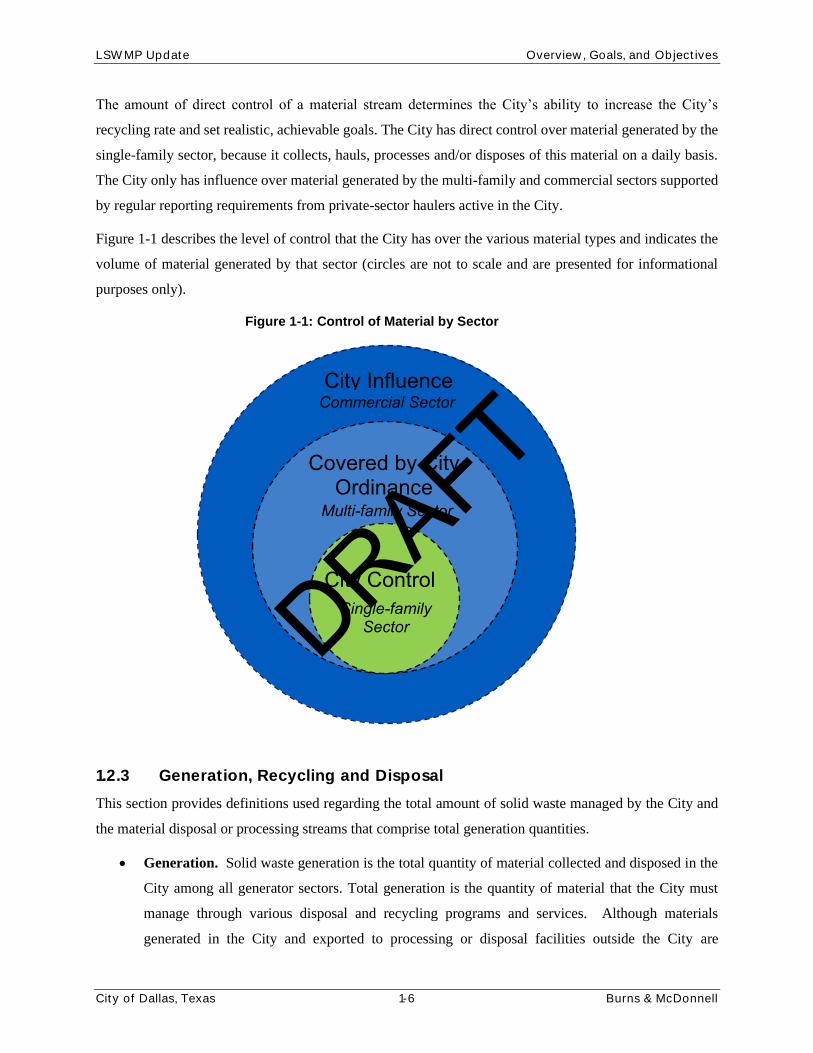
LSWMP Update Overview, Goals, and Objectives
City of Dallas, Texas 1-6 Burns & McDonnell
The amount of direct control of a material stream determines the City’s ability to increase the City’s
recycling rate and set realistic, achievable goals. The City has direct control over material generated by the
single-family sector, because it collects, hauls, processes and/or disposes of this material on a daily basis.
The City only has influence over material generated by the multi-family and commercial sectors supported
by regular reporting requirements from private-sector haulers active in the City.
Figure 1-1 describes the level of control that the City has over the various material types and indicates the
volume of material generated by that sector (circles are not to scale and are presented for informational
purposes only).
1.2.3 Generation, Recycling and Disposal
This section provides definitions used regarding the total amount of solid waste managed by the City and
the material disposal or processing streams that comprise total generation quantities.
• Generation. Solid waste generation is the total quantity of material collected and disposed in the
City among all generator sectors. Total generation is the quantity of material that the City must
manage through various disposal and recycling programs and services. Although materials
generated in the City and exported to processing or disposal facilities outside the City are
City Influence
City Control
Covered by City Ordinance
Commercial Sector
Multi-family Sector
Single-family Sector
Figure 1-1: Control of Material by Sector
DRAFT
LSWMP Update Overview, Goals, and Objectives
City of Dallas, Texas 1-7 Burns & McDonnell
considered part of the total material generated, these quantities are not included for the purposes of
the material projections and forward-looking analysis due to data limitation as part of the LSWMP
Update.
• Recycling. For the purposes of the LSWMP Update, recycling is defined consistently with Texas
Health and Safety Code §361.421(8) to include typical recyclables, composting, land application
of biosolids/sludge, and pyrolysis of post-use polymers; and to exclude source reduction, energy
recovery and reuse. Recycling materials are processed at a MRFs for sale on the secondary material
commodity market or composted/mulched. Recycling and recycling rates include MSW material
that is generated among all generator sectors, collected and processed through single-stream MRFs
and yard waste and organics material that is mulched, composted, or otherwise diverted from
landfill disposal.
• Disposal. Disposal refers to all remaining material placed in landfills that has not been processed
for sale on the secondary material commodity market, composted, or otherwise diverted. Disposed
materials include some quantities of materials that were not recovered prior to disposal but could
potentially be recovered through improvement of recycling programs, policy, infrastructure, or
education, outreach and compliance efforts.
1.3 Updated Goals and Objectives
This section presents the updated goals and objectives as part of the LSWMP Update. The goals and
objectives have been updated to align with those adopted as part of CECAP, most recent data collected
during the current system review and recent stakeholder engagement conducted as part of the LSWMP
Update.
The updated goals and objectives recall the core ideas from the 2011 LSWMP objectives and indicate the
needs to continue progress toward the City’s long-term Zero Waste goal while focusing the near-term goals
in alignment with those adopted by CECAP. The intention of the updated goals and objectives is to provide
strategic targets for the City to utilize as part of current and future program and infrastructure planning
efforts.
1.3.1 Goals
The following quantitative goals established by the LSWMP Update are consistent with the goals adopted
by CECAP:
1. Achieve 35% and 80% diversion of organic waste by 2030 and 2050, respectively, from the single-
family sector.
DRAFT
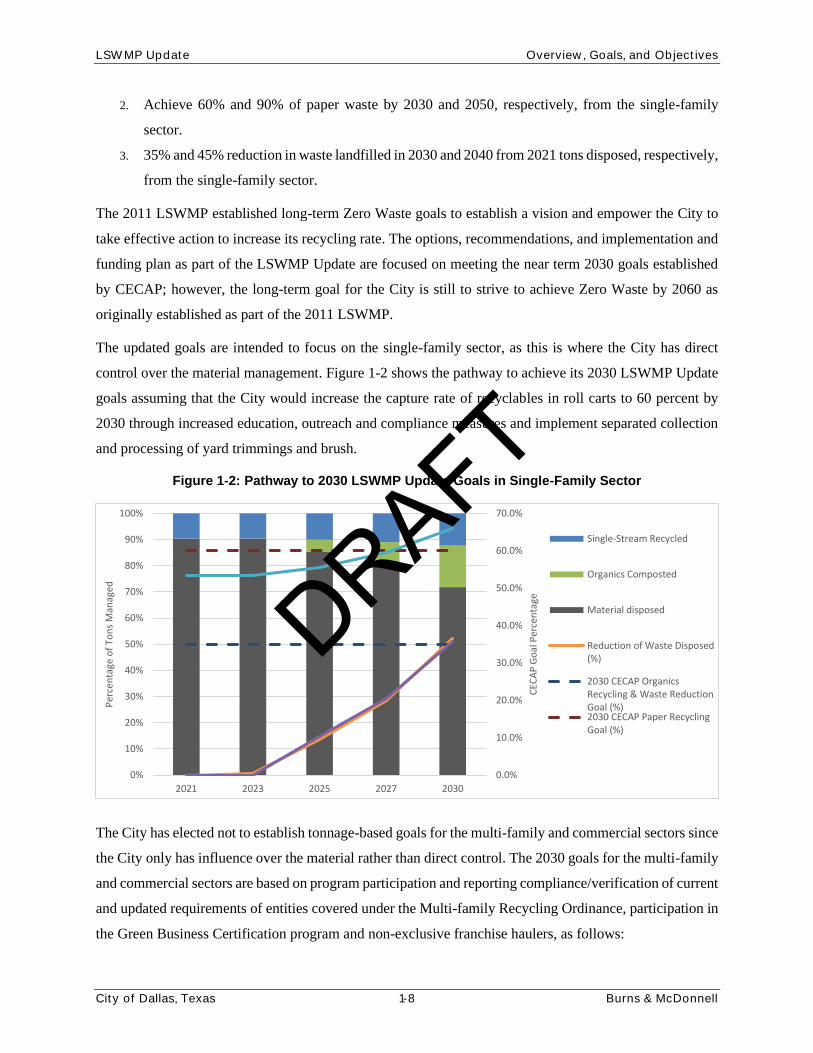
LSWMP Update Overview, Goals, and Objectives
City of Dallas, Texas 1-8 Burns & McDonnell
2. Achieve 60% and 90% of paper waste by 2030 and 2050, respectively, from the single-family
sector.
3. 35% and 45% reduction in waste landfilled in 2030 and 2040 from 2021 tons disposed, respectively,
from the single-family sector.
The 2011 LSWMP established long-term Zero Waste goals to establish a vision and empower the City to
take effective action to increase its recycling rate. The options, recommendations, and implementation and
funding plan as part of the LSWMP Update are focused on meeting the near term 2030 goals established
by CECAP; however, the long-term goal for the City is still to strive to achieve Zero Waste by 2060 as
originally established as part of the 2011 LSWMP.
The updated goals are intended to focus on the single-family sector, as this is where the City has direct
control over the material management. Figure 1-2 shows the pathway to achieve its 2030 LSWMP Update
goals assuming that the City would increase the capture rate of recyclables in roll carts to 60 percent by
2030 through increased education, outreach and compliance measures and implement separated collection
and processing of yard trimmings and brush.
Figure 1-2: Pathway to 2030 LSWMP Update Goals in Single-Family Sector
The City has elected not to establish tonnage-based goals for the multi-family and commercial sectors since
the City only has influence over the material rather than direct control. The 2030 goals for the multi-family
and commercial sectors are based on program participation and reporting compliance/verification of current
and updated requirements of entities covered under the Multi-family Recycling Ordinance, participation in
the Green Business Certification program and non-exclusive franchise haulers, as follows:
0.0%
10.0%
20.0%
30.0%
40.0%
50.0%
60.0%
70.0%
0%
10%
20%
30%
40%
50%
60%
70%
80%
90%
100%
2021 2023 2025 2027 2030
CEC
AP
Go
al P
erce
nta
ge
Per
cen
tage
of
Ton
s M
anag
ed
Single-Stream Recycled
Organics Composted
Material disposed
Reduction of Waste Disposed(%)
2030 CECAP OrganicsRecycling & Waste ReductionGoal (%)2030 CECAP Paper RecyclingGoal (%)
DRAFT
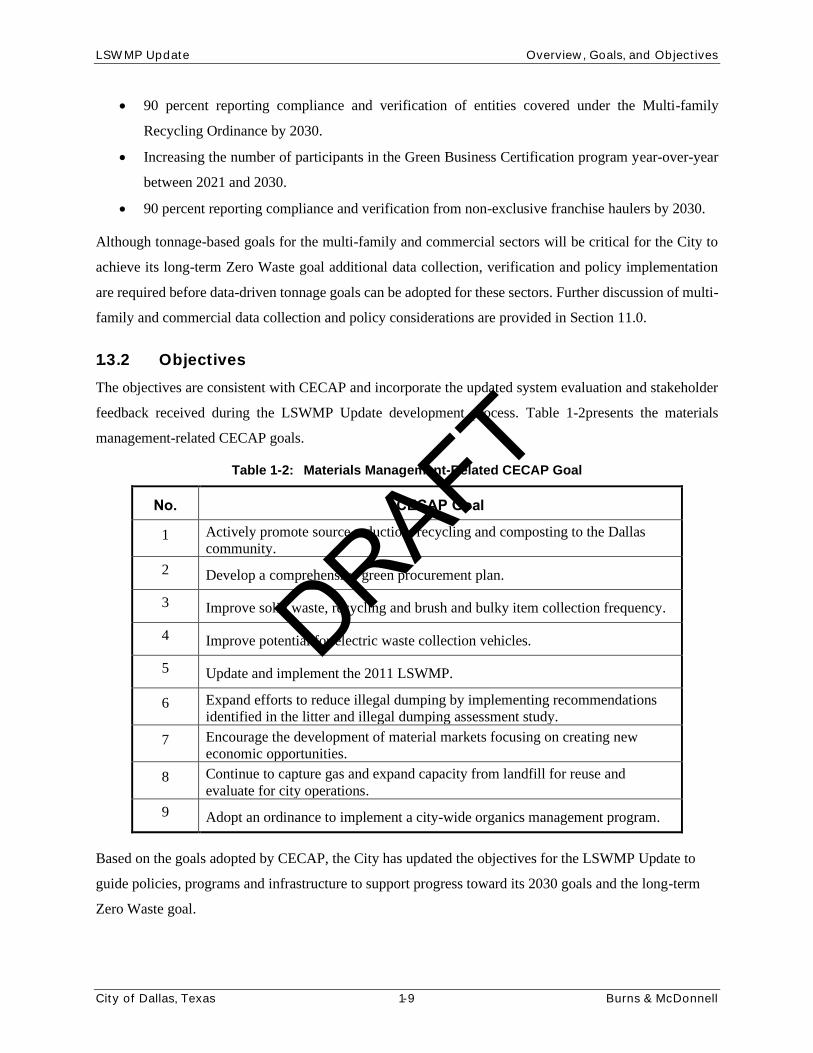
LSWMP Update Overview, Goals, and Objectives
City of Dallas, Texas 1-9 Burns & McDonnell
• 90 percent reporting compliance and verification of entities covered under the Multi-family
Recycling Ordinance by 2030.
• Increasing the number of participants in the Green Business Certification program year-over-year
between 2021 and 2030.
• 90 percent reporting compliance and verification from non-exclusive franchise haulers by 2030.
Although tonnage-based goals for the multi-family and commercial sectors will be critical for the City to
achieve its long-term Zero Waste goal additional data collection, verification and policy implementation
are required before data-driven tonnage goals can be adopted for these sectors. Further discussion of multi-
family and commercial data collection and policy considerations are provided in Section 11.0.
1.3.2 Objectives
The objectives are consistent with CECAP and incorporate the updated system evaluation and stakeholder
feedback received during the LSWMP Update development process. Table 1-2presents the materials
management-related CECAP goals.
Table 1-2: Materials Management-Related CECAP Goal
No. CECAP Goal
1 Actively promote source reduction, recycling and composting to the Dallas
community.
2 Develop a comprehensive green procurement plan.
3 Improve solid waste, recycling and brush and bulky item collection frequency.
4 Improve potential for electric waste collection vehicles.
5 Update and implement the 2011 LSWMP.
6 Expand efforts to reduce illegal dumping by implementing recommendations
identified in the litter and illegal dumping assessment study.
7 Encourage the development of material markets focusing on creating new
economic opportunities.
8 Continue to capture gas and expand capacity from landfill for reuse and
evaluate for city operations.
9 Adopt an ordinance to implement a city-wide organics management program.
Based on the goals adopted by CECAP, the City has updated the objectives for the LSWMP Update to
guide policies, programs and infrastructure to support progress toward its 2030 goals and the long-term
Zero Waste goal.
DRAFT
LSWMP Update Overview, Goals, and Objectives
City of Dallas, Texas 1-10 Burns & McDonnell
1. Empower residents and businesses to reduce the amount of discarded material generated through
proactive education, outreach and compliance efforts.
2. Establish and implement innovative operational best practices to provide efficient, cost effective,
and environmentally responsible service.
3. Provide excellent customer service and support residents and businesses to maximize diversion
from landfill.
4. Operate a clean, green and efficient waste system that seeks to generate energy from organics.
1.4 Guidance for Reading the LSWMP Update
This section provides guidance reading the LSWMP Update, including the content provided in each section,
information about each section is structured, how case studies and benchmarking are utilized, the approach
to evaluating options and a description of the implementation and funding plan. The LSWMP Update is
organized into three overall sections: (1) introductory sections, programs, (2) policies and infrastructure
sections, and (3) appendices. The introductory sections provide key context about the LSWMP Update,
materials management trends, regulations, projected material management needs, and regional facilities
and infrastructure. Program, policies and infrastructure sections are dedicated to discussion of a specific
aspect of the City’s material management system where each has unique characteristics requiring a
customized approach based on varying generators, material types and customers. The appendices provide
detailed information compiled and analyzed throughout the LSWMP Update development process. Table
1-3 indicates how the LSWMP Update is organized, listing each section with a brief description of the
content included. DRAFT

LSWMP Update Overview, Goals, and Objectives
City of Dallas, Texas 1-11 Burns & McDonnell
Table 1-3: LSWMP Update Section Organization and Description
No. Title Description
Introductory Sections
1.0 Overview, Goals and Objectives Describes the purpose, key terms, updated goals and objectives, and guidance for
reading the LSWMP Update document.
2.0 Planning Studies, Regulatory and Trends Review Includes applicable planning studies and regulations, roles of government entities in
solid waste management, and current solid waste management industry trends.
3.0 Planning Area Characteristics Reviews the planning area characteristics such as population, economic projections,
and projected material management needs.
4.0 Facilities and Infrastructure Review of material management facilities and infrastructure in the North Central
Texas region and presents information on public-private partnership approaches.
Programs, Policies and Infrastructure Sections
5.0 Transfer Station System
Review of the operational capacity of the program, policy and infrastructure and
evaluation of options to support continued strategic usage to meet near- and long-term
goals and objectives established by the LSWMP Update.
6.0 Refuse and Recycling Collection
7.0 Brush and Bulky Item Collection
8.0 Landfill Operation
9.0 Recycling Processing
10.0 Organics Management
11.0 Multi-Family and Commercial Sector
12.0 HHW and Electronics Management
13.0 Public Education, Outreach and Compliance
Appendices
A Stakeholder Engagement Summary Provides data and results of the stakeholder engagement efforts.
B Regional Facilities Maps Maps of the materials management, processing and disposal facilities in the region.
C Transfer Station System Evaluation Detailed technical evaluation of the City’s transfer station system, refuse and recycling
collection, and Landfill programs and operations. D Refuse and Recycling Collection Evaluation
E Landfill Operation Evaluation
F Implementation and Funding Plan
Presents a detailed implementation and funding plan matrix that indicates the priority,
funding mechanism, difficulty of implementation, and responsible party for each key
recommendation of the LSWMP Update.
DRAFT
LSWMP Update Overview, Goals, and Objectives
City of Dallas, Texas 1-12 Burns & McDonnell
1.4.1 Section Layout
Each section of the LSWMP Update is intended to be structured consistently, but customized based on
unique characteristics. The introductory sections are structured to provide more general information about
materials management, material projections and composition profiles, and regional infrastructure. The
program, policy and infrastructure sections each begin with a current system review, evaluation of the
recommendations from the 2011 LSWMP, relevant case studies, an evaluation of options and key findings
and recommendations. Relevant feedback from the stakeholder engagement efforts precedes the evaluation
of options but may be incorporated in other locations throughout the LSWMP Update as appropriate.
1.4.2 Case Studies and Benchmarking
Each section provides case studies and benchmarking data from refuse and recycling collection programs
in peer cities to inform the development of the options that are further evaluated. The case studies and
benchmarking cities were selected based on challenges that the City is encountering related to the program,
policy or infrastructure addressed in each section.
1.4.3 Options Evaluation
Each of the options and specific tactics identified in the LSWMP Update is evaluated based on the following
criteria:
1. Recycling potential. Indicates if implementation of the tactic would increase the City’s capability
to separately mange material for recycling. Depending on the option and/or tactic recycling
potential may include recycling, organics, bulky items or HHW.
2. Operational impact. Indicates if implementation of the tactic would have an operational impact
on staffing, equipment, infrastructure currently used to run one or more programs.
3. Financial impact. Indicates if implementation of the tactic would financial impacts including
increases or decreases to operational and capital costs or if the tactic would realize cost savings.
4. Environmental impact. Indicates if implementation of the tactic would have a positive (e.g.,
emissions reduction) or negative (e.g., increased emissions) environmental impact including
greenhouse gases (GHG) or other emissions such as particulate matter (PM), nitrous oxide (NOx)
or sulfur oxide (SOx).
5. Policy impacts. Indicates if implementation of the tactic would have policy implications related to
the existing City Code of Ordinances or require developing and adopting new policy.
DRAFT
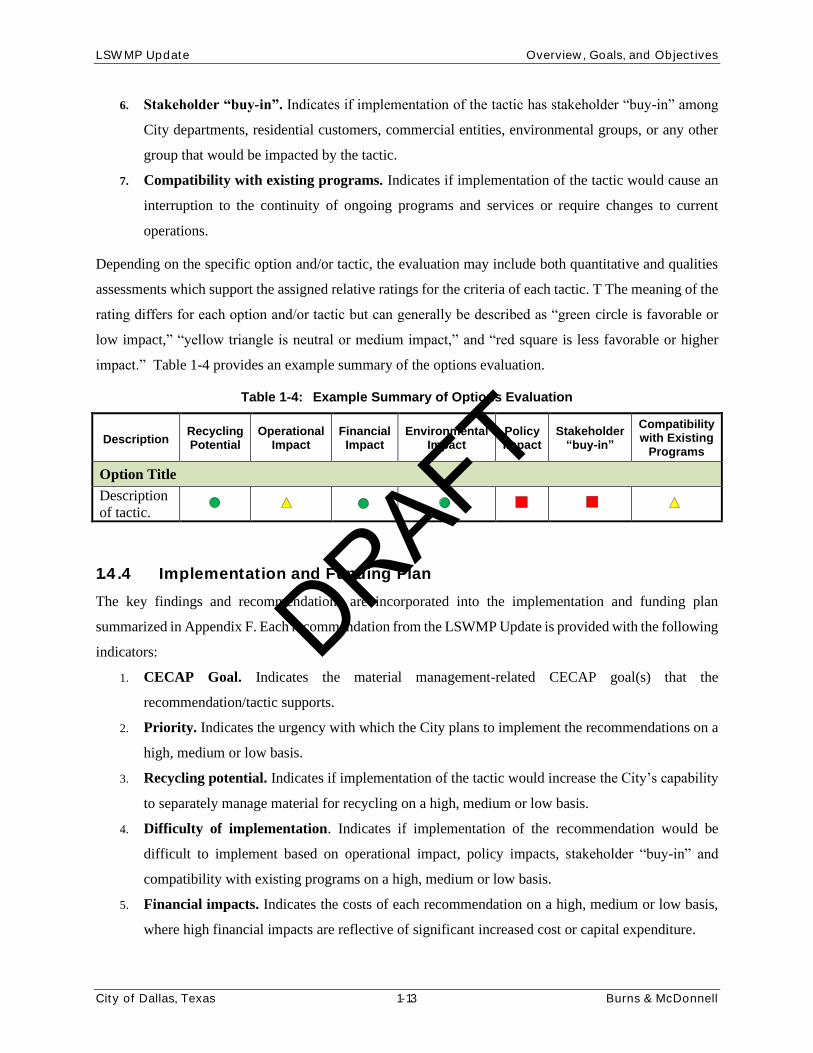
LSWMP Update Overview, Goals, and Objectives
City of Dallas, Texas 1-13 Burns & McDonnell
6. Stakeholder “buy-in”. Indicates if implementation of the tactic has stakeholder “buy-in” among
City departments, residential customers, commercial entities, environmental groups, or any other
group that would be impacted by the tactic.
7. Compatibility with existing programs. Indicates if implementation of the tactic would cause an
interruption to the continuity of ongoing programs and services or require changes to current
operations.
Depending on the specific option and/or tactic, the evaluation may include both quantitative and qualities
assessments which support the assigned relative ratings for the criteria of each tactic. T The meaning of the
rating differs for each option and/or tactic but can generally be described as “green circle is favorable or
low impact,” “yellow triangle is neutral or medium impact,” and “red square is less favorable or higher
impact.” Table 1-4 provides an example summary of the options evaluation.
Table 1-4: Example Summary of Options Evaluation
Description Recycling Potential
Operational Impact
Financial Impact
Environmental Impact
Policy Impact
Stakeholder “buy-in”
Compatibility with Existing
Programs
Option Title
Description
of tactic.
1.4.4 Implementation and Funding Plan
The key findings and recommendations are incorporated into the implementation and funding plan
summarized in Appendix F. Each recommendation from the LSWMP Update is provided with the following
indicators:
1. CECAP Goal. Indicates the material management-related CECAP goal(s) that the
recommendation/tactic supports.
2. Priority. Indicates the urgency with which the City plans to implement the recommendations on a
high, medium or low basis.
3. Recycling potential. Indicates if implementation of the tactic would increase the City’s capability
to separately manage material for recycling on a high, medium or low basis.
4. Difficulty of implementation. Indicates if implementation of the recommendation would be
difficult to implement based on operational impact, policy impacts, stakeholder “buy-in” and
compatibility with existing programs on a high, medium or low basis.
5. Financial impacts. Indicates the costs of each recommendation on a high, medium or low basis,
where high financial impacts are reflective of significant increased cost or capital expenditure.
DRAFT
LSWMP Update Overview, Goals, and Objectives
City of Dallas, Texas 1-14 Burns & McDonnell
6. Funding source. Indicates if the funding source for the recommendation would be part of a bond
offering or other fundraising approach.
7. Implementation timing. Provides a general indication of when the proposed recommendation will
be implemented on a near-term (one to three years), mid-term (three to five years), or long-term
(five to 10 year) basis.
8. Responsible party. Indicates which City department or external organization is responsible for the
implementation of each recommendation.
DRAFT
LSWMP Update Planning Studies, Regulatory, and Trends Review
City of Dallas, Texas 2-1 Burns & McDonnell
2.0 PLANNING STUDIES, REGULATORY, AND TRENDS REVIEW
This section provides a broad perspective of the historic and current state of the MSW management
environment in which the City is developing this LSWMP Update. It provides a review of relevant existing
planning studies, a summary of relevant laws and regulations, and information on key trends in MSW
management.
2.1 Review of Relevant Planning Studies
Understanding prior MSW and community planning projects completed at the local, regional, and state
levels is a critical step in effectively and efficiently developing the LSWMP Update for the City. To inform
development of this LSWMP Update, Burns & McDonnell reviewed the following studies and plans
presented chronologically.
• Landfill Management and Operations Assessment. In 2000, R. W. Beck completed performed
a management and operations assessment of the McCommas Bluff Landfill (Landfill).
• Transfer Station Evaluation. In 2006, R. W. Beck performed an operational review of the City’s
three transfer stations and transfer fleet to evaluate the efficiencies of the City's transfer operation
to determine the City's cost to operate its system.
• Local Solid Waste Management Plan 2011 - 20602. In 2011, the City contracted with HDR to
develop a Local Solid Waste Management Plan (2011 LSWMP) consistent with the requirements
of 30 TAC §330. The contract included a formal planning process to identify the policies, programs
and infrastructure needed to effectively manage municipal solid waste and recycling materials.
Considering economic growth, environmental stewardship, and the City’s policies around fiscal
responsibility, the plan included goals to systematically reduce the volume and toxicity of wastes,
and ways of maximizing diversion and opportunities to recover raw materials and clean energy
from the waste stream. The plan included a series of programmatic, policy and infrastructure
development recommendations along with a timeline for implementation.
• Resource Recovery Planning and Implementation Study3. In 2014, the City began the planning
process to determine where recyclable materials would be processed when its existing contract with
2 City of Dallas. 2013. “Local Solid Waste management Plan 2011-2060” Available online:
https://dallascityhall.com/departments/sanitation/DCH%20Documents/pdf/DallasLocalSWMP_Vol-I-II.pdf 3 City of Dallas. 2014. “Consulting Services in Support of Resource Recovery Planning and Implementation.”
Available online:
https://dallascityhall.com/departments/sanitation/DCH%20Documents/pdf/ResourceRecoverPlanningAndImplement
ation.pdf
DRAFT
LSWMP Update Planning Studies, Regulatory, and Trends Review
City of Dallas, Texas 2-2 Burns & McDonnell
Waste Management Recycle America expired in 2016. This evaluation included the including the
option to take a more active role in a future processing facility by developing a City-owned and
managed facility or entering into a public-private partnership. The City evaluated technologies
including single-stream recycling, mixed waste processing, gasification and anaerobic digestion
and as a result of the analysis and recommendations, released a Request for Competitive Sealed
Proposals (RFCSP) as described below.
• Recycling Processing Request for Competitive Sealed Proposals. In 2014, Burns & McDonnell
developed an RFCSP, as well as the contract for recycling processing services between the City
and the selected vendor. Fomento de Construcciones y Contratas, S.A. dba FCC, S.A (FCC) was
selected and worked with the City to develop the Materials Recovery Facility (MRF) located on
the Landfill site. FCC has and has been operating the MRF since 2016. Further discussion and
evaluation of the FCC MRF and contract including key contract terms, accepted materials and
annual tonnage processed is provided in Section 9.0
• North Central Texas Council of Governments (NCTCOG) Regional Solid Waste.
Management Plan 2015 - 20404. This plan was developed by NCTCOG in 2015 and covers a 25-
year planning period for the NCTCOG, the 16-county regional planning area in the North Central
Texas region. The primary purpose of this plan is to inventory closed landfills, quantify regional
landfill capacity in relation to projected future growth in waste generation, identify the region’s
most prominent needs and problems, and outline activities and priorities to be initiated throughout
the planning period. NCTCOG is currently working with Burns & McDonnell in the process of
updating this regional planning effort.
• Draft Facility Condition Assessments. In 2016 the City contracted with AECOM Technical
Services to complete a draft Facility Condition Assessment to evaluate the conditions of the transfer
station system and other operational buildings including the Sanitation Department heavy shop,
administrative building at the Landfill and Eco Park.
• Evaluation of Collection Methods and Alternatives. In 2017 the City contracted with Burns &
McDonnell to complete a review of collection operations to evaluate the current methods of
collection and provide recommendations to increase collection efficiency related to residential
refuse, recycling, brush and bulky material collections as well as fleet maintenance. The
recommendations were used to support the three-month separated brush and bulky item collection
4 North Central Texas Council of Governments (NCTCOG). 2015. “Planning for Sustainable Materials Management
in North Central Texas 2015-2040.” Available online: https://www.nctcog.org/envir/materials-
management/materials-management-plan
DRAFT
LSWMP Update Planning Studies, Regulatory, and Trends Review
City of Dallas, Texas 2-3 Burns & McDonnell
pilot that was held from October – December 2021. Further discussion of brush and bulky item
collection is provided in Section 7.0.
• TCEQ Study on the Economic Impacts of Recycling5. This 2017 study, completed by the TCEQ
as outlined in House Bill 2763 of the regular session of the 84th Texas Legislature, documented the
quantities of MSW recycled and landfilled in Texas. The report provides a state-level
understanding of 2015 recycling and landfill disposal quantities and composition and provides key
economic and market trend data. . The study also includes comprehensive information and
recommendations on funding methods to increase recycling and identified infrastructure needs and
opportunities for rural and underserved areas,
• Solid Waste Landfill Market Study. In 2018, the City contracted with Burns & McDonnell to
complete completed a Solid Waste Landfill Market Study, which updated prior landfill market
studies completed by Burns & McDonnell on behalf of the City to identify the market rate for
disposal in the region to determine the impact of the City's current landfill tipping fees.
• Litter and Illegal Dumping Assessment Study. In 2018 the City contracted with Burns &
McDonnell to complete a study to evaluate the City’s ongoing efforts and costs to address litter and
illegal dumping. This cross-departmental effort included Dallas Water Utility (DWU), the
Marshall’s office, the Office of Environmental Quality and Sustainability (OEQS), the Sanitation
Department, and Code Compliance. The study and provides recommendations for how the City can
implement a more strategic and preventative approach to combatting litter and illegal dumping
including:
o Develop a geographically-focused approach
o Improve local/regional collaboration
o Implement proactive and preventative methods
o Increase community engagement and public education
o Reduce illegal dumping from construction activities and commercial sources
o Enhance enforcement of litter and illegal dumping policies.
• Initial Operational Assessment. In 2020, Burns & McDonnell completed a study to provide the
City with a planning-level understanding of key managerial and operational issues facing the
Sanitation Department and present key findings and recommendations that are included in the
LSWMP Update.
5 Texas Commission on Environmental Quality (TCEQ). July 2017. “Study on the Economic Impacts of Recycling.”
Available online: https://www.tceq.texas.gov/p2/recycle/study-on-the-economic-impacts-of-recycling.
DRAFT
LSWMP Update Planning Studies, Regulatory, and Trends Review
City of Dallas, Texas 2-4 Burns & McDonnell
• TCEQ Recycling Market Development Plan6. In September 2021, the TCEQ published a
Recycling Market Development Plan (RMDP) to promote the use of recyclable materials as
feedstock in processing and manufacturing. Similar to the Study on the Economic Impacts of
Recycling, the RMDP provides state-level estimates of recycling and landfill disposal quantities
statewide and estimates the resulting economic benefits of recycling. The RMDP also provides a
plan recommendations to increase recycling, developed based on the key barriers and opportunities
identified across the State.
• City of Dallas Comprehensive Environmental and Climate Action Plan (CECAP)7. The
CECAP was published in 2020 and provides a framework for achieving significant and measurable
reductions in carbon emissions, enhancing environmental quality equitably, and creating a more
sustainable infrastructure resilient to the negative effects of climate change. The AECOM-
developed CECAP communicates goals among eight key environmental sectors including
buildings, energy, transportation, solid waste, water resources, ecosystems and green space, food
and urban agriculture, and air quality. Solid waste is a key focus of the CECAP and the plan defines
nine goals to mitigate waste-based carbon emissions, several of which will be addressed as part of
the development of the LSWMP Update. Table 2-1 lists the nine solid waste goals and identifies
how they are addressed in the LSWMP Update.
Table 2-1: Description of How LSWMP Update Addresses CECAP Goals
No. CECAP Goal How LSWMP Update Addresses Goal
1
Actively promote source reduction,
recycling and composting to the Dallas
community.
Evaluates the City’s education, outreach and
compliance programs and provides
recommendations on how to enhance its
capabilities.
2 Develop a comprehensive green
procurement plan.
Supports on-going cross-departmental efforts to
develop a comprehensive green procurement plan
by providing discussion about the impact of
purchasing policy on source reduction efforts.
3
Improve solid waste, recycling and
brush and bulky item collection
frequency.
Evaluates the City’s current brush and bulky item
collection program and provides
recommendations on approaches to scale separate
collection on a City-wide basis.
6 Texas Commission on Environmental Quality (TCEQ). August 2021. “Recycling Market Development Plan.”
Available online: https://www.tceq.texas.gov/assets/public/assistance/P2Recycle/Recyclable-
Materials/2021%20Recycling%20Market%20Development%20Plan.pdf 7 City of Dallas. 2020. “Comprehensive Environmental and Climate Action Plan.” Available online:
https://www.dallasclimateaction.com/cecap
DRAFT
LSWMP Update Planning Studies, Regulatory, and Trends Review
City of Dallas, Texas 2-5 Burns & McDonnell
No. CECAP Goal How LSWMP Update Addresses Goal
4 Improve potential for electric waste
collection vehicles.
Incorporates case studies on collection systems
that have incorporated Battery Electric Vehicles
(BEVs) provides considerations for implementing
a BEVs on a pilot basis.
5 Update and implement the 2011
LSWMP.
Establishes realistic goals and metrics by sector
and strategic approaches to achieve these goals.
6
Expand efforts to reduce illegal
dumping by implementing
recommendations identified in the litter
and illegal dumping assessment study.
Evaluates the City’s Household Hazardous Waste
(HHW) and electronics management programs,
including a high-level evaluation of the progress
made toward the recommendations of the Litter
and Illegal Dumping Assessment Study.
7
Encourage the development of material
markets focusing on creating new
economic opportunities.
Interviewed the City’s Economic Development
Department and Chambers of Commerce as part
of the stakeholder engagement effort and
leveraged the statewide Recycling Market
Development Plan (RMDP) to provide
information on economic opportunities related to
material markets.
8
Continue to capture gas and expand
capacity from landfill for reuse and
evaluate for city operations.
Evaluates the Landfill’s gas collection system and
provides recommendations to continue to expand
capacity to beneficially reuse Landfill gas.
9
Adopt an ordinance to implement a
city-wide organics management
program.
In addition to the recommendations related to
separately collecting brush and bulky items, the
LSWMP Update evaluates the City’s non-
exclusive franchise ordinances and provides near-
and long-term recommendations on increasing
organics recycling from the commercial sector.
2.2 Regulatory and Policy Review
Prior regulations and policies related to material management, as well as trends and the current regulatory
climate, have largely shaped the state of material management and defined the environment in which this
LSWMP Update is being developed. This section provides a summary of federal and state regulations,
policies, and trends.
2.2.1 Role of the Federal Government in Regulating Solid Waste
The federal government sets basic requirements for regulations which help provide regulatory consistency
across the United States and protects public health and the environment, which helps to provide consistency
across the U.S. The United States Environmental Protection Agency (U.S. EPA) is responsible for
DRAFT
LSWMP Update Planning Studies, Regulatory, and Trends Review
City of Dallas, Texas 2-6 Burns & McDonnell
hazardous and non-hazardous solid waste management through the Office for Solid Waste and Emergency
Response. There are three four major pieces of federal legislation pertaining to solid waste management:8
• Prior to 1965, solid waste management was entirely dependent on the judgement and decisions of
individuals or local departments of health and sanitation. In 1965, Congress made its first attempt
to define the scope of the nation’s waste disposal problems by enacting the Federal Solid Waste
Disposal Act (SWDA), which financed statewide surveys of landfills and illegal dumps.
• The first significant federal legislation governing the disposal of non-hazardous and hazardous
waste was passed in 1976 under the Resource Conservation and Recovery Act (RCRA). RCRA
established landfill construction, management, and closure guidelines. It also regulates hazardous
waste management facilities that treat, store, or dispose of hazardous waste. In 2006 the U.S. EPA
delegated the primary responsibility of implementing RCRA hazardous waste programs to the
TCEQ9. RCRA has been amended three times since its inception:10
o 1984 Hazardous and Solid Waste Amendments, requiring the phasing out of landfill
disposal of hazardous wastes and granting the U. S. EPA with regulatory authority over
landfills (Subtitle C Hazardous Waste and Subtitle D Non-hazardous waste).
o 1992 Federal Facility Compliance Act, strengthening enforcement of RCRA at federal
facilities.
o 1996 Land Disposal Program Flexibility Act, providing regulatory flexibility for land
disposal of certain wastes.
• The Comprehensive Environmental Response, Compensation, and Liability Act (CERCLA) of
1980, known as Superfund, was enacted by Congress to address abandoned hazardous waste sites
in the United States. CERCLA was subsequently amended by the Superfund Amendments and
Reauthorization Act of 1986 (SARA) to stress the importance of permanent remedies, provide for
increased state involvement, and increase federal funding. 11 The Office of Air and Radiation
regulates solid waste-related air emissions, enforcing the Clean Air Act of 1976 (CAA) and its
subsequent amendments.12
8 Texas Center for Policy Studies. 1995. “Texas Environmental Almanac.” Available online:
http://www.texascenter.org/almanac/ 9 Texas Commission on Environmental Quality. “Chapter 335- Industrial Solid Waste and Municipal Hazardous
Waste” Available online:
https://www.tceq.texas.gov/assets/public/legal/rules/hist_rules/Complete.06s/06032335/06032335_pro_clean.pdf 10 U.S. Environmental Protection Agency. 2017. “History of the Resource Conservation and Recovery Act
(RCRA).” Available online: https://www.epa.gov/rcra/history-resource-conservation-and-recovery-act-rcra 11 U.S. Environmental Protection Agency (U.S. EPA). 2017. “Superfund: CERCLA Overview.” Available online:
https://www.epa.gov/superfund/superfund-cercla-overview 12 U.S. EPA. 2020. “Summary of the Clean Air Act 42 U.S.C. §7401 et seq. (1970).” Available online:
https://www.epa.gov/laws-regulations/summary-clean-air-act
DRAFT
LSWMP Update Planning Studies, Regulatory, and Trends Review
City of Dallas, Texas 2-7 Burns & McDonnell
• Following the ecological impacts from the Exxon-Valdez Oil Spill, in 1980, Congress passed the
Natural Resource Damages Assessment (NRDA) Act, to provide for habitat restoration,
replacement and/or preservation following remediation under CERCLA. The U.S. Department of
Interior governs actions under the NRDA Program13.
In addition to federal legislation, there are various ongoing policy development and implementation efforts
relates to SMM. To address food loss and waste nationwide, the U.S. EPA established a national goal on
September 16, 2015 to reduce food loss and waste by 50 percent by 2030. The Food Loss and Waste
Reduction Goal was a joint effort with the U.S. Department of Agriculture to address food insecurity and
reduce landfill methane emissions. Achieving the target 50 percent reduction is equivalent to reaching a
total disposal rate of 109.4 pounds of food waste per person per year.
Recently, the U.S. EPA developed a National Recycling Strategy identifies objectives and actions needed
to create a more resilient and cost-effective recycling system nationwide including integrating recycled
materials into product and packaging designs14. The National Recycling Strategy supports implementation
of the National Recycling Goals developed to there are national policies that in place and under
development to guide lawmakers to develop and implement future legislation.
On November 17, 2020 the U.S. EPA established the National Recycling Goal of 50 percent by 2030 to
provide the benchmarks needed to evaluate the success of the collective efforts to significantly improve the
nation’s recycling system. The metrics identified in the National Goal are based on the broad objectives of
the draft National Recycling Strategy and are divided into four categories: assessing recycling performance,
reducing contamination, increasing processing efficiency and strengthening recycled material markets. The
National Recycling Goal aims to create standardized definitions for the recycling industry to keep pace with
today’s diverse and changing waste system. The following lists the measures that will be used to track the
progress toward the National Recycling Goal.
• Measure 1: Reduce contamination in recycling. This will be calculated by examining the
percentage of contaminants in the recycling stream.
• Measure 2: Make the national recycling processing system more efficient. This will be
measured by tracking the percentage of materials successfully recycled through recycling
facilities compared to the inbound material.
13 Further information on the National Resource Damage Assessment and Restoration Program is available online:
https://www.doi.gov/restoration 14 U.S. EPA. “National Recycling Strategy Part One of a Series on Building a Circular Economy for All”. Available
online: https://www.epa.gov/system/files/documents/2021-11/final-national-recycling-strategy.pdf
DRAFT
LSWMP Update Planning Studies, Regulatory, and Trends Review
City of Dallas, Texas 2-8 Burns & McDonnell
• Measure 3: Strengthen the economic markets for recycled materials. This will be measured by
tracking the average price per ton of recycled material on the secondary materials commodity
market.
The related National Recycling Strategy identifies objectives and actions needed to create a more resilient
and cost-effective recycling system nationwide. The draft National Recycling Strategy was open for public
comment until December 4, 2020 and is expected to be finalized in late 2021. The National Recycling
Strategy will be aligned with and support implementation of the National Recycling Goals.
National organizations other than the federal government also play a role in national solid waste policies
and trends. The Recycling Partnership has been working to develop an initiative called the Circular
Economy Accelerator Policy15 to support the collective U.S. residential recycling collection system to
develop a collaborative public-private policy solution that includes:
• A packaging and printed paper fee paid by private-sector brands to support residential recycling
infrastructure and education.
• A disposal surcharge on waste generators to help defray recycling operational costs for
communities.
Packaging and printed paper fees would be based on a needs assessment and data-driven plan. Fees would
be calculated to address the level of investments that are needed to provide recycling access to residents on
par with disposal, provide education and outreach to residents to reduce rates of inbound contamination,
and enhance MRF capabilities to efficiently sort and process collected materials. A third-party Non-
Governmental Organization (NGO) would set and collect fees based on the established needs and disburse
funds in order to meet statutory goals.
Combined, this dual-policy solution is intended to bring key stakeholders together to create funding
mechanisms that could address the infrastructure, education and operational challenges facing the recycling
collection system.
2.2.2 Role of the State Government in Regulating Solid Waste
Texas has a long-standing solid waste material management regulatory program, initiated with the Texas
Solid Waste Disposal Act and passed by the state legislature in 1969. This Act required the Texas Health
Department to adopt regulations pertaining to the design, construction, and operation of landfills and other
processing facilities. Today, the TCEQ holds jurisdiction over solid waste material management. Several
15 For more information on the Accelerator Policy see the report “Accelerating Recycling: Policy to Unlock Supply
for the Circular Economy” here: https://recyclingpartnership.org/accelerator-policy/
DRAFT
LSWMP Update Planning Studies, Regulatory, and Trends Review
City of Dallas, Texas 2-9 Burns & McDonnell
other major pieces of state legislation from the state Senate and House of Representatives have been
enacted:
• The 1983 Comprehensive Municipal Solid Waste Management, Resource Recovery, and
Conservation Act, which established the Municipal Solid Waste Management and Resource
Recovery Advisory Council, prescribed criteria and procedures for regional planning agencies and
local governments that wanted to develop solid waste management plans.
• The 1987 House Bill 2051 established a preferred hierarchy via state policy for the management of
hazardous waste, municipal waste, and municipal sludge. Figure 2-1 illustrates a current version
of the municipal waste management hierarchy.
• The 1989 Senate Bill 1519 established a solid waste disposal fee program to fund the state’s MSW
regulatory programs. It required the state’s regional planning agencies (Councils of Governments,
COG) to develop regional solid waste management plans and to provide grand funding to support
development of local plans.
• The 1991 Omnibus Recycling Act (Senate Bill 1340), set a statewide recycling goal of 40 percent
of its MSW by January 1, 1994 and directed several state agencies to develop a joint market study
and strategies to stimulate markets for recycled goods.
• The 1993 Senate Bill 1051 expanded state recycling programs and amended the state’s 40 percent
recycling goal. The goal became a 40 percent waste reduction goal, aimed at reducing the total
amount of material disposed of in the state through recycling as well as source reduction.
• The 1993 House Bill 2537 addressed the risks associated with methane gas release from closed
landfills by establishing a process for the TCEQ to review proposals and issue permits to build atop
closed MSW landfills.16
• The 2007 Texas Computer Equipment Recycling Law required manufacturers to establish and
implement a recovery plan for collection, recycling, and reuse of computer products.17
• The 2013 House Bill 7 reduced the disposal fees that landfills are required to pay to TCEQ from
$1.25 per ton to $0.94 per ton and reduced the percentage allocated to Councils of Governments
(COGs) to 33.3 percent.
• The 2015 House Bill 2736 required the TCEQ to conduct a study to quantify the amount of
materials being recycled in the state, assess the economic impacts of recycling, and identify ways
16 Texas Center for Policy Studies. 1995. “Texas Environmental Almanac.” Available online:
http://www.texascenter.org/almanac/ 17 Texas Commission on Environmental Quality. “Guidance for the Texas Recycles Computers Program”
Available online: https://www.tceq.texas.gov/p2/recycle/electronics/computer-recycling.html
DRAFT
LSWMP Update Planning Studies, Regulatory, and Trends Review
City of Dallas, Texas 2-10 Burns & McDonnell
to develop new markets to increase recycling. The TCEQ completed Study on the Economic
Impacts of Recycling in 2017.
• The 2019 House Bill 61 is the “Slow Down to Get Around” legislation that establishes a
misdemeanor violation for vehicles that do not adhere to the Transportation Code’s requirements
of slowing and moving 2 lanes away from a solid waste collection vehicle.
• The 2019 Senate Bill 649 required the TCEQ to produce a plan to stimulate the use of recyclable
material as feedstock in manufacturing. The bill also requires the TCEQ to develop an education
program outlining all the ways that recycling provides economic benefits to the state.
• The 2019 House Bill 1435 authorized the TCEQ to inspect the facility or site before a permit for a
proposed MSW management facility is issued, amended, extended, or renewed.
• The 2019 House Bill 1953 prohibited TCEQ from treating post-use polymers or recoverable
feedstocks as solid waste if the substances are converted (by pyrolysis or gasification) into other
valuable products.
• The state procurement office requires that state agencies give preference to specific types of
products known as “first choice purchasing options.” These preferred products have a 10 percent
price preferential (meaning they should be preferred even if they cost up to 10 percent more than
products that do not contain recycled content) and must suit the needs of the purchasing agency.
Preferred products include:
• Re-refined oils and lubricants (to be 25 percent recycled content, if quality similar).
• Certain paper products, including paper towels, toilet paper, toilet seat covers, printing, computer
and copier paper, and business envelopes (a state agency is to procure the highest recycled content
that meets their needs and is offered by the Comptroller).
• Certain plastic products including trash bags, binders, and recycling containers.
• Steel products.
• Additionally, the state comptroller may give priority to Rubberized Asphalt Paving (RAP) material
made from scrap tires by a facility in this state if the cost, as determined by life-cycle cost-benefit
analysis, does not exceed the bid cost of alternative paving materials by more than 15 percent.
(Texas Government Code §2155.443).
• In addition to state legislation, a rule adopted by the TCEQ, the Governmental Entity Recycling
Program, became effective July 2, 2020 and requires local government entities in Texas to create
and maintain a recycling program for their operations, as well as create a preference in purchasing
for products made of recycled materials when the cost difference is less than 10 percent.
DRAFT
LSWMP Update Planning Studies, Regulatory, and Trends Review
City of Dallas, Texas 2-11 Burns & McDonnell
As part of the Governmental Entity Recycling Program, entities must give preference to products made
with recycled materials, so long as the products meet applicable specifications as to quantity and quality
and the average price of the product is not more than 10 percent greater than the price of comparable non-
recycled products. The TCEQ rules require municipalities to:
1. Separate and collect all recyclable materials.
2. Provide procedures for collecting and storing recyclable material and making contractual or other
arrangements with buyers of recyclable materials.
3. Evaluate the amount of recyclable material recycled and modify the recycling program as necessary
to ensure that all recyclable materials are effectively and practicably recycled.
4. Establish educational and incentive programs to encourage maximum employee participation.
To establish a governmental entity recycling program, municipalities should review purchasing procedures,
prioritize purchasing products that are recyclable or contain recycled content, encourage the community to
buy recycled, and leverage the Texas Smart Buy Membership program (State of Texas Cooperative
Purchasing program). The requirements of the governmental entity recycling program are covered as part
of the sustainable procurement policy adopted by the City in May 2021. The sustainable procurement policy
guides the City in making procurement decisions that positively impact social, economic and environmental
health by establishing a working group to maintain an environmentally preferred products list, identify
sustainability labels and standards to use in writing specifications, analyze citywide purchases for efficiency
and waste reduction opportunities, and make other recommendations to achieve these ends.
2.2.3 Recent State Legislative Trends
The Texas Legislature meets on a biennium, or every other year. When the Texas Legislature is in session,
a variety of Senate and House bill proposals relating to solid waste material management are introduced.
During the recent 2021 legislative sessions, the Texas Legislature passed the following bills that could have
an impact on the solid waste industry:
1. House Bill 1322 requires agencies such as TCEQ to provide plain-language summaries of any
proposed rules.
2. House Bull 1869 amends the definition of debt in the Tax Code to include debt for “designated
infrastructure” including landfills.
3. House Bill 1118 increases cybersecurity requirements for state and local entities, including
compliance with cybersecurity training.
DRAFT
LSWMP Update Planning Studies, Regulatory, and Trends Review
City of Dallas, Texas 2-12 Burns & McDonnell
4. House Bill 2708 provides some municipalities access to certain hazardous waste remediation fees
for reimbursement related to environmental cleanup at used battery recycling facilities.
5. House Bill 3516 requires TCEQ to adopt rules for the treatment and beneficial use of oil and gas
waste, including permitting standards for commercial recycling.
6. House Bill 4110 increases recordkeeping requirements and documentation needed when a person
attempts to sell a catalytic converter to a metal recycling facility.
7. Senate Bill 211 creates a 30-day deadline to file a petition on a TCEQ ruling, such as a permit
issuance or other decision under the Solid Waste Disposal Act.
8. Senate Bill 1818 defines liability and reasonable care criteria for scrap metal recycling transactions
with an end user/manufacturing facility.
Throughout the recent 2021 session and subsequent special sessions, additional topics of interest to state
legislators were discussed based on proposed bills, but were not enacted. These topics include18:
1. Regulations related to the ability of the State to restrict local government ability to enact
prohibitions on the sale or use of a container or package.
2. Regulations that for any product listed as recycled, remanufactured, environmentally sensitive be
certified as accurate.
3. Regulations relating to municipal solid waste management services that cap the fee of gross receipts
of a collection service provider to two percent.19
4. Regulations relating to the authority of certain municipal employees to request the removal and
storage of certain abandoned or illegal parked or operated vehicles.
5. Creation of an eight-member council that advises state agencies and local governments on
environmental justice issues (15-member review board advises the council) and the creation of an
Office of Environmental Justice within the TCEQ.
6. Development of the Texas Clean and Healthy program, a rebate system for recyclable materials
with verified end markets and direct economic relief.20
18 North Central Texas Council of Governments. 2021. “87th Session Legislative Matrix.” Available online:
https://nctcog.org/nctcg/media/Environment-and-Development/Documents/Materials%20Management/87th-
Legislative-Matrix_Solid-Waste.pdf 19 North Central Texas Council of Governments. 2021. “House Bill 753 One-Pager.” Available online:
https://www.nctcog.org/nctcg/media/Environment-and-Development/Committee%20Documents/RCC/FY2021/HB-
753-One-Pager.pdf 20 North Central Texas Council of Governments. 2021. “Texas Clean and Healthy Initiative.” Available online:
https://www.nctcog.org/nctcg/media/Environment-and-
Development/Committee%20Documents/RCC/FY2021/Texas-Clean-and-Healthy-Initiative_Summary.pdf?ext=.pdf
DRAFT
LSWMP Update Planning Studies, Regulatory, and Trends Review
City of Dallas, Texas 2-13 Burns & McDonnell
7. Amendment of the water code to restrict direct discharge or waste or pollutants into a classified
stream segments that has had low phosphorus level at or below 0.06 mg/L in 90% or more of water
quality samples for 10 years.
8. Regulation to allow a county to regulate solid waste services and ability to establish a mandatory
program to collect a fee for solid waste services through the county tax assessor-collector’s office.
9. Stricter regulations for locations of new landfills or the horizontal expansion of existing landfills
in environmentally sensitive areas, such as over sole source aquifers or within special flood hazard
areas.
10. Regulation related to the discharge of preproduction plastic, including prompt and environmentally
responsible containment and cleanup, additional stormwater permit requirements, monitoring and
implementation of best management practices.
2.2.4 Role of the City of Dallas in Regulating Solid Waste
Chapter 18 of the Dallas City Code regulates the collection and disposal of MSW and defines Sanitation
Services as the department of the City that is responsible for the operation of the City’s solid waste
collection and disposal utility. This provides the regulations for the following aspects of solid waste
management:
1. Proper material set -outs
2. Collecting from residences, duplexes, apartments, institutions, commercial establishments and
mobile home parks
3. Collection and removal of recyclable materials from multifamily sites
4. Collection and removal of material from the Downtown Area
5. Solid waste not handled by the Sanitation Services Department
6. Charges for disposal of solid waste
7. Collection and removal of illegally dumped materials on private premises
8. Penalties for violation
9. Weeds, grass and vegetation
10. Junked vehicles
11. Private solid waste collection service
12. Tires
2.3 Solid Waste Material Management Industry Trends
Solid Waste management philosophy, trends and practices have evolved significantly since the 2011
LSWMP. Key MSW management trends that may influence development of the LSWMP Update include,
DRAFT
LSWMP Update Planning Studies, Regulatory, and Trends Review
City of Dallas, Texas 2-14 Burns & McDonnell
but are not limited to, Sustainable Material Management (SMM), the waste management hierarchy, Zero
Waste philosophy, circular economic practices, and several other local and national material management
industry trends. This section provides perspective on key MSW management trends that may influence the
development of the LSWMP Update and the industry moving forward.
Sustainable Materials Management. SMM is a systematic approach to using and reusing materials more
productively over their entire life cycles.21 SMM encourages changes in how communities think about the
use of natural resources and environmental protection, and goes beyond traditional thinking about waste
reduction, reuse, recycling, and disposal. SMM emphasizes the consideration of a product’s life from
manufacturing to disposal and the need to make sustainable choices throughout that life cycle. An SMM
approach seeks to:
• Use materials in the most productive way with an emphasis on using less.
• Reduce toxic chemicals and environmental impacts throughout a material’s life cycle.
• Provide sufficient resources to meet the material needs of today and the future.
It has been a trend for the material management industry to apply the broad view of SMM to better plan for
their community’s economic and environmental future. For example, as discussed in Table 2-2, several
cities in Texas (including Dallas) have adopted plans with high diversion goals, which typically include
addressing SMM concepts.
21 U.S. Environmental Protection Agency (U.S. EPA). 2017. “Sustainable Materials Management Basics.”
Available online: https://www.epa.gov/smm/sustainable-materials-management-basics
DRAFT
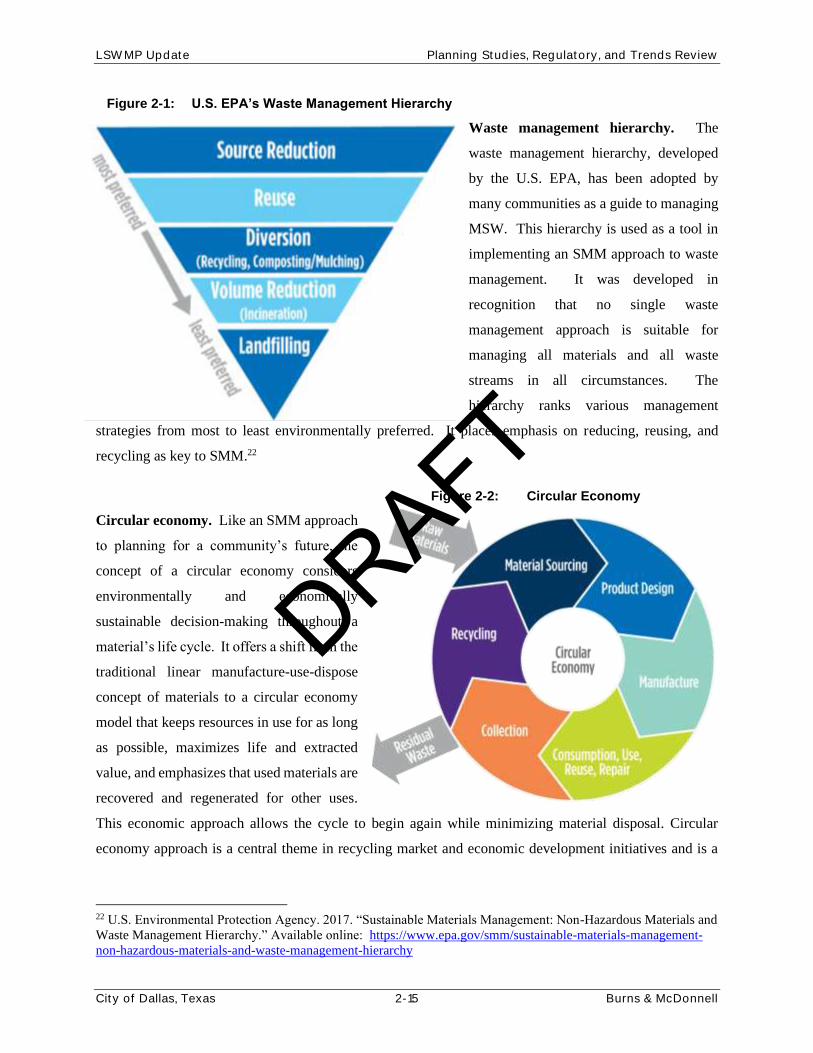
LSWMP Update Planning Studies, Regulatory, and Trends Review
City of Dallas, Texas 2-15 Burns & McDonnell
Figure 2-1: U.S. EPA’s Waste Management Hierarchy
Waste management hierarchy. The
waste management hierarchy, developed
by the U.S. EPA, has been adopted by
many communities as a guide to managing
MSW. This hierarchy is used as a tool in
implementing an SMM approach to waste
management. It was developed in
recognition that no single waste
management approach is suitable for
managing all materials and all waste
streams in all circumstances. The
hierarchy ranks various management
strategies from most to least environmentally preferred. It places emphasis on reducing, reusing, and
recycling as key to SMM.22
Figure 2-2: Circular Economy
Circular economy. Like an SMM approach
to planning for a community’s future, the
concept of a circular economy considers
environmentally and economically
sustainable decision-making throughout a
material’s life cycle. It offers a shift from the
traditional linear manufacture-use-dispose
concept of materials to a circular economy
model that keeps resources in use for as long
as possible, maximizes life and extracted
value, and emphasizes that used materials are
recovered and regenerated for other uses.
This economic approach allows the cycle to begin again while minimizing material disposal. Circular
economy approach is a central theme in recycling market and economic development initiatives and is a
22 U.S. Environmental Protection Agency. 2017. “Sustainable Materials Management: Non-Hazardous Materials and
Waste Management Hierarchy.” Available online: https://www.epa.gov/smm/sustainable-materials-management-
non-hazardous-materials-and-waste-management-hierarchy
DRAFT
LSWMP Update Planning Studies, Regulatory, and Trends Review
City of Dallas, Texas 2-16 Burns & McDonnell
goal of the City’s CECAP to encourage the development of material markets and focusing on creating new
economic opportunities within the City.
Zero Waste. Zero Waste is a philosophy that encourages the redesign of resource life cycles so that all
products are reused. Zero waste is not a static, defined benchmark of eliminating landfill disposal of waste,
but is rather a vision or philosophy around which communities and society should develop and adapt their
materials management systems and culture. A number of industry organizations, states, and cities have
begun setting zero waste goals. While diversion recycling rate is a common metric used to evaluate zero
waste progress, 100 percent diversion recycling is not the ultimate goal of zero waste; rather, the focus is
on continuous improvement and progressively working toward maximizing use of resources, and
minimizing adverse environmental impacts and material disposal.
A comparison of the accepted municipal and industry definitions of zero waste shows that there are a
number of prominent or key concepts across zero waste philosophies:
• Zero Waste as a guiding vision, philosophy, or set of principles (rather than a numeric goal); Zero
Waste as striving for continuous improvement, not an absolute term or goal.
• System and material life cycle approach.
• Minimize waste generation and promote waste prevention.
• Circular economy.
• Supporting economic value, stimulation, and job creation.
• Minimization of environmental and health impacts (e.g., greenhouse gas emissions, landfill burial,
water pollution).
• View used materials as resources, not waste and maximize recovery of materials.
• Extended producer responsibility (EPR).
• Adherence to the materials management hierarchy.
High Recycling or Zero Waste Goals by Other Texas Cities. Over the last 10 years, several cities
(including Dallas) in Texas have developed MSW management plans that include goals to recycle or divert
a high percentage of material from being landfilled. Some of these cities have specifically developed “Zero
Waste” plans, while others have preferred to use terminology such as “high diversion.” Zero Waste is a
philosophy that encourages the redesign of resource life cycles so that all products are reused. The goal for
Zero Waste is that no MSW be sent to landfills or waste-to-energy facilities. Zero Waste is more a goal or
DRAFT
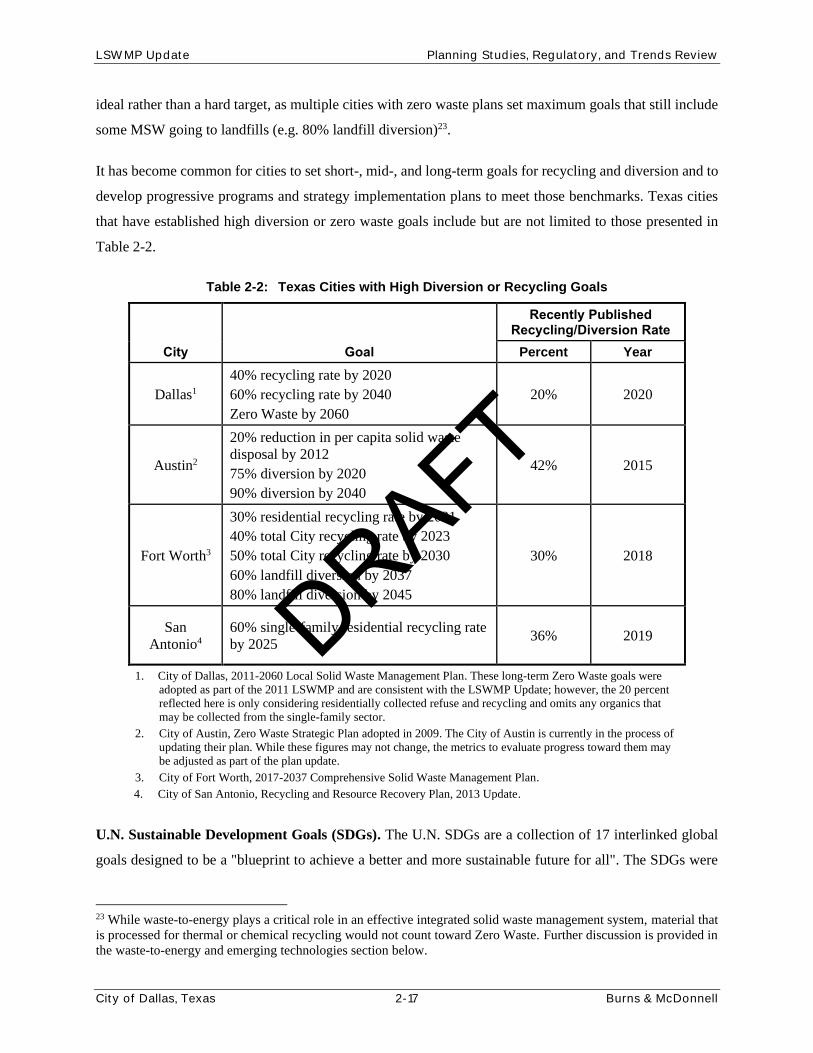
LSWMP Update Planning Studies, Regulatory, and Trends Review
City of Dallas, Texas 2-17 Burns & McDonnell
ideal rather than a hard target, as multiple cities with zero waste plans set maximum goals that still include
some MSW going to landfills (e.g. 80% landfill diversion)23.
It has become common for cities to set short-, mid-, and long-term goals for recycling and diversion and to
develop progressive programs and strategy implementation plans to meet those benchmarks. Texas cities
that have established high diversion or zero waste goals include but are not limited to those presented in
Table 2-2.
Table 2-2: Texas Cities with High Diversion or Recycling Goals
City Goal
Recently Published Recycling/Diversion Rate
Percent Year
Dallas1
40% recycling rate by 2020
60% recycling rate by 2040
Zero Waste by 2060
20% 2020
Austin2
20% reduction in per capita solid waste
disposal by 2012
75% diversion by 2020
90% diversion by 2040
42% 2015
Fort Worth3
30% residential recycling rate by 2021
40% total City recycling rate by 2023
50% total City recycling rate by 2030
60% landfill diversion by 2037
80% landfill diversion by 2045
30% 2018
San
Antonio4
60% single-family residential recycling rate
by 2025 36% 2019
1. City of Dallas, 2011-2060 Local Solid Waste Management Plan. These long-term Zero Waste goals were
adopted as part of the 2011 LSWMP and are consistent with the LSWMP Update; however, the 20 percent
reflected here is only considering residentially collected refuse and recycling and omits any organics that
may be collected from the single-family sector.
2. City of Austin, Zero Waste Strategic Plan adopted in 2009. The City of Austin is currently in the process of
updating their plan. While these figures may not change, the metrics to evaluate progress toward them may
be adjusted as part of the plan update.
3. City of Fort Worth, 2017-2037 Comprehensive Solid Waste Management Plan.
4. City of San Antonio, Recycling and Resource Recovery Plan, 2013 Update.
U.N. Sustainable Development Goals (SDGs). The U.N. SDGs are a collection of 17 interlinked global
goals designed to be a "blueprint to achieve a better and more sustainable future for all". The SDGs were
23 While waste-to-energy plays a critical role in an effective integrated solid waste management system, material that
is processed for thermal or chemical recycling would not count toward Zero Waste. Further discussion is provided in
the waste-to-energy and emerging technologies section below.
DRAFT
LSWMP Update Planning Studies, Regulatory, and Trends Review
City of Dallas, Texas 2-18 Burns & McDonnell
set up in 2015 by the United Nations General Assembly and are intended to be achieved by 2030. While
the LSWMP Update does not include goals or objectives related to the U.N. SDGs, commercial entities in
the City may use this system to support its materials management practices and policies.
Recycling Measurement. Traditionally, a recycling rate has been calculated as a means to measure
recycling efforts. A recycling rate indicates the percentage of MSW generated that is recycled. In support
of the use of transparent and consistent methods to measure materials recycled, the Solid Waste Association
of North America (SWANA) technical policy for Measuring Recycling (T-6.4), published in 2018, defines
recycling rate as the proportion of generated MSW that is recycled and is typically calculated utilizing the
following formula, where totals are measured by weight in tons24.
𝑡𝑜𝑡𝑎𝑙 𝑟𝑒𝑐𝑦𝑐𝑙𝑒𝑑
𝑡𝑜𝑡𝑎𝑙 𝑟𝑒𝑐𝑦𝑐𝑙𝑒𝑑 + 𝑡𝑜𝑡𝑎𝑙 𝑑𝑖𝑠𝑝𝑜𝑠𝑒𝑑× 100% = 𝑟𝑒𝑐𝑦𝑐𝑙𝑖𝑛𝑔 𝑟𝑎𝑡𝑒 𝑝𝑒𝑟𝑐𝑒𝑛𝑡𝑎𝑔𝑒
The recycling rate may vary depending on the material types and generators that are included in the
calculation. For example, including commercially generated material is challenging because there is no
mandatory reporting requirement that the City could use to collect, verify and analyze tonnage data and is
unaware of any recycling that is currently being conducted in the commercial sector.
Over the past decade, the weights and composition of materials in MSW streams have changed. For
example, there is now typically less newspaper but more cardboard, and individual plastic bottles and
aluminum cans weigh less. Some consumer packaging contains multiple materials, making recycling more
challenging. Due to these factors, some communities are considering alternative methods to recycling
measurement, other than recycling rates as described above:
• Single-stream recycling collected. The amount of residential recyclables collected annually on a
pounds per household basis.
• Capture rate. Percentage of recyclable material that is recycled versus disposed.
• Disposal rate. Based on per capita/employee disposal quantities.
• Contamination rate. The amount of contamination (i.e., material that is not accepted by the City’s
contract recycling processing facility) present in the residential recycling program on a percentage
basis. Contamination rate includes both non-recyclable contaminants and MRF process residue.
• Participation rate. Based on how frequently a resident or business recycles over a defined time
period (e.g., monthly).
24 Solid Waste Association of North America Technical Policy T-6.4, Measuring Recycling, available at
https://swana.org/TechnicalandManagementPolicies.aspx
DRAFT
LSWMP Update Planning Studies, Regulatory, and Trends Review
City of Dallas, Texas 2-19 Burns & McDonnell
• Life cycle analysis. Analysis of the total environmental impacts associated with a product or
process and evaluation of opportunities to reduce impacts throughout its life cycle, using methods
such as replacing virgin material inputs with recycled material.
• Carbon footprint. Quantification of greenhouse gas reductions through increased use of recycled
materials as product inputs (life cycle analysis) and reduction of material landfilled, which reduces
the generation of greenhouse gases due to decomposition.
Environmental justice and equity. Environmental justice and equity considerations related to material
management are critical trends that municipalities are considering related to economic development, future
infrastructure and transportation needs. Equity is a key consideration that informed the recommendations
and goals adopted by set by the City’s CECAP (e.g. considering equity to determine siting of any future
transfer stations or solid waste management facilities). An example of this is the City’s Multi-Family
Recycling Ordinance (MFRO). A critical intended impact of the policy is to increase the environmental
justice and equity for its residents related to solid waste material management by providing increased access
to recycling among residents who live in multi-family tenant dwelling units. Further description related to
the MFRO is provided in Section 11.0.
Waste-to-energy and emerging technologies. While recycling and disposal have been considered
traditional solid waste material management methods in Texas, some components of the solid waste stream
can be converted into energy or further processed. In the 2011 LSWMP, several waste-to-energy
technologies were evaluated. Following that effort as part of the 2014 Resource Recovery Planning and
Implementation Study, the City further evaluated several emerging technology options including the
following, with brief descriptions:
• Mixed waste processing. A mechanical process to segregate recyclable materials from the solid
waste stream to increase the recovery or recyclables from residential or commercial garbage (e.g.
mixed waste) and preparation of materials to be sold at market.
• Gasification. A technologically-advanced process that converts the carbon-containing materials in
mixed waste (such as paper, plastic, wood, rubber and other organics) into a synthesis gas or
“syngas” composed primarily of carbon monoxide and hydrogen used as fuel to generate electricity
or as a chemical building block in the synthesis of gasoline or diesel fuel
• Anaerobic digestion. A biological process by which organic matter found in the solid waste stream
decomposes in the absence of oxygen, producing and using biogas to generate energy and
producing a compost product marketed as fertilizer or soil amendment.
As part of the results and recommendations of the 2014 Resource Recovery Planning and Implementation
Study, the high cost of development and implementation of mixed waste processing, gasification and
DRAFT
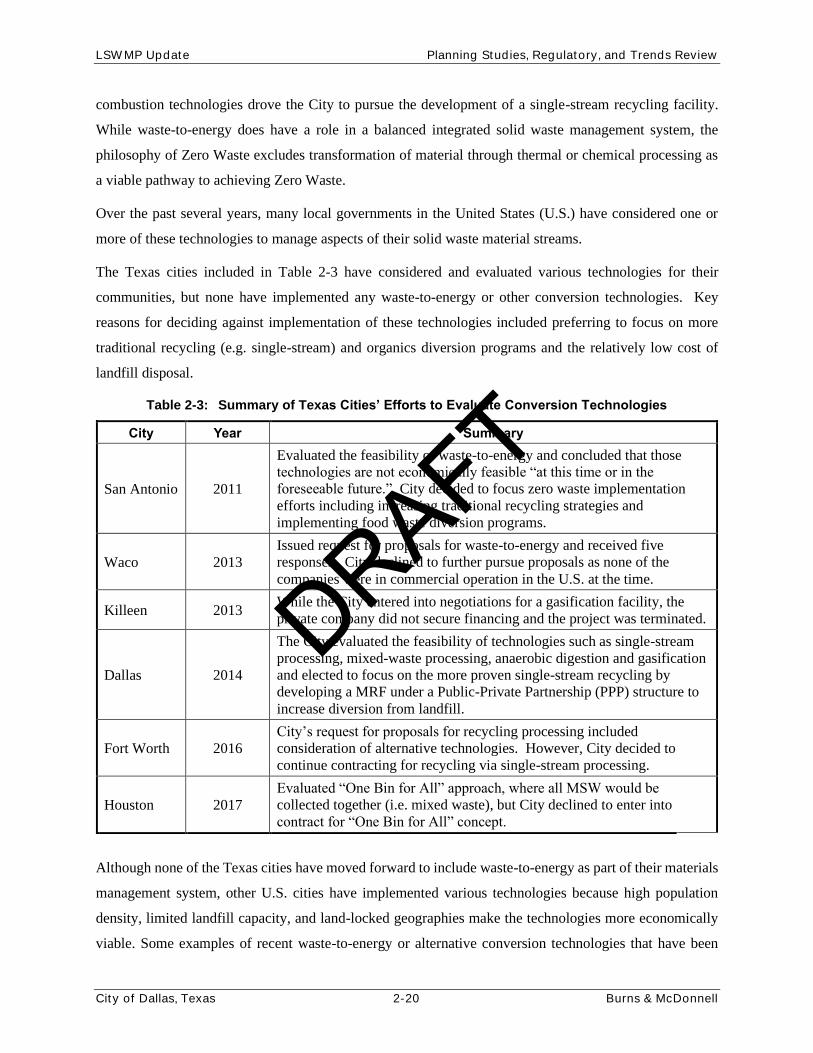
LSWMP Update Planning Studies, Regulatory, and Trends Review
City of Dallas, Texas 2-20 Burns & McDonnell
combustion technologies drove the City to pursue the development of a single-stream recycling facility.
While waste-to-energy does have a role in a balanced integrated solid waste management system, the
philosophy of Zero Waste excludes transformation of material through thermal or chemical processing as
a viable pathway to achieving Zero Waste.
Over the past several years, many local governments in the United States (U.S.) have considered one or
more of these technologies to manage aspects of their solid waste material streams.
The Texas cities included in Table 2-3 have considered and evaluated various technologies for their
communities, but none have implemented any waste-to-energy or other conversion technologies. Key
reasons for deciding against implementation of these technologies included preferring to focus on more
traditional recycling (e.g. single-stream) and organics diversion programs and the relatively low cost of
landfill disposal.
Table 2-3: Summary of Texas Cities’ Efforts to Evaluate Conversion Technologies
City Year Summary
San Antonio 2011
Evaluated the feasibility of waste-to-energy and concluded that those
technologies are not economically feasible “at this time or in the
foreseeable future.” City decided to focus zero waste implementation
efforts including increasing traditional recycling strategies and
implementing food waste diversion programs.
Waco 2013
Issued request for proposals for waste-to-energy and received five
responses. City declined to further pursue proposals as none of the
companies were in commercial operation in the U.S. at the time.
Killeen 2013 While the City entered into negotiations for a gasification facility, the
private company did not secure financing and the project was terminated.
Dallas 2014
The City evaluated the feasibility of technologies such as single-stream
processing, mixed-waste processing, anaerobic digestion and gasification
and elected to focus on the more proven single-stream recycling by
developing a MRF under a Public-Private Partnership (PPP) structure to
increase diversion from landfill.
Fort Worth 2016
City’s request for proposals for recycling processing included
consideration of alternative technologies. However, City decided to
continue contracting for recycling via single-stream processing.
Houston 2017
Evaluated “One Bin for All” approach, where all MSW would be
collected together (i.e. mixed waste), but City declined to enter into
contract for “One Bin for All” concept.
Although none of the Texas cities have moved forward to include waste-to-energy as part of their materials
management system, other U.S. cities have implemented various technologies because high population
density, limited landfill capacity, and land-locked geographies make the technologies more economically
viable. Some examples of recent waste-to-energy or alternative conversion technologies that have been
DRAFT
LSWMP Update Planning Studies, Regulatory, and Trends Review
City of Dallas, Texas 2-21 Burns & McDonnell
implemented include Fiberight (https://fiberight.com/facilities/) in Bangor, ME and Enerkem
(https://enerkem.com/company/facilities-projects/) in Edmonton, CAN. The most recent combustion
waste-to-energy facility developed in the U.S. was implemented by the Solid Waste Authority of Palm
Beach County, Florida in 201525. Although waste-to-energy project is not being actively pursued in the
near-term, the City would consider these as long-term options to support the continued development of a
robust integrated solid waste management system.
Landfill Trends. As regulations become more restrictive and it becomes increasingly more challenging to
obtain permits for new landfills, the MSW industry is seeing an increase in the vertical and horizontal
expansion of established landfills. Owners are more commonly seeking to extend the useful life of their
landfill by expanding the landfill footprint, improving operations, or implementing additional technologies
such as enhanced leachate recirculation (a process in which liquids or air are added into a landfill to
accelerate degradation of the waste and prolonging its useful life).
Landfill capacity is a finite resource in the region and permitting new landfills is becoming increasingly
difficult. Closing facilities such as the DFW Landfill operated by Waste Management may cause tonnage
flows to shift among facilities in the region, where displaced tonnage from closing landfills are required to
be disposed at other facilities. Further discussion of the disposal marketplace is provided in Section
4.1.1.2.0.
Landfill Tipping Fees. The Environmental Research and Education Foundation (EREF) has conducted
annual studies comparing landfill tipping fees across the country since 2016. In 2019, average per-ton
landfill tipping fees in Texas are lower than both the national average and the South Central Region
(Arkansas, Louisiana, New Mexico, Oklahoma, and Texas) average. In 2020, the average landfill tipping
fees in Texas remained below the national average but rose slightly higher than the regional average. The
average tipping fees in Texas increased while both the regional and national averages decreased slightly in
the year from 2019-2020.26 This increase could be attributed to differences in economic growth across
regions and landfill capacity, as well as that EREF received responses from a slightly different set of
landfills from one year to the next. The multi-year trends developed by EREF show increasing tip fees
nationally and in all regions over the period from 2016 - 2020.
25 Solid Waste Authority of Palm Beach County. “Renewable Energy Facility 2” Available online:
https://www.swa.org/Facilities/Facility/Details/Renewable-Energy-Facility-2-11 26 Environmental Research & Education Foundation (EREF). March 2020 and January 2021. “Analysis of MSW
Landfill Tipping Fees.” Available online: https://erefdn.org/bibliography/datapolicy-projects/
DRAFT
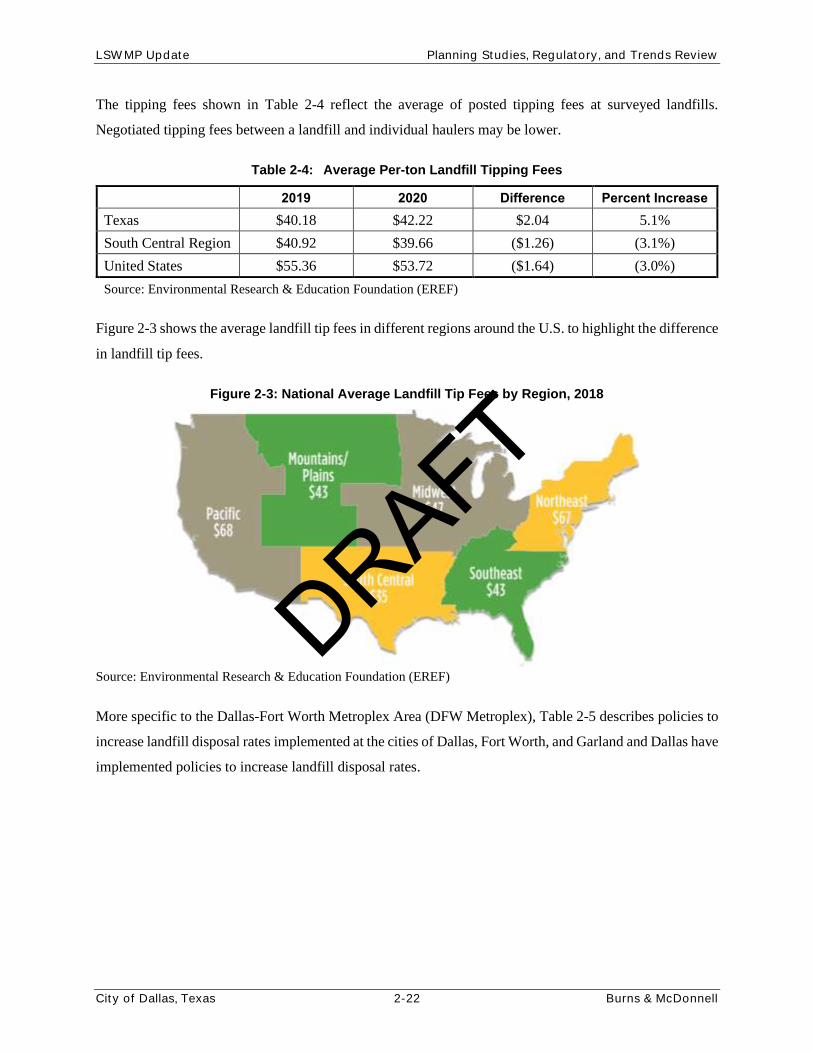
LSWMP Update Planning Studies, Regulatory, and Trends Review
City of Dallas, Texas 2-22 Burns & McDonnell
The tipping fees shown in Table 2-4 reflect the average of posted tipping fees at surveyed landfills.
Negotiated tipping fees between a landfill and individual haulers may be lower.
Table 2-4: Average Per-ton Landfill Tipping Fees
2019 2020 Difference Percent Increase
Texas $40.18 $42.22 $2.04 5.1%
South Central Region $40.92 $39.66 ($1.26) (3.1%)
United States $55.36 $53.72 ($1.64) (3.0%)
Source: Environmental Research & Education Foundation (EREF)
Figure 2-3 shows the average landfill tip fees in different regions around the U.S. to highlight the difference
in landfill tip fees.
Figure 2-3: National Average Landfill Tip Fees by Region, 2018
Source: Environmental Research & Education Foundation (EREF)
More specific to the Dallas-Fort Worth Metroplex Area (DFW Metroplex), Table 2-5 describes policies to
increase landfill disposal rates implemented at the cities of Dallas, Fort Worth, and Garland and Dallas have
implemented policies to increase landfill disposal rates.
DRAFT
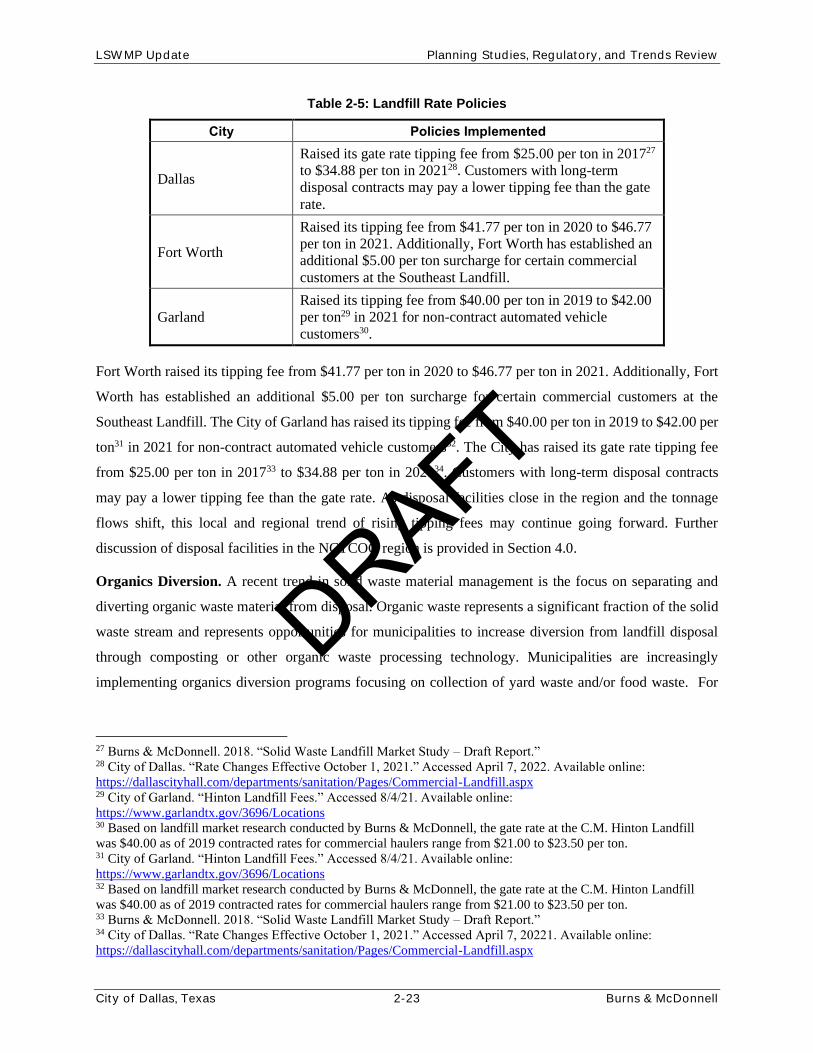
LSWMP Update Planning Studies, Regulatory, and Trends Review
City of Dallas, Texas 2-23 Burns & McDonnell
Table 2-5: Landfill Rate Policies
City Policies Implemented
Dallas
Raised its gate rate tipping fee from $25.00 per ton in 201727
to $34.88 per ton in 202128. Customers with long-term
disposal contracts may pay a lower tipping fee than the gate
rate.
Fort Worth
Raised its tipping fee from $41.77 per ton in 2020 to $46.77
per ton in 2021. Additionally, Fort Worth has established an
additional $5.00 per ton surcharge for certain commercial
customers at the Southeast Landfill.
Garland
Raised its tipping fee from $40.00 per ton in 2019 to $42.00
per ton29 in 2021 for non-contract automated vehicle
customers30.
Fort Worth raised its tipping fee from $41.77 per ton in 2020 to $46.77 per ton in 2021. Additionally, Fort
Worth has established an additional $5.00 per ton surcharge for certain commercial customers at the
Southeast Landfill. The City of Garland has raised its tipping fee from $40.00 per ton in 2019 to $42.00 per
ton31 in 2021 for non-contract automated vehicle customers32. The City has raised its gate rate tipping fee
from $25.00 per ton in 201733 to $34.88 per ton in 202134. Customers with long-term disposal contracts
may pay a lower tipping fee than the gate rate. As disposal facilities close in the region and the tonnage
flows shift, this local and regional trend of rising tipping fees may continue going forward. Further
discussion of disposal facilities in the NCTCOG region is provided in Section 4.0.
Organics Diversion. A recent trend in solid waste material management is the focus on separating and
diverting organic waste material from disposal. Organic waste represents a significant fraction of the solid
waste stream and represents opportunities for municipalities to increase diversion from landfill disposal
through composting or other organic waste processing technology. Municipalities are increasingly
implementing organics diversion programs focusing on collection of yard waste and/or food waste. For
27 Burns & McDonnell. 2018. “Solid Waste Landfill Market Study – Draft Report.” 28 City of Dallas. “Rate Changes Effective October 1, 2021.” Accessed April 7, 2022. Available online:
https://dallascityhall.com/departments/sanitation/Pages/Commercial-Landfill.aspx 29 City of Garland. “Hinton Landfill Fees.” Accessed 8/4/21. Available online:
https://www.garlandtx.gov/3696/Locations 30 Based on landfill market research conducted by Burns & McDonnell, the gate rate at the C.M. Hinton Landfill
was $40.00 as of 2019 contracted rates for commercial haulers range from $21.00 to $23.50 per ton. 31 City of Garland. “Hinton Landfill Fees.” Accessed 8/4/21. Available online:
https://www.garlandtx.gov/3696/Locations 32 Based on landfill market research conducted by Burns & McDonnell, the gate rate at the C.M. Hinton Landfill
was $40.00 as of 2019 contracted rates for commercial haulers range from $21.00 to $23.50 per ton. 33 Burns & McDonnell. 2018. “Solid Waste Landfill Market Study – Draft Report.” 34 City of Dallas. “Rate Changes Effective October 1, 2021.” Accessed April 7, 20221. Available online:
https://dallascityhall.com/departments/sanitation/Pages/Commercial-Landfill.aspx
DRAFT
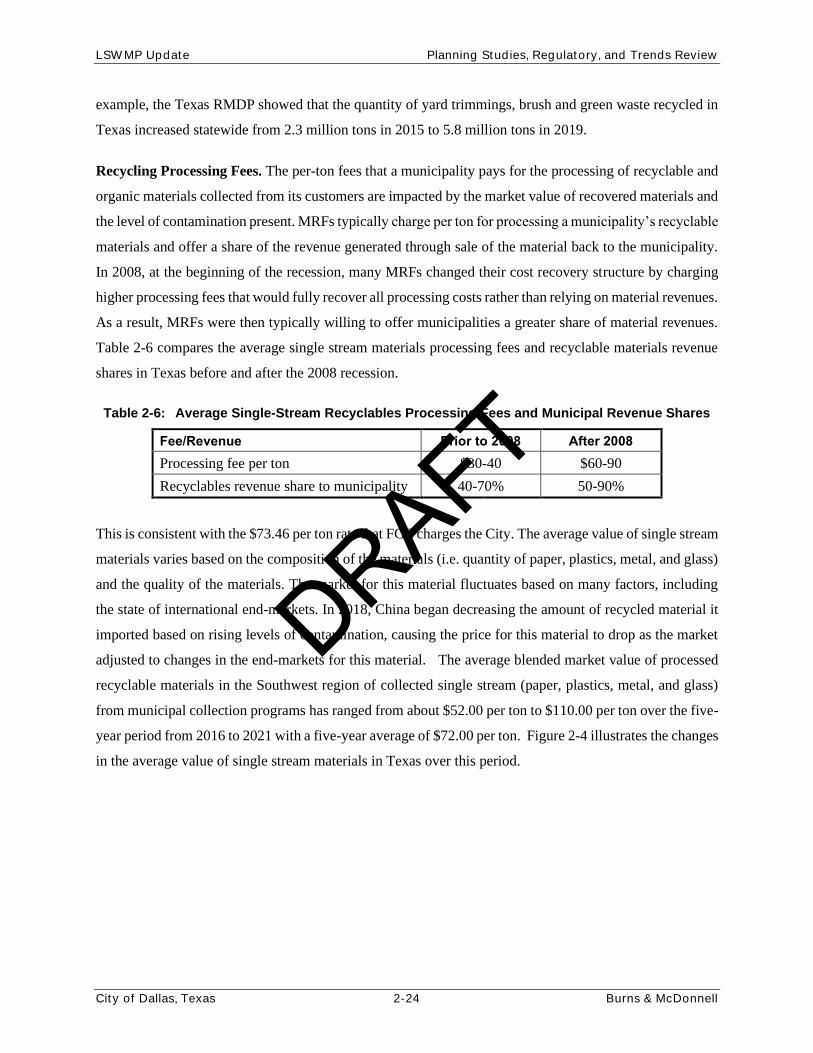
LSWMP Update Planning Studies, Regulatory, and Trends Review
City of Dallas, Texas 2-24 Burns & McDonnell
example, the Texas RMDP showed that the quantity of yard trimmings, brush and green waste recycled in
Texas increased statewide from 2.3 million tons in 2015 to 5.8 million tons in 2019.
Recycling Processing Fees. The per-ton fees that a municipality pays for the processing of recyclable and
organic materials collected from its customers are impacted by the market value of recovered materials and
the level of contamination present. MRFs typically charge per ton for processing a municipality’s recyclable
materials and offer a share of the revenue generated through sale of the material back to the municipality.
In 2008, at the beginning of the recession, many MRFs changed their cost recovery structure by charging
higher processing fees that would fully recover all processing costs rather than relying on material revenues.
As a result, MRFs were then typically willing to offer municipalities a greater share of material revenues.
Table 2-6 compares the average single stream materials processing fees and recyclable materials revenue
shares in Texas before and after the 2008 recession.
Table 2-6: Average Single-Stream Recyclables Processing Fees and Municipal Revenue Shares
Fee/Revenue Prior to 2008 After 2008
Processing fee per ton $30-40 $60-90
Recyclables revenue share to municipality 40-70% 50-90%
This is consistent with the $73.46 per ton rate that FCC charges the City. The average value of single stream
materials varies based on the composition of the materials (i.e. quantity of paper, plastics, metal, and glass)
and the quality of the materials. The market for this material fluctuates based on many factors, including
the state of international end-markets. In 2018, China began decreasing the amount of recycled material it
imported based on rising levels of contamination, causing the price for this material to drop as the market
adjusted to changes in the end-markets for this material. The average blended market value of processed
recyclable materials in the Southwest region of collected single stream (paper, plastics, metal, and glass)
from municipal collection programs has ranged from about $52.00 per ton to $110.00 per ton over the five-
year period from 2016 to 2021 with a five-year average of $72.00 per ton. Figure 2-4 illustrates the changes
in the average value of single stream materials in Texas over this period.
DRAFT
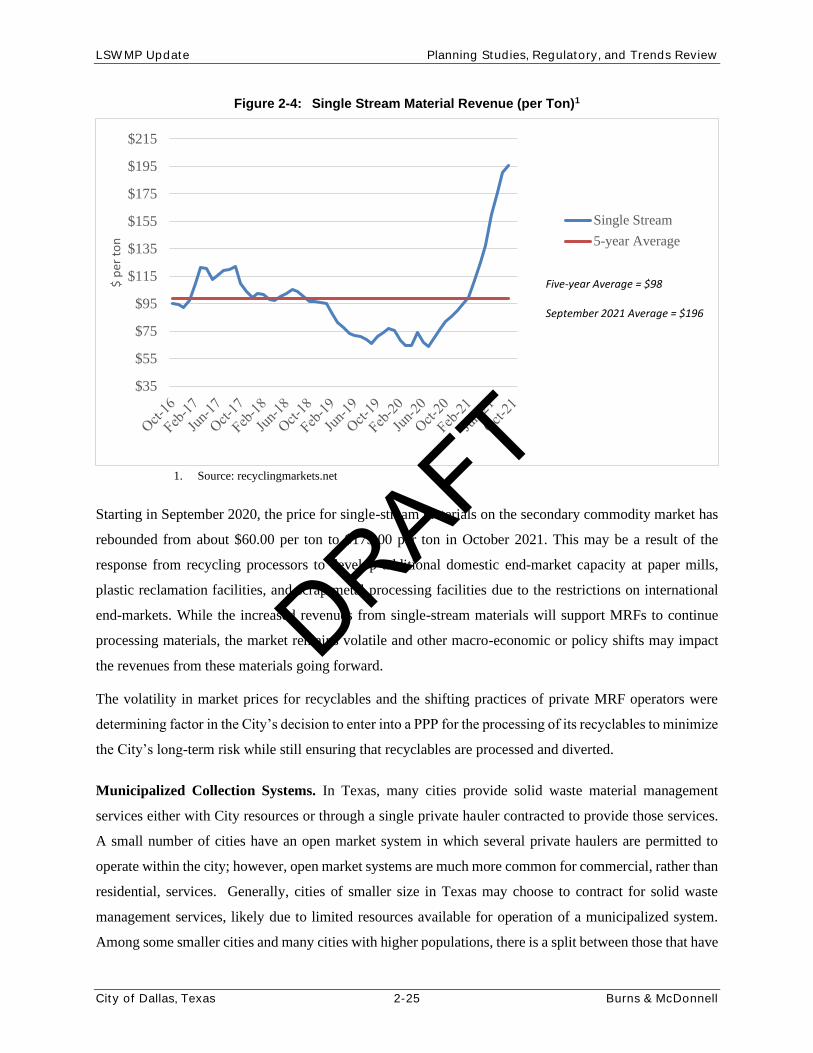
LSWMP Update Planning Studies, Regulatory, and Trends Review
City of Dallas, Texas 2-25 Burns & McDonnell
Figure 2-4: Single Stream Material Revenue (per Ton)1
1. Source: recyclingmarkets.net
Starting in September 2020, the price for single-stream materials on the secondary commodity market has
rebounded from about $60.00 per ton to $175.00 per ton in October 2021. This may be a result of the
response from recycling processors to develop additional domestic end-market capacity at paper mills,
plastic reclamation facilities, and scrap metal processing facilities due to the restrictions on international
end-markets. While the increased revenues from single-stream materials will support MRFs to continue
processing materials, the market remains volatile and other macro-economic or policy shifts may impact
the revenues from these materials going forward.
The volatility in market prices for recyclables and the shifting practices of private MRF operators were
determining factor in the City’s decision to enter into a PPP for the processing of its recyclables to minimize
the City’s long-term risk while still ensuring that recyclables are processed and diverted.
Municipalized Collection Systems. In Texas, many cities provide solid waste material management
services either with City resources or through a single private hauler contracted to provide those services.
A small number of cities have an open market system in which several private haulers are permitted to
operate within the city; however, open market systems are much more common for commercial, rather than
residential, services. Generally, cities of smaller size in Texas may choose to contract for solid waste
management services, likely due to limited resources available for operation of a municipalized system.
Among some smaller cities and many cities with higher populations, there is a split between those that have
$35
$55
$75
$95
$115
$135
$155
$175
$195
$215
$ p
er t
on
Single Stream
5-year Average
Five-year Average = $98
September 2021 Average = $196
DRAFT

LSWMP Update Planning Studies, Regulatory, and Trends Review
City of Dallas, Texas 2-26 Burns & McDonnell
municipally and privately provided services. This approach is consistent with cities of comparable size in
Texas. Table 2-7 shows the top 10 largest cities in Texas and how residential collection, recycling
processing, disposal and transfer operations are managed.
DRAFT
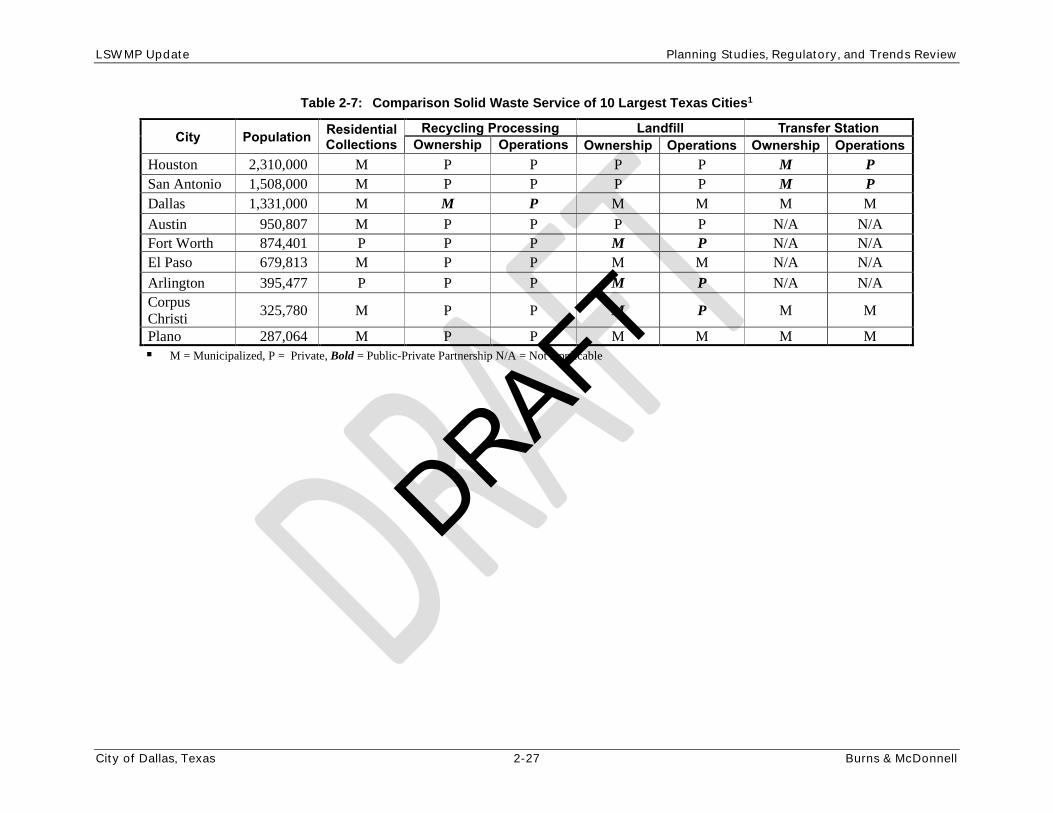
LSWMP Update Planning Studies, Regulatory, and Trends Review
City of Dallas, Texas 2-27 Burns & McDonnell
Table 2-7: Comparison Solid Waste Service of 10 Largest Texas Cities1
City Population Residential Collections
Recycling Processing Landfill Transfer Station
Ownership Operations Ownership Operations Ownership Operations
Houston 2,310,000 M P P P P M P
San Antonio 1,508,000 M P P P P M P
Dallas 1,331,000 M M P M M M M
Austin 950,807 M P P P P N/A N/A
Fort Worth 874,401 P P P M P N/A N/A
El Paso 679,813 M P P M M N/A N/A
Arlington 395,477 P P P M P N/A N/A
Corpus
Christi 325,780 M P P M P M M
Plano 287,064 M P P M M M M
▪ M = Municipalized, P = Private, Bold = Public-Private Partnership N/A = Not Applicable
DRAFT
LSWMP Update Planning Studies, Regulatory, and Trends Review
City of Dallas, Texas 2-28 Burns & McDonnell
Alternative Fleet Fueling. Over the last five years there has been an increase in the manufacture and
deployment of alternative fleet fueling options including Compressed Natural Gas (CNG) and battery-
powered solid waste collection vehicles and other equipment typical of municipal fleets (e.g. passenger
vehicles, pickup trucks, etc.). Cities with ambitious greenhouse gas reduction goals are considering the
purchase and implementation of these types of vehicles to support that effort. In the City’s CECAP, one of
the goals is to explore the potential for electric waste collection trucks to replace short range vehicles over
time as part of a fleet replacement program. The requirements, challenges and potential financial impact of
implementing battery-powered electric vehicles in the City’s fleet is provided in Section 6.0. Additionally,
the NCTCOG is currently developing a feasibility study for the manufacture of Renewable Natural Gas
(RNG) for use in vehicle fleets in the DFW Metroplex.
DRAFT
LSWMP Update Planning Area Characteristics
City of Dallas, Texas 3-1 Burns & McDonnell
3.0 PLANNING AREA CHARACTERISTICS
To properly plan for the City’s future solid waste and recycling management needs, an understanding of
the factors that will impact those needs is important. This section describes the City’s current demographic
and economic characteristics as well as anticipated future growth. To the extent that data is available, the
material generation in the City is presented. As the population and economic activity of the City and region
continue to grow, the volume of materials generated will increase accordingly. Anticipated growth of
residents, businesses and development in the City is one of the primary factors the City and North Central
Texas region must consider in planning for future materials management. Following description of the
demographic and economic characteristics of the City, this section presents material generation forecasts
and waste characterization information on a statewide and regional basis that provide the baseline for
various analyses included throughout the LSWMP Update such as evaluating facility capacities (e.g.,
transfer station system, Landfill, FCC MRF, etc.), future operational requirements for the City’s programs
(e.g., curbside collection, brush and bulky item collection), estimating diversion potential from the
residential and commercial sectors, and identifying key material types to target for diversion.
3.1 Demographic and Economic Characteristics
The population and economic growth the City experiences in the coming years will directly determine the
quantities of material generated in the City. Anticipated material generation quantities will impact future
materials management planning aspects addressed throughout this LSWMP Update including infrastructure
development, public-private partnership development, and appropriate timing of continued system and
program development. This section presents a selection of existing population data and projections and
economic development information to provide an understanding of the planning area considerations under
which this LSWMP Update has been developed.
3.1.1 Historical and Current Population
The City’s population has grown since the 2011 LSWMP was published, from a population of
approximately 1,205,490 in 2011 to 1,320,170 in 202135 representing a 0.91% compound annual growth
rate. Figure 3-1 presents the City’s population growth from 2011 to 2021 based on regional population data
published by NCTCOG. The NCTCOG population dataset and projections are used in the LSWMP Update
rather than data generated by the U.S. Census Bureau because it is based on the local region.
35 North Central Texas Council of Governments Regional Data Center. “2021 NCTCOG Population Estimates
(City)” Available online: https://data-nctcoggis.opendata.arcgis.com/datasets/NCTCOGGIS::2021-nctcog-
population-estimates-city/about
DRAFT
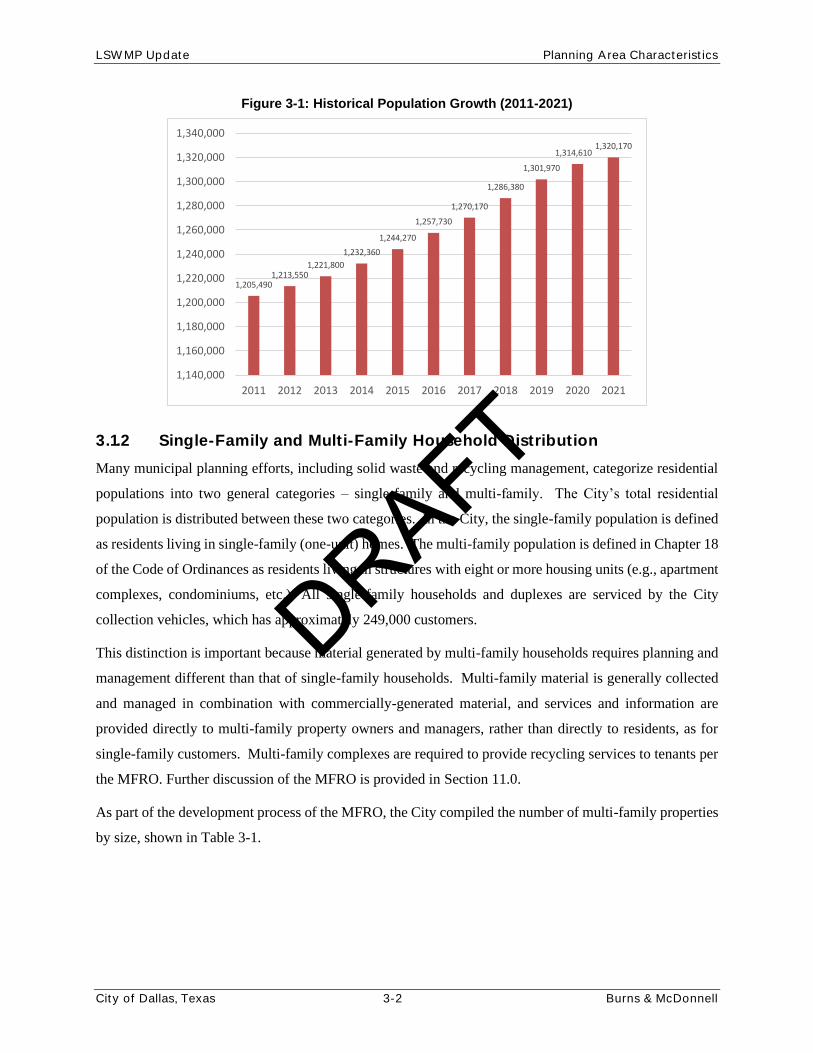
LSWMP Update Planning Area Characteristics
City of Dallas, Texas 3-2 Burns & McDonnell
Figure 3-1: Historical Population Growth (2011-2021)
3.1.2 Single-Family and Multi-Family Household Distribution
Many municipal planning efforts, including solid waste and recycling management, categorize residential
populations into two general categories – single-family and multi-family. The City’s total residential
population is distributed between these two categories. In the City, the single-family population is defined
as residents living in single-family (one-unit) homes. The multi-family population is defined in Chapter 18
of the Code of Ordinances as residents living in structures with eight or more housing units (e.g., apartment
complexes, condominiums, etc.). All single-family households and duplexes are serviced by the City
collection vehicles, which has approximately 249,000 customers.
This distinction is important because material generated by multi-family households requires planning and
management different than that of single-family households. Multi-family material is generally collected
and managed in combination with commercially-generated material, and services and information are
provided directly to multi-family property owners and managers, rather than directly to residents, as for
single-family customers. Multi-family complexes are required to provide recycling services to tenants per
the MFRO. Further discussion of the MFRO is provided in Section 11.0.
As part of the development process of the MFRO, the City compiled the number of multi-family properties
by size, shown in Table 3-1.
1,205,4901,213,550
1,221,800
1,232,360
1,244,270
1,257,730
1,270,170
1,286,380
1,301,970
1,314,6101,320,170
1,140,000
1,160,000
1,180,000
1,200,000
1,220,000
1,240,000
1,260,000
1,280,000
1,300,000
1,320,000
1,340,000
2011 2012 2013 2014 2015 2016 2017 2018 2019 2020 2021
DRAFT
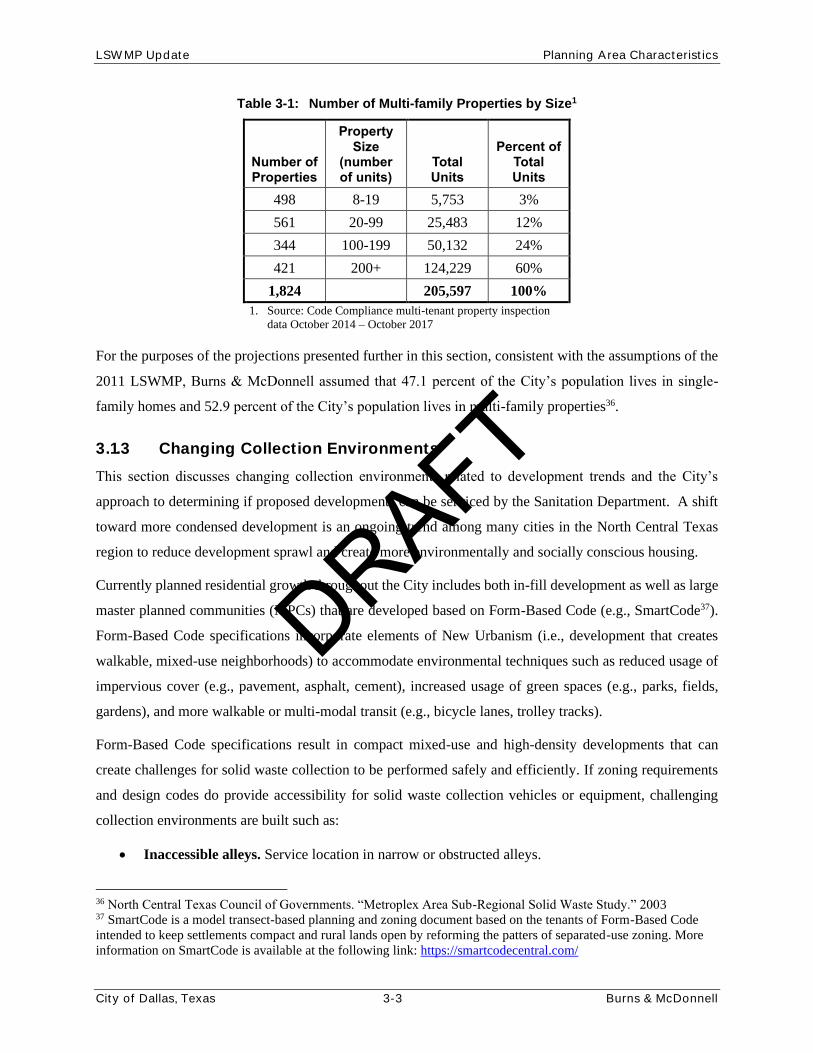
LSWMP Update Planning Area Characteristics
City of Dallas, Texas 3-3 Burns & McDonnell
Table 3-1: Number of Multi-family Properties by Size1
Number of Properties
Property Size
(number of units)
Total Units
Percent of Total Units
498 8-19 5,753 3%
561 20-99 25,483 12%
344 100-199 50,132 24%
421 200+ 124,229 60%
1,824
205,597 100%
1. Source: Code Compliance multi-tenant property inspection
data October 2014 – October 2017
For the purposes of the projections presented further in this section, consistent with the assumptions of the
2011 LSWMP, Burns & McDonnell assumed that 47.1 percent of the City’s population lives in single-
family homes and 52.9 percent of the City’s population lives in multi-family properties36.
3.1.3 Changing Collection Environments
This section discusses changing collection environments related to development trends and the City’s
approach to determining if proposed developments can be serviced by the Sanitation Department. A shift
toward more condensed development is an ongoing trend among many cities in the North Central Texas
region to reduce development sprawl and create more environmentally and socially conscious housing.
Currently planned residential growth throughout the City includes both in-fill development as well as large
master planned communities (MPCs) that are developed based on Form-Based Code (e.g., SmartCode37).
Form-Based Code specifications incorporate elements of New Urbanism (i.e., development that creates
walkable, mixed-use neighborhoods) to accommodate environmental techniques such as reduced usage of
impervious cover (e.g., pavement, asphalt, cement), increased usage of green spaces (e.g., parks, fields,
gardens), and more walkable or multi-modal transit (e.g., bicycle lanes, trolley tracks).
Form-Based Code specifications result in compact mixed-use and high-density developments that can
create challenges for solid waste collection to be performed safely and efficiently. If zoning requirements
and design codes do provide accessibility for solid waste collection vehicles or equipment, challenging
collection environments are built such as:
• Inaccessible alleys. Service location in narrow or obstructed alleys.
36 North Central Texas Council of Governments. “Metroplex Area Sub-Regional Solid Waste Study.” 2003 37 SmartCode is a model transect-based planning and zoning document based on the tenants of Form-Based Code
intended to keep settlements compact and rural lands open by reforming the patters of separated-use zoning. More
information on SmartCode is available at the following link: https://smartcodecentral.com/
DRAFT
LSWMP Update Planning Area Characteristics
City of Dallas, Texas 3-4 Burns & McDonnell
• Private drives with limited maneuverability. Service locations only accessible by private drives.
• Cul-de-sacs with inaccessible set outs. Service locations on Cul-de-sacs that are too small or
contain obstructions.
• Hammerhead or dead ends. Service locations on hammerhead (i.e., dead-end streets that end in
a “Y” shape) or dead-end streets with undersized turn radii.
• Boulevards. Service locations on arterial roads that contain obstacles for collection due to multi-
modal transportation lanes.
The City’s Development Services conducts a pre-development process to review submittals to support the
permit review process. City staff provide a cursory review to identify any major violations (e.g., not meeting
minimum right-of-way, located in a thoroughfare, etc.) so the developer can adjust before the submission
is fully evaluated. Development Services works collaboratively with other departments such as Dallas Fire-
Rescue (DFR) and DWU in the pre-development process to identify any challenges that would cause the
submission to ultimately be denied. Based on discussions with City staff, there are currently limited
considerations in the pre-development process to ensure that the submission accounts for solid waste
collection vehicle accessibility and meets the minimum standards to ensure that Sanitation Department
equipment will be able to service these properties safely and efficiently.
Multiple cities across Texas are experiencing collection challenges associated with the implementation of
SmartCode development, including Austin, Fort Worth, and San Antonio. Each of these cities have
indicated that applications for new developments are provided to its solid waste and recycling collection
group for initial review. It is clear, however, that even though this initial review process may be sufficient
for the needs of fire truck equipment, the needs of solid waste and recycling collection vehicles require
additional attention in regard to interim applications or amendments.
Although the City Code requires the Sanitation Department to provide services for all residences and
duplexes, single-family attached properties with eight or less units cause a challenge for providing
collection service. These types of properties may take the form of condominiums or in-fill properties added
as additional units on existing lots or dividing existing home into multiple units. These types of properties
are considered single-family properties and are often constructed based on form-based zoning
specifications.
The challenge with single-family attached properties is that when they include challenging collection
environments (e.g., private drives) the Sanitation Department has to consider removing the customer from
service because they may not be able to safely or efficiently collect set outs, ultimately requiring the
customer to hire a private sector service provider. Over time, if increasing numbers of City customers are
DRAFT
LSWMP Update Planning Area Characteristics
City of Dallas, Texas 3-5 Burns & McDonnell
serviced by private-sector haulers they may be subject to higher rates for refuse and/or recycling service
and require more collection vehicles to travel the City’s roads causing increased repair needs.
Higher density developments and single-family attached units result in challenging collection environments
that will inhibit the Sanitation Department’s or other hauler’s abilities to provide services to single-family
and higher-density residences.
The proliferation of higher-density developments presents operational challenges for collection services.
Collaborate with Development Services to ensure that the Sanitation Department is included in the pre-
development process and that form-based code specifications meet the needs of collection equipment to
minimize the development of challenging collection environments. Additionally, amend the City Code to
define single-family attached properties more clearly as either the responsibility of the Sanitation
Department to provide service, or have them covered under the MFRO to ensure that residents have access
to cost-effective services and are not forced to hire private sector collection service providers
3.1.4 Population Projections
The NCTCOG previously developed the 2040 forecast to provide the estimated number and distribution of
population, households and employment by member city for the North Central Texas region.38 Burns &
McDonnell extrapolated the projection for the City to estimate the total population through 2040. Burns &
McDonnell selected this 19-year planning period based on the expectation that the Landfill would be
nearing capacity at that point. In 2040 the Landfill would have approximately 15 years of useful life, and
the City will must need to determine if the disposal operation could be expanded or if there is a need to
prepare to change disposal practices. Additionally, the regional population is also growing, which may
impact the volume of material generated outside of the City and imported for disposal at the Landfill.
Further discussion about regional landfill capacity is provided is Section 4.0 and detailed information and
analysis related to the Landfill is provided in Section 8.0 and Appendix E.
The LSWMP Update projects the population growth based on the historical compound annual growth rate
of the City as published by the North Central Texas Council of Governments where the population has
grown from 1,205,490 in 2011 to 1,320,170 in 2021, representing an annual growth of 0.91 percent39. Using
the growth rate of 0.91 percent, the City’s population is projected to reach 1,568,974 in 2040.
38 North Central Texas Council of Governments. Regional Data Center. 2040 Demographic Forecast by District.
Available online at: https://data-nctcoggis.opendata.arcgis.com/datasets/2040-nctcog-demographic-forecast-
district/explore 39 North Central Texas Council of Governments. “2021 NCTCOG Population Estimates (City).” 2021. Available
online at:
https://data-nctcoggis.opendata.arcgis.com/datasets/NCTCOGGIS::2021-nctcog-population-estimates-city/about
DRAFT

LSWMP Update Planning Area Characteristics
City of Dallas, Texas 3-6 Burns & McDonnell
The total population is further divided into single-family and multi-family populations based on the
respective population distributions presented in the previous section (refer to Section 3.1.2) and is held
constant through 204040. Figure 3-2 shows the projected single-family and multi-family population growth
of the City over the next 19 years, from 2021 through 2040.
Figure 3-2: Population Projection (2021-2040)
3.2 Economic Characteristics
The City is part of the larger Dallas-Fort Worth (DFW) Metroplex, the largest metropolitan area in Texas
and the fourth largest in the U.S.41 A primary driver of the population growth the City has experienced
(refer to Section 3.1.3) is the economic development that has taken place. This section provides information
on employment and economic development in the City.
3.2.1 Current Regional Employment
Current employment figures for the DFW Metroplex region are provided for informational purposes. Table
3-2 presents the employees in the DFW Metroplex as of March 2022 as reported by the U.S. Bureau of
Labor Statistics.
40 The distribution of population is held constant for the purposes of these projections, since no historical data on the
number of permitted construction was conducted as part of the LSMWP Update; however, there is an anecdotal
trend in the City that number of multi-family dwellings being developed outpaces the number of single-family
dwellings. Further discussion of multi-family generation sector is provided in Section 11.0. 41 New Census Bureau Estimates Show Counties in South and West Lead Nation in Population Growth, U.S. Census
Bureau Press Release April 18, 2019. Retrieved September 2019 from https://www.census.gov/newsroom/press-
releases/2019/estimates-county-metro.html
621,800 644,818 674,793 706,161 738,987
698,370 724,223 757,888 793,119829,987
0
200,000
400,000
600,000
800,000
1,000,000
1,200,000
1,400,000
1,600,000
1,800,000
2021 2025 2030 2035 2040
Single Family Population Multi-Family Population
DRAFT
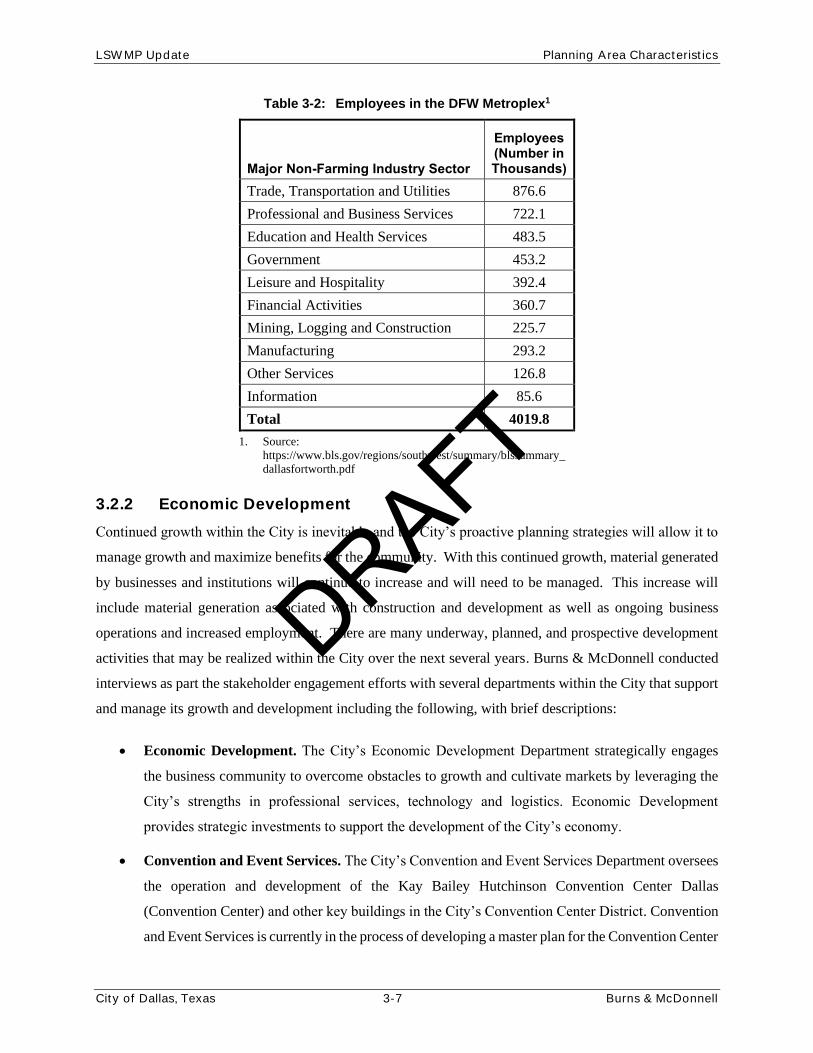
LSWMP Update Planning Area Characteristics
City of Dallas, Texas 3-7 Burns & McDonnell
Table 3-2: Employees in the DFW Metroplex1
Major Non-Farming Industry Sector
Employees (Number in Thousands)
Trade, Transportation and Utilities 876.6
Professional and Business Services 722.1
Education and Health Services 483.5
Government 453.2
Leisure and Hospitality 392.4
Financial Activities 360.7
Mining, Logging and Construction 225.7
Manufacturing 293.2
Other Services 126.8
Information 85.6
Total 4019.8
1. Source:
https://www.bls.gov/regions/southwest/summary/blssummary_
dallasfortworth.pdf
3.2.2 Economic Development
Continued growth within the City is inevitable and the City’s proactive planning strategies will allow it to
manage growth and maximize benefits for the community. With this continued growth, material generated
by businesses and institutions will continue to increase and will need to be managed. This increase will
include material generation associated with construction and development as well as ongoing business
operations and increased employment. There are many underway, planned, and prospective development
activities that may be realized within the City over the next several years. Burns & McDonnell conducted
interviews as part the stakeholder engagement efforts with several departments within the City that support
and manage its growth and development including the following, with brief descriptions:
• Economic Development. The City’s Economic Development Department strategically engages
the business community to overcome obstacles to growth and cultivate markets by leveraging the
City’s strengths in professional services, technology and logistics. Economic Development
provides strategic investments to support the development of the City’s economy.
• Convention and Event Services. The City’s Convention and Event Services Department oversees
the operation and development of the Kay Bailey Hutchinson Convention Center Dallas
(Convention Center) and other key buildings in the City’s Convention Center District. Convention
and Event Services is currently in the process of developing a master plan for the Convention Center
DRAFT
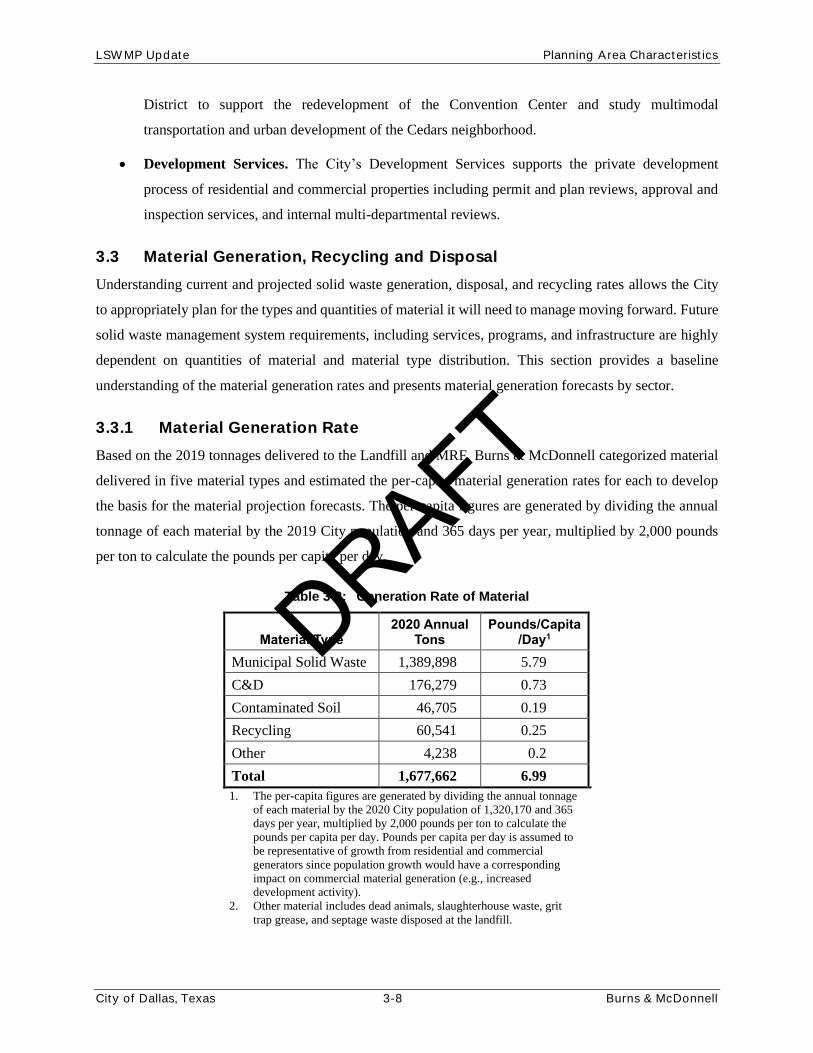
LSWMP Update Planning Area Characteristics
City of Dallas, Texas 3-8 Burns & McDonnell
District to support the redevelopment of the Convention Center and study multimodal
transportation and urban development of the Cedars neighborhood.
• Development Services. The City’s Development Services supports the private development
process of residential and commercial properties including permit and plan reviews, approval and
inspection services, and internal multi-departmental reviews.
3.3 Material Generation, Recycling and Disposal
Understanding current and projected solid waste generation, disposal, and recycling rates allows the City
to appropriately plan for the types and quantities of material it will need to manage moving forward. Future
solid waste management system requirements, including services, programs, and infrastructure are highly
dependent on quantities of material and material type distribution. This section provides a baseline
understanding of the material generation rates and presents material generation forecasts by sector.
3.3.1 Material Generation Rate
Based on the 2019 tonnages delivered to the Landfill and MRF, Burns & McDonnell categorized material
delivered in five material types and estimated the per-capita material generation rates for each to develop
the basis for the material projection forecasts. The per-capita figures are generated by dividing the annual
tonnage of each material by the 2019 City population and 365 days per year, multiplied by 2,000 pounds
per ton to calculate the pounds per capita per day.
Table 3-3: Generation Rate of Material
Material Type 2020 Annual
Tons Pounds/Capita
/Day1
Municipal Solid Waste 1,389,898 5.79
C&D 176,279 0.73
Contaminated Soil 46,705 0.19
Recycling 60,541 0.25
Other 4,238 0.2
Total 1,677,662 6.99
1. The per-capita figures are generated by dividing the annual tonnage
of each material by the 2020 City population of 1,320,170 and 365
days per year, multiplied by 2,000 pounds per ton to calculate the
pounds per capita per day. Pounds per capita per day is assumed to
be representative of growth from residential and commercial
generators since population growth would have a corresponding
impact on commercial material generation (e.g., increased
development activity).
2. Other material includes dead animals, slaughterhouse waste, grit
trap grease, and septage waste disposed at the landfill.
DRAFT
LSWMP Update Planning Area Characteristics
City of Dallas, Texas 3-9 Burns & McDonnell
The following provides further detail of each material type including how each material is managed and the
constituent materials that compose each material stream, and how each is further analyzed in the plan. capita
generation and how each material category and how each material is managed.
• Municipal Solid Waste. MSW tons include refuse, yard waste, brush and bulky items generated
by the residential and commercial sectors and collected by the City or private haulers. The majority
of this material is generated within the City limits, but some materials may be collected from
surrounding municipalities and delivered to the Landfill.
• Construction & Demolition. C&D tons include material generated by the commercial sector as
part of development within the City including new construction, renovation, deconstruction and
demolition projects. The materials in the C&D stream may include concrete, lumber, rebar,
gypsum, plastic, and cardboard.
• Contaminated Soil. Contaminated soil includes inert materials generated by the commercial sector
that have become contaminated with gas, oil, or other chemicals that require it be disposed at the
Landfill.
• Recycling. Recycling tons include curbside collected single-stream material, separated bulk metal,
recycled electronic equipment, and tires generated by residential and commercial sector. Curbside
single-stream materials are collected curbside from single-family residences and bulk metal,
electronics and tires are delivered to the Landfill and diverted from disposal.
• Other. Other material includes dead animals, slaughterhouse waste, grit trap grease, and septage
waste generated by the commercial sector and disposed at the Landfill.
In the 2011 LSWMP, the reported annual disposal for 2010 was 5.67 pounds per person per day. Based on
the tonnage and per capita generation figures shown in Table 3-3, the generation rate is now 6.99 pounds
per person per day, about 1.32 pounds per person per day higher than it had been in the 2011 LSWMP,
likely due to the increase in population and associated commercial development and construction.
3.4 Material Generation Forecast
This section presents the baseline material generation forecast and breakdown of material generation
forecasts for key materials and generator types. The per capita generation rates (see Section 3.3.1) serves
as the basis for the material generation forecasts. Table 3-4 presents the forecast of material to be delivered
to the Landfill and managed annually between 2021 and 2040.
DRAFT
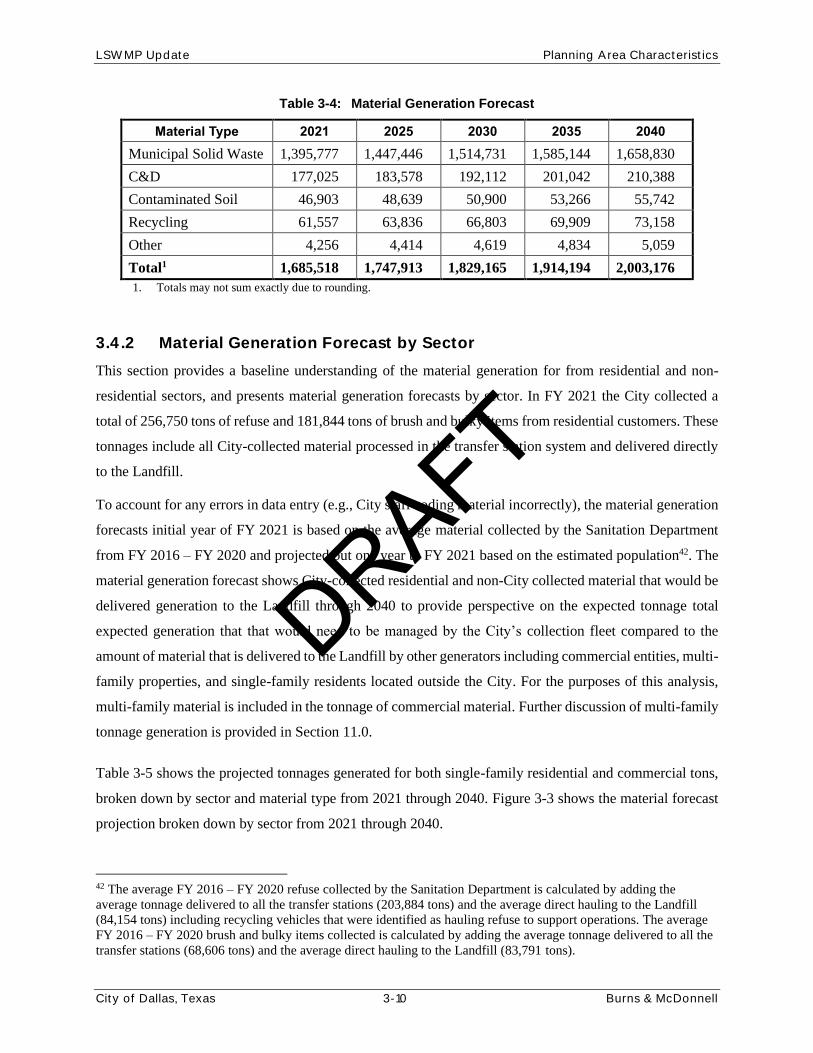
LSWMP Update Planning Area Characteristics
City of Dallas, Texas 3-10 Burns & McDonnell
Table 3-4: Material Generation Forecast
Material Type 2021 2025 2030 2035 2040
Municipal Solid Waste 1,395,777 1,447,446 1,514,731 1,585,144 1,658,830
C&D 177,025 183,578 192,112 201,042 210,388
Contaminated Soil 46,903 48,639 50,900 53,266 55,742
Recycling 61,557 63,836 66,803 69,909 73,158
Other 4,256 4,414 4,619 4,834 5,059
Total1 1,685,518 1,747,913 1,829,165 1,914,194 2,003,176
1. Totals may not sum exactly due to rounding.
3.4.2 Material Generation Forecast by Sector
This section provides a baseline understanding of the material generation for from residential and non-
residential sectors, and presents material generation forecasts by sector. In FY 2021 the City collected a
total of 256,750 tons of refuse and 181,844 tons of brush and bulky items from residential customers. These
tonnages include all City-collected material processed in the transfer station system and delivered directly
to the Landfill.
To account for any errors in data entry (e.g., City staff coding material incorrectly), the material generation
forecasts initial year of FY 2021 is based on the average material collected by the Sanitation Department
from FY 2016 – FY 2020 and projected out one year to FY 2021 based on the estimated population42. The
material generation forecast shows City-collected residential and non-City collected material that would be
delivered generation to the Landfill through 2040 to provide perspective on the expected tonnage total
expected generation that that would need to be managed by the City’s collection fleet compared to the
amount of material that is delivered to the Landfill by other generators including commercial entities, multi-
family properties, and single-family residents located outside the City. For the purposes of this analysis,
multi-family material is included in the tonnage of commercial material. Further discussion of multi-family
tonnage generation is provided in Section 11.0.
Table 3-5 shows the projected tonnages generated for both single-family residential and commercial tons,
broken down by sector and material type from 2021 through 2040. Figure 3-3 shows the material forecast
projection broken down by sector from 2021 through 2040.
42 The average FY 2016 – FY 2020 refuse collected by the Sanitation Department is calculated by adding the
average tonnage delivered to all the transfer stations (203,884 tons) and the average direct hauling to the Landfill
(84,154 tons) including recycling vehicles that were identified as hauling refuse to support operations. The average
FY 2016 – FY 2020 brush and bulky items collected is calculated by adding the average tonnage delivered to all the
transfer stations (68,606 tons) and the average direct hauling to the Landfill (83,791 tons).
DRAFT
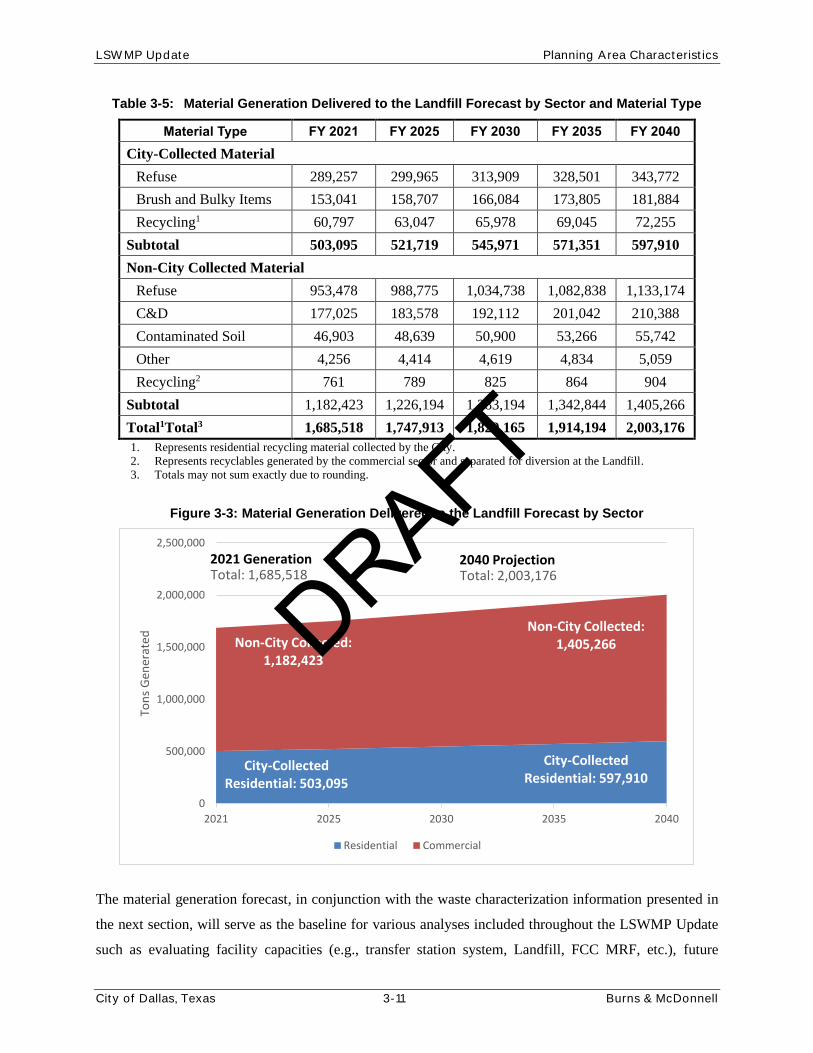
LSWMP Update Planning Area Characteristics
City of Dallas, Texas 3-11 Burns & McDonnell
Table 3-5: Material Generation Delivered to the Landfill Forecast by Sector and Material Type
Material Type FY 2021 FY 2025 FY 2030 FY 2035 FY 2040
City-Collected Material
Refuse 289,257 299,965 313,909 328,501 343,772
Brush and Bulky Items 153,041 158,707 166,084 173,805 181,884
Recycling1 60,797 63,047 65,978 69,045 72,255
Subtotal 503,095 521,719 545,971 571,351 597,910
Non-City Collected Material
Refuse 953,478 988,775 1,034,738 1,082,838 1,133,174
C&D 177,025 183,578 192,112 201,042 210,388
Contaminated Soil 46,903 48,639 50,900 53,266 55,742
Other 4,256 4,414 4,619 4,834 5,059
Recycling2 761 789 825 864 904
Subtotal 1,182,423 1,226,194 1,283,194 1,342,844 1,405,266
Total1Total3 1,685,518 1,747,913 1,829,165 1,914,194 2,003,176
1. Represents residential recycling material collected by the City.
2. Represents recyclables generated by the commercial sector and separated for diversion at the Landfill.
3. Totals may not sum exactly due to rounding.
Figure 3-3: Material Generation Delivered to the Landfill Forecast by Sector
The material generation forecast, in conjunction with the waste characterization information presented in
the next section, will serve as the baseline for various analyses included throughout the LSWMP Update
such as evaluating facility capacities (e.g., transfer station system, Landfill, FCC MRF, etc.), future
0
500,000
1,000,000
1,500,000
2,000,000
2,500,000
2021 2025 2030 2035 2040
Ton
s G
ener
ated
Residential Commercial
Non-City Collected: 1,182,423
Non-City Collected: 1,405,266
City-Collected Residential: 597,910
City-Collected Residential: 503,095
2021 GenerationTotal: 1,685,518
2040 ProjectionTotal: 2,003,176
DRAFT
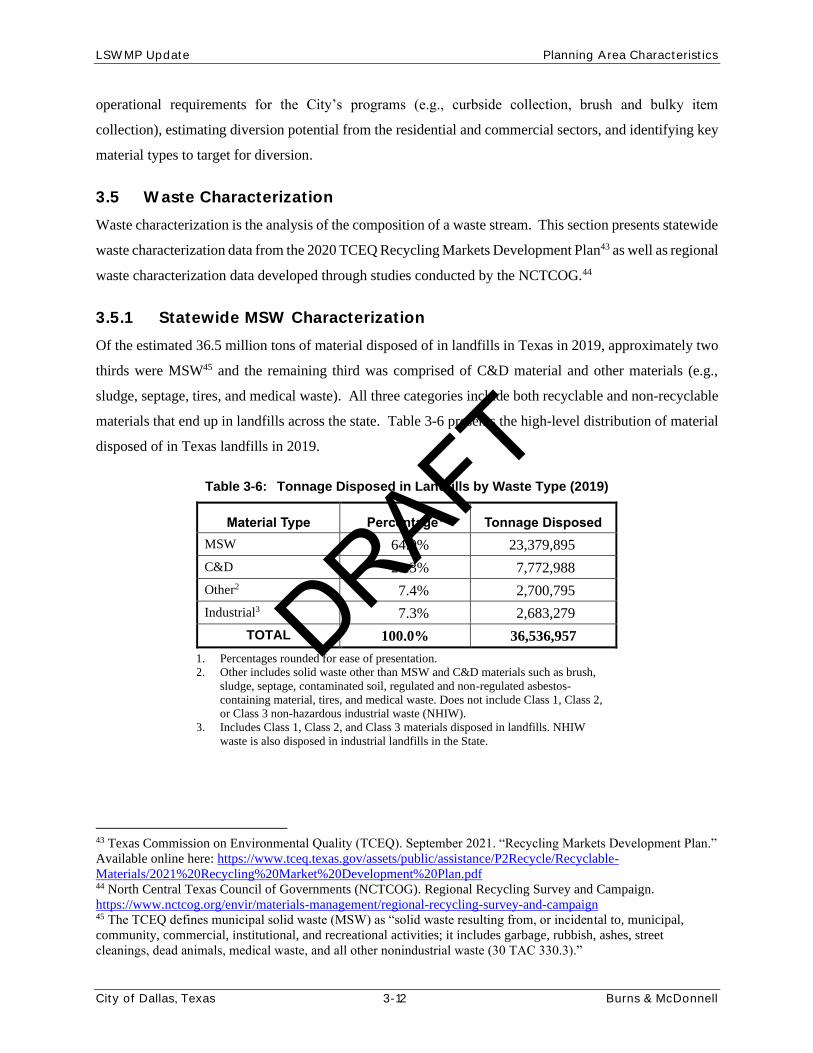
LSWMP Update Planning Area Characteristics
City of Dallas, Texas 3-12 Burns & McDonnell
operational requirements for the City’s programs (e.g., curbside collection, brush and bulky item
collection), estimating diversion potential from the residential and commercial sectors, and identifying key
material types to target for diversion.
3.5 Waste Characterization
Waste characterization is the analysis of the composition of a waste stream. This section presents statewide
waste characterization data from the 2020 TCEQ Recycling Markets Development Plan43 as well as regional
waste characterization data developed through studies conducted by the NCTCOG.44
3.5.1 Statewide MSW Characterization
Of the estimated 36.5 million tons of material disposed of in landfills in Texas in 2019, approximately two
thirds were MSW45 and the remaining third was comprised of C&D material and other materials (e.g.,
sludge, septage, tires, and medical waste). All three categories include both recyclable and non-recyclable
materials that end up in landfills across the state. Table 3-6 presents the high-level distribution of material
disposed of in Texas landfills in 2019.
Table 3-6: Tonnage Disposed in Landfills by Waste Type (2019)
Material Type Percentage1 Tonnage Disposed
MSW 64.0% 23,379,895
C&D 21.3% 7,772,988
Other2 7.4% 2,700,795
Industrial3 7.3% 2,683,279
TOTAL 100.0% 36,536,957
1. Percentages rounded for ease of presentation.
2. Other includes solid waste other than MSW and C&D materials such as brush,
sludge, septage, contaminated soil, regulated and non-regulated asbestos-
containing material, tires, and medical waste. Does not include Class 1, Class 2,
or Class 3 non-hazardous industrial waste (NHIW).
3. Includes Class 1, Class 2, and Class 3 materials disposed in landfills. NHIW
waste is also disposed in industrial landfills in the State.
43 Texas Commission on Environmental Quality (TCEQ). September 2021. “Recycling Markets Development Plan.”
Available online here: https://www.tceq.texas.gov/assets/public/assistance/P2Recycle/Recyclable-
Materials/2021%20Recycling%20Market%20Development%20Plan.pdf 44 North Central Texas Council of Governments (NCTCOG). Regional Recycling Survey and Campaign.
https://www.nctcog.org/envir/materials-management/regional-recycling-survey-and-campaign 45 The TCEQ defines municipal solid waste (MSW) as “solid waste resulting from, or incidental to, municipal,
community, commercial, institutional, and recreational activities; it includes garbage, rubbish, ashes, street
cleanings, dead animals, medical waste, and all other nonindustrial waste (30 TAC 330.3).”
DRAFT
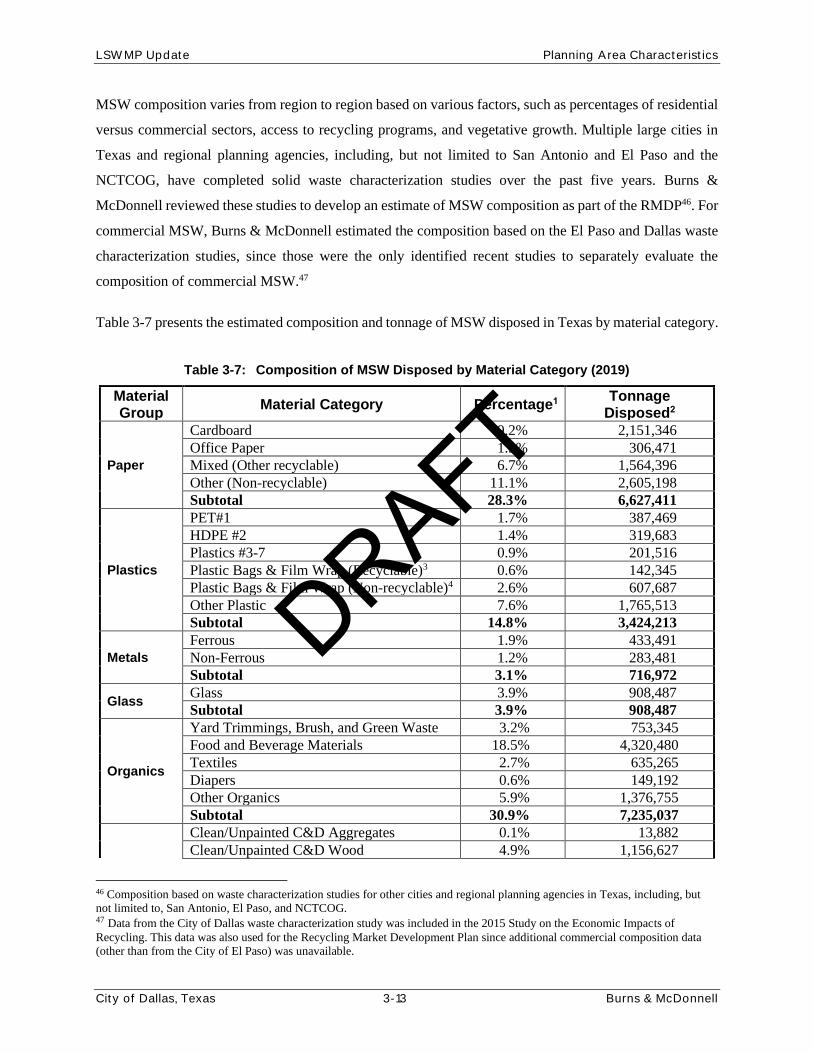
LSWMP Update Planning Area Characteristics
City of Dallas, Texas 3-13 Burns & McDonnell
MSW composition varies from region to region based on various factors, such as percentages of residential
versus commercial sectors, access to recycling programs, and vegetative growth. Multiple large cities in
Texas and regional planning agencies, including, but not limited to San Antonio and El Paso and the
NCTCOG, have completed solid waste characterization studies over the past five years. Burns &
McDonnell reviewed these studies to develop an estimate of MSW composition as part of the RMDP46. For
commercial MSW, Burns & McDonnell estimated the composition based on the El Paso and Dallas waste
characterization studies, since those were the only identified recent studies to separately evaluate the
composition of commercial MSW.47
Table 3-7 presents the estimated composition and tonnage of MSW disposed in Texas by material category.
Table 3-7: Composition of MSW Disposed by Material Category (2019)
Material Group
Material Category Percentage1 Tonnage
Disposed2
Paper
Cardboard 9.2% 2,151,346
Office Paper 1.3% 306,471
Mixed (Other recyclable) 6.7% 1,564,396
Other (Non-recyclable) 11.1% 2,605,198
Subtotal 28.3% 6,627,411
Plastics
PET#1 1.7% 387,469
HDPE #2 1.4% 319,683
Plastics #3-7 0.9% 201,516
Plastic Bags & Film Wrap (Recyclable)3 0.6% 142,345
Plastic Bags & Film Wrap (Non-recyclable)4 2.6% 607,687
Other Plastic 7.6% 1,765,513
Subtotal 14.8% 3,424,213
Metals
Ferrous 1.9% 433,491
Non-Ferrous 1.2% 283,481
Subtotal 3.1% 716,972
Glass Glass 3.9% 908,487
Subtotal 3.9% 908,487
Organics
Yard Trimmings, Brush, and Green Waste 3.2% 753,345
Food and Beverage Materials 18.5% 4,320,480
Textiles 2.7% 635,265
Diapers 0.6% 149,192
Other Organics 5.9% 1,376,755
Subtotal 30.9% 7,235,037
Clean/Unpainted C&D Aggregates 0.1% 13,882
Clean/Unpainted C&D Wood 4.9% 1,156,627
46 Composition based on waste characterization studies for other cities and regional planning agencies in Texas, including, but
not limited to, San Antonio, El Paso, and NCTCOG. 47 Data from the City of Dallas waste characterization study was included in the 2015 Study on the Economic Impacts of
Recycling. This data was also used for the Recycling Market Development Plan since additional commercial composition data
(other than from the City of El Paso) was unavailable.
DRAFT
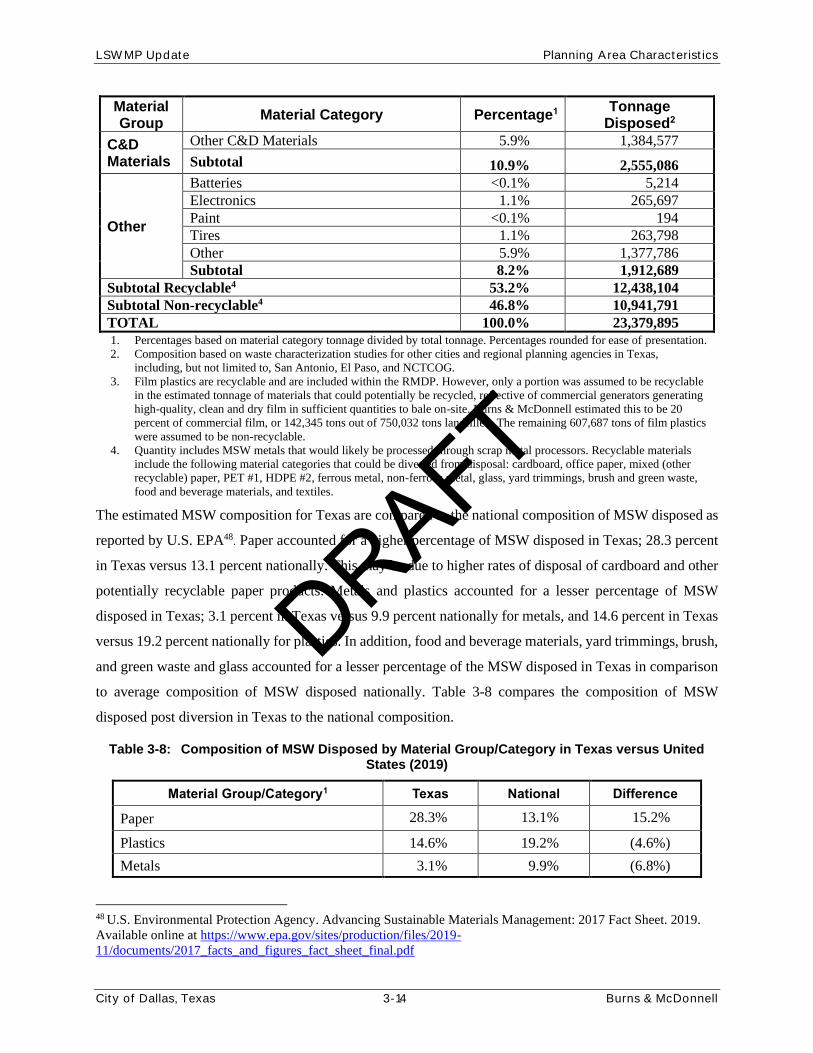
LSWMP Update Planning Area Characteristics
City of Dallas, Texas 3-14 Burns & McDonnell
Material Group
Material Category Percentage1 Tonnage
Disposed2
C&D Materials
Other C&D Materials 5.9% 1,384,577
Subtotal 10.9% 2,555,086
Other
Batteries <0.1% 5,214
Electronics 1.1% 265,697
Paint <0.1% 194
Tires 1.1% 263,798
Other 5.9% 1,377,786
Subtotal 8.2% 1,912,689
Subtotal Recyclable4 53.2% 12,438,104
Subtotal Non-recyclable4 46.8% 10,941,791
TOTAL 100.0% 23,379,895
1. Percentages based on material category tonnage divided by total tonnage. Percentages rounded for ease of presentation.
2. Composition based on waste characterization studies for other cities and regional planning agencies in Texas,
including, but not limited to, San Antonio, El Paso, and NCTCOG.
3. Film plastics are recyclable and are included within the RMDP. However, only a portion was assumed to be recyclable
in the estimated tonnage of materials that could potentially be recycled, reflective of commercial generators generating
high-quality, clean and dry film in sufficient quantities to bale on-site. Burns & McDonnell estimated this to be 20
percent of commercial film, or 142,345 tons out of 750,032 tons landfilled. The remaining 607,687 tons of film plastics
were assumed to be non-recyclable.
4. Quantity includes MSW metals that would likely be processed through scrap metal processors. Recyclable materials
include the following material categories that could be diverted from disposal: cardboard, office paper, mixed (other
recyclable) paper, PET #1, HDPE #2, ferrous metal, non-ferrous metal, glass, yard trimmings, brush and green waste,
food and beverage materials, and textiles.
The estimated MSW composition for Texas are compared to the national composition of MSW disposed as
reported by U.S. EPA48. Paper accounted for a higher percentage of MSW disposed in Texas; 28.3 percent
in Texas versus 13.1 percent nationally. This may be due to higher rates of disposal of cardboard and other
potentially recyclable paper products. Metals and plastics accounted for a lesser percentage of MSW
disposed in Texas; 3.1 percent in Texas versus 9.9 percent nationally for metals, and 14.6 percent in Texas
versus 19.2 percent nationally for plastics. In addition, food and beverage materials, yard trimmings, brush,
and green waste and glass accounted for a lesser percentage of the MSW disposed in Texas in comparison
to average composition of MSW disposed nationally. Table 3-8 compares the composition of MSW
disposed post diversion in Texas to the national composition.
Table 3-8: Composition of MSW Disposed by Material Group/Category in Texas versus United States (2019)
Material Group/Category1 Texas National Difference
Paper 28.3% 13.1% 15.2%
Plastics 14.6% 19.2% (4.6%)
Metals 3.1% 9.9% (6.8%)
48 U.S. Environmental Protection Agency. Advancing Sustainable Materials Management: 2017 Fact Sheet. 2019.
Available online at https://www.epa.gov/sites/production/files/2019-
11/documents/2017_facts_and_figures_fact_sheet_final.pdf
DRAFT
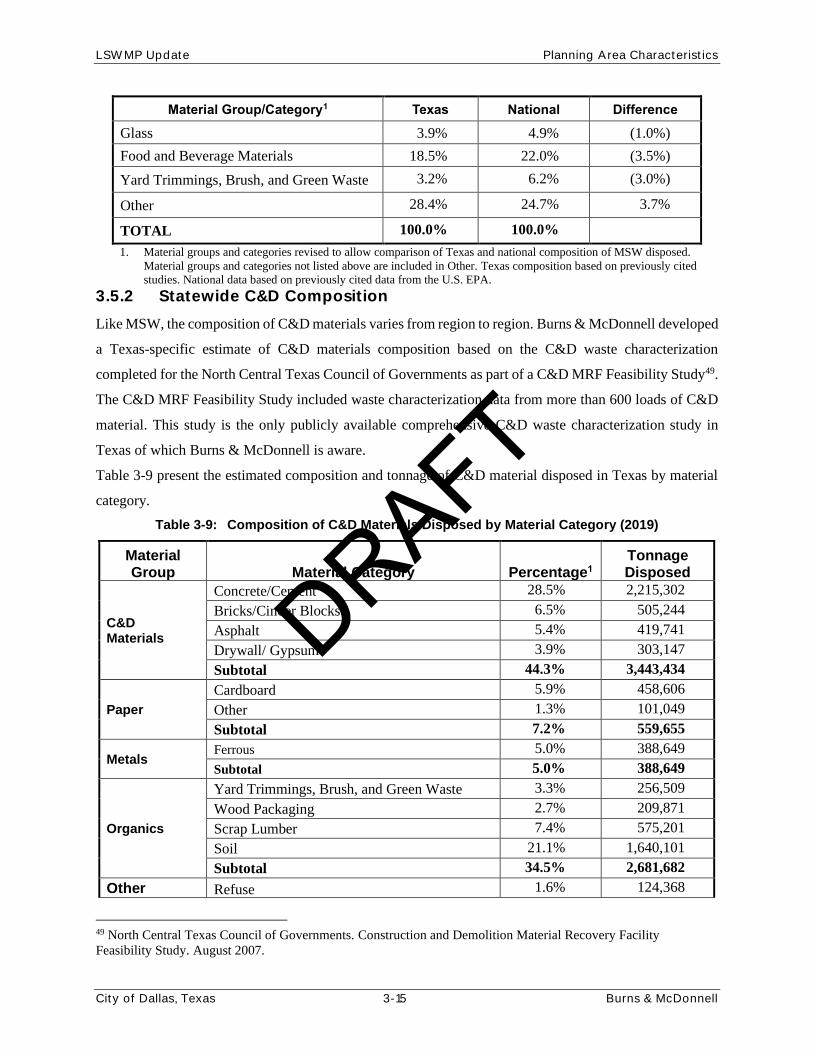
LSWMP Update Planning Area Characteristics
City of Dallas, Texas 3-15 Burns & McDonnell
Material Group/Category1 Texas National Difference
Glass 3.9% 4.9% (1.0%)
Food and Beverage Materials 18.5% 22.0% (3.5%)
Yard Trimmings, Brush, and Green Waste 3.2% 6.2% (3.0%)
Other 28.4% 24.7% 3.7%
TOTAL 100.0% 100.0%
1. Material groups and categories revised to allow comparison of Texas and national composition of MSW disposed.
Material groups and categories not listed above are included in Other. Texas composition based on previously cited
studies. National data based on previously cited data from the U.S. EPA.
3.5.2 Statewide C&D Composition
Like MSW, the composition of C&D materials varies from region to region. Burns & McDonnell developed
a Texas-specific estimate of C&D materials composition based on the C&D waste characterization
completed for the North Central Texas Council of Governments as part of a C&D MRF Feasibility Study49.
The C&D MRF Feasibility Study included waste characterization data from more than 600 loads of C&D
material. This study is the only publicly available comprehensive C&D waste characterization study in
Texas of which Burns & McDonnell is aware.
Table 3-9 present the estimated composition and tonnage of C&D material disposed in Texas by material
category.
Table 3-9: Composition of C&D Materials Disposed by Material Category (2019)
Material Group Material Category Percentage1
Tonnage Disposed
C&D Materials
Concrete/Cement 28.5% 2,215,302
Bricks/Cinder Blocks 6.5% 505,244
Asphalt 5.4% 419,741
Drywall/ Gypsum 3.9% 303,147
Subtotal 44.3% 3,443,434
Paper
Cardboard 5.9% 458,606
Other 1.3% 101,049
Subtotal 7.2% 559,655
Metals Ferrous 5.0% 388,649
Subtotal 5.0% 388,649
Organics
Yard Trimmings, Brush, and Green Waste 3.3% 256,509
Wood Packaging 2.7% 209,871
Scrap Lumber 7.4% 575,201
Soil 21.1% 1,640,101
Subtotal 34.5% 2,681,682
Other Refuse 1.6% 124,368
49 North Central Texas Council of Governments. Construction and Demolition Material Recovery Facility
Feasibility Study. August 2007.
DRAFT
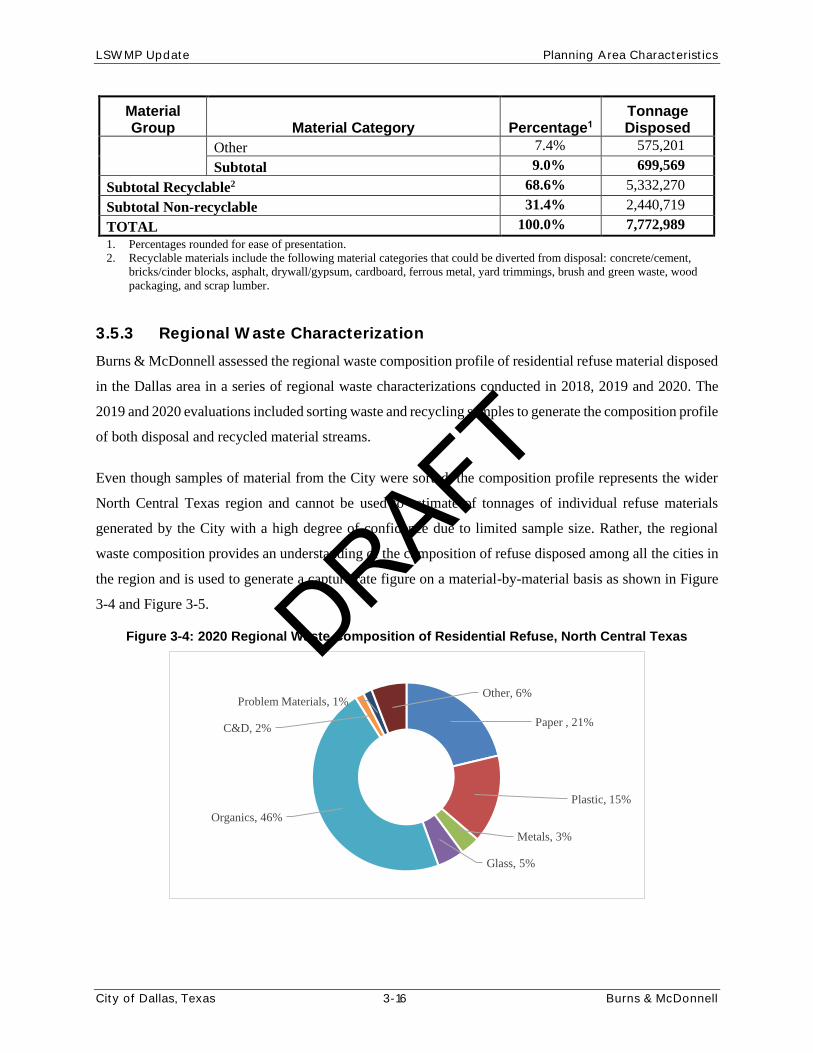
LSWMP Update Planning Area Characteristics
City of Dallas, Texas 3-16 Burns & McDonnell
Material Group Material Category Percentage1
Tonnage Disposed
Other 7.4% 575,201
Subtotal 9.0% 699,569
Subtotal Recyclable2 68.6% 5,332,270
Subtotal Non-recyclable 31.4% 2,440,719
TOTAL 100.0% 7,772,989
1. Percentages rounded for ease of presentation. 2. Recyclable materials include the following material categories that could be diverted from disposal: concrete/cement,
bricks/cinder blocks, asphalt, drywall/gypsum, cardboard, ferrous metal, yard trimmings, brush and green waste, wood
packaging, and scrap lumber.
3.5.3 Regional Waste Characterization
Burns & McDonnell assessed the regional waste composition profile of residential refuse material disposed
in the Dallas area in a series of regional waste characterizations conducted in 2018, 2019 and 2020. The
2019 and 2020 evaluations included sorting waste and recycling samples to generate the composition profile
of both disposal and recycled material streams.
Even though samples of material from the City were sorted, the composition profile represents the wider
North Central Texas region and cannot be used to estimate of tonnages of individual refuse materials
generated by the City with a high degree of confidence due to limited sample size. Rather, the regional
waste composition provides an understanding of the composition of refuse disposed among all the cities in
the region and is used to generate a capture rate figure on a material-by-material basis as shown in Figure
3-4 and Figure 3-5.
Figure 3-4: 2020 Regional Waste Composition of Residential Refuse, North Central Texas
Paper , 21%
Plastic, 15%
Metals, 3%
Glass, 5%
Organics, 46%
C&D, 2%
Problem Materials, 1%Other, 6%
DRAFT
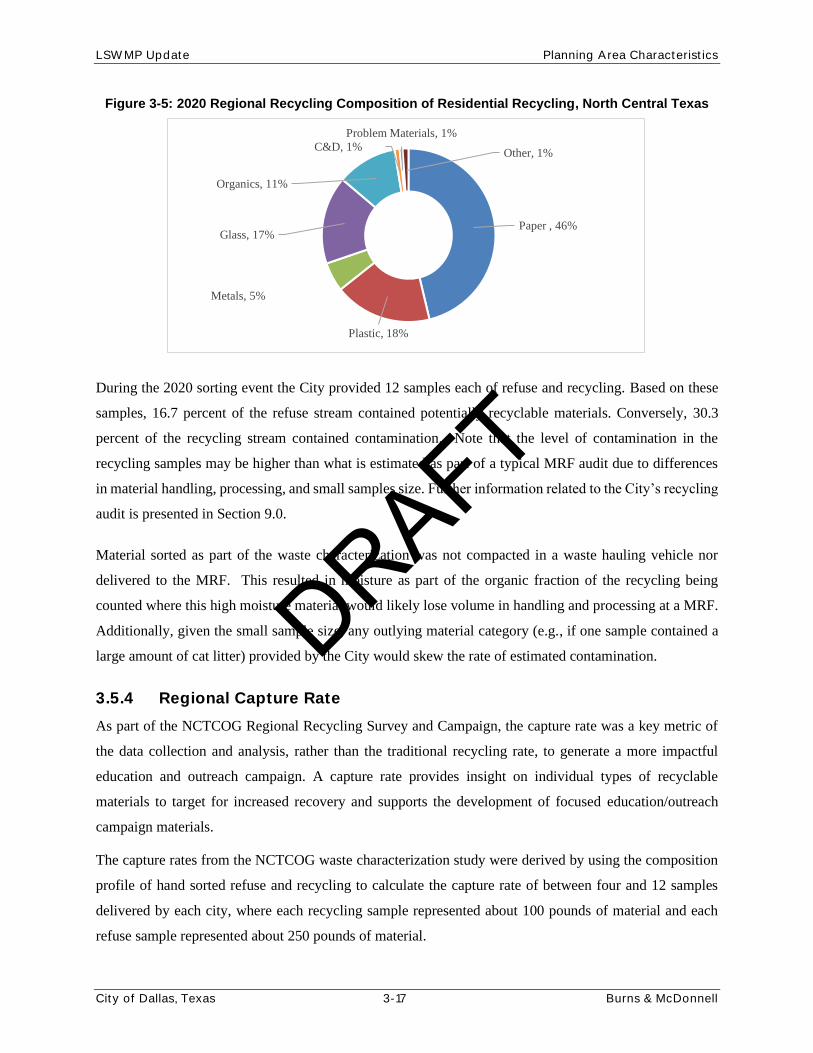
LSWMP Update Planning Area Characteristics
City of Dallas, Texas 3-17 Burns & McDonnell
Figure 3-5: 2020 Regional Recycling Composition of Residential Recycling, North Central Texas
During the 2020 sorting event the City provided 12 samples each of refuse and recycling. Based on these
samples, 16.7 percent of the refuse stream contained potentially recyclable materials. Conversely, 30.3
percent of the recycling stream contained contamination. Note that the level of contamination in the
recycling samples may be higher than what is estimated as part of a typical MRF audit due to differences
in material handling, processing, and small samples size. Further information related to the City’s recycling
audit is presented in Section 9.0.
Material sorted as part of the waste characterization was not compacted in a waste hauling vehicle nor
delivered to the MRF. This resulted in moisture as part of the organic fraction of the recycling being
counted where this high moisture material would likely lose volume in handling and processing at a MRF.
Additionally, given the small sample size, any outlying material category (e.g., if one sample contained a
large amount of cat litter) provided by the City would skew the rate of estimated contamination.
3.5.4 Regional Capture Rate
As part of the NCTCOG Regional Recycling Survey and Campaign, the capture rate was a key metric of
the data collection and analysis, rather than the traditional recycling rate, to generate a more impactful
education and outreach campaign. A capture rate provides insight on individual types of recyclable
materials to target for increased recovery and supports the development of focused education/outreach
campaign materials.
The capture rates from the NCTCOG waste characterization study were derived by using the composition
profile of hand sorted refuse and recycling to calculate the capture rate of between four and 12 samples
delivered by each city, where each recycling sample represented about 100 pounds of material and each
refuse sample represented about 250 pounds of material.
Paper , 46%
Plastic, 18%
Metals, 5%
Glass, 17%
Organics, 11%
C&D, 1%
Problem Materials, 1%
Other, 1%
DRAFT
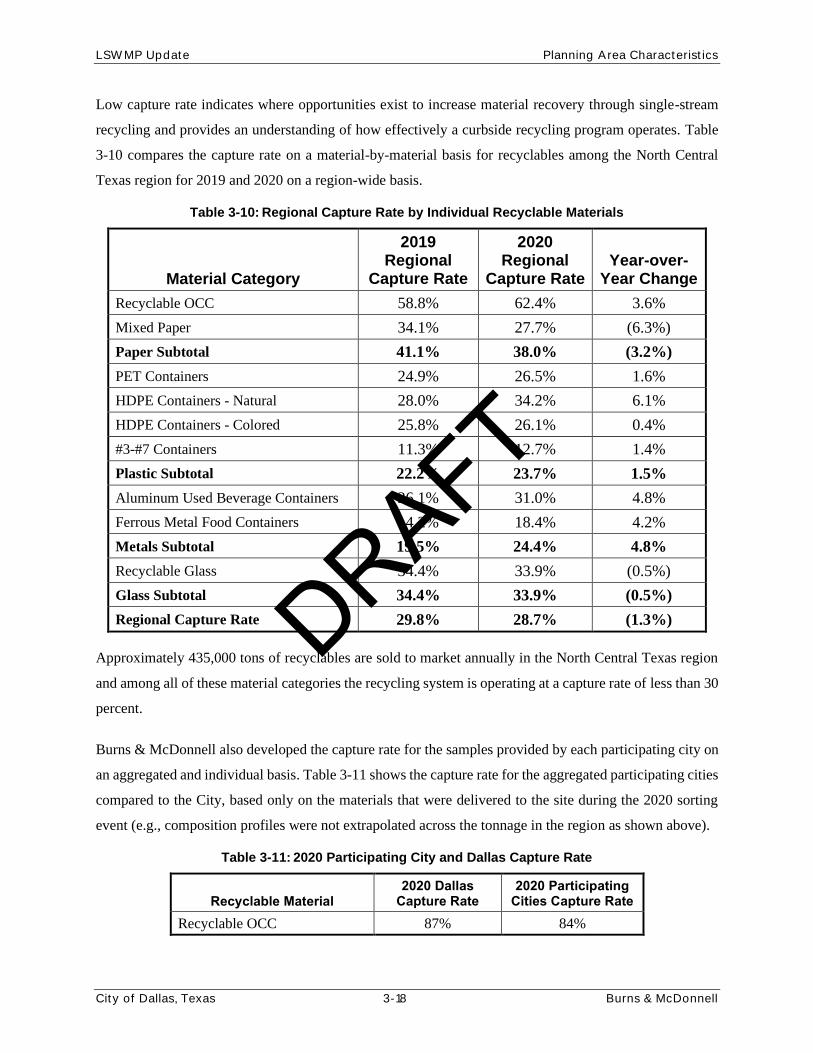
LSWMP Update Planning Area Characteristics
City of Dallas, Texas 3-18 Burns & McDonnell
Low capture rate indicates where opportunities exist to increase material recovery through single-stream
recycling and provides an understanding of how effectively a curbside recycling program operates. Table
3-10 compares the capture rate on a material-by-material basis for recyclables among the North Central
Texas region for 2019 and 2020 on a region-wide basis.
Table 3-10: Regional Capture Rate by Individual Recyclable Materials
Material Category
2019 Regional
Capture Rate
2020 Regional
Capture Rate Year-over-
Year Change
Recyclable OCC 58.8% 62.4% 3.6%
Mixed Paper 34.1% 27.7% (6.3%)
Paper Subtotal 41.1% 38.0% (3.2%)
PET Containers 24.9% 26.5% 1.6%
HDPE Containers - Natural 28.0% 34.2% 6.1%
HDPE Containers - Colored 25.8% 26.1% 0.4%
#3-#7 Containers 11.3% 12.7% 1.4%
Plastic Subtotal 22.2% 23.7% 1.5%
Aluminum Used Beverage Containers 26.1% 31.0% 4.8%
Ferrous Metal Food Containers 14.2% 18.4% 4.2%
Metals Subtotal 19.5% 24.4% 4.8%
Recyclable Glass 34.4% 33.9% (0.5%)
Glass Subtotal 34.4% 33.9% (0.5%)
Regional Capture Rate 29.8% 28.7% (1.3%)
Approximately 435,000 tons of recyclables are sold to market annually in the North Central Texas region
and among all of these material categories the recycling system is operating at a capture rate of less than 30
percent.
Burns & McDonnell also developed the capture rate for the samples provided by each participating city on
an aggregated and individual basis. Table 3-11 shows the capture rate for the aggregated participating cities
compared to the City, based only on the materials that were delivered to the site during the 2020 sorting
event (e.g., composition profiles were not extrapolated across the tonnage in the region as shown above).
Table 3-11: 2020 Participating City and Dallas Capture Rate
Recyclable Material 2020 Dallas
Capture Rate 2020 Participating
Cities Capture Rate
Recyclable OCC 87% 84%
DRAFT

LSWMP Update Planning Area Characteristics
City of Dallas, Texas 3-19 Burns & McDonnell
Recyclable Material 2020 Dallas
Capture Rate 2020 Participating
Cities Capture Rate
Mixed Paper 49% 52%
PET Containers 52% 51%
HDPE Containers - Natural 56% 58%
HDPE Containers - Colored 61% 52%
#3-#7 Containers 26% 31%
Aluminum Used Beverage
Containers 63% 57%
Ferrous Metal Food Containers 24% 41%
Recyclable Glass 60% 59%
Total 61% 59%
The capture rate of material delivered to the sorting site by the City at 61 percent is slightly higher than the
capture rate of the aggregated samples at 59 percent. Based on these results, there is opportunity for the
City to improve in the capture of key and highly valuable recyclable materials including mixed paper, PET,
HDPE and ferrous metal.
DRAFT
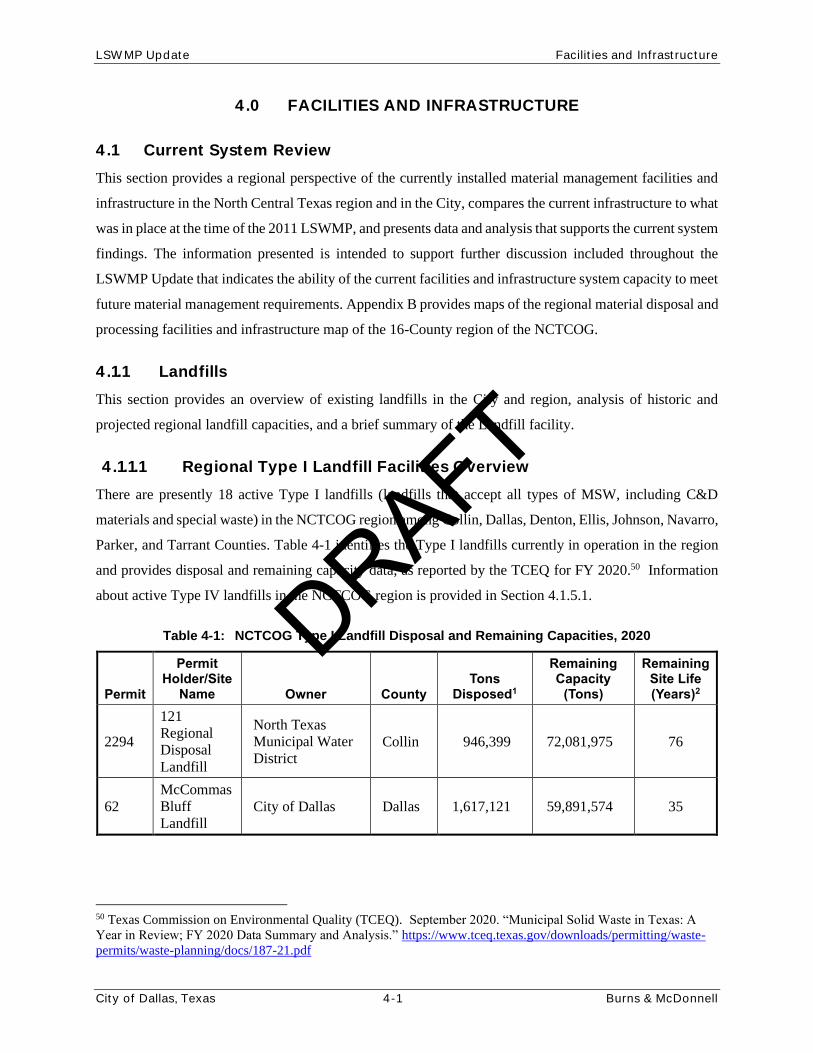
LSWMP Update Facilities and Infrastructure
City of Dallas, Texas 4-1 Burns & McDonnell
4.0 FACILITIES AND INFRASTRUCTURE
4.1 Current System Review
This section provides a regional perspective of the currently installed material management facilities and
infrastructure in the North Central Texas region and in the City, compares the current infrastructure to what
was in place at the time of the 2011 LSWMP, and presents data and analysis that supports the current system
findings. The information presented is intended to support further discussion included throughout the
LSWMP Update that indicates the ability of the current facilities and infrastructure system capacity to meet
future material management requirements. Appendix B provides maps of the regional material disposal and
processing facilities and infrastructure map of the 16-County region of the NCTCOG.
4.1.1 Landfills
This section provides an overview of existing landfills in the City and region, analysis of historic and
projected regional landfill capacities, and a brief summary of the Landfill facility.
4.1.1.1 Regional Type I Landfill Facilities Overview
There are presently 18 active Type I landfills (landfills that accept all types of MSW, including C&D
materials and special waste) in the NCTCOG region among Collin, Dallas, Denton, Ellis, Johnson, Navarro,
Parker, and Tarrant Counties. Table 4-1 identifies the Type I landfills currently in operation in the region
and provides disposal and remaining capacity data, as reported by the TCEQ for FY 2020.50 Information
about active Type IV landfills in the NCTCOG region is provided in Section 4.1.5.1.
Table 4-1: NCTCOG Type I Landfill Disposal and Remaining Capacities, 2020
Permit
Permit Holder/Site
Name Owner County Tons
Disposed1
Remaining Capacity
(Tons)
Remaining Site Life (Years)2
2294
121
Regional
Disposal
Landfill
North Texas
Municipal Water
District
Collin 946,399 72,081,975 76
62
McCommas
Bluff
Landfill
City of Dallas Dallas 1,617,121 59,891,574 35
50 Texas Commission on Environmental Quality (TCEQ). September 2020. “Municipal Solid Waste in Texas: A
Year in Review; FY 2020 Data Summary and Analysis.” https://www.tceq.texas.gov/downloads/permitting/waste-
permits/waste-planning/docs/187-21.pdf
DRAFT
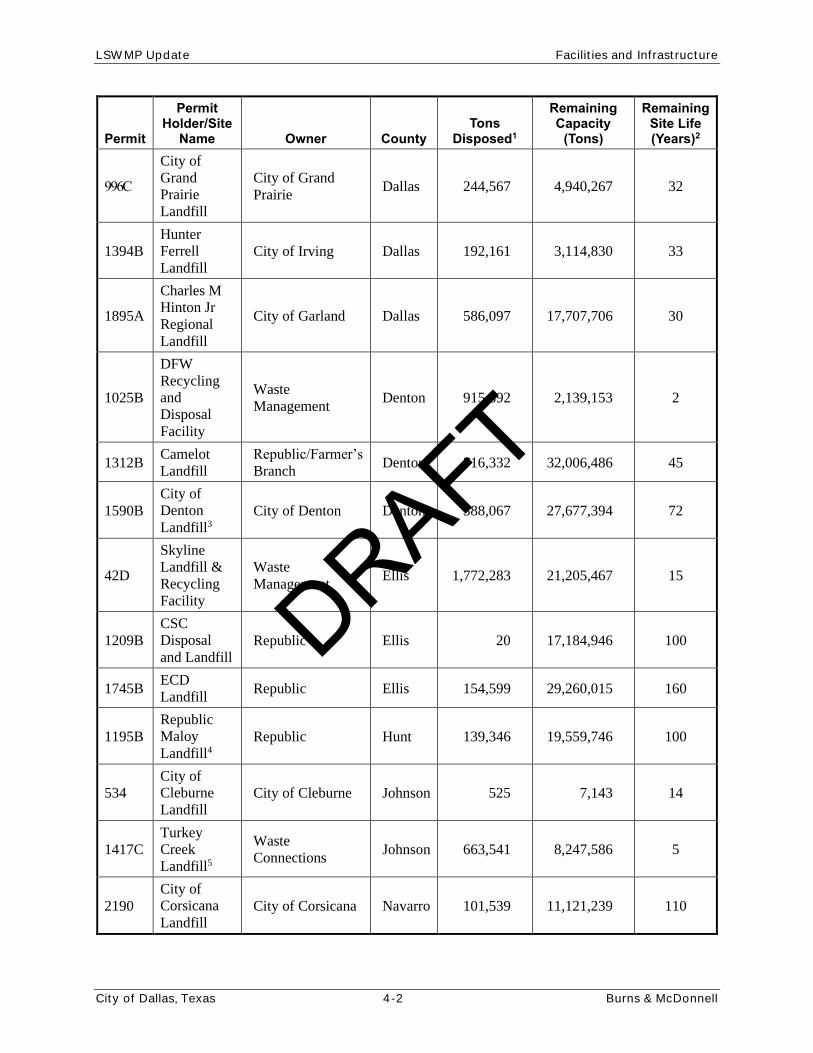
LSWMP Update Facilities and Infrastructure
City of Dallas, Texas 4-2 Burns & McDonnell
Permit
Permit Holder/Site
Name Owner County Tons
Disposed1
Remaining Capacity
(Tons)
Remaining Site Life (Years)2
996C
City of
Grand
Prairie
Landfill
City of Grand
Prairie Dallas 244,567 4,940,267 32
1394B
Hunter
Ferrell
Landfill
City of Irving Dallas 192,161 3,114,830 33
1895A
Charles M
Hinton Jr
Regional
Landfill
City of Garland Dallas 586,097 17,707,706 30
1025B
DFW
Recycling
and
Disposal
Facility
Waste
Management Denton 915,892 2,139,153 2
1312B Camelot
Landfill
Republic/Farmer’s
Branch Denton 716,332 32,006,486 45
1590B
City of
Denton
Landfill3
City of Denton Denton 388,067 27,677,394 72
42D
Skyline
Landfill &
Recycling
Facility
Waste
Management Ellis 1,772,283 21,205,467 15
1209B
CSC
Disposal
and Landfill
Republic Ellis 20 17,184,946 100
1745B ECD
Landfill Republic Ellis 154,599 29,260,015 160
1195B
Republic
Maloy
Landfill4
Republic Hunt 139,346 19,559,746 100
534
City of
Cleburne
Landfill
City of Cleburne Johnson 525 7,143 14
1417C
Turkey
Creek
Landfill5
Waste
Connections Johnson 663,541 8,247,586 5
2190
City of
Corsicana
Landfill
City of Corsicana Navarro 101,539 11,121,239 110
DRAFT
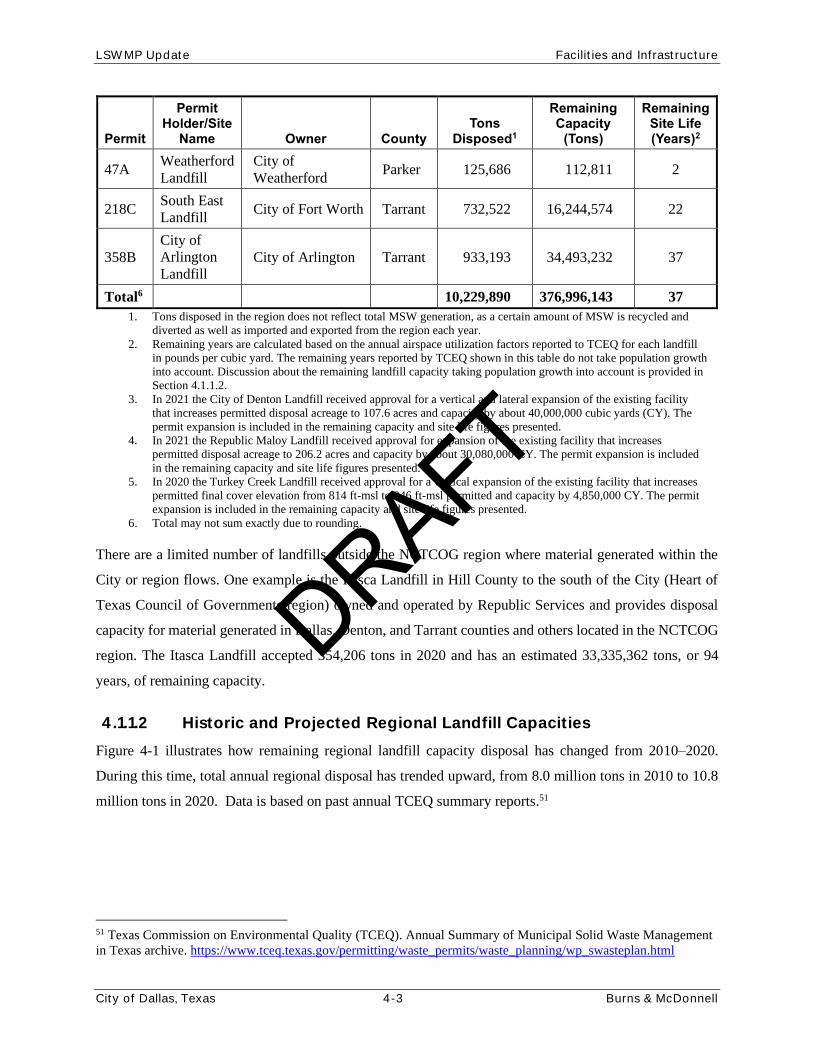
LSWMP Update Facilities and Infrastructure
City of Dallas, Texas 4-3 Burns & McDonnell
Permit
Permit Holder/Site
Name Owner County Tons
Disposed1
Remaining Capacity
(Tons)
Remaining Site Life (Years)2
47A Weatherford
Landfill
City of
Weatherford Parker 125,686 112,811 2
218C South East
Landfill City of Fort Worth Tarrant 732,522 16,244,574 22
358B
City of
Arlington
Landfill
City of Arlington Tarrant 933,193 34,493,232 37
Total6 10,229,890 376,996,143 37
1. Tons disposed in the region does not reflect total MSW generation, as a certain amount of MSW is recycled and
diverted as well as imported and exported from the region each year.
2. Remaining years are calculated based on the annual airspace utilization factors reported to TCEQ for each landfill
in pounds per cubic yard. The remaining years reported by TCEQ shown in this table do not take population growth
into account. Discussion about the remaining landfill capacity taking population growth into account is provided in
Section 4.1.1.2.
3. In 2021 the City of Denton Landfill received approval for a vertical and lateral expansion of the existing facility
that increases permitted disposal acreage to 107.6 acres and capacity by about 40,000,000 cubic yards (CY). The
permit expansion is included in the remaining capacity and site life figures presented.
4. In 2021 the Republic Maloy Landfill received approval for expansion of the existing facility that increases
permitted disposal acreage to 206.2 acres and capacity by about 30,080,000 CY. The permit expansion is included
in the remaining capacity and site life figures presented.
5. In 2020 the Turkey Creek Landfill received approval for a vertical expansion of the existing facility that increases
permitted final cover elevation from 814 ft-msl to 946 ft-msl permitted and capacity by 4,850,000 CY. The permit
expansion is included in the remaining capacity and site life figures presented.
6. Total may not sum exactly due to rounding.
There are a limited number of landfills outside the NCTCOG region where material generated within the
City or region flows. One example is the Itasca Landfill in Hill County to the south of the City (Heart of
Texas Council of Governments region) owned and operated by Republic Services and provides disposal
capacity for material generated in Dallas, Denton, and Tarrant counties and others located in the NCTCOG
region. The Itasca Landfill accepted 354,206 tons in 2020 and has an estimated 33,335,362 tons, or 94
years, of remaining capacity.
4.1.1.2 Historic and Projected Regional Landfill Capacities
Figure 4-1 illustrates how remaining regional landfill capacity disposal has changed from 2010–2020.
During this time, total annual regional disposal has trended upward, from 8.0 million tons in 2010 to 10.8
million tons in 2020. Data is based on past annual TCEQ summary reports.51
51 Texas Commission on Environmental Quality (TCEQ). Annual Summary of Municipal Solid Waste Management
in Texas archive. https://www.tceq.texas.gov/permitting/waste_permits/waste_planning/wp_swasteplan.html
DRAFT
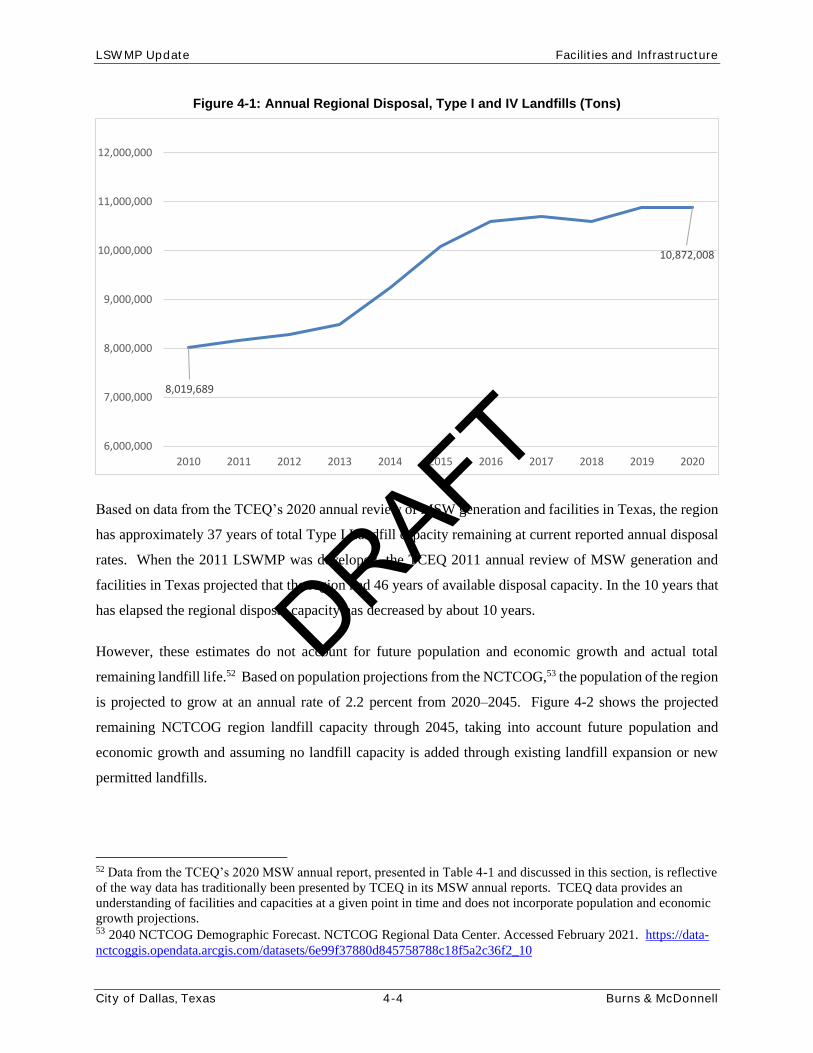
LSWMP Update Facilities and Infrastructure
City of Dallas, Texas 4-4 Burns & McDonnell
Figure 4-1: Annual Regional Disposal, Type I and IV Landfills (Tons)
Based on data from the TCEQ’s 2020 annual review of MSW generation and facilities in Texas, the region
has approximately 37 years of total Type I Landfill capacity remaining at current reported annual disposal
rates. When the 2011 LSWMP was developed, the TCEQ 2011 annual review of MSW generation and
facilities in Texas projected that the region had 46 years of available disposal capacity. In the 10 years that
has elapsed the regional disposal capacity has decreased by about 10 years.
However, these estimates do not account for future population and economic growth and actual total
remaining landfill life.52 Based on population projections from the NCTCOG,53 the population of the region
is projected to grow at an annual rate of 2.2 percent from 2020–2045. Figure 4-2 shows the projected
remaining NCTCOG region landfill capacity through 2045, taking into account future population and
economic growth and assuming no landfill capacity is added through existing landfill expansion or new
permitted landfills.
52 Data from the TCEQ’s 2020 MSW annual report, presented in Table 4-1 and discussed in this section, is reflective
of the way data has traditionally been presented by TCEQ in its MSW annual reports. TCEQ data provides an
understanding of facilities and capacities at a given point in time and does not incorporate population and economic
growth projections. 53 2040 NCTCOG Demographic Forecast. NCTCOG Regional Data Center. Accessed February 2021. https://data-
nctcoggis.opendata.arcgis.com/datasets/6e99f37880d845758788c18f5a2c36f2_10
8,019,689
10,872,008
6,000,000
7,000,000
8,000,000
9,000,000
10,000,000
11,000,000
12,000,000
2010 2011 2012 2013 2014 2015 2016 2017 2018 2019 2020
DRAFT
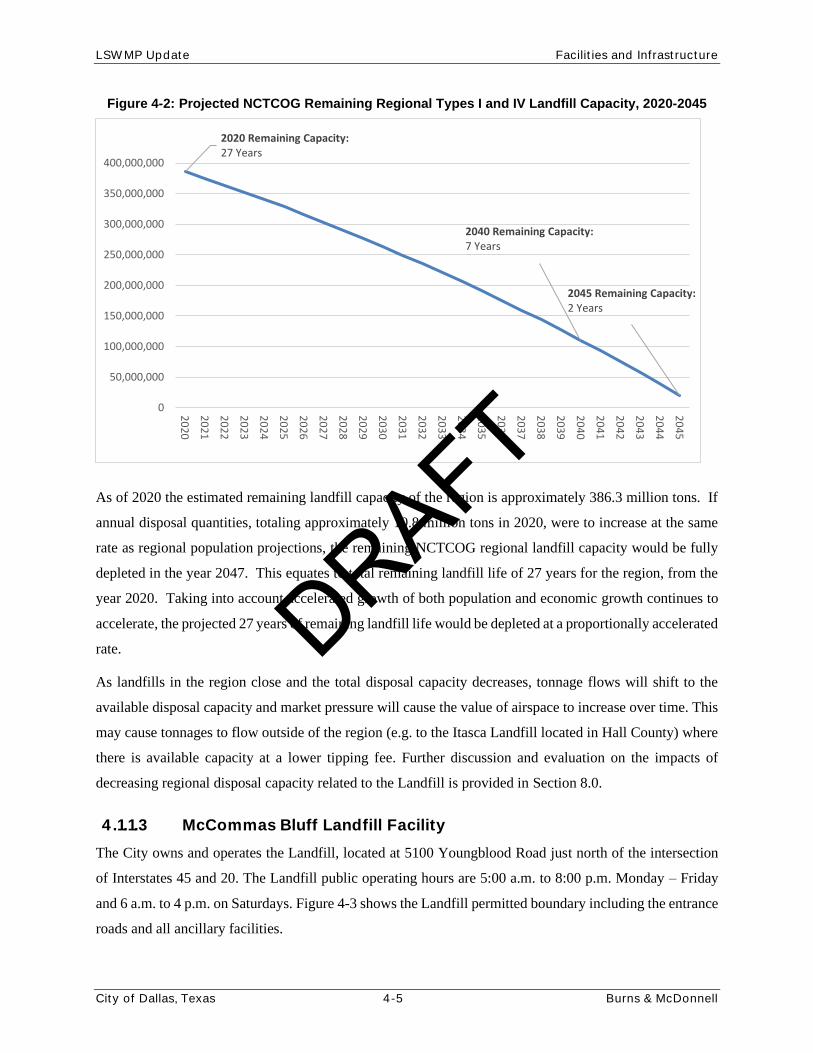
LSWMP Update Facilities and Infrastructure
City of Dallas, Texas 4-5 Burns & McDonnell
Figure 4-2: Projected NCTCOG Remaining Regional Types I and IV Landfill Capacity, 2020-2045
As of 2020 the estimated remaining landfill capacity of the region is approximately 386.3 million tons. If
annual disposal quantities, totaling approximately 10.8 million tons in 2020, were to increase at the same
rate as regional population projections, the remaining NCTCOG regional landfill capacity would be fully
depleted in the year 2047. This equates to total remaining landfill life of 27 years for the region, from the
year 2020. Taking into account accelerated growth of both population and economic growth continues to
accelerate, the projected 27 years of remaining landfill life would be depleted at a proportionally accelerated
rate.
As landfills in the region close and the total disposal capacity decreases, tonnage flows will shift to the
available disposal capacity and market pressure will cause the value of airspace to increase over time. This
may cause tonnages to flow outside of the region (e.g. to the Itasca Landfill located in Hall County) where
there is available capacity at a lower tipping fee. Further discussion and evaluation on the impacts of
decreasing regional disposal capacity related to the Landfill is provided in Section 8.0.
4.1.1.3 McCommas Bluff Landfill Facility
The City owns and operates the Landfill, located at 5100 Youngblood Road just north of the intersection
of Interstates 45 and 20. The Landfill public operating hours are 5:00 a.m. to 8:00 p.m. Monday – Friday
and 6 a.m. to 4 p.m. on Saturdays. Figure 4-3 shows the Landfill permitted boundary including the entrance
roads and all ancillary facilities.
2020 Remaining Capacity: 27 Years
2040 Remaining Capacity:7 Years
2045 Remaining Capacity:2 Years
0
50,000,000
100,000,000
150,000,000
200,000,000
250,000,000
300,000,000
350,000,000
400,000,000
20
20
20
21
20
22
20
23
20
24
20
25
20
26
20
27
20
28
20
29
20
30
20
31
20
32
20
33
20
34
20
35
20
36
20
37
20
38
20
39
20
40
20
41
20
42
20
43
20
44
20
45
DRAFT
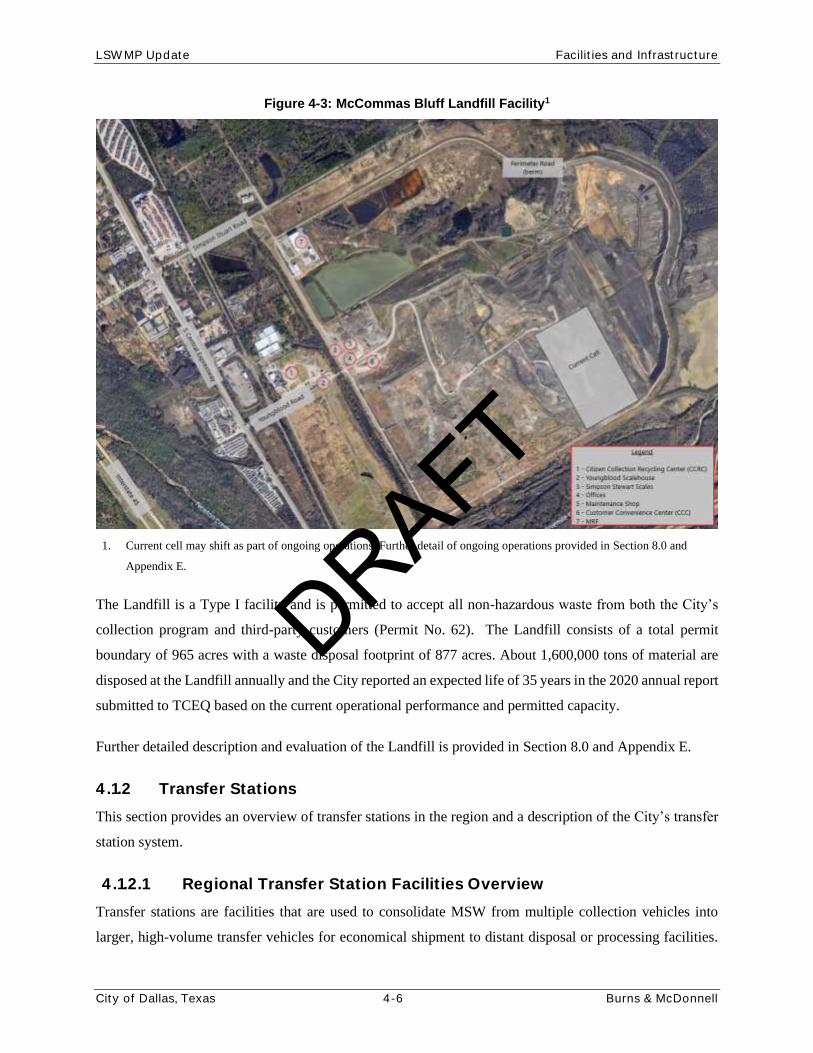
LSWMP Update Facilities and Infrastructure
City of Dallas, Texas 4-6 Burns & McDonnell
Figure 4-3: McCommas Bluff Landfill Facility1
1. Current cell may shift as part of ongoing operations. Further detail of ongoing operations provided in Section 8.0 and
Appendix E.
The Landfill is a Type I facility and is permitted to accept all non-hazardous waste from both the City’s
collection program and third-party customers (Permit No. 62). The Landfill consists of a total permit
boundary of 965 acres with a waste disposal footprint of 877 acres. About 1,600,000 tons of material are
disposed at the Landfill annually and the City reported an expected life of 35 years in the 2020 annual report
submitted to TCEQ based on the current operational performance and permitted capacity.
Further detailed description and evaluation of the Landfill is provided in Section 8.0 and Appendix E.
4.1.2 Transfer Stations
This section provides an overview of transfer stations in the region and a description of the City’s transfer
station system.
4.1.2.1 Regional Transfer Station Facilities Overview
Transfer stations are facilities that are used to consolidate MSW from multiple collection vehicles into
larger, high-volume transfer vehicles for economical shipment to distant disposal or processing facilities.
DRAFT
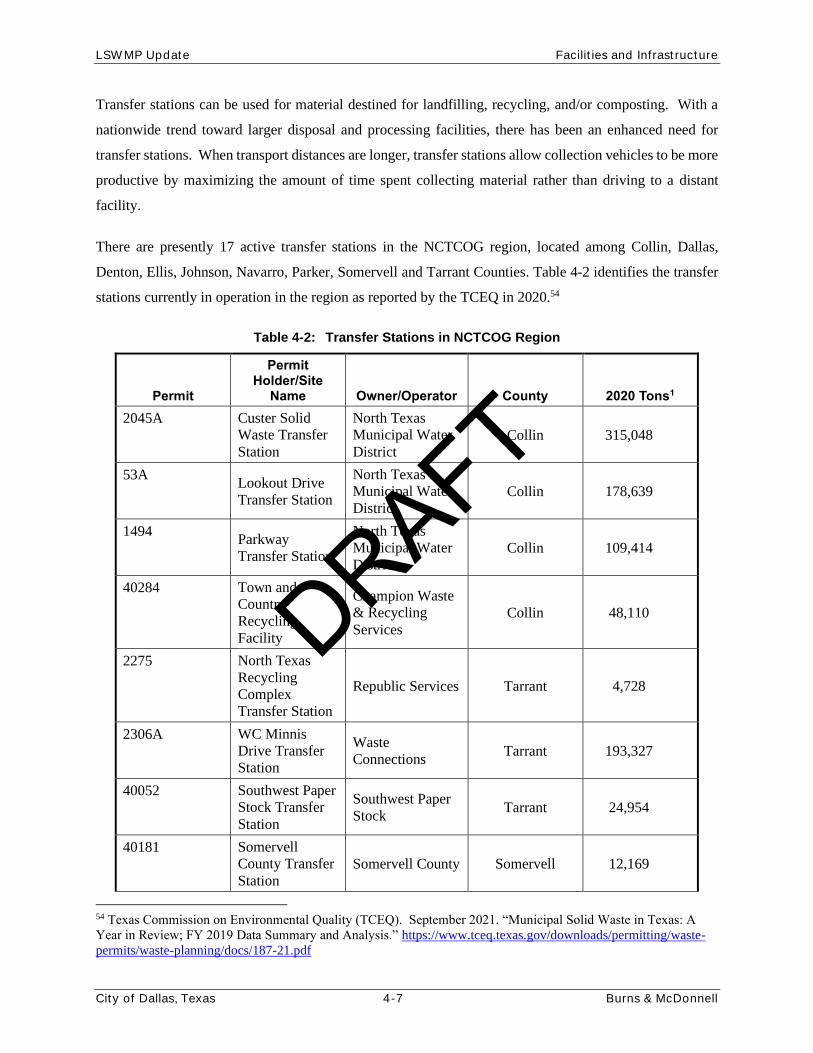
LSWMP Update Facilities and Infrastructure
City of Dallas, Texas 4-7 Burns & McDonnell
Transfer stations can be used for material destined for landfilling, recycling, and/or composting. With a
nationwide trend toward larger disposal and processing facilities, there has been an enhanced need for
transfer stations. When transport distances are longer, transfer stations allow collection vehicles to be more
productive by maximizing the amount of time spent collecting material rather than driving to a distant
facility.
There are presently 17 active transfer stations in the NCTCOG region, located among Collin, Dallas,
Denton, Ellis, Johnson, Navarro, Parker, Somervell and Tarrant Counties. Table 4-2 identifies the transfer
stations currently in operation in the region as reported by the TCEQ in 2020.54
Table 4-2: Transfer Stations in NCTCOG Region
Permit
Permit Holder/Site
Name Owner/Operator County 2020 Tons1
2045A Custer Solid
Waste Transfer
Station
North Texas
Municipal Water
District
Collin 315,048
53A Lookout Drive
Transfer Station
North Texas
Municipal Water
District
Collin 178,639
1494 Parkway
Transfer Station
North Texas
Municipal Water
District
Collin 109,414
40284 Town and
Country
Recycling
Facility
Champion Waste
& Recycling
Services
Collin 48,110
2275 North Texas
Recycling
Complex
Transfer Station
Republic Services Tarrant 4,728
2306A WC Minnis
Drive Transfer
Station
Waste
Connections Tarrant 193,327
40052 Southwest Paper
Stock Transfer
Station
Southwest Paper
Stock Tarrant 24,954
40181 Somervell
County Transfer
Station
Somervell County Somervell 12,169
54 Texas Commission on Environmental Quality (TCEQ). September 2021. “Municipal Solid Waste in Texas: A
Year in Review; FY 2019 Data Summary and Analysis.” https://www.tceq.texas.gov/downloads/permitting/waste-
permits/waste-planning/docs/187-21.pdf
DRAFT
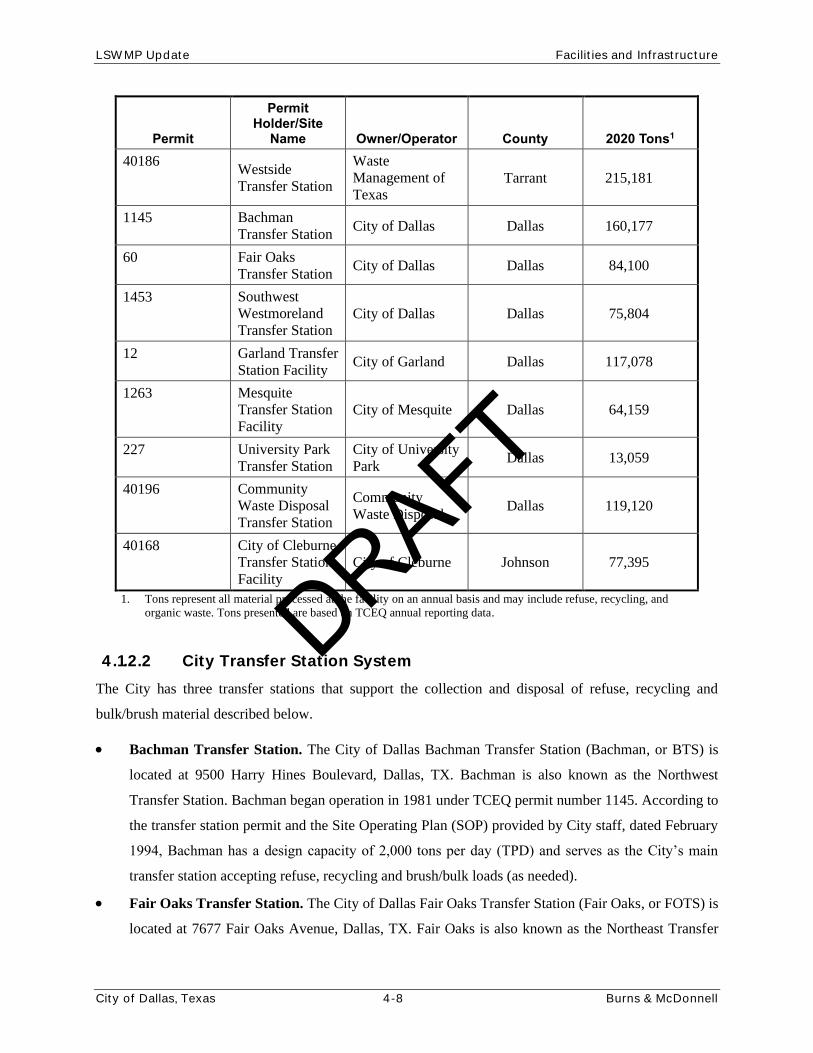
LSWMP Update Facilities and Infrastructure
City of Dallas, Texas 4-8 Burns & McDonnell
Permit
Permit Holder/Site
Name Owner/Operator County 2020 Tons1
40186 Westside
Transfer Station
Waste
Management of
Texas
Tarrant 215,181
1145 Bachman
Transfer Station City of Dallas Dallas 160,177
60 Fair Oaks
Transfer Station City of Dallas Dallas 84,100
1453 Southwest
Westmoreland
Transfer Station City of Dallas Dallas 75,804
12 Garland Transfer
Station Facility City of Garland Dallas 117,078
1263 Mesquite
Transfer Station
Facility City of Mesquite Dallas 64,159
227 University Park
Transfer Station City of University
Park Dallas 13,059
40196 Community
Waste Disposal
Transfer Station
Community
Waste Disposal Dallas 119,120
40168 City of Cleburne
Transfer Station
Facility
City of Cleburne Johnson 77,395
1. Tons represent all material processed at the facility on an annual basis and may include refuse, recycling, and
organic waste. Tons presented are based on TCEQ annual reporting data.
4.1.2.2 City Transfer Station System
The City has three transfer stations that support the collection and disposal of refuse, recycling and
bulk/brush material described below.
• Bachman Transfer Station. The City of Dallas Bachman Transfer Station (Bachman, or BTS) is
located at 9500 Harry Hines Boulevard, Dallas, TX. Bachman is also known as the Northwest
Transfer Station. Bachman began operation in 1981 under TCEQ permit number 1145. According to
the transfer station permit and the Site Operating Plan (SOP) provided by City staff, dated February
1994, Bachman has a design capacity of 2,000 tons per day (TPD) and serves as the City’s main
transfer station accepting refuse, recycling and brush/bulk loads (as needed).
• Fair Oaks Transfer Station. The City of Dallas Fair Oaks Transfer Station (Fair Oaks, or FOTS) is
located at 7677 Fair Oaks Avenue, Dallas, TX. Fair Oaks is also known as the Northeast Transfer
DRAFT
LSWMP Update Facilities and Infrastructure
City of Dallas, Texas 4-9 Burns & McDonnell
Station. Fair Oaks began operation in 1969, but has undergone several major renovations. The facility
currently operates under TCEQ permit number 0060. According to the transfer station permit and the
Site Operating Plan (SOP) provided by City staff, dated February 1994, Fair Oaks has a design
capacity of 400 TPD and serves one of the City’s smaller transfer stations accepting refuse and
recycling material.
• Westmoreland Transfer Station. The Westmoreland Transfer Station (Westmoreland) is located at
4610 S. Westmoreland Avenue, Dallas, TX. Westmoreland is also known as the Southwest Transfer
Station. Westmoreland began operation in 1985 under TCEQ permit number 1453. According to the
transfer station permit and the Site Operating Plan (SOP) provided by City staff, dated February 1994,
Westmoreland has a design capacity of 400 TPD and serves as one of the City’s smaller transfer
stations accepting refuse and recycling materials.
When the 2011 LSWMP was developed, the City’s transfer station system’s physical infrastructure was
identical to the current system; however, since that point the City has begun to manage single-stream
recyclables at the transfer stations. While Bachman and the satellite transfer stations support the City’s
current transfer needs for both refuse, recycling, brush and bulky waste during typical operations, the
transfer station system struggles to handle and transfer material without extended operating hours when it
becomes inundated with material during unanticipated surges in volume.
Further detail and evaluation related the transfer station system and each of the City’s transfer stations is
provided in Section 5.0.
4.1.3 Material Recovery Facilities
This section provides an overview of MRFs in the region and a description of the FCC MRF located at the
Landfill.
4.1.3.1 Material Recovery Facilities Overview
This section provides an overview of Materials Recovery Facilities (MRFs) in the region and provides a
high-level overview of the MRF located at the Landfill.
MRFs are designed to receive, process, segregate and bale various recoverable commodities and prepare
them for sale on the secondary material commodity market. There are presently eight active MRFs in the
NCTCOG region, located among Collin, Dallas, Denton, and Tarrant Counties. Table 4-3 identifies the
MRFs currently in operation in the region and provides the owner and/or operator, location, and materials
accepted.
DRAFT
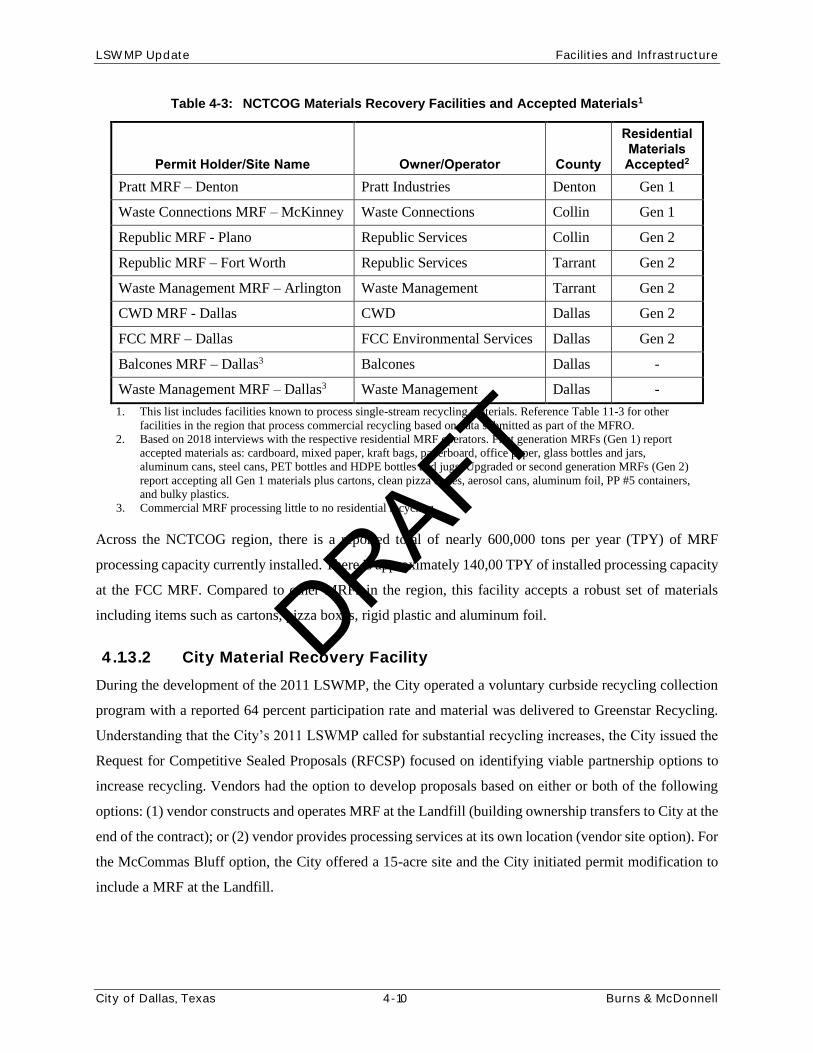
LSWMP Update Facilities and Infrastructure
City of Dallas, Texas 4-10 Burns & McDonnell
Table 4-3: NCTCOG Materials Recovery Facilities and Accepted Materials1
Permit Holder/Site Name Owner/Operator County
Residential Materials Accepted2
Pratt MRF – Denton Pratt Industries Denton Gen 1
Waste Connections MRF – McKinney Waste Connections Collin Gen 1
Republic MRF - Plano Republic Services Collin Gen 2
Republic MRF – Fort Worth Republic Services Tarrant Gen 2
Waste Management MRF – Arlington Waste Management Tarrant Gen 2
CWD MRF - Dallas CWD Dallas Gen 2
FCC MRF – Dallas FCC Environmental Services Dallas Gen 2
Balcones MRF – Dallas3 Balcones Dallas -
Waste Management MRF – Dallas3 Waste Management Dallas -
1. This list includes facilities known to process single-stream recycling materials. Reference Table 11-3 for other
facilities in the region that process commercial recycling based on data submitted as part of the MFRO.
2. Based on 2018 interviews with the respective residential MRF operators. First generation MRFs (Gen 1) report
accepted materials as: cardboard, mixed paper, kraft bags, paperboard, office paper, glass bottles and jars,
aluminum cans, steel cans, PET bottles and HDPE bottles and jugs. Upgraded or second generation MRFs (Gen 2)
report accepting all Gen 1 materials plus cartons, clean pizza boxes, aerosol cans, aluminum foil, PP #5 containers,
and bulky plastics.
3. Commercial MRF processing little to no residential recycling.
Across the NCTCOG region, there is a reported total of nearly 600,000 tons per year (TPY) of MRF
processing capacity currently installed. There is approximately 140,00 TPY of installed processing capacity
at the FCC MRF. Compared to other MRFs in the region, this facility accepts a robust set of materials
including items such as cartons, pizza boxes, rigid plastic and aluminum foil.
4.1.3.2 City Material Recovery Facility
During the development of the 2011 LSWMP, the City operated a voluntary curbside recycling collection
program with a reported 64 percent participation rate and material was delivered to Greenstar Recycling.
Understanding that the City’s 2011 LSWMP called for substantial recycling increases, the City issued the
Request for Competitive Sealed Proposals (RFCSP) focused on identifying viable partnership options to
increase recycling. Vendors had the option to develop proposals based on either or both of the following
options: (1) vendor constructs and operates MRF at the Landfill (building ownership transfers to City at the
end of the contract); or (2) vendor provides processing services at its own location (vendor site option). For
the McCommas Bluff option, the City offered a 15-acre site and the City initiated permit modification to
include a MRF at the Landfill.
DRAFT
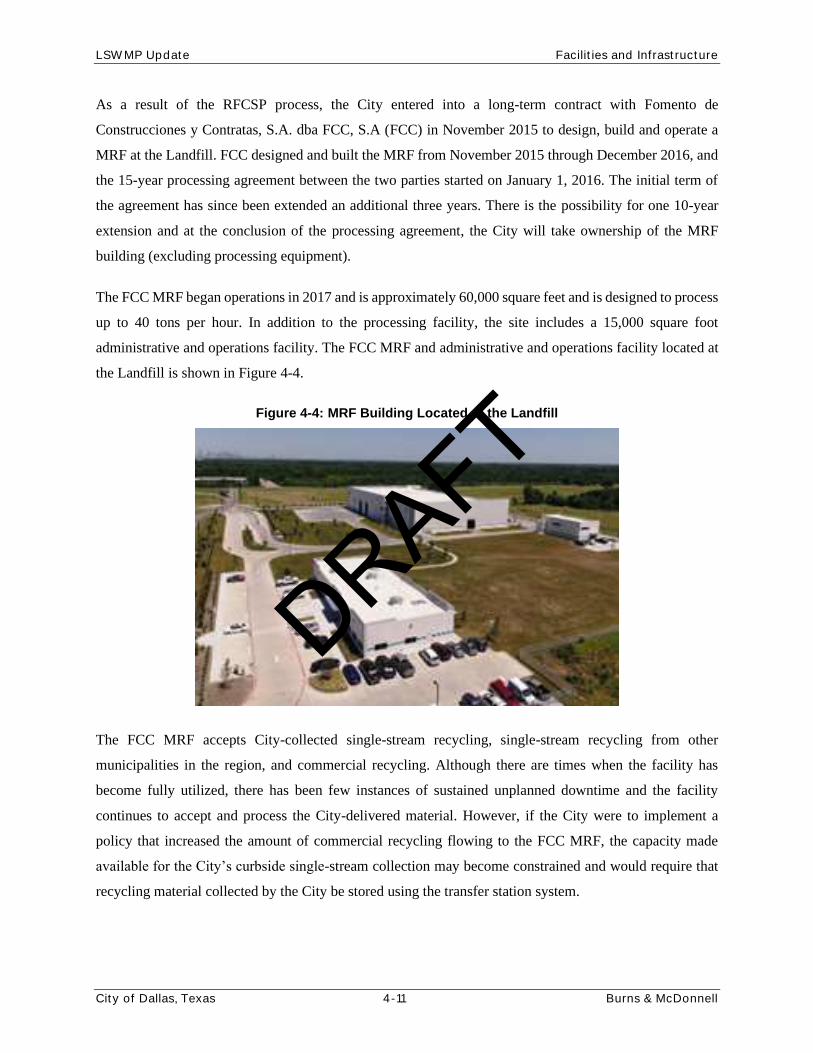
LSWMP Update Facilities and Infrastructure
City of Dallas, Texas 4-11 Burns & McDonnell
As a result of the RFCSP process, the City entered into a long-term contract with Fomento de
Construcciones y Contratas, S.A. dba FCC, S.A (FCC) in November 2015 to design, build and operate a
MRF at the Landfill. FCC designed and built the MRF from November 2015 through December 2016, and
the 15-year processing agreement between the two parties started on January 1, 2016. The initial term of
the agreement has since been extended an additional three years. There is the possibility for one 10-year
extension and at the conclusion of the processing agreement, the City will take ownership of the MRF
building (excluding processing equipment).
The FCC MRF began operations in 2017 and is approximately 60,000 square feet and is designed to process
up to 40 tons per hour. In addition to the processing facility, the site includes a 15,000 square foot
administrative and operations facility. The FCC MRF and administrative and operations facility located at
the Landfill is shown in Figure 4-4.
Figure 4-4: MRF Building Located at the Landfill
The FCC MRF accepts City-collected single-stream recycling, single-stream recycling from other
municipalities in the region, and commercial recycling. Although there are times when the facility has
become fully utilized, there has been few instances of sustained unplanned downtime and the facility
continues to accept and process the City-delivered material. However, if the City were to implement a
policy that increased the amount of commercial recycling flowing to the FCC MRF, the capacity made
available for the City’s curbside single-stream collection may become constrained and would require that
recycling material collected by the City be stored using the transfer station system.
DRAFT
LSWMP Update Facilities and Infrastructure
City of Dallas, Texas 4-12 Burns & McDonnell
The City pays a rate of $73.46 per ton that is adjusted annually based on a contractually-based rate
adjustment (that only applies to the operation component of the rate) and receives 50 percent of the revenue
of material sales, based on the higher of actual sales or index pricing. The City and FCC conduct MRF
audits on a semi-annual basis to ensure that the processing efficiency of the equipment meets the
contractually obligated 95 percent efficiency and to calculate revenue sharing. As of the most recent audit
conducted in September 2021, the contamination of the City’s material is about 25 percent by weight.
The City provides disposal of residuals and contamination from materials delivered by the City at no cost
to FCC and receives about $16.60 per ton host fee for guaranteed tonnages and a $1.11 per household public
education fee. FCC also provides $40,000 annually for community outreach and $25,000 annually for
managerial education support, although these are not paid directly to the City and are provided as in-kind
services.
Further discussion and evaluation of the MRF and processing agreement are provided in Section 109.0.
4.1.4 Organics Processing Facilities
This section provides an overview of organics processing facilities in the region and the City’s current
organics processing system.
4.1.4.1 Organics Processing Facilities Overview
TCEQ regulation and oversight of organics processing regulations vary depending on the types of materials
a facility accepts and therefore TCEQ does not actively regulate all organics processing facilities. Burns &
McDonnell has compiled an inventory of known active organics processing facilities, although there may
be additional organics processing operations in the region that are small scale or do not generate a compost
product that is marketed commercially. Table 4-4 identifies major organics processing facilities within the
Denton, Collins, and Tarrant County areas that accept a combination of yard trimmings and food scraps.
DRAFT
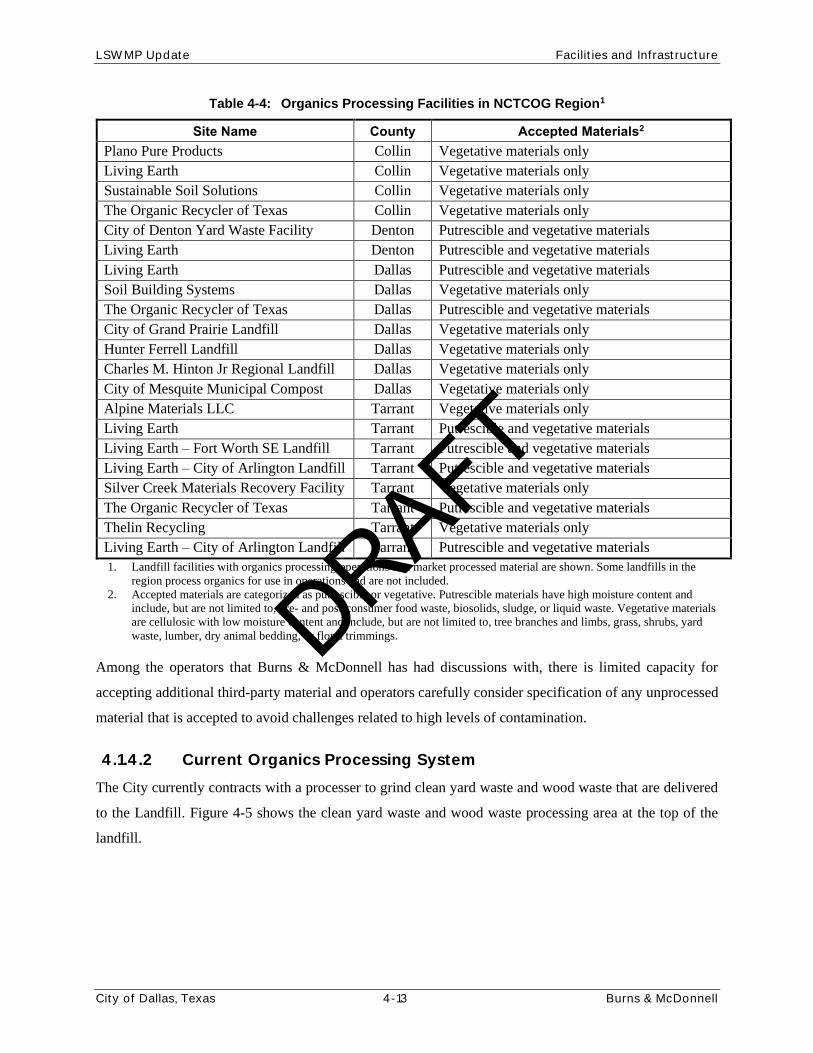
LSWMP Update Facilities and Infrastructure
City of Dallas, Texas 4-13 Burns & McDonnell
Table 4-4: Organics Processing Facilities in NCTCOG Region1
Site Name County Accepted Materials2
Plano Pure Products Collin Vegetative materials only
Living Earth Collin Vegetative materials only
Sustainable Soil Solutions Collin Vegetative materials only
The Organic Recycler of Texas Collin Vegetative materials only
City of Denton Yard Waste Facility Denton Putrescible and vegetative materials
Living Earth Denton Putrescible and vegetative materials
Living Earth Dallas Putrescible and vegetative materials
Soil Building Systems Dallas Vegetative materials only
The Organic Recycler of Texas Dallas Putrescible and vegetative materials
City of Grand Prairie Landfill Dallas Vegetative materials only
Hunter Ferrell Landfill Dallas Vegetative materials only
Charles M. Hinton Jr Regional Landfill Dallas Vegetative materials only
City of Mesquite Municipal Compost Dallas Vegetative materials only
Alpine Materials LLC Tarrant Vegetative materials only
Living Earth Tarrant Putrescible and vegetative materials
Living Earth – Fort Worth SE Landfill Tarrant Putrescible and vegetative materials
Living Earth – City of Arlington Landfill Tarrant Putrescible and vegetative materials
Silver Creek Materials Recovery Facility Tarrant Vegetative materials only
The Organic Recycler of Texas Tarrant Putrescible and vegetative materials
Thelin Recycling Tarrant Vegetative materials only
Living Earth – City of Arlington Landfill Tarrant Putrescible and vegetative materials
1. Landfill facilities with organics processing operations that market processed material are shown. Some landfills in the
region process organics for use in operations and are not included.
2. Accepted materials are categorized as putrescible or vegetative. Putrescible materials have high moisture content and
include, but are not limited to, pre- and post-consumer food waste, biosolids, sludge, or liquid waste. Vegetative materials
are cellulosic with low moisture content and include, but are not limited to, tree branches and limbs, grass, shrubs, yard
waste, lumber, dry animal bedding, or floral trimmings.
Among the operators that Burns & McDonnell has had discussions with, there is limited capacity for
accepting additional third-party material and operators carefully consider specification of any unprocessed
material that is accepted to avoid challenges related to high levels of contamination.
4.1.4.2 Current Organics Processing System
The City currently contracts with a processer to grind clean yard waste and wood waste that are delivered
to the Landfill. Figure 4-5 shows the clean yard waste and wood waste processing area at the top of the
landfill.
DRAFT
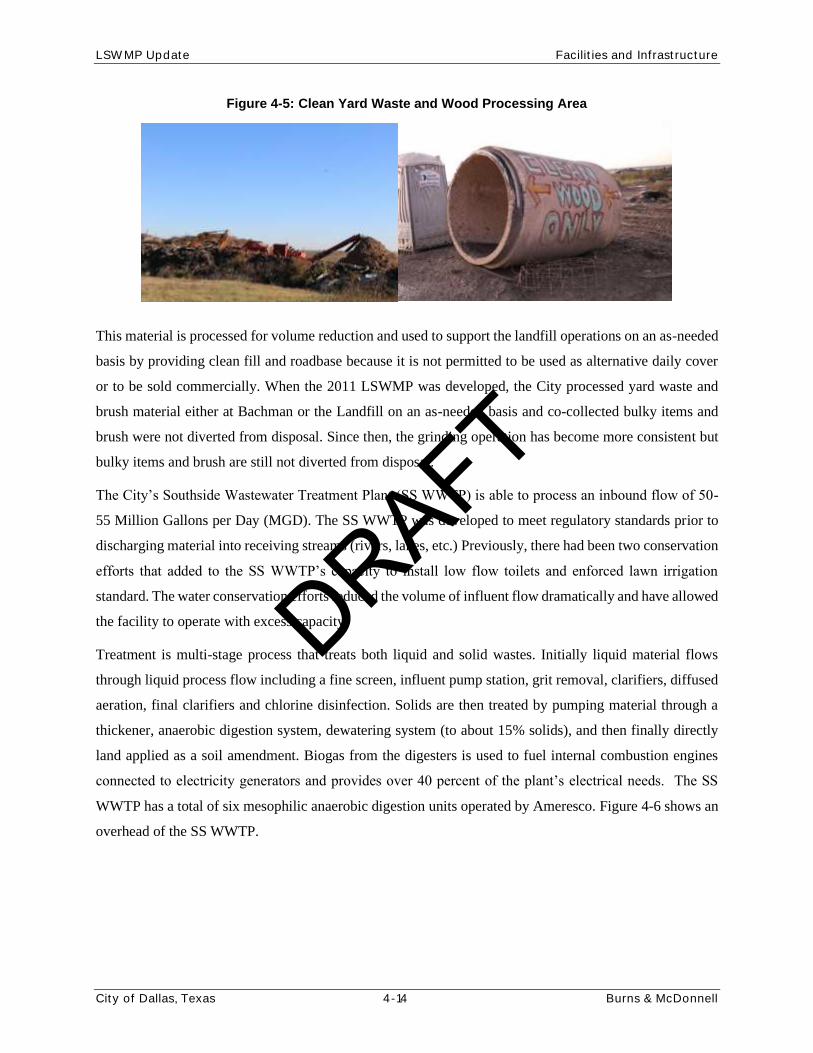
LSWMP Update Facilities and Infrastructure
City of Dallas, Texas 4-14 Burns & McDonnell
Figure 4-5: Clean Yard Waste and Wood Processing Area
This material is processed for volume reduction and used to support the landfill operations on an as-needed
basis by providing clean fill and roadbase because it is not permitted to be used as alternative daily cover
or to be sold commercially. When the 2011 LSWMP was developed, the City processed yard waste and
brush material either at Bachman or the Landfill on an as-needed basis and co-collected bulky items and
brush were not diverted from disposal. Since then, the grinding operation has become more consistent but
bulky items and brush are still not diverted from disposal.
The City’s Southside Wastewater Treatment Plant (SS WWTP) is able to process an inbound flow of 50-
55 Million Gallons per Day (MGD). The SS WWTP was developed to meet regulatory standards prior to
discharging material into receiving streams (rivers, lakes, etc.) Previously, there had been two conservation
efforts that added to the SS WWTP’s capacity to install low flow toilets and enforced lawn irrigation
standard. The water conservation efforts reduced the volume of influent flow dramatically and have allowed
the facility to operate with excess capacity.
Treatment is multi-stage process that treats both liquid and solid wastes. Initially liquid material flows
through liquid process flow including a fine screen, influent pump station, grit removal, clarifiers, diffused
aeration, final clarifiers and chlorine disinfection. Solids are then treated by pumping material through a
thickener, anaerobic digestion system, dewatering system (to about 15% solids), and then finally directly
land applied as a soil amendment. Biogas from the digesters is used to fuel internal combustion engines
connected to electricity generators and provides over 40 percent of the plant’s electrical needs. The SS
WWTP has a total of six mesophilic anaerobic digestion units operated by Ameresco. Figure 4-6 shows an
overhead of the SS WWTP.
DRAFT
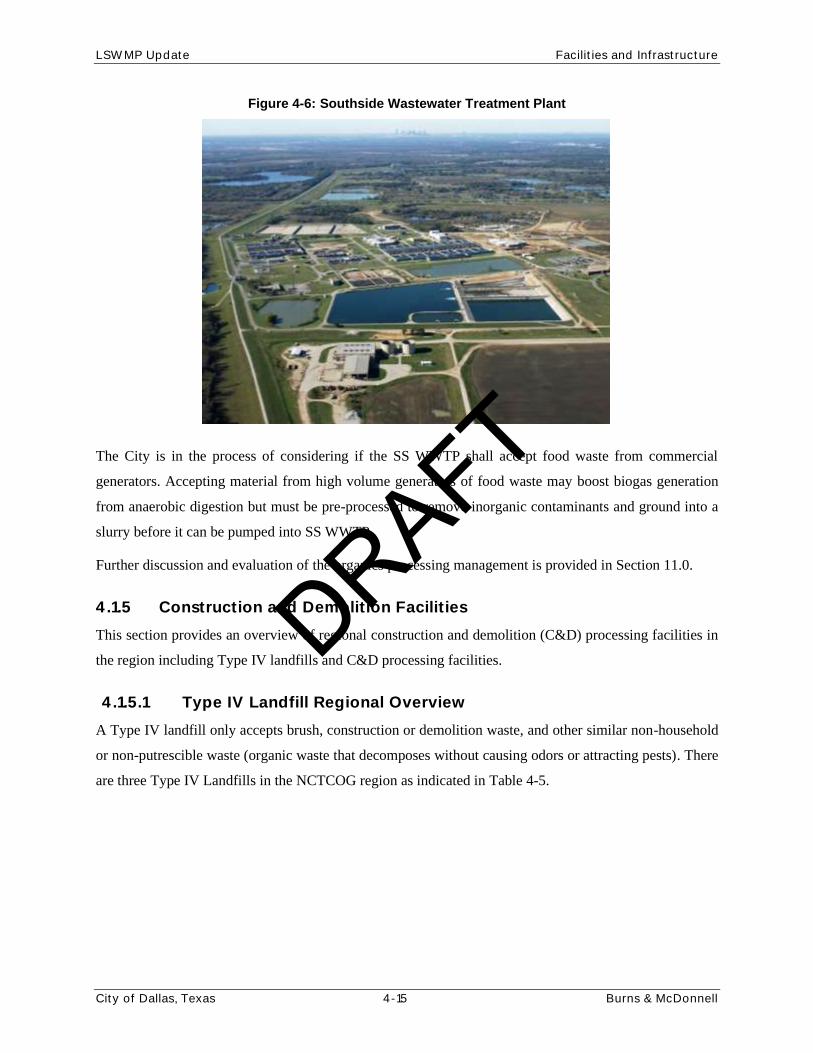
LSWMP Update Facilities and Infrastructure
City of Dallas, Texas 4-15 Burns & McDonnell
Figure 4-6: Southside Wastewater Treatment Plant
The City is in the process of considering if the SS WWTP shall accept food waste from commercial
generators. Accepting material from high volume generators of food waste may boost biogas generation
from anaerobic digestion but must be pre-processed to remove inorganic contaminants and ground into a
slurry before it can be pumped into SS WWTP.
Further discussion and evaluation of the organics processing management is provided in Section 11.0.
4.1.5 Construction and Demolition Facilities
This section provides an overview of regional construction and demolition (C&D) processing facilities in
the region including Type IV landfills and C&D processing facilities.
4.1.5.1 Type IV Landfill Regional Overview
A Type IV landfill only accepts brush, construction or demolition waste, and other similar non-household
or non-putrescible waste (organic waste that decomposes without causing odors or attracting pests). There
are three Type IV Landfills in the NCTCOG region as indicated in Table 4-5.
DRAFT
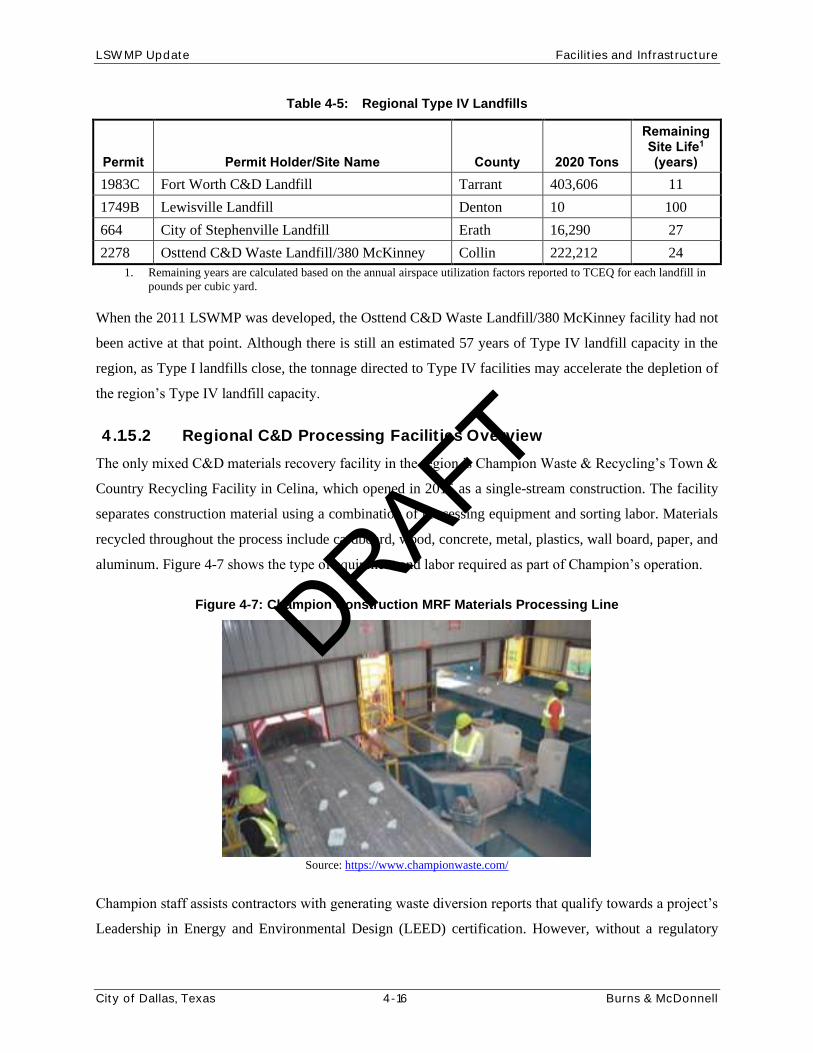
LSWMP Update Facilities and Infrastructure
City of Dallas, Texas 4-16 Burns & McDonnell
Table 4-5: Regional Type IV Landfills
Permit Permit Holder/Site Name County 2020 Tons
Remaining Site Life1
(years)
1983C Fort Worth C&D Landfill Tarrant 403,606 11
1749B Lewisville Landfill Denton 10 100
664 City of Stephenville Landfill Erath 16,290 27
2278 Osttend C&D Waste Landfill/380 McKinney Collin 222,212 24
1. Remaining years are calculated based on the annual airspace utilization factors reported to TCEQ for each landfill in
pounds per cubic yard.
When the 2011 LSWMP was developed, the Osttend C&D Waste Landfill/380 McKinney facility had not
been active at that point. Although there is still an estimated 57 years of Type IV landfill capacity in the
region, as Type I landfills close, the tonnage directed to Type IV facilities may accelerate the depletion of
the region’s Type IV landfill capacity.
4.1.5.2 Regional C&D Processing Facilities Overview
The only mixed C&D materials recovery facility in the region is Champion Waste & Recycling’s Town &
Country Recycling Facility in Celina, which opened in 2015 as a single-stream construction. The facility
separates construction material using a combination of processing equipment and sorting labor. Materials
recycled throughout the process include cardboard, wood, concrete, metal, plastics, wall board, paper, and
aluminum. Figure 4-7 shows the type of equipment and labor required as part of Champion’s operation.
Figure 4-7: Champion Construction MRF Materials Processing Line
Source: https://www.championwaste.com/
Champion staff assists contractors with generating waste diversion reports that qualify towards a project’s
Leadership in Energy and Environmental Design (LEED) certification. However, without a regulatory
DRAFT
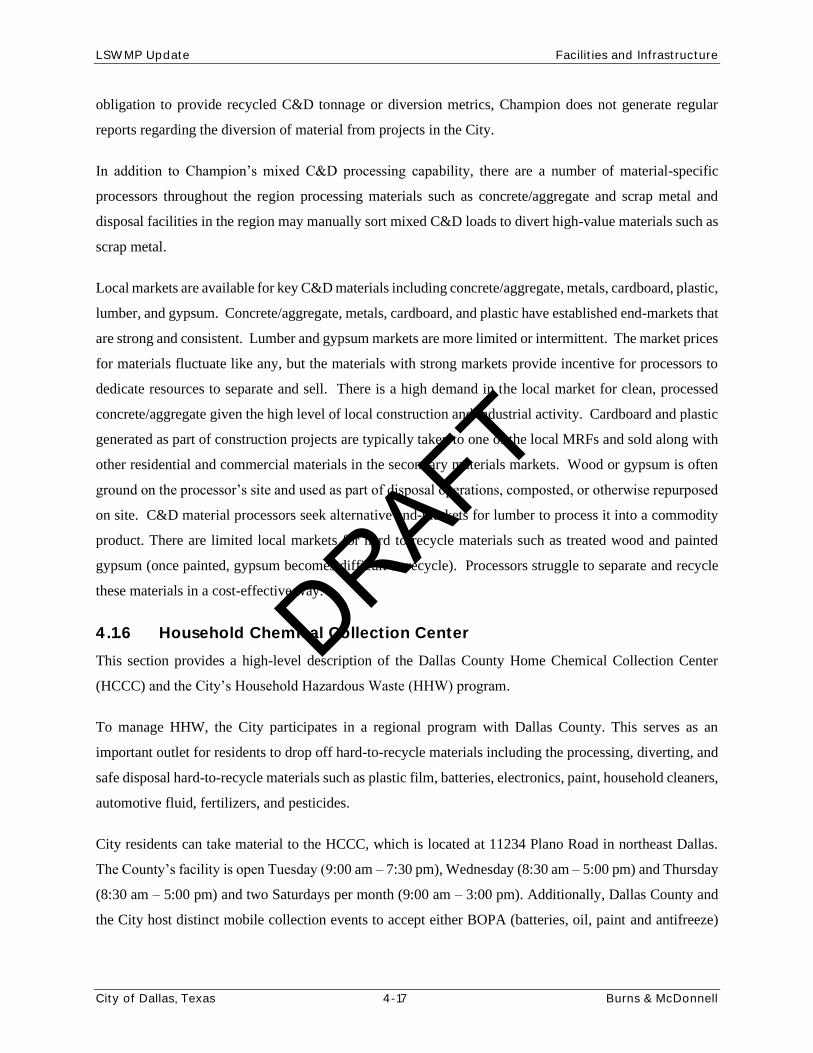
LSWMP Update Facilities and Infrastructure
City of Dallas, Texas 4-17 Burns & McDonnell
obligation to provide recycled C&D tonnage or diversion metrics, Champion does not generate regular
reports regarding the diversion of material from projects in the City.
In addition to Champion’s mixed C&D processing capability, there are a number of material-specific
processors throughout the region processing materials such as concrete/aggregate and scrap metal and
disposal facilities in the region may manually sort mixed C&D loads to divert high-value materials such as
scrap metal.
Local markets are available for key C&D materials including concrete/aggregate, metals, cardboard, plastic,
lumber, and gypsum. Concrete/aggregate, metals, cardboard, and plastic have established end-markets that
are strong and consistent. Lumber and gypsum markets are more limited or intermittent. The market prices
for materials fluctuate like any, but the materials with strong markets provide incentive for processors to
dedicate resources to separate and sell. There is a high demand in the local market for clean, processed
concrete/aggregate given the high level of local construction and industrial activity. Cardboard and plastic
generated as part of construction projects are typically taken to one of the local MRFs and sold along with
other residential and commercial materials in the secondary materials markets. Wood or gypsum is often
ground on the processor’s site and used as part of disposal operations, composted, or otherwise repurposed
on site. C&D material processors seek alternative end-markets for lumber to process it into a commodity
product. There are limited local markets for hard to recycle materials such as treated wood and painted
gypsum (once painted, gypsum becomes difficult to recycle). Processors struggle to separate and recycle
these materials in a cost-effective way.
4.1.6 Household Chemical Collection Center
This section provides a high-level description of the Dallas County Home Chemical Collection Center
(HCCC) and the City’s Household Hazardous Waste (HHW) program.
To manage HHW, the City participates in a regional program with Dallas County. This serves as an
important outlet for residents to drop off hard-to-recycle materials including the processing, diverting, and
safe disposal hard-to-recycle materials such as plastic film, batteries, electronics, paint, household cleaners,
automotive fluid, fertilizers, and pesticides.
City residents can take material to the HCCC, which is located at 11234 Plano Road in northeast Dallas.
The County’s facility is open Tuesday (9:00 am – 7:30 pm), Wednesday (8:30 am – 5:00 pm) and Thursday
(8:30 am – 5:00 pm) and two Saturdays per month (9:00 am – 3:00 pm). Additionally, Dallas County and
the City host distinct mobile collection events to accept either BOPA (batteries, oil, paint and antifreeze)
DRAFT
LSWMP Update Facilities and Infrastructure
City of Dallas, Texas 4-18 Burns & McDonnell
or HHW materials meant to provide more convenient access for City residents who do not live near the
HCCC.
Dallas County began offering a regional HHW program in 1997 and has owned and operated its permanent
HCCC since 2002. The program offers facility drop-off of material to residents of its 16 participating cities
(including Dallas), as well as hosting large mobile events and “mini” mobile events per year (separate from
the City’s BOPA mobile collection events). The County bills participating cities on a monthly basis after
actual costs are assessed. Costs for each City are divided into operating costs, based on the City’s
population, and disposal costs, based on the City’s actual participation for each billing period. The current
agreement with the County expires in 2023, at which point the City will need to determine if it should
continue participating in the current HHW program or identify alternative approaches to managing HHW
materials.
Further detail and evaluation related to the City’s current HHW program and future considerations are
provided in Section 12.0
4.2 Public-Private Partnerships
The City has engaged in PPPs to develop materials management infrastructure and may take this approach
to develop facilities going forward to meet future disposal and processing needs.
PPPs can be an effective model to provide needed infrastructure without the full financial risk falling on
either the City or the private business. Effective PPP exist when both local governments and the private
industry collaborate to share resources, capital investment, risk, and revenue. When considering a public-
private partnership, a local government should consider the degree to which it wants to be involved in the
operations and capital investment of a facility.
There are advantages and disadvantages to the different types of arrangements and which entity takes
ownership of the land, capital investment, and operations. While the processing services agreement is the
most common option, public-private partnerships are gaining more appeal as a means to share risk among
market volatility. Table 4-6 provides an overview of the different public-private partnership options
available to local governments and private businesses.
DRAFT
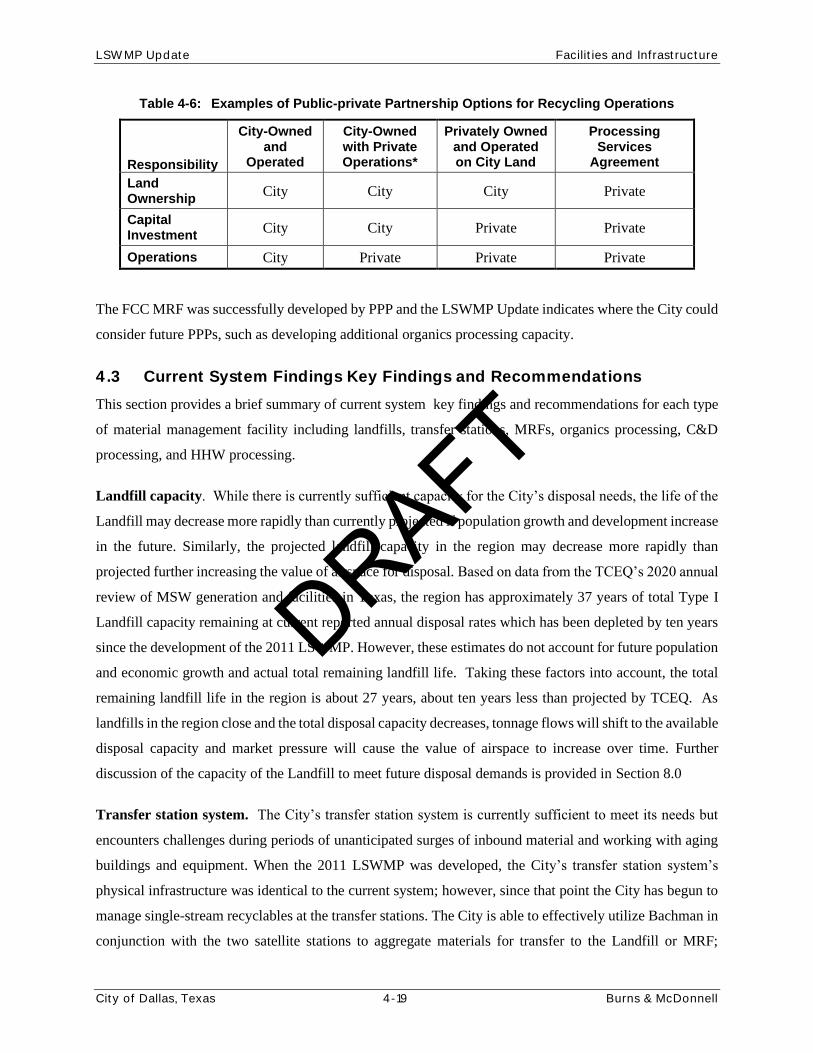
LSWMP Update Facilities and Infrastructure
City of Dallas, Texas 4-19 Burns & McDonnell
Table 4-6: Examples of Public-private Partnership Options for Recycling Operations
Responsibility
City-Owned and
Operated
City-Owned with Private Operations*
Privately Owned and Operated on City Land
Processing Services
Agreement
Land Ownership
City City City Private
Capital Investment
City City Private Private
Operations City Private Private Private
The FCC MRF was successfully developed by PPP and the LSWMP Update indicates where the City could
consider future PPPs, such as developing additional organics processing capacity.
4.3 Current System Findings Key Findings and Recommendations
This section provides a brief summary of current system key findings and recommendations for each type
of material management facility including landfills, transfer stations, MRFs, organics processing, C&D
processing, and HHW processing.
Landfill capacity. While there is currently sufficient capacity for the City’s disposal needs, the life of the
Landfill may decrease more rapidly than currently projected if population growth and development increase
in the future. Similarly, the projected landfill capacity in the region may decrease more rapidly than
projected further increasing the value of airspace for disposal. Based on data from the TCEQ’s 2020 annual
review of MSW generation and facilities in Texas, the region has approximately 37 years of total Type I
Landfill capacity remaining at current reported annual disposal rates which has been depleted by ten years
since the development of the 2011 LSWMP. However, these estimates do not account for future population
and economic growth and actual total remaining landfill life. Taking these factors into account, the total
remaining landfill life in the region is about 27 years, about ten years less than projected by TCEQ. As
landfills in the region close and the total disposal capacity decreases, tonnage flows will shift to the available
disposal capacity and market pressure will cause the value of airspace to increase over time. Further
discussion of the capacity of the Landfill to meet future disposal demands is provided in Section 8.0
Transfer station system. The City’s transfer station system is currently sufficient to meet its needs but
encounters challenges during periods of unanticipated surges of inbound material and working with aging
buildings and equipment. When the 2011 LSWMP was developed, the City’s transfer station system’s
physical infrastructure was identical to the current system; however, since that point the City has begun to
manage single-stream recyclables at the transfer stations. The City is able to effectively utilize Bachman in
conjunction with the two satellite stations to aggregate materials for transfer to the Landfill or MRF;
DRAFT
LSWMP Update Facilities and Infrastructure
City of Dallas, Texas 4-20 Burns & McDonnell
however during surges of higher than typical inbound volume, the transfer station system struggles to
complete daily operations. While Bachman and the satellite transfer stations support the City’s current
transfer needs for both refuse and recycling (and occasionally brush and bulky loads, as needed) during
typical operations, the transfer station system requires extending working hours to manage material when
it becomes inundated during unanticipated surges in volume.
Further discussion of the capacity of the transfer station system to meet future material management
demands is provided in Section 5.0.
FCC MRF. The current agreement with FCC has been sufficient to meet the City’s recycling processing
needs. Although there are times when the facility has become fully utilized, there has been few instances
of sustained unplanned downtime and the facility continues to accept and process the City-delivered
material. However, if the City were to implement a policy that increased the amount of commercial
recycling flowing to the FCC MRF, the capacity made available for the City’s curbside single-stream
collection will become constrained and would require that recycling material collected by the City be stored
using the transfer station system. Further discussion of the current agreement and capacity of the FCC MRF
to meet future single-stream recycling processing demands is provided in Section 9.0.
Organics processing. The City’s current contract to grind clean yard waste and wood waste delivered to
the Landfill is sufficient to meet the City’s needs. When the 2011 LSWMP was developed, the City
processed yard waste and brush material either at Bachman or the Landfill on an as-needed basis and co-
collected bulky items and brush were not diverted from disposal. Since then, the grinding operation has
become more consistent but bulky items and brush are still not diverted from disposal. Among the organics
processing operators in the region, there is limited capacity for accepting additional third-party material and
operators carefully consider specification of any unprocessed material that is accepted to avoid challenges
related to high levels of contamination. The SS WWTP has available capacity to accept organics material
from high volume generators of food waste which could boost biogas generation from anaerobic digestion;
however, this material must be pre-processed to remove inorganic contaminants and ground into a slurry
before it can be pumped into SS WWTP. but requires Additionally, the SS WWTP would require further
infrastructure development to accept this material delivered this way. Further discussion and evaluation of
the organics processing is provided in Section 10.0.
C&D disposal and processing. The current capacity for C&D disposal in the region has been sufficient
to meet the City’s needs. Although there is still an estimated 57 years of Type IV landfill capacity in the
region, as Type I landfills close the tonnage directed to Type IV facilities may accelerate the depletion of
the region’s Type IV landfill capacity. The only mixed C&D materials recovery facility in the region is
DRAFT

LSWMP Update Facilities and Infrastructure
City of Dallas, Texas 4-21 Burns & McDonnell
Champion Waste & Recycling’s Town & Country Recycling Facility. In addition to Champion’s mixed
C&D processing capability, there are a number of material-specific processors throughout the region
processing materials such as concrete/aggregate and scrap metal and disposal facilities in the region may
manually sort mixed C&D loads to divert high-value materials such as scrap metal.
HCCC facility and BOPA events. The current agreement with Dallas County to operate the HCCC and
City-hosted BOPA events are able to meet the City’s HHW management needs. Since the agreement with
Dallas County expires in the next two years, the City needs to determine if the current arrangement will
support the City’s future HHW management needs. Further discussion and evaluation of the City’s future
HHW management needs and options is provided in Section 12.0.
DRAFT
LSWMP Update Transfer Station System
City of Dallas, Texas 5-1 Burns & McDonnell
5.0 TRANSFER STATION SYSTEM
The transfer station system is critical to the long-term material management needs of the City and supports
the collection operations to minimize the environmental impact and maximize operational efficiency and
supports the capabilities of the services offered by the Sanitation Department and OEQS. The City must
support the aging transfer station system to ensure it can be utilized on a sustained, long term basis to meet
the operational, financial and environmental needs to reach Zero Waste.
Further detailed technical evaluation of the transfer station system collection operation is provided in
Appendix C. City has evaluated several potential options to support the immediate and long-term needs of
the transfer station system.:
5.1 Current System Review
The transfer station system consists of the City’s three transfer station facilities that collectively shorten
haul times for the Sanitation Department’s collection system. All materials accepted at the transfer stations
are hauled to the Landfill for disposal and to the MRF for recycling. The transfer stations are operated via
City-owned equipment and City personnel. The transfer stations are geographically located in the northeast,
northwest and southwest areas of the City, allowing for more efficient transfer and disposal of material.
The transfer station system consists of three transfer stations including Bachman, the largest facility in the
northwest region of the City, and two smaller transfer stations called Fair Oaks and Westmoreland facilities
located in the northeast and southwest regions of the City, respectively. Figure 5-1 shows the location of
the City’s transfer stations. DRAFT
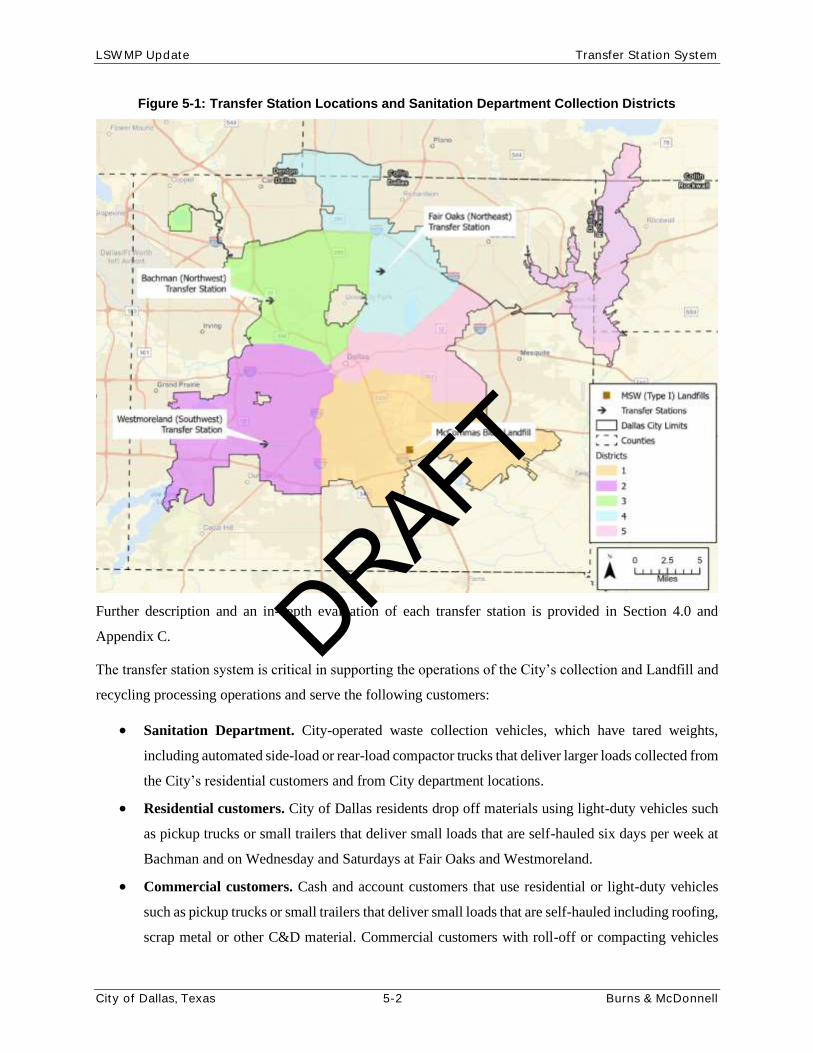
LSWMP Update Transfer Station System
City of Dallas, Texas 5-2 Burns & McDonnell
Figure 5-1: Transfer Station Locations and Sanitation Department Collection Districts
Further description and an in-depth evaluation of each transfer station is provided in Section 4.0 and
Appendix C.
The transfer station system is critical in supporting the operations of the City’s collection and Landfill and
recycling processing operations and serve the following customers:
• Sanitation Department. City-operated waste collection vehicles, which have tared weights,
including automated side-load or rear-load compactor trucks that deliver larger loads collected from
the City’s residential customers and from City department locations.
• Residential customers. City of Dallas residents drop off materials using light-duty vehicles such
as pickup trucks or small trailers that deliver small loads that are self-hauled six days per week at
Bachman and on Wednesday and Saturdays at Fair Oaks and Westmoreland.
• Commercial customers. Cash and account customers that use residential or light-duty vehicles
such as pickup trucks or small trailers that deliver small loads that are self-hauled including roofing,
scrap metal or other C&D material. Commercial customers with roll-off or compacting vehicles
DRAFT
LSWMP Update Transfer Station System
City of Dallas, Texas 5-3 Burns & McDonnell
are accepted at Bachman. City-operated light-duty or pickup vehicles providing material generated
from various City department operations (e.g., parks and recreation) are included with commercial
customers.
The transfer station system was originally designed and constructed in the late 1970’s and early 1980’s to
only accept refuse. Since then, recycling program have become introduced as part of standard solid waste
systems and the transfer stations now accept both recycling and brush/bulk material. This has created
challenges leveraging the transfer station system to maximize current and future diversion from the Landfill.
As part of the LSWMP Update, operations were observed including a review of key daily activities and
discussions with transfer station staff and management. The following lists key challenges identified as part
the analysis provided in Appendix C and informed by discussions with transfer station system staff and
management:
• Managing multiple material streams and customer types reduces the City’s ability to utilize full
permitted capacity of transfer station system
• Unexpected changes on number and timing of inbound loads create challenges to manage and
process material safely and efficiently.
• With more volume than expected is delivered, staff is not able to transfer material out of facility
quickly enough and are forced to store material on the tipping floor, which constrains space and
increases customer queues.
• With less volume than expected is delivered, heavy equipment operators and transfer trailers sit
idle waiting for material to arrive.
• Material is stored in the pit and on the transfer floor on Monday and Tuesday at Bachman then
operators manage and transfer the stored material later in the week contributing to space constraints
in the transfer building.
• The vehicle scales and scalehouse designs cause increased wait times at facilities and transfer trailer
scales are on a separate system than inbound customer scales.
• Truck drivers and crew leaders are working positions and are expected to fill in as heavy equipment
operators at times of peak tonnage flows minimizing the capacity for transfer fleet to be responsive
during peak tonnage flows.
• Equipment not optimal size for certain materials (e.g., loads from 60 CY brush trucks are larger
than some wheel loaders can manage in one push) and others require upgrade to key components
in-house to proactively minimize maintenance needs and damage to transfer building floors.
• Transfer fleet trucks and drivers are dispatched to Bachman and a designated small satellite facility,
but may be forced to operate reactively and “chase waste” when material flows fluctuate from
DRAFT
LSWMP Update Transfer Station System
City of Dallas, Texas 5-4 Burns & McDonnell
anticipated inbound volumes, limiting management’s flexibility to adapt when inbound flows
change unexpectedly. This is particularly challenging for transfer trucks designated to haul
recyclables based on changing tonnage flows.
Further detailed information and analysis related to these challenges are provided in Appendix C.
5.2 Evaluation of 2011 LSWMP Recommendations
This section evaluates the recommendations presented in the 2011 LSWMP, indicating the progress that
has been made toward the recommended policies and/or programs. Additionally, this section identifies any
fundamental changes that have been made related to programs, policies or forecasts as it relates to the
transfer station system and consistency with CECAP goals.
Table 5-1 lists the recommendations from the 2011 LSWMP related to the transfer station system with a
brief description of progress to date and potential next steps as part of the LSWMP Update.
Table 5-1: Evaluation of 2011 LSWMP Recommendations
In the 2011 LSWMP the capacity of the transfer station system was deemed to be sufficient to manage
operations and support the City to achieve its Zero Waste goals. Based on the evaluation of the transfer
station system, the introduction of multiple material streams has significantly impacted the capacity of the
transfer station system to manage material streams separately for recycling. Without the ability to manage
multiple materials effectively among the transfer stations, the City has struggled to meet goals identified in
the 2011 LSMWP and there are instances when the system is unable to meet the current service demand
during surges in tonnage, most notably at Bachman.
2011 LSWMP Recommendation
Progress to date Potential Next Steps
Assess methods to optimize the
available disposal capacity.
Unable to maximize capacity of
current system due to delivery
of multiple material streams.
Evaluate capital and operational
changes to maximize existing
capacity.
Maintain transfer station
capacity to reduce effects of
traffic and air quality impacts.
Utilize transfer station system to
minimize environmental
impacts of transportation.
Evaluate options to maintain
sufficient capacity to meet future
needs, especially for new
material types (e.g., separately
collected brush, food waste)
Develop other infrastructure, as
needed, to implement plan.
Current infrastructure aging and
not able to efficiently process
multiple material types.
Evaluate option to develop new
transfer station or rebuild on
existing sites.
DRAFT
LSWMP Update Transfer Station System
City of Dallas, Texas 5-5 Burns & McDonnell
CECAP set goals to recycle 35 percent of organic waste, 60 percent of paper waste and achieve a 35 percent
reduction of waste landfilled by 2030. The City must address the challenges with the transfer station system
to be in a position to achieve these goals in the time frame established by CECAP.
5.3 Case Studies
This section provides descriptions of transfer stations that demonstrate configurations or operational
considerations that would support the City’s long-term planning needs related to the future of the transfer
station system. The following section provide perspective about separating customers by type and multi-
material streams.
5.3.1 Separating Customers by Type
Separating customers by type is a key consideration for the City and is a challenge shared by other transfer
station facilities. The Bow Lake Recycling & Transfer Station located in King County, Washington is an
example of a facility that was designed and constructed to intentionally separate self-haul or manual unload
customers from large compacting solid waste vehicles. The facility opened in 2012, with expanded
recycling added in 2013, and replaced an older 33,000 square foot station built in 1977. The upgraded
transfer building is approximately 68,000 square feet, processes approximately 267,000 tons annually and
cost approximately $88 million when constructed55. The high capital cost may be due in part to the multiple
operational areas of the facility segregated by customer type and sophisticated traffic control system. Error! R
eference source not found. shows the facility layout of the Bow Lake Recycling & Transfer Station.
55 More information about the Bow Lake Recycling & Transfer station is available at the following links:
https://kingcounty.gov/~/media/depts/dnrp/solid-waste/facilities/documents/factsheet-Bow-Lake.ashx?la=en
https://interfaceengineering.com/work/bow-lake-transfer-and-recycling-station
DRAFT
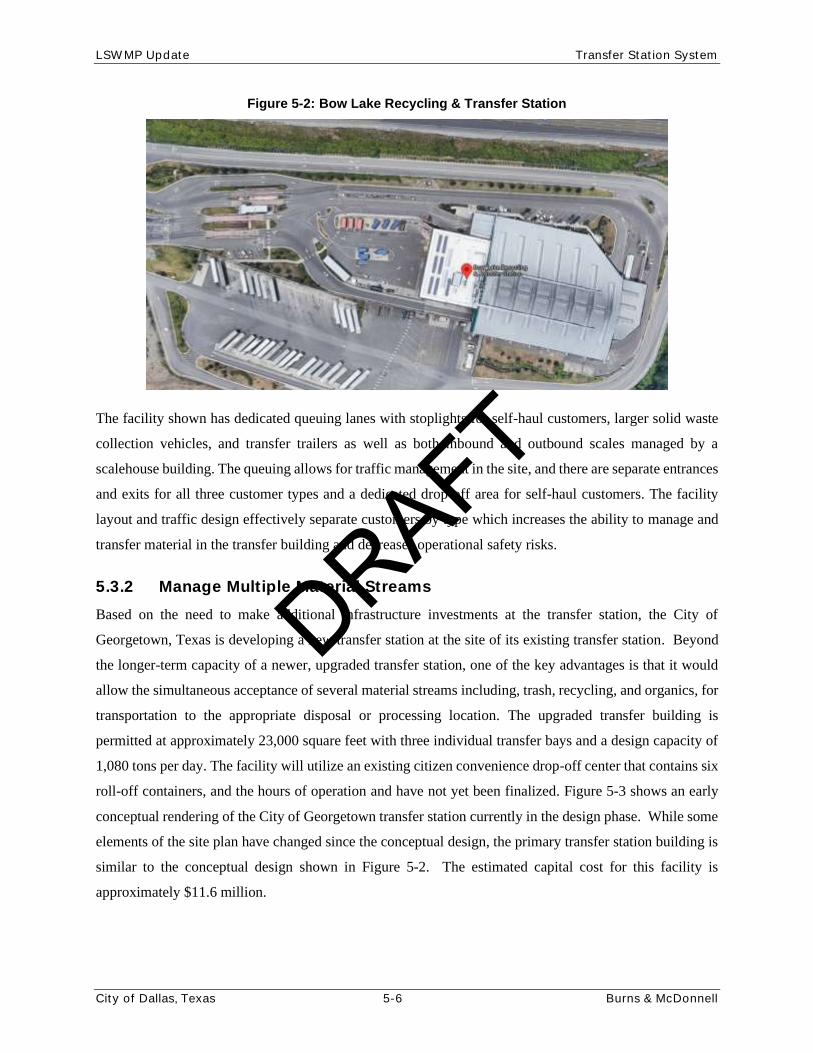
LSWMP Update Transfer Station System
City of Dallas, Texas 5-6 Burns & McDonnell
Figure 5-2: Bow Lake Recycling & Transfer Station
The facility shown has dedicated queuing lanes with stoplights for self-haul customers, larger solid waste
collection vehicles, and transfer trailers as well as both inbound and outbound scales managed by a
scalehouse building. The queuing allows for traffic management in the site, and there are separate entrances
and exits for all three customer types and a dedicated drop-off area for self-haul customers. The facility
layout and traffic design effectively separate customers by type which increases the ability to manage and
transfer material in the transfer building and decreases operational safety risks.
5.3.2 Manage Multiple Material Streams
Based on the need to make additional infrastructure investments at the transfer station, the City of
Georgetown, Texas is developing a new transfer station at the site of its existing transfer station. Beyond
the longer-term capacity of a newer, upgraded transfer station, one of the key advantages is that it would
allow the simultaneous acceptance of several material streams including, trash, recycling, and organics, for
transportation to the appropriate disposal or processing location. The upgraded transfer building is
permitted at approximately 23,000 square feet with three individual transfer bays and a design capacity of
1,080 tons per day. The facility will utilize an existing citizen convenience drop-off center that contains six
roll-off containers, and the hours of operation and have not yet been finalized. Figure 5-3 shows an early
conceptual rendering of the City of Georgetown transfer station currently in the design phase. While some
elements of the site plan have changed since the conceptual design, the primary transfer station building is
similar to the conceptual design shown in Figure 5-2. The estimated capital cost for this facility is
approximately $11.6 million.
DRAFT
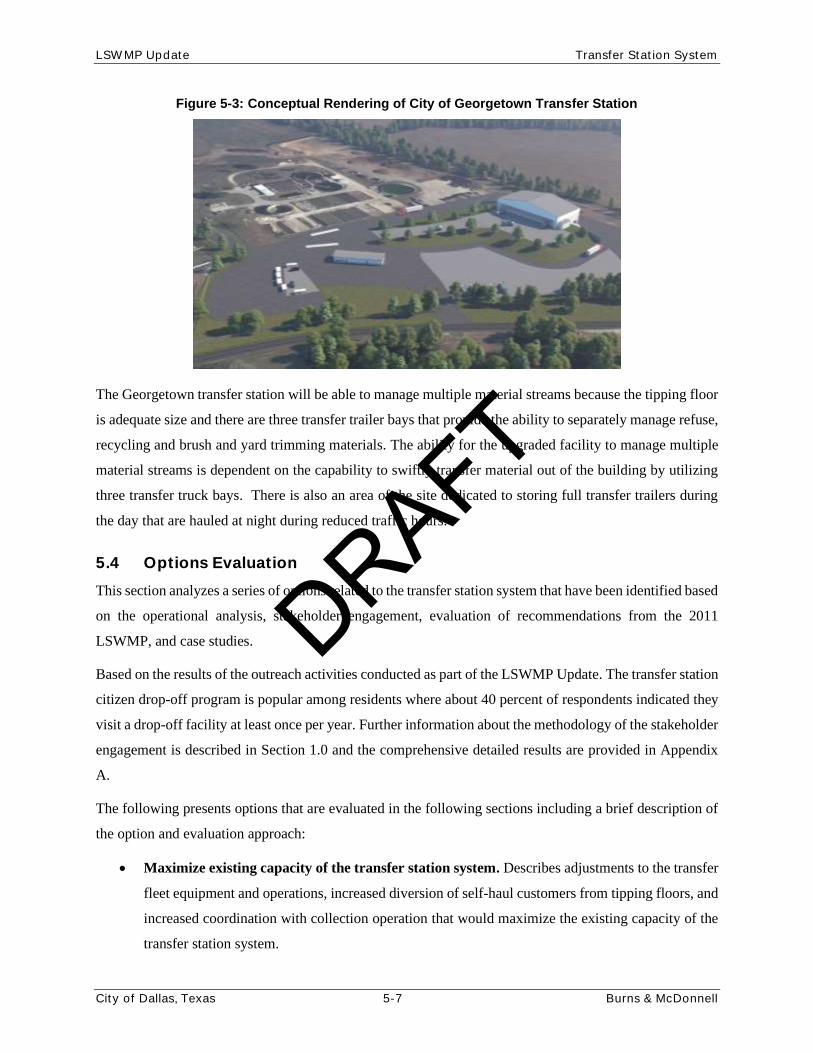
LSWMP Update Transfer Station System
City of Dallas, Texas 5-7 Burns & McDonnell
Figure 5-3: Conceptual Rendering of City of Georgetown Transfer Station
The Georgetown transfer station will be able to manage multiple material streams because the tipping floor
is adequate size and there are three transfer trailer bays that provide the ability to separately manage refuse,
recycling and brush and yard trimming materials. The ability for the upgraded facility to manage multiple
material streams is dependent on the capability to swiftly transfer material out of the building by utilizing
three transfer truck bays. There is also an area of the site dedicated to storing full transfer trailers during
the day that are hauled at night during reduced traffic hours.
5.4 Options Evaluation
This section analyzes a series of options related to the transfer station system that have been identified based
on the operational analysis, stakeholder engagement, evaluation of recommendations from the 2011
LSWMP, and case studies.
Based on the results of the outreach activities conducted as part of the LSWMP Update. The transfer station
citizen drop-off program is popular among residents where about 40 percent of respondents indicated they
visit a drop-off facility at least once per year. Further information about the methodology of the stakeholder
engagement is described in Section 1.0 and the comprehensive detailed results are provided in Appendix
A.
The following presents options that are evaluated in the following sections including a brief description of
the option and evaluation approach:
• Maximize existing capacity of the transfer station system. Describes adjustments to the transfer
fleet equipment and operations, increased diversion of self-haul customers from tipping floors, and
increased coordination with collection operation that would maximize the existing capacity of the
transfer station system.
DRAFT
LSWMP Update Transfer Station System
City of Dallas, Texas 5-8 Burns & McDonnell
• Upgrade site layout and/or transfer buildings. Evaluates impact of upgrading existing facilities
to overcome existing challenges.
• Separately receive and process brush and yard trimmings. Evaluates the impact on operations
to manage material streams for processing in the transfer station system including separate handling
of brush and yard trimmings using the existing equipment and staffing resources available.
• Major expansion or rebuild of Bachman. Describes a major expansion or rebuild of Bachman
that would support the long-term needs of the City, including any future programs developed.
Each of the following sections provide an overview of each option and specific tactics and evaluates the
impact of each options’ components based on the criteria detailed in Section 1.4.3. A high-level summary
of the evaluation criteria for each tactic within the options is provided in Section 5.5 to support the key
findings, recommendations and implementation and funding plan.
5.4.1 Maximize Existing Capacity
Overview. Maximizing the existing capacity among the transfer station system without expanding the
existing transfer buildings can be accomplished with the following approaches:
• Increase number of transfer trucks, trailers and drivers. The City currently has 26 transfer
trucks and trailers and 18 drivers56. Based on the evaluation provided in Appendix C, if the City
were to increase the number of transfer trucks, trailers and drivers by they would be able to better
meet surge demands and more proactively deploy equipment and drivers rather than reacting to
real-time needs that cause challenges transferring material out of the facility. The City should
consider multiple trailer types to increase the ability to transfer the current and future material
streams that may require separate transfer including the following:
o Tipper trailer. Tipper trailers can haul refuse and brush and bulky items for disposal at
the Landfill because they have access to trailer tipper equipment.
o Ejector trailer. Ejector trailers are the only ones that can haul recycling because there is
no trailer tipper at the FCC MRF.
• Adjust operations to store material in transfer trailers on site. With more transfer trucks,
trailers and drivers, City staff would increase equipment availability and have a higher degree of
flexibility to manage materials into transfer trailers for storage to minimize storing material in the
transfer building. To accomplish this, transfer station operators would store material utilizing idle
56 City staff has received approval to hire five additional truck drivers and purchase three new trucks and six new
trailers (three for refuse and three ejector trailers). If successfully hired, the number of FTEs will increase to 22, the
number of trucks will increase to 29 and number of trailers will increase by 32.
DRAFT
LSWMP Update Transfer Station System
City of Dallas, Texas 5-9 Burns & McDonnell
transfer trailers, maneuvering and staging them on-site with a yard tractor to and hauling the
transfer trailers to the Landfill for disposal after the transfer stations are closed to customers for
the day. This would allow materials to be moved out of the transfer buildings the same day they
are delivered to minimize overnight storage of in the transfer buildings, but may require a modified
permit that supports storing material in trailers as part of the operations. The adjusted operations
would be most applicable at Bachman.
• Separate Sanitation Department vehicles from self-haul and manual unloading customers.
Separating Sanitation Department vehicles from self-haul or manual unloading customers is
critical to maintaining a safe operating environment in the transfer buildings by reducing excess
traffic and maintaining a physical separation between these customers and larger collection
vehicles. This is most important at Bachman due to the current practice of storing material in the
building throughout the week. When the pit and tipping floor are used to store material, the space
constraints increase the risk for vehicle collisions or damage to the transfer building. Separating
customer types can be accomplished by increasing the number of staff or upgrading the scalehouse
at the entrance of Bachman to manage the flow of self-haul and manual unload customers into the
building. This would allow the City to reserve adequate unloading space for Sanitation
Department vehicles. Holding self-haul or manual unload customers near the entrance to Bachman
would provide an opportunity to request customers take better advantage of the Dry Gulch drop-
off facility instead of entering the transfer building, as applicable, and collect data to track the
number of times customers have used the facility to streamline billing processes and other
information that would support capital upgrades to the Dry Gulch drop-off facility.
• Increase coordination with collection operation. Increasing the frequency of communication
between transfer station supervisors and collection supervisors to provide accurate estimates of
when Sanitation Department vehicles are expected to arrive at a transfer station would increase the
capability of City staff to make proactive and real-time operational adjustments to clear material
from tipping areas as soon as it is delivered. Increased communications could be accomplished via
dedicated radios and leveraging on-board equipment to identify changes in expected route
completion time on a real-time basis (e.g., equipment breakdown, unanticipated high levels of
traffic, etc.).
Recycling potential. Maximizing the existing capacity of the transfer station system to support processing
of yard trimmings, brush or other organic materials on a separated basis provides high diversion recycling
potential.
DRAFT
LSWMP Update Transfer Station System
City of Dallas, Texas 5-10 Burns & McDonnell
Operational impact. Increasing the equipment and staffing to clear the transfer floor daily and more
frequently communicating with the collection operation minimizes safety risks and reduces overtime
demand required to clear material stored in transfer buildings throughout the work week. Storing material
in extra trailers on site may present challenges due to space constraints at transfer stations and adjustments
to the typical hauling operating schedule to work at night. Separating customer types at transfer stations
would increase the amount of floor space available so that the City could consider managing material types
separately, particularly during surges in material. If the refuse and recycling collection program transitions
to five day per week collection (reference Section 6.4.1), residents may be able to be accepted at the transfer
stations before Sanitation Department vehicles arrive (e.g., between 7:00 AM and 10:00 AM).Overall,
maximizing existing capacity would have a medium operational impact because it would require additional
staff and equipment to operate transfer trucks and provide traffic control, but would allow the transfer
station system to manage additional material while minimizing overtime demand.
Financial impact. Maximizing the existing capacity would require the purchase of additional equipment
(e.g., transfer trailers or yard tractors), staff and pursuing small to medium-sized capital projects (e.g.,
upgrading scalehouse system at Bachman). The financial impact of this option is less than building upgrades
or site re-designs efforts, and therefore this option would have a medium financial impact.
Environmental impact. Maximizing existing capacity would allow separate management of more
recycling and brush and yard trimmings. If material is recycled or composted rather than disposed the City
would realize environmental benefits and the option would have a low impact.
Policy impact. Better tracking the number of uses by customer at the transfer stations would allow the City
to better regulate customers that are frequent users of the disposal allowance provided by the City. There
would be a medium policy impact if the City enforces the maximum number of uses throughout the transfer
station system by turning away customers that utilize the free residential drop-off program excessively and
contribute to the traffic congestion among facilities.
Stakeholder “buy-in”. There is medium stakeholder buy-in on this option because while there is a high
level of buy-in for increasing the capacity of the transfer stations but , there is lower buy-in from an
operational perspective related to space constraints of storing material in idle transfer trailers on site and
hauling material at night. Additionally, enforcing a maximum number of uses of the residential drop-off
program may result in backlash due to perceived reduction in service.
Compatibility with existing programs. This option has a medium compatibility with existing programs
because there would be changes in hauling operations, traffic control, and enforcing a maximum number
of uses of the residential drop-off program.
DRAFT
LSWMP Update Transfer Station System
City of Dallas, Texas 5-11 Burns & McDonnell
5.4.2 Upgrade Site Layout and/or Transfer Buildings
Overview. Upgrading the transfer building and/or equipment would help to overcome current challenges
and transition the transfer station system to meet the City’s long-term needs. Bachman, Fair Oak and
Westmoreland transfer buildings were constructed in 1978, 1969, and 1983, respectively. The transfer
stations in the system have undergone several upgrades since they were initially installed. Table 5-2
presents the challenges and recommended upgrades to address the challenges for each transfer station in
the system.
DRAFT
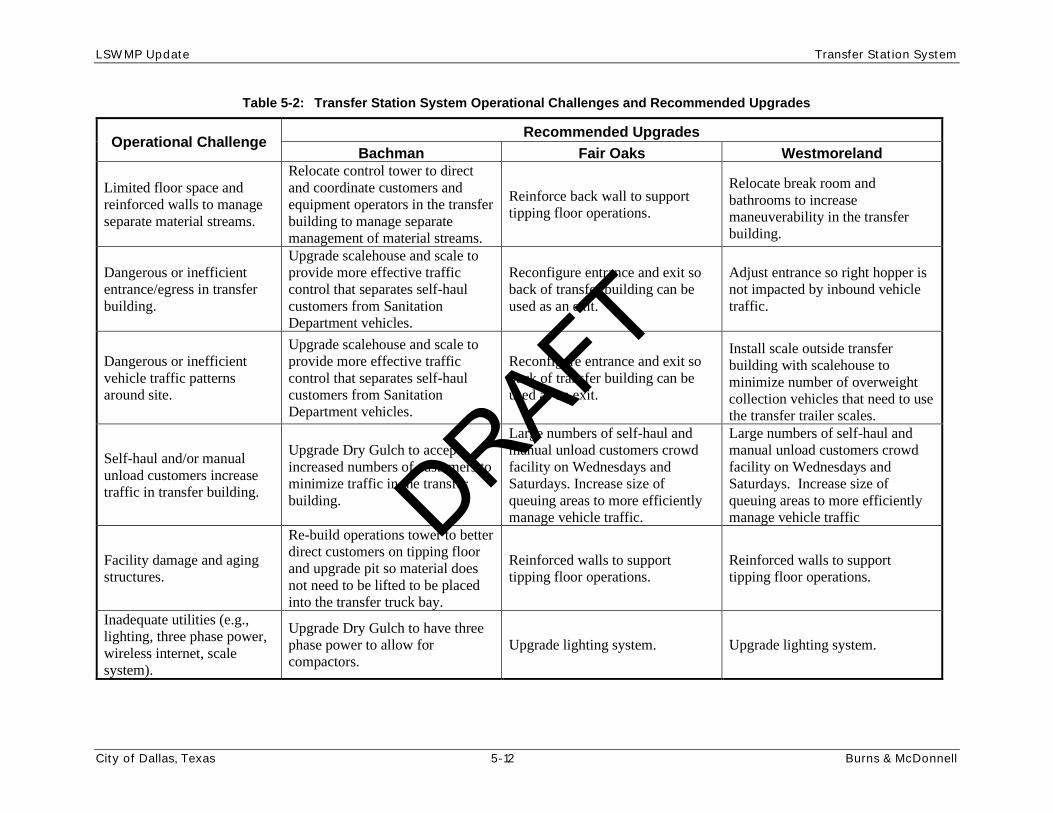
LSWMP Update Transfer Station System
City of Dallas, Texas 5-12 Burns & McDonnell
Table 5-2: Transfer Station System Operational Challenges and Recommended Upgrades
Operational Challenge Recommended Upgrades
Bachman Fair Oaks Westmoreland
Limited floor space and
reinforced walls to manage
separate material streams.
Relocate control tower to direct
and coordinate customers and
equipment operators in the transfer
building to manage separate
management of material streams.
Reinforce back wall to support
tipping floor operations.
Relocate break room and
bathrooms to increase
maneuverability in the transfer
building.
Dangerous or inefficient
entrance/egress in transfer
building.
Upgrade scalehouse and scale to
provide more effective traffic
control that separates self-haul
customers from Sanitation
Department vehicles.
Reconfigure entrance and exit so
back of transfer building can be
used as an exit.
Adjust entrance so right hopper is
not impacted by inbound vehicle
traffic.
Dangerous or inefficient
vehicle traffic patterns
around site.
Upgrade scalehouse and scale to
provide more effective traffic
control that separates self-haul
customers from Sanitation
Department vehicles.
Reconfigure entrance and exit so
back of transfer building can be
used as an exit.
Install scale outside transfer
building with scalehouse to
minimize number of overweight
collection vehicles that need to use
the transfer trailer scales.
Self-haul and/or manual
unload customers increase
traffic in transfer building.
Upgrade Dry Gulch to accept
increased numbers of customers to
minimize traffic in the transfer
building.
Large numbers of self-haul and
manual unload customers crowd
facility on Wednesdays and
Saturdays. Increase size of
queuing areas to more efficiently
manage vehicle traffic.
Large numbers of self-haul and
manual unload customers crowd
facility on Wednesdays and
Saturdays. Increase size of
queuing areas to more efficiently
manage vehicle traffic
Facility damage and aging
structures.
Re-build operations tower to better
direct customers on tipping floor
and upgrade pit so material does
not need to be lifted to be placed
into the transfer truck bay.
Reinforced walls to support
tipping floor operations.
Reinforced walls to support
tipping floor operations.
Inadequate utilities (e.g.,
lighting, three phase power,
wireless internet, scale
system).
Upgrade Dry Gulch to have three
phase power to allow for
compactors.
Upgrade lighting system. Upgrade lighting system.
DRAFT
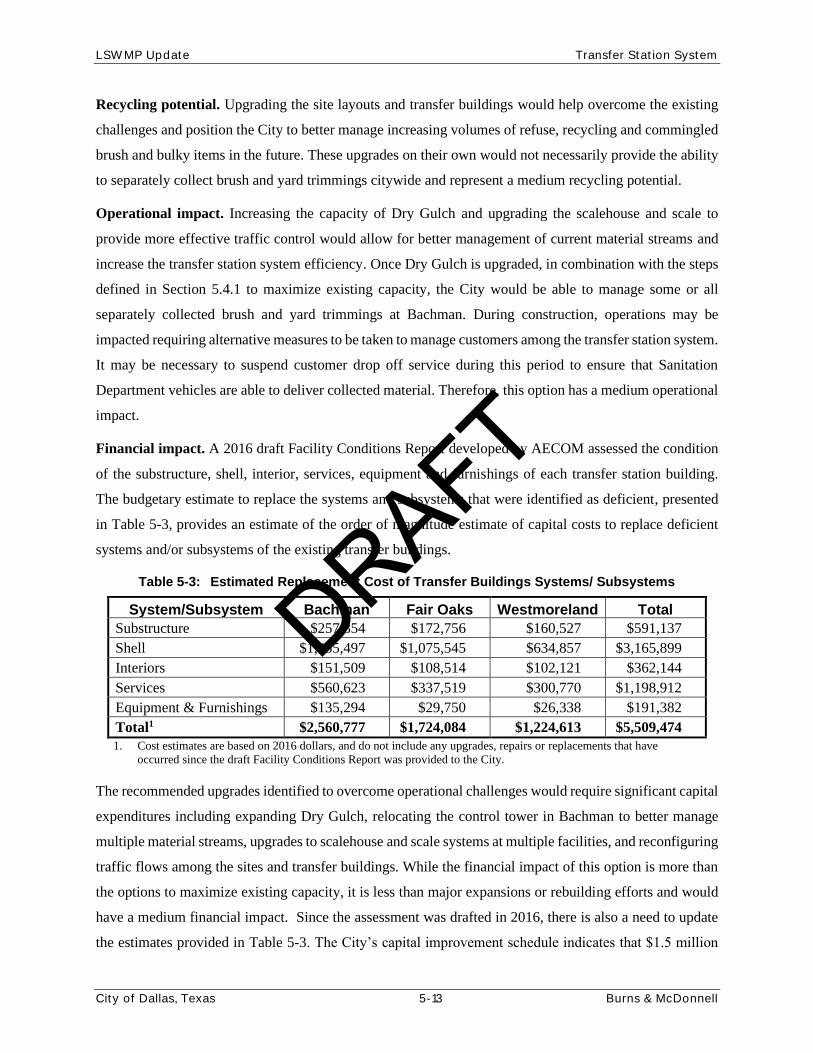
LSWMP Update Transfer Station System
City of Dallas, Texas 5-13 Burns & McDonnell
Recycling potential. Upgrading the site layouts and transfer buildings would help overcome the existing
challenges and position the City to better manage increasing volumes of refuse, recycling and commingled
brush and bulky items in the future. These upgrades on their own would not necessarily provide the ability
to separately collect brush and yard trimmings citywide and represent a medium recycling potential.
Operational impact. Increasing the capacity of Dry Gulch and upgrading the scalehouse and scale to
provide more effective traffic control would allow for better management of current material streams and
increase the transfer station system efficiency. Once Dry Gulch is upgraded, in combination with the steps
defined in Section 5.4.1 to maximize existing capacity, the City would be able to manage some or all
separately collected brush and yard trimmings at Bachman. During construction, operations may be
impacted requiring alternative measures to be taken to manage customers among the transfer station system.
It may be necessary to suspend customer drop off service during this period to ensure that Sanitation
Department vehicles are able to deliver collected material. Therefore, this option has a medium operational
impact.
Financial impact. A 2016 draft Facility Conditions Report developed by AECOM assessed the condition
of the substructure, shell, interior, services, equipment and furnishings of each transfer station building.
The budgetary estimate to replace the systems and subsystems that were identified as deficient, presented
in Table 5-3, provides an estimate of the order of magnitude estimate of capital costs to replace deficient
systems and/or subsystems of the existing transfer buildings.
Table 5-3: Estimated Replacement Cost of Transfer Buildings Systems/ Subsystems
The recommended upgrades identified to overcome operational challenges would require significant capital
expenditures including expanding Dry Gulch, relocating the control tower in Bachman to better manage
multiple material streams, upgrades to scalehouse and scale systems at multiple facilities, and reconfiguring
traffic flows among the sites and transfer buildings. While the financial impact of this option is more than
the options to maximize existing capacity, it is less than major expansions or rebuilding efforts and would
have a medium financial impact. Since the assessment was drafted in 2016, there is also a need to update
the estimates provided in Table 5-3. The City’s capital improvement schedule indicates that $1.5 million
System/Subsystem Bachman Fair Oaks Westmoreland Total
Substructure $257,854 $172,756 $160,527 $591,137
Shell $1,455,497 $1,075,545 $634,857 $3,165,899
Interiors $151,509 $108,514 $102,121 $362,144
Services $560,623 $337,519 $300,770 $1,198,912
Equipment & Furnishings $135,294 $29,750 $26,338 $191,382
Total1 $2,560,777 $1,724,084 $1,224,613 $5,509,474
1. Cost estimates are based on 2016 dollars, and do not include any upgrades, repairs or replacements that have
occurred since the draft Facility Conditions Report was provided to the City.
DRAFT
LSWMP Update Transfer Station System
City of Dallas, Texas 5-14 Burns & McDonnell
are budgeted to renovate Bachman to increase waste flow in FY 2023 and FY 2024, $1.8 million is budgeted
between FY 2022 and FY 2025 to provide repair and improvements to the transfer station facilities, and $1
million is budgeted between FY 2023 and FY 2024 to renovate Fair Oaks in combination with repairs to
the City’s Northeast Service Center.
Environmental impact. Upgrades to the transfer sites or buildings will allow continued management of
multiple material streams on a separated basis. Although there may be more vehicles or more hauling trips
required to transport separately managed material, if material is recycled or composted rather than disposed,
the City would realize environmental benefits and the option would have a low impact.
Policy impact. Upgrading the site layout and/or transfer buildings would have a low policy impact.
Stakeholder “buy-in”. Upgrading the site layout and/or transfer buildings would have a high level of
stakeholder “buy-in” since it would help overcome the existing operational challenges.
Compatibility with existing programs. Upgrades indicated would help overcome existing operational
challenges in line with existing programs.
5.4.3 Separately Receive and Process Brush and Yard Trimmings
Overview. As part of this option City crews would separately collect brush and yard trimming material
using the existing equipment and staffing and the option would require Bachman to receive, store, handle,
and transfer material without commingling the material with refuse, recycling, or mixed brush and bulky
items. The Fair Oaks and Westmoreland facilities are not configured to receive large brush loads in addition
to the refuse and recycling material that is currently delivered. At Bachman, dedicated transfer trailers
would need to be re-allocated from their current roles to haul separated brush material to a processing
facility with a trailer tipping equipment, since ejector trailers are required to transfer recycling materials.
This additional material stream would need to be processed inside the transfer building, since brush material
cannot be stored outside the transfer building.
Recycling potential. If Bachman were able to separately manage and transfer brush material, the total tons
of clean brush that could be collected and potentially recycled is estimated as 45 percent of the current
brush and bulky items collected, or about 69,000 tons per year, and has high recycling potential57.
Operational impact. To separately receive, store and transfer about 69,000 tons per year of source
separated brush delivered to Bachman, there would need to be a dedicated area of floor space and between
one to three transfer trucks, trailers and drivers to haul material to a composting facility, depending on the
57 Tonnage range based on estimated percentage of clean brush set out as part of the separated brush collection pilot.
Further discussion of the results of the separated brush collection pilot is provided in Section 7.2.
DRAFT
LSWMP Update Transfer Station System
City of Dallas, Texas 5-15 Burns & McDonnell
volume of brush separately collected. Although the total tons of material processed through Bachman would
not increase substantially, there would be an increase in the number of inbound vehicles based on separate
collection of brush/yard trimmings and bulky items. This would have a high operational impact due to
increased vehicle traffic in the transfer building and because the hauling operation would need to haul the
materials separately, requiring more trips from Bachman to the processing and/or disposal facility. The
additional effort to manage this material separately would potentially increase the volume of material that
is stored in the transfer building throughout the week and increase the risk of vehicle collisions and other
safety challenges.
Financial impact. Separately managing brush and yard trimmings at Bachman would require storing
additional material in the transfer building throughout the week. It would cause additional overtime demand
on staff and hauling operations due to additional handling efforts and require increased overtime in addition
to the current overtime demand. Therefore, this option would have a high financial impact.
Environmental impact. Maximizing existing capacity would allow separate management of more
recycling and brush and yard trimmings. If material is recycled or composted rather than disposed the City
would realize environmental benefits and the option would have a low impact because the option would
minimize emissions related to avoided disposal.
Policy impact. There is a medium policy impact related to this option because the City would need to
implement separate brush and yard trimmings collection.
Stakeholder “buy-in”. This option has medium stakeholder “buy-in” because separately collecting and
processing brush and yard trimmings will support the City’s long-term recycling goals but would cause
operational and safety challenges due to space constraints and increased vehicle traffic in transfer buildings.
Compatibility with existing programs. Separately receiving and managing brush and yard trimmings has
low compatibility with existing programs, since it would require separately managing an additional material
stream.
5.4.4 Major Expansion or Rebuild of Bachman
Overview. As part of this option the City would complete a major expansion or rebuild of Bachman to
expand the tipping floor and number of transfer truck bays to better manage multiple material streams.
Although Fair Oaks and Westmoreland would benefit from increasing permitted capacity, dedicating the
resources for a major expansion or capital upgrade at Bachman would provide the most long-term beneficial
impact to the transfer station system. While the current square footage of Bachman transfer building is sized
at 24 square feet per permitted ton, which is consistent with the City of Georgetown’s upgraded transfer
station at 22 square feet per permitted ton, the City is unable to separately manage multiple material streams
DRAFT
LSWMP Update Transfer Station System
City of Dallas, Texas 5-16 Burns & McDonnell
because there are only two transfer truck bays and limited transfer trucks and drivers. Variations in
operating hours also contribute to the discrepancy. Without dedicated bays for materials that are intended
to be handled separately, future operators will experience similar challenges to ongoing operations. If
additional material streams are added and Bachman is unable to transfer the material shortly after it is
delivered, it could cause even more material to be stored in the transfer building, increasing the risk of
safety challenges. A major expansion or rebuild could reconfigure the facility layout, add an additional
transfer bay, and support future programs that the City would seek to implement to advance towards its
recycling goals.
Recycling potential. Expanding Bachman to have a dedicated third bay for organics (including brush, yard
trimmings and potentially residential food waste) would allow the City to make significant progress toward
its recycling goals.
Operational impact. A major expansion or rebuild of Bachman would require a construction effort that
could halt operations and cause a high level of disruption to operations. If collection vehicles are directed
to the Landfill during this time, there would be significant operational impact on collections due to the
increased time for collection vehicles to travel across the City rather than consolidate materials at the
transfer station. For example, between FY 2016 and FY 2020 Bachman had an annual average of about
32,000 transactions from Sanitation Department vehicles and if each of these vehicles were required to
direct haul material to the Landfill at an estimated round trip time of 60 minutes58 the collection operation
would fall behind on collections due to the 32,000 hours of driving time to direct haul material for disposal
or recycling compared to the current ability to deliver to Bachman and head back to the collection route in
significantly less time. If a major expansion or rebuild of Bachman were to be developed, it is possible to
schedule construction phasing so that the facility would not be non-operational throughout construction but
would still have a significant impact on the ability of the collection operation to manage material collected
in the north part of the City.
Financial impact. There would be high capital costs associated with a major expansion or rebuild of
Bachman. Table 5-4 describes the major cost items related to this type of construction project.
58 60 minutes round trip is used for example purposes, and may be longer in practice based on wait times for
unloading at the Landfill.
DRAFT
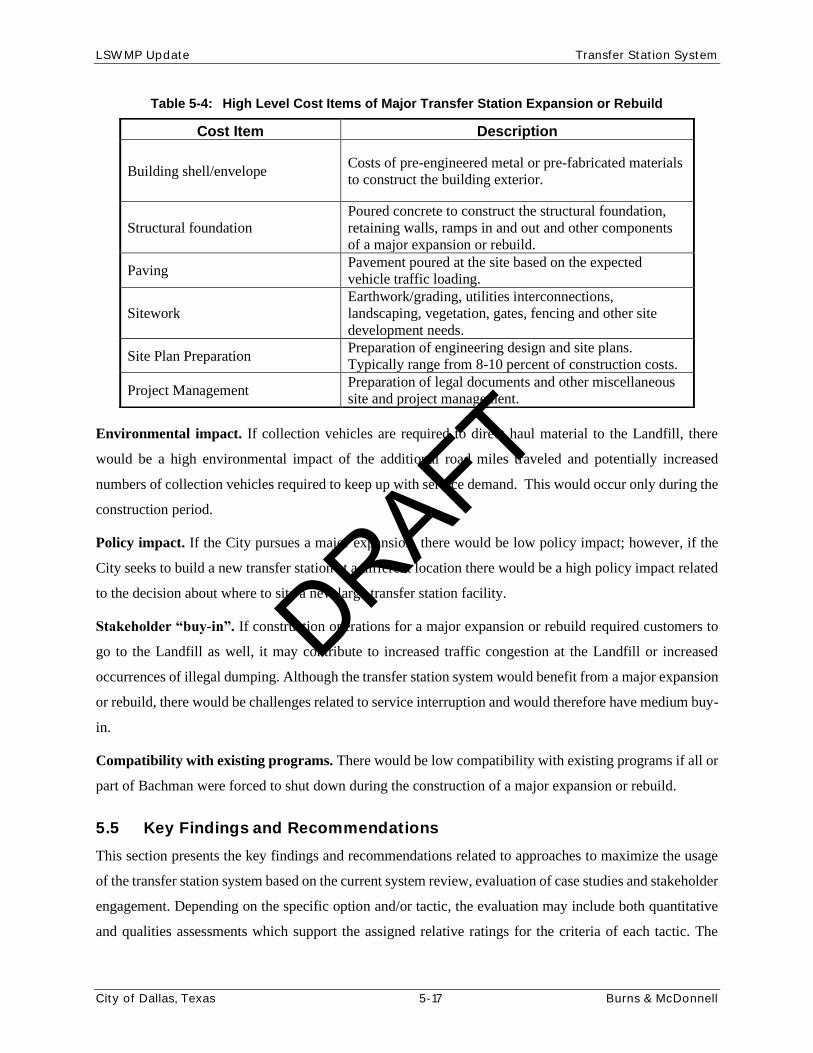
LSWMP Update Transfer Station System
City of Dallas, Texas 5-17 Burns & McDonnell
Table 5-4: High Level Cost Items of Major Transfer Station Expansion or Rebuild
Environmental impact. If collection vehicles are required to direct haul material to the Landfill, there
would be a high environmental impact of the additional road miles traveled and potentially increased
numbers of collection vehicles required to keep up with service demand. This would occur only during the
construction period.
Policy impact. If the City pursues a major expansion, there would be low policy impact; however, if the
City seeks to build a new transfer station at a different location there would be a high policy impact related
to the decision about where to site a new large transfer station facility.
Stakeholder “buy-in”. If construction operations for a major expansion or rebuild required customers to
go to the Landfill as well, it may contribute to increased traffic congestion at the Landfill or increased
occurrences of illegal dumping. Although the transfer station system would benefit from a major expansion
or rebuild, there would be challenges related to service interruption and would therefore have medium buy-
in.
Compatibility with existing programs. There would be low compatibility with existing programs if all or
part of Bachman were forced to shut down during the construction of a major expansion or rebuild.
5.5 Key Findings and Recommendations
This section presents the key findings and recommendations related to approaches to maximize the usage
of the transfer station system based on the current system review, evaluation of case studies and stakeholder
engagement. Depending on the specific option and/or tactic, the evaluation may include both quantitative
and qualities assessments which support the assigned relative ratings for the criteria of each tactic. The
Cost Item Description
Building shell/envelope Costs of pre-engineered metal or pre-fabricated materials
to construct the building exterior.
Structural foundation
Poured concrete to construct the structural foundation,
retaining walls, ramps in and out and other components
of a major expansion or rebuild.
Paving Pavement poured at the site based on the expected
vehicle traffic loading.
Sitework
Earthwork/grading, utilities interconnections,
landscaping, vegetation, gates, fencing and other site
development needs.
Site Plan Preparation Preparation of engineering design and site plans.
Typically range from 8-10 percent of construction costs.
Project Management Preparation of legal documents and other miscellaneous
site and project management.
DRAFT
LSWMP Update Transfer Station System
City of Dallas, Texas 5-18 Burns & McDonnell
meaning of the rating differs for each option and/or tactic but can generally be described as “green circle is
favorable or low impact,” “yellow triangle is neutral or medium impact,” and “red square is less favorable
or higher impact.” Further description of the criteria is provided in Section 1.4.3. Table 5-5 provides a
summary of the evaluation of the transfer station system options.
DRAFT
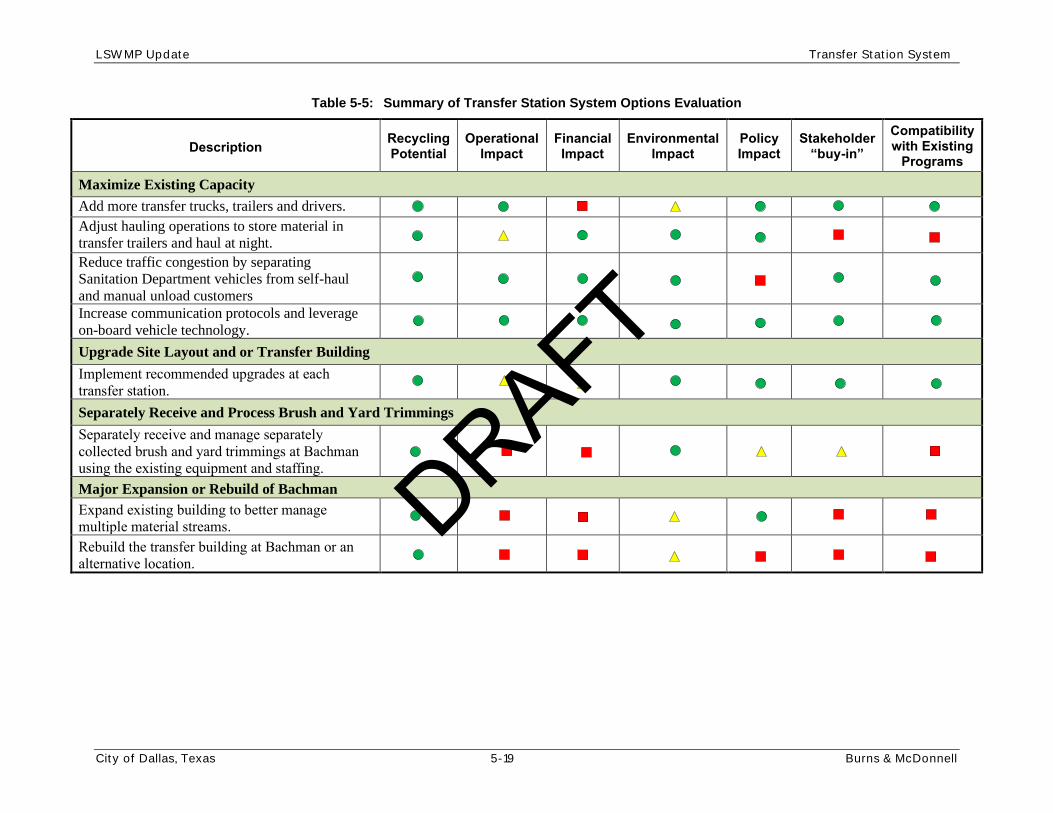
LSWMP Update Transfer Station System
City of Dallas, Texas 5-19 Burns & McDonnell
Table 5-5: Summary of Transfer Station System Options Evaluation
Description Recycling Potential
Operational Impact
Financial Impact
Environmental Impact
Policy Impact
Stakeholder “buy-in”
Compatibility with Existing
Programs
Maximize Existing Capacity
Add more transfer trucks, trailers and drivers.
Adjust hauling operations to store material in
transfer trailers and haul at night.
Reduce traffic congestion by separating
Sanitation Department vehicles from self-haul
and manual unload customers
Increase communication protocols and leverage
on-board vehicle technology.
Upgrade Site Layout and or Transfer Building
Implement recommended upgrades at each
transfer station.
Separately Receive and Process Brush and Yard Trimmings
Separately receive and manage separately
collected brush and yard trimmings at Bachman
using the existing equipment and staffing.
Major Expansion or Rebuild of Bachman
Expand existing building to better manage
multiple material streams.
Rebuild the transfer building at Bachman or an
alternative location.
DRAFT
LSWMP Update Transfer Station System
City of Dallas, Texas 5-1 Burns & McDonnell
5.5.1 Key Findings
Each of the following key findings supports the corresponding recommendation in the subsequent section.
1. Self-haul and manual unload customers cause challenges in the transfer buildings. The high
volume of self-haul and manual unload customers minimizes the capacity of the transfer stations
to manage multiple material streams and presents safety risks to customers.
2. Managing multiple material streams and customer types minimizes the City’s ability to utilize
full permitted capacity of transfer station system. Processing recycling and brush and bulky
items limits the capacity of the transfer station system and indicates the current transfer station
system would be unable to manage additional separated materials (e.g., brush and yard trimmings
separated from bulky items). Unexpected changes on number and timing of inbound loads create
challenges to manage and process material safely and efficiently.
3. Fair Oaks and Westmoreland are not able to store material in the transfer building overnight
due to permit restrictions. The transfer fleet must prioritize these facilities over Bachman when
there are surges of material.
4. Storing material in Bachman’s transfer building throughout the week minimizes the City’s
ability to manage multiple materials. Material is stored when the transfer fleet is unable to haul
all the material out of Bachman’s transfer building during daily operations and causes space
constraints in the transfer building required to separately manage and transfer out recycling and
clean brush.
5. The vehicle scales, scalehouse designs and traffic flow cause challenges during surges of
material. The traffic flows at the transfer stations result in increased traffic congestion due in part
to the location and capabilities of scale and scalehouses. Notably at Westmoreland, vehicles that
exceed the weight of the scale must encircle the facility several times to weigh at the transfer trailer
scales and then deliver material in the transfer building.
6. Transfer fleet trucks and drivers are dispatched reactively. Without clear indications of when
surges of material are approaching, the transfer station operators’ ability to proactively deploy
resources to meet service demand is limited.
7. The City must address the existing challenges with the transfer station system to achieve the
goals set by CECAP. CECAP set goals to recycle 35 percent of organic waste, 60 percent of paper
waste and achieve a 35 percent reduction of waste landfilled by 2030 in the single-family sector.
The City will not be able to achieve these goals without being able to consolidate material collected
in the north part of the City for transfer to processing facilities in the southern areas of the City.
DRAFT
LSWMP Update Transfer Station System
City of Dallas, Texas 5-2 Burns & McDonnell
5.5.2 Recommendations
Each of the following recommendations are components of the planning level implementation & funding
plan provided in Appendix F.
1. Implement key operational adjustments and capital upgrades to maximize existing capacity
among the transfer station system. Implement the number of transfer trucks and drivers required
to meet the operational needs of a separated brush and bulky item collection program. Additionally,
execute upgrades to the various transfer station buildings and facilities including increasing the
capacity of Dry Gulch to effectively divert the majority of self-haul and manual unload customers
from the transfer building at Bachman. Move forward to comprehensively upgrade the transfer
station system including reconfiguring transfer station sites as necessary, upgrading transfer
buildings, and integrating the hardware and software of scales and scalehouses.
2. Concurrently with implementation of key operational and/or capital upgrades, transfer
brush and yard trimming loads through Bachman on a pilot basis. As transfer station
operational and capital upgrades are being planned and executed, begin processing separated brush
material through Bachman on a regular basis for transfer to the Landfill’s existing brush grinding
operation until an available composting facility is identified. During the separated brush and bulky
item collection pilot a small amount of material was processed at Bachman, but there was not
enough room in the transfer building to maintain this throughout the pilot.
3. Develop engineering design study and preliminary construction phasing plan for major
expansion or rebuild of Bachman. Prepare for a future major expansion or rebuild of Bachman
by developing a series of options that would effectively route traffic through the site and maintain
the capability to expand services while maintaining continuity of service through strategic
construction phasing. This engineering design study would provide the configurations required to
manage separately collected brush and potentially separately collected food waste in the future.
DRAFT
LSWMP Update Refuse and Recycling Collection
City of Dallas, Texas 6-1 Burns & McDonnell
6.0 REFUSE AND RECYCLING COLLECTION
Refuse and recycling collection is provided by the Sanitation Department to single-family customers using
multiple equipment types and crew configurations to collect roll carts both in the alley and at the curb. The
Sanitation Department is the exclusive provider for single-family and duplexes in the City, although
commercial customers can request roll cart service. Further description of collection provided by the
Sanitation Department to commercial customers is provided in Appendix D. Providing this service is critical
to supporting progress toward the City’s recycling goals, as it allows the Sanitation Department direct
control over the collection, transportation, processing and disposal of material. The Sanitation Department
has been in the process of re-routing its refuse and recycling collection vehicles to increase the operating
efficiency in coordination with recently implemented on-board technology over the past year. This section
presents considerations to incorporate as part of the ongoing re-routing effort to position the City’s
operations to increase the efficiency of current program and support implementation of future programs to
increase recycling.
As part of the LSWMP Update, select on-route refuse and recycling collection operations were observed
as part of the Collection Operation Observations on February 8 and 9, 2021 including both alley and
curbside collection services. Additionally, discussions were held with various members of management and
staff to discuss ongoing operations and collect data. Further detailed technical evaluation of the refuse and
recycling collection operation is provided in Appendix D. The City has evaluated several potential scenarios
to adjust services to support providing more efficient services.
6.1 Current System Review
The City’s refuse and recycling collection operation services approximately 250,000 households across five
collection districts. Chapter 18 of the City’s Code of Ordinances establishes that collection services,
including collection, removal, disposal and processing of refuse and recycling must be provided by the
Sanitation Department for all single-family residences and duplexes. The following refuse and recycling
collection services are provided by the Sanitation Department (further discussion of brush and bulky item
collection services, including yard trimmings, is provided in Section 7.0):
• Refuse. Once per week collection and disposal of refuse contained in 64 and 96-gallon carts from
approximately 250,000 households. All residential customers receive refuse collection from City
crews and residents can request additional carts for an additional monthly fee. The City also
provides “Packout” services at an additional charge for collection on private drives.
• Recycling. Once per week collection and processing of recyclables contained in 96-gallon carts
from approximately 249,000 households. Recycling collection is voluntary, and residential
DRAFT
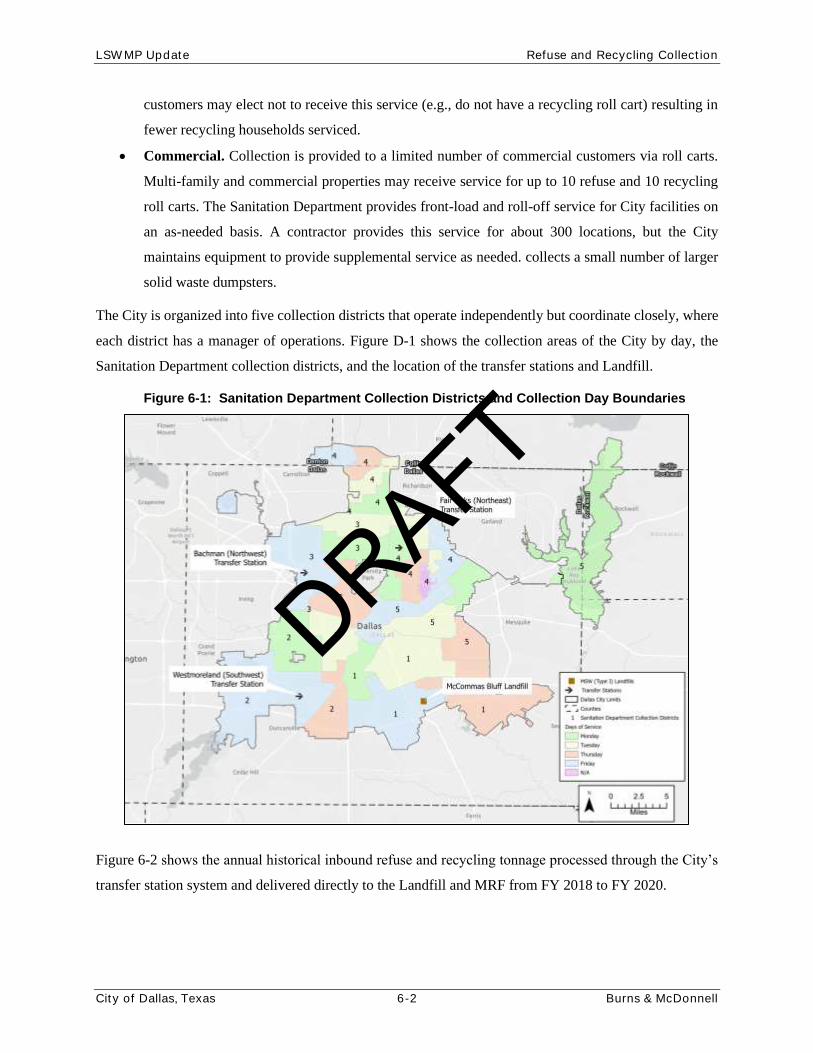
LSWMP Update Refuse and Recycling Collection
City of Dallas, Texas 6-2 Burns & McDonnell
customers may elect not to receive this service (e.g., do not have a recycling roll cart) resulting in
fewer recycling households serviced.
• Commercial. Collection is provided to a limited number of commercial customers via roll carts.
Multi-family and commercial properties may receive service for up to 10 refuse and 10 recycling
roll carts. The Sanitation Department provides front-load and roll-off service for City facilities on
an as-needed basis. A contractor provides this service for about 300 locations, but the City
maintains equipment to provide supplemental service as needed. collects a small number of larger
solid waste dumpsters.
The City is organized into five collection districts that operate independently but coordinate closely, where
each district has a manager of operations. Figure D-1 shows the collection areas of the City by day, the
Sanitation Department collection districts, and the location of the transfer stations and Landfill.
Figure 6-1: Sanitation Department Collection Districts and Collection Day Boundaries
Figure 6-2 shows the annual historical inbound refuse and recycling tonnage processed through the City’s
transfer station system and delivered directly to the Landfill and MRF from FY 2018 to FY 2020.
DRAFT
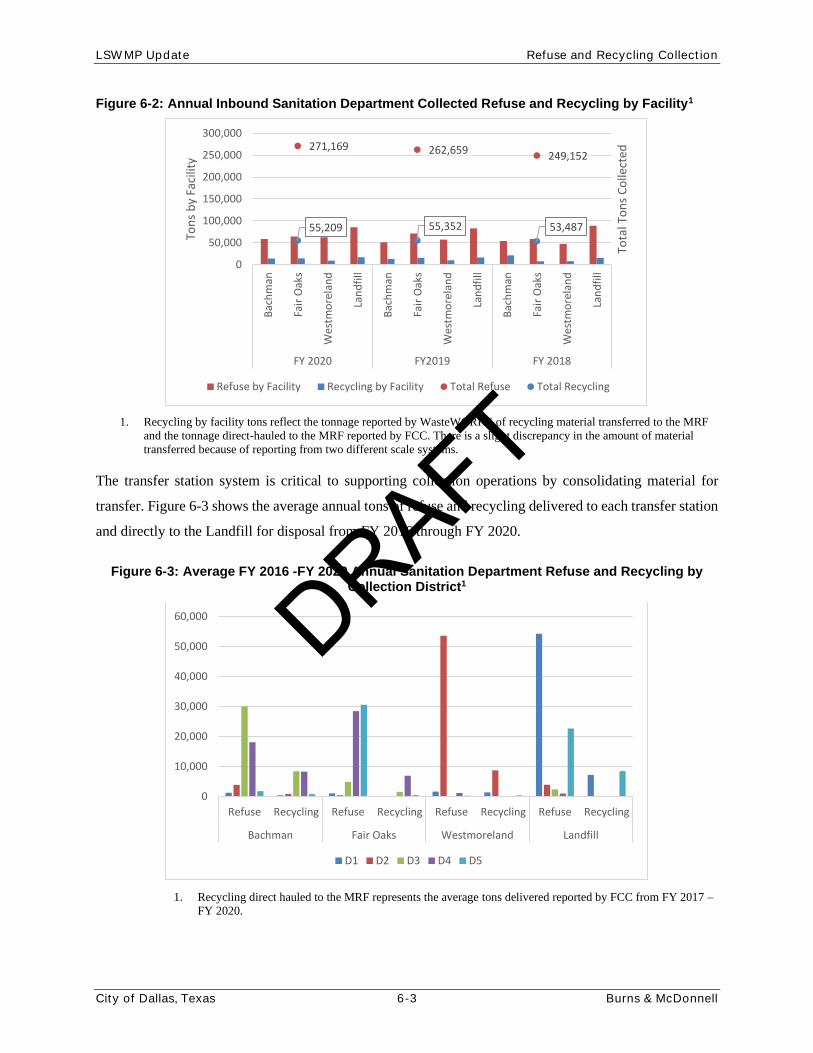
LSWMP Update Refuse and Recycling Collection
City of Dallas, Texas 6-3 Burns & McDonnell
Figure 6-2: Annual Inbound Sanitation Department Collected Refuse and Recycling by Facility1
1. Recycling by facility tons reflect the tonnage reported by WasteWORKS of recycling material transferred to the MRF
and the tonnage direct-hauled to the MRF reported by FCC. There is a slight discrepancy in the amount of material
transferred because of reporting from two different scale systems.
The transfer station system is critical to supporting collection operations by consolidating material for
transfer. Figure 6-3 shows the average annual tons of refuse and recycling delivered to each transfer station
and directly to the Landfill for disposal from FY 2016 through FY 2020.
Figure 6-3: Average FY 2016 -FY 2020 Annual Sanitation Department Refuse and Recycling by Collection District1
1. Recycling direct hauled to the MRF represents the average tons delivered reported by FCC from FY 2017 –
FY 2020.
271,169 262,659 249,152
55,209 55,352 53,487
0
50,000
100,000
150,000
200,000
250,000
300,000
Bac
hm
an
Fair
Oak
s
Wes
tmo
rela
nd
Lan
dfi
ll
Bac
hm
an
Fair
Oak
s
Wes
tmo
rela
nd
Lan
dfi
ll
Bac
hm
an
Fair
Oak
s
Wes
tmo
rela
nd
Lan
dfi
ll
FY 2020 FY2019 FY 2018
Tota
l To
ns
Co
llect
ed
Ton
s b
y Fa
cilit
y
Refuse by Facility Recycling by Facility Total Refuse Total Recycling
0
10,000
20,000
30,000
40,000
50,000
60,000
Refuse Recycling Refuse Recycling Refuse Recycling Refuse Recycling
Bachman Fair Oaks Westmoreland Landfill
D1 D2 D3 D4 D5
DRAFT
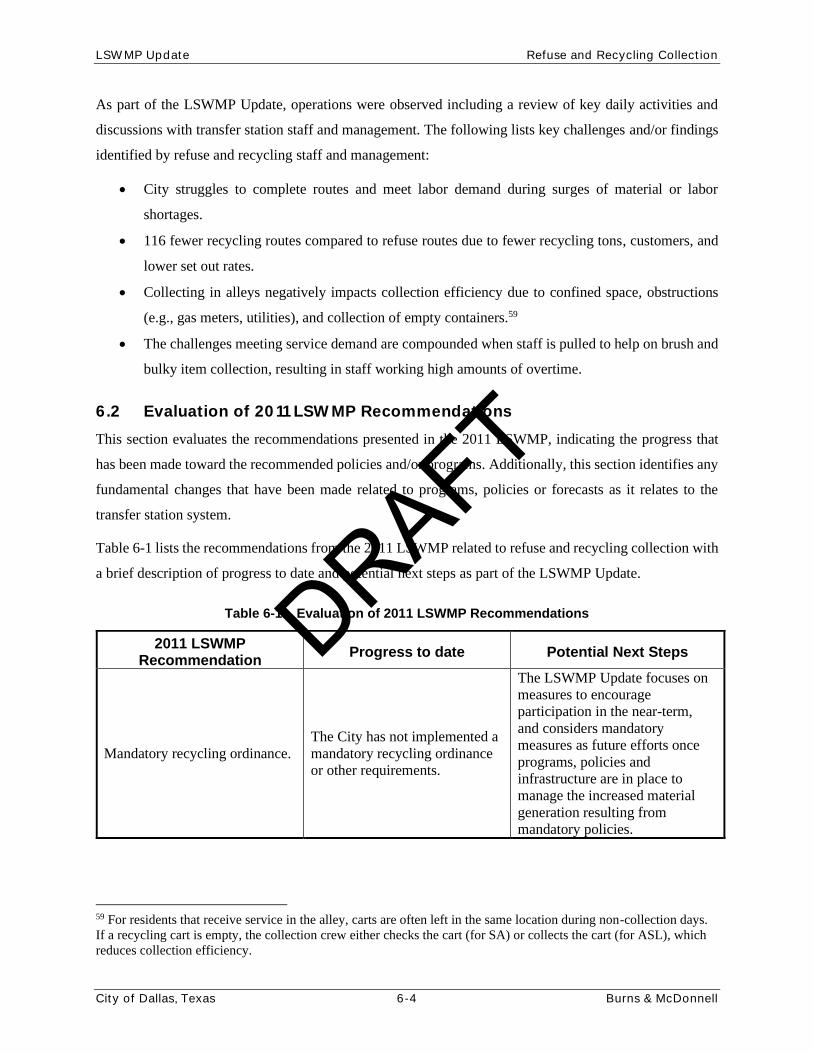
LSWMP Update Refuse and Recycling Collection
City of Dallas, Texas 6-4 Burns & McDonnell
As part of the LSWMP Update, operations were observed including a review of key daily activities and
discussions with transfer station staff and management. The following lists key challenges and/or findings
identified by refuse and recycling staff and management:
• City struggles to complete routes and meet labor demand during surges of material or labor
shortages.
• 116 fewer recycling routes compared to refuse routes due to fewer recycling tons, customers, and
lower set out rates.
• Collecting in alleys negatively impacts collection efficiency due to confined space, obstructions
(e.g., gas meters, utilities), and collection of empty containers.59
• The challenges meeting service demand are compounded when staff is pulled to help on brush and
bulky item collection, resulting in staff working high amounts of overtime.
6.2 Evaluation of 2011 LSWMP Recommendations
This section evaluates the recommendations presented in the 2011 LSWMP, indicating the progress that
has been made toward the recommended policies and/or programs. Additionally, this section identifies any
fundamental changes that have been made related to programs, policies or forecasts as it relates to the
transfer station system.
Table 6-1 lists the recommendations from the 2011 LSWMP related to refuse and recycling collection with
a brief description of progress to date and potential next steps as part of the LSWMP Update.
Table 6-1: Evaluation of 2011 LSWMP Recommendations
59 For residents that receive service in the alley, carts are often left in the same location during non-collection days.
If a recycling cart is empty, the collection crew either checks the cart (for SA) or collects the cart (for ASL), which
reduces collection efficiency.
2011 LSWMP Recommendation
Progress to date Potential Next Steps
Mandatory recycling ordinance.
The City has not implemented a
mandatory recycling ordinance
or other requirements.
The LSWMP Update focuses on
measures to encourage
participation in the near-term,
and considers mandatory
measures as future efforts once
programs, policies and
infrastructure are in place to
manage the increased material
generation resulting from
mandatory policies.
DRAFT
LSWMP Update Refuse and Recycling Collection
City of Dallas, Texas 6-5 Burns & McDonnell
Since the 2011 LSWMP the collection environments in the City have evolved based on trends shifting
toward more condensed development. This shift is an ongoing trend among many cities in the North Central
Texas region to reduce development sprawl and create more environmentally and socially conscious
housing.
City Code requires the Sanitation Department to provide services for all single-family detached residences
and duplexes. Single-family attached properties such as condominiums and townhomes which are not
required to seek collection services with the Sanitation Department cause a challenge because roll carts at
these locations are not able to collected in a safe and efficient manner. These types of properties may take
the form of condominiums or in-fill properties added as additional units on existing lots or dividing existing
home into multiple units. These types of properties are not considered single-family properties and are often
constructed based on form-based zoning specifications, which does not allow the City the right of first
refusal of service in some cases. Further discussion of the City’s permit review process is provided in
Section 6.3.5.
Although there was limited discussion of natural gas or electric powered solid waste collection vehicles in
the 2011 LSWMP, this became a key goal of CECAP and has recently become a focus of the NCTCOG.
Further discussion of alternative fuel collection vehicles is provided in Section 6.3.3.
6.3 Case Studies and Benchmarking
This section provides descriptions of programs or operational considerations from peer cities that would
support the City’s long-term planning needs related to the future of refuse and recycling collection. The
following sections provide perspective about the following topics, and is organized as follows:
• Alternative collection schedule and frequency
• Leverage on-board vehicle equipment
• Collection equipment backup ratio
• Permit review process
6.3.1 Alternative Collection Schedule and Frequency
The City collects refuse and recycling from single-family households on a weekly basis. Table 6-2
compares the City’s residential refuse and recycling collection operating schedule and frequency to peer
cities in the region.60
60 Peer cities were selected to show a range of municipal collection programs of varying sizes, operating schedules
and collection frequencies.
DRAFT
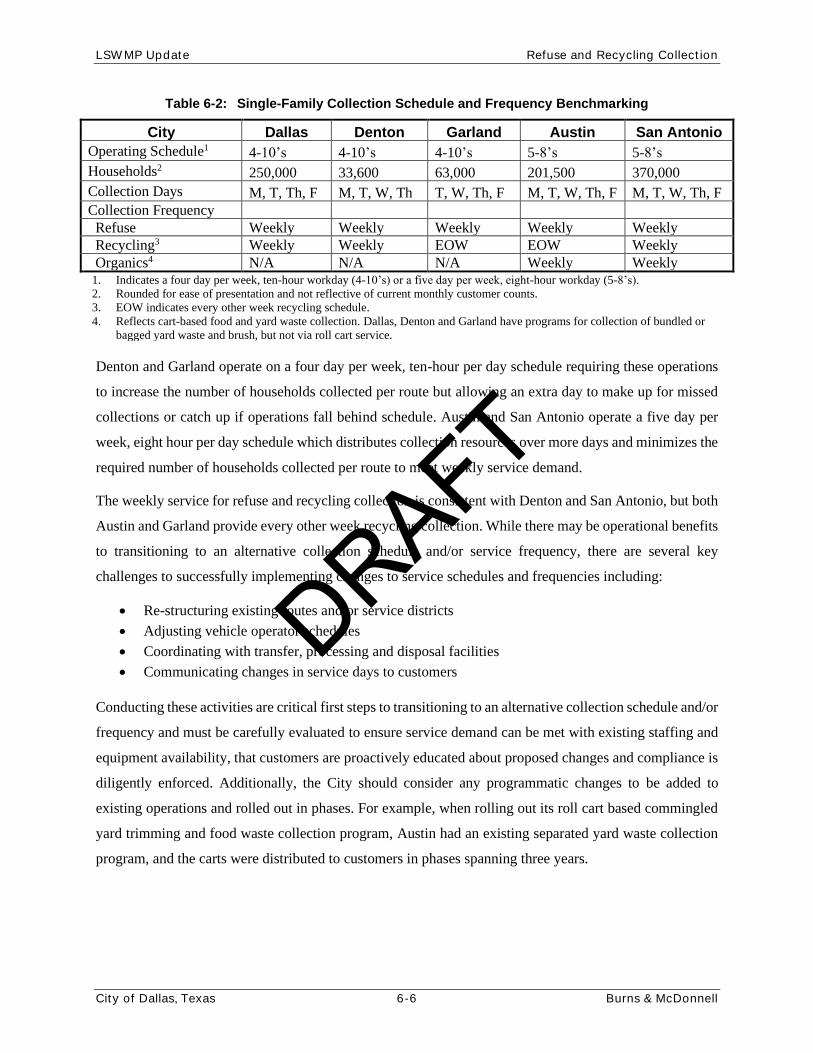
LSWMP Update Refuse and Recycling Collection
City of Dallas, Texas 6-6 Burns & McDonnell
Table 6-2: Single-Family Collection Schedule and Frequency Benchmarking
City Dallas Denton Garland Austin San Antonio
Operating Schedule1 4-10’s 4-10’s 4-10’s 5-8’s 5-8’s
Households2 250,000 33,600 63,000 201,500 370,000
Collection Days M, T, Th, F M, T, W, Th T, W, Th, F M, T, W, Th, F M, T, W, Th, F
Collection Frequency
Refuse Weekly Weekly Weekly Weekly Weekly
Recycling3 Weekly Weekly EOW EOW Weekly
Organics4 N/A N/A N/A Weekly Weekly 1. Indicates a four day per week, ten-hour workday (4-10’s) or a five day per week, eight-hour workday (5-8’s).
2. Rounded for ease of presentation and not reflective of current monthly customer counts.
3. EOW indicates every other week recycling schedule. 4. Reflects cart-based food and yard waste collection. Dallas, Denton and Garland have programs for collection of bundled or
bagged yard waste and brush, but not via roll cart service.
Denton and Garland operate on a four day per week, ten-hour per day schedule requiring these operations
to increase the number of households collected per route but allowing an extra day to make up for missed
collections or catch up if operations fall behind schedule. Austin and San Antonio operate a five day per
week, eight hour per day schedule which distributes collection resources over more days and minimizes the
required number of households collected per route to meet weekly service demand.
The weekly service for refuse and recycling collection is consistent with Denton and San Antonio, but both
Austin and Garland provide every other week recycling collection. While there may be operational benefits
to transitioning to an alternative collection schedule and/or service frequency, there are several key
challenges to successfully implementing changes to service schedules and frequencies including:
• Re-structuring existing routes and/or service districts
• Adjusting vehicle operator schedules
• Coordinating with transfer, processing and disposal facilities
• Communicating changes in service days to customers
Conducting these activities are critical first steps to transitioning to an alternative collection schedule and/or
frequency and must be carefully evaluated to ensure service demand can be met with existing staffing and
equipment availability, that customers are proactively educated about proposed changes and compliance is
diligently enforced. Additionally, the City should consider any programmatic changes to be added to
existing operations and rolled out in phases. For example, when rolling out its roll cart based commingled
yard trimming and food waste collection program, Austin had an existing separated yard waste collection
program, and the carts were distributed to customers in phases spanning three years.
DRAFT
LSWMP Update Refuse and Recycling Collection
City of Dallas, Texas 6-7 Burns & McDonnell
6.3.2 Leveraging On-board Vehicle Technology
Implementation of on-board vehicle technology and advanced data analytics (e.g., artificial intelligence) is
being implemented by both public and private-sector collection operators to increase the efficiency of refuse
and recycling collections and support service verification is. The City has recently installed on-board
hardware and software to support routing planning efforts, service verification and operator safety61.
Peer cities in the region are exploring vendors to provide the hardware, software and service to increase the
efficiency of managing their collection systems. The City of Denton contracted with Rubicon Global
(Rubicon) to install on-board equipment (e.g., tablets, sensors) on collection vehicles to support service
verification and as a feedback tool to optimize routing and route planning. Currently the data is not used
for compliance reporting, although Denton is considering this application. Vehicle operators use a
dashboard mounted tablet to take pictures of contaminated carts or dumpsters that is transmitted to their
customer service center for service verification. Additionally, Rubicon’s system collects, analyzes and
reports individual vehicle operating data such as fuel efficiency, sudden stops or starts, speeding and fault
codes for maintenance.
Based on discussion with staff at Denton, there are up-front capital costs to install the system (e.g., tablets,
geocoding customers) and an annual subscription cost, but the system was competitive compared to other
providers in the market (e.g., FleetMind, Routeware). Since installing the system in 2020, Denton has seen
a decrease in the contamination reported by its recycling processor because the technology system
streamlines operations for drivers, holds customers to account by providing data to support service
verification and helps the operations keep up with customer growth. Additionally, through the route assist
program route supervisors are able to see how drivers are doing in real time and can re-deploy resources to
support when needed if one or more drivers are behind schedule.
In the future, Denton is seeking to expand its use of Rubicon’s hardware and software to run a pilot to
collect and analyze contamination data using on-board cameras, streamline its billing system and potentially
leverage the equipment and software to capture other data such as images of challenging collection
environments, graffiti and potholes.
6.3.3 Alternative Fuel Collection Vehicles
Increasing numbers of alternative fuel collection vehicles are being implemented by public and private
sector fleets and there has been an industry trend to explore electric powered heavy-duty vehicles. Fleet
managers seek the most effective vehicle and fueling types to achieve increase operational efficiency and
61 Further information about Third Eye refuse fleet solutions is provided here: https://www.3rdeyecam.com/refuse-
fleet-management-systems/
DRAFT
LSWMP Update Refuse and Recycling Collection
City of Dallas, Texas 6-8 Burns & McDonnell
minimize emissions. Battery electric vehicles (BEVs) have emerged recently, but the importance of
lifecycle assessments to compare and contrast technology and fuel options is critical to consider as part of
the long-term direction of the City’s vehicle fleet. The following alternative fuel collection vehicles and
manufacturers are currently active in the solid waste collection vehicle market, based on a recently released
report by the non-profit Energy Vision called The Refuse Revolution 62:
• Natural gas vehicles. Includes both CNG and Liquified Natural Gas (LNG) extracted through
drilling and oil excavation. These fuels are compatible with natural gas engines burn cleaner than
gasoline or diesel and reduce emissions of nitrogen oxide (NOx) by 90 percent and particulate
matter (PM) by 60 percent compared to diesel. Additionally, fossil natural gas vehicles are 50
percent quieter than diesel engine vehicles. There are about 18,000 natural fossil gas burning trucks
on the road and these vehicles can reduce the lifecycle of GHG emissions by five percent compared
to diesel. Renewable Natural Gas (RNG) is not a fossil fuel and is made from a renewable resource:
food waste, animal manure, and other types of organic wastes. Production of RNG traps and refines
methane biogases which would otherwise escape into the atmosphere with significant
environmental impacts. The incremental cost increase of purchasing of natural gas collection
vehicles is about $38,000 more than comparable diesel models.63 There are about 10,000 RNG
burning collection vehicles on the road and these vehicles reduce can reduce GHG emissions by 50
- 300 percent compared to diesel, depending on the feedstocks used to manufacture RNG. Some
natural gas vehicles are retrofitted diesel vehicles, which may be subject to increased maintenance
and downtime challenges compared to new natural gas vehicles.
• BEVs. These vehicles have zero tailpipe emissions and have significantly quieter operations due
to the electric battery, but the environmental benefits are not as competitive to natural gas fueled
vehicles from a lifecycle perspective. There are benefits of BEVs including minimal tailpipe
emissions, quieter operations, and less maintenance costs over the life of the vehicle compared to
diesel or natural gas vehicles. Additionally, certain models of BEVs can provide a charge through
regenerative braking, where breaking energy that would normally be lost as heat is returned to the
battery as electricity. The challenges with BEVs are that these vehicles have limited range between
charges require a large electricity demand to power the batteries, which may result in more lifecycle
emissions if the electricity is generated by coal-fired power plants. The extraction and
62 Further information and analysis on the operational, financial, and environmental components of alternative fuel
collection vehicles including renewable diesel, hydrogen fuel, hydraulic hybrids, biodiesel, and dimethyl ether as
part of the following report: https://energy-vision.org/wp-content/uploads/2021/12/The_Refuse_Revolution.pdf 63 U.S. Department of Energy. “Case Study – Compressed Natural Gas Refuse Fleets.” February, 2014.
https://afdc.energy.gov/files/u/publication/casestudy_cng_refuse_feb2014.pdf
DRAFT
LSWMP Update Refuse and Recycling Collection
City of Dallas, Texas 6-9 Burns & McDonnell
transportation of rare or precious metals (e.g., lithium, cobalt and other rare earth minerals) and the
associated labor requirements are a key challenge related to the scalability of BEVs. Additionally,
there are limited outlets to recycle or dispose batteries when they reach the end of their useful lives.
Based on these challenges related to the scalability of BEVs, there are less than 50 fully electric
refuse trucks on the road nationwide, and their cost is nearly 70 percent higher than diesel trucks –
as much as $800,000 compared to $300,000.
Waste Management has maintained consistent messaging over the past several years that their intention is
to purchase as many natural gas solid waste collection vehicles for operations across the country where the
opportunities exist to do so. Additionally, they are seeking to increase the percentage of vehicles in their
collection fleets that are fueled by RNG.64 Waste Management currently maintains a fleet of about 100
RNG solid waste collection vehicles at the Skyline Landfill that are fueled by the processed landfill gas.
These vehicles are deployed to service municipal and commercial customers in the DFW Metroplex area.
There are several equipment manufacturers marketing BEVs including Motiv Power Systems, Mack, and
Build Your Dreams (BYD, a Chinese manufacturing company). These equipment manufacturers have
recently sold BEV solid waste collection vehicles to cities including Chicago, Sacramento, Los Angeles,
Seattle and New York City. Although there are cities incorporating battery electric vehicles in their fleets,
the results of pilot efforts have had mixed reviews. Los Angeles piloted a BYD vehicle for four months in
2017 and concluded the test was successful, although they have not added more BEVs. Other cities have
piloted BEVs and have limited or discontinued their use citing challenges with battery operation in cold
weather, reliability of hydraulics (e.g., ASL collection arms), reliability issues and less collection capacity
compared to natural gas or diesel vehicles due to the size of the battery pack.
Even with the identified challenges, there is continued interest in BEVs for solid waste collection. For
example, in an application to the NCTCOG’s Regional Transportation Council’s North Texas Clean Diesel
Projects, the City of Plano submitted an application to support their fleet to replace one diesel refuse
collection vehicle with one BEV.
6.3.4 Equipment Backup Ratio
The equipment backup ratio is a critical consideration for collection service operators to ensure that the
amount of available equipment is sufficient to meet service demands. The backup ratio is the amount of
64 Waster Dive. “Waste Management Looks to Surpass 80% CNG Collection Fleet.” June 2, 2021.
https://www.wastedive.com/news/waste-management-cng-electric-sustainable-fleets/601037/
DRAFT
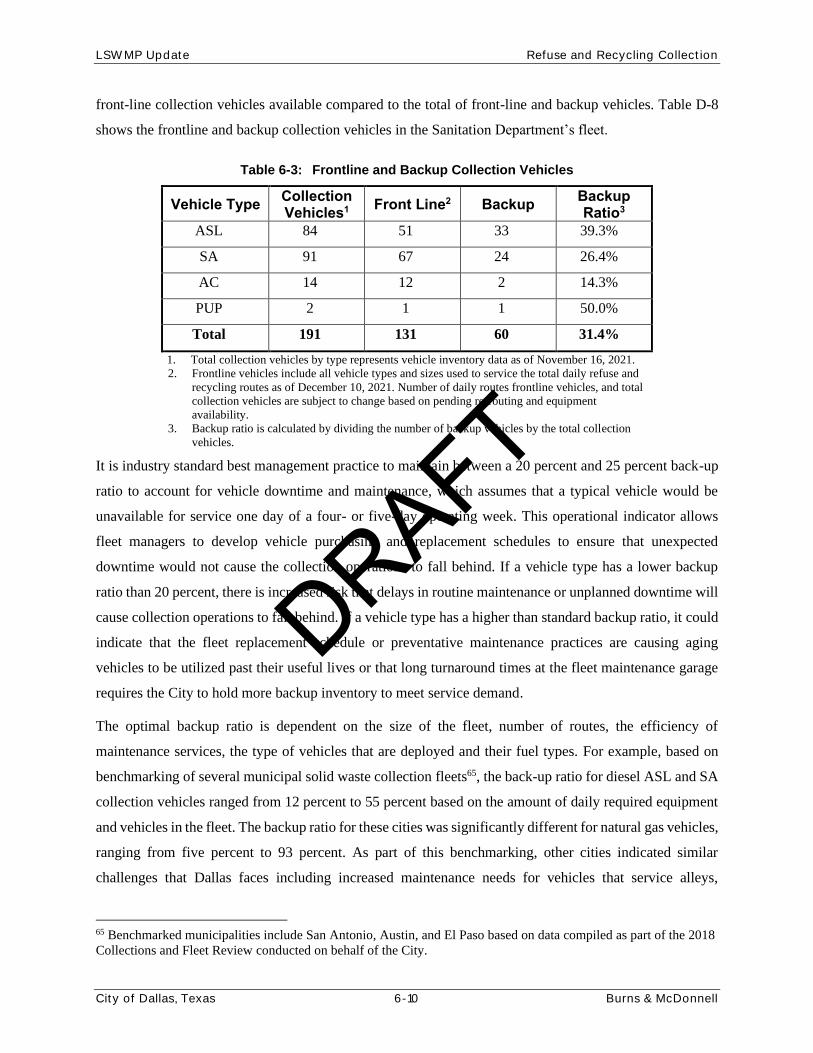
LSWMP Update Refuse and Recycling Collection
City of Dallas, Texas 6-10 Burns & McDonnell
front-line collection vehicles available compared to the total of front-line and backup vehicles. Table D-8
shows the frontline and backup collection vehicles in the Sanitation Department’s fleet.
Table 6-3: Frontline and Backup Collection Vehicles
Vehicle Type Collection Vehicles1
Front Line2 Backup Backup Ratio3
ASL 84 51 33 39.3%
SA 91 67 24 26.4%
AC 14 12 2 14.3%
PUP 2 1 1 50.0%
Total 191 131 60 31.4%
1. Total collection vehicles by type represents vehicle inventory data as of November 16, 2021.
2. Frontline vehicles include all vehicle types and sizes used to service the total daily refuse and
recycling routes as of December 10, 2021. Number of daily routes frontline vehicles, and total
collection vehicles are subject to change based on pending re-routing and equipment
availability. 3. Backup ratio is calculated by dividing the number of backup vehicles by the total collection
vehicles.
It is industry standard best management practice to maintain between a 20 percent and 25 percent back-up
ratio to account for vehicle downtime and maintenance, which assumes that a typical vehicle would be
unavailable for service one day of a four- or five-day operating week. This operational indicator allows
fleet managers to develop vehicle purchasing and replacement schedules to ensure that unexpected
downtime would not cause the collection operations to fall behind. If a vehicle type has a lower backup
ratio than 20 percent, there is increased risk that delays in routine maintenance or unplanned downtime will
cause collection operations to fall behind. If a vehicle type has a higher than standard backup ratio, it could
indicate that the fleet replacement schedule or preventative maintenance practices are causing aging
vehicles to be utilized past their useful lives or that long turnaround times at the fleet maintenance garage
requires the City to hold more backup inventory to meet service demand.
The optimal backup ratio is dependent on the size of the fleet, number of routes, the efficiency of
maintenance services, the type of vehicles that are deployed and their fuel types. For example, based on
benchmarking of several municipal solid waste collection fleets65, the back-up ratio for diesel ASL and SA
collection vehicles ranged from 12 percent to 55 percent based on the amount of daily required equipment
and vehicles in the fleet. The backup ratio for these cities was significantly different for natural gas vehicles,
ranging from five percent to 93 percent. As part of this benchmarking, other cities indicated similar
challenges that Dallas faces including increased maintenance needs for vehicles that service alleys,
65 Benchmarked municipalities include San Antonio, Austin, and El Paso based on data compiled as part of the 2018
Collections and Fleet Review conducted on behalf of the City.
DRAFT
LSWMP Update Refuse and Recycling Collection
City of Dallas, Texas 6-11 Burns & McDonnell
minimizing maintenance requirements and allowing maintenance staff sufficient time to make all necessary
repairs before vehicles are required to be re-deployed to meet service demand.
6.3.5 Permit Review Process
Currently planned residential growth throughout the City includes both in-fill development as well as large
master planned communities (MPCs) that are developed based on Form-Based Code (e.g., SmartCode66).
Form-Based Code specifications incorporate elements of New Urbanism (i.e., development that creates
walkable, mixed-use neighborhoods) to accommodate environmental techniques such as reduced usage of
impervious cover (e.g., pavement, asphalt, cement), increased usage of green spaces (e.g., parks, fields,
gardens), and more walkable or multi-modal transit (e.g., bicycle lanes, trolley tracks).
Form-Based Code specifications result in compact mixed-use and high-density developments that can
create challenges for solid waste collection to be performed safely and efficiently. If zoning requirements
and design codes do provide accessibility for solid waste collection vehicles or equipment, challenging
collection environments are built such as:
• Inaccessible alleys. Service location in narrow or obstructed alleys.
• Private drives with limited maneuverability. Service locations only accessible by private drives.
• Cul-de-sacs with inaccessible set outs. Service locations on Cul-de-sacs that are too small or
contain obstructions.
• Hammerhead or dead ends. Service locations on hammerhead (i.e., dead-end streets that end in
a “Y” shape) or dead-end streets with undersized turn radii.
• Boulevards. Service locations on arterial roads that contain obstacles for collection due to multi-
modal transportation lanes.
City staff provide a cursory review to identify any major violations (e.g., not meeting minimum right-of-
way, located in a thoroughfare, etc.) so the developer can adjust before the submission is fully evaluated.
Development Services works collaboratively with other departments such as Dallas Fire-Rescue (DFR) and
DWU in the pre-development process to identify any challenges that would cause the submission to
ultimately be denied. Based on discussions with City staff, there are currently limited considerations in the
pre-development process to ensure that the submission accounts for solid waste collection vehicle
accessibility and meets the minimum standards to ensure that the Sanitation Department equipment will be
able to safely and efficiently service these properties. Developers are able to complete a dumpster waiver
66 SmartCode is a model transect-based planning and zoning document based on the tenants of Form-Based Code
intended to keep settlements compact and rural lands open by reforming the patters of separated-use zoning. More
information on SmartCode is available at the following link: https://smartcodecentral.com/
DRAFT
LSWMP Update Refuse and Recycling Collection
City of Dallas, Texas 6-12 Burns & McDonnell
form to develop properties that may not be accessible to solid waste vehicles. The challenge with single-
family attached properties is that when they include challenging collection environments (e.g., private
drives) the Sanitation Department has to consider removing the customer from service because they may
not be able to safely or efficiently collect set outs, ultimately requiring the customer to hire a private sector
service provider.
Multiple cities across Texas are experiencing collection challenges associated with the implementation of
SmartCode development, including Austin, Fort Worth, and San Antonio. Each of these cities have
indicated that applications for new developments are provided to its solid waste and recycling collection
group for initial review. It is clear, however, that even though this initial review process may be sufficient
for the needs of fire truck equipment, the needs of solid waste and recycling collection vehicles require
additional attention in regard to interim applications or amendments. This is due to the fact that solid waste
and recycling collection vehicles will visit these locations more frequently than emergency fire vehicles.
Additionally:
• Fort Worth noted that even after reviewing initial permits, developments were still being installed
that did not meet the needs of solid waste and recycling collection equipment and indicated that it
is challenging to devote resources to interim reviews.
• Austin indicated that it has a strategic development team that is dedicated to tracking policy
development and reviewing inconsistencies in code that would impact solid waste and recycling
collection vehicle accessibility. This team works closely with Austin’s Planning and Zoning
Department.
• San Antonio has developed a committee that seeks to ensure the safest and most efficient solid
waste and recycling collection equipment is able to remain in operation. This committee is tasked
to create an informational bulletin that would serve as the policy to determine criteria for
SmartCode policy implementation. Recommendations may include variable fee structures,
minimums for ASL service and emergency fire equipment, cart set out placement, parking
restrictions, and protocols for private haulers.
6.4 Options Evaluation
This section analyzes a series of options related to the refuse and recycling collection program that have
been identified based on the operational analysis, stakeholder engagement, evaluation of recommendations
from the 2011 LSWMP, and case studies.
The following summarizes the key takeaways from the community survey and other outreach activities
conducted as part of the LSWMP Update.
DRAFT
LSWMP Update Refuse and Recycling Collection
City of Dallas, Texas 6-13 Burns & McDonnell
• 95 percent of respondents to the survey are homeowners and 93 percent indicated that use garbage
collection once per week and 84 percent indicated they use recycling collection once per week.
• 74 percent of respondents indicated they were satisfied or very satisfied with refuse collection
service and about 70 percent indicated the same for recycling collection service.
• 58 percent of respondents indicated they have collection service provided in an alleyway, compared
to 42 percent of respondents receiving collection at the curb.
• 25 percent of respondents indicated they would be supportive of transitioning to curbside collection
in areas where alleys are not conducive to automated collection compared to 67 percent of
respondents that were opposed or very opposed.
• 58 percent of respondents indicated they would be supportive of ordinances that require
participation in services in programs, such as mandatory recycling.
Further information about the methodology of the stakeholder engagement is described in Section 1.0 and
the comprehensive detailed results are provided in Appendix A.
The following presents options that are evaluated in the following sections including a brief description of
the option and evaluation approach:
• Evaluate potential efficiencies of adjusting collection schedule. Describes the considerations of
evaluating adjustments to the collection schedule for refuse and recycling collection schedule from
four days per week to five days per week as part of the ongoing re-route.
• Minimize alley collection and combined routes. Evaluates the impact of adjusting collection
routes to minimize the number that collect in alleys and from routes that contain alley and curbside
collection, leveraging on-board technology to track performance metrics and maximize collection
efficiency
• Decrease use of diesel collection vehicles. Describes the impact of increasing the use of
CNG/RNG collection vehicles for refuse and recycling collection and piloting a BEV.
• Release procurement for cart supplier. Describes the considerations of releasing a procurement
for cart supplier and/or cart management service provider to leverage cooperative purchasing to
realize cost savings.
Each of the following sections provide an overview of each option and specific tactics and evaluates the
impact of each options’ components based on the criteria detailed in Section 1.4.3. A high-level summary
of the evaluation criteria for each tactic within the options is provided in Section 6.5 to support the key
findings, recommendations and implementation and funding plan.
DRAFT
LSWMP Update Refuse and Recycling Collection
City of Dallas, Texas 6-14 Burns & McDonnell
6.4.1 Evaluate Potential Efficiencies of Adjusting Collection Schedule
Overview. As part of this option the City would evaluate adjusting its current collection schedule of four,
10-hour operating days per week to five, eight-hour operating days per week as part of the ongoing re-route.
This would require an adjustment to the collection districts that, given reduced number of households per
route, may allow resources from multiple collection districts to more effectively share collection demand
when necessary (e.g., equipment could be deployed from one sanitation district to another in the case of
unplanned vehicle downtime). Adjusting current service days and adjusting the boundaries of the solid
waste collection districts to support the ongoing re-route may benefit the operation if there are increased
operating efficiencies (e.g., fewer trips to disposal/processing per route, more streamlined maintenance,
higher equipment availability, etc.). As long as adjusted routes and sanitation districts allows collection
operation to within a 40-hour work week (e.g., not requiring a sixth day of operation to meet service
demand), distributing resources over a five-day schedule has the potential to balance the number of
customers collected per day and minimize the strain on both drivers and equipment. Although transitioning
to a 5-8 collection schedule would not guarantee improved routing efficiencies, if the City is able to capture
efficiencies related to the transition, the Sanitation Department would be able to deploy collection resources
more effectively and position the City to gain the capacity to implement expanded service offerings in the
future (e.g., material types collected, frequency of collection). There would be challenges to ensure that
brush and bulky item collection has sufficient resources, since refuse and recycling collection vehicle
operators are often pulled onto this service on Wednesdays to support the brush and bulky item collection
operation.
Recycling potential. Adjusting the collection schedule would provide the same level of service for
recycling collection. This option has recycling potential if the City captures efficiencies upon
implementation of a re-route and increases its capability to expand service offerings in the future (e.g., roll
cart collected organics, every other week recycling, etc.); however, the recycling potential of this option
would not be realized in the short-term time frame.
Operational impact. Adjusting the collection schedule would distribute refuse and recycling customers
over five days and potentially minimize strain on existing collection equipment and staff to meet current
and future service demand, limit the occurrence of overpacking vehicles, streamline vehicle maintenance
workflow and provide increased capability to support unplanned downtime of collection vehicles. Re-
configuring the refuse and recycling routes would shorten the length of daily routes, but could increase the
time total time per week that crews are not on-route (e.g., lunch breaks, pre- and post- trip inspections).
Transitioning to a five day collection may have a positive effect on the transfer station system because there
would be fewer daily inbound tons to transfer out for disposal and/or processing. Adjusting the collection
DRAFT
LSWMP Update Refuse and Recycling Collection
City of Dallas, Texas 6-15 Burns & McDonnell
schedule would cause challenges that the City would need to overcome such as ensuring there are sufficient
resources to meet brush and bulky item collection service demand (since refuse and recycling staff would
not be able to support brush and bulky item collection on Wednesdays), re-configuring the transfer station
programs and operations to support the adjusted collection schedule and determining the equipment types
that are deployed on each route. Additionally, maintenance requirements of collection vehicles would need
to be distributed throughout the week rather than concentrated on Wednesdays like it is currently with the
4-10’s collection schedule.
Financial impact. If the City is able to achieve efficiencies by implementing a re-route on a 5-108
collection schedule, regularly completing collections without falling behind and meeting service demand
even during surges of material generation, there may be less overtime demand. Although there would be
education and outreach efforts required as part of the implementation of an adjusted collection schedule,
these efforts could be managed by the Sanitation Department staff.
Environmental impact. The environmental impact of this option depends on the results of the ongoing re-
route and if it would require increased collection vehicles and road miles traveled.
Policy impact. Adjusting the collection schedule would be an operational decision and has minimal policy
impacts.
Stakeholder “buy-in”. If adjusting the collection schedule minimizes the strain on equipment and staff
there would have high “buy-in” from an operational perspective. If service demand could be met in a 40
hour work week, there would be a high “buy-in” from collection staff. There may be mixed “buy-in” from
other parts of the Sanitation Department operation that would be changed such as brush and bulky item
collection and the transfer station system. Additionally, customers that have their collection days changed
may become confused about the correct set out days and times.
Compatibility with existing programs. There is low compatibility with current programs due to the
changes to collection days and required adjustments to other Sanitation Department operations.
6.4.2 Minimize Alley Collection and Combined Routes
Overview. This option would reduce the number of customers that are serviced in the alley and minimize
routes that have both alley and curbside collection as part of the ongoing re-route. Minimizing alley
collections and combined routes would decrease safety and property damage risks by leveraging on-board
technology to determine the most effective approach to phasing out mixed routes. Collecting a high
percentage of households in the alley decreases refuse and recycling collection efficiency and accelerates
DRAFT
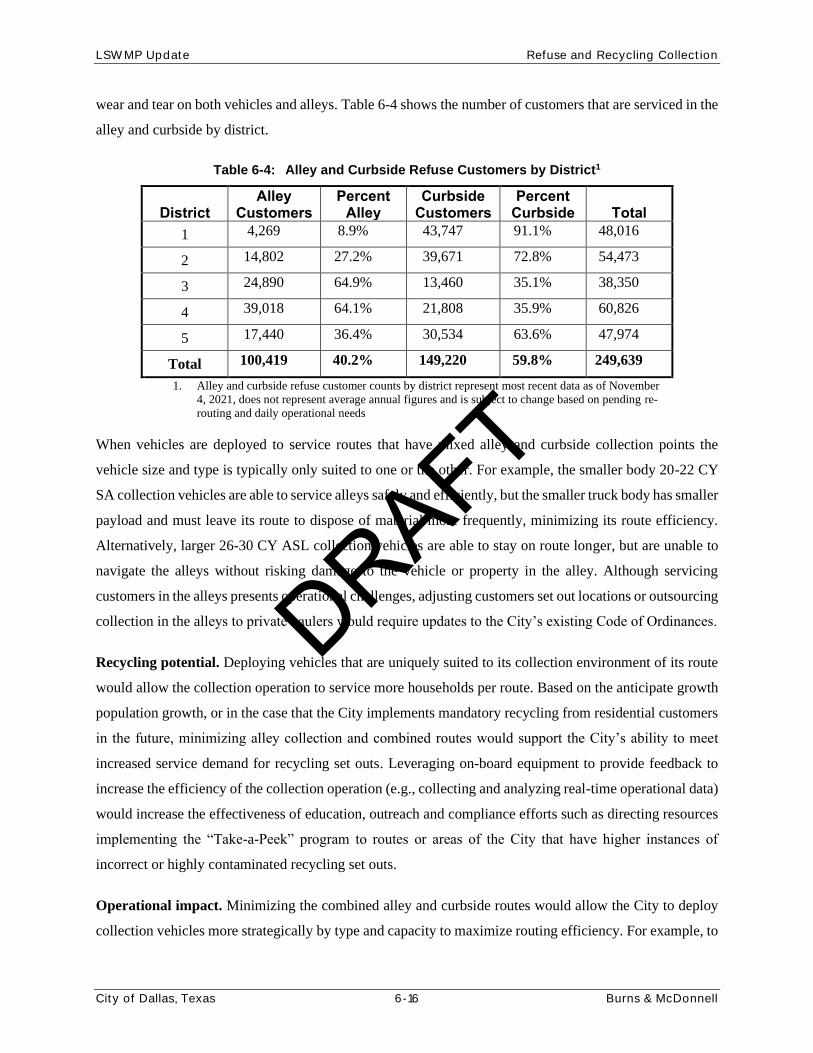
LSWMP Update Refuse and Recycling Collection
City of Dallas, Texas 6-16 Burns & McDonnell
wear and tear on both vehicles and alleys. Table 6-4 shows the number of customers that are serviced in the
alley and curbside by district.
Table 6-4: Alley and Curbside Refuse Customers by District1
District Alley
Customers Percent
Alley Curbside
Customers Percent
Curbside Total
1 4,269 8.9% 43,747 91.1% 48,016
2 14,802 27.2% 39,671 72.8% 54,473
3 24,890 64.9% 13,460 35.1% 38,350
4 39,018 64.1% 21,808 35.9% 60,826
5 17,440 36.4% 30,534 63.6% 47,974
Total 100,419 40.2% 149,220 59.8% 249,639
1. Alley and curbside refuse customer counts by district represent most recent data as of November
4, 2021, does not represent average annual figures and is subject to change based on pending re-
routing and daily operational needs
When vehicles are deployed to service routes that have mixed alley and curbside collection points the
vehicle size and type is typically only suited to one or the other. For example, the smaller body 20-22 CY
SA collection vehicles are able to service alleys safely and efficiently, but the smaller truck body has smaller
payload and must leave its route to dispose of material more frequently, minimizing its route efficiency.
Alternatively, larger 26-30 CY ASL collection vehicles are able to stay on route longer, but are unable to
navigate the alleys without risking damage to the vehicle or property in the alley. Although servicing
customers in the alleys presents operational challenges, adjusting customers set out locations or outsourcing
collection in the alleys to private haulers would require updates to the City’s existing Code of Ordinances.
Recycling potential. Deploying vehicles that are uniquely suited to its collection environment of its route
would allow the collection operation to service more households per route. Based on the anticipate growth
population growth, or in the case that the City implements mandatory recycling from residential customers
in the future, minimizing alley collection and combined routes would support the City’s ability to meet
increased service demand for recycling set outs. Leveraging on-board equipment to provide feedback to
increase the efficiency of the collection operation (e.g., collecting and analyzing real-time operational data)
would increase the effectiveness of education, outreach and compliance efforts such as directing resources
implementing the “Take-a-Peek” program to routes or areas of the City that have higher instances of
incorrect or highly contaminated recycling set outs.
Operational impact. Minimizing the combined alley and curbside routes would allow the City to deploy
collection vehicles more strategically by type and capacity to maximize routing efficiency. For example, to
DRAFT
LSWMP Update Refuse and Recycling Collection
City of Dallas, Texas 6-17 Burns & McDonnell
service alleys, ASL vehicles need to service one side of the alley then turn around to service the other side
because the collection arm is only located on one side of the vehicle. Traveling down an alley twice
increases the time to collect material, number of times the collection vehicle travels along alleys, and
increases the potential for property damage. On-board technology can be used to support route adjustments
to minimize combined alley and curbside routes.
Financial impact. There would be financial benefit to minimizing alley collection and combined routes
based on reduced overtime demand, reduce vehicle maintenance costs and increased collection vehicle
capacity. Based on financial analysis modeling the hypothetical situation that all customs were collected
from curbside utilizing ASL, alley cat and PUP collection vehicles, the full system could be serviced
utilizing 115 vehicles compared to the current 12967.
Environmental impact. There would be a beneficial environmental impact to minimizing alley collection
and combined routes because the City would be better positioned to deploy vehicles that are uniquely suited
to each route’s collection environment. This would eliminate excess road miles and damage to City roads
and alleys that are required when collection vehicles are deployed to challenging collection environments
(e.g., ASL required to travel down alleys twice, smaller body vehicles required to leave routes to dispose
material more frequently).
Policy impact. Minimizing alley collection and combined routes would require consideration for adjusting
the location of residential set outs at certain locations, charging customers for the additional effort to service
in the alleys, or outsourcing collection of challenging collection environments to the private sector. These
considerations would have a high impact on the existing City Code and policy for residential customers.
Stakeholder “buy-in”. There is high “buy-in” from refuse and recycling collection operators, but low buy
in from residential customers that would potentially be required to adjust their set out location. Some
customer locations are not designed to store and transport roll carts to the curb, and other residential streets
are not conducive to curbside collection because of residential parking rules. Overall, there is medium
stakeholder “buy-in” for this option.
Compatibility with existing programs. The Sanitation Department is in the process of a re-route and is
actively seeking to minimize collection from alley set outs; however, further reducing the alley set outs and
67 Further detailed evaluation of the financial and operational impacts of transitioning to all-curbside collection is
provided as part of the draft Financial Impact of Alley Collection memorandum dated March 14, 2022.
DRAFT
LSWMP Update Refuse and Recycling Collection
City of Dallas, Texas 6-18 Burns & McDonnell
combined routes would require City-wide changes. Since this option could be implemented by making
iterative adjustments to the routing in strategic phases, it has medium compatibility with existing services.
6.4.3 Decrease Use of Diesel Collection Vehicles
Overview. This option would decrease the use of diesel vehicle fuel through the expansion of natural gas
vehicles for refuse and recycling collection and piloting BEV collection vehicles. Expanding the number
of natural gas vehicles would require a corresponding expansion of the vehicle fueling capacity (e.g.,
fueling stations, vehicle storage locations, etc.) and coordination with maintenance to ensure the expanded
number of natural gas vehicles could be maintained. Piloting a BEV collection vehicle would also require
installation of charging infrastructure and identifying funding sources that could support the purchase cost
of one or more pilot BEVs.
Recycling potential. There is no additional recycling potential for single-stream materials, but there would
be the potential to increase the recycling of organics to generate RNG through anaerobic digestion at the
SS WWTP that could be used to fuel natural gas vehicles. Increasing the natural gas demand from the
collection vehicle fleet would support increased generation of RNG.
Operational impact. The Sanitation Department utilizes 45 natural gas collection vehicles. The majority
of these vehicles are rear-load vehicles and are fueled at the operation center in District 3 and District 4.
There are no natural gas fueling stations at other operation centers, and to expand the use of natural gas
vehicles would require fueling capability in other sanitation districts. Additionally, the City would need to
have capacity and parts to manage the maintenance needs of a higher percentage of natural gas vehicles in
the fleet. To incorporate BEVs in Sanitation Department’s collection fleet, the fueling infrastructure would
need to be established to support deploying the vehicle for service. Other operational challenges would
need to be overcome including the parts and knowledge to provide specialized maintenance and repair for
BEVs, limitations on range on a given charge, and redundancy in the event the vehicle experiences
unplanned downtime. Given the limited existing fueling infrastructure for both natural gas and BEVs and
increased maintenance requirements this option would have a high operational impact.
Financial impact. The purchase cost of both CNG/RNG vehicles and BEVs are higher than their diesel
counterparts and the operations are typically less as well, but are subject to fluctuations of the fuel and
electricity market. The maintenance costs for natural gas vehicles are higher than its diesel counterparts,
particularly if the vehicle has been retrofitted as a CNG/RNG vehicle. The maintenance cost for BEVs are
less than the cost of its diesel counterparts, but require that the City has the appropriate equipment, parts
and knowledge to service electric refuse collection vehicles.
DRAFT
LSWMP Update Refuse and Recycling Collection
City of Dallas, Texas 6-19 Burns & McDonnell
Environmental impact. There are environmental benefits to replacing diesel burning vehicles with natural
gas vehicles or BEVs. There are even further environmental benefits to utilizing RNG because it has the
climate benefit of trapping methane biogases that would otherwise escape into the air as GHGs, including
from landfills. Natural gas reduces particulate matter compared to diesel burning vehicles and reduces
nitrogen oxide emissions by over 90 percent compared to the EPA standard when used in new natural gas
engines (model year 2016 or newer)68.
Policy impact. This option is operationally-focused and would not have an impact on policy.
Stakeholder “buy-in”. There is high stakeholder “buy-in” for this option because it supports CECAP goals
and incorporates state of the art technology for both natural gas vehicles and BEVs as part of the City’s
current and future fleet planning.
Compatibility with existing programs. This option is compatible with existing programs, but requires
adjustments to the City’s existing infrastructure and maintenance practices. This option has medium
compatibility with the City’s existing programs.
6.4.4 Release Procurement for Cart Supplier
Overview. As part of this option the City would procure vendors to provide roll cart sales and maintenance
before the current contract for cart purchase expires to identify the costs and needs to support future goals
as part of the LSWMP Update. The City currently has a contract in place to purchase carts and manages
and deploys carts using City resources. This procurement would solicit information related to the cost of
cart purchases (including 96- and 64-gallon cart sizes) and costs to outsource cart management operations
including cart inventory, managing warranty replacement, cart repair and replacement. Understanding the
costs of cart purchase and other service, including potential cooperative purchasing arrangements with peer
cities, would provide the information required to consider the costs of implementing future service offerings
(e.g., roll cart based organics collection) and potentially finding cost savings by outsourcing management
and maintenance of carts as the City’s cart inventory continues to age.
Recycling potential. This option would not increase the amount of recycling collected and has low
recycling potential.
68 Energy Vision. “The Refuse Revolution Leading the Way to a Sustainable Future.” https://energy-vision.org/wp-
content/uploads/2021/12/The_Refuse_Revolution.pdf
DRAFT
LSWMP Update Refuse and Recycling Collection
City of Dallas, Texas 6-20 Burns & McDonnell
Operational impact. Replacing aging carts and increasing the ability for City staff to manage inventory
supports efficient collection operations and could free resources the City currently dedicates to this activity.
These resources could be deployed elsewhere in the operation to meet service demand.
Financial impact. Releasing a procurement for cart supply and maintenance would potentially minimize
costs if the City were able to leverage cooperative purchasing with peer cities to reduce the unit price of
carts or if a third-party provider can manage carts more cost effectively by reducing the amount of staff
time required to repair, replace and distribute carts. The City would have the ability to determine if
responses were in its best interest and would only move forward if a response was more competitive than
its current cart management operation.
Environmental impact. This option would not have an environmental impact.
Policy impact. This option would not have a policy impact.
Stakeholder “buy-in”. The current cart management system supports the City’s current needs but
exploring the opportunity to leverage collective purchasing power and minimizing staff demand has high
“buy-in” from City staff.
Compatibility with existing programs. This option would not interrupt existing services and has a high
compatibility with existing programs.
6.5 Key Findings and Recommendations
This section presents the key findings and recommendations related to program and policy approaches
increasing the effectiveness of the City’s refuse and recycling collection program based on the results of
the overview, evaluation of case studies, benchmarking and stakeholder engagement. Depending on the
specific option and/or tactic, the evaluation may include both quantitative and qualities assessments which
support the assigned relative ratings for the criteria of each tactic. The meaning of the rating differs for each
option and/or tactic but can generally be described as “green circle is favorable or low impact,” “yellow
triangle is neutral or medium impact,” and “red square is less favorable or higher impact.” Further
description of the criteria is provided in Section 1.4.3. Table 6-5 shows the summary of refuse and recycling
collection options evaluation.
DRAFT
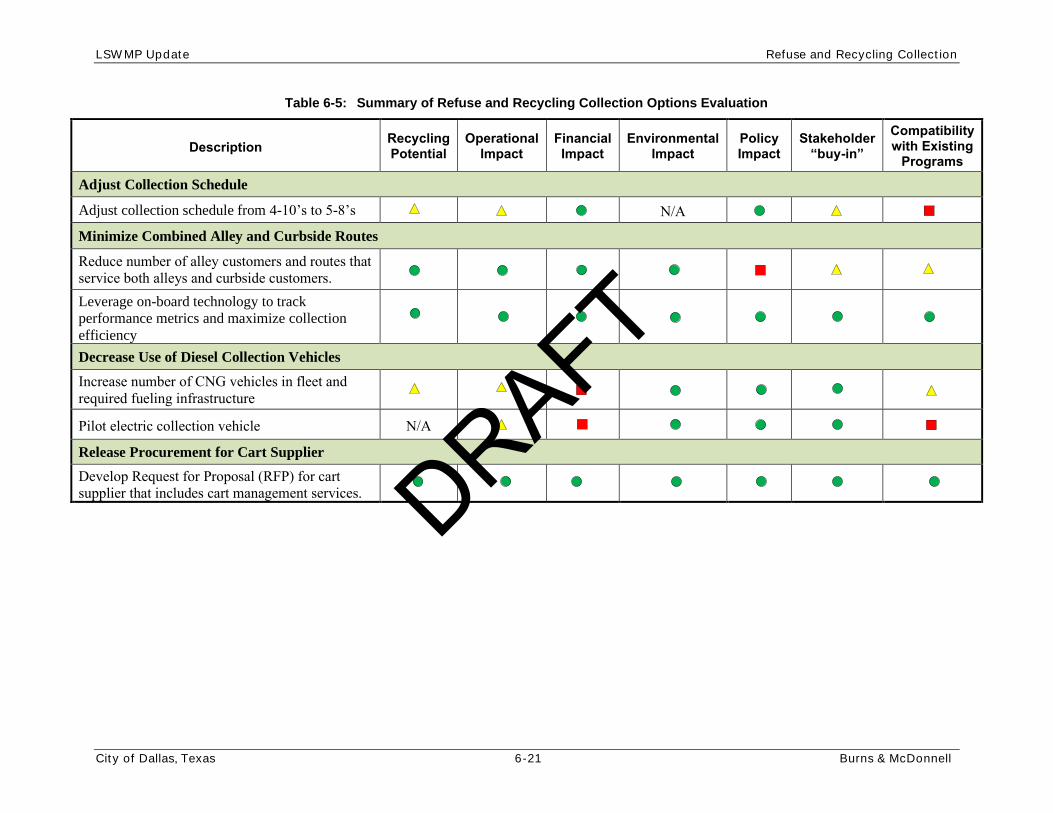
LSWMP Update Refuse and Recycling Collection
City of Dallas, Texas 6-21 Burns & McDonnell
Table 6-5: Summary of Refuse and Recycling Collection Options Evaluation
Description Recycling Potential
Operational Impact
Financial Impact
Environmental Impact
Policy Impact
Stakeholder “buy-in”
Compatibility with Existing
Programs
Adjust Collection Schedule
Adjust collection schedule from 4-10’s to 5-8’s N/A
Minimize Combined Alley and Curbside Routes
Reduce number of alley customers and routes that
service both alleys and curbside customers.
Leverage on-board technology to track
performance metrics and maximize collection
efficiency
Decrease Use of Diesel Collection Vehicles
Increase number of CNG vehicles in fleet and
required fueling infrastructure
Pilot electric collection vehicle N/A
Release Procurement for Cart Supplier
Develop Request for Proposal (RFP) for cart
supplier that includes cart management services.
DRAFT
LSWMP Update Refuse and Recycling Collection
City of Dallas, Texas 6-1 Burns & McDonnell
6.5.1 Key Findings
Each of the following key findings supports the corresponding recommendation in the subsequent section.
1. The City has an opportunity to identify opportunities to increase the efficiency of refuse and
recycling collections as part of the ongoing re-route. Evaluating adjusted routes would provide
insight to the benefit of potentially adjusting the service schedule to identify opportunities to
minimize overtime demand and reducing occurrences of overpacking vehicles and decreasing
maintenance turnaround time.
2. Transitioning collection schedule to a five-day collection week requires proactive route
planning, resource allocation, education, outreach and compliance efforts. Successfully
adjusting the collection schedule would require proactive communication with impacted residents
(particularly those whose collection day changes) and other stakeholders.
3. Adjusting existing customer set out locations is challenging but would achieve financial
savings. Changing from alley to curbside set out location is challenging for customers based on
conflicting street parking configurations, cart storage and house configuration. Some residential
single-family customers do not have a place in front of their house to store carts during the week,
or a paved path to roll carts out to the curb. At the curb, some areas of the City allow for street
parking that would block the set out of roll carts at the curb and create challenges for ASL vehicles
to service roll carts; however, there would be potential financial savings if the City were able to
transition to an all-curbside system. While it would not be possible to transition to a completely
curbside system, the City could realize financial benefits to transitioning out of the alleys.
4. Leveraging on-board hardware and software is an increasing trend among municipal
collection operations. As an example, Denton has experienced success implementing Rubicon’s
hardware and software and would provide the City with greater ability to track key performance
metrics.
5. An increasing number of customer locations are unable to be serviced by the Sanitation
Department due to high density housing developments. If City customers are required to hire
private-sector haulers for service, the Sanitation Department would be unable to prevent residents
from being assessed to higher rates or reduced levels of service.
6. BEVs are being implemented as a continued industry trend, but do not yet have the
operational track record of success necessary for widespread adoption. While there is
continued interest in BEVs as an industry trend and they are now being piloted by public and private
refuse fleets in several locations, but there is not yet an established track record that these vehicles
DRAFT
LSWMP Update Refuse and Recycling Collection
City of Dallas, Texas 6-2 Burns & McDonnell
can operate consistently under the challenging conditions facing the Sanitation Department. Since
the City currently has the maintenance and fueling infrastructure in place to support natural gas
collection vehicles, there are more practical applications to increase the amount of CNG or RNG
as part of the current collection fleet.
7. RNG presents the greatest environmental benefit from a lifecycle perspective compared to its
diesel-burning counterpart. While natural gas vehicles and BEVs are comparable from an
emissions reduction perspective compared to diesel-burning collection vehicles, RNG presents that
greatest opportunity to minimize emissions from the City’s refuse and recycling collection
operation. Additionally, the NCTCOG is pursuing regional projects to support the feasibility and
development of RNG projects and pilot programs.
6.5.2 Recommendations
Each of the following recommendations are components of the planning level Implementation & Funding
Plan provided in Appendix F.
1. Evaluate efficiencies that could be achieved by adjusting collection schedule to five days per
week, eight hours per day as part of the ongoing re-route. The City should evaluate the impact
of the reducing the number of households per route required for a five day collection week,
identifying efficiencies in the re-routed system that could position the City to implement increased
service levels in the future (e.g., every other week recycling, weekly collection of yard trimmings).
2. Develop an education, outreach, and compliance plan to establish the key steps required to
implement an adjustment to the City’s collection schedule. The Sanitation Department, OEQS
and Code Compliance should collaborate to develop an implementation plan (separate from the
Implementation & Funding Plan provided in Appendix F) to communicate service changes and the
beneficial impacts for the City to reach its Zero Waste goals. This plan should include how the City
would leverage on-board technology to support compliance efforts, required adjustments to other
City programs (e.g., brush and bulky item collection, transfer station operation), and phasing plan
regarding the implementation of the re-route.
3. Utilize on-board vehicle technology to collect key performance metrics and support
compliance efforts. The City should leverage on-board collection technology to track key
performance metrics such as daily time on-route and off-route, number of trips to
disposal/processing facilities per route, and tonnage collected per route and per household to
support the City’s “Take-a-Peek” program.
DRAFT
LSWMP Update Refuse and Recycling Collection
City of Dallas, Texas 6-3 Burns & McDonnell
4. Exit the alleys and minimize combined alley and curbside routes as part of the ongoing re-
route. The City should minimize the number of alley collection and combined routes by
strategically adjusting the collection routes and/or sanitation districts that have customers with
household configuration that allow them to change collection location.
5. The City should ensure that the Sanitation Department is involved in its permit pre-approval
review process conducted by Development Services. Including the Sanitation Department to
regularly review permit applications for mixed use developments or multi-tenant complexes would
require developers to consider solid waste collection and recycling capabilities as part of the
development process to minimize challenging collection environments.
6. Increase number of CNG and/or RNG vehicles in collection fleet and expand fueling
infrastructure. CNG and/or RNG present significant environmental benefits and support CECAP
goals of implementing a cleaner, greener solid waste collection system. The key challenge to
increase the number of CNG and/or RNG vehicles is the ability to fuel at multiple locations
throughout the City. The City should consider implementing additional CNG and/or RNG fueling
stations and leveraging NCTCOG grant funding to support this infrastructure expansion to meet
the demand of increased natural gas-burning vehicles.
7. Track ongoing efforts to implement BEVs and explore the feasibility of a BEV pilot project
based on the results from peer cities. This City should continue to track the ongoing efforts of
BEV collection vehicles around the country and explore the feasibility of running a BEV pilot upon
successful implementation of these vehicles on a long-term basis (e.g., through a full replacement
cycle) in peer cities. The City should then gauge the ability of the existing infrastructure and
maintenance capabilities to support BEVs for collection vehicles and leverage regional or national
grants or other available funding support to subsidize the purchase, infrastructure upgrade, or
maintenance needs to successfully implement a pilot project.
8. Explore opportunities to procure carts leveraging cooperative purchasing arrangement with
peer cities. The City should release an RFP in conjunction with peer cities to explore the ability to
leverage collective purchasing power with peer cities to realize cost savings on cart purchase and/or
cart management and support services.
DRAFT
LSWMP Update Brush and Bulky Item Collection
City of Dallas, Texas 7-1 Burns & McDonnell
7.0 BRUSH AND BULKY ITEM COLLECTION
Brush and bulky item collection is provided by the Sanitation Department to single-family customers using
multiple equipment types and crew configurations. Brush and bulky items represent a large portion of the
materials collected annually by the City and contains yard trimming and brush that, if separately collected
and processed, would significantly increase the recycling rate. This section presents information and
analysis regarding brush and bulky item collection including a review of the recent separate collection pilot
and other program and policy considerations to scale the separate collection of brush and bulky items.
As part of the LSWMP Update, select on-route brush and bulky item collection operations were observed
as part of the Collection Operation Observations on February 8 and 9, 2021 including multiple equipment
and staffing configurations of brush and bulky item collection. Additionally, discussions were held with
various members of management and staff to discuss ongoing operations and collect data. The City has
evaluated several potential scenarios to adjust service frequency to support separately collecting brush and
bulky items. This section relies, in part, on the past evaluation of these scenarios. Further description of the
previous evaluation and scenarios is provided in Section 7.2.
7.1 Current System Review
The City provides once a month collection of brush and bulky items to all residential refuse customers and
is included in each resident’s monthly service fee. Non-residential customers are not eligible for monthly
brush and bulky item collection services. Brush and bulky item collection is an essential service provided
by the City to maintain clean neighborhoods, minimize illegal dumping, and provide residents with a high
level of quality collection service.
Separating organic waste as part of this operation presents a significant opportunity to increase the tonnage
of material diverted from disposal annually. For the purposes of the LSWMP Update, “brush” and “bulky
items” are referred to as separate material types, anticipating that the City will ultimately collect these items
separately. In the past, the City has considered several options for implementing separate collection of brush
and bulky items; however, collections are still operated on a com-mingled basis and limits the ability for
the City to divert organics from diversion.
Residents are instructed to put brush and bulky item materials out for collection no earlier than the Thursday
preceding their scheduled collection week or later than 7:00 a.m. on the Monday of the collection week.
Table 7-1 describes acceptable material and any specific set out requirements communicated to customers
as part of brush and bulky item collection service.
DRAFT
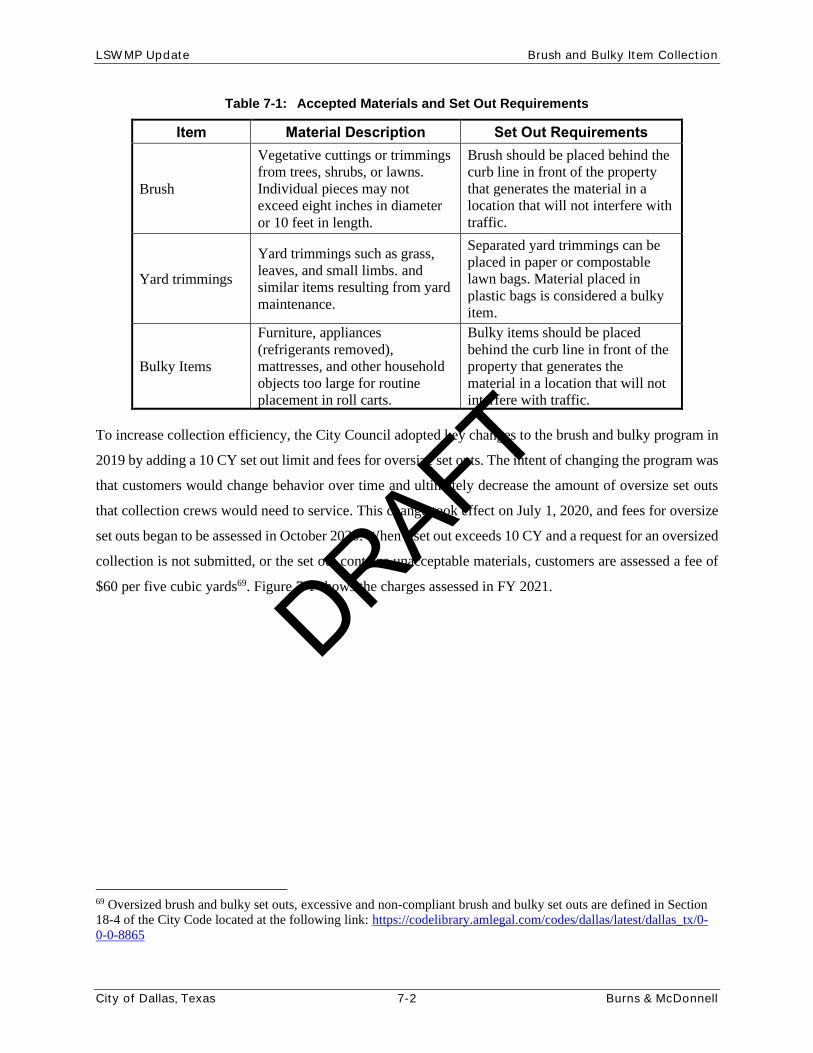
LSWMP Update Brush and Bulky Item Collection
City of Dallas, Texas 7-2 Burns & McDonnell
Table 7-1: Accepted Materials and Set Out Requirements
Item Material Description Set Out Requirements
Brush
Vegetative cuttings or trimmings
from trees, shrubs, or lawns.
Individual pieces may not
exceed eight inches in diameter
or 10 feet in length.
Brush should be placed behind the
curb line in front of the property
that generates the material in a
location that will not interfere with
traffic.
Yard trimmings
Yard trimmings such as grass,
leaves, and small limbs. and
similar items resulting from yard
maintenance.
Separated yard trimmings can be
placed in paper or compostable
lawn bags. Material placed in
plastic bags is considered a bulky
item.
Bulky Items
Furniture, appliances
(refrigerants removed),
mattresses, and other household
objects too large for routine
placement in roll carts.
Bulky items should be placed
behind the curb line in front of the
property that generates the
material in a location that will not
interfere with traffic.
To increase collection efficiency, the City Council adopted key changes to the brush and bulky program in
2019 by adding a 10 CY set out limit and fees for oversize set outs. The intent of changing the program was
that customers would change behavior over time and ultimately decrease the amount of oversize set outs
that collection crews would need to service. This change took effect on July 1, 2020, and fees for oversize
set outs began to be assessed in October 2020. When a set out exceeds 10 CY and a request for an oversized
collection is not submitted, or the set out contains unacceptable materials, customers are assessed a fee of
$60 per five cubic yards69. Figure 7-1 shows the charges assessed in FY 2021.
69 Oversized brush and bulky set outs, excessive and non-compliant brush and bulky set outs are defined in Section
18-4 of the City Code located at the following link: https://codelibrary.amlegal.com/codes/dallas/latest/dallas_tx/0-
0-0-8865
DRAFT
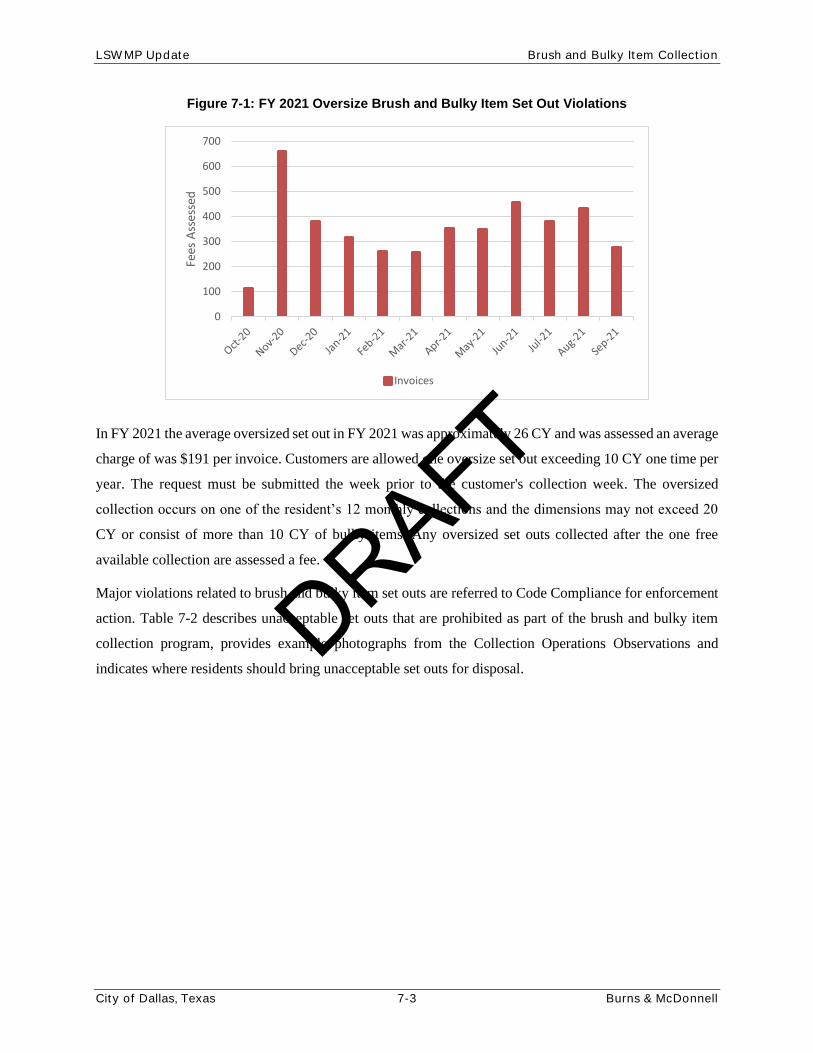
LSWMP Update Brush and Bulky Item Collection
City of Dallas, Texas 7-3 Burns & McDonnell
Figure 7-1: FY 2021 Oversize Brush and Bulky Item Set Out Violations
In FY 2021 the average oversized set out in FY 2021 was approximately 26 CY and was assessed an average
charge of was $191 per invoice. Customers are allowed one oversize set out exceeding 10 CY one time per
year. The request must be submitted the week prior to the customer's collection week. The oversized
collection occurs on one of the resident’s 12 monthly collections and the dimensions may not exceed 20
CY or consist of more than 10 CY of bulky items. Any oversized set outs collected after the one free
available collection are assessed a fee.
Major violations related to brush and bulky item set outs are referred to Code Compliance for enforcement
action. Table 7-2 describes unacceptable set outs that are prohibited as part of the brush and bulky item
collection program, provides example photographs from the Collection Operations Observations and
indicates where residents should bring unacceptable set outs for disposal.
0
100
200
300
400
500
600
700
Fees
Ass
esse
d
Invoices
DRAFT
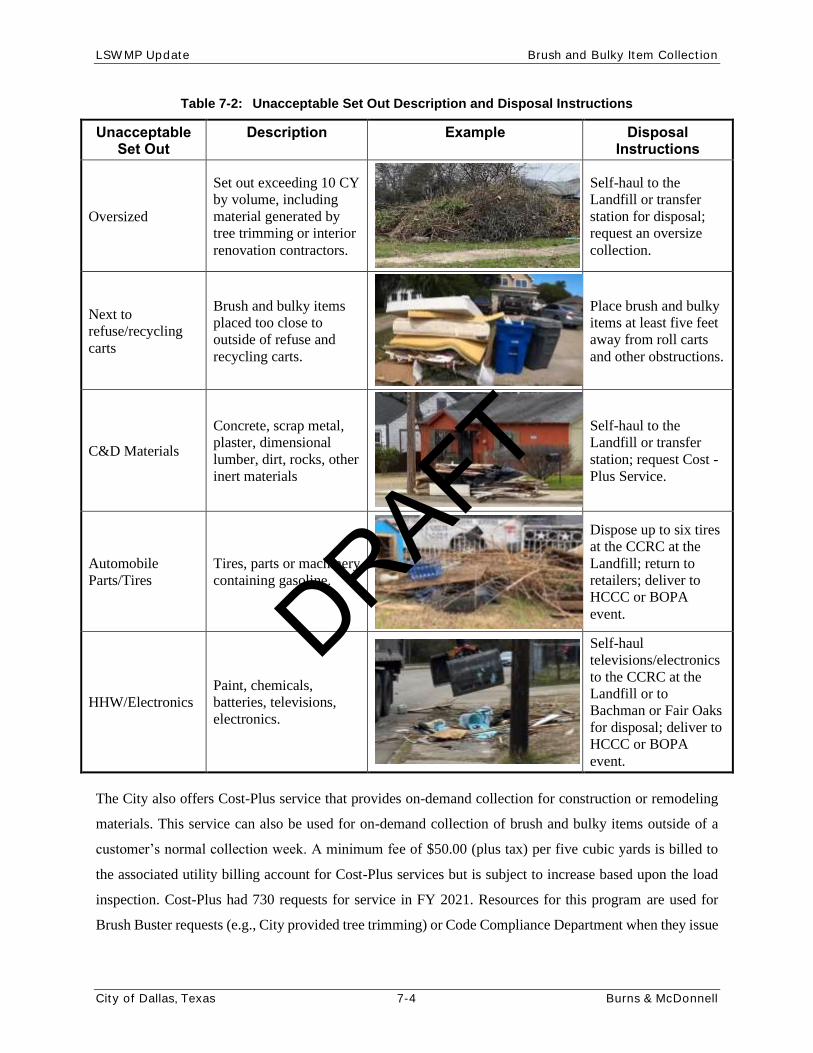
LSWMP Update Brush and Bulky Item Collection
City of Dallas, Texas 7-4 Burns & McDonnell
Table 7-2: Unacceptable Set Out Description and Disposal Instructions
Unacceptable Set Out
Description Example Disposal Instructions
Oversized
Set out exceeding 10 CY
by volume, including
material generated by
tree trimming or interior
renovation contractors.
Self-haul to the
Landfill or transfer
station for disposal;
request an oversize
collection.
Next to
refuse/recycling
carts
Brush and bulky items
placed too close to
outside of refuse and
recycling carts.
Place brush and bulky
items at least five feet
away from roll carts
and other obstructions.
C&D Materials
Concrete, scrap metal,
plaster, dimensional
lumber, dirt, rocks, other
inert materials
Self-haul to the
Landfill or transfer
station; request Cost -
Plus Service.
Automobile
Parts/Tires
Tires, parts or machinery
containing gasoline.
Dispose up to six tires
at the CCRC at the
Landfill; return to
retailers; deliver to
HCCC or BOPA
event.
HHW/Electronics
Paint, chemicals,
batteries, televisions,
electronics.
Self-haul
televisions/electronics
to the CCRC at the
Landfill or to
Bachman or Fair Oaks
for disposal; deliver to
HCCC or BOPA
event.
The City also offers Cost-Plus service that provides on-demand collection for construction or remodeling
materials. This service can also be used for on-demand collection of brush and bulky items outside of a
customer’s normal collection week. A minimum fee of $50.00 (plus tax) per five cubic yards is billed to
the associated utility billing account for Cost-Plus services but is subject to increase based upon the load
inspection. Cost-Plus had 730 requests for service in FY 2021. Resources for this program are used for
Brush Buster requests (e.g., City provided tree trimming) or Code Compliance Department when they issue
DRAFT
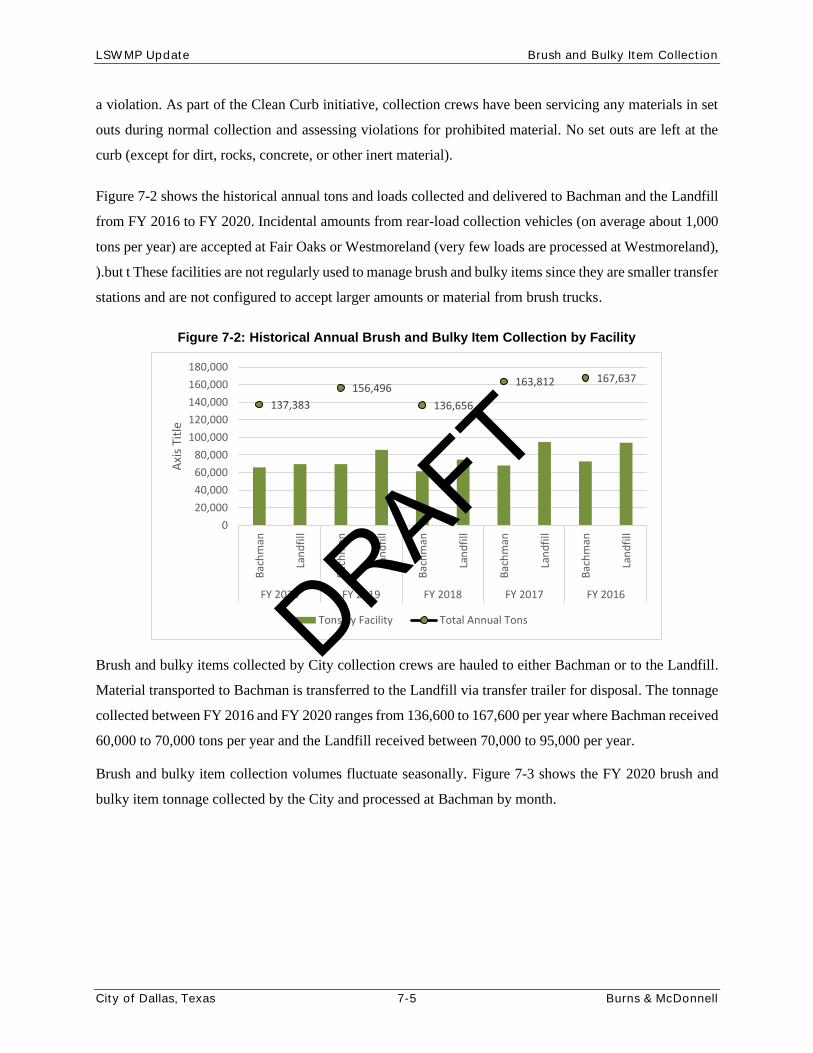
LSWMP Update Brush and Bulky Item Collection
City of Dallas, Texas 7-5 Burns & McDonnell
a violation. As part of the Clean Curb initiative, collection crews have been servicing any materials in set
outs during normal collection and assessing violations for prohibited material. No set outs are left at the
curb (except for dirt, rocks, concrete, or other inert material).
Figure 7-2 shows the historical annual tons and loads collected and delivered to Bachman and the Landfill
from FY 2016 to FY 2020. Incidental amounts from rear-load collection vehicles (on average about 1,000
tons per year) are accepted at Fair Oaks or Westmoreland (very few loads are processed at Westmoreland),
).but t These facilities are not regularly used to manage brush and bulky items since they are smaller transfer
stations and are not configured to accept larger amounts or material from brush trucks.
Figure 7-2: Historical Annual Brush and Bulky Item Collection by Facility
Brush and bulky items collected by City collection crews are hauled to either Bachman or to the Landfill.
Material transported to Bachman is transferred to the Landfill via transfer trailer for disposal. The tonnage
collected between FY 2016 and FY 2020 ranges from 136,600 to 167,600 per year where Bachman received
60,000 to 70,000 tons per year and the Landfill received between 70,000 to 95,000 per year.
Brush and bulky item collection volumes fluctuate seasonally. Figure 7-3 shows the FY 2020 brush and
bulky item tonnage collected by the City and processed at Bachman by month.
137,383
156,496
136,656
163,812 167,637
0
20,000
40,000
60,000
80,000
100,000
120,000
140,000
160,000
180,000
Bac
hm
an
Lan
dfi
ll
Bac
hm
an
Lan
dfi
ll
Bac
hm
an
Lan
dfi
ll
Bac
hm
an
Lan
dfi
ll
Bac
hm
an
Lan
dfi
ll
FY 2020 FY 2019 FY 2018 FY 2017 FY 2016
Axi
s Ti
tle
Tons by Facility Total Annual TonsDRAFT
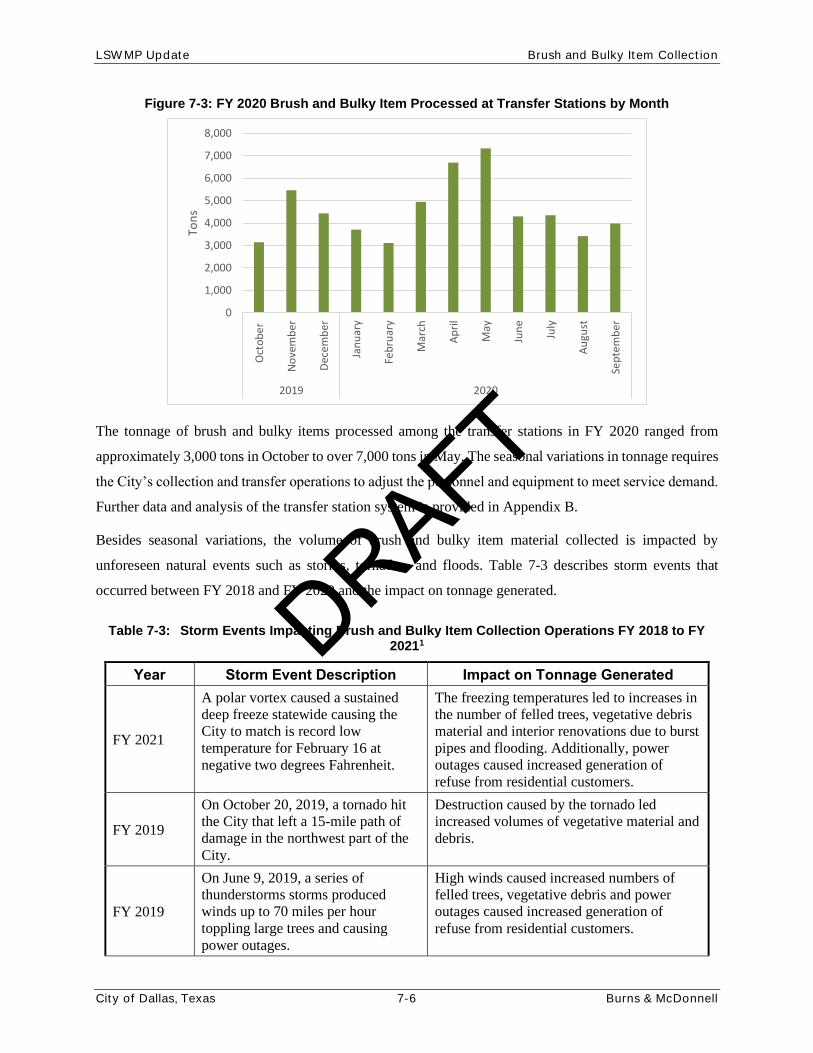
LSWMP Update Brush and Bulky Item Collection
City of Dallas, Texas 7-6 Burns & McDonnell
Figure 7-3: FY 2020 Brush and Bulky Item Processed at Transfer Stations by Month
The tonnage of brush and bulky items processed among the transfer stations in FY 2020 ranged from
approximately 3,000 tons in October to over 7,000 tons in May. The seasonal variations in tonnage requires
the City’s collection and transfer operations to adjust the personnel and equipment to meet service demand.
Further data and analysis of the transfer station system is provided in Appendix B.
Besides seasonal variations, the volume of brush and bulky item material collected is impacted by
unforeseen natural events such as storms, tornados, and floods. Table 7-3 describes storm events that
occurred between FY 2018 and FY 2020 and the impact on tonnage generated.
Table 7-3: Storm Events Impacting Brush and Bulky Item Collection Operations FY 2018 to FY 20211
Year Storm Event Description Impact on Tonnage Generated
FY 2021
A polar vortex caused a sustained
deep freeze statewide causing the
City to match is record low
temperature for February 16 at
negative two degrees Fahrenheit.
The freezing temperatures led to increases in
the number of felled trees, vegetative debris
material and interior renovations due to burst
pipes and flooding. Additionally, power
outages caused increased generation of
refuse from residential customers.
FY 2019
On October 20, 2019, a tornado hit
the City that left a 15-mile path of
damage in the northwest part of the
City.
Destruction caused by the tornado led
increased volumes of vegetative material and
debris.
FY 2019
On June 9, 2019, a series of
thunderstorms storms produced
winds up to 70 miles per hour
toppling large trees and causing
power outages.
High winds caused increased numbers of
felled trees, vegetative debris and power
outages caused increased generation of
refuse from residential customers.
0
1,000
2,000
3,000
4,000
5,000
6,000
7,000
8,000
Oct
ob
er
No
vem
ber
Dec
em
ber
Jan
uar
y
Feb
ruar
y
Mar
ch
Ap
ril
May
Jun
e
July
Au
gust
Sep
tem
ber
2019 2020
Ton
s
DRAFT
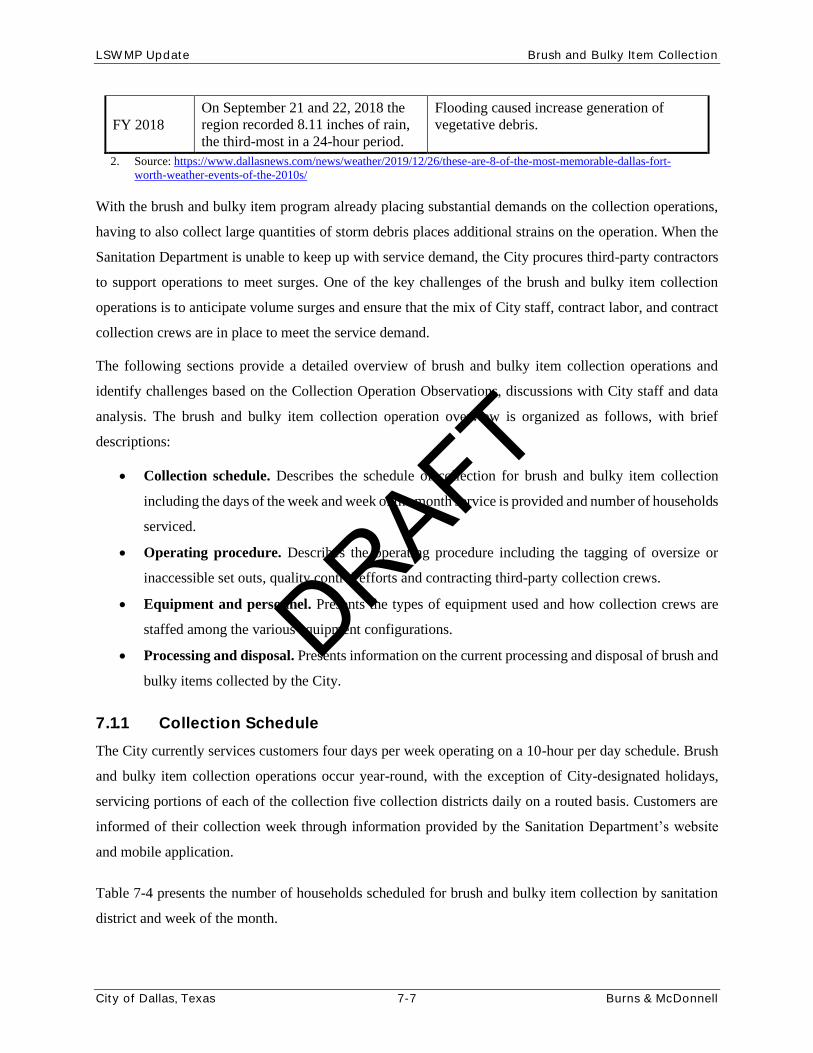
LSWMP Update Brush and Bulky Item Collection
City of Dallas, Texas 7-7 Burns & McDonnell
FY 2018
On September 21 and 22, 2018 the
region recorded 8.11 inches of rain,
the third-most in a 24-hour period.
Flooding caused increase generation of
vegetative debris.
2. Source: https://www.dallasnews.com/news/weather/2019/12/26/these-are-8-of-the-most-memorable-dallas-fort-
worth-weather-events-of-the-2010s/
With the brush and bulky item program already placing substantial demands on the collection operations,
having to also collect large quantities of storm debris places additional strains on the operation. When the
Sanitation Department is unable to keep up with service demand, the City procures third-party contractors
to support operations to meet surges. One of the key challenges of the brush and bulky item collection
operations is to anticipate volume surges and ensure that the mix of City staff, contract labor, and contract
collection crews are in place to meet the service demand.
The following sections provide a detailed overview of brush and bulky item collection operations and
identify challenges based on the Collection Operation Observations, discussions with City staff and data
analysis. The brush and bulky item collection operation overview is organized as follows, with brief
descriptions:
• Collection schedule. Describes the schedule of collection for brush and bulky item collection
including the days of the week and week of the month service is provided and number of households
serviced.
• Operating procedure. Describes the operating procedure including the tagging of oversize or
inaccessible set outs, quality control efforts and contracting third-party collection crews.
• Equipment and personnel. Presents the types of equipment used and how collection crews are
staffed among the various equipment configurations.
• Processing and disposal. Presents information on the current processing and disposal of brush and
bulky items collected by the City.
7.1.1 Collection Schedule
The City currently services customers four days per week operating on a 10-hour per day schedule. Brush
and bulky item collection operations occur year-round, with the exception of City-designated holidays,
servicing portions of each of the collection five collection districts daily on a routed basis. Customers are
informed of their collection week through information provided by the Sanitation Department’s website
and mobile application.
Table 7-4 presents the number of households scheduled for brush and bulky item collection by sanitation
district and week of the month.
DRAFT
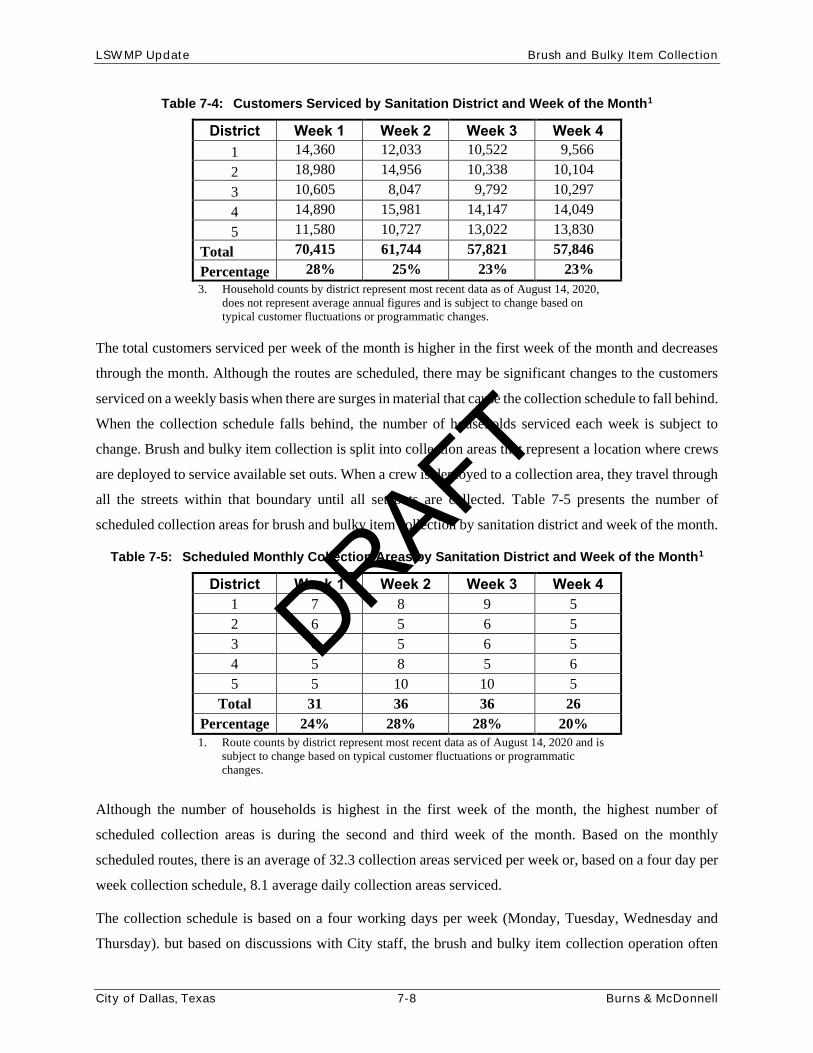
LSWMP Update Brush and Bulky Item Collection
City of Dallas, Texas 7-8 Burns & McDonnell
Table 7-4: Customers Serviced by Sanitation District and Week of the Month1
District Week 1 Week 2 Week 3 Week 4
1 14,360 12,033 10,522 9,566
2 18,980 14,956 10,338 10,104
3 10,605 8,047 9,792 10,297
4 14,890 15,981 14,147 14,049
5 11,580 10,727 13,022 13,830
Total 70,415 61,744 57,821 57,846
Percentage 28% 25% 23% 23%
3. Household counts by district represent most recent data as of August 14, 2020,
does not represent average annual figures and is subject to change based on
typical customer fluctuations or programmatic changes.
The total customers serviced per week of the month is higher in the first week of the month and decreases
through the month. Although the routes are scheduled, there may be significant changes to the customers
serviced on a weekly basis when there are surges in material that cause the collection schedule to fall behind.
When the collection schedule falls behind, the number of households serviced each week is subject to
change. Brush and bulky item collection is split into collection areas that represent a location where crews
are deployed to service available set outs. When a crew is deployed to a collection area, they travel through
all the streets within that boundary until all set outs are collected. Table 7-5 presents the number of
scheduled collection areas for brush and bulky item collection by sanitation district and week of the month.
Table 7-5: Scheduled Monthly Collection Areas by Sanitation District and Week of the Month1
District Week 1 Week 2 Week 3 Week 4
1 7 8 9 5
2 6 5 6 5
3 8 5 6 5
4 5 8 5 6
5 5 10 10 5
Total 31 36 36 26
Percentage 24% 28% 28% 20%
1. Route counts by district represent most recent data as of August 14, 2020 and is
subject to change based on typical customer fluctuations or programmatic
changes.
Although the number of households is highest in the first week of the month, the highest number of
scheduled collection areas is during the second and third week of the month. Based on the monthly
scheduled routes, there is an average of 32.3 collection areas serviced per week or, based on a four day per
week collection schedule, 8.1 average daily collection areas serviced.
The collection schedule is based on a four working days per week (Monday, Tuesday, Wednesday and
Thursday). but based on discussions with City staff, the brush and bulky item collection operation often
DRAFT
LSWMP Update Brush and Bulky Item Collection
City of Dallas, Texas 7-9 Burns & McDonnell
deploys crews on Fridays, Saturdays and Sundays to meet collection demand. Equipment from the refuse
and recycling collection program (reference Section 6.0) is utilized on Wednesdays and Saturdays, as-
needed, to meet service demand by collecting smaller set outs. Collections operations managers anticipate
the need to The City should be deploying about 31 crews per day to meet the scheduled service demand,
but due to labor shortages has only been able to deploy about half of that on a daily basis which challenges
crews to completely service collection areas. This causes the collection operation to deploy crews on
Fridays, Saturdays and Sundays to meet service demand and, as a result, the City to incur rising overtime
costs rise. and creates challenges completing daily routes, particularly during labor shortages. Further
discussion about the equipment and personnel requirements are provided in Section 7.1.4.
When there are disruptions in the typical collection schedule (e.g., routes are not able to be completed and
are completed the following day or weeks), brush and bulky item collection operators struggle to deploy
resources to maintain the scheduled service collection and make up for portions of routes that were not
collected. The collection districts operate independently as it relates to deploying personnel and equipment,
although resources are shared from one district to shift to another on an as-needed basis similar to the refuse
and recycling collection operation.
Consequently, when the collection schedule falls behind, determining which sanitation districts and areas
within those districts to prioritize becomes a major operational challenge. The determination of which areas
to prioritize occur on a case-by-case basis and are impacted by which areas are experiencing surges in
material, available staffing and equipment, and requests from residents through 311 or other City
departments. As part of the stakeholder engagement effort, residential customers expressed frustrations
about requests to make these determinations with all possible equity. Further discussion of the operating on
procedures related to brush and bulky item collection is provided in Section 7.1.3.
7.1.2 Operating Procedures
This section describes the operating procedures related to the collection and management of brush and
bulky items . The following describes the key components of the Sanitation Department’s current operating
procedures based on the Collection Operations Observations and discussions with City staff:
• Collection. Set outs are not allowed in alleys (paved or unpaved), in front of a vacant lot or business
or within five feet from a roll cart, mailbox, fence, wall, fire hydrant, water meter, telephone
connection box, parked cars or under low hanging tree limbs or power lines. Collection crews
collect brush and bulky item set outs in two operational configurations that are routed throughout
the sanitation districts. Equipment and personnel configurations for brush and bulky item collection
are further described in Section 7.1.4. City staff indicated that set outs placed at corner-houses (e.g.,
DRAFT
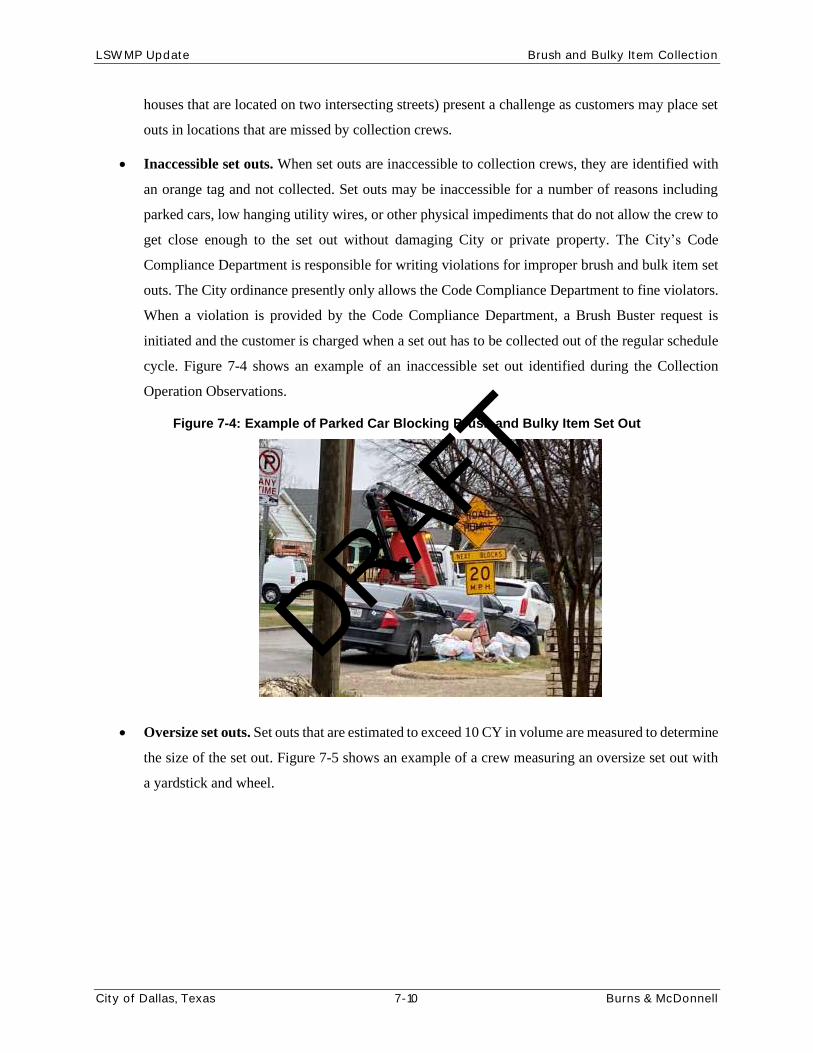
LSWMP Update Brush and Bulky Item Collection
City of Dallas, Texas 7-10 Burns & McDonnell
houses that are located on two intersecting streets) present a challenge as customers may place set
outs in locations that are missed by collection crews.
• Inaccessible set outs. When set outs are inaccessible to collection crews, they are identified with
an orange tag and not collected. Set outs may be inaccessible for a number of reasons including
parked cars, low hanging utility wires, or other physical impediments that do not allow the crew to
get close enough to the set out without damaging City or private property. The City’s Code
Compliance Department is responsible for writing violations for improper brush and bulk item set
outs. The City ordinance presently only allows the Code Compliance Department to fine violators.
When a violation is provided by the Code Compliance Department, a Brush Buster request is
initiated and the customer is charged when a set out has to be collected out of the regular schedule
cycle. Figure 7-4 shows an example of an inaccessible set out identified during the Collection
Operation Observations.
Figure 7-4: Example of Parked Car Blocking Brush and Bulky Item Set Out
• Oversize set outs. Set outs that are estimated to exceed 10 CY in volume are measured to determine
the size of the set out. Figure 7-5 shows an example of a crew measuring an oversize set out with
a yardstick and wheel.
DRAFT
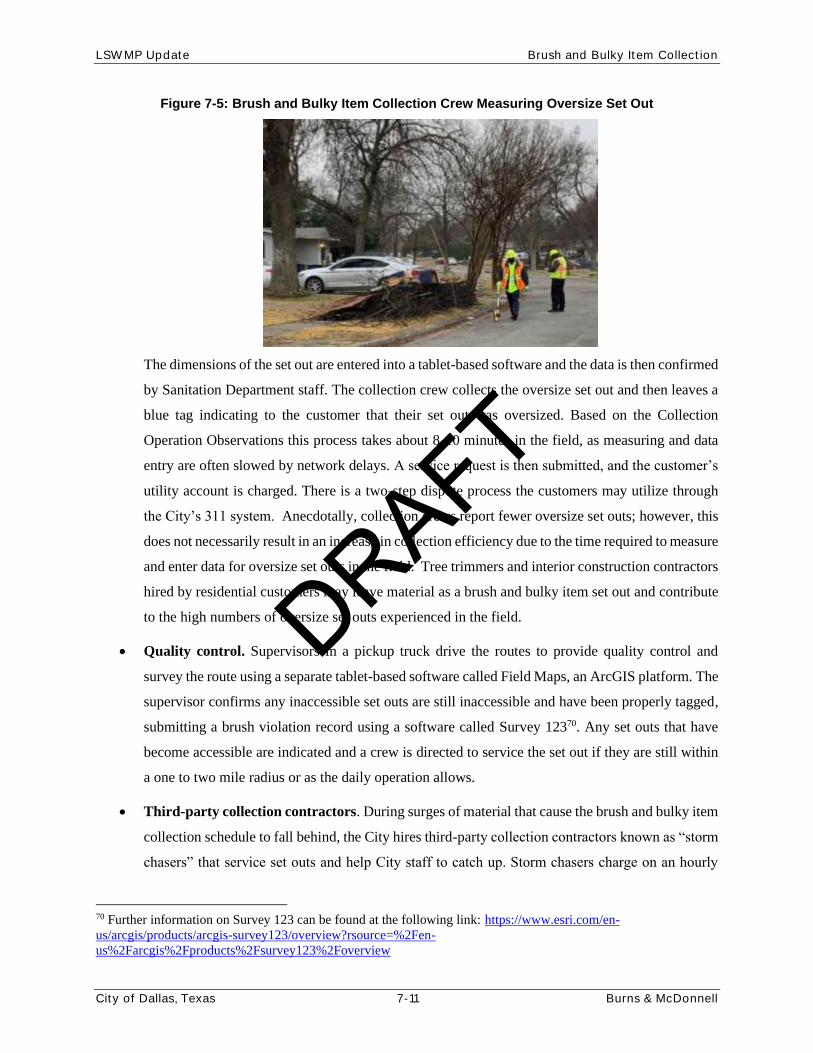
LSWMP Update Brush and Bulky Item Collection
City of Dallas, Texas 7-11 Burns & McDonnell
Figure 7-5: Brush and Bulky Item Collection Crew Measuring Oversize Set Out
The dimensions of the set out are entered into a tablet-based software and the data is then confirmed
by Sanitation Department staff. The collection crew collects the oversize set out and then leaves a
blue tag indicating to the customer that their set out was oversized. Based on the Collection
Operation Observations this process takes about 8-10 minutes in the field, as measuring and data
entry are often slowed by network delays. A service request is then submitted, and the customer’s
utility account is charged. There is a two-step dispute process the customers may utilize through
the City’s 311 system. Anecdotally, collection crews report fewer oversize set outs; however, this
does not necessarily result in an increase in collection efficiency due to the time required to measure
and enter data for oversize set outs in the field. Tree trimmers and interior construction contractors
hired by residential customers may leave material as a brush and bulky item set out and contribute
to the high numbers of oversize set outs experienced in the field.
• Quality control. Supervisors in a pickup truck drive the routes to provide quality control and
survey the route using a separate tablet-based software called Field Maps, an ArcGIS platform. The
supervisor confirms any inaccessible set outs are still inaccessible and have been properly tagged,
submitting a brush violation record using a software called Survey 12370. Any set outs that have
become accessible are indicated and a crew is directed to service the set out if they are still within
a one to two mile radius or as the daily operation allows.
• Third-party collection contractors. During surges of material that cause the brush and bulky item
collection schedule to fall behind, the City hires third-party collection contractors known as “storm
chasers” that service set outs and help City staff to catch up. Storm chasers charge on an hourly
70 Further information on Survey 123 can be found at the following link: https://www.esri.com/en-
us/arcgis/products/arcgis-survey123/overview?rsource=%2Fen-
us%2Farcgis%2Fproducts%2Fsurvey123%2Foverview
DRAFT
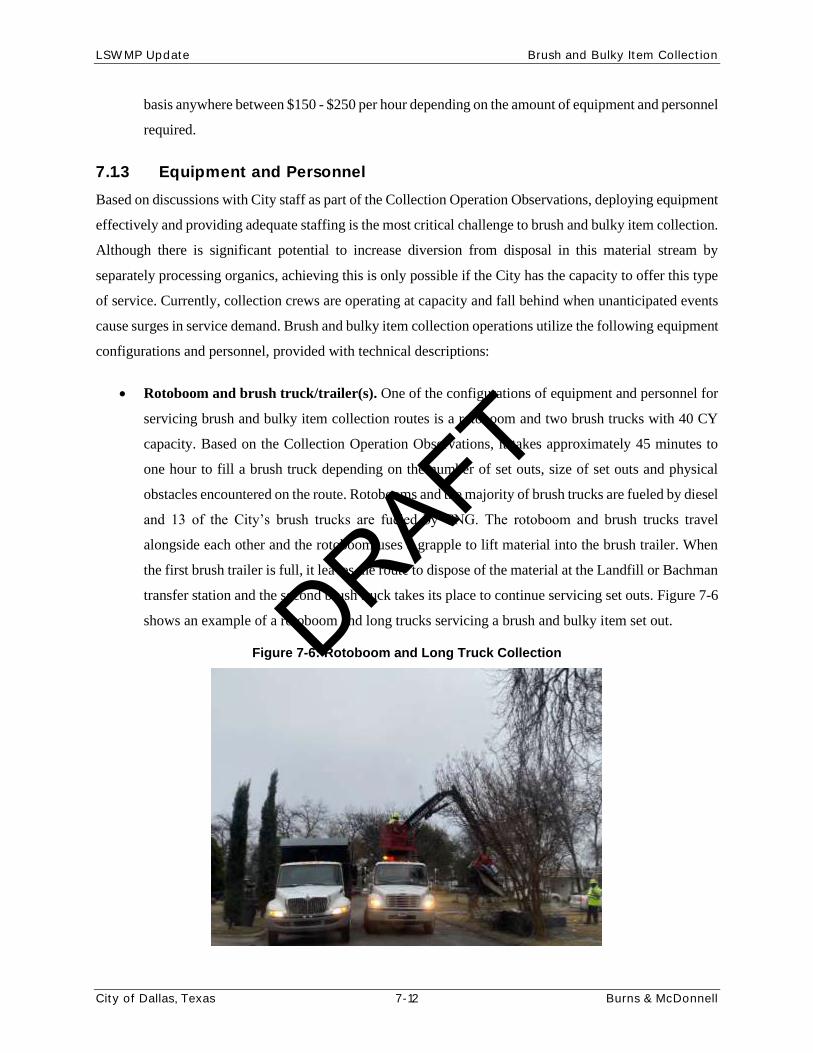
LSWMP Update Brush and Bulky Item Collection
City of Dallas, Texas 7-12 Burns & McDonnell
basis anywhere between $150 - $250 per hour depending on the amount of equipment and personnel
required.
7.1.3 Equipment and Personnel
Based on discussions with City staff as part of the Collection Operation Observations, deploying equipment
effectively and providing adequate staffing is the most critical challenge to brush and bulky item collection.
Although there is significant potential to increase diversion from disposal in this material stream by
separately processing organics, achieving this is only possible if the City has the capacity to offer this type
of service. Currently, collection crews are operating at capacity and fall behind when unanticipated events
cause surges in service demand. Brush and bulky item collection operations utilize the following equipment
configurations and personnel, provided with technical descriptions:
• Rotoboom and brush truck/trailer(s). One of the configurations of equipment and personnel for
servicing brush and bulky item collection routes is a rotoboom and two brush trucks with 40 CY
capacity. Based on the Collection Operation Observations, it takes approximately 45 minutes to
one hour to fill a brush truck depending on the number of set outs, size of set outs and physical
obstacles encountered on the route. Rotobooms and the majority of brush trucks are fueled by diesel
and 13 of the City’s brush trucks are fueled by CNG. The rotoboom and brush trucks travel
alongside each other and the rotoboom uses a grapple to lift material into the brush trailer. When
the first brush trailer is full, it leaves the route to dispose of the material at the Landfill or Bachman
transfer station and the second brush truck takes its place to continue servicing set outs. Figure 7-6
shows an example of a rotoboom and long trucks servicing a brush and bulky item set out.
Figure 7-6: Rotoboom and Long Truck Collection
DRAFT
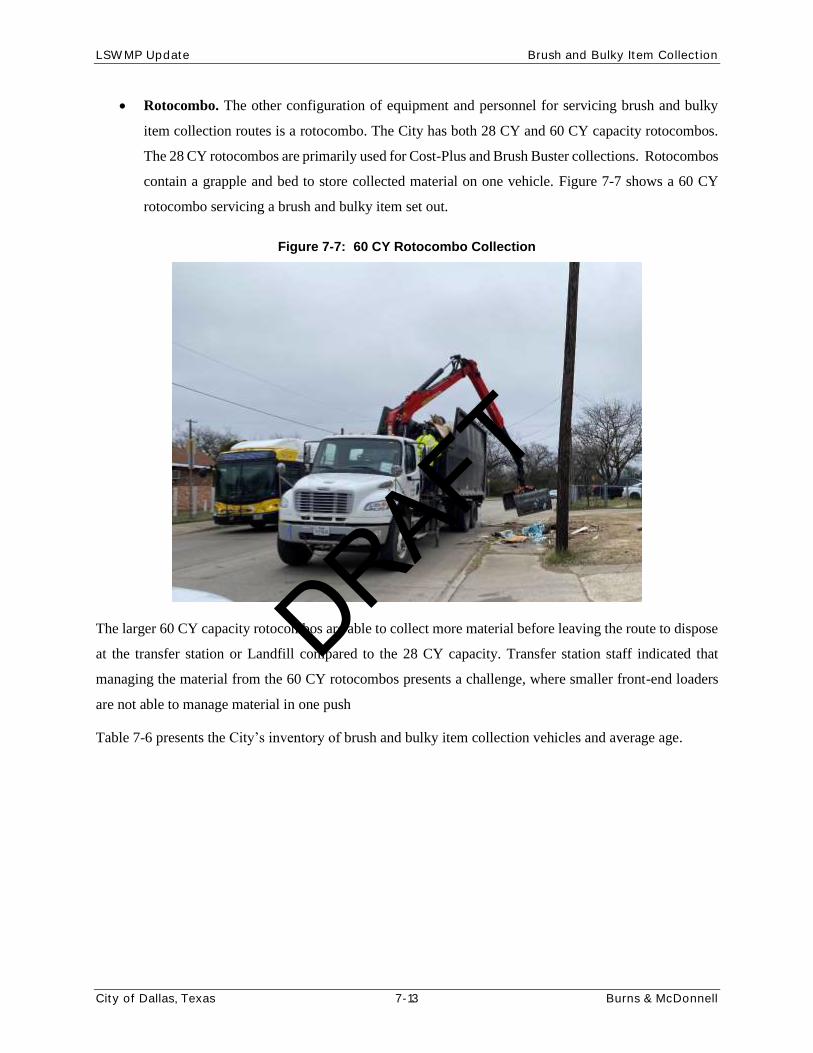
LSWMP Update Brush and Bulky Item Collection
City of Dallas, Texas 7-13 Burns & McDonnell
• Rotocombo. The other configuration of equipment and personnel for servicing brush and bulky
item collection routes is a rotocombo. The City has both 28 CY and 60 CY capacity rotocombos.
The 28 CY rotocombos are primarily used for Cost-Plus and Brush Buster collections. Rotocombos
contain a grapple and bed to store collected material on one vehicle. Figure 7-7 shows a 60 CY
rotocombo servicing a brush and bulky item set out.
Figure 7-7: 60 CY Rotocombo Collection
The larger 60 CY capacity rotocombos are able to collect more material before leaving the route to dispose
at the transfer station or Landfill compared to the 28 CY capacity. Transfer station staff indicated that
managing the material from the 60 CY rotocombos presents a challenge, where smaller front-end loaders
are not able to manage material in one push
Table 7-6 presents the City’s inventory of brush and bulky item collection vehicles and average age.
DRAFT
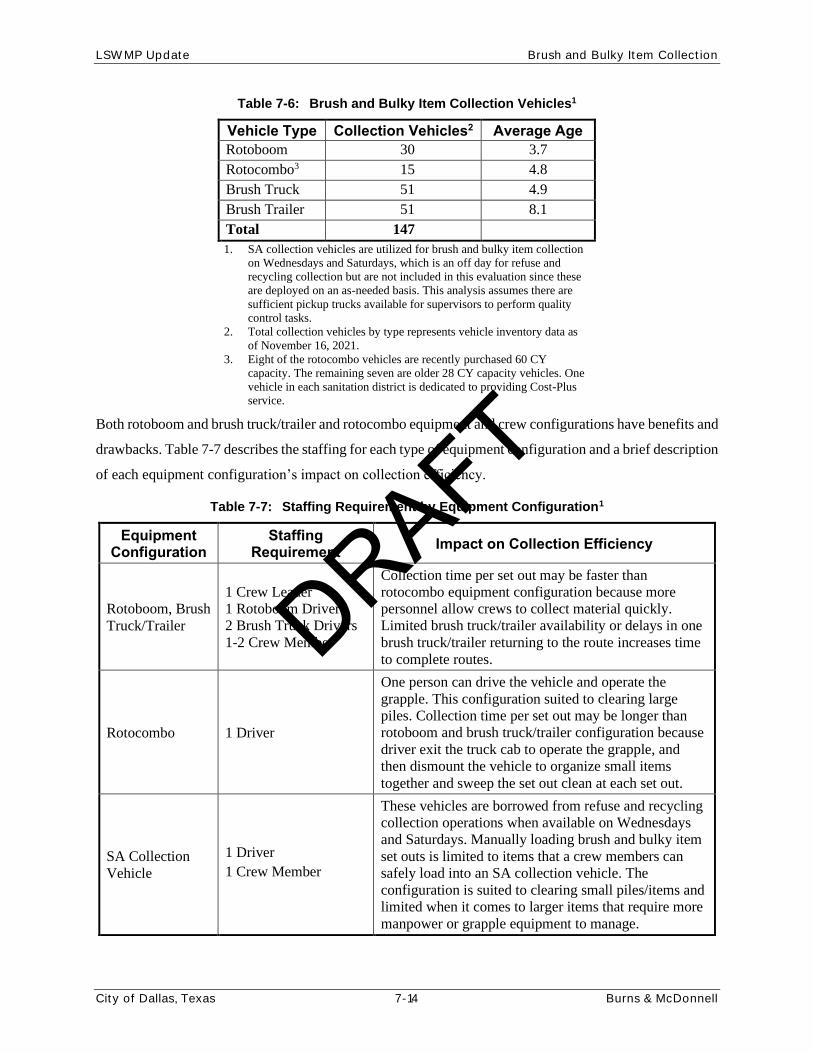
LSWMP Update Brush and Bulky Item Collection
City of Dallas, Texas 7-14 Burns & McDonnell
Table 7-6: Brush and Bulky Item Collection Vehicles1
Vehicle Type Collection Vehicles2 Average Age
Rotoboom 30 3.7
Rotocombo3 15 4.8
Brush Truck 51 4.9
Brush Trailer 51 8.1
Total 147
1. SA collection vehicles are utilized for brush and bulky item collection
on Wednesdays and Saturdays, which is an off day for refuse and
recycling collection but are not included in this evaluation since these
are deployed on an as-needed basis. This analysis assumes there are
sufficient pickup trucks available for supervisors to perform quality
control tasks.
2. Total collection vehicles by type represents vehicle inventory data as
of November 16, 2021. 3. Eight of the rotocombo vehicles are recently purchased 60 CY
capacity. The remaining seven are older 28 CY capacity vehicles. One
vehicle in each sanitation district is dedicated to providing Cost-Plus
service.
Both rotoboom and brush truck/trailer and rotocombo equipment and crew configurations have benefits and
drawbacks. Table 7-7 describes the staffing for each type of equipment configuration and a brief description
of each equipment configuration’s impact on collection efficiency.
Table 7-7: Staffing Requirement by Equipment Configuration1
Equipment Configuration
Staffing Requirement
Impact on Collection Efficiency
Rotoboom, Brush
Truck/Trailer
1 Crew Leader
1 Rotoboom Driver
2 Brush Truck Drivers
1-2 Crew Member
Collection time per set out may be faster than
rotocombo equipment configuration because more
personnel allow crews to collect material quickly.
Limited brush truck/trailer availability or delays in one
brush truck/trailer returning to the route increases time
to complete routes.
Rotocombo 1 Driver
One person can drive the vehicle and operate the
grapple. This configuration suited to clearing large
piles. Collection time per set out may be longer than
rotoboom and brush truck/trailer configuration because
driver exit the truck cab to operate the grapple, and
then dismount the vehicle to organize small items
together and sweep the set out clean at each set out.
SA Collection
Vehicle
1 Driver
1 Crew Member
These vehicles are borrowed from refuse and recycling
collection operations when available on Wednesdays
and Saturdays. Manually loading brush and bulky item
set outs is limited to items that a crew members can
safely load into an SA collection vehicle. The
configuration is suited to clearing small piles/items and
limited when it comes to larger items that require more
manpower or grapple equipment to manage.
DRAFT
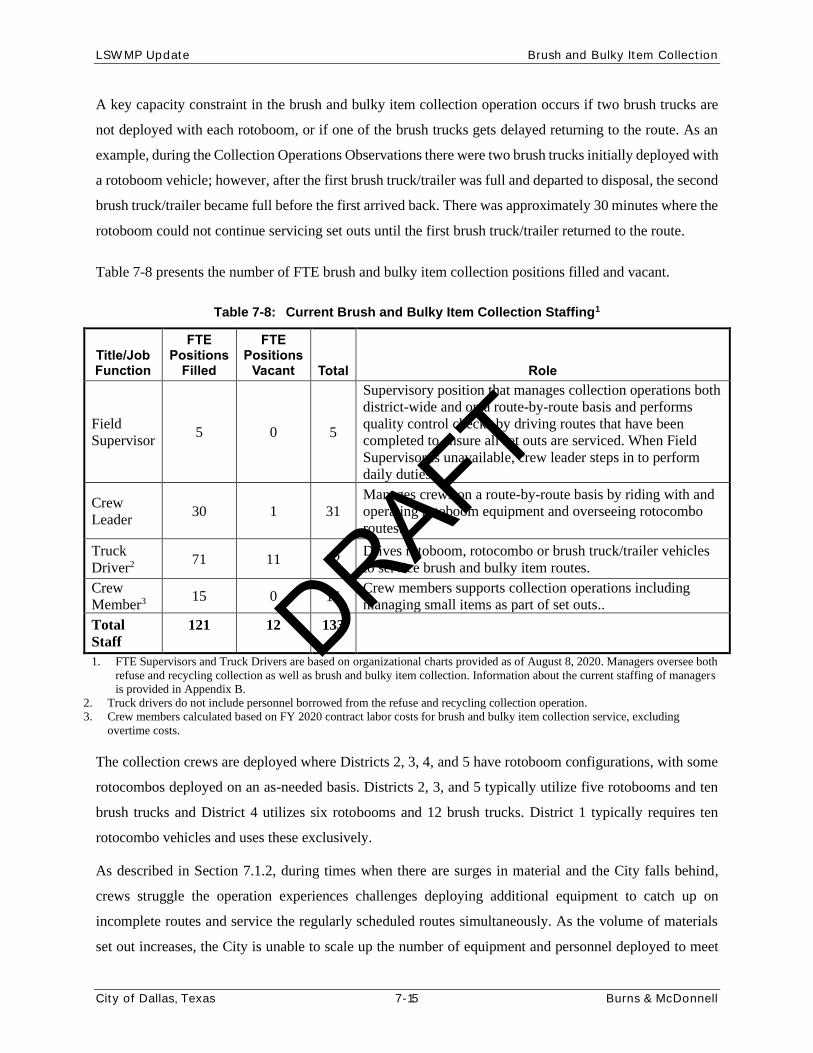
LSWMP Update Brush and Bulky Item Collection
City of Dallas, Texas 7-15 Burns & McDonnell
A key capacity constraint in the brush and bulky item collection operation occurs if two brush trucks are
not deployed with each rotoboom, or if one of the brush trucks gets delayed returning to the route. As an
example, during the Collection Operations Observations there were two brush trucks initially deployed with
a rotoboom vehicle; however, after the first brush truck/trailer was full and departed to disposal, the second
brush truck/trailer became full before the first arrived back. There was approximately 30 minutes where the
rotoboom could not continue servicing set outs until the first brush truck/trailer returned to the route.
Table 7-8 presents the number of FTE brush and bulky item collection positions filled and vacant.
Table 7-8: Current Brush and Bulky Item Collection Staffing1
Title/Job Function
FTE Positions
Filled
FTE Positions
Vacant Total Role
Field
Supervisor 5 0 5
Supervisory position that manages collection operations both
district-wide and on a route-by-route basis and performs
quality control checks by driving routes that have been
completed to ensure all set outs are serviced. When Field
Supervisor is unavailable, crew leader steps in to perform
daily duties.
Crew
Leader 30 1 31
Manages crews on a route-by-route basis by riding with and
operating rotoboom equipment and overseeing rotocombo
routes.
Truck
Driver2 71 11 82
Drives rotoboom, rotocombo or brush truck/trailer vehicles
to service brush and bulky item routes.
Crew
Member3 15 0 15 Crew members supports collection operations including
managing small items as part of set outs..
Total
Staff
121 12 133
1. FTE Supervisors and Truck Drivers are based on organizational charts provided as of August 8, 2020. Managers oversee both
refuse and recycling collection as well as brush and bulky item collection. Information about the current staffing of managers
is provided in Appendix B.
2. Truck drivers do not include personnel borrowed from the refuse and recycling collection operation.
3. Crew members calculated based on FY 2020 contract labor costs for brush and bulky item collection service, excluding
overtime costs.
The collection crews are deployed where Districts 2, 3, 4, and 5 have rotoboom configurations, with some
rotocombos deployed on an as-needed basis. Districts 2, 3, and 5 typically utilize five rotobooms and ten
brush trucks and District 4 utilizes six rotobooms and 12 brush trucks. District 1 typically requires ten
rotocombo vehicles and uses these exclusively.
As described in Section 7.1.2, during times when there are surges in material and the City falls behind,
crews struggle the operation experiences challenges deploying additional equipment to catch up on
incomplete routes and service the regularly scheduled routes simultaneously. As the volume of materials
set out increases, the City is unable to scale up the number of equipment and personnel deployed to meet
DRAFT
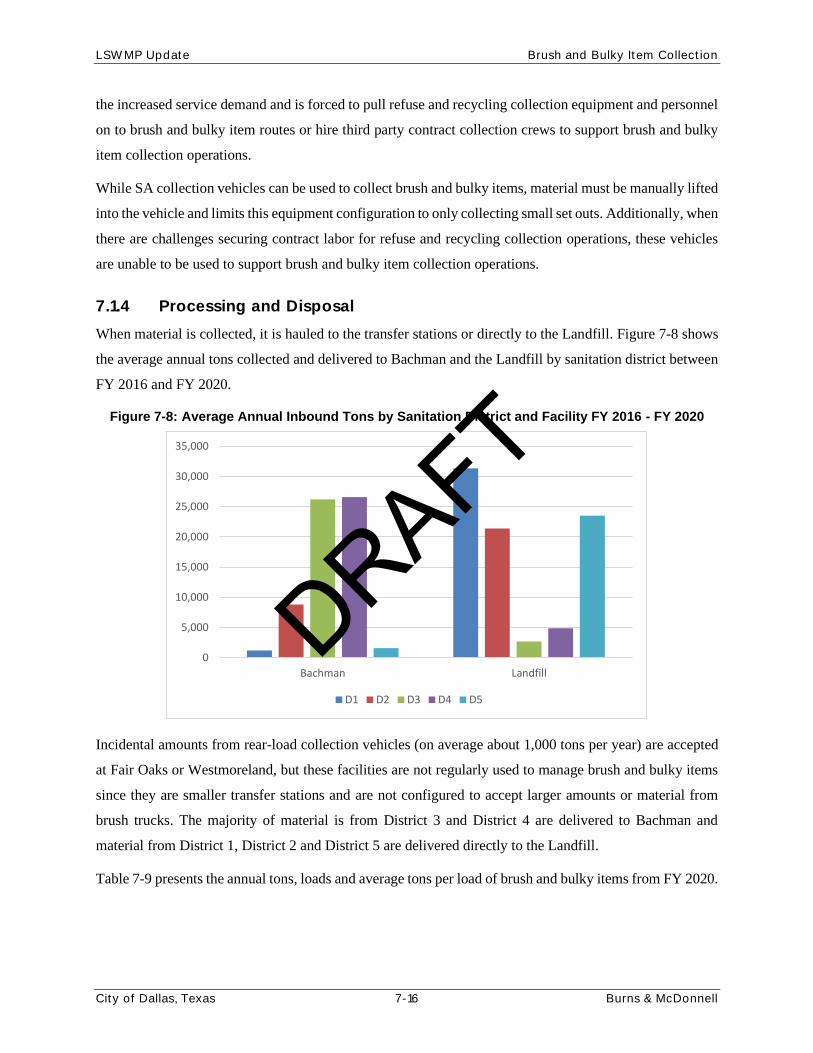
LSWMP Update Brush and Bulky Item Collection
City of Dallas, Texas 7-16 Burns & McDonnell
the increased service demand and is forced to pull refuse and recycling collection equipment and personnel
on to brush and bulky item routes or hire third party contract collection crews to support brush and bulky
item collection operations.
While SA collection vehicles can be used to collect brush and bulky items, material must be manually lifted
into the vehicle and limits this equipment configuration to only collecting small set outs. Additionally, when
there are challenges securing contract labor for refuse and recycling collection operations, these vehicles
are unable to be used to support brush and bulky item collection operations.
7.1.4 Processing and Disposal
When material is collected, it is hauled to the transfer stations or directly to the Landfill. Figure 7-8 shows
the average annual tons collected and delivered to Bachman and the Landfill by sanitation district between
FY 2016 and FY 2020.
Figure 7-8: Average Annual Inbound Tons by Sanitation District and Facility FY 2016 - FY 2020
Incidental amounts from rear-load collection vehicles (on average about 1,000 tons per year) are accepted
at Fair Oaks or Westmoreland, but these facilities are not regularly used to manage brush and bulky items
since they are smaller transfer stations and are not configured to accept larger amounts or material from
brush trucks. The majority of material is from District 3 and District 4 are delivered to Bachman and
material from District 1, District 2 and District 5 are delivered directly to the Landfill.
Table 7-9 presents the annual tons, loads and average tons per load of brush and bulky items from FY 2020.
0
5,000
10,000
15,000
20,000
25,000
30,000
35,000
Bachman Landfill
D1 D2 D3 D4 D5
DRAFT
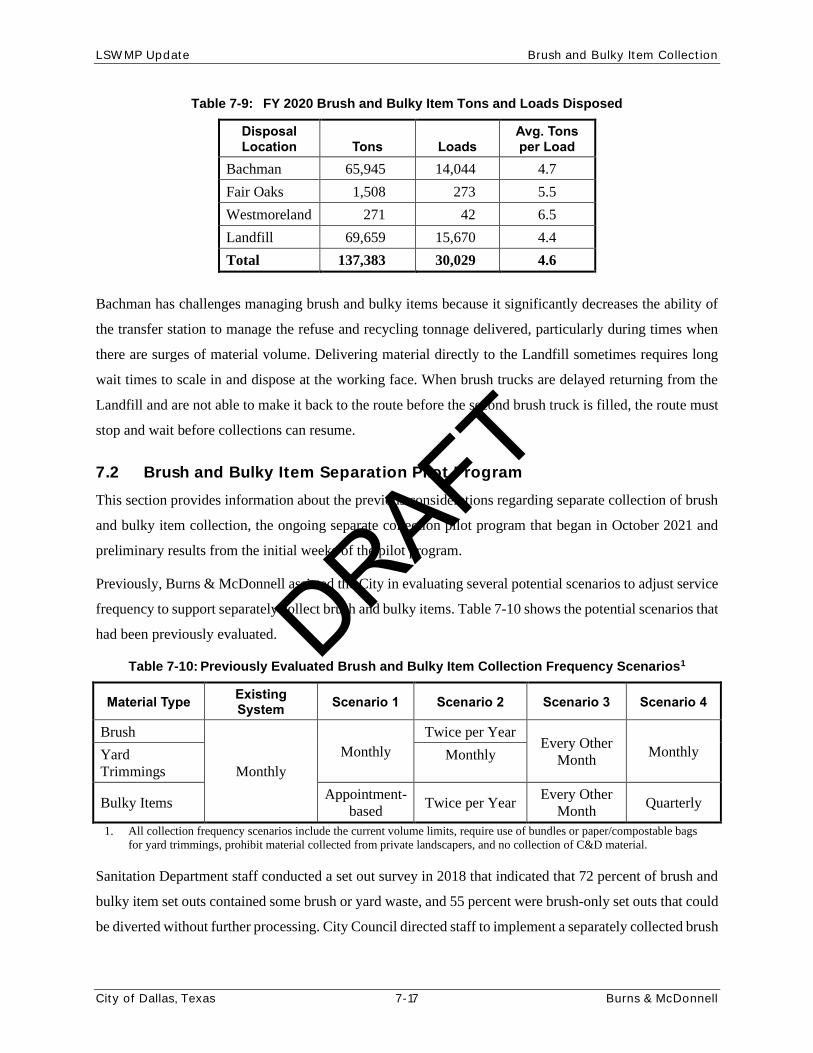
LSWMP Update Brush and Bulky Item Collection
City of Dallas, Texas 7-17 Burns & McDonnell
Table 7-9: FY 2020 Brush and Bulky Item Tons and Loads Disposed
Disposal Location Tons Loads
Avg. Tons per Load
Bachman 65,945 14,044 4.7
Fair Oaks 1,508 273 5.5
Westmoreland 271 42 6.5
Landfill 69,659 15,670 4.4
Total 137,383 30,029 4.6
Bachman has challenges managing brush and bulky items because it significantly decreases the ability of
the transfer station to manage the refuse and recycling tonnage delivered, particularly during times when
there are surges of material volume. Delivering material directly to the Landfill sometimes requires long
wait times to scale in and dispose at the working face. When brush trucks are delayed returning from the
Landfill and are not able to make it back to the route before the second brush truck is filled, the route must
stop and wait before collections can resume.
7.2 Brush and Bulky Item Separation Pilot Program
This section provides information about the previous considerations regarding separate collection of brush
and bulky item collection, the ongoing separate collection pilot program that began in October 2021 and
preliminary results from the initial weeks of the pilot program.
Previously, Burns & McDonnell assisted the City in evaluating several potential scenarios to adjust service
frequency to support separately collect brush and bulky items. Table 7-10 shows the potential scenarios that
had been previously evaluated.
Table 7-10: Previously Evaluated Brush and Bulky Item Collection Frequency Scenarios1
Material Type Existing System
Scenario 1 Scenario 2 Scenario 3 Scenario 4
Brush
Monthly
Monthly
Twice per Year Every Other
Month Monthly Yard
Trimmings
Monthly
Bulky Items Appointment-
based Twice per Year
Every Other
Month Quarterly
1. All collection frequency scenarios include the current volume limits, require use of bundles or paper/compostable bags
for yard trimmings, prohibit material collected from private landscapers, and no collection of C&D material.
Sanitation Department staff conducted a set out survey in 2018 that indicated that 72 percent of brush and
bulky item set outs contained some brush or yard waste, and 55 percent were brush-only set outs that could
be diverted without further processing. City Council directed staff to implement a separately collected brush
DRAFT
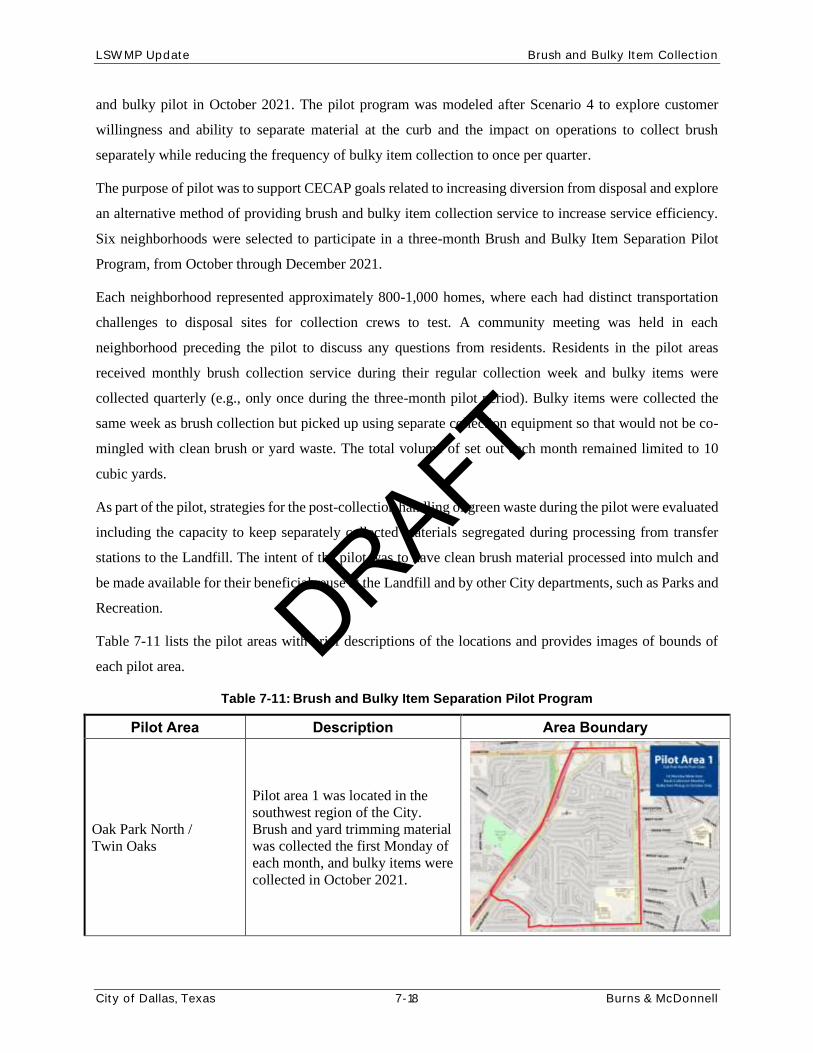
LSWMP Update Brush and Bulky Item Collection
City of Dallas, Texas 7-18 Burns & McDonnell
and bulky pilot in October 2021. The pilot program was modeled after Scenario 4 to explore customer
willingness and ability to separate material at the curb and the impact on operations to collect brush
separately while reducing the frequency of bulky item collection to once per quarter.
The purpose of pilot was to support CECAP goals related to increasing diversion from disposal and explore
an alternative method of providing brush and bulky item collection service to increase service efficiency.
Six neighborhoods were selected to participate in a three-month Brush and Bulky Item Separation Pilot
Program, from October through December 2021.
Each neighborhood represented approximately 800-1,000 homes, where each had distinct transportation
challenges to disposal sites for collection crews to test. A community meeting was held in each
neighborhood preceding the pilot to discuss any questions from residents. Residents in the pilot areas
received monthly brush collection service during their regular collection week and bulky items were
collected quarterly (e.g., only once during the three-month pilot period). Bulky items were collected the
same week as brush collection but picked up using separate collection equipment so that would not be co-
mingled with clean brush or yard waste. The total volume of set out each month remained limited to 10
cubic yards.
As part of the pilot, strategies for the post-collection handling of green waste during the pilot were evaluated
including the capacity to keep separately collected materials segregated during processing from transfer
stations to the Landfill. The intent of the pilot was to have clean brush material processed into mulch and
be made available for their beneficial reuse at the Landfill and by other City departments, such as Parks and
Recreation.
Table 7-11 lists the pilot areas with brief descriptions of the locations and provides images of bounds of
each pilot area.
Table 7-11: Brush and Bulky Item Separation Pilot Program
Pilot Area Description Area Boundary
Oak Park North /
Twin Oaks
Pilot area 1 was located in the
southwest region of the City.
Brush and yard trimming material
was collected the first Monday of
each month, and bulky items were
collected in October 2021.
DRAFT
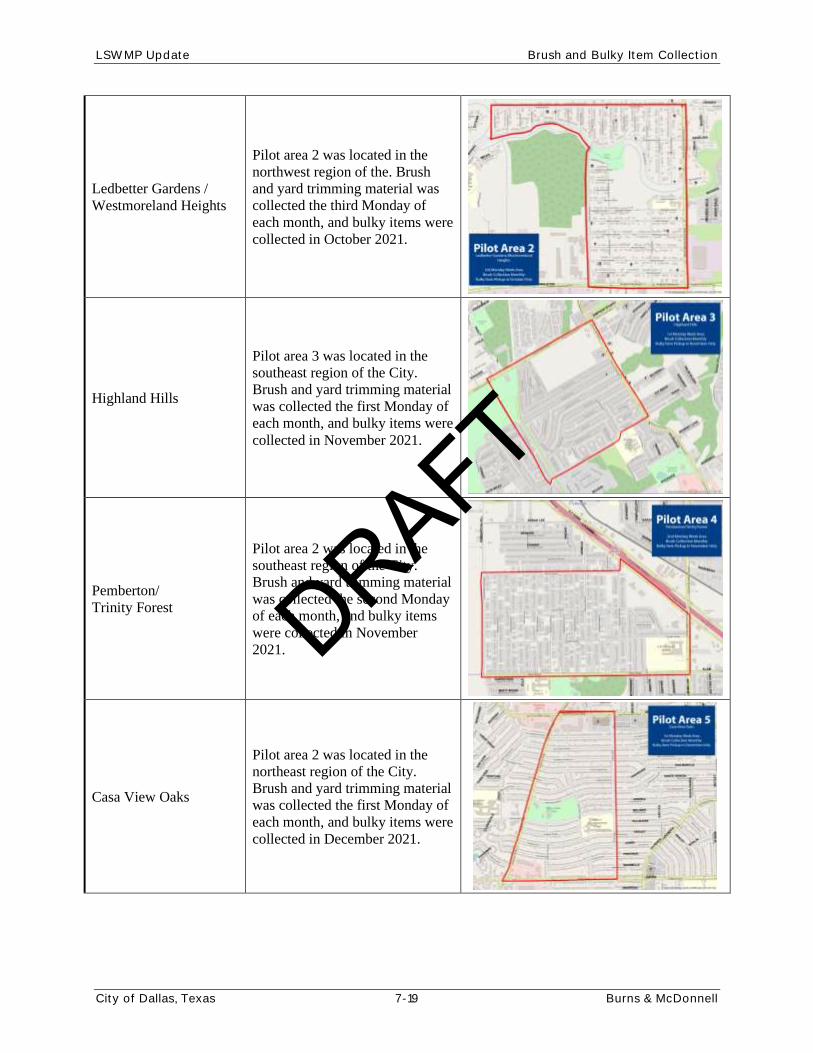
LSWMP Update Brush and Bulky Item Collection
City of Dallas, Texas 7-19 Burns & McDonnell
Ledbetter Gardens /
Westmoreland Heights
Pilot area 2 was located in the
northwest region of the. Brush
and yard trimming material was
collected the third Monday of
each month, and bulky items were
collected in October 2021.
Highland Hills
Pilot area 3 was located in the
southeast region of the City.
Brush and yard trimming material
was collected the first Monday of
each month, and bulky items were
collected in November 2021.
Pemberton/
Trinity Forest
Pilot area 2 was located in the
southeast region of the City.
Brush and yard trimming material
was collected the second Monday
of each month, and bulky items
were collected in November
2021.
Casa View Oaks
Pilot area 2 was located in the
northeast region of the City.
Brush and yard trimming material
was collected the first Monday of
each month, and bulky items were
collected in December 2021.
DRAFT
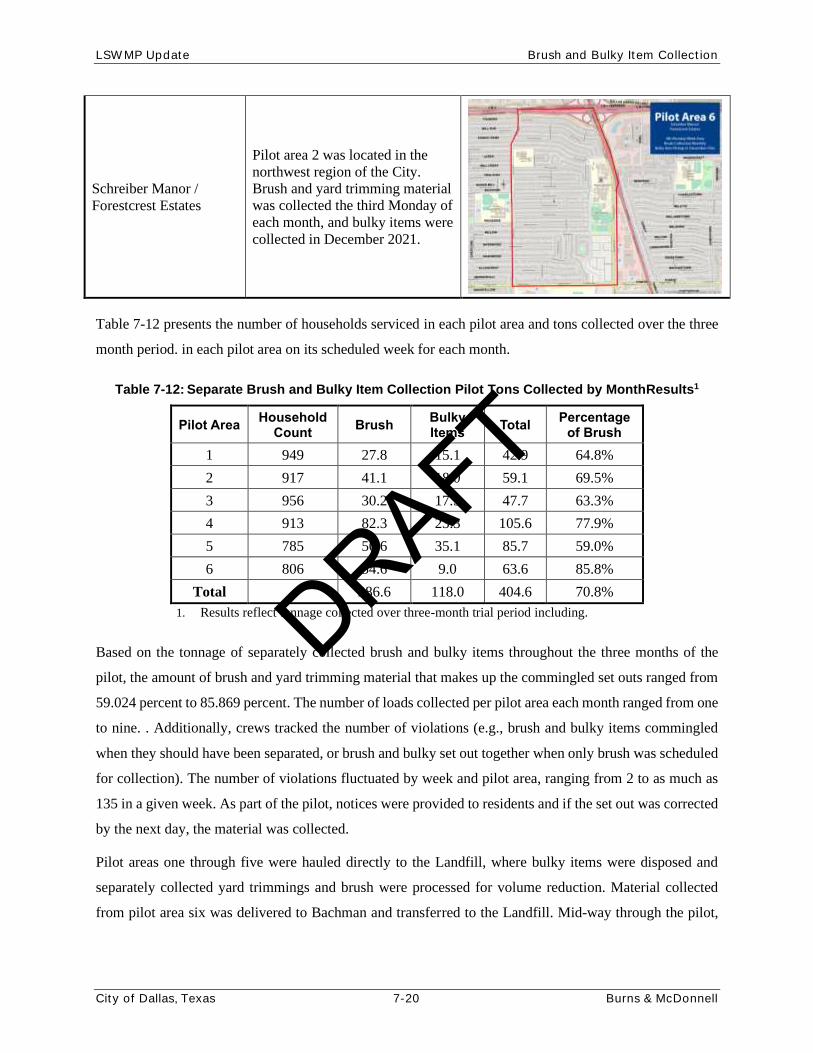
LSWMP Update Brush and Bulky Item Collection
City of Dallas, Texas 7-20 Burns & McDonnell
Schreiber Manor /
Forestcrest Estates
Pilot area 2 was located in the
northwest region of the City.
Brush and yard trimming material
was collected the third Monday of
each month, and bulky items were
collected in December 2021.
Table 7-12 presents the number of households serviced in each pilot area and tons collected over the three
month period. in each pilot area on its scheduled week for each month.
Table 7-12: Separate Brush and Bulky Item Collection Pilot Tons Collected by MonthResults1
Pilot Area Household
Count Brush
Bulky Items
Total Percentage
of Brush
1 949 27.8 15.1 42.9 64.8%
2 917 41.1 18.0 59.1 69.5%
3 956 30.2 17.5 47.7 63.3%
4 913 82.3 23.3 105.6 77.9%
5 785 50.6 35.1 85.7 59.0%
6 806 54.6 9.0 63.6 85.8%
Total
286.6 118.0 404.6 70.8%
1. Results reflect tonnage collected over three-month trial period including.
Based on the tonnage of separately collected brush and bulky items throughout the three months of the
pilot, the amount of brush and yard trimming material that makes up the commingled set outs ranged from
59.024 percent to 85.869 percent. The number of loads collected per pilot area each month ranged from one
to nine. . Additionally, crews tracked the number of violations (e.g., brush and bulky items commingled
when they should have been separated, or brush and bulky set out together when only brush was scheduled
for collection). The number of violations fluctuated by week and pilot area, ranging from 2 to as much as
135 in a given week. As part of the pilot, notices were provided to residents and if the set out was corrected
by the next day, the material was collected.
Pilot areas one through five were hauled directly to the Landfill, where bulky items were disposed and
separately collected yard trimmings and brush were processed for volume reduction. Material collected
from pilot area six was delivered to Bachman and transferred to the Landfill. Mid-way through the pilot,
DRAFT
LSWMP Update Brush and Bulky Item Collection
City of Dallas, Texas 7-21 Burns & McDonnell
the area where separately collected brush and bulky items were stored at Bachman became unavailable. At
that point in the pilot, the material was co-mingled for transportation to Landfill.
From an operational perspective, the separate collection structure increased the number of equipment and
personnel required to meet service demand. On the weeks where brush and bulky items were collected,
multiple crews are deployed to separately collect material compared to the current service configuration
where one crew can provide service for commingled set outs. If scaled City-wide, the service demand would
increase due to the need to send additional crews to service brush and bulky item set outs simultaneously
for customers that are scheduled to have both materials serviced that month.
7.3 Evaluation of 2011 LSWMP Recommendations
This section evaluates the recommendations presented in the 2011 LSWMP, indicating the progress that
has been made toward the recommended policy and/or program. Additionally, this section identifies any
fundamental changes that have been made since related to programs, policies or forecasts as it relates to
brush and bulky item collection.
Table 7-13 lists the recommendations from the 2011 LSWMP related to brush and bulky item collection
with a brief description of progress to date and next steps as part of the LSWMP Update.
Table 7-13: Evaluation of 2011 LSWMP Recommendations
2011 LSWMP Recommendation
Progress To Date Potential Next Steps
Provide separate
collection for organics.
This recommendation includes
separate collection brush and yard
trimmings from residential
customers for processing and
diversion. City staff has presented
several options for implementing
separate collection of brush and
bulky items to City Council since the
2011 LWMP.
The Brush and Bulky Item Separation
Pilot Program concluded in December
2021. Data gathered as part of the pilot
will inform the evaluation of the
LSWMP Update and next steps for
collection operations as it evaluates the
feasibility of scaling separate
collection of brush and bulky items
City-wide.
Provide bulky item
reuse and recycling.
One of the options presented to City
Council was the consideration of an
appointment-based collection
program for bulky items. This
program was not included in the
Brush and Bulky Item Separation
Pilot Program. Bulky items are
currently commingled with brush
and yard trimmings and there has
been limited progress to date
providing reuse and recycling of
bulky items.
As the City considers the feasibility of
scaling separate brush and bulky item
collection City-wide, a key
consideration is to identify
opportunities to expand programmatic
and infrastructure capabilities to reuse
and/or recycling recycle of separately
collected bulky items in the future at
one or more transfer stations or
Landfill.
DRAFT
LSWMP Update Brush and Bulky Item Collection
City of Dallas, Texas 7-22 Burns & McDonnell
Separate collection of organics, including brush generated by residential customers, was a critical milestone
identified in the 2011 LSWMP required to be implemented to achieve the City’s goal of Zero Waste and
was also a key solid waste related goal in CECAP. Separate collection and processing of brush presents the
most tangible opportunity to move the needle closer to Zero Waste. The timing and goals established in the
2011 LSWMP are not feasible without separately collecting and processing brush and providing an outlet
for bulky item reuse and recycling. Further discussion about the impacts on diversion related to the separate
collection and processing of brush and other organics is provided in Section 10.0.
7.4 Benchmarking
This section provides compares the City’s brush and bulky item collection program to other programs in
peer cities in Texas. This group of peer cities has been selected to show a mix of program types and sizes
that are smaller and larger to the City’s program to provide a range examples.
The following criteria on each peer city’s brush and bulky item collection programs are provided below
with brief descriptions:
• Year. Indicates the year that the benchmarking data represents, including if it is on a fiscal year
(FY) or calendar year (CY) basis.
• Households. Represents the total households serviced as part of the benchmark collection program.
• Service provider. Indicates if collection service is provided by the municipality or a private sector
contractor.
• Service type. Describes the type of service provided to residents including routed collection or
appointment/scheduled service and if the material is collected on a separated or co-mingled basis.
• Materials accepted. Provides the materials that are accepted as part of the program.
• Service frequency. Describes the number of services provided to customers.
• Prohibited materials and set out limits. Identifies the materials prohibited and any limitations on
the amount of material that can be set out by customers.
• Pounds per household per year collected. Indicates the amount of material collected and disposed
on a pounds per household per year basis.
• Disposal allowance. The volume (CY) that is serviced on an annual basis. This represents the total
volume that is provided as part of the program, not an estimate of the volume of material collected.
Disposal allowance is calculated by multiplying the service frequency by the amount of material
that is allowed to be set out per service.
DRAFT
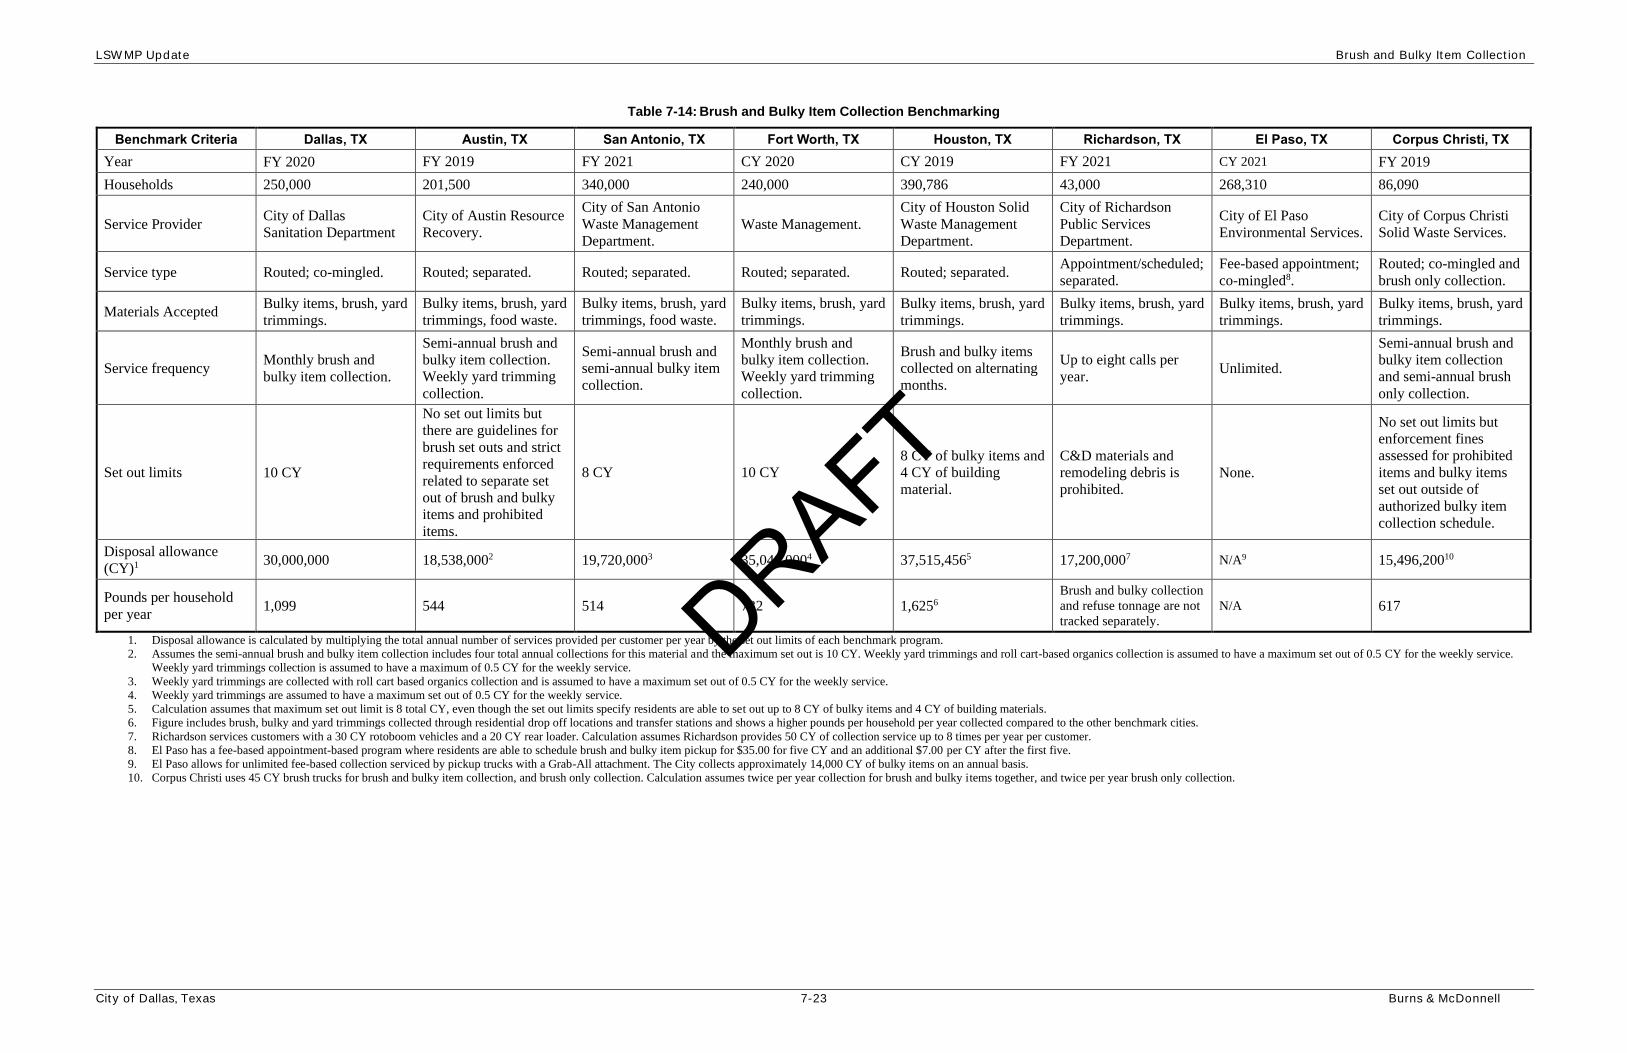
LSWMP Update Brush and Bulky Item Collection
City of Dallas, Texas 7-23 Burns & McDonnell
Table 7-14: Brush and Bulky Item Collection Benchmarking
Benchmark Criteria Dallas, TX Austin, TX San Antonio, TX Fort Worth, TX Houston, TX Richardson, TX El Paso, TX Corpus Christi, TX
Year FY 2020 FY 2019 FY 2021 CY 2020 CY 2019 FY 2021 CY 2021 FY 2019
Households 250,000 201,500 340,000 240,000 390,786 43,000 268,310 86,090
Service Provider City of Dallas
Sanitation Department
City of Austin Resource
Recovery.
City of San Antonio
Waste Management
Department.
Waste Management.
City of Houston Solid
Waste Management
Department.
City of Richardson
Public Services
Department.
City of El Paso
Environmental Services.
City of Corpus Christi
Solid Waste Services.
Service type Routed; co-mingled. Routed; separated. Routed; separated. Routed; separated. Routed; separated. Appointment/scheduled;
separated.
Fee-based appointment;
co-mingled8.
Routed; co-mingled and
brush only collection.
Materials Accepted Bulky items, brush, yard
trimmings.
Bulky items, brush, yard
trimmings, food waste.
Bulky items, brush, yard
trimmings, food waste.
Bulky items, brush, yard
trimmings.
Bulky items, brush, yard
trimmings.
Bulky items, brush, yard
trimmings.
Bulky items, brush, yard
trimmings.
Bulky items, brush, yard
trimmings.
Service frequency Monthly brush and
bulky item collection.
Semi-annual brush and
bulky item collection.
Weekly yard trimming
collection.
Semi-annual brush and
semi-annual bulky item
collection.
Monthly brush and
bulky item collection.
Weekly yard trimming
collection.
Brush and bulky items
collected on alternating
months.
Up to eight calls per
year. Unlimited.
Semi-annual brush and
bulky item collection
and semi-annual brush
only collection.
Set out limits 10 CY
No set out limits but
there are guidelines for
brush set outs and strict
requirements enforced
related to separate set
out of brush and bulky
items and prohibited
items.
8 CY 10 CY
8 CY of bulky items and
4 CY of building
material.
C&D materials and
remodeling debris is
prohibited.
None.
No set out limits but
enforcement fines
assessed for prohibited
items and bulky items
set out outside of
authorized bulky item
collection schedule.
Disposal allowance
(CY)1 30,000,000 18,538,0002 19,720,0003 35,040,0004 37,515,4565 17,200,0007 N/A9 15,496,20010
Pounds per household
per year 1,099 544 514 732 1,6256
Brush and bulky collection
and refuse tonnage are not
tracked separately.
N/A 617
1. Disposal allowance is calculated by multiplying the total annual number of services provided per customer per year by the set out limits of each benchmark program.
2. Assumes the semi-annual brush and bulky item collection includes four total annual collections for this material and the maximum set out is 10 CY. Weekly yard trimmings and roll cart-based organics collection is assumed to have a maximum set out of 0.5 CY for the weekly service.
Weekly yard trimmings collection is assumed to have a maximum of 0.5 CY for the weekly service.
3. Weekly yard trimmings are collected with roll cart based organics collection and is assumed to have a maximum set out of 0.5 CY for the weekly service.
4. Weekly yard trimmings are assumed to have a maximum set out of 0.5 CY for the weekly service.
5. Calculation assumes that maximum set out limit is 8 total CY, even though the set out limits specify residents are able to set out up to 8 CY of bulky items and 4 CY of building materials.
6. Figure includes brush, bulky and yard trimmings collected through residential drop off locations and transfer stations and shows a higher pounds per household per year collected compared to the other benchmark cities.
7. Richardson services customers with a 30 CY rotoboom vehicles and a 20 CY rear loader. Calculation assumes Richardson provides 50 CY of collection service up to 8 times per year per customer.
8. El Paso has a fee-based appointment-based program where residents are able to schedule brush and bulky item pickup for $35.00 for five CY and an additional $7.00 per CY after the first five.
9. El Paso allows for unlimited fee-based collection serviced by pickup trucks with a Grab-All attachment. The City collects approximately 14,000 CY of bulky items on an annual basis.
10. Corpus Christi uses 45 CY brush trucks for brush and bulky item collection, and brush only collection. Calculation assumes twice per year collection for brush and bulky items together, and twice per year brush only collection.
DRAFT
LSWMP Update Brush and Bulky Item Collection
City of Dallas, Texas 7-24 Burns & McDonnell
Austin and San Antonio offer cart-based food waste collection and yard trimmings are collected by this
method. While Austin does not have quantitative set out limits, they take great effort to enforce their set
out restrictions based on material type. If there are any prohibited items, the set out is not serviced. Both
Austin and San Antonio have structured their programs to provide less disposal allowance annually and
supplement brush and bulky item collection with weekly roll cart based organics collection. With these
programs in place, Austin and San Antonio collect 500 – 550 pound per household per year.
The City is consistent with other benchmark cities on its set out limits but is the only city to collect material
on a co-mingled basis without any other dedicated separated collection. Richardson and El Paso utilize an
appointment-based call-in program, and while they are a smaller municipalities (which makes this type of
system more manageable) their system allows them to create separate work order tickets based on material
types allows them to generate a clean source-separate stream of brush, bulky items, and tree trimmings.
7.5 Options Evaluation
This section analyzes a series of options related to brush and bulky item collection that have been identified
based on the results of the stakeholder engagement, evaluation of the recommendations from the 2011
LSWMP, and benchmarking comparison.
The following summarizes the key takeaways from the community survey and other outreach activities
conducted as part of the LSWMP Update:
• 44 percent of the respondents indicated they were very satisfied with the frequency of brush and
bulky item collection service. 85 percent were aware of changes being made to the program to
implement set out limits at 10 CY and 95 percent of the respondents had not been charged a fee for
oversize set outs.
• 53.9 percent of respondents indicated that they dispose of their yard trimmings through the brush
and bulky item collection program, and 62 percent of respondents indicated they would be
supportive of a brush and bulky item collection program that required residents to set out items
separately. Additionally, 72 percent of residents indicated they would support a rate increase of
more than $1.00 on their monthly bill to support this type of program.
Further information about the methodology of the stakeholder engagement is described in Section 1.0 and
the comprehensive detailed results are provided in Appendix A.
The following presents options that are evaluated in the following sections including a brief description of
the option and evaluation approach:
DRAFT
LSWMP Update Brush and Bulky Item Collection
City of Dallas, Texas 7-25 Burns & McDonnell
• Evaluate 10 CY set out limit. Presents the options related to the current set out limits in place and
evaluates the impacts of (1) staying with the current 10 CY set out limit or (2) reducing the set out
limit to 8 CY to be more consistent with benchmark cities.
• Adjust mix of collection equipment. Describes the impact on personnel and equipment associated
with the planned increase in number of rotocombo vehicles in the City’s equipment fleet.
• Implement separate brush and bulky item collection. Evaluates the impact on equipment,
staffing, equipment and processing capacity to implement separate brush and bulky item collection
based on Scenario 1 and Scenario 3 (reference Table 7-10). Information and analysis presented as
part of this option is based, in part, on the draft Evaluation of Collection Methods and Alternatives
report.
Each of the following sections provide an overview of each option and specific tactics and evaluates the
impact of each options’ components based on the criteria detailed in Section 1.4.3. A high-level summary
of the evaluation criteria for each tactic within the options is provided in Section 7.6 to support the key
findings, recommendations and implementation and funding plan
7.5.1 Evaluate 10 CY Set Out Limit
Overview. Leveraging the City’s 10 CY set out limit is an important step toward advancing the brush and
bulky item collection program to decrease material disposed. Oversize set outs cause significant operational
challenges and limit the ability to implement a separate brush and bulky items collection program because
oversize set outs require longer to collect. In FY 2021, there were a total of 4,223 oversize set outs assessed
a fee. For each of these set outs, collection crews measured and entered data about the set out so the fees
could be justified and properly assessed. Based on the benchmarking, peer cities all have set out limits of
10 CY, 8 CY or enforce restrictions on materials that are set out. Among the benchmarked cities, the City
followed only Houston in the amount of brush and bulky item materials on a per household per year basis
and total collection service provided on CY per year basis71. Currently, the City provides residents with a
high level of service based on the current set out limits and service frequency. If every customer put out the
maximum 10 CY that they are allowed each month, the City would become overwhelmed and fall behind
on collections.
Recycling potential. Leveraging the 10 CY set out limit and fee mechanism to influence customer behavior
could support future programmatic changes to collect brush and bulky items separately, which would allow
71 The 1,625 pounds per household per year collected by Houston is likely comparable to the City’s 1,099 pounds
per household per year because, due to data limitations, the pound per household figure presented for Houston is
inclusive of both curbside collected material and drop off station material where none of the other benchmark cities
include drop off station tonnage.
DRAFT
LSWMP Update Brush and Bulky Item Collection
City of Dallas, Texas 7-26 Burns & McDonnell
for clean brush to be regularly diverted. Further discussion on the diversion recycling potential of diverting
brush as part of the brush and bulky item collection is provided in Section 10.0.
Operational impact. While the current procedure to measure and input data on oversize set outs takes
more time in the field, the intended long-term impacts of the set out limits and fee structure is to change
resident behavior to set out less material, require less data entry in the field, and ultimately reduce the
number of incomplete brush and bulky item routes. Influencing customer behavior to minimize the number
of oversize set outs and pounds per household per year to between 500 – 750 pounds per household per
year would reduce the strain collection crews and supervisors and minimize staffing and equipment required
to meet service demand. This would also reduce the need to pull resources from the refuse and recycling
collection operation. If there is no reduction in the total number of oversize set outs or pound per household
per year collected, the City could consider reducing the set out limits to 8 CY which would initially increase
the number of oversize set outs, demand on collection crews to measure and log information, and total fees
assessed; however, over time decreasing the set out limits could result in more effective behavior change
because more residents would be assessed fees and educated about the program.
Financial impact. If the City is able to achieve behavior change over time, there would be less data entry
requirements by brush and bulky item collection crews resulting in a reduction in the number of incomplete
routes. There would be fewer instances when staff and equipment need to be pulled from refuse and
recycling collection or the City has to hire a third-party collection services. With higher capacity to meet
service demand and less need to rely on refuse and recycling resources or third-party contractors, the
operation would realize positive financial benefit. The magnitude of this positive financial impact would
depend on the amount of overtime and third-party contractor hours. Even if customer behavior changes to
result in fewer oversize set outs and pound per household per year collected, in the event of a storm event
or surge in material generation there will still be a need for additional resources to meet service demand
above the typical staff and equipment. Hiring staff and buying equipment to meet the maximum service
demand at times when material volumes are surging would cause the City to have excess equipment that
would ultimately be unused during typical operations. Developing contingency plans and building a reserve
fund over time could allow the City to hire a third-party collection service on an as -needed basis without
purchasing equipment and hiring staff that would not be fully utilized during typical operations.
Environmental impact. Influencing behavior change to minimize the number of oversize set outs would
reduce the number of vehicles that need to be deployed to complete routes. Incomplete routes require the
City deploy more collection crews to service set outs and increase the emissions and road miles traveled by
vehicles. Ultimately, the City is required to service all the set outs, but there are marginal environmental
benefits to being able to complete routes using fewer vehicles.
DRAFT
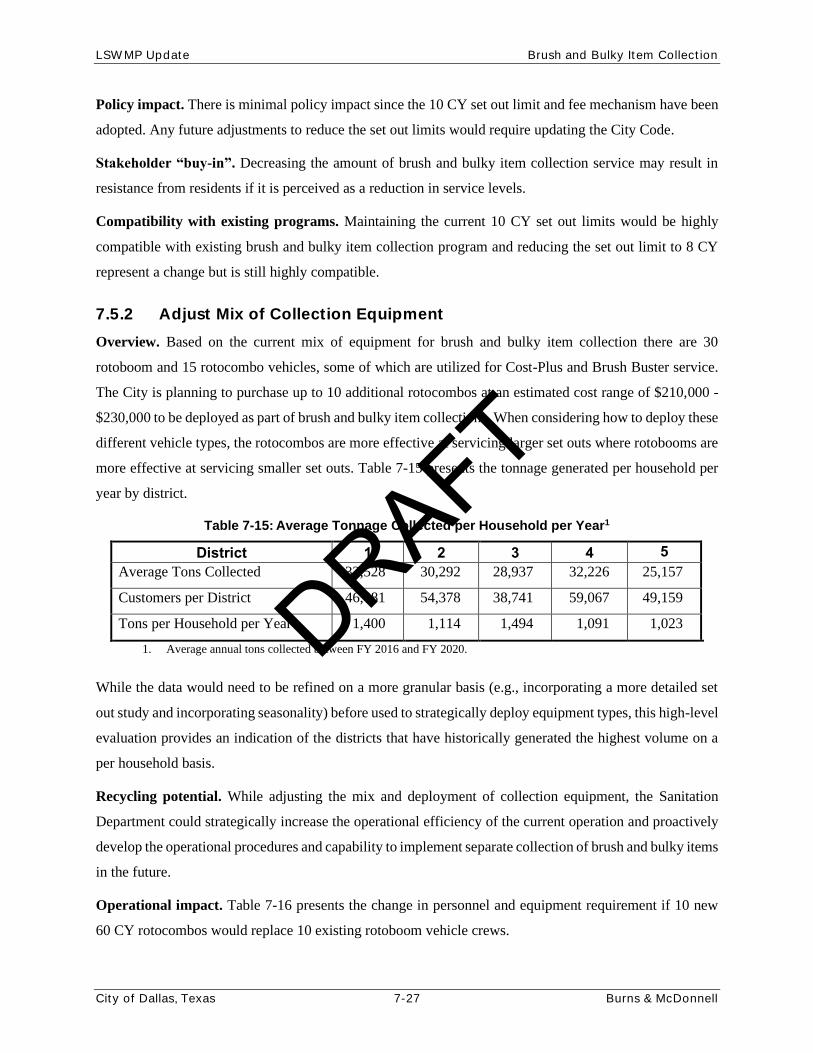
LSWMP Update Brush and Bulky Item Collection
City of Dallas, Texas 7-27 Burns & McDonnell
Policy impact. There is minimal policy impact since the 10 CY set out limit and fee mechanism have been
adopted. Any future adjustments to reduce the set out limits would require updating the City Code.
Stakeholder “buy-in”. Decreasing the amount of brush and bulky item collection service may result in
resistance from residents if it is perceived as a reduction in service levels.
Compatibility with existing programs. Maintaining the current 10 CY set out limits would be highly
compatible with existing brush and bulky item collection program and reducing the set out limit to 8 CY
represent a change but is still highly compatible.
7.5.2 Adjust Mix of Collection Equipment
Overview. Based on the current mix of equipment for brush and bulky item collection there are 30
rotoboom and 15 rotocombo vehicles, some of which are utilized for Cost-Plus and Brush Buster service.
The City is planning to purchase up to 10 additional rotocombos at an estimated cost range of $210,000 -
$230,000 to be deployed as part of brush and bulky item collections. When considering how to deploy these
different vehicle types, the rotocombos are more effective at servicing larger set outs where rotobooms are
more effective at servicing smaller set outs. Table 7-15 presents the tonnage generated per household per
year by district.
Table 7-15: Average Tonnage Collected per Household per Year1
District 1 2 3 4 5
Average Tons Collected 32,528 30,292 28,937 32,226 25,157
Customers per District 46,481 54,378 38,741 59,067 49,159
Tons per Household per Year 1,400 1,114 1,494 1,091 1,023
1. Average annual tons collected between FY 2016 and FY 2020.
While the data would need to be refined on a more granular basis (e.g., incorporating a more detailed set
out study and incorporating seasonality) before used to strategically deploy equipment types, this high-level
evaluation provides an indication of the districts that have historically generated the highest volume on a
per household basis.
Recycling potential. While adjusting the mix and deployment of collection equipment, the Sanitation
Department could strategically increase the operational efficiency of the current operation and proactively
develop the operational procedures and capability to implement separate collection of brush and bulky items
in the future.
Operational impact. Table 7-16 presents the change in personnel and equipment requirement if 10 new
60 CY rotocombos would replace 10 existing rotoboom vehicle crews.
DRAFT
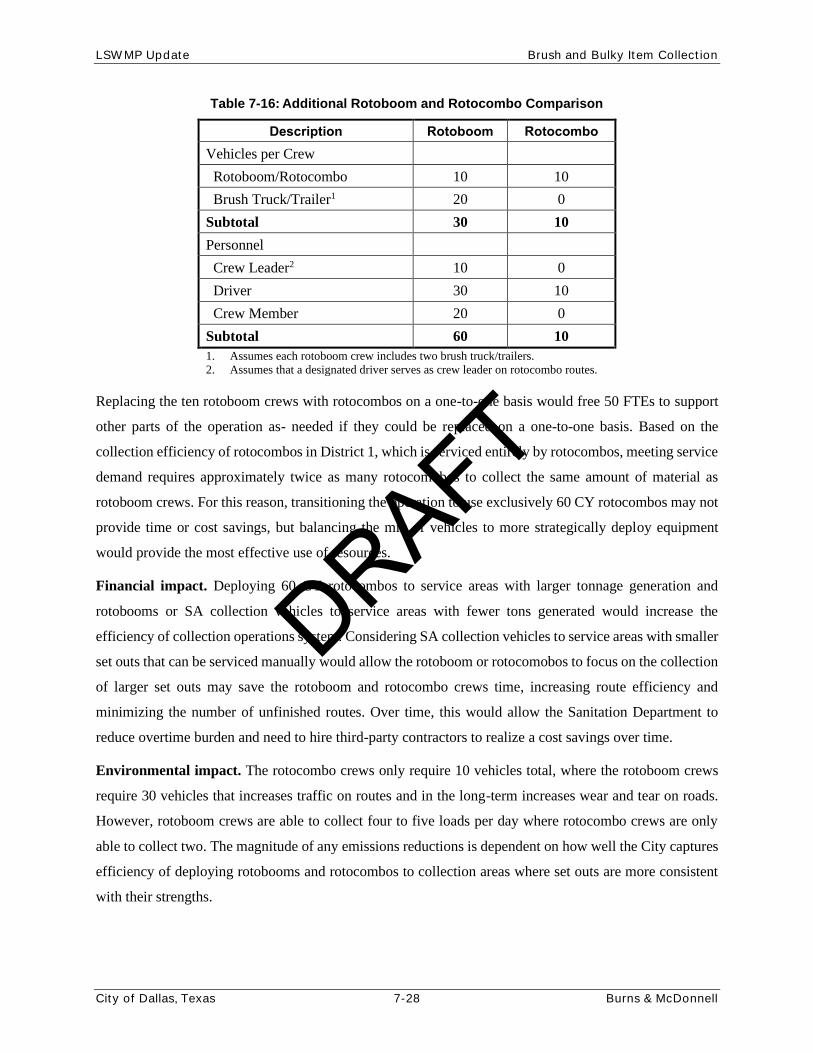
LSWMP Update Brush and Bulky Item Collection
City of Dallas, Texas 7-28 Burns & McDonnell
Table 7-16: Additional Rotoboom and Rotocombo Comparison
Description Rotoboom Rotocombo
Vehicles per Crew
Rotoboom/Rotocombo 10 10
Brush Truck/Trailer1 20 0
Subtotal 30 10
Personnel
Crew Leader2 10 0
Driver 30 10
Crew Member 20 0
Subtotal 60 10
1. Assumes each rotoboom crew includes two brush truck/trailers.
2. Assumes that a designated driver serves as crew leader on rotocombo routes.
Replacing the ten rotoboom crews with rotocombos on a one-to-one basis would free 50 FTEs to support
other parts of the operation as- needed if they could be replaced on a one-to-one basis. Based on the
collection efficiency of rotocombos in District 1, which is serviced entirely by rotocombos, meeting service
demand requires approximately twice as many rotocomobos to collect the same amount of material as
rotoboom crews. For this reason, transitioning the operation to use exclusively 60 CY rotocombos may not
provide time or cost savings, but balancing the mix of vehicles to more strategically deploy equipment
would provide the most effective use of resources.
Financial impact. Deploying 60 CY rotocombos to service areas with larger tonnage generation and
rotobooms or SA collection vehicles to service areas with fewer tons generated would increase the
efficiency of collection operations system. Considering SA collection vehicles to service areas with smaller
set outs that can be serviced manually would allow the rotoboom or rotocomobos to focus on the collection
of larger set outs may save the rotoboom and rotocombo crews time, increasing route efficiency and
minimizing the number of unfinished routes. Over time, this would allow the Sanitation Department to
reduce overtime burden and need to hire third-party contractors to realize a cost savings over time.
Environmental impact. The rotocombo crews only require 10 vehicles total, where the rotoboom crews
require 30 vehicles that increases traffic on routes and in the long-term increases wear and tear on roads.
However, rotoboom crews are able to collect four to five loads per day where rotocombo crews are only
able to collect two. The magnitude of any emissions reductions is dependent on how well the City captures
efficiency of deploying rotobooms and rotocombos to collection areas where set outs are more consistent
with their strengths.
DRAFT
LSWMP Update Brush and Bulky Item Collection
City of Dallas, Texas 7-29 Burns & McDonnell
Policy impact. There is no policy impact related to adjusting the mix of equipment utilized for brush and
bulky item collection service.
Stakeholder “buy-in”. There are no impacts on stakeholder “buy-in” related to this option.
Compatibility with existing programs. Adjusting the mix of vehicles is compatible with the existing
program but adjusting the strategy for deploying equipment may conflict with the existing programs if the
current boundaries and resources of sanitation districts are changed to have rotocombos service areas with
larger set outs and rotobooms or SA collection vehicles service areas with smaller set outs. This approach
may require the use of additional on-board technology to adjust routes in-field or utilizing SA collection
vehicles to run routes ahead of the rotoboom or rotocombos to identify large set outs and collect small set
outs. Additionally, the transition would need to be coordinated with EFS to ensure that they have the
capacity to service more 60 CY rotocombos.
7.5.3 Implement Separate Brush and Bulky Item Collection
Overview. Implementing separate brush and bulky item collection is critical to achieving the City’s near-
term recycling goals and long-term Zero Waste goals. Scenarios 1, 2, and 3 (reference Table 7-10) are
evaluated as part of this option. Scenario 2 (weekly yard trimmings collection, monthly commingled brush
and bulky item collection) and Scenario 4 (monthly yard trimmings/brush collection and quarterly separate
bulky item collection) were evaluated based on the results of the pilot program, indicating the level of the
commingled brush and bulky item collection on a monthly basis would not allow the City to maximize
collection of organics and the quarterly collection of bulky items in Scenario 4 requires increased staff and
equipment resources to service individual households with two separate crews. and may result in bulky
item set outs being left at the curb for extended periods of time. Information and analysis presented as part
of this option is based, in part, on the draft Evaluation of Collection Methods and Alternatives report. The
following descriptions of Scenarios 1, 2 and 31 and Scenario 3 provide a high level overview of each option
and relevant assumptions:
• Scenario 1: Monthly brush collection and appointment-based bulky item collection. This
collection scenario would have City crews collect yard trimmings and brush from residents on a
monthly basis, consistent with the current collection service and utilizing the same crew and
equipment configurations. Residents would be instructed to set out only yard trimmings and brush
on their current collection days and utilize a appointment-based service for bulky item collections,
which would be collected using the same crew and equipment configuration of rotobooms with
brush trucks and rotocombos depending on the type and size of material being collected.
DRAFT
LSWMP Update Brush and Bulky Item Collection
City of Dallas, Texas 7-30 Burns & McDonnell
Appointments would be scheduled, and routes generated, but routed based on the number, and
location, and type of material of call-ins. There would be a violation assessed for set outs that were
commingled with bulky items and assumes that two to four collections per year would be provided
to residents as part of their base residential rate, with additional collections charged an additional
fee.
• Scenario 2: Monthly trimmings collection and alternating quarterly brush and bulky item
collection. This collection scenario would have City crews collect yard trimmings on a monthly or
weekly basis, and brush and bulky item collection on an alternating quarterly basis. Separated yard
trimmings would be collected by a combination of SA collection vehicles, rotobooms with brush
trucks and rotocombos. This scenario provides the flexibility for the City to increase frequency of
yard trimming collection from monthly to weekly and residents would be instructed to set out brush
or bulky items on an alternating basis once per quarter. Violations would be assessed for set outs
that were commingled, or if the wrong material were set out.
• Scenario 3: Every other month brush collection and every other month bulky item collection.
This collection scenario would have City crews collect yard trimmings and brush from residents
on a monthly basis, and bulky items on an alternating monthly basis. Material would be collected
utilizing the same crew and equipment configurations, and violations would be assessed for set outs
that were commingled, or if the wrong material were set out.
Recycling potential. There is a high recycling potential for all three scenarios based on separate collection
of brush and yard trimmings. Between the three, there is a similar amount of yard trimmings and brush that
would be separately collected, but Scenarios 1 has higher recycling potential because the appointment-
based bulk program would minimize the number of bulky items set out for disposal (assuming that
requirements for appointment-based collection would change behavior of residents compared to routed
collection). Additionally, Scenario 1and provides greater opportunity to recycle or reuse bulky items.
Additionally, Scenarios 1 and 2 positions the City to adjust service frequency to weekly yard waste and
brush collection over time in conjunction with potential adjustments to the service frequency of refuse and
recycling collection. Further discussion of adjustments to the service frequency of refuse and recycling
service is provided in Section 6.0.
Operational impact. The collection operation of Scenarios 1 and 2 would require include a rear loader,
rotoboom and two brush trucks to service yard trimming and brush set outs. The appointment-based call in
bulky item collection routes of Scenario 1 would require include one rotocombo combo boom and one
brush truck/trailer (assuming the rotocombo boom would stay on route throughout the day and the brush
DRAFT
LSWMP Update Brush and Bulky Item Collection
City of Dallas, Texas 7-31 Burns & McDonnell
truck would make several trips for processing and disposal). Scenario 3 would require the same crew and
equipment configuration as the yard trimming and brush routes of Scenario 1 (rear loader, rotoboom and
two brush trucks). While each scenario would meet the service demand from a collection perspective, there
is currently no viable outlet to deliver separate yard trimmings and brush on a separated basis, as
demonstrated during the recent pilot project. Although there is brush grinding ongoing at the Landfill, if
the estimated 68,000 tons of separately collected yard trimmings and brush (reference Section 10.0, Table
10-3) would likely exceed the processing capacity and storage space available as part of the current brush
grinding operation. Scenario 3 presents a challenge based on the increased volume of yard trimmings and
brush generated in the summer and fall seasons that could be left at the curb would require residents to store
high volumes of material between every other month service. Additionally, the City would be responsible
for the marketing and sales of processed material, which would present a key bottleneck in the operation if
the product were not able to be screened and marketed to City Departments or sold.
Financial impact. Both Each scenarios would allow the City to operate with similar crew and equipment
configuration. The draft Evaluation of Collection Methods and Alternatives indicated there are
opportunities for cost savings as part of collection service for all scenarios compared to the current system
once they are fully implemented and does not include costs associated with the public education campaigns
required to educate customers on program changes. Scenario 2 presented the highest level of potential cost
savings at 20.3 percent, followed by Scenario 1 at 14.5 percent and Scenario 3 at 11.5 percent.in both
Scenario 1 and Scenario 3 ranging from 11.5 to 14.5 percent72. The call-in bulky item collection as part of
Scenario 1 is assumed to provide more cost savings because restructuring the program would reduce the
amount of material that the City would collect as part of the base rates. Overall, separately collecting and
processing yard trimmings and brush would result in a cost increase because processing and marketing yard
trimmings and brush and identifying outlets for bulky items to be reused or recycled would be higher than
the cost of managing the material by simply disposing.
Environmental impact. If the crew and equipment configurations for Scenario 1 and Scenario 3each
Scenario are able to meet service demand without increasing the number of vehicles required, separately
collecting and processing yard trimmings and brush and reusing or recycling bulky items would result in
beneficial environmental impacts due to avoided disposal.
Policy impact. There would be a significant policy impact to both all scenarios, where the City’s Code of
Ordinances would need to be updated to implement the changes in residential service frequency and
72 The draft Evaluation of Collection Methods and Alternatives assumed there would be no assistance from
residential collection operation and would operate on a four day per week, 10-hour per day collection schedule. The
cost savings figures provided are provided to indicate cost saving potential on a percentage basis, and do not reflect
an updated evaluation based on the current equipment and staffing.
DRAFT
LSWMP Update Brush and Bulky Item Collection
City of Dallas, Texas 7-32 Burns & McDonnell
adjustments to the definition of brush, yard trimmings and bulky items to identify them as separate items
and omit containerized trash and cardboard from accepted bulky items. Additionally, replacing the current
service with a bulky item appointment-based program may cause increased illegal dumping or instances of
uncollected piles left at the curb without significant education, outreach and compliance efforts.
Stakeholder “buy-in”. The changes to the program structure would have high stakeholder “buy-in” from
environmental advocates because the City must implement separate brush and bulky item collection to
achieve its near-term goals and long-term Zero Waste goal. There would be less stakeholder “buy-in” from
operational staff since there is already challenges meeting service demand during surges of material,
insufficient capacity at the transfer stations to manage these materials separately and no existing processing
capacity to recycle separately collected brush and yard trimmings. Additionally, changes to the collection
days or set out instructions may increase complaints from residential customers and there would be low
“buy-in” if residents perceive adjustments to collection programs as a reduction in service.
Compatibility with existing programs. There is low compatibility with the existing programs because of
the significant changes to the collection frequency and set out instructions. Additionally, the City would
need to adjust the Cost-Plus program to support the bulky item appointment-based collection service as part
of Scenario 1.
7.6 Key Findings and Recommendations
This section presents the key findings and recommendations related to program and policy approaches
increasing the effectiveness of the City’s brush and bulky item collection program based on the results of
the overview, evaluation of case studies, benchmarking and stakeholder engagement. Depending on the
specific option and/or tactic, the evaluation may include both quantitative and qualities assessments which
support the assigned relative ratings for the criteria of each tactic. The meaning of the rating differs for each
option and/or tactic but can generally be described as “green circle is favorable or low impact,” “yellow
triangle is neutral or medium impact,” and “red square is less favorable or higher impact.” Further
description of the criteria is provided in Section 1.4.3. Table 7-17 shows the summary of refuse and
recycling collection options evaluation.
DRAFT
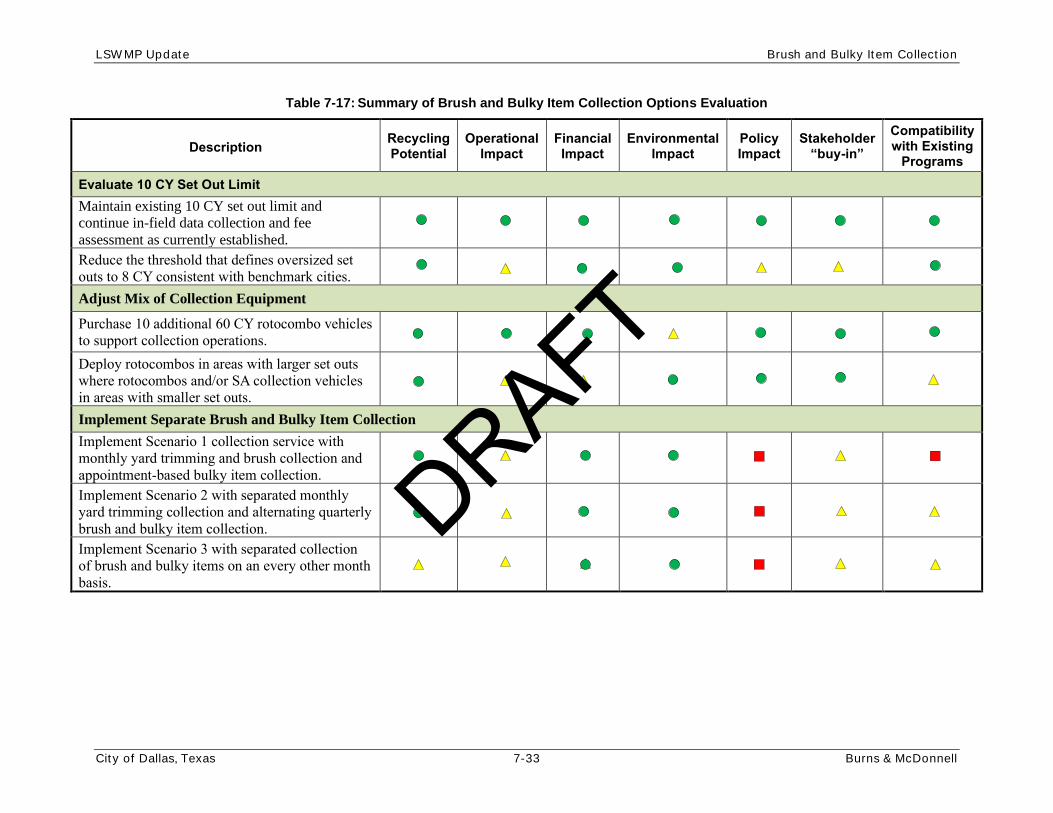
LSWMP Update Brush and Bulky Item Collection
City of Dallas, Texas 7-33 Burns & McDonnell
Table 7-17: Summary of Brush and Bulky Item Collection Options Evaluation
Description Recycling Potential
Operational Impact
Financial Impact
Environmental Impact
Policy Impact
Stakeholder “buy-in”
Compatibility with Existing
Programs
Evaluate 10 CY Set Out Limit
Maintain existing 10 CY set out limit and
continue in-field data collection and fee
assessment as currently established.
Reduce the threshold that defines oversized set
outs to 8 CY consistent with benchmark cities.
Adjust Mix of Collection Equipment
Purchase 10 additional 60 CY rotocombo vehicles
to support collection operations.
Deploy rotocombos in areas with larger set outs
where rotocombos and/or SA collection vehicles
in areas with smaller set outs.
Implement Separate Brush and Bulky Item Collection
Implement Scenario 1 collection service with
monthly yard trimming and brush collection and
appointment-based bulky item collection.
Implement Scenario 2 with separated monthly
yard trimming collection and alternating quarterly
brush and bulky item collection.
Implement Scenario 3 with separated collection
of brush and bulky items on an every other month
basis.
DRAFT
LSWMP Update Brush and Bulky Item Collection
City of Dallas, Texas 7-34 Burns & McDonnell
7.6.1 Key Findings
Each of the following key findings supports the corresponding recommendation in the subsequent section.
1. The 10 CY set out limit and fee assessment support brush and bulky item collection program
development. In FY 2021 the average oversized set out in FY 2021 was approximately 26 CY and
was assessed an average charge of $191 per invoice.
2. Material is collected and delivered to Bachman and the Landfill. The majority of material is
from District 3 and District 4 are delivered to Bachman and material from District 1, District 2 and
District 5 are delivered directly to the Landfill.
3. The City provides a high level of service compared to benchmark cities. The City provides each
120 about 30,000,000 CY of brush and bulky item collection service annually to each customer
annually. This is about double the amount of annual service that Austin and San Antonio provide
(92 and 58 CY, respectively) on a CY basis provided by benchmark cities that collect brush and
bulky items separately, less frequently, or on an appointment-based schedule.
4. The City collects material on commingled basis, resulting in a higher pounds per household
per year basis compared to benchmark cities. The City collects about 1,099 pounds per
household per year compared to other benchmark cities in the 500-750 pound per household per
year range because they collect brush and bulky items separately, less frequently, or on an
appointment basis.
5. There are opportunities to more strategically deploy vehicle types to service areas with set
outs they are best equipped to service. Rotocombos are best equipped to service larger set outs
and rotobooms or SA collection vehicles to areas with smaller set outs. Deploying vehicles in the
manner would increase the efficiency of the brush and bulky item collection program.
6. One-person collection crews on rotocomobos cause bottleneck in operations. The current one-
person collection crew on rotocombo vehicles is sufficient to meet service demand, but does not
provide redundancy when an operator is out. If the crew leader is not available, the collection for
that area is not able to proceed.
7. Cost-Plus service is not widely used by residential customers. The Cost-Plus service was
requested 730 times in FY 2021. This may be a result of the ability for residents to commingle
brush and bulky items under the current program and the Clean Curb initiative where crews collect
any materials set out and apply applicable violations and fees if the set out includes prohibited
items.
8. Separated brush and bulky item collection pilot revealed key challenges with monthly brush
and quarterly bulky item service frequency. The resources required to service brush and bulky
DRAFT
LSWMP Update Brush and Bulky Item Collection
City of Dallas, Texas 7-35 Burns & McDonnell
items separately on weeks when material was set out in two separate piles by customers resulted in
high numbers of violations (e.g., not adhering to the guidelines of the pilot) and required two crews
to service the same customer location. Additionally, halfway through the pilot the space at
Bachman was no longer available and material collected in the northern areas of the City could not
be separately managed and transferred for processing and disposal.
7.6.2 Recommendations
Each of the following recommendations are components of the planning level Implementation & Funding
Plan provided in Appendix F.
1. Maintain 10 CY set out limits. The 10 CY set out limit and fee assessment support brush and
bulky item collection program development and should be maintained in the near term. As a longer-
term consideration, the City could decrease the set out limit to 8 CY to be more consistent with
benchmark cities but should only do that if over time it becomes clear that the 10 CY set out limits
are not effectively resulting in decreased oversized set outs.
2. Deploy brush and bulky item collection equipment based on set out patterns. The Sanitation
Department should deploy the larger rotocombo vehicles to areas of the City that generally have
the largest set outs and fewer individual or smaller items. The rotoboom crews should be deployed
to areas with smaller items given the strengths of each particular equipment type. Support the
decisions for deployment by conducting a multi-season set out study to identify collection areas
that set out larger set outs and take this approach with any future appointment-based system that is
implemented.
3. Pilot two-person crew for rotocombo equipment. In addition to deploying crews based on set
out patterns, the City should pilot two-person crews in rotocombo, especially in collection areas
with high route density.
4. Increase capacity for managing brush and bulky items separately at Bachman and the
Landfill. Brush and bulky items currently commingled and cannot be hauled separately.
Additionally, there is no dedicated areas at Bachman or the Landfill to separately store and transport
brush and bulky items even if they were collected separately. Increasing the capacity to manage
these materials separately in the near term is a key next step to advancing the City’s brush and
bulky item collection program and making progress toward the goals established in the 2011
LSWMP.
5. Implement monthly yard trimmings and brush collection and appointment-based brush and
bulky item collection service, contingent on applicable changes to other material management
programs. The City should implement a variation of Scenario 1 to scale separated brush and bulky
DRAFT
LSWMP Update Brush and Bulky Item Collection
City of Dallas, Texas 7-36 Burns & McDonnell
item collection, assuming that these program changes are compatible with any adjustments to the
refuse and recycling collection program (e.g., transitioning from 4-10’s to 5-8’s) and the transfer
station system is upgraded to manage brush and yard trimmings on a separated basis. To implement
the appointment-based bulky item collection, the City should leverage the existing Cost-Plus
program to provide appointment-based bulky item collection offering customers two four total free
collections per year (either brush or bulky items, but not commingled) and charging fees per
collection after each customer request beyond two four per year (consistent with the current
minimum $50.00 fee for Cost-Plus service, subject to increase based on load inspection).
6. Streamline compliance tools to support transition to appointment-based brush and bulky
item collection and implement bulky item reuse or recycling program. To implement brush
and bulky item collection on an appointment basis, the City should streamline the various software
platforms (e.g., Re-Collect, Survey123, Field Maps, etc.) by integrating with a platform that could
receive bulky item collection requests via user-friendly interface, generate route sheets and have
the capability to track violations and any compliance mechanisms implemented to support the
program. Additionally, separately collected bulky items present the opportunity for reuse and
recycling and the City should develop programs to identify products or materials that could be
reused or recycled before disposal at the Landfill.
DRAFT
LSWMP Update Landfill
City of Dallas, Texas 8-1 Burns & McDonnell
8.0 LANDFILL
The Landfill is critical to the long-term material management needs of the City and the revenue from the
operations supports the capabilities of the services offered by the Sanitation Department. While the Landfill
generates significant quantities of greenhouse gasses, the robust gas collection system diverts the potential
emissions to a processing facility for sale and minimizes the impact on the local emissions inventory.
Additionally, maximizing the life of the Landfill is critical to for the City to provide the financial means to
support current and future efforts to reach its Zero Waste goals. Although it may appear counterintuitive
that ownership and operation of a disposal facility would be essential to the Zero Waste effort, the direct
control over disposal provides the City strategic advantages to implement essential programs, policies and
infrastructure to increase the recycling rate and make meaningful progress toward Zero Waste.
8.1 Current System Review
The Landfill manages a high tonnage and volume of daily customers. The City owns and operates the
Landfill, located at 5100 Youngblood Road just north of the intersection of Interstates 45 and 20. The
Landfill has a permitted boundary of 965 acres with a waste disposal footprint of 877 acres. There is
approximately 70,713,556 CY of remaining airspace in the constructed and unconstructed areas of the
Landfill (excluding final cover) based on the airspace analysis conducted October 2021. The Landfill
accepts and processes an average of 6,400 tons of waste per day during a six-day work week and processes
a range of 1,400 to 1,600 loads per day. The Landfill services cash customers, Sanitation Department,
Commercial and discount accounts and City departments. The Landfill is administered as an enterprise
fund.
As part of the LSWMP Update, a full working day of operations were observed including a review of key
daily activities and discussions with Landfill staff and management. The following lists key challenges
identified by Landfill staff and management:
• Management relies on overtime and has challenges approving time off for staff when requested due
to the staffing demands of the facility.
• The shift to maintaining transfer trucks and trailers at the heavy shop has decreased the availability
to maintain Landfill operating equipment.
• Manual data entry and point-of-sale transaction requirements at the Youngblood Scalehouse create
long lines and high wait times at the Landfill, especially during surges of material.
• Traffic control personnel at the working face struggle to separate self-haul customers from
Sanitation Department customers to minimize wait times.
DRAFT
LSWMP Update Landfill
City of Dallas, Texas 8-2 Burns & McDonnell
• The configuration of the working face is space constrained and creates challenges operating safely
and efficiently.
• The time required to conduct opening and closing procedures at the Landfill exceed an hour and
exacerbate the challenges with long working days and overtime demand.
• Landfill slopes are not constructed to convey water to downchutes, and final cover has not been
applied to completed cells causing challenges with effective stormwater management and rising
volumes of leachate.
• Ancillary site infrastructure (CCC, administration building, etc.) are located within the disposal
footprint and minimize the site life of the Landfill.
Further detailed information and analysis related to these challenges are provided in Appendix E. The
following benchmarking and options evaluation present tactics to overcome the identified operational
challenges and support the City’s recycling goals.
8.2 Evaluation of 2011 LWMP Recommendations
This section evaluates the recommendations presented in the 2011 LSWMP, indicating the progress that
has been made toward the recommended policies and/or programs. Additionally, this section identifies any
fundamental changes that have been implemented related to programs, policies or forecasts as it relates to
the Landfill.
Table 8-1 lists the recommendations from the 2011 LSWMP related to the Landfill with a brief description
of progress to date and potential next steps as part of the LSWMP Update.
Table 8-1: Evaluation of 2011 LSWMP Recommendations
2011 LSWMP Recommendation
Progress to date Potential Next Steps
Assess methods to optimize the
available disposal capacity.
Use of Enhanced Leachate
Recirculation (ELR) for
increased biodegradation.
Consider employing ELR in
the future to further maximize
biodegradation and maximize
use of available capacity.
Continually assess the need for
new waste disposal capacity.
Preliminary estimates show
Landfill gained two years of life
since 2011 LSWMP even with
growing tonnage disposed.
Evaluate approaches to
maximize capacity and
potential long-term options for
new disposal capacity.
Cooperate with neighboring
municipalities that need disposal
capacity.
City allows peer municipalities
to dispose at the Landfill.
Explore incentivizing
recycling/diversion through
Landfill pricing structure.
DRAFT
LSWMP Update Landfill
City of Dallas, Texas 8-3 Burns & McDonnell
Develop a Resource Recovery
Park at Landfill: composting,
expanded CCC, recycling
processing.
Implemented FCC MRF in 2018
through a successful PPP.
Evaluate CCC expansion and
composting operation at
Landfill.
Develop Mixed Materials
Processing Facility.
Resource Recovery Planning
and Implementation Study
evaluation indicated mixed
waste processing was not the
most cost effective processing
infrastructure at the time.
Although this type of facility
may be a future consideration
as the City continues toward
Zero Waste, it is not
advancing this concept since
the FCC MRF has been
installed.
In the 2011 LSWMP the future Landfill life was projected using a sensitivity analysis to show various
scenarios. The 2011 LSWMP results projected there would be 79,459,156 CY of remaining airspace in
2020; however, the actual available airspace of the Landfill in FY 2020 was 74,864,468 CY, about 4.5
million CY less than projected. The 2011 LSWMP estimated that the Landfill would reach capacity in
205373. Even with 4.5 million fewer CY available compared to the 2011 LSWMP projections, the most
recent annual report submitted to TCEQ estimates the Landfill will reach capacity in 2055. Achieving a
longer useful life with less available airspace indicates the City has successfully increased operating
efficiency or achieved high rates of biodegradation and settling.
The City will need to establish organics processing capacity to be in a position to achieve the goals for
organic waste recycling and landfill reduction in the time frame established by CECAP. Evaluation
performed as part of the 2011 LSWMP identified area within the disposal footprint (Cells 8 through 14) to
be used for a City-operated composting facility; however, doing so limits the City’s ability to maximize
existing airspace for future disposal needs.
8.3 Benchmarking
This section benchmarks key components of landfill operations that have been incorporated by peer
municipalities or private sector operators related to increasing the operational efficiency and meet long-
term planning needs. The following sections provide perspective about the following topics, including
select case studies, and is organized as follows:
• Landfill Operations
• Organics diversion
• Pricing strategy
73 The 2011 LSWMP Waste Quantity Projections Technical Memo estimates the Landfill reaching capacity in the
year 2053 assuming all the waste currently going to the Landfill will continue based on only the current users of the
facility.
DRAFT
LSWMP Update Landfill
City of Dallas, Texas 8-4 Burns & McDonnell
8.3.1 Landfill Operations
The Landfill’s AUF is key to understanding how well waste disposal is being managed to conserve airspace.
It is a critical component of projecting remaining Landfill life and planning for future cell constructions
and closures. The average historical annual AUF for the Landfill based on data reported to TCEQ is
approximately 1,600 pounds per cubic yard (lb/CY). Appendix E includes additional detail on the Landfill’s
AUF including annual factors presented in Table E-2. Based on industry experience, an AUF of greater
than 1,400 lbs/CY is achievable if the staffing and equipment is deployed strategically. The City is currently
exceeding this based on the report submitted to TCEQ. The City’s performance also exceeds the average
AUF for Type I landfills in the North Central Texas region, which averaged 1,375 lb/CY in 2020 based on
information reported to TCEQ as part of annual reporting.
Landfill gas generated at the site is managed for beneficial use through a contract with Dallas Clean Energy
McCommas Bluff, LLC (DCEMB) to upgrade landfill gas for pipeline injection. The City’s contract with
DCEMB is further described in Appendix E. Based on analysis of data from U.S. EPA, approximately 27
percent of landfills in the U.S. have landfill gas capture and collection systems (GCCS), with end uses
ranging from electricity generation to combined heat and power (CHP) generation and natural gas vehicle
fuel or pipeline injection.74 Beneficial use systems are less common in the public sector (with 19 percent of
landfills having a beneficial use system installed), and the City’s partnership with DCEMB represents a
high level of performance to capture environmental and financial value from landfill gas.
There are 29 landfill gas beneficial use projects in the state, and the City’s is the largest in the North Central
Texas region. The City’s 12.5 percent revenue share is higher than other high-BTU landfill gas contracts in
the area, which range from 3-12 percent of the gross revenue stream (e.g., landfill gas and constituent
product gas sales and all related environmental credits). Efforts to divert organics from landfill may reduce
landfill gas production and, in turn, the revenue to be shared by DCEMB and the City. The impacts of
organics diversion from landfill are discussed in more detail in Section 8.3.2.
8.3.2 Organics Diversion
Diverting organics from diversion is an important consideration for the City to progress toward its long-
term Zero Waste goals, but requires consideration of multiple operational impacts including:
74 Analysis of LMOP and GHGRP Subpart HH databases performed by EREF.
DRAFT
LSWMP Update Landfill
City of Dallas, Texas 8-5 Burns & McDonnell
• Reduced gas generation.75 Degradable organic carbon, such as that in food waste and yard
trimmings, results in the production of landfill gas. Food waste is responsible for 20-30 percent of
methane yield (similar to that of various paper grades) and food waste diversion can impact
methane production and yield curve noticeably for future cells. Yard trimmings are responsible for
a relatively small portion of methane yield, and therefore diversion of yard trimmings typically
has a minor impact on methane production and yield curve. However, it is unlikely that a large
portion of methane from food waste will be captured due to the typical delayed timing of GCCS
installation.
• Decreased methane emissions. Food waste degrades quickly in a landfill, and one quarter of
methane may be produced in the first two years after disposal. During this time a GCCS is typically
not yet installed because there has not been enough time for a critical mass of landfill gas to be
generated. By reducing food waste disposal, these uncollected methane emissions from future cells
are reduced.
• Decreased settlement and increased landfill stability.76 Food waste diversion can result in
enhanced internal stability within the landfill by reducing the amount of combustible material
compared to inert waste materials.
• Potential airspace savings. Organics comprise a large portion of landfilled wastes, and diversion
of materials provides airspace savings, extending the life of the landfill.
• Leachate impacts. Food waste diversion, specifically of protein food wastes, can significantly
reduce leachate ammonia and UV absorbance. As a result, leachate treatment can be easier and
potentially less expensive. Although the Dallas Southside WWTP has capacity to receive leachate
quality, alternative treatment options should continue to be a long-term consideration as industrial
wastewater sources including landfills may fall under increased scrutiny in the future.
Given the City’s and DCEMB’s investment in the Landfill’s GCCS, a 10-15 percent drop in landfill gas
production should be anticipated if a comprehensive food waste diversion program across all generator
sectors is implemented. Based on analysis performed by the Environmental Research & Education
Foundation (EREF),77 aggressive diversion and organics policies enacted in San Francisco beginning in
75 Based on studies on the composition of landfilled streams and the estimated resulting methane yield curves
published in De la Crus & Barlaz (2010). Environ. Sci. Tecnhol. 44:4722-4728; Staley & Barlaz (2009). ASCE
Journal of Environ. Eng. 135:901-909. 76 Based on research published by Bareither et al. 2012 77 “Trends in Beneficial Use of Landfill Gas & Potential Impacts of Organics Diversion” EREF presentation at 2014
SWANApalooza.
DRAFT
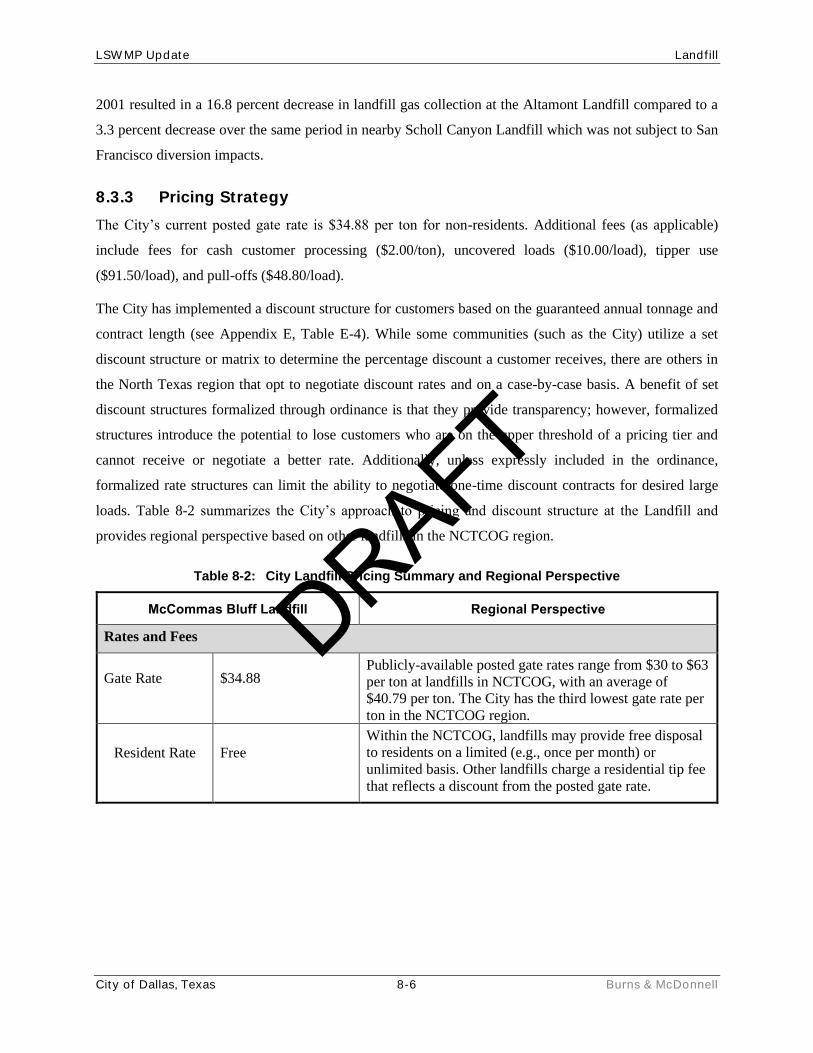
LSWMP Update Landfill
City of Dallas, Texas 8-6 Burns & McDonnell
2001 resulted in a 16.8 percent decrease in landfill gas collection at the Altamont Landfill compared to a
3.3 percent decrease over the same period in nearby Scholl Canyon Landfill which was not subject to San
Francisco diversion impacts.
8.3.3 Pricing Strategy
The City’s current posted gate rate is $34.88 per ton for non-residents. Additional fees (as applicable)
include fees for cash customer processing ($2.00/ton), uncovered loads ($10.00/load), tipper use
($91.50/load), and pull-offs ($48.80/load).
The City has implemented a discount structure for customers based on the guaranteed annual tonnage and
contract length (see Appendix E, Table E-4). While some communities (such as the City) utilize a set
discount structure or matrix to determine the percentage discount a customer receives, there are others in
the North Texas region that opt to negotiate discount rates and on a case-by-case basis. A benefit of set
discount structures formalized through ordinance is that they provide transparency; however, formalized
structures introduce the potential to lose customers who are on the upper threshold of a pricing tier and
cannot receive or negotiate a better rate. Additionally, unless expressly included in the ordinance,
formalized rate structures can limit the ability to negotiate one-time discount contracts for desired large
loads. Table 8-2 summarizes the City’s approach to pricing and discount structure at the Landfill and
provides regional perspective based on other landfills in the NCTCOG region.
Table 8-2: City Landfill Pricing Summary and Regional Perspective
McCommas Bluff Landfill Regional Perspective
Rates and Fees
Gate Rate $34.88 Publicly-available posted gate rates range from $30 to $63
per ton at landfills in NCTCOG, with an average of
$40.79 per ton. The City has the third lowest gate rate per
ton in the NCTCOG region.
Resident Rate Free
Within the NCTCOG, landfills may provide free disposal
to residents on a limited (e.g., once per month) or
unlimited basis. Other landfills charge a residential tip fee
that reflects a discount from the posted gate rate.
DRAFT
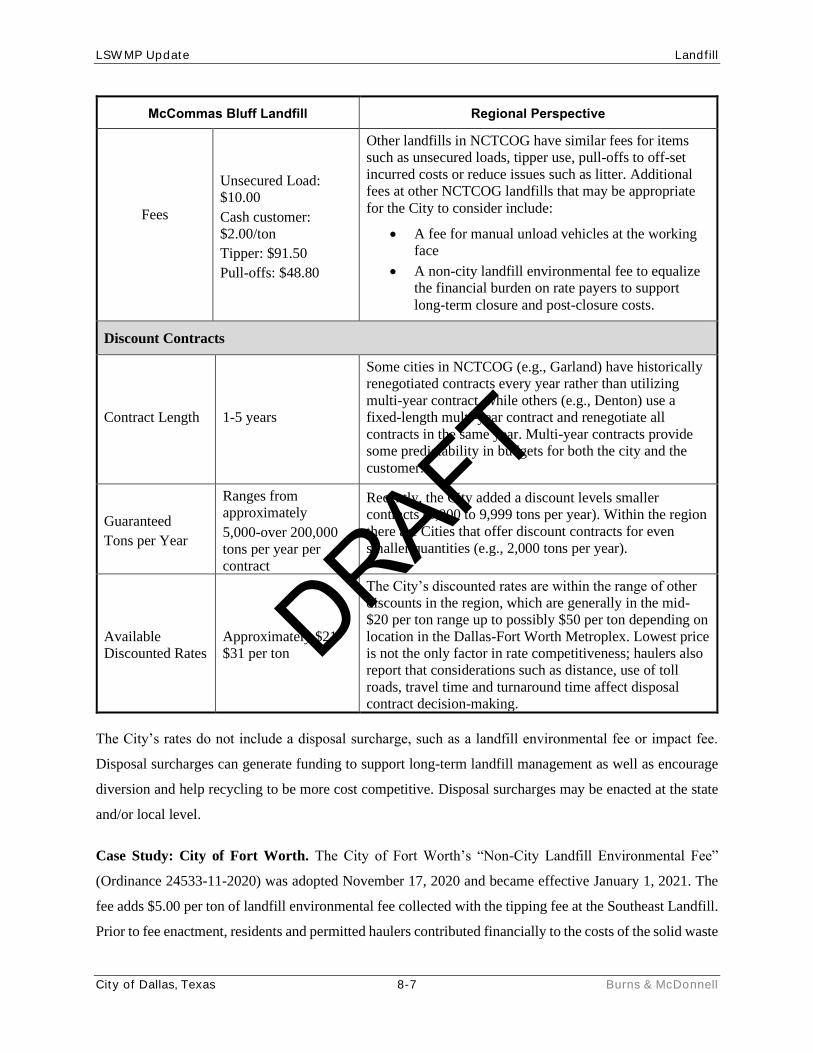
LSWMP Update Landfill
City of Dallas, Texas 8-7 Burns & McDonnell
McCommas Bluff Landfill Regional Perspective
Fees
Unsecured Load:
$10.00
Cash customer:
$2.00/ton
Tipper: $91.50
Pull-offs: $48.80
Other landfills in NCTCOG have similar fees for items
such as unsecured loads, tipper use, pull-offs to off-set
incurred costs or reduce issues such as litter. Additional
fees at other NCTCOG landfills that may be appropriate
for the City to consider include:
• A fee for manual unload vehicles at the working
face
• A non-city landfill environmental fee to equalize
the financial burden on rate payers to support
long-term closure and post-closure costs.
Discount Contracts
Contract Length 1-5 years
Some cities in NCTCOG (e.g., Garland) have historically
renegotiated contracts every year rather than utilizing
multi-year contract, while others (e.g., Denton) use a
fixed-length multi-year contract and renegotiate all
contracts in the same year. Multi-year contracts provide
some predictability in budgets for both the city and the
customer.
Guaranteed
Tons per Year
Ranges from
approximately
5,000-over 200,000
tons per year per
contract
Recently, the City added a discount levels smaller
contracts (5,000 to 9,999 tons per year). Within the region
there are Cities that offer discount contracts for even
smaller quantities (e.g., 2,000 tons per year).
Available
Discounted Rates
Approximately $21-
$31 per ton
The City’s discounted rates are within the range of other
discounts in the region, which are generally in the mid-
$20 per ton range up to possibly $50 per ton depending on
location in the Dallas-Fort Worth Metroplex. Lowest price
is not the only factor in rate competitiveness; haulers also
report that considerations such as distance, use of toll
roads, travel time and turnaround time affect disposal
contract decision-making.
The City’s rates do not include a disposal surcharge, such as a landfill environmental fee or impact fee.
Disposal surcharges can generate funding to support long-term landfill management as well as encourage
diversion and help recycling to be more cost competitive. Disposal surcharges may be enacted at the state
and/or local level.
Case Study: City of Fort Worth. The City of Fort Worth’s “Non-City Landfill Environmental Fee”
(Ordinance 24533-11-2020) was adopted November 17, 2020 and became effective January 1, 2021. The
fee adds $5.00 per ton of landfill environmental fee collected with the tipping fee at the Southeast Landfill.
Prior to fee enactment, residents and permitted haulers contributed financially to the costs of the solid waste
DRAFT
LSWMP Update Landfill
City of Dallas, Texas 8-8 Burns & McDonnell
disposal program through residential rates or permit fees; however, haulers disposing of non-city material
did not contribute in a similar manner. Objectives of the Fort Worth’s environmental fee include to
preserving the remaining capacity for Fort Worth-generated materials and to equitably distribute the
financial burden of responsible solid waste management among all users of the landfill.
Case Study: Lyon County, MN. The County operates both a MSW landfill and a construction and
demolition debris C&D landfill with the MSW landfill serving an eight-county region. As part of the
Minnesota Pollution Control Agency permit, the County is required to maintain a financial assurance fund
to pay for closure, post-closure, and contingency action activities that are not covered by the operating
budget. Beginning in 2005, the County implemented a $2 per ton Financial Assurance Solid Waste
Surcharge to support this fund. The fee applies for both MSW and C&D loads received at the landfills.
Regional Market. Figure 8-1 shows the average rate charged at landfills in the vicinity of the Landfill
based on information reported to the TCEQ, which ranged from $25-38 per ton. This facility-reported
information differs from the posted gate rate, reflecting factors such as discount structures and/or additional
fees. Based on the reported average rate, pricing at the Landfill is in line with the local disposal market. In
recent years, the City has implemented price increases with little to no business falloff and the market can
likely support continued increases in the City’s landfill rates without driving significant tonnage to other
landfills in Dallas County or the broader North Texas region.
DRAFT
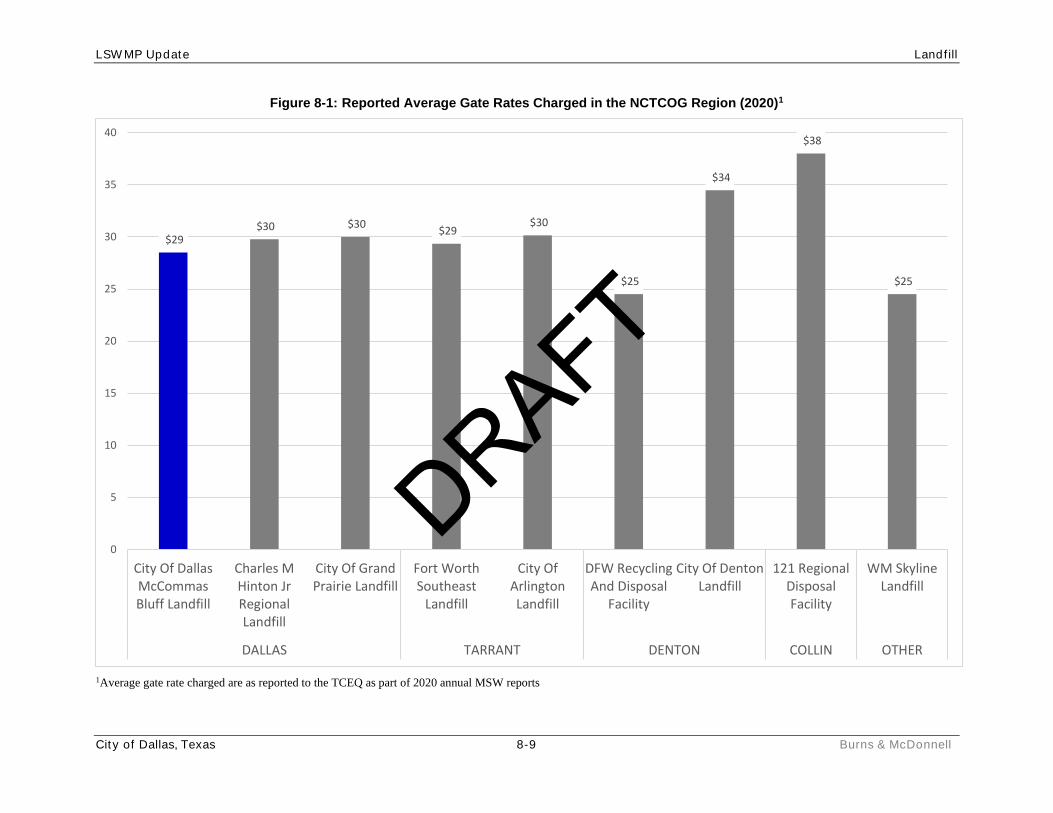
LSWMP Update Landfill
City of Dallas, Texas 8-9 Burns & McDonnell
Figure 8-1: Reported Average Gate Rates Charged in the NCTCOG Region (2020)1
1Average gate rate charged are as reported to the TCEQ as part of 2020 annual MSW reports
$29 $30 $30
$29 $30
$25
$34
$38
$25
0
5
10
15
20
25
30
35
40
City Of DallasMcCommasBluff Landfill
Charles MHinton JrRegionalLandfill
City Of GrandPrairie Landfill
Fort WorthSoutheast
Landfill
City OfArlingtonLandfill
DFW RecyclingAnd Disposal
Facility
City Of DentonLandfill
121 RegionalDisposalFacility
WM SkylineLandfill
DALLAS TARRANT DENTON COLLIN OTHER
DRAFT
LSWMP Update Landfill
City of Dallas, Texas 8-10 Burns & McDonnell
8.4 Options Evaluation
This section analyzes a series of options related to the Landfill that have been identified based on site visits
of the Landfill, stakeholder engagement, evaluation of recommendations from the 2011 LSWMP, and
benchmarking.
The following presents options that are evaluated in the following sections including a brief description of
the option and evaluation approach:
• Maximize site life and maintain sufficient revenues within currently permitted disposal
footprint. Describes pricing considerations to generate sufficient revenues and maximize site life
within the currently permitted disposal footprint.
• Divert self-haul customers from working face. Describes approaches to divert small self-haul
customers from the working face and evaluates the opportunity to develop an expanded CCC
outside the permitted limits of waste.
• Increase organics processing capacity. Describes options and considerations for the Landfill to
support organics diversion initiatives.
• Develop long-term Landfill master plan. Describes the capital improvements and operational
planning the City could include in a long-term Landfill master planning effort.
Each of the following sections provide an overview of each option and specific tactics and evaluates the
impact of each options’ components based on the criteria detailed in Section 1.4.3. A high-level summary
of the evaluation criteria for each tactic within the options is provided in Section 8.5 to support the key
findings, recommendations and implementation and funding plan
8.4.1 Maximize Site Life and Maintain Sufficient Revenues
Overview. Maximizing site life will become increasingly important as there will be an increased demand
for disposal as population grows in the region and the amount of available airspace decreases as facilities
close or divert material. This option considers adjustments to the current pricing at the Landfill to balance
the rate that site life decreases and revenue generated from various customer types utilizing the following
tactics:
• Increase operating efficiency. There are opportunities to further maximize site life through
continued operational improvements such as increasing the permitted size of the working face
(permit modification currently in progress), filling staffing vacancies, deploying technology such
as GPS integration in dozers for elevations and fill planning or drone use for LFG monitoring,
DRAFT
LSWMP Update Landfill
City of Dallas, Texas 8-11 Burns & McDonnell
expanding to 24-hour operations to receive transfer loads at night, or maintaining the option for
leachate and condensate recirculation when needed and as appropriate.
• Continue to increase gate rates at the current rate consistent with regional landfill market.
The current gate rate is on the lower end of the regional market rates, indicating the City can
continue to incrementally raise the gate rate to maintain Landfill revenues, even if there are small
dips in tonnage delivered immediately following pricing increases.
• Implement environmental fee (or similar) to fund long-term management of the Landfill in
an equitable way. As a strategy to increase revenue from the commercial customers of the landfill,
the City could introduce a mandatory separate surcharge for non-city materials disposed at the
Landfill. This surcharge would be designed to generate revenue from the tonnage disposed.
• Incentivize diversion from third-party hauling customers by revising discount structures or
implementing material-specific gate rates. Shift the discount structure to provide more favorable
pricing based on a documented level of diversion. As the City looks to establish on-site organics
recycling opportunities, gate rates could be established for clean source-separated loads of clean
yard trimmings and other desired materials. These material-specific gate rates, if set below the gate
rate for mixed MSW, can incentivize diversion in the community while providing feedstock for the
City’s diversion activities.
Recycling potential. Pricing strategies that include increased costs of landfill disposal and pricing
incentives for diversion (either as part of the discount structure or through material-specific gate rates for
divertible materials) provides waste reduction and recycling potential. A discount structure based on
diversion levels (e.g., single-stream material recycled) provides additional incentives for recycling of non-
City materials in neighboring communities, driving increased volumes of material sent to FCC, non-City
organics that may be accepted at a future City composting facility, and/or the Dallas County regional HHW
program.
Operational impact. Increasing operating efficiency through increased staffing and technology
deployment minimizes safety risks and reduces overtime demand required for daily opening and closing
activities. Similarly, expanding to a 24-hour operation could reduce operational needs associated with daily
cover and opening and closing activities. Deploying additional hardware and software technology can
improve operational efficiency. For example, the Landfill recently began using GPS technology integration
with Carlson in landfill equipment (one compactor and two dozers) to communicate compaction and
number of passes to the operators. This technology can also be used to assist in more sophisticated ways
such as for phase geometry and elevations (cell, lift and final intermediate). Based on recent Landfill survey
data there are inactive cells under intermediate cover that are short of final waste grades, and use of on-
DRAFT
LSWMP Update Landfill
City of Dallas, Texas 8-12 Burns & McDonnell
board GPS technology could improve filling of future cells to grade to completely utilize permitted airspace.
Continuing the option of leachate and/or condensate recirculation when needed provides operational
benefits of accelerated decomposition and maintains the flexibility of an on-site method for managing
condensate and leachate in the event that off-site management options become temporarily or permanently
limited. It is important that liquids addition is not overutilized to avoid operational challenges such as
potential decrease in stability and potential seeps.
Financial impact. Any adjustments to the pricing strategy at the landfill will have potential financial
impacts to the facility.
• Increases in gate rates typically have a short-term impact on received tonnages, though quantities
rebound when gate rates are set appropriately relative to the market.
• Establishing a per-ton environmental fee (e.g., $2.50 per ton) applied to cash, commercial, and
contract customers would more equitably fund closure and post-closure needs and lessen the future
financial impact to residents and taxpayers to fund these activities. Based on 2019 scalehouse data,
a $2.50 per ton environmental fee would have generated approximately $3 million in revenue from
the outside users of the Landfill.
Increasing the use of technology will require the purchase of additional equipment (e.g., on-board GPS),
but operational improvements can also result in financial savings through efficient use of airspace and
improved execution of phase geometry, reducing the potential to install wells and long-term cover prior to
reaching final grades.
Currently, the Landfill receives a significant portion of waste from outside third-party sources through
discount contracts, commercial accounts, and cash customers (see Appendix E, Figure E-7 for customer
summary); however, in the coming decades there may be pressure to limit outside waste to preserve capacity
for the City’s needs. Implementing a per-ton environmental fee in the near-term will generate closure and
post-closure funds more equitably by including the third-party private-sector customers who dispose of
significant tonnage in the Landfill. Implementing a fee to support closure and post-closure costs later in the
Landfill’s life may result in these costs being borne primarily or exclusively by City residents.
Environmental impact. The environmental impacts of landfilling, including GHG emissions, vary
depending on the materials being landfilled as well as the landfill gas management approach. Operations at
the landfill such as using diesel-powered equipment also result in emissions. Efforts to preserve landfill
airspace through diversion and waste reduction (e.g., avoiding the creation of wastes that must be managed)
reduce the City’s carbon footprint through both the avoided landfill emissions and the associated benefits
DRAFT
LSWMP Update Landfill
City of Dallas, Texas 8-13 Burns & McDonnell
of recycling or composting materials. Extending landfill life also provides avoids environmental impacts
associated with developing additional land for landfill disposal.
Policy impacts. Landfill gate rates, increases, and discount structure are set through City ordinance, and
changes to pricing and discount structure would require a relatively high level of effort to develop
ordinances to be adopted by City Council. Some operational changes require TCEQ permit modification,
such as SOP changes to increase the size of the working face or expand to 24-hour operation. Other
operational changes, such as deploying technology or filling staff vacancies, should not have policy
impacts.
Stakeholder “buy-in”. There is medium stakeholder “buy-in” on this option because while there is an
anticipated high level of “buy-in” from staff from an operational perspective especially for changes that
would increase safety and reduce overtime, there is lower “buy-in” from an operational perspective related
to space constraints of storing material in idle transfer trailers on site and hauling material at night.
Compatibility with existing programs. This option has a high level of compatibility with existing
programs, as available approaches build from current landfill management approaches and programs, such
as by revising existing discount and fee structures and incorporating additional technology into the planning
and execution of current fill approach.
8.4.2 Divert Self-Haul Customers from the Working Face
Overview. Diverting self-haul customers away from the landfill working face would help to address traffic
and safety considerations at the site. Self-haul customers such as residents and other manual unloading
customers contribute to longer than desired wait times at the scalehouse and high traffic at the working
face. The City’s approach to diverting these customers to a separate portion of the working face from waste
collection vehicles has improved conditions; however, the City can further improve safety and efficiency
through the following approaches to divert self-haul customers:
• Incentivize customers to utilize CCC. Currently, residents and other manual unloading customers
are instructed to use the existing CCC; however, many bypass this option and historically have filed
complaints if they are turned away from the working face to use the existing CCC. These customers
could be incentivized by receiving discounted disposal fees for use of the CCC.
• Develop an expanded CCC and require its use by certain customer categories. Self-haul
customers infrequently use the existing CCC which is located within the permitted limits of waste
and will need to be demolished and relocated to facilitate future fill. If the City were to develop an
DRAFT
LSWMP Update Landfill
City of Dallas, Texas 8-14 Burns & McDonnell
expanded CCC outside the limits of waste, the City could use tactics such as traffic control, signage,
and financial incentives to require and/or encourage its use.
• Leverage transfer station system, contingent on upgrades. The City could implement tactics
such as directing self-haul customers to use the Bachman transfer station. Currently, residential
self-haul may use satellite transfer stations on Wednesday and Saturday. One challenge to address
with this approach is that self-haul customers decrease the efficiency of the transfer station system.
Recycling potential. Diverting self-haul customers to an expanded CCC has limited ability to increase
diversion in the near-term; however, an expanded facility could facilitate long-term diversion in
coordination with the CCRC and potential future organics diversion efforts at the Landfill.
Operational impact. Diverting self-haul and other manual unloading customers provides multiple
operational benefits by:
• Eliminating safety risks at the working face for residents and others who are not specifically trained
regarding potential hazards.
• Improving efficiency by diverting manual unload customers who contribute to long wait times and
working face traffic.
• Weighing of transfer trailer loads to provide additional insight into the quantity of material received
from residential self-haul customers and overall CCC use.
Financial impact. Developing a new, expanded CCC will requires capital investment and have high
financial impact. While specific capital costs will depend on factors such as the number of bays and capacity
needs, costs should be considered similar to those of a small transfer station and could likely be in the order
of $1-3 million.
Environmental impact. There is limited anticipated environmental benefit directly associated with
developing a new CCC, though improved traffic flow and decreased wait times can improve fuel use and
reduce vehicle emissions at the site.
Policy impact. Developing a new, expanded CCC would have low policy impact.
Stakeholder “buy-in”. A new, expanded CCC may result in mixed levels of “buy-in” from stakeholders.
Operationally, the CCC would provide increased convenience and safety to residents and others who self-
haul material to the Landfill. Self-haul customers may be incentivized through strategies such as a flat fee
pricing structure allowing users to skip the line at the scalehouse when using the CCC, controlled traffic
patterns, signage and gates. Additionally, the perception of the CCC as a new, more convenient facility
could help overcome resident hesitancy to change.
DRAFT
LSWMP Update Landfill
City of Dallas, Texas 8-15 Burns & McDonnell
Compatibility with existing programs. While the current CCC is functional, it is within the permitted
limits of waste and must be demolished before Cell 15 can be developed. Developing a new, expanded
CCC outside of the limits of waste therefore has a high level of compatibility with existing the existing
permit and programs.
8.4.3 Increase Organics Processing Capacity
Overview. This option explores the considerations for the Landfill to support the City’s broader efforts to
implement organics diversion for materials such as yard waste, brush, or food waste. Organics processing
technologies and options are described and evaluated in more detail in Section 10.0. The Landfill can be
used to support increased organics processing capacity through several considerations and approaches:
• Develop feasibility analysis for a composting facility at the Landfill. Provide suitable location
to site organics processing infrastructure north of the perimeter berm in coordination with the U.S.
Army Corp of Engineers (USACE). The Landfill permit allows for on-site composting.
Consideration for the feasibility analysis include identifying:
o Material grinding, pre-processing, and processing needs and costs. Composting requires
pre-processing of materials, such as grinding and de-packaging. There is a brush grinding
operation at the Landfill for volume reduction, but there is not space or processing capacity to
manage significant increases in volumes of material. To process additional quantities of clean
brush (or other organics), the Landfill will need to expand green waste/brush processing
capability. One option to do so is by leveraging the existing master agreement to process City-
collected green waste from the separate brush/bulky collection pilot program and then further
expand to process future City-collected and commercial green wastes.
o Staffing and equipment needs for the City to operate the facility. Composting operations
will require additional staffing support, though the level of staffing needs will vary depending
on the selected organics processing technology (e.g., windrow composting, anerobic digestion,
etc.) and potential public-private partnership to develop and operate the facility.
o End markets for compost and mulch finished product(s). Finished composting and mulch
products could be sold or provided for free to residents, additional end markets could include
local landscaping companies and state agencies (e.g., TxDOT).
• Develop and release a procurement for organics processing in conjunction with upgrading
the transfer station system. Releasing a procurement for organics processing that meets the
anticipated timeline of upgrades to the transfer station system would allow the City to evaluate
costs and the level of effort to implement the infrastructure to effectively divert separate yard
DRAFT
LSWMP Update Landfill
City of Dallas, Texas 8-16 Burns & McDonnell
trimmings and brush collected. Additionally, portions of this effort may be eligible for funding
from the NCTCOG.
Recycling potential. Organic waste is a large portion of disposed material and expanding organics
processing capacity would increase the City’s ability to make meaningful progress toward its long-term
Zero Waste goals.
Operational impact. Implementing organics diversion at the Landfill would have a high operational
impact, including the need to allocate space to receive source-separated loads of clean organics (brush,
green waste); process through grinding, composting, and/or another technology; and store finished product
(e.g., compost) as needed. These activities will also require additional equipment and staff.
Financial impact. While specific costs vary depending on the selected organics processing technology,
operating an organics processing facility at the Landfill would incur capital, equipment and operational
financial impacts. These impacts would be high for a City-owned and operated facility. If a public-private
partnership were leveraged to develop and operate the facility, the financial impact to the City would be
less, however there would still be financial impacts such as tipping fees for material processing.
Additionally, organics diversion from landfill can reduce gas generation potential (described in Section
8.3.2). In the event of reduced gas generation, there would be financial impacts to the revenue share
provided to the City as part of the landfill gas contract with DCEMB.
Environmental impact. Generally, environmental benefits associated with diverting organics from landfill
include reduced landfill emissions and improved soil and nutrient benefits from use of the resulting compost
product. The level of benefit varies depending on the type of organics diverted (e.g., food waste compared
to brush), processing technology used (e.g., composting compared to AD) and the landfill gas management
practices used (e.g., landfill gas flaring compared to aggressive gas capture and conversion to high-BTU
fuel).
Policy impact. Supporting organics processing efforts at the Landfill would require a moderate level of
effort related to policy, regulatory requirements, and adjustments. The primary regulatory impact is related
to citing an organics management facility north of the landfill berm, which would require approval of the
USACE and modification of the wetlands permit. If approval cannot be obtained from USACE, alternative
locations would need to be explored.
Stakeholder “buy-in”. There is a mixed level of stakeholder “buy-in” related to this option because
although it would support increasing recycling, the capital and operational needs to develop an organics
processing facility at the Landfill may interrupt existing operations. As described in Section 8.3.2, diversion
DRAFT
LSWMP Update Landfill
City of Dallas, Texas 8-17 Burns & McDonnell
of degradable organics from the landfill has potential gas generation impacts affecting the level of “buy-
in” from DCEMB.
Compatibility with existing programs. There is a moderate level of compatibility with existing brush
grinding operations and contracts, which have potential for expansion on a pilot-scale but additional space
and equipment would be required to expand operations into a more robust composting or other organics
processing facility.
8.4.4 Undertake Long-term Operations and Development Planning
Overview. This option explores the long-term planning needs for the Landfill, specifically to:
• Create a facility master plan. This type of plan is valuable to identify and optimize site
development phasing, capital improvement projects, and infrastructure needs (e.g., stormwater,
leachate forcemain, electrical). A master plan will allow the City to coordinate and plan for capital
and operational needs and changes as it explores relocation of buildings (e.g., administration
building, maintenance building, scalehouse, CCC) outside the limits of waste, continues cell
development to the north (and associated traffic and utility needs), and considers the timeline for
funding and installing the final cover system.
• Explore needs for future permit modification to revise to the final grading plan and permitted
heights. The current permitted final grades are designed with the typical 4(H):1(V) side-slopes and
a shallow crown, which can be subject to ponding due to the large footprint of the Landfill. The
City should consider pursuing a permit modification to revise the final grading plan to maintain 4:1
side-slopes but use 7:1 slopes on the crown to mitigate any stormwater management challenges.
• Move structures outside the permitted limits of waste. The maintenance building, administration
building, and CCC are all located within the permitted limits of waste (Cell 15) and will need to be
demolished for future cell development.
Recycling potential. While long-term planning will support effective use of existing landfill resources, it
will not necessarily provide additional recycling potential.
Operational impact. Long-term operations planning can provide significant operational benefits at the
Landfill by forecasting operational and capital needs throughout the site life. A long-term landfill
masterplan can also support Landfill staff with site development efforts (e.g., weekly and daily fill plans).
Modifications to final grades can be used to mitigate future operational challenges with stormwater
management. Moving structures outside the permitted limits of waste can be disruptive to operations, and
careful evaluation, planning and phasing as part of a long-term master plan can help to mitigate these
DRAFT
LSWMP Update Landfill
City of Dallas, Texas 8-18 Burns & McDonnell
impacts. The new facilities will benefit operations by addressing challenges with the existing aged buildings
(e.g., electrical and size constraints at the maintenance building).
Financial impact. Moving structures outside of the permitted limits of waste represent large capital
expenses for design, permitting, and construction activity. Once developed, a master plan will assist the
City by establishing capital post milestones for Landfill needs, including relocating these structures. Costs
associated with long-term operations planning include costs associated with developing a facility master
plan, permitting and design of revised slopes.
Environmental impact. Long-term planning efforts, including development of a landfill masterplan, will
support environmentally responsible operations of the Landfill; for example, exploring modifications such
as revisions to the final grades to improve stormwater management.
Policy impact. Policy impacts with long-term planning are limited to permitting needs associated with
facility modifications.
Stakeholder “buy-in”. There is medium stakeholder buy-in on this option. Long-term master planning
will provide valuable information for the City’s and operational challenges will be addressed through the
relocation of buildings outside of the limits of waste. However, construction associated with moving these
buildings could create congestion and challenges at the Landfill, reducing customer “by-in.” While a
potential regrade of final elevations will address potential operational challenges, it would result in an
increase in the Landfill’s maximum elevation. This increase, and any similar recommendations that result
from a Landfill master plan, could be viewed unfavorably by residents.
Compatibility with existing programs. There is a high level of compatibility with existing programs, as
one purpose of long-term master planning is to optimize continued operation of the existing Landfill and
prepare of potential challenges.
8.5 Key Findings and Recommendations
This section presents a summary of the options evaluation followed by key findings and recommendations
related to program and policy approaches to increasing diversion from the City’s multi-family and
commercial sectors. Table 8-3 summarizes the results of the options evaluation for each of the tactics
presented.
DRAFT
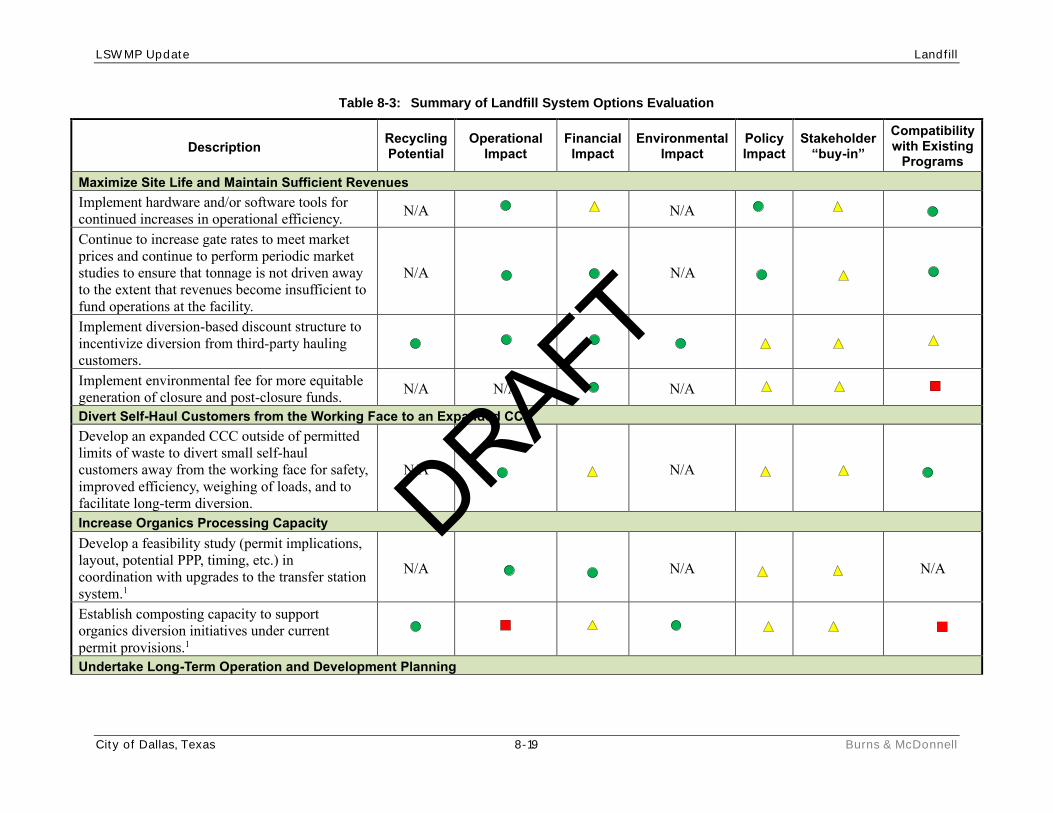
LSWMP Update Landfill
City of Dallas, Texas 8-19 Burns & McDonnell
Table 8-3: Summary of Landfill System Options Evaluation
Description Recycling Potential
Operational Impact
Financial Impact
Environmental Impact
Policy Impact
Stakeholder “buy-in”
Compatibility with Existing
Programs
Maximize Site Life and Maintain Sufficient Revenues
Implement hardware and/or software tools for
continued increases in operational efficiency. N/A N/A
Continue to increase gate rates to meet market
prices and continue to perform periodic market
studies to ensure that tonnage is not driven away
to the extent that revenues become insufficient to
fund operations at the facility.
N/A N/A
Implement diversion-based discount structure to
incentivize diversion from third-party hauling
customers.
Implement environmental fee for more equitable
generation of closure and post-closure funds. N/A N/A N/A
Divert Self-Haul Customers from the Working Face to an Expanded CCC
Develop an expanded CCC outside of permitted
limits of waste to divert small self-haul
customers away from the working face for safety,
improved efficiency, weighing of loads, and to
facilitate long-term diversion.
N/A N/A
Increase Organics Processing Capacity
Develop a feasibility study (permit implications,
layout, potential PPP, timing, etc.) in
coordination with upgrades to the transfer station
system.1
N/A N/A N/A
Establish composting capacity to support
organics diversion initiatives under current
permit provisions.1
Undertake Long-Term Operation and Development Planning
DRAFT
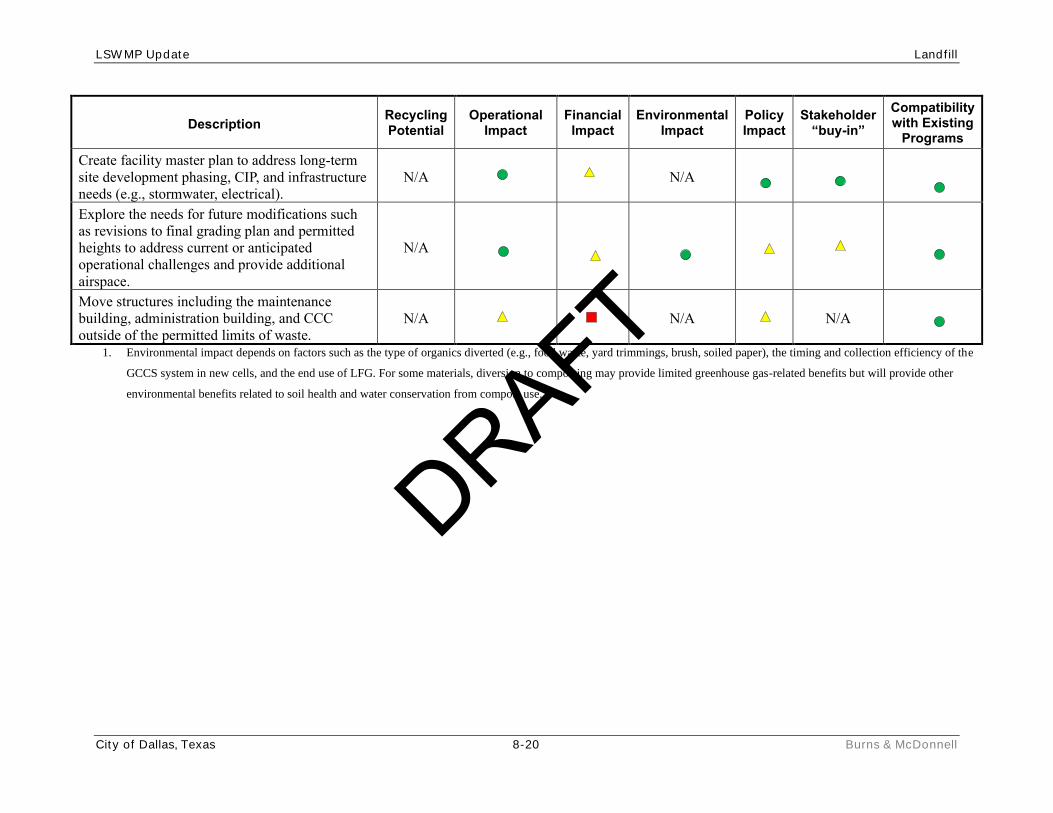
LSWMP Update Landfill
City of Dallas, Texas 8-20 Burns & McDonnell
Description Recycling Potential
Operational Impact
Financial Impact
Environmental Impact
Policy Impact
Stakeholder “buy-in”
Compatibility with Existing
Programs
Create facility master plan to address long-term
site development phasing, CIP, and infrastructure
needs (e.g., stormwater, electrical).
N/A N/A
Explore the needs for future modifications such
as revisions to final grading plan and permitted
heights to address current or anticipated
operational challenges and provide additional
airspace.
N/A
Move structures including the maintenance
building, administration building, and CCC
outside of the permitted limits of waste.
N/A N/A N/A
1. Environmental impact depends on factors such as the type of organics diverted (e.g., food waste, yard trimmings, brush, soiled paper), the timing and collection efficiency of the
GCCS system in new cells, and the end use of LFG. For some materials, diversion to composting may provide limited greenhouse gas-related benefits but will provide other
environmental benefits related to soil health and water conservation from compost use.
DRAFT
LSWMP Update Landfill
City of Dallas, Texas 8-21 Burns & McDonnell
8.5.2 Key Findings
Each of the following key findings supports the recommendation in the subsequent section.
1. Airspace utilization (AUF) suggests that staffing and equipment are being deployed
effectively. The AUF for the Landfill is approximately 1,600 pounds per cubic yard, which exceeds
the regional average (1,375 pounds per cubic yard) and a typical industry performance benchmark
of 1,400 pounds per cubic yard.
2. The local and regional disposal market could likely support increased rates at the Landfill.
The current gate rate ($34.88) is the third lowest in the NCTCOG region, and the average tipping
fee charged ($29) at the Landfill is comparable the average prices of landfills in the regional market
and support ongoing effort to increase tip fees.
3. Buildings are located within the permitted limits of waste, limiting availability of valuable
airspace. The CCC, maintenance building, and administration building are located within the
permitted limits of waste at Cell 15. These buildings must be demolished and relocated in the future
in order to develop Cell 15 for waste disposal.
4. The CCC is underutilized and self-haul and manual load customers at the working face
represent a potential safety risk and lead to longer wait times. The CCC provides a safer
alternative to the working face for self-haul and manual load customers. Currently, these customers
are instructed to use the CCC rather than proceeding to the working face; however, the majority of
customers do not comply with this request. The recent implementation of separate working faces
and traffic control stands on the landfill road have resulted in improvements, but safety and turn-
around times could still be improved by requiring self-haul and manual load customers to use the
CCC.
5. None of the Subtitle D cells have received final cover, and many with intermediate cover and
GCCS system installed have areas not filled to final limits of waste elevation. Installation of
the final cover system over older Subtitle D cells can provide operational benefits such as reduced
leachate generation through reduced infiltration and increased LFG capture efficiency. There are
potential operational challenges associated with recapturing permitted airspace for disposal, such
as the need to navigate heavy equipment around a highly-packed well-field. However, for future
cells on-board technology can be used to bring cells to final limits of waste elevations.
6. Landfill generates significant quantities of greenhouse gasses but the GCCS diverts the
potential emissions to a processing facility for sale. The robust GCCS at the Landfill minimizes
the impact the Landfill would otherwise have on the local emissions inventory.
DRAFT
LSWMP Update Landfill
City of Dallas, Texas 8-22 Burns & McDonnell
7. Closure and post-closure reserves are currently unfunded. Closure and post-closure care can
represent significant cost for materials, installation, and monitoring. Currently closure and post-
closure reserves are unfunded, which presents some financial risk to the City.
8. There are valuable opportunities to expand the City’s current use of on-board technology in
vehicle equipment to more effectively manage operations in real-time. The Landfill recently
began using GPS technology integration with Carlson in landfill equipment (one compactor and
two dozers) to communicate compaction and number of passes to the operators. This technology
can also be used to assist in more sophisticated ways such as for phase geometry and elevations
(cell, lift and final intermediate) to improve filling of future cells to grade to completely utilize
permitted airspace.
8.5.3 Recommendations
Each of the following recommendations are components of the planning level Implementation & Funding
Plan provided in Appendix F.
1. Continue to increase gate rates to meet market prices. The City’s current gate rates are lower
than some nearby facilities, even when accounting for recent 20 percent increases in gate rate for
FY 2021. With appropriate pricing, the City can control the amount of non-contract third-party
waste accepted for disposal while maintaining adequate revenues for short- and long-term
operational needs.
2. Conduct periodic market assessment to determine support future pricing increases. The
regional market price for disposal is driven by many factors and facility pricing dynamics are ever
changing. As nearby facilities change their respective pricing and discount strategies the market
will shift. Given the number of factors, including price, that influence the flow of refuse throughout
the region, the City should conduct routine market studies to track disposal capacity market price
and set rates accordingly to balance incoming tonnages with revenue needs.
3. Implement environmental fee (or similar) to fund long-term management of the Landfill
equitably. The City should implement an environment fee to increase revenue from the commercial
entities and develop a new revenue stream to support funding for closure and post-closure care. It
is possible that commercial haulers would continue disposing at the Landfill if the tip fee with a
new surcharge brings the total per-ton cost to a rate comparable with the regional disposal market.
Likely, commercial haulers would pass increased costs along to their customers by changing
collection rates.
4. Implement pricing strategies to incentivize diversion from third-party hauling customers.
Include level of discount. The Landfill is an important disposal resource not just for the City but
DRAFT
LSWMP Update Landfill
City of Dallas, Texas 8-23 Burns & McDonnell
also for the broader region as other landfills near capacity. The City can leverage its discount
structure to incentivize third-party communities to divert by implementing a discount structure that
provides an increase discount rate based on documented diversion tonnages. This put-or-pay
approach could be used to attract increased volumes of recycling material to the FCC MRF and
other documented activities taken to minimize the waste sent to the Landfill. Discount levels should
be carefully set based on the recommended landfill market studies.
5. Incentivize self-haul customers to utilize the CCC then develop an expanded CCC outside the
permitted limits of waste. The City should implement an incentive for self-haul customers to
utilize the CCC that decreases wait time by bypassing the scalehouse and assessing a flat fee. The
material would need to be weighed before the transfer trailers dispose in the Landfill, but would
allow the City to track the increased usage of equipment to determine when an expanded CCC
would need to be built outside the permitted limits of waste.
6. Implement key operational adjustments and capital upgrades to maximize existing capacity
at the Landfill. The City should expand the use of on-board GPS technology to improve efficiency
of lift planning, compactions, and construction and integrate scalehouse data collection platforms
with the transfer station system.
7. Develop and release procurement for the development and operation of a composting facility.
The City should release a procurement determine most effective approach to developing organics
processing capacity through PPP. As part of this effort, the City should coordinate the procurement
with the upgrades of the transfer station system and potentially offer one or more sites where
vendors to process material rather than attempting to identify a location to process all the material
at the Landfill.
8. Develop a long-term master plan for the Landfill. A long-term master plan can be used to
prepare the City for operational, Capital Improvement Plan (CIP), and other needs at the site and
coordinate activities and needs (e.g., landfill road, utility, traffic control, and construction based on
cell phasing). As part of the master plan, the City will be better prepared to:
a. Discontinue building in the permitted limits of waste and move buildings that are in
footprint. The long-term master plan will allow the City to coordinate the timing of capital
needs and new building development (design, permitting, construction) with cell phasing and
development to minimize disruptions to Landfill operations. While some of the current
buildings (e.g., maintenance shop, CCC) have significant wear and could use improvement,
there does not appear to be an immediate need to relocate these structures. Although buildings
do not need to be moved immediately, no new buildings should be constructed in the permitted
limits of waste, and existing buildings should be relocated to other areas of the site over time.
DRAFT
LSWMP Update Landfill
City of Dallas, Texas 8-24 Burns & McDonnell
b. Undertake design and permitting modification to address operational challenges. This
includes re-grading the crown by increasing the final grade of the crow from 4:1 to 7:1 to
prevent stormwater run-off challenges and increase airspace.
c. Revise traffic flow patterns. If the City shifts to using the north entrance for the scalehouse,
CCC, maintenance building and/or organics processing, a master plan should be utilized to
support the development of roads to the working face and other areas of the facility and new
scalehouse or other infrastructure.
d. Explore options when currently-permitted airspace is consumed. A masterplan would
consider and compare options such as a potential vertical expansion, new landfill, or additional
transfer station(s) for long-haul to an existing landfill.
DRAFT
LSWMP Update Recycling Processing
City of Dallas, Texas 9-1 Burns & McDonnell
9.0 RECYCLING PROCESSING
Effective recycling processing infrastructure capacity and programs support the City’s efforts to increase
diversion from disposal. Processing services for recycling material collected by the Sanitation Department
are provided at the FCC MRF under a public-private partnership agreement that began in 2015.
This section presents information, and analysis and evaluation regarding the City’s recycling processing
agreement.
9.1 Recycling Processing Agreement Overview
Leading up to the expiration of the processing contract with Waste Management Recycle America in 2016,
the City evaluated processing technologies including single-stream recycling, mixed waste processing,
gasification and anaerobic digestion. As a result of the analysis, a Request for Competitive Sealed Proposals
(RFCSP) was issued to identify viable partnership options to increase recycling. Vendors had the option to
develop proposals based on either or both of the following options:
• Vendor constructs and operates MRF at the McCommas Bluff landfill (building ownership
transfers to City at the end of the contract)
• Vendor provides processing services at its own location (vendor site option).
The City offered a 15-acre site and initiated a permit modification to include a MRF at the Landfill. As a
part of its proposal to the City, FCC agreed to the City’s proposed terms and did not request any exceptions
to the contract. FCC designed the sitework and constructed the buildings at no cost to the City. At the
termination of the contract, building ownership will vest with the City. The City will also have the option
to purchase equipment from FCC at termination of the contract. FCC designed and built the MRF from
November 2015 through December 2016, and the processing agreement between the two parties started on
January 1, 2016 and has been in place since.
Sanitation Department vehicles deliver recycling directly to the FCC MRF, but the majority of material is
delivered by transfer trailers. FCC hauls contamination and process residue for disposal at the Landfill.
Table 9-1 presents the annual tons delivered to the FCC MRF by collection location from FY 2018 – FY
2020.
DRAFT
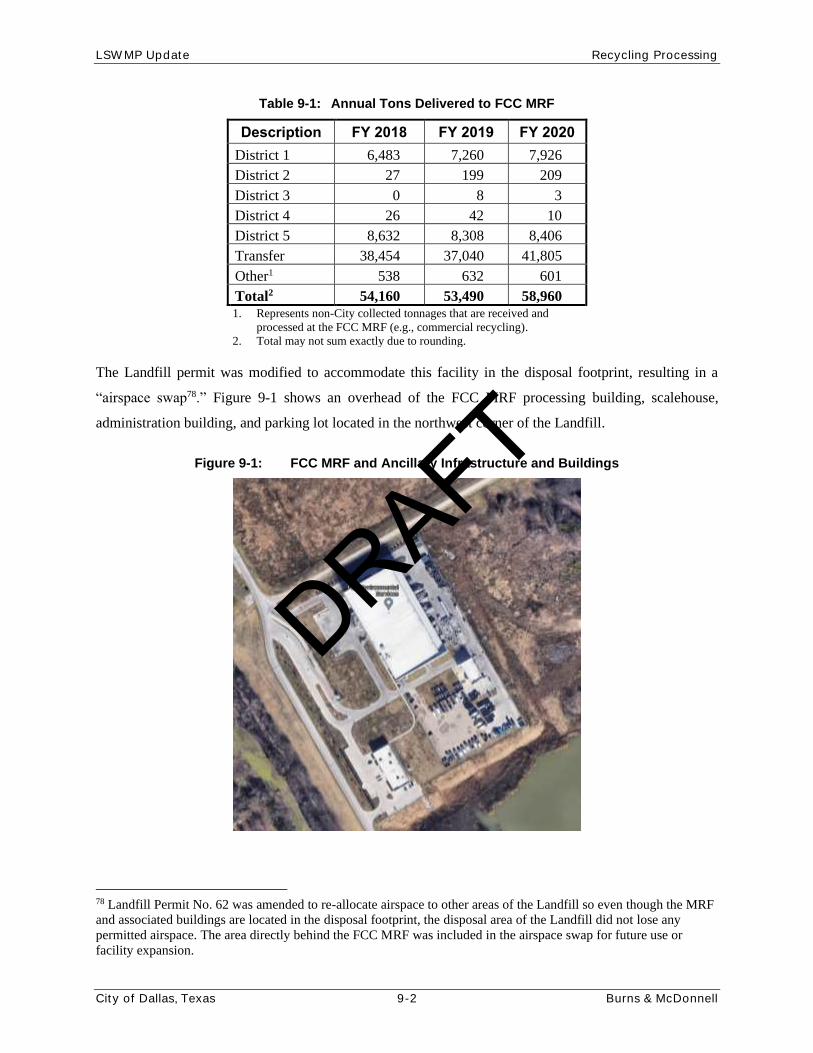
LSWMP Update Recycling Processing
City of Dallas, Texas 9-2 Burns & McDonnell
Table 9-1: Annual Tons Delivered to FCC MRF
Description FY 2018 FY 2019 FY 2020
District 1 6,483 7,260 7,926
District 2 27 199 209
District 3 0 8 3
District 4 26 42 10
District 5 8,632 8,308 8,406
Transfer 38,454 37,040 41,805
Other1 538 632 601
Total2 54,160 53,490 58,960 1. Represents non-City collected tonnages that are received and
processed at the FCC MRF (e.g., commercial recycling). 2. Total may not sum exactly due to rounding.
The Landfill permit was modified to accommodate this facility in the disposal footprint, resulting in a
“airspace swap78.” Figure 9-1 shows an overhead of the FCC MRF processing building, scalehouse,
administration building, and parking lot located in the northwest corner of the Landfill.
Figure 9-1: FCC MRF and Ancillary Infrastructure and Buildings
78 Landfill Permit No. 62 was amended to re-allocate airspace to other areas of the Landfill so even though the MRF
and associated buildings are located in the disposal footprint, the disposal area of the Landfill did not lose any
permitted airspace. The area directly behind the FCC MRF was included in the airspace swap for future use or
facility expansion.
DRAFT
LSWMP Update Recycling Processing
City of Dallas, Texas 9-3 Burns & McDonnell
FCC designed and built the MRF with the intention of processing up to 120,000 tons79 annually. Inside the
MRF building there are climate-controlled cabins for employees and a viewing gallery to be used for
educational tours to provide a “bird’s eye” view of the processing system from a safe and climate-controlled
area.
The initial term of the agreement is 15 years, with optional renewals (up to 10 additional years). Recently,
the initial term of contract has been extended by an additional three years and will terminate in 2035. There
may be conditional extension option or options for a period from one to ten years at the conclusion of the
initial term. This provides the flexibility to extend the operating agreement for the time frame that best suits
both the City and FCC upon the expiration of the initial term of the agreement.
Rather than dictate specific processing requirements (such as equipment types or methods), the agreement
includes performance-based processing requirements. Section 2.1 of the RFCSP requires FCC to process a
minimum of ninety-five percent (95.0%) by weight of Program Recyclable Materials into recovered
materials and that glass shall be processed to achieve greater than 75 percent usable glass.
To administer the performance-based specifications, the agreement calls for FCC to conduct a MRF audits
twice annually. These audits are necessary to determine the composition for the revenue share, levels of
contamination and whether the processing equipment is achieving a 95 percent recovery rate. The contract
includes audit procedures; additionally, the City and FCC have agreed to conduct the audit based on a more
detailed guideline based on the audit procedures. The audit procedures have been refined over the course
of multiple audits, and it serves as an effective resource.
During each MRF audit the City collects and stores between 75 and 120 tons of recycling material that is
processed through the facility on a dedicated basis to evaluate the composition of the material,
contamination and recovery rate of the equipment. The most recent MRF audit in October 2021 indicated
that contamination levels are in the low 20 percent range and the recovery rate is at or above the 95 percent
minimum.
FCC charges the City a processing fee of $73.46 per ton of recycling delivered that adjusts annually based
on a contractually-based rate adjustment (that only applies to the operational component of the rate). The
City receives 50 percent of the revenue from sales of processed recyclables. The revenue sharing agreement
is based on the higher of actual sales or index pricing, and FCC agreed to set a floor price so the City would
not be required to compensate FCC in the case of negative revenues from low commodity market prices.
79 Based on information in the capacity section of FCC’s proposal to the City, included on pages 91-92.
DRAFT
LSWMP Update Recycling Processing
City of Dallas, Texas 9-4 Burns & McDonnell
Based on the results of the MRF audits, the City provides for the disposal of residuals and contamination
from materials delivered by the City at no cost to FCC. FCC also receives a discounted disposal rate for the
first 20,000 tons of non-City residue and contamination.
FCC pays the City $15.58 per ton host fee for all third-party tonnage; this amount also increases based on
the same percentage as the processing fee. Via a contract addendum, the City and FCC agreed to exclude
certain third-party tonnage from the host fee, as these tonnages are subject to a lower host fee amount.
These tonnages are limited to source separated cardboard that can be baled and sold without extensive
processing. The reason for the lower amount for the “bale and sale” tons is that FCC only receives revenue
based on a percentage of the value of the material (similar to a brokering fee).
FCC currently pays $1.06 per household annually to the City to support its public education and outreach
program. This amount also increases based on the same percentage as the processing fee. FCC also
committed to an additional $40,000 annually for community outreach plus $25,000 annually for FCC
managerial education support; these amounts are not paid directly to the City and are provided as in-kind
services.
9.2 Evaluation of 2011 LSWMP Recommendations
This section evaluates the recommendations presented in the 2011 LSWMP, indicating the progress that
has been made toward the recommended policy and/or program. Additionally, this section identifies any
fundamental changes that have been made since related to programs, policies or forecasts as it relates to
brush and bulky item collection.
Table 9-2 lists the recommendations from the 2011 LSWMP related to recycling processing with a brief
description of progress to date and next steps as part of the LSWMP Update.
Table 9-2: Evaluation of 2011 LSWMP Recommendations
2011 LSWMP Recommendation
Progress To Date Potential Next Steps
Collection of residential
recyclable items.
The City continues to collect and
process material.
Increase generation rate of recycling
while decreasing the current
contamination rate in the 20-25 percent
range.
Adding materials to the
recycling program
(textiles, durable plastics,
film plastic, scrap metal)
The City works closely with FCC to
identify opportunities to increase
recycling while balancing the
operational and safety requirements
of the MRF.
Leverage the recent increase in market
prices to explore opportunities for
increased diversion of materials that
are currently not accepted as part of the
recycling program.
DRAFT
LSWMP Update Recycling Processing
City of Dallas, Texas 9-5 Burns & McDonnell
9.3 Recycling Processing Agreement Evaluation
This section provides an evaluation of key components of the City’s recycling processing contract. This
evaluation is intended to serve as the basis for the following key findings and recommendations. While
tactics and strategic options related to recycling processing are included in the Implementation & Funding
Plan, this section does not contain a high-level table that reviews each tactic provided in other sections of
the LSWMP Update.
Table 9-3 provides an evaluation matrix that compares key components the agreement and based on
strengths, weaknesses and opportunities.
DRAFT
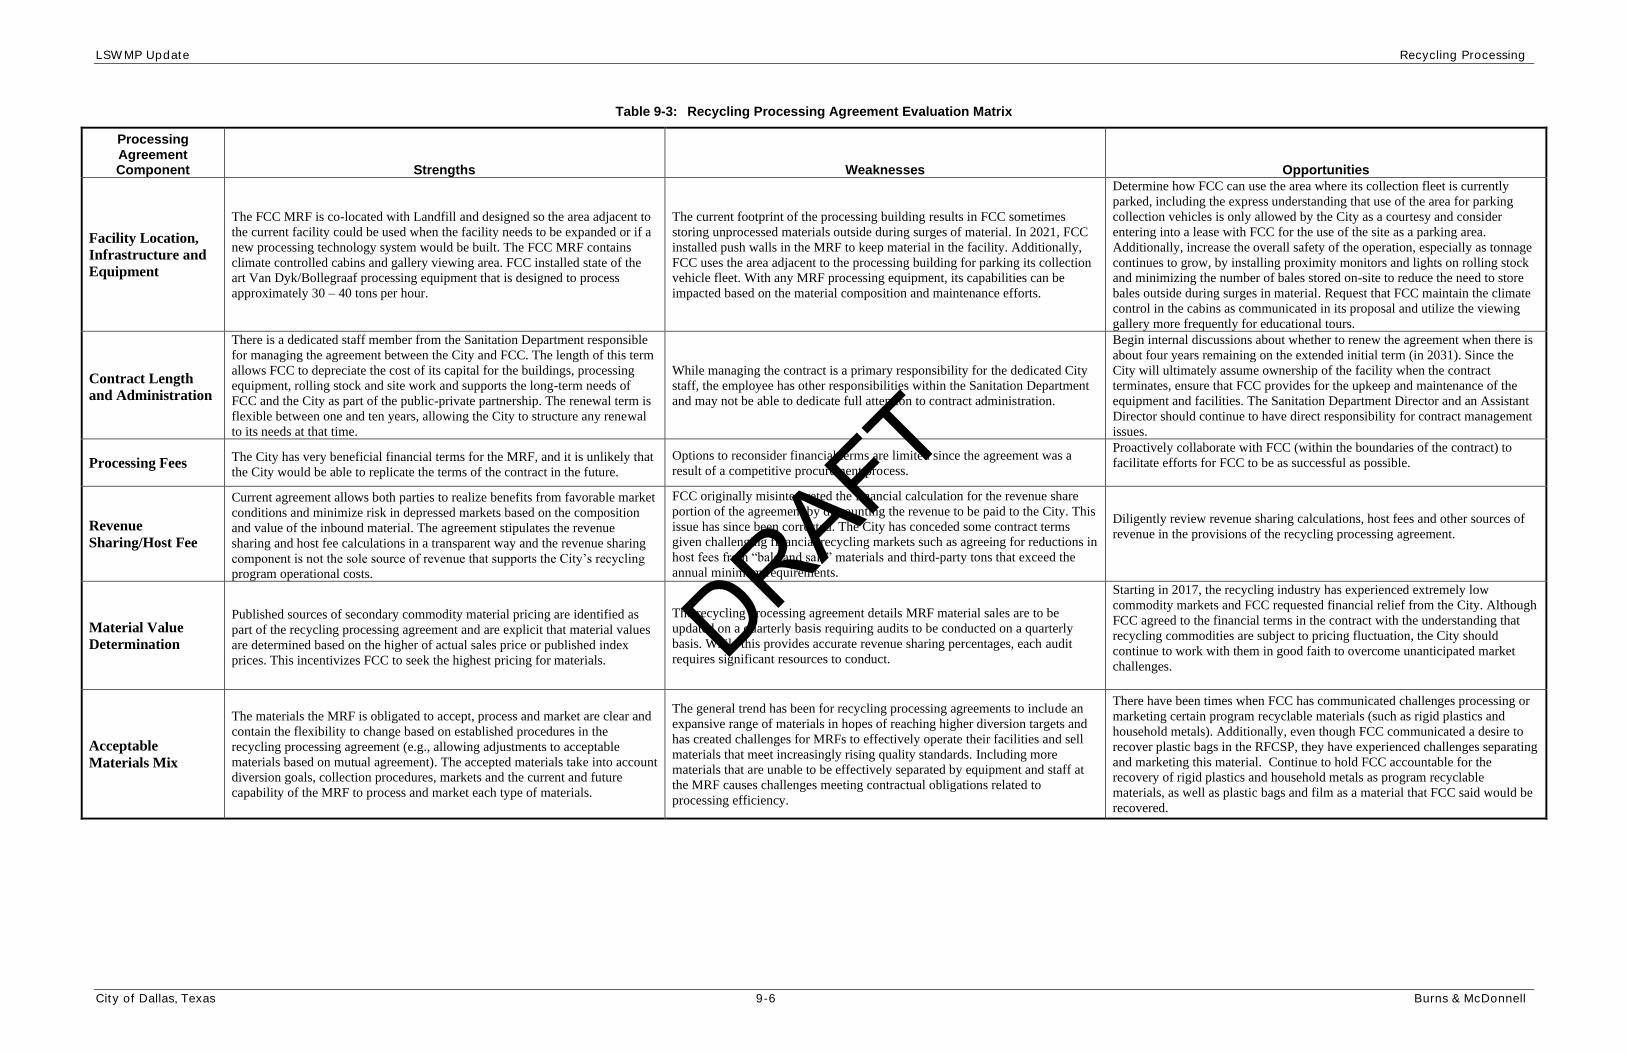
LSWMP Update Recycling Processing
City of Dallas, Texas 9-6 Burns & McDonnell
Table 9-3: Recycling Processing Agreement Evaluation Matrix
Processing Agreement Component Strengths Weaknesses Opportunities
Facility Location,
Infrastructure and
Equipment
The FCC MRF is co-located with Landfill and designed so the area adjacent to
the current facility could be used when the facility needs to be expanded or if a
new processing technology system would be built. The FCC MRF contains
climate controlled cabins and gallery viewing area. FCC installed state of the
art Van Dyk/Bollegraaf processing equipment that is designed to process
approximately 30 – 40 tons per hour.
The current footprint of the processing building results in FCC sometimes
storing unprocessed materials outside during surges of material. In 2021, FCC
installed push walls in the MRF to keep material in the facility. Additionally,
FCC uses the area adjacent to the processing building for parking its collection
vehicle fleet. With any MRF processing equipment, its capabilities can be
impacted based on the material composition and maintenance efforts.
Determine how FCC can use the area where its collection fleet is currently
parked, including the express understanding that use of the area for parking
collection vehicles is only allowed by the City as a courtesy and consider
entering into a lease with FCC for the use of the site as a parking area.
Additionally, increase the overall safety of the operation, especially as tonnage
continues to grow, by installing proximity monitors and lights on rolling stock
and minimizing the number of bales stored on-site to reduce the need to store
bales outside during surges in material. Request that FCC maintain the climate
control in the cabins as communicated in its proposal and utilize the viewing
gallery more frequently for educational tours.
Contract Length
and Administration
There is a dedicated staff member from the Sanitation Department responsible
for managing the agreement between the City and FCC. The length of this term
allows FCC to depreciate the cost of its capital for the buildings, processing
equipment, rolling stock and site work and supports the long-term needs of
FCC and the City as part of the public-private partnership. The renewal term is
flexible between one and ten years, allowing the City to structure any renewal
to its needs at that time.
While managing the contract is a primary responsibility for the dedicated City
staff, the employee has other responsibilities within the Sanitation Department
and may not be able to dedicate full attention to contract administration.
Begin internal discussions about whether to renew the agreement when there is
about four years remaining on the extended initial term (in 2031). Since the
City will ultimately assume ownership of the facility when the contract
terminates, ensure that FCC provides for the upkeep and maintenance of the
equipment and facilities. The Sanitation Department Director and an Assistant
Director should continue to have direct responsibility for contract management
issues.
Processing Fees The City has very beneficial financial terms for the MRF, and it is unlikely that
the City would be able to replicate the terms of the contract in the future.
Options to reconsider financial terms are limited since the agreement was a
result of a competitive procurement process.
Proactively collaborate with FCC (within the boundaries of the contract) to
facilitate efforts for FCC to be as successful as possible.
Revenue
Sharing/Host Fee
Current agreement allows both parties to realize benefits from favorable market
conditions and minimize risk in depressed markets based on the composition
and value of the inbound material. The agreement stipulates the revenue
sharing and host fee calculations in a transparent way and the revenue sharing
component is not the sole source of revenue that supports the City’s recycling
program operational costs.
FCC originally misinterpreted the financial calculation for the revenue share
portion of the agreement by discounting the revenue to be paid to the City. This
issue has since been corrected. The City has conceded some contract terms
given challenging financial recycling markets such as agreeing for reductions in
host fees from “bale and sale” materials and third-party tons that exceed the
annual minimum requirements.
Diligently review revenue sharing calculations, host fees and other sources of
revenue in the provisions of the recycling processing agreement.
Material Value
Determination
Published sources of secondary commodity material pricing are identified as
part of the recycling processing agreement and are explicit that material values
are determined based on the higher of actual sales price or published index
prices. This incentivizes FCC to seek the highest pricing for materials.
The recycling processing agreement details MRF material sales are to be
updated on a quarterly basis requiring audits to be conducted on a quarterly
basis. While this provides accurate revenue sharing percentages, each audit
requires significant resources to conduct.
Starting in 2017, the recycling industry has experienced extremely low
commodity markets and FCC requested financial relief from the City. Although
FCC agreed to the financial terms in the contract with the understanding that
recycling commodities are subject to pricing fluctuation, the City should
continue to work with them in good faith to overcome unanticipated market
challenges.
Acceptable
Materials Mix
The materials the MRF is obligated to accept, process and market are clear and
contain the flexibility to change based on established procedures in the
recycling processing agreement (e.g., allowing adjustments to acceptable
materials based on mutual agreement). The accepted materials take into account
diversion goals, collection procedures, markets and the current and future
capability of the MRF to process and market each type of materials.
The general trend has been for recycling processing agreements to include an
expansive range of materials in hopes of reaching higher diversion targets and
has created challenges for MRFs to effectively operate their facilities and sell
materials that meet increasingly rising quality standards. Including more
materials that are unable to be effectively separated by equipment and staff at
the MRF causes challenges meeting contractual obligations related to
processing efficiency.
There have been times when FCC has communicated challenges processing or
marketing certain program recyclable materials (such as rigid plastics and
household metals). Additionally, even though FCC communicated a desire to
recover plastic bags in the RFCSP, they have experienced challenges separating
and marketing this material. Continue to hold FCC accountable for the
recovery of rigid plastics and household metals as program recyclable
materials, as well as plastic bags and film as a material that FCC said would be
recovered.
DRAFT
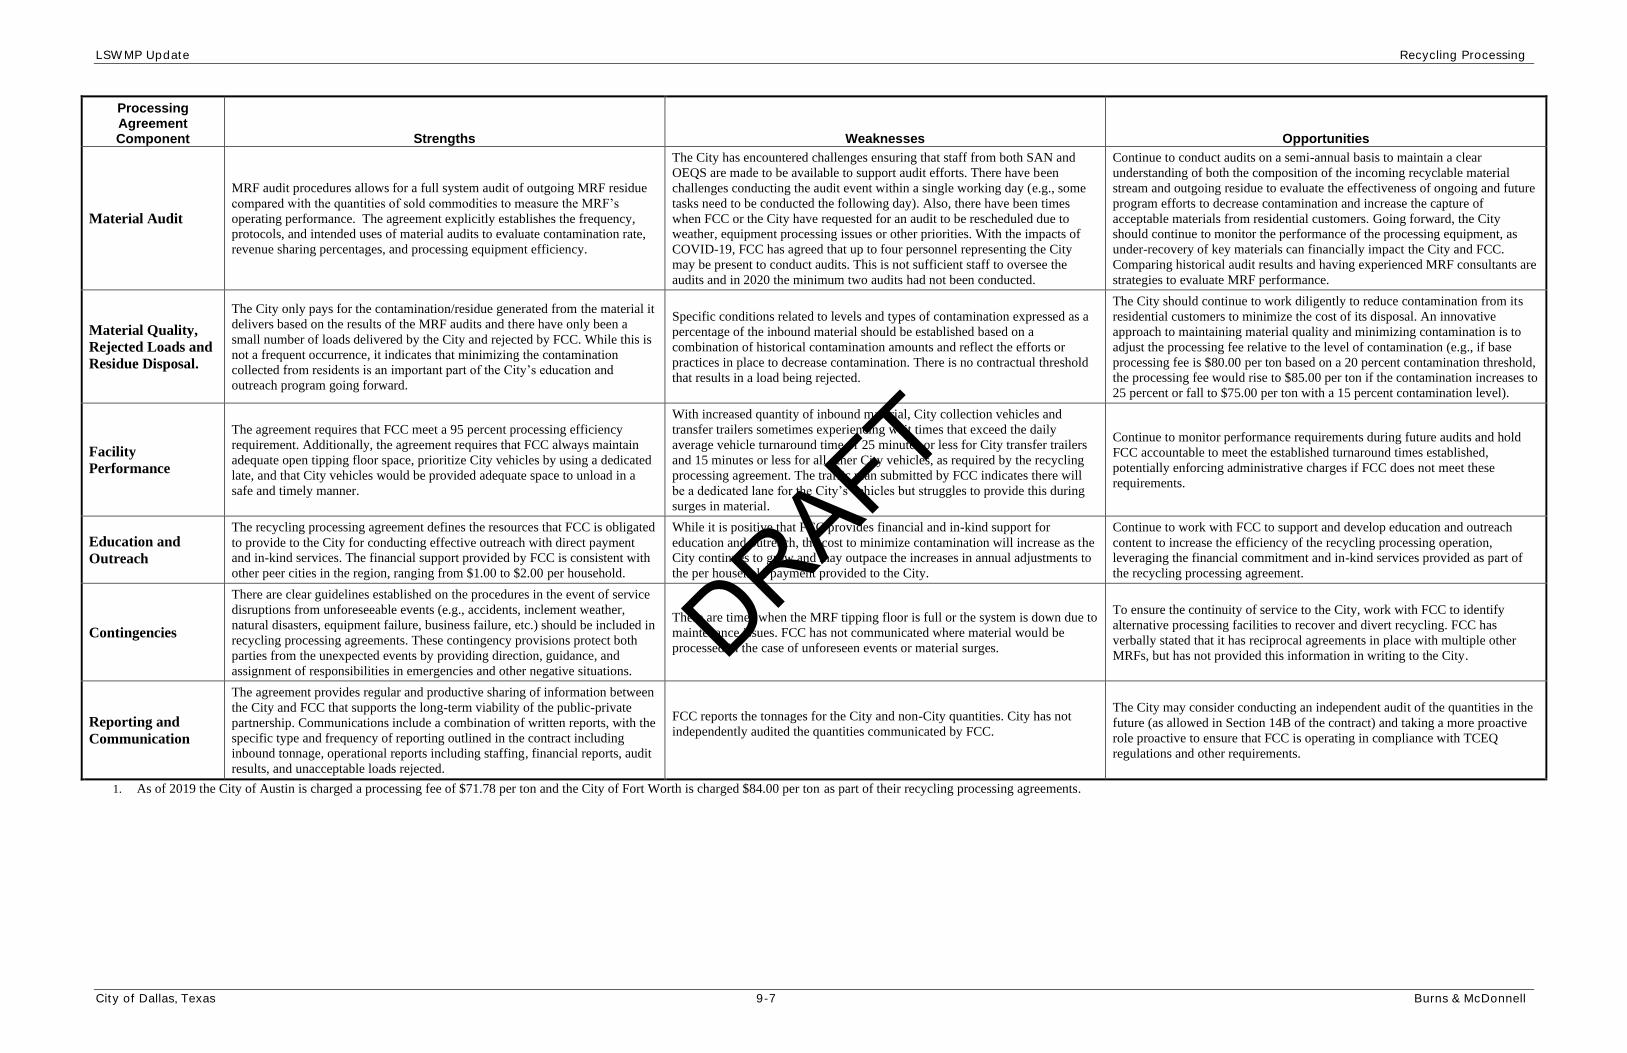
LSWMP Update Recycling Processing
City of Dallas, Texas 9-7 Burns & McDonnell
Processing Agreement Component Strengths Weaknesses Opportunities
Material Audit
MRF audit procedures allows for a full system audit of outgoing MRF residue
compared with the quantities of sold commodities to measure the MRF’s
operating performance. The agreement explicitly establishes the frequency,
protocols, and intended uses of material audits to evaluate contamination rate,
revenue sharing percentages, and processing equipment efficiency.
The City has encountered challenges ensuring that staff from both SAN and
OEQS are made to be available to support audit efforts. There have been
challenges conducting the audit event within a single working day (e.g., some
tasks need to be conducted the following day). Also, there have been times
when FCC or the City have requested for an audit to be rescheduled due to
weather, equipment processing issues or other priorities. With the impacts of
COVID-19, FCC has agreed that up to four personnel representing the City
may be present to conduct audits. This is not sufficient staff to oversee the
audits and in 2020 the minimum two audits had not been conducted.
Continue to conduct audits on a semi-annual basis to maintain a clear
understanding of both the composition of the incoming recyclable material
stream and outgoing residue to evaluate the effectiveness of ongoing and future
program efforts to decrease contamination and increase the capture of
acceptable materials from residential customers. Going forward, the City
should continue to monitor the performance of the processing equipment, as
under-recovery of key materials can financially impact the City and FCC.
Comparing historical audit results and having experienced MRF consultants are
strategies to evaluate MRF performance.
Material Quality,
Rejected Loads and
Residue Disposal.
The City only pays for the contamination/residue generated from the material it
delivers based on the results of the MRF audits and there have only been a
small number of loads delivered by the City and rejected by FCC. While this is
not a frequent occurrence, it indicates that minimizing the contamination
collected from residents is an important part of the City’s education and
outreach program going forward.
Specific conditions related to levels and types of contamination expressed as a
percentage of the inbound material should be established based on a
combination of historical contamination amounts and reflect the efforts or
practices in place to decrease contamination. There is no contractual threshold
that results in a load being rejected.
The City should continue to work diligently to reduce contamination from its
residential customers to minimize the cost of its disposal. An innovative
approach to maintaining material quality and minimizing contamination is to
adjust the processing fee relative to the level of contamination (e.g., if base
processing fee is $80.00 per ton based on a 20 percent contamination threshold,
the processing fee would rise to $85.00 per ton if the contamination increases to
25 percent or fall to $75.00 per ton with a 15 percent contamination level).
Facility
Performance
The agreement requires that FCC meet a 95 percent processing efficiency
requirement. Additionally, the agreement requires that FCC always maintain
adequate open tipping floor space, prioritize City vehicles by using a dedicated
late, and that City vehicles would be provided adequate space to unload in a
safe and timely manner.
With increased quantity of inbound material, City collection vehicles and
transfer trailers sometimes experiencing wait times that exceed the daily
average vehicle turnaround time of 25 minutes or less for City transfer trailers
and 15 minutes or less for all other City vehicles, as required by the recycling
processing agreement. The traffic plan submitted by FCC indicates there will
be a dedicated lane for the City’s vehicles but struggles to provide this during
surges in material.
Continue to monitor performance requirements during future audits and hold
FCC accountable to meet the established turnaround times established,
potentially enforcing administrative charges if FCC does not meet these
requirements.
Education and
Outreach
The recycling processing agreement defines the resources that FCC is obligated
to provide to the City for conducting effective outreach with direct payment
and in-kind services. The financial support provided by FCC is consistent with
other peer cities in the region, ranging from $1.00 to $2.00 per household.
While it is positive that FCC provides financial and in-kind support for
education and outreach, the cost to minimize contamination will increase as the
City continues to grow and may outpace the increases in annual adjustments to
the per household payment provided to the City.
Continue to work with FCC to support and develop education and outreach
content to increase the efficiency of the recycling processing operation,
leveraging the financial commitment and in-kind services provided as part of
the recycling processing agreement.
Contingencies
There are clear guidelines established on the procedures in the event of service
disruptions from unforeseeable events (e.g., accidents, inclement weather,
natural disasters, equipment failure, business failure, etc.) should be included in
recycling processing agreements. These contingency provisions protect both
parties from the unexpected events by providing direction, guidance, and
assignment of responsibilities in emergencies and other negative situations.
There are times when the MRF tipping floor is full or the system is down due to
maintenance issues. FCC has not communicated where material would be
processed in the case of unforeseen events or material surges.
To ensure the continuity of service to the City, work with FCC to identify
alternative processing facilities to recover and divert recycling. FCC has
verbally stated that it has reciprocal agreements in place with multiple other
MRFs, but has not provided this information in writing to the City.
Reporting and
Communication
The agreement provides regular and productive sharing of information between
the City and FCC that supports the long-term viability of the public-private
partnership. Communications include a combination of written reports, with the
specific type and frequency of reporting outlined in the contract including
inbound tonnage, operational reports including staffing, financial reports, audit
results, and unacceptable loads rejected.
FCC reports the tonnages for the City and non-City quantities. City has not
independently audited the quantities communicated by FCC.
The City may consider conducting an independent audit of the quantities in the
future (as allowed in Section 14B of the contract) and taking a more proactive
role proactive to ensure that FCC is operating in compliance with TCEQ
regulations and other requirements.
1. As of 2019 the City of Austin is charged a processing fee of $71.78 per ton and the City of Fort Worth is charged $84.00 per ton as part of their recycling processing agreements.
DRAFT
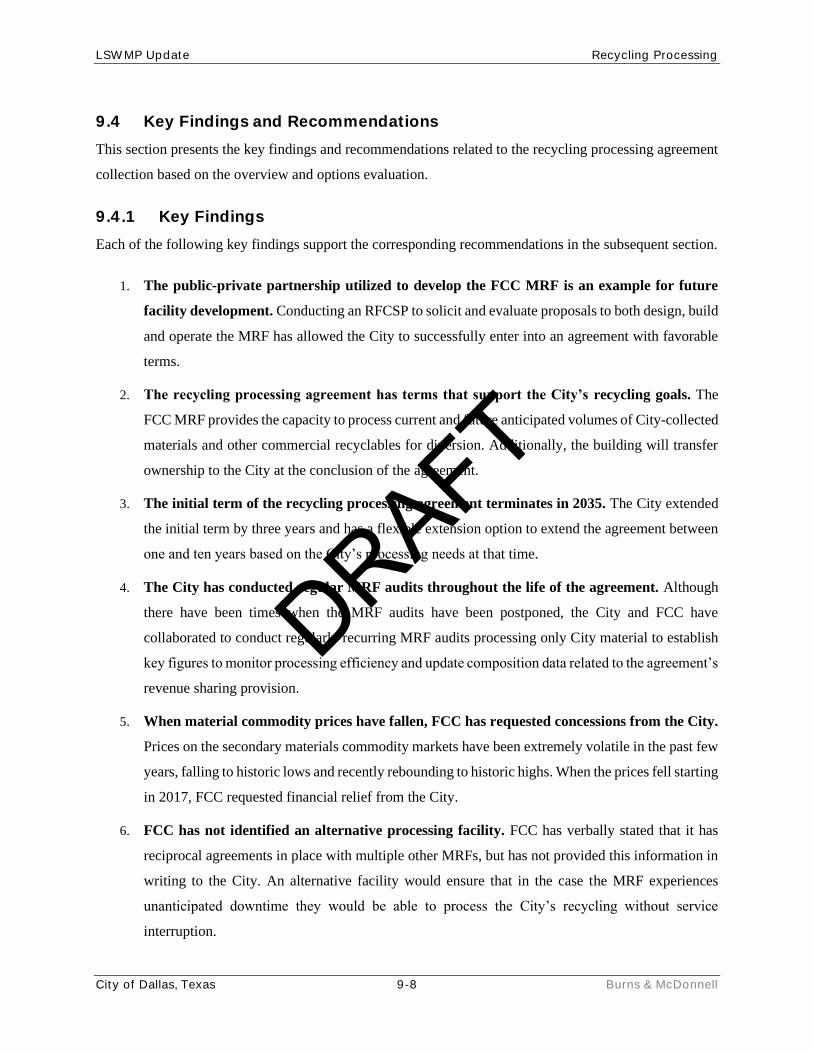
LSWMP Update Recycling Processing
City of Dallas, Texas 9-8 Burns & McDonnell
9.4 Key Findings and Recommendations
This section presents the key findings and recommendations related to the recycling processing agreement
collection based on the overview and options evaluation.
9.4.1 Key Findings
Each of the following key findings support the corresponding recommendations in the subsequent section.
1. The public-private partnership utilized to develop the FCC MRF is an example for future
facility development. Conducting an RFCSP to solicit and evaluate proposals to both design, build
and operate the MRF has allowed the City to successfully enter into an agreement with favorable
terms.
2. The recycling processing agreement has terms that support the City’s recycling goals. The
FCC MRF provides the capacity to process current and future anticipated volumes of City-collected
materials and other commercial recyclables for diversion. Additionally, the building will transfer
ownership to the City at the conclusion of the agreement.
3. The initial term of the recycling processing agreement terminates in 2035. The City extended
the initial term by three years and has a flexible extension option to extend the agreement between
one and ten years based on the City’s processing needs at that time.
4. The City has conducted regular MRF audits throughout the life of the agreement. Although
there have been times when the MRF audits have been postponed, the City and FCC have
collaborated to conduct regularly recurring MRF audits processing only City material to establish
key figures to monitor processing efficiency and update composition data related to the agreement’s
revenue sharing provision.
5. When material commodity prices have fallen, FCC has requested concessions from the City.
Prices on the secondary materials commodity markets have been extremely volatile in the past few
years, falling to historic lows and recently rebounding to historic highs. When the prices fell starting
in 2017, FCC requested financial relief from the City.
6. FCC has not identified an alternative processing facility. FCC has verbally stated that it has
reciprocal agreements in place with multiple other MRFs, but has not provided this information in
writing to the City. An alternative facility would ensure that in the case the MRF experiences
unanticipated downtime they would be able to process the City’s recycling without service
interruption.
DRAFT

LSWMP Update Recycling Processing
City of Dallas, Texas 9-9 Burns & McDonnell
9.4.2 Recommendations
Each of the following recommendations are components of the planning level Implementation & Funding
Plan provided in Appendix F.
1. Establish a public-private partnership for future infrastructure development needs. The
successful procurement, construction and operation of the FCC MRF presents a model that can be
utilized for the development of an organics processing facility.
2. Maintain current terms and conditions of the agreement and hold the contractor accountable
to maintain them. The current terms of the agreement are favorable, and the City should continue
to hold the contractor to account to meet these terms. There have been challenges for the contractor
to meet certain provisions during surges of material such as consistently meeting minimum
turnaround times for City vehicles and storing material outside. While these occurrences have been
remedied, the City should diligently administer the terms of the agreement and hold the contractor
to them, including requesting confirmation of agreements with alternative facilities in the case of
unplanned downtime.
3. Re-evaluate recycling processing agreement four years before conclusion of initial term. In
advance of potentially renewing the agreement in 2035, the City should re-evaluate the agreement
to determine if the financial terms are still favorable (e.g., processing fee and revenue sharing
provision), if the contractor has maintained compliance (e.g., regularly scheduling MRF audits,
meeting reporting requirements, storing materials inside the processing building) and the state of
the processing equipment. Based on this evaluation, the City would determine to execute an
extension of the agreement or solicit proposals for other options.
4. Work with FCC to expand facility as needed in the future. Although there is sufficient capacity
at the MRF to meet the annual tonnage delivered by the City, the plot of land directly adjacent to
the facility is earmarked to expand the facility as needed. Given the growing volumes of recycling
of residential material, the implementation of the MFRO, and the need for increased diversion from
commercial sector generators, there may be a need to expand the FCC MRF in the future. This
expansion could be designed to increase the processing capacity of single-stream material or could
become the site of a processing facility that compliments the FCC MRF but is designed to accept
other material types (e.g., organics). The City should work with FCC to identify the timing and
needs of any future facility expansion.
DRAFT
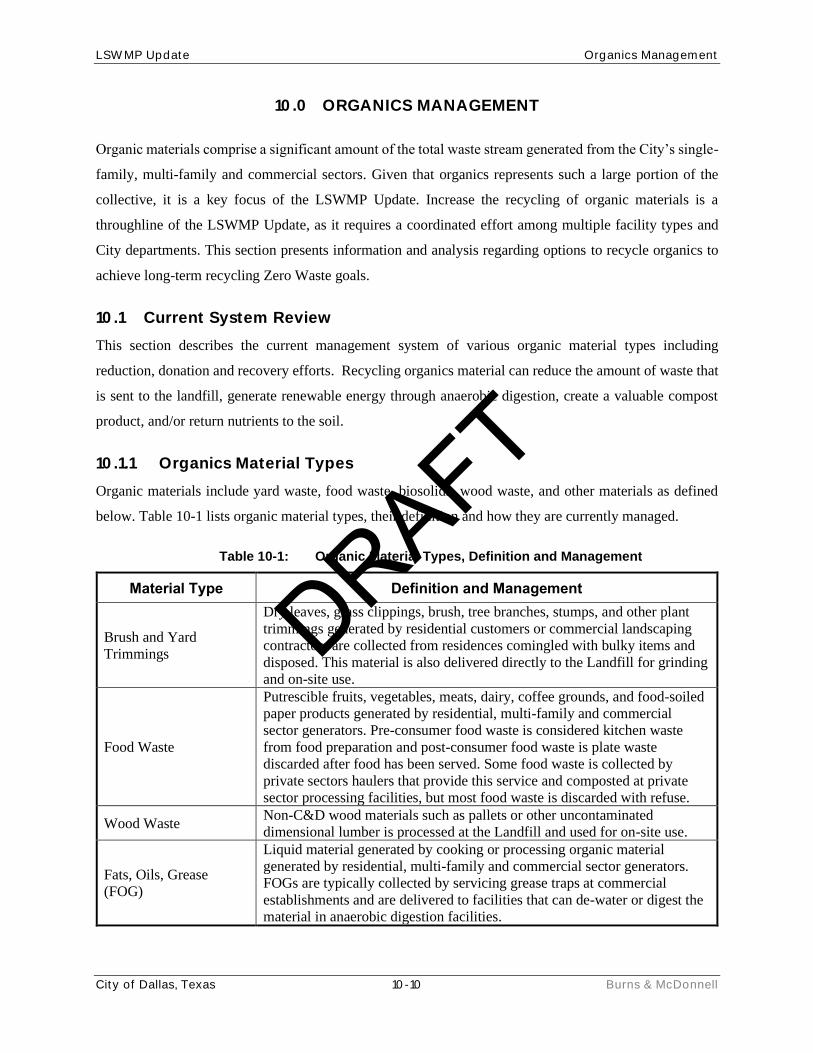
LSWMP Update Organics Management
City of Dallas, Texas 10-10 Burns & McDonnell
10.0 ORGANICS MANAGEMENT
Organic materials comprise a significant amount of the total waste stream generated from the City’s single-
family, multi-family and commercial sectors. Given that organics represents such a large portion of the
collective, it is a key focus of the LSWMP Update. Increase the recycling of organic materials is a
throughline of the LSWMP Update, as it requires a coordinated effort among multiple facility types and
City departments. This section presents information and analysis regarding options to recycle organics to
achieve long-term recycling Zero Waste goals.
10.1 Current System Review
This section describes the current management system of various organic material types including
reduction, donation and recovery efforts. Recycling organics material can reduce the amount of waste that
is sent to the landfill, generate renewable energy through anaerobic digestion, create a valuable compost
product, and/or return nutrients to the soil.
10.1.1 Organics Material Types
Organic materials include yard waste, food waste, biosolids, wood waste, and other materials as defined
below. Table 10-1 lists organic material types, their definition and how they are currently managed.
Table 10-1: Organic Material Types, Definition and Management
Material Type Definition and Management
Brush and Yard
Trimmings
Dry leaves, grass clippings, brush, tree branches, stumps, and other plant
trimmings generated by residential customers or commercial landscaping
contractors are collected from residences comingled with bulky items and
disposed. This material is also delivered directly to the Landfill for grinding
and on-site use.
Food Waste
Putrescible fruits, vegetables, meats, dairy, coffee grounds, and food-soiled
paper products generated by residential, multi-family and commercial
sector generators. Pre-consumer food waste is considered kitchen waste
from food preparation and post-consumer food waste is plate waste
discarded after food has been served. Some food waste is collected by
private sectors haulers that provide this service and composted at private
sector processing facilities, but most food waste is discarded with refuse.
Wood Waste Non-C&D wood materials such as pallets or other uncontaminated
dimensional lumber is processed at the Landfill and used for on-site use.
Fats, Oils, Grease
(FOG)
Liquid material generated by cooking or processing organic material
generated by residential, multi-family and commercial sector generators.
FOGs are typically collected by servicing grease traps at commercial
establishments and are delivered to facilities that can de-water or digest the
material in anaerobic digestion facilities.
DRAFT
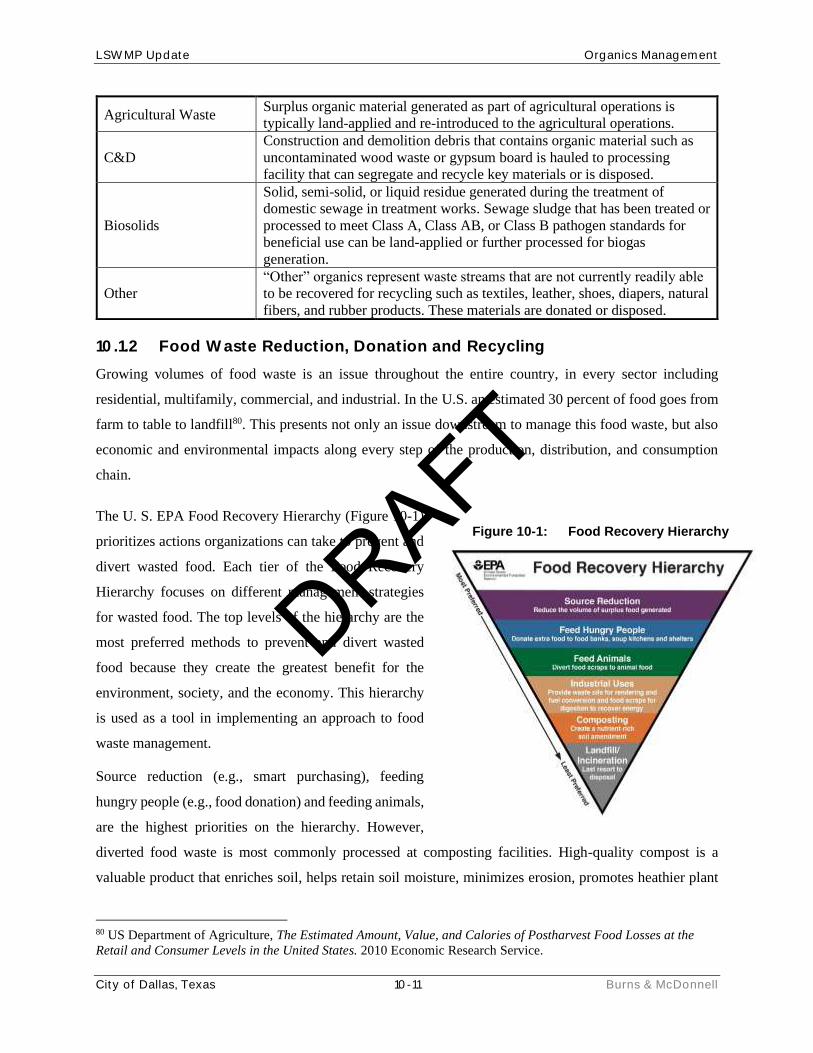
LSWMP Update Organics Management
City of Dallas, Texas 10-11 Burns & McDonnell
Agricultural Waste Surplus organic material generated as part of agricultural operations is
typically land-applied and re-introduced to the agricultural operations.
C&D
Construction and demolition debris that contains organic material such as
uncontaminated wood waste or gypsum board is hauled to processing
facility that can segregate and recycle key materials or is disposed.
Biosolids
Solid, semi-solid, or liquid residue generated during the treatment of
domestic sewage in treatment works. Sewage sludge that has been treated or
processed to meet Class A, Class AB, or Class B pathogen standards for
beneficial use can be land-applied or further processed for biogas
generation.
Other
“Other” organics represent waste streams that are not currently readily able
to be recovered for recycling such as textiles, leather, shoes, diapers, natural
fibers, and rubber products. These materials are donated or disposed.
10.1.2 Food Waste Reduction, Donation and Recycling
Growing volumes of food waste is an issue throughout the entire country, in every sector including
residential, multifamily, commercial, and industrial. In the U.S. an estimated 30 percent of food goes from
farm to table to landfill80. This presents not only an issue downstream to manage this food waste, but also
economic and environmental impacts along every step of the production, distribution, and consumption
chain.
The U. S. EPA Food Recovery Hierarchy (Figure 10-1)
prioritizes actions organizations can take to prevent and
divert wasted food. Each tier of the Food Recovery
Hierarchy focuses on different management strategies
for wasted food. The top levels of the hierarchy are the
most preferred methods to prevent and divert wasted
food because they create the greatest benefit for the
environment, society, and the economy. This hierarchy
is used as a tool in implementing an approach to food
waste management.
Source reduction (e.g., smart purchasing), feeding
hungry people (e.g., food donation) and feeding animals,
are the highest priorities on the hierarchy. However,
diverted food waste is most commonly processed at composting facilities. High-quality compost is a
valuable product that enriches soil, helps retain soil moisture, minimizes erosion, promotes heathier plant
80 US Department of Agriculture, The Estimated Amount, Value, and Calories of Postharvest Food Losses at the
Retail and Consumer Levels in the United States. 2010 Economic Research Service.
Figure 10-1: Food Recovery Hierarchy
DRAFT
LSWMP Update Organics Management
City of Dallas, Texas 10-12 Burns & McDonnell
growth and creates higher resistance to diseases and pests. Using compost can reduce the need for chemical
fertilizers.
There are private companies providing food waste collection and composting services in the North Central
Texas region, but it is unknown if they are providing services to any commercial entities in the City and
how many customers they service.
The City is developing a program to support commercial organics recycling with the funding from a grant
provided by the United States Department of Agriculture (USDA) that will target special events and food
service establishments. The City is in the process of procuring an organics collection and processing service
provided to collect material from businesses and events on a pilot basis. This material will be processed by
the collection contractor and the finished product is intended to be used at the Dallas County gardens. This
program in partnership with Dallas County increases to support its healthy food initiative.
A key consideration related to diverting organic materials that are currently disposed is collecting data to
provide an understanding of the existing recycling levels. Leveraging and expanding on the City’s existing
programs to collect data from food service entities is further discussed in Section 11.0.
10.1.3 Processing Infrastructure
Organics processing infrastructure is a critical component of recycling organic materials. Further
information about composting facilities in the region and the SS WWTP located in the region are provided
in Section 4.0. The varying generators, types and processing needs makes it challenging to recycle on a
comprehensive basis. Each material type may require various screening or pre-processing before it becomes
compatible with the infrastructure that can convert it to a product that does not require landfill disposal. For
example, brush material collected by City crews would need to be mechanically screened before or after
any composting or mulching operation to ensure that the product could be utilized by other City departments
or sold. Additionally, if City collection crews separately collect brush the transfer station system does not
have the capacity to separately store or transfer brush material as a fourth material stream (refuse, recycling,
bulky items and clean brush). With limited available processing infrastructure within 20 miles of the City,
the need to consolidate material for transfer becomes even more critical.
Currently, clean brush and yard trimmings delivered by customers at the Landfill are ground for volume
reduction and are used as part of disposal operations on an as-needed basis. If the existing organic material
delivered to the Landfill were to increase by the estimated tonnage of brush material that could be separately
collected by City crews (approximately 69,000 tons per year), the storage and processing requirements
would exceed the designated space at the Landfill. As part of the 2011 LSWMP analysis, composting brush
DRAFT
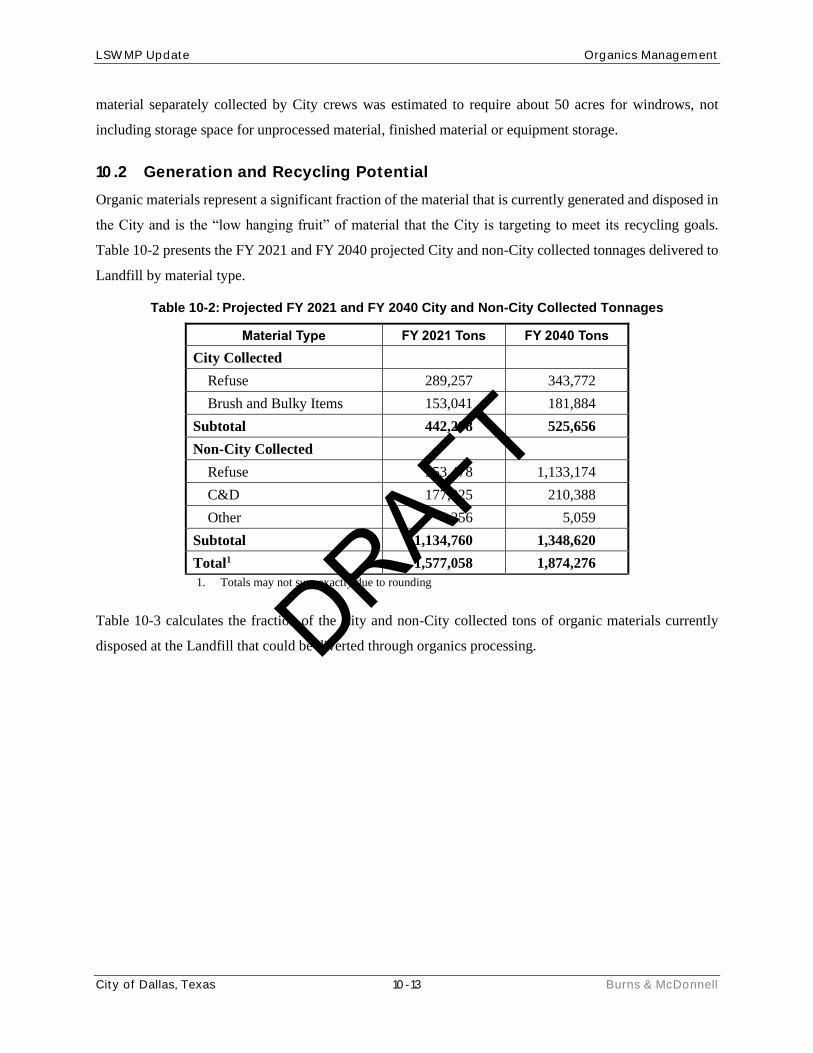
LSWMP Update Organics Management
City of Dallas, Texas 10-13 Burns & McDonnell
material separately collected by City crews was estimated to require about 50 acres for windrows, not
including storage space for unprocessed material, finished material or equipment storage.
10.2 Generation and Recycling Potential
Organic materials represent a significant fraction of the material that is currently generated and disposed in
the City and is the “low hanging fruit” of material that the City is targeting to meet its recycling goals.
Table 10-2 presents the FY 2021 and FY 2040 projected City and non-City collected tonnages delivered to
Landfill by material type.
Table 10-2: Projected FY 2021 and FY 2040 City and Non-City Collected Tonnages
Material Type FY 2021 Tons FY 2040 Tons
City Collected
Refuse 289,257 343,772
Brush and Bulky Items 153,041 181,884
Subtotal 442,298 525,656
Non-City Collected
Refuse 953,478 1,133,174
C&D 177,025 210,388
Other 4,256 5,059
Subtotal 1,134,760 1,348,620
Total1 1,577,058 1,874,276
1. Totals may not sum exactly due to rounding
Table 10-3 calculates the fraction of the City and non-City collected tons of organic materials currently
disposed at the Landfill that could be diverted through organics processing.
DRAFT
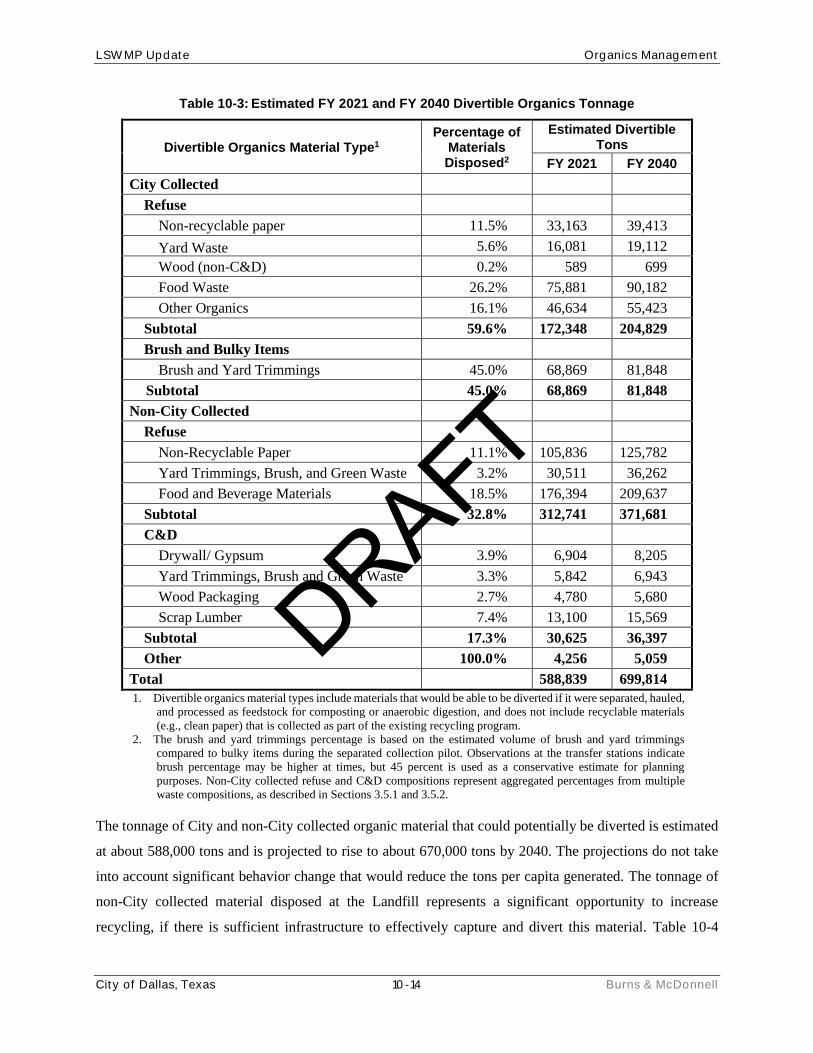
LSWMP Update Organics Management
City of Dallas, Texas 10-14 Burns & McDonnell
Table 10-3: Estimated FY 2021 and FY 2040 Divertible Organics Tonnage
Divertible Organics Material Type1 Percentage of
Materials Disposed2
Estimated Divertible Tons
FY 2021 FY 2040
City Collected
Refuse
Non-recyclable paper 11.5% 33,163 39,413
Yard Waste 5.6% 16,081 19,112
Wood (non-C&D) 0.2% 589 699
Food Waste 26.2% 75,881 90,182
Other Organics 16.1% 46,634 55,423
Subtotal 59.6% 172,348 204,829
Brush and Bulky Items
Brush and Yard Trimmings 45.0% 68,869 81,848
Subtotal 45.0% 68,869 81,848
Non-City Collected
Refuse
Non-Recyclable Paper 11.1% 105,836 125,782
Yard Trimmings, Brush, and Green Waste 3.2% 30,511 36,262
Food and Beverage Materials 18.5% 176,394 209,637
Subtotal 32.8% 312,741 371,681
C&D
Drywall/ Gypsum 3.9% 6,904 8,205
Yard Trimmings, Brush and Green Waste 3.3% 5,842 6,943
Wood Packaging 2.7% 4,780 5,680
Scrap Lumber 7.4% 13,100 15,569
Subtotal 17.3% 30,625 36,397
Other 100.0% 4,256 5,059
Total 588,839 699,814
1. Divertible organics material types include materials that would be able to be diverted if it were separated, hauled,
and processed as feedstock for composting or anaerobic digestion, and does not include recyclable materials
(e.g., clean paper) that is collected as part of the existing recycling program.
2. The brush and yard trimmings percentage is based on the estimated volume of brush and yard trimmings
compared to bulky items during the separated collection pilot. Observations at the transfer stations indicate
brush percentage may be higher at times, but 45 percent is used as a conservative estimate for planning
purposes. Non-City collected refuse and C&D compositions represent aggregated percentages from multiple
waste compositions, as described in Sections 3.5.1 and 3.5.2.
The tonnage of City and non-City collected organic material that could potentially be diverted is estimated
at about 588,000 tons and is projected to rise to about 670,000 tons by 2040. The projections do not take
into account significant behavior change that would reduce the tons per capita generated. The tonnage of
non-City collected material disposed at the Landfill represents a significant opportunity to increase
recycling, if there is sufficient infrastructure to effectively capture and divert this material. Table 10-4
DRAFT
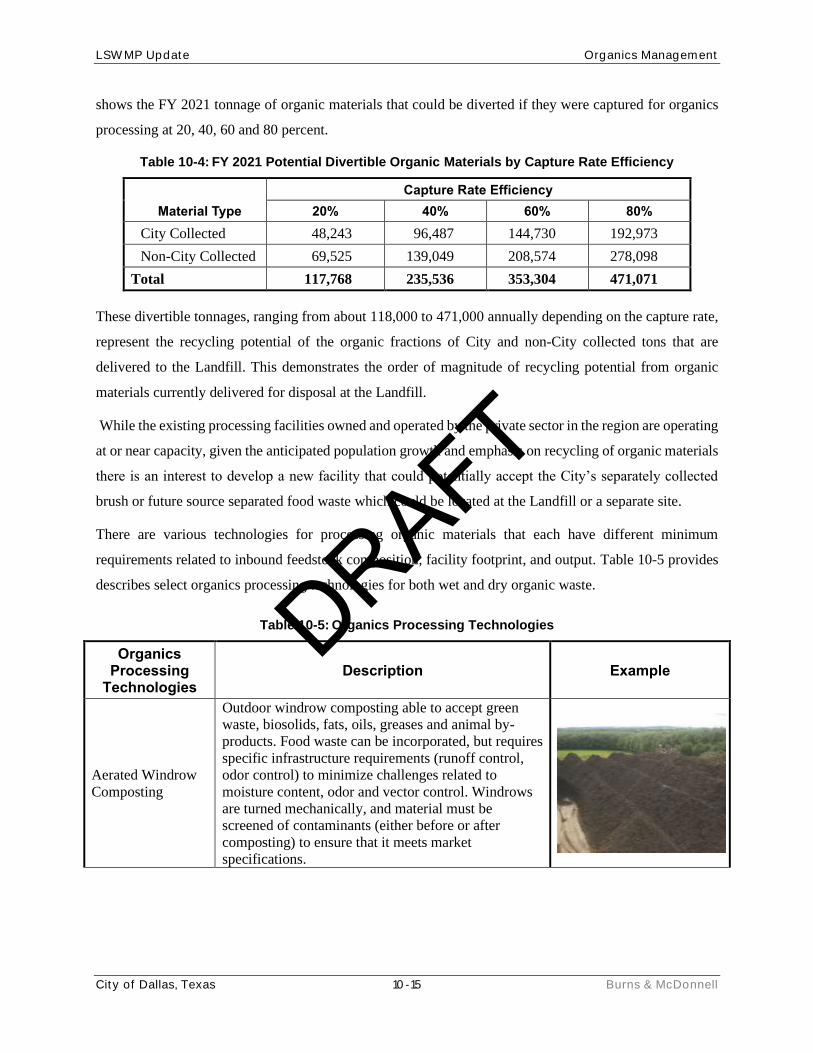
LSWMP Update Organics Management
City of Dallas, Texas 10-15 Burns & McDonnell
shows the FY 2021 tonnage of organic materials that could be diverted if they were captured for organics
processing at 20, 40, 60 and 80 percent.
Table 10-4: FY 2021 Potential Divertible Organic Materials by Capture Rate Efficiency
Material Type
Capture Rate Efficiency
20% 40% 60% 80%
City Collected 48,243 96,487 144,730 192,973
Non-City Collected 69,525 139,049 208,574 278,098
Total 117,768 235,536 353,304 471,071
These divertible tonnages, ranging from about 118,000 to 471,000 annually depending on the capture rate,
represent the recycling potential of the organic fractions of City and non-City collected tons that are
delivered to the Landfill. This demonstrates the order of magnitude of recycling potential from organic
materials currently delivered for disposal at the Landfill.
While the existing processing facilities owned and operated by the private sector in the region are operating
at or near capacity, given the anticipated population growth and emphasis on recycling of organic materials
there is an interest to develop a new facility that could potentially accept the City’s separately collected
brush or future source separated food waste which could be located at the Landfill or a separate site.
There are various technologies for processing organic materials that each have different minimum
requirements related to inbound feedstock composition, facility footprint, and output. Table 10-5 provides
describes select organics processing technologies for both wet and dry organic waste.
Table 10-5: Organics Processing Technologies
Organics Processing
Technologies Description Example
Aerated Windrow
Composting
Outdoor windrow composting able to accept green
waste, biosolids, fats, oils, greases and animal by-
products. Food waste can be incorporated, but requires
specific infrastructure requirements (runoff control,
odor control) to minimize challenges related to
moisture content, odor and vector control. Windrows
are turned mechanically, and material must be
screened of contaminants (either before or after
composting) to ensure that it meets market
specifications.
DRAFT
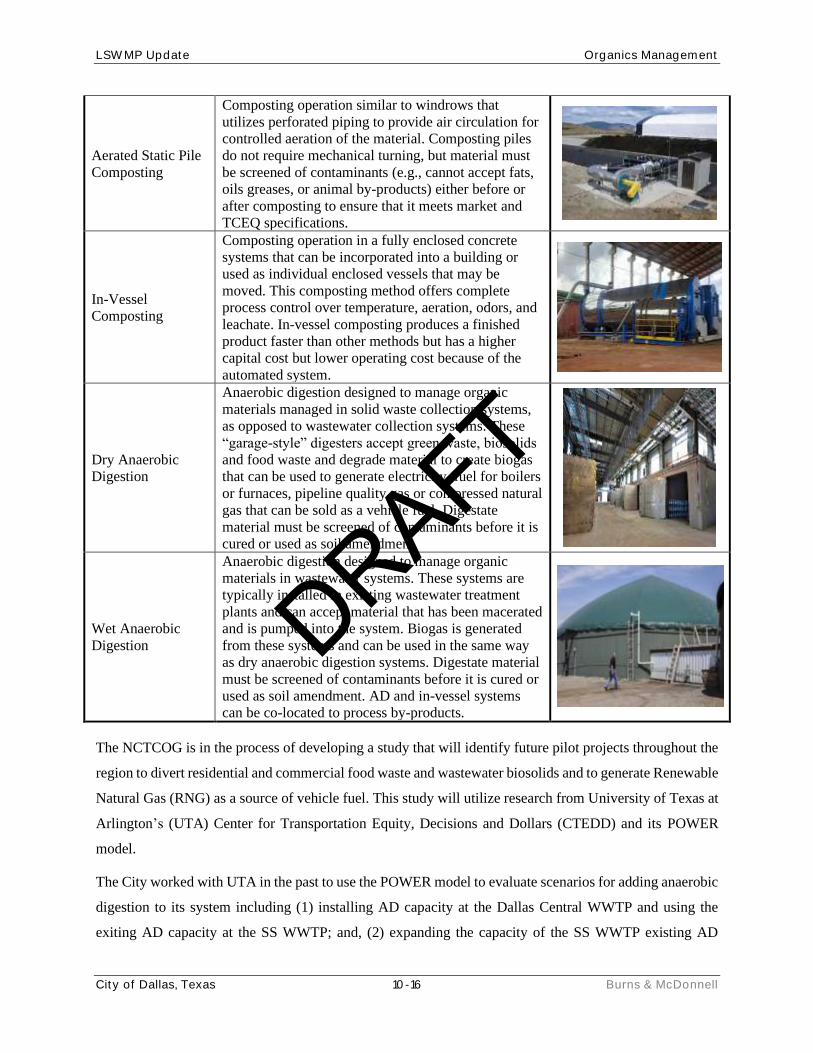
LSWMP Update Organics Management
City of Dallas, Texas 10-16 Burns & McDonnell
Aerated Static Pile
Composting
Composting operation similar to windrows that
utilizes perforated piping to provide air circulation for
controlled aeration of the material. Composting piles
do not require mechanical turning, but material must
be screened of contaminants (e.g., cannot accept fats,
oils greases, or animal by-products) either before or
after composting to ensure that it meets market and
TCEQ specifications.
In-Vessel
Composting
Composting operation in a fully enclosed concrete
systems that can be incorporated into a building or
used as individual enclosed vessels that may be
moved. This composting method offers complete
process control over temperature, aeration, odors, and
leachate. In-vessel composting produces a finished
product faster than other methods but has a higher
capital cost but lower operating cost because of the
automated system.
Dry Anaerobic
Digestion
Anaerobic digestion designed to manage organic
materials managed in solid waste collection systems,
as opposed to wastewater collection systems. These
“garage-style” digesters accept green waste, biosolids
and food waste and degrade material to create biogas
that can be used to generate electricity, fuel for boilers
or furnaces, pipeline quality gas or compressed natural
gas that can be sold as a vehicle fuel. Digestate
material must be screened of contaminants before it is
cured or used as soil amendment.
Wet Anaerobic
Digestion
Anaerobic digestion designed to manage organic
materials in wastewater systems. These systems are
typically installed in existing wastewater treatment
plants and can accept material that has been macerated
and is pumped into the system. Biogas is generated
from these systems and can be used in the same way
as dry anaerobic digestion systems. Digestate material
must be screened of contaminants before it is cured or
used as soil amendment. AD and in-vessel systems
can be co-located to process by-products.
The NCTCOG is in the process of developing a study that will identify future pilot projects throughout the
region to divert residential and commercial food waste and wastewater biosolids and to generate Renewable
Natural Gas (RNG) as a source of vehicle fuel. This study will utilize research from University of Texas at
Arlington’s (UTA) Center for Transportation Equity, Decisions and Dollars (CTEDD) and its POWER
model.
The City worked with UTA in the past to use the POWER model to evaluate scenarios for adding anaerobic
digestion to its system including (1) installing AD capacity at the Dallas Central WWTP and using the
exiting AD capacity at the SS WWTP; and, (2) expanding the capacity of the SS WWTP existing AD
DRAFT
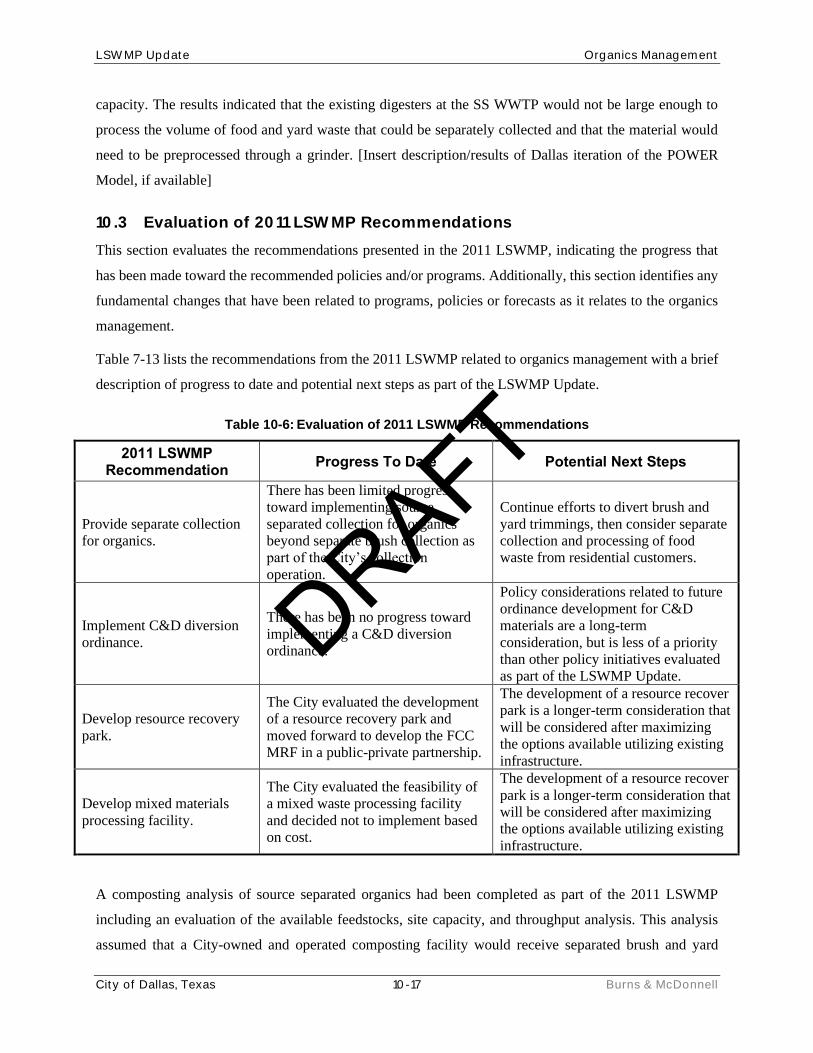
LSWMP Update Organics Management
City of Dallas, Texas 10-17 Burns & McDonnell
capacity. The results indicated that the existing digesters at the SS WWTP would not be large enough to
process the volume of food and yard waste that could be separately collected and that the material would
need to be preprocessed through a grinder. [Insert description/results of Dallas iteration of the POWER
Model, if available]
10.3 Evaluation of 2011 LSWMP Recommendations
This section evaluates the recommendations presented in the 2011 LSWMP, indicating the progress that
has been made toward the recommended policies and/or programs. Additionally, this section identifies any
fundamental changes that have been related to programs, policies or forecasts as it relates to the organics
management.
Table 7-13 lists the recommendations from the 2011 LSWMP related to organics management with a brief
description of progress to date and potential next steps as part of the LSWMP Update.
Table 10-6: Evaluation of 2011 LSWMP Recommendations
2011 LSWMP Recommendation
Progress To Date Potential Next Steps
Provide separate collection
for organics.
There has been limited progress
toward implementing source
separated collection for organics
beyond separate brush collection as
part of the City’s collection
operation.
Continue efforts to divert brush and
yard trimmings, then consider separate
collection and processing of food
waste from residential customers.
Implement C&D diversion
ordinance.
There has been no progress toward
implementing a C&D diversion
ordinance.
Policy considerations related to future
ordinance development for C&D
materials are a long-term
consideration, but is less of a priority
than other policy initiatives evaluated
as part of the LSWMP Update.
Develop resource recovery
park.
The City evaluated the development
of a resource recovery park and
moved forward to develop the FCC
MRF in a public-private partnership.
The development of a resource recover
park is a longer-term consideration that
will be considered after maximizing
the options available utilizing existing
infrastructure.
Develop mixed materials
processing facility.
The City evaluated the feasibility of
a mixed waste processing facility
and decided not to implement based
on cost.
The development of a resource recover
park is a longer-term consideration that
will be considered after maximizing
the options available utilizing existing
infrastructure.
A composting analysis of source separated organics had been completed as part of the 2011 LSWMP
including an evaluation of the available feedstocks, site capacity, and throughput analysis. This analysis
assumed that a City-owned and operated composting facility would receive separated brush and yard
DRAFT
LSWMP Update Organics Management
City of Dallas, Texas 10-18 Burns & McDonnell
trimmings from residents, brush and yard trimmings from private haulers and biosolids generated by DWU
totaling about 82,500 tons per year (or 372,000 CY per year).
The site of this facility was planned to be on cells 8 through 14 within the disposal footprint of the Landfill,
totaling about 100 acres. A total of 58 acres would be used to locate 240 windrow piles that and the rest of
the land would be developed into the requisite infrastructure (e.g., scale, entrance/egress roads, etc.). The
2011 LSWMP notes that not all of the 100 acres would be viable for a composting facility because it is
prone to flooding.
Based on the throughput analysis, this sized facility would be able to process the inbound material in three
to six months. Although the brush, wood, yard trimmings and biosolid inputs would have a high carbon to
nitrogen ratio, the facility would be viable and would produce about 185,000 CY of compost product per
year. If higher nitrogen feedstocks were added (e.g., food waste), the facility could produce up to 250,000
CY of product per year.
While the technical components of this analysis still hold true, utilizing cells 8 through 14 of the disposal
area of the Landfill would not be feasible because those cells are required to manage the expected future
inbound disposal tonnages. Additionally, the analysis assumed that a separate brush and bulky item
collection program would be in place and while the City is working to establish this program, it is not
currently in place. Further discussion related to separate brush and bulky item collection is provided in
Section 7.0.
Another assumption of the analysis was that material would be able to be transferred and direct hauled to a
future composting site; however, the transfer station system is not able to store or process organic material
outside and has limited space in the transfer buildings to receive separated brush or other organics. In the
past, semi-clean loads of separated brush had been stored outside but this could not continue on a consistent
basis unless the material were stored under cover, on top of a pad, and the sites were configured to manage
runoff from the material. Further discussion about the capability of the transfer station system to manage
organic materials is provided in Section 5.0.
10.4 Case Studies
This section provides overviews of practices that have been incorporated by municipalities in the region
and nationally related to organics management for the City’s consideration and to inform the options
evaluation that follows. The case studies are presented by topic and organized as follows:
• Source reduction initiatives
• Organics collection and processing
• Organics disposal bans
DRAFT
LSWMP Update Organics Management
City of Dallas, Texas 10-19 Burns & McDonnell
10.4.1 Source Reduction Initiatives
Source reduction initiatives the most effective approach to diverting material from disposal and minimizing
the resources required to manage material. The Natural Resources Defense Council (NRDC) developed a
campaign to raise awareness about the economic and environmental impacts of wasted food and encourage
Americans to take easy and actionable steps to reduce food waste in their homes. The Save the Food
campaign provides all materials for free on their website to partnering organizations and has distributed a
series of public service announcements and other tips and tools to help consumers take action. More
information related to the Save the Food campaign can be found at www.savethefood.com, where visitors
can learn how to better plan, store, and cook their food.
There are several resources additional available in the region including the following:
• The U. S. EPA has several great resources available to share with businesses including a food waste
audit tool, safety regulations and guidance for food donations, and a legal guide for feeding animals
leftover food81.
• FoodSource DFW is a nonprofit organization that strives to reduce waste and distribute food and
resources to people and families in need82.
• Melissa Feeders is a family-owned company specializing in all areas of the beef and dairy beef
industries that uses food waste for animal feed83.
Another key initiative related to source reduction is backyard composting so that organic materials are not
disposed in the waste stream. Since 2010, Johnson County, Kansas has supported a backyard composting
program for residents. For the first three years, the program included selling heavily discounted compost
bins. The program also includes hosting educational classes and attending community events. The Johnson
County partners with their local extension office through Kansas State University to develop backyard
composting guidance and provide education and outreach to the community. The backyard composting
program won an award from the local regional planning agency for the significant number of individual
participants it has reached with its message through classes, events, and compost bin sales. Additionally,
the effort to promote backyard composting supports the yard waste disposal ban in place in Johnson County.
81 https://www.epa.gov/sustainable-management-food/tools-preventing-and-diverting-wasted-food 82 https://www.foodsourcedfw.org/ 83 http://www.melissafeeders.com/environmentalstewardship/valueaddedfeeds.html
DRAFT
LSWMP Update Organics Management
City of Dallas, Texas 10-20 Burns & McDonnell
10.4.2 Organics Collection and Processing
The ongoing NCTCOG Know What to Throw campaign to increase recycling and decrease contamination
in the region has been active for about two years. The NCTCOG is considering how to build on this effort
to support municipalities to increase the amount of organics that are diverted from landfill in the region.
Several peer cities separately collect and compost yard waste material including Fort Worth, Plano,
McKinney and Frisco. This material is processed among the available processing facilities in the region
including at the 121 Landfill where it is sold as Texas Pure Products compost and at Fort Worth’s Southeast
Landfill where Living Earth processes the material where it is sold or provided back to the City on a
discounted basis. A key challenge with these processing facilities is that they are operating near capacity
and are not designed to take wet organics (e.g., food waste). Additionally, the area of the Southeast Landfill
where Living Earth processes yard trimmings is in the disposal footprint of the facility and will eventually
need to be moved when that area becomes an active disposal cell.
Other cities in Texas collect and process food waste from residential customers including the cities of Austin
and San Antonio. Austin implemented curbside composting collection of food scraps, yard trimmings, food-
soiled paper, and natural fibers from single-family residential customers in phases over four years. The final
expansion of the program was recently completed, and all customers have been provided 48-gallon organics
collection roll carts for collection on a weekly basis and is a key part of Austin’s pay-as-you-throw system,
where customers can separate organics for collection and downsize the size of their refuse roll cart. Organics
collected are delivered to the Hornsby Bend facility for processing into compost product.
San Antonio has a comprehensive curbside collection organics program. Residents are provided a green
cart (96- or 48-gallon) for items that can be composted into nutrient-rich material that is made available
back to the community. San Antonio accepts all food waste (pre- and post-consumer), non-recyclable paper,
and yard waste in their collection cart for composting. Materials may be either loose or placed in paper bags
in the cart. When unaccepted items (contamination) are in the green cart, the material is landfilled and
customers incur a fee. Fees are collected through the resident’s utility bill and most violation fees are $25-
50. In 2020, participation in this program helped divert 70,000 tons of material from the landfill where it is
composted by Atlas Organics, San Antonio’s contracted processing facility operator.
There are also efforts to divert organic materials from commercial sector generators by processing material
at wastewater treatment plants with anaerobic digestion technology and available capacity. The business
unit of Insinkerator called Grind2Energy develops programs to service commercial customers that generate
high quantities of food waste. The Grind2Energy program installs commercial-grade macerator equipment
and holding tanks on site where food waste is mechanically processed and stored. Then, vacuum trucks are
deployed to service the holding tanks and are delivered to local wastewater treatment facilities with
DRAFT
LSWMP Update Organics Management
City of Dallas, Texas 10-21 Burns & McDonnell
anaerobic digestion processing capacity. Insinkerator has developed and deployed these programs for many
institutional and commercial customers in the northeastern and midwest regions of the U.S. such as Notre
Dame College, Emory College, University of Illinois, Ohio State University, Whole Foods grocery, J.D.
Smuckers, AT&T and the Omni Hotel Group.
10.4.3 Organics Disposal Bans
Increasing recycling of organic material types by banning disposal is a policy/regulatory approach that has
been proven to increase recycling. Arlington, TX implemented a yard waste disposal ban in 1993 as a
program that is not included in its municipal code. The City’s program, also known as “Don’t Bag It,”
encourages households to leave grass clippings on the lawn and prohibits grass disposal with refuse. Grass
clippings mixed with household waste are not collected. The City educates residents on the natural benefits
that grass clippings can have on their lawn and how to set up backyard composting systems.
In 2014, the state of Massachusetts passed a state-wide ban to reduce the disposal of commercial organic
waste. The law requires any business or institution which disposes of one ton or more of food waste per
week to divert it through donations, feeding animals, composting, or anaerobic digestion. A total of 1,700
businesses and institutions were impacted by the ban. Two years after the implementation of the law, the
total reported recycling of food waste was 260,000 tons. In 2017 the Massachusetts Department of
Environmental Protection released an economic impact analysis on the commercial food waste ban which
found that in two years the commercial food waste ban created more than 900 new jobs, and $175 million
in economic activity resulting from more composting facilities, food rescue organizations, and waste
haulers to keep up with demand84. Based on the success of the law, the state is lowering the threshold of
the ban so that it applies to businesses and institutions generating one-half ton or more food waste per week,
effective November 1, 2022.
Despite the success of the disposal ban, there have also been some unintended consequences through
increased nutrient pollution from composting facilities. Some facilities are discharging nutrient rich
leachate into local waterways, causing water quality impairments in local communities. Leachate samples
collected from one composting facility showed very high total nitrogen concentrations85. This highlights
the need for clear standards and oversight on composting facilities to protect water quality and conservation
efforts.
84 “Massachusetts Commercial Food Waste Ban Economic Analysis.” ICF. 11/14/2016.
https://www.mass.gov/files/documents/2016/11/vz/icfrep.pdf 85 More information on the State of Massachusetts’ organics disposal ban is provided at the following hyperlink:
https://www.epa.gov/snep/composting-food-waste-keeping-good-thing-going
DRAFT

LSWMP Update Organics Management
City of Dallas, Texas 10-22 Burns & McDonnell
Recently, several laws and ordinances have gone into effect to divert food waste and other organics from
landfill. The most notable is California’s SB 1383 law, which requires that 75 percent of all organic waste
streams be diverted from the landfill by 2025. Also, in effect as of January 1 are New York State’s Food
Donation and Food Scraps Recycling Act and Hennepin County, Minnesota’s food waste recycling
ordinance86.
The New York State law requires businesses and institutions that generate an annual average of two tons
of wasted food per week or more to donate excess edible food, and recycle all remaining food scraps if they
are within 25 miles of an organics recycler (composting facility, anaerobic digester, etc.). In Hennepin
County, all cities are required to make curbside organics recycling service available to all households,
through Ordinance 13. Cities with 10,000 residents or less will be given the additional option to meet the
ordinance requirement through a drop-off location(s).
10.5 Options Evaluation
This section analyzes a series of options related to organics management that have been identified based on
analysis of recycling potential from these sectors, stakeholder engagement, evaluation of recommendations
from the 2011 LSWMP, and case studies.
The following summarizes the key takeaways from the community survey and other outreach activities
conducted as part of the LSWMP Update. Further information about the methodology of the stakeholder
engagement is described in Section 1.0 and the comprehensive detailed results are provided in Appendix
A.
• 35 percent of respondents indicated that they currently separate organics from their garbage to
divert the material from disposal through methods such as backyard composting, subscription
services for food scraps collection or drop off at local farmers markets.
• If the City were to develop a separate organics collection program, 53 percent of respondents
indicated they would support separate yard trimmings collection in a City-provided cart and 45
percent indicated they would support comingled food and yard waste collection in a City-provided
cart.
• 45 percent of respondents indicated they would participate in a comingled food and yard waste
collection program, but about the same percentage of respondents indicated they would need more
information about the program before they would participate. About 70 percent of respondents
86 “Organics Recycling Truisms.” Biocycle Magazine. 1/25/22. https://www.biocycle.net/organics-recycling-
truisms/
DRAFT
LSWMP Update Organics Management
City of Dallas, Texas 10-23 Burns & McDonnell
indicated they would support a monthly rate increase of at least $1.00 for the City to establish an
organics recycling program.
The following presents options that are evaluated in the following sections including a brief description of
the option and evaluation approach:
• Expand source reduction efforts. Presents options to expand the source reduction efforts by
emphasizing the backyard composting and other existing food donation programs and leveraging
NCTCOG resources to increase the reduction of organic wastes.
• Increase organics processing capacity across operations. Evaluates the requirements and
impacts to increase organics processing capacity across the City’s existing infrastructure and
operations.
• Leverage public-private partnership for third-party composting. Describes the opportunity and
impacts to establish a public-private partnership with a third-party organics processing operator
and/or facility.
Each of the following sections provide an overview of each option and specific tactics and evaluates the
impact of each options’ components based on the criteria detailed in Section 1.4.3. A high-level summary
of the evaluation criteria for each tactic within the options is provided in Section 10.6 to support the key
findings, recommendations and implementation and funding plan.
10.5.1 Expand Source Reduction Efforts
Overview. As part of this option, the City would increase the promotion of source reduction of food waste
and yard trimmings by increasing awareness and understanding of existing programs that customers can
participate in and offer technical assistance to expand promotion of these programs. Promoting source
reduction of yard waste includes encouraging residents to mulch grass clippings and leaves and leveraging
existing Code Compliance Department inspections to evaluate commercial food service purchasing
practices and collect data related to organic material generation. There are organizations promoting
backyard composting that the City can leverage as resources to increase the promotion of this source
reduction technique including the State of Texas Alliance for Recycling (STAR), which serves as the
statewide administrator for the Texas-based Master Composter programs and can provide resources and
technical assistance to communities hosting Master Composter training events. Texas A&M AgriLife
Extension also provides research-based information and educational materials as well as classes on
backyard composting. The City could also promote resources for food donation such as programs developed
by North Texas Food Bank.
DRAFT
LSWMP Update Organics Management
City of Dallas, Texas 10-24 Burns & McDonnell
Recycling potential. Reduction of organic material minimizes the amount of organic material that enters
the waste stream and allows processing facilities in the region to accept more organic materials, providing
the capacity to divert more organic materials from disposal.
Operational impact. Since the City is already resource constrained with its existing programs, emphasizing
backyard composting and leveraging existing Code Compliance Department inspections or technical
assistance programs will minimize the resources required to introduce new organics recycling or data
collection programming in the future resulting in a low operational impact.
Financial impact. Increasing the promotion of existing programs and leveraging technical assistance
opportunities would have minimal financial impact to the City.
Environmental impact. Reducing the generation of organic material for disposal or processing has the
greatest environmental impact, because it minimizes the resources required to manage, collect, process
and/or dispose organic materials. This results in a significant reduction in vehicle emissions and/or point
source emissions from composting operations, eliminates methane emissions if the material were landfilled
and therefore has a low environmental impact.
Policy impact. There is minimal policy impact to leverage the existing programs to encourage more
backyard composting and food donation. Code Compliance Department inspections may need to adjust
their data collection procedures.
Stakeholder “buy-in”. There is a high level of stakeholder “buy-in” related to this option, where residents
and commercial entities support minimizing food waste and donating materials.
Compatibility with existing programs. This option is highly compatible with existing programs including
ongoing education and outreach efforts and Code Compliance Department inspections.
10.5.2 Increase Organics Processing Capacity Across Operations
Overview. As part of this option, the City would increase the capacity to receive and process organic
materials such as yard trimmings, brush and food waste among the transfer station system, wastewater
treatment plants and Landfill. Currently the transfer station system is not able to separately manage organic
materials because of a lack of space in the transfer buildings and inability to store organic materials outside
without developing a dedicated cover or pad. While the SS WWTP plant has capacity and ability to process
organic materials through its anaerobic digestion system (reference Section 4.1.4.2), the facility is not
designed to accept material from solid waste collection vehicles and food waste must be ground to a slurry
DRAFT
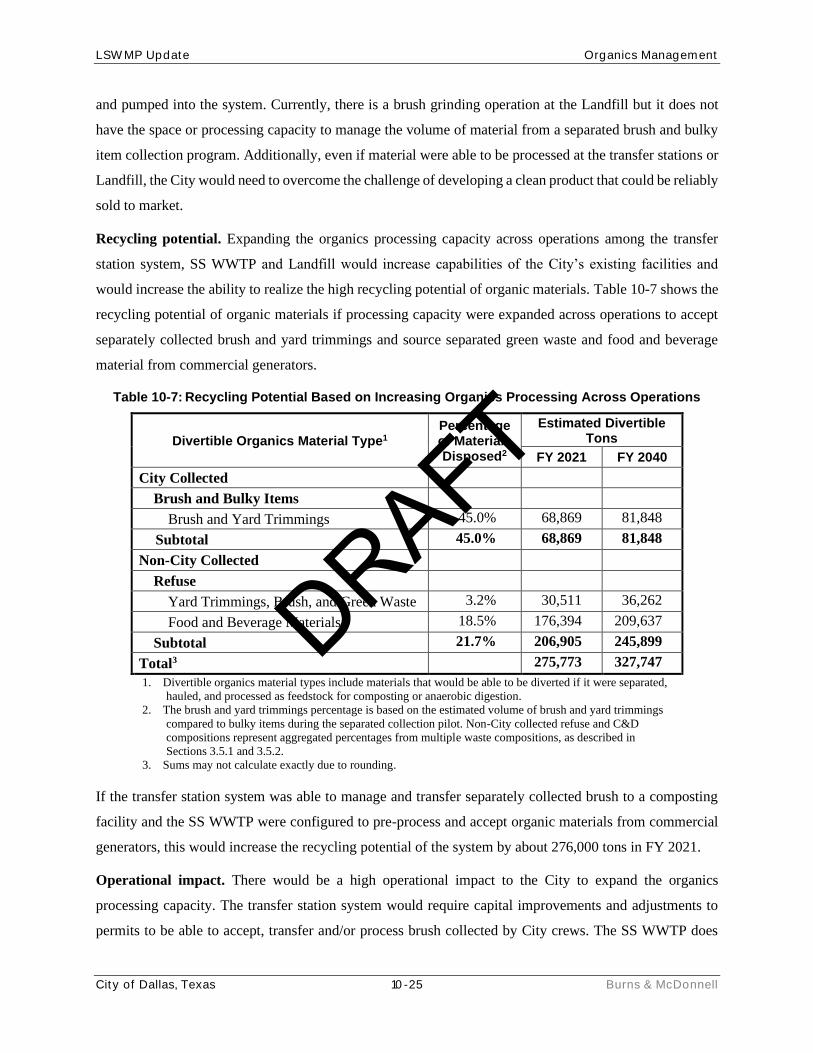
LSWMP Update Organics Management
City of Dallas, Texas 10-25 Burns & McDonnell
and pumped into the system. Currently, there is a brush grinding operation at the Landfill but it does not
have the space or processing capacity to manage the volume of material from a separated brush and bulky
item collection program. Additionally, even if material were able to be processed at the transfer stations or
Landfill, the City would need to overcome the challenge of developing a clean product that could be reliably
sold to market.
Recycling potential. Expanding the organics processing capacity across operations among the transfer
station system, SS WWTP and Landfill would increase capabilities of the City’s existing facilities and
would increase the ability to realize the high recycling potential of organic materials. Table 10-7 shows the
recycling potential of organic materials if processing capacity were expanded across operations to accept
separately collected brush and yard trimmings and source separated green waste and food and beverage
material from commercial generators.
Table 10-7: Recycling Potential Based on Increasing Organics Processing Across Operations
Divertible Organics Material Type1 Percentage of Materials Disposed2
Estimated Divertible Tons
FY 2021 FY 2040
City Collected
Brush and Bulky Items
Brush and Yard Trimmings 45.0% 68,869 81,848
Subtotal 45.0% 68,869 81,848
Non-City Collected
Refuse
Yard Trimmings, Brush, and Green Waste 3.2% 30,511 36,262
Food and Beverage Materials 18.5% 176,394 209,637
Subtotal 21.7% 206,905 245,899
Total3
275,773 327,747
1. Divertible organics material types include materials that would be able to be diverted if it were separated,
hauled, and processed as feedstock for composting or anaerobic digestion.
2. The brush and yard trimmings percentage is based on the estimated volume of brush and yard trimmings
compared to bulky items during the separated collection pilot. Non-City collected refuse and C&D
compositions represent aggregated percentages from multiple waste compositions, as described in
Sections 3.5.1 and 3.5.2.
3. Sums may not calculate exactly due to rounding.
If the transfer station system was able to manage and transfer separately collected brush to a composting
facility and the SS WWTP were configured to pre-process and accept organic materials from commercial
generators, this would increase the recycling potential of the system by about 276,000 tons in FY 2021.
Operational impact. There would be a high operational impact to the City to expand the organics
processing capacity. The transfer station system would require capital improvements and adjustments to
permits to be able to accept, transfer and/or process brush collected by City crews. The SS WWTP does
DRAFT
LSWMP Update Organics Management
City of Dallas, Texas 10-26 Burns & McDonnell
have additional capacity to accept material, but the infrastructure is not designed to accept material
delivered by solid waste collection vehicles; therefore, there would need to be capital upgrades to the site
to develop the roadways so vehicles hauling organic materials could enter and staff would need to direct
them to locations that are developed to either deposit material for preprocessing on site, or pump slurry that
has been preprocessed off-site into the anaerobic digestion system. At the Landfill, space would need to be
dedicated to receive loads of clean brush material from transfer trailers, Sanitation Department vehicles,
and third-party haulers. Additionally, staff would need to be hired and equipment purchased to manage
inbound organic materials and packaging or transporting finished product to market.
Financial impact. There would be a high financial impact to increase the capacity of organics across the
operations given the capital cost requirements to establish or upgrade the transportation and processing
infrastructure at among the transfer station system, SS WWTP and Landfill.
Environmental impact. If the City expands the organics processing capacity there would be significant
potential to increase recycling there would be a low environmental impact. Since this organic material is
currently hauled for disposal, the adjustment in hauling requirement would have negligible environmental
impact and be significantly outweighed by the positive impact of diverting the organic materials from
disposal.
Policy impact. There would be moderate policy impact related to accepting organics for processing at the
transfer station system and SS WWTP, and low policy impact related to accepting organics at the Landfill.
Currently the City is not able to store brush material among the transfer station system and would need to
amend its permit to expand its operations. Additionally, the City does not accept organic materials from the
solid waste stream at the SS WWTP.
Stakeholder “buy-in”. There is a mixed level of stakeholder “buy-in” related to this option because
although it would support increasing recycling, the capital and operational requirements to upgrade the
transfer station system and SS WWTP may interrupt existing operations, causing challenges to manage the
current stream of materials.
Compatibility with existing programs. At the transfer station and SS WWTP there is low compatibility
with existing infrastructure, operations and programs. Conversely, at the Landfill there is already a brush
grinding operation that could be leveraged to phase in a more robust composting operation.
10.5.3 Leverage Public-Private Partnership for Third-Party Composting
Overview. As part of this option, the City would contract with a third-party composting operator to accept
separately collected brush and yard trimmings. Entering into a public-private partnership could take the
form of hauling and transferring material to an existing composting facility in the area, or working with a
DRAFT
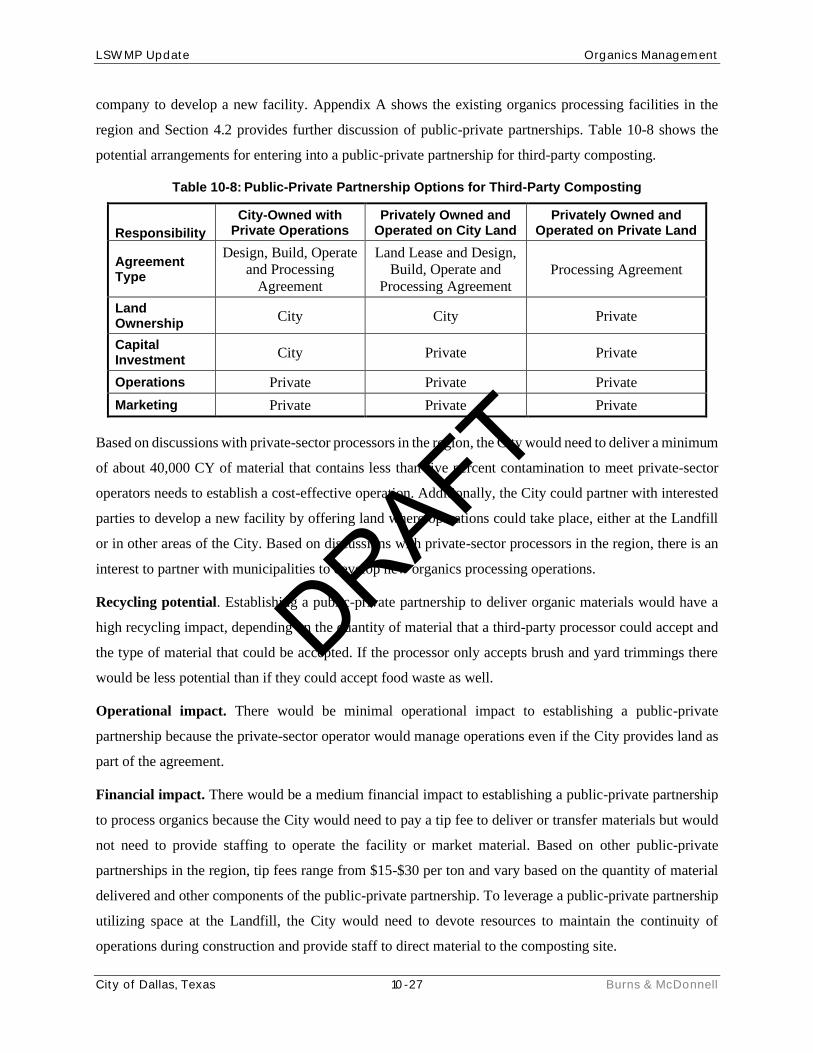
LSWMP Update Organics Management
City of Dallas, Texas 10-27 Burns & McDonnell
company to develop a new facility. Appendix A shows the existing organics processing facilities in the
region and Section 4.2 provides further discussion of public-private partnerships. Table 10-8 shows the
potential arrangements for entering into a public-private partnership for third-party composting.
Table 10-8: Public-Private Partnership Options for Third-Party Composting
Responsibility
City-Owned with Private Operations
Privately Owned and Operated on City Land
Privately Owned and Operated on Private Land
Agreement Type
Design, Build, Operate
and Processing
Agreement
Land Lease and Design,
Build, Operate and
Processing Agreement
Processing Agreement
Land Ownership
City City Private
Capital Investment
City Private Private
Operations Private Private Private
Marketing Private Private Private
Based on discussions with private-sector processors in the region, the City would need to deliver a minimum
of about 40,000 CY of material that contains less than five percent contamination to meet private-sector
operators needs to establish a cost-effective operation. Additionally, the City could partner with interested
parties to develop a new facility by offering land where operations could take place, either at the Landfill
or in other areas of the City. Based on discussions with private-sector processors in the region, there is an
interest to partner with municipalities to develop new organics processing operations.
Recycling potential. Establishing a public-private partnership to deliver organic materials would have a
high recycling impact, depending on the quantity of material that a third-party processor could accept and
the type of material that could be accepted. If the processor only accepts brush and yard trimmings there
would be less potential than if they could accept food waste as well.
Operational impact. There would be minimal operational impact to establishing a public-private
partnership because the private-sector operator would manage operations even if the City provides land as
part of the agreement.
Financial impact. There would be a medium financial impact to establishing a public-private partnership
to process organics because the City would need to pay a tip fee to deliver or transfer materials but would
not need to provide staffing to operate the facility or market material. Based on other public-private
partnerships in the region, tip fees range from $15-$30 per ton and vary based on the quantity of material
delivered and other components of the public-private partnership. To leverage a public-private partnership
utilizing space at the Landfill, the City would need to devote resources to maintain the continuity of
operations during construction and provide staff to direct material to the composting site.
DRAFT
LSWMP Update Organics Management
City of Dallas, Texas 10-28 Burns & McDonnell
Environmental impact. There would be low environmental impact to establishing a public-private
partnership for third-party composting, since that material would be diverted from disposal. Since this
material is currently hauled for disposal, the adjustment in hauling requirement would have negligible
environmental impact and be significantly outweighed by the positive impact of diverting the organic
materials from disposal.
Policy impact. There would be no policy impacts to entering into a public-private partnership for third-
party composting services.
Stakeholder “buy-in”. There would be moderate stakeholder “buy-in” because even though there would
be increased recycling, if a facility is established on another site besides the Landfill, there may be backlash
from the surrounding community that is opposed to the development of a composting facility near them.
Compatibility with existing programs. There is moderate compatibility with existing programs because
currently brush material is not separately collected, but there is a brush processing operation active at the
Landfill. The City would need to separately collect brush to effectively engage in a public-private
partnership, but could also leverage the existing brush processing operation to expand it into a more robust
composting facility.
10.6 Key Findings and Recommendations
This section presents the key findings and recommendations related to program and policy approaches to
increasing recycling of organic materials based on the results of the overview, evaluation of case studies
and stakeholder engagement. Depending on the specific option and/or tactic, the evaluation may include
both quantitative and qualities assessments which support the assigned relative ratings for the criteria of
each tactic. The meaning of the rating differs for each option and/or tactic but can generally be described
as “green circle is favorable or low impact,” “yellow triangle is neutral or medium impact,” and “red square
is less favorable or higher impact.” Further description of the criteria is provided in Section 1.4.3. Table
10-9 summarizes the results of the options evaluation for each of the tactics presented.
DRAFT
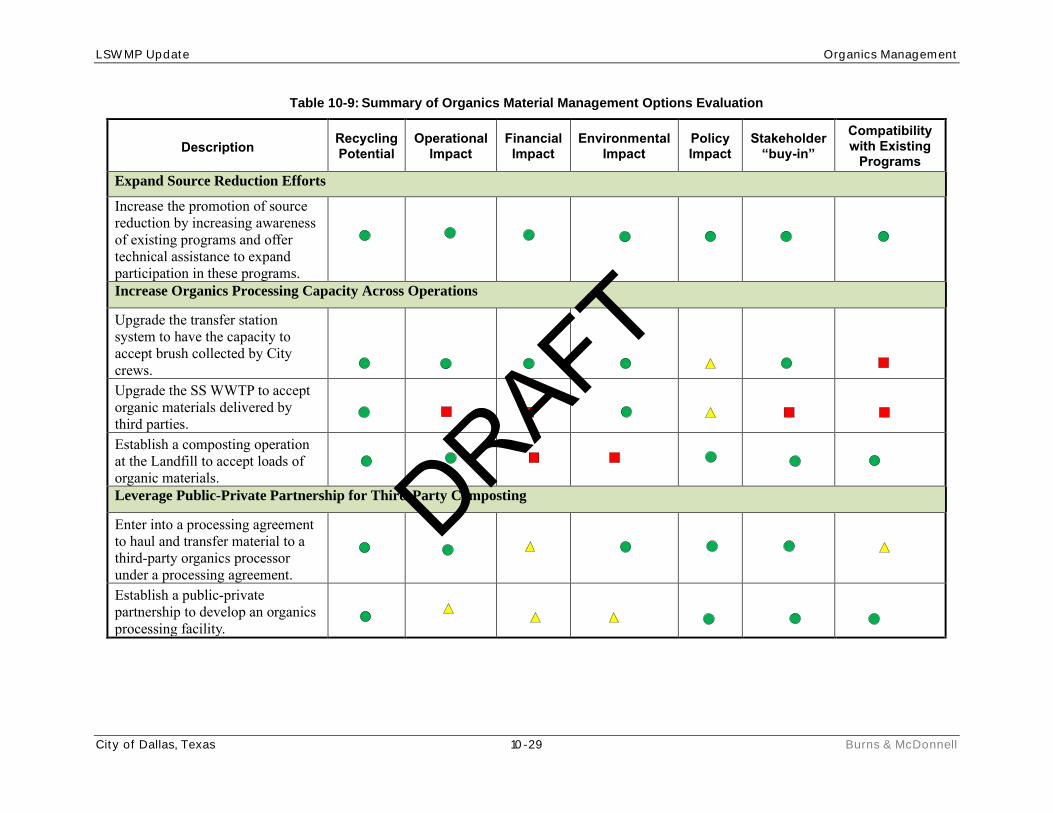
LSWMP Update Organics Management
City of Dallas, Texas 10-29 Burns & McDonnell
Table 10-9: Summary of Organics Material Management Options Evaluation
Description Recycling Potential
Operational Impact
Financial Impact
Environmental Impact
Policy Impact
Stakeholder “buy-in”
Compatibility with Existing
Programs
Expand Source Reduction Efforts
Increase the promotion of source
reduction by increasing awareness
of existing programs and offer
technical assistance to expand
participation in these programs.
Increase Organics Processing Capacity Across Operations
Upgrade the transfer station
system to have the capacity to
accept brush collected by City
crews.
Upgrade the SS WWTP to accept
organic materials delivered by
third parties.
Establish a composting operation
at the Landfill to accept loads of
organic materials.
Leverage Public-Private Partnership for Third-Party Composting
Enter into a processing agreement
to haul and transfer material to a
third-party organics processor
under a processing agreement.
Establish a public-private
partnership to develop an organics
processing facility.
DRAFT
LSWMP Update Organics Management
City of Dallas, Texas 10-1 Burns & McDonnell
10.6.1 Key Findings
Each of the following key findings supports the corresponding recommendation in the subsequent section.
2. Source reduction and food donation are most important efforts to minimize impacts of
organic waste. The U. S. EPA Food Recovery Hierarchy (reference Figure 10-1) prioritizes
prevention and recycling of food waste. Source reduction (e.g., smart purchasing), feeding hungry
people (e.g., food donation) and feeding animals, are the highest priorities on the hierarchy and
have the most positive impact on the financial and environmental aspects of organic materials
management.
3. Stakeholders are supportive of the City to developing organics recycling programs. Based on
the results of the survey, respondents support the development of separate collection and process
of organic materials, and are willing to sustain a rate increase of at least $1.00 per household per
month for the increased levels of service and recycling.
4. The City is establishing a pilot program to minimize, collect and process food from
commercial districts. The City is in the process of procuring an organics collection and processing
service to collect organic materials from businesses in a designated district of the City and special
events on a pilot basis. The finished compost product will be used by Dallas County in community
gardens to establish a closed loop system.
5. There is significant recycling potential for organic materials that are currently disposed but
limited third-party processing capacity to effectively divert materials. The tonnage of City and
non-City collected organic material that could potentially be diverted is estimated at about 588,000
tons and is projected to rise to about 670,000 tons by 2040.
6. The City’s existing infrastructure is not equipped to manage and process organic materials.
The tonnage of non-City collected material disposed at the Landfill represents a significant
opportunity to increase recycling, but there is insufficient existing processing infrastructure to
effectively capture and divert this material.
7. Organic material disposal bans are effective policy mechanisms to increasing recycling. As
part of a long-term approach to increasing recycling from disposal, the considering organics
disposal bans would support increasing recycling from disposal; however, this policy approach is
only effective if there is sufficient processing capacity to manage the material prohibited from
disposal. Currently, there is insufficient infrastructure to support such a policy approach.
DRAFT
LSWMP Update Organics Management
City of Dallas, Texas 10-2 Burns & McDonnell
10.6.2 Recommendations
Each of the following recommendations are components of the planning level Implementation & Funding
Plan provided in Appendix F.
8. Emphasize backyard composting, food donation and source reduction programs as part of
future data collection and the development of education and outreach programs. Focusing
education, outreach and program development to expand backyard composting and food donation
is a critical first step to make the most impact related to recycling from landfill while maximizing
existing City resources without requiring hiring more personnel or purchasing more equipment.
9. Pilot windrow composting project outside the permitted disposal areas of the Landfill for
yard trimmings and brush only. As part of the ongoing considerations to adjust the location of
key infrastructure at the Landfill, identify areas that could be used to pilot a windrow composting
operation to gauge the feasibility of transitioning the existing organic material processing operation
at the Landfill to compost rather than just grind brush and yard trimmings for use by other City
departments or Landfill customers.
10. Engage with private-sector processors in the area to identify the feasibility of developing a
public-private partnership. Reach out to composting operators in the region to identify parties
that would be interested in accepting separately collected brush material, developing a new
composting facility in the area or operating a composting facility at the Landfill. If there is interest,
develop and release a Request for Competitive Sealed Proposals (RFCSP) to evaluate opportunities
and identify the best value proposal to determine how the City should move forward to establish
processing capacity for separately collected brush and yard trimming materials.
11. Evaluate the capital cost requirements at the SS WWTP to be able to accept organic
materials. Develop a feasibility study that evaluates the traffic and tonnage flows if the SS WWTP
were to accept material delivered by either vacuum trucks or solid waste collection vehicles. The
feasibility study should assess the capital and infrastructure upgrades required to effectively receive
and manage third-party organic materials.
DRAFT
LSWMP Update Multi-Family and Commercial
City of Dallas, Texas 11-1 Burns & McDonnell
11.0 MULTI-FAMILY AND COMMERCIAL
Solid waste and recycling management planning efforts categorize the commercial sector into two generator
categories – multi-family and commercial. Multi-family properties are occupied by the residential sector;
however, waste from these locations is managed similarly to commercial generators and is often comingled
with commercial material upon collection. Private sector haulers co-mingle material to increase routing
efficiency based on the location of the properties and similar management practices. This section identifies
the significant opportunity for the City to drive diversion of the high volumes of divertible material
generated from multi-family and commercial generators and details the limitations related existing data
reporting and verifications mechanisms. This section presents information and analysis regarding the multi-
family and commercial sector.
11.1 Current System Review
11.1.1 Multi-Family Sector
The multi-family sector consists of apartment complexes with three or more units and over half of the
residential population of the City resides in multi-family properties. Material from the multi-family sector
is not managed the same way as the single-family sector and although a significant amount of refuse,
recycling and bulky items are generated, effectively diverting this material presents significant challenges
due to the transient nature of multi-family tenants and the diversity of property owners and types.
There are about 1,800 multi-family properties with eight or more units and about 205,600 total units within
the City (reference Section 3.1.2) and the current multi-family population of about 698,000 is expected to
increase to about 830,000 by 2040.
Ensuring that multi-family residents have equitable access to recycling services is critical to achieving the
City’s diversion goals; however, material generation and diversion data specific to multi-family dwellings
had been unavailable to the City until the 2020 adoption of the MFRO.
Understanding how much material from multi-family dwellings is currently diverted as a baseline is
essential to setting realistic diversion goals, and the implementation of the MFRO is a key first step to
ensure that as much recyclable material as possible is captured for diversion from multi-family generators.
11.1.2 Multi-Family Recycling Ordinance
As part of the 2011 LSWMP, a key recommendation was to increase access to recycling for multi-family
tenants and City staff began working with stakeholders to advance recycling programs at multi-family
properties and increase availability of recycling to tenants. City staff engaged with several key stakeholders
DRAFT
LSWMP Update Multi-Family and Commercial
City of Dallas, Texas 11-2 Burns & McDonnell
in the development of the MFRO to identify the scope of the policy, including the Apartment Association
of Greater Dallas (AAGD), Hotel Association of North Texas (HANTx), Building Office Managers
Association (BOMA) Dallas, and Texas Campaign for the Environment (TCE).
Based on the reporting of multi-family properties, before MFRO was adopted only 24 percent of properties
had registered online for multi-tenant permits87 indicating that only about a quarter of properties were
providing access to recycling service at that time. Additionally, without policy and programmatic support,
this would likely not change due to several barriers identified by stakeholders including increased cost, lack
of space, and lack of demand from both tenants and property managers. As part of this stakeholder
engagement, City staff also explored the option of a commercial recycling ordinance on a parallel track.
Further discussion of staff’s evaluation and considerations related to a commercial recycling ordinance is
provided in Section 12.2.
City staff compared multi-family recycling ordinances implementation from peer cities in Texas including
Austin, San Antonio and Fort Worth to identify the covered entities, required materials and capacity,
reporting requirements, staffing demand and implementation approaches that would be most effective for
the City. Based on this evaluation the City considered phased approaches, targeting high quantity and value
material types, allowing exemptions under certain conditions, and annual inspections combined with cross-
departmental enforcement support.
The MFRO was ultimately adopted and was implemented on January 1, 2020, covering multi-family
complexes of eight units or more. The ordinance provides the reporting mechanism, so the City has the
capability to increase access to recycling for multi-family tenants. The ordinance requires that multi-family
property managers provide access and contract with private sector haulers to collect and transporting this
material to processing for diversion. The management of the MFRO is a collaborative and cross-
departmental effort supported among the Sanitation Department, OEQS and Code Compliance to leverage
the City’s existing multi-tenant permit and inspection program to effectively enforce and implement the
program88. Specific requirements for multi-family property managers and haulers are outlined in Table
11-1.
87 Any person who owns, operates or controls a multi-tenant property is required to register at least thirty days before expiration
of the prior year’s registration or upon taking ownership or control of the property. Additionally, multi-tenant properties must be
inspected at least once every three years. For detailed information regarding minimum housing standards please refer to Chapter
27 of the Dallas City Code at the following link: https://codelibrary.amlegal.com/codes/dallas/latest/dallas_tx/0-0-0-11034 88 More information about the City’s multi-tenant registration and inspection program, including the VGOV system can be found
at the following link:
https://dallascityhall.com/departments/codecompliance/Admin1/ApplyforaPermit/Pages/Multitenantpermit.aspx
DRAFT
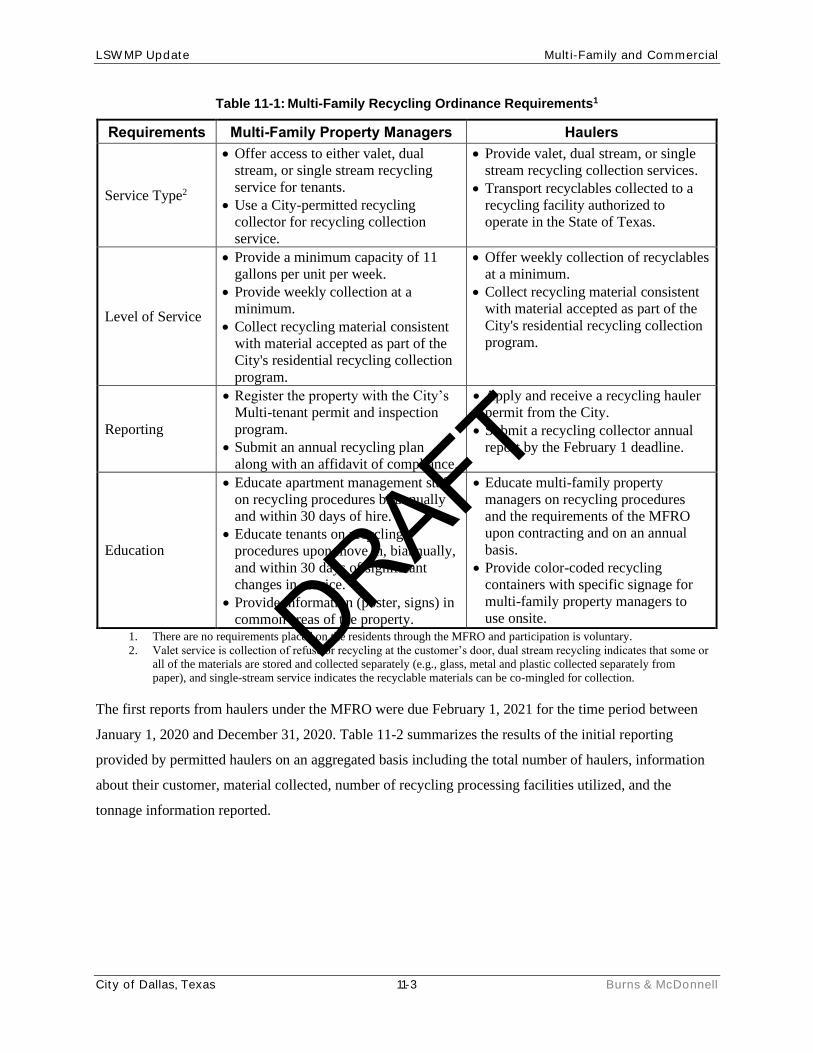
LSWMP Update Multi-Family and Commercial
City of Dallas, Texas 11-3 Burns & McDonnell
Table 11-1: Multi-Family Recycling Ordinance Requirements1
Requirements Multi-Family Property Managers Haulers
Service Type2
• Offer access to either valet, dual
stream, or single stream recycling
service for tenants.
• Use a City-permitted recycling
collector for recycling collection
service.
• Provide valet, dual stream, or single
stream recycling collection services.
• Transport recyclables collected to a
recycling facility authorized to
operate in the State of Texas.
Level of Service
• Provide a minimum capacity of 11
gallons per unit per week.
• Provide weekly collection at a
minimum.
• Collect recycling material consistent
with material accepted as part of the
City's residential recycling collection
program.
• Offer weekly collection of recyclables
at a minimum.
• Collect recycling material consistent
with material accepted as part of the
City's residential recycling collection
program.
Reporting
• Register the property with the City’s
Multi-tenant permit and inspection
program.
• Submit an annual recycling plan
along with an affidavit of compliance.
• Apply and receive a recycling hauler
permit from the City.
• Submit a recycling collector annual
report by the February 1 deadline.
Education
• Educate apartment management staff
on recycling procedures bi-annually
and within 30 days of hire.
• Educate tenants on recycling
procedures upon move in, biannually,
and within 30 days of significant
changes in service.
• Provide information (poster, signs) in
common areas of the property.
• Educate multi-family property
managers on recycling procedures
and the requirements of the MFRO
upon contracting and on an annual
basis.
• Provide color-coded recycling
containers with specific signage for
multi-family property managers to
use onsite.
1. There are no requirements placed on the residents through the MFRO and participation is voluntary.
2. Valet service is collection of refuse or recycling at the customer’s door, dual stream recycling indicates that some or
all of the materials are stored and collected separately (e.g., glass, metal and plastic collected separately from
paper), and single-stream service indicates the recyclable materials can be co-mingled for collection.
The first reports from haulers under the MFRO were due February 1, 2021 for the time period between
January 1, 2020 and December 31, 2020. Table 11-2 summarizes the results of the initial reporting
provided by permitted haulers on an aggregated basis including the total number of haulers, information
about their customer, material collected, number of recycling processing facilities utilized, and the
tonnage information reported.
DRAFT
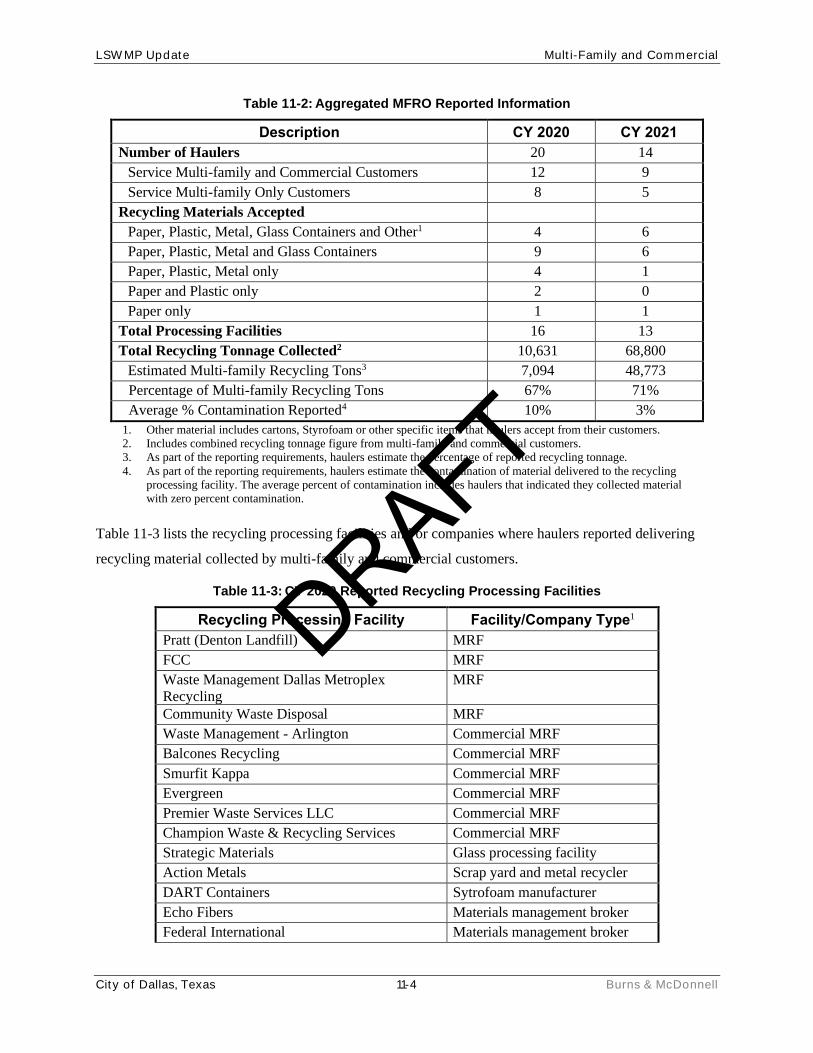
LSWMP Update Multi-Family and Commercial
City of Dallas, Texas 11-4 Burns & McDonnell
Table 11-2: Aggregated MFRO Reported Information
Description CY 2020 CY 2021
Number of Haulers 20 14
Service Multi-family and Commercial Customers 12 9
Service Multi-family Only Customers 8 5
Recycling Materials Accepted
Paper, Plastic, Metal, Glass Containers and Other1 4 6
Paper, Plastic, Metal and Glass Containers 9 6
Paper, Plastic, Metal only 4 1
Paper and Plastic only 2 0
Paper only 1 1
Total Processing Facilities 16 13
Total Recycling Tonnage Collected2 10,631 68,800
Estimated Multi-family Recycling Tons3 7,094 48,773
Percentage of Multi-family Recycling Tons 67% 71%
Average % Contamination Reported4 10% 3%
1. Other material includes cartons, Styrofoam or other specific items that haulers accept from their customers.
2. Includes combined recycling tonnage figure from multi-family and commercial customers.
3. As part of the reporting requirements, haulers estimate the percentage of reported recycling tonnage.
4. As part of the reporting requirements, haulers estimate the contamination of material delivered to the recycling
processing facility. The average percent of contamination includes haulers that indicated they collected material
with zero percent contamination.
Table 11-3 lists the recycling processing facilities and/or companies where haulers reported delivering
recycling material collected by multi-family and commercial customers.
Table 11-3: CY 2020 Reported Recycling Processing Facilities
Recycling Processing Facility Facility/Company Type1
Pratt (Denton Landfill) MRF
FCC MRF
Waste Management Dallas Metroplex
Recycling
MRF
Community Waste Disposal MRF
Waste Management - Arlington Commercial MRF
Balcones Recycling Commercial MRF
Smurfit Kappa Commercial MRF
Evergreen Commercial MRF
Premier Waste Services LLC Commercial MRF
Champion Waste & Recycling Services Commercial MRF
Strategic Materials Glass processing facility
Action Metals Scrap yard and metal recycler
DART Containers Sytrofoam manufacturer
Echo Fibers Materials management broker
Federal International Materials management broker
DRAFT
LSWMP Update Multi-Family and Commercial
City of Dallas, Texas 11-5 Burns & McDonnell
Bachman Transfer Station Transfer station
Fair Oaks Transfer Station Transfer station
1. Commercial MRF indicates the facility does not process recycling generated by single-family
residents; materials management brokers indicate that they do not necessarily have a dedicated
processing facility but may receive, bale, and market recycling materials.
Based on discussion with MRF and commercial MRF processors in the area, the majority are 60-100 percent
utilized, indicating that there is limited available capacity to increase the recycling tonnage that flows to
these facilities. Additionally, the facilities are located throughout the City and wider metroplex which may
increase the cost to provide recycling service to commercial generators due to longer travel times depending
on where customers are located.
The locations of the facilities where permitted recycling haulers deliver material collected from multi-
family and commercial customers are spread across the City and beyond, limiting the ability of permitted
recycling haulers to take advantage of route density and economies of scale related to the provision of
recycling collection service.
11.1.3 Commercial Sector
The commercial sector consists of a wide variety of properties, facilities and business operations. Material
from the commercial sector is not managed the same way as the single-family sector and although a
significant amount of materials have diversion potential, effectively segregating and diverting this material
presents significant challenges due to the broad set of entities and material types in the commercial sector.
There are 1,259 commercial entities within the City representing about 347,500 total employees.
Understanding the volume and type of material generated from commercial entities that is currently diverted
as a baseline is essential to updating the diversion goals that were previously set in the 2011 LSWMP.
As part of the 2011 LSWMP, a key recommendation was to increase diversion from the commercial sector
as part of a potential universal recycling ordinance. City staff began working with stakeholders to advance
discussions of a universal recycling ordinance that would support increased diversion from the commercial
sector on a parallel track to advance recycling programs at multi-family properties. Additionally, City staff
compared commercial recycling ordinances from 12 cities to identify opportunities, constraints and
implementation considerations89.
Based on the research and stakeholder engagement some peer cities have found success by encouraging,
but not requiring, commercial recycling while others require single-stream recycling related to primary
business operation, along with some C&D and vegetative waste. A key challenge to increasing commercial
89 “Update on Current Recycling & Diversion Initiatives.” Presented to the City of Dallas Quality of Life, Arts &
Culture. June 10, 2019.
DRAFT
LSWMP Update Multi-Family and Commercial
City of Dallas, Texas 11-6 Burns & McDonnell
recycling is limited space or inconvenient configuration of enclosure stalls on commercial properties
restricts collection providers.
Most of the benchmark cities allowed for variances for hardships and for facilities that generate small
quantities of recyclable and have policy that covers both multi-family and commercial entities as part of
the same ordinance. Based on the experience of benchmark cities, a phased implementation is preferable
given the total commercial entities and various types of businesses. Key challenges related to adopting and
implementing a universal recycling ordinance include the diversity of entities that would be covered,
impacts to both front of house and back of house operations, and high demand for education and outreach
with no central enforcement authority.
Based on the benchmark cities experiences with commercial recycling and the results of the stakeholder
engagement, the City determined to develop the MFRO rather than implement a commercial requirement
for recycling or material diversion at that time. The City’s intention is to revisit the opportunity to develop
policy that drives diversion from commercial sector generators.
11.1.3.1 Generators
Commercial properties include restaurants, retail, offices, schools, hospitals, and industrial facilities and
material generated from this sector represents a significant portion of the City’s waste stream. While this
presents an opportunity for increased waste diversion, there are challenges to ensure that diversion occurs
due to the diversity among many different industries and that make up the City’s commercial sector. Key
industries in the commercial sector are currently regulated by the Code Compliance Department as it relates
to obtaining their certificate of occupancy and regular code compliance inspections. All commercial
properties are required to obtain a certificate of occupancy before operations can commence. Typically,
commercial properties manage solid waste using front-load bins that are kept in enclosures and Code
Compliance inspections are focused on confirming that the enclosures and solid waste management
practices conform with City code.
The Consumer Health Division of Code Compliance regulates commercial entities that provide food service
by health. Entities that are deemed high risk are inspected by the consumer health division of Code
Compliance twice per year, and less risky establishments (e.g., serving pre-packaged or non-perishable
items) are inspected on a less frequent basis.
Food service entities must also submit a health permit application and the information is updated as
necessary as part of routine inspections. During inspections, sanitarians gather information to confirm that
the business has the equipment and ability to store and serve food items at the temperature required to
prevent spoil and that the material management enclosures are set up to prevent attracting vermin. Based
DRAFT
LSWMP Update Multi-Family and Commercial
City of Dallas, Texas 11-7 Burns & McDonnell
on discussions with the Consumer Health Division of Code Compliance, there is an opportunity to adjust
the inspection or health permit application forms to request targeted information about food surplus
donation, food waste recycling or single-stream recycling.
To encourage commercial generators to become more sustainable, the City implemented the Green
Business Certification program in 2019, new service offered to businesses to assist and recognize entities
that implement programs that prevent waste, incorporate recycling, or promote reuse, reduce, and
composting in their business operations90. Any business which supports sustainability efforts can be
recognized through the Green Business Certification program. To date, 16 businesses have been certified
and recognized for their excellence in sustainability. Awardees include a variety of facility and business
types including hotels, schools, retail locations, offices, material collection services, and non-profits.
Applicants must submit a form identifying their recycling, education, leadership and policy, transportation,
water conservation and energy efficiency efforts. The City provides limited technical assistance to the
commercial sector upon request. This includes phone consultation to businesses interested in starting a
recycling program, online technical guidance, and downloadable educational print materials. Further
discussion of the education and outreach efforts related to the Green Business Certification program are
provided in Section 13.0.
The City would like to expand the Green Business Certification program to work with more businesses
over time and increase its capabilities to provide technical assistance. This may require increased staff time
and result in hiring or dedicating more FTEs to the program.
11.1.3.2 Franchise Haulers
The City transitioned to the current non-exclusive franchise system in 2007 from the previous hauler
permitting system91. Private sector haulers operating in the City are granted approval to collect and haul
material as part of a non-exclusive franchise system. Currently there are 109 franchise haulers operation in
the City. As part of the application process, franchise haulers must provide information regarding the
number of vehicles, description of service, and liability insurance related to their collection operations.
Franchise haulers enter into individual ordinance agreements and are required to submit monthly reports
and remit four percent of gross revenues from their collection operations to the City92. This revenue flows
90 More information related to the Green Business Certification program is available here:
https://dallascityhall.com/departments/sanitation/Pages/greenbusiness.aspx 91 The previous system for regulating haulers required annual sticker/decal replacement of approximately 1,000
vehicles and 20,000 containers City-wide. 92 Franchise haulers submit a Solid Waste Operator Franchisee Monthly Report on a monthly basis that identify the
gross receipts during the reporting period. Receipts for disposal fees of solid waste collected in the City and
DRAFT
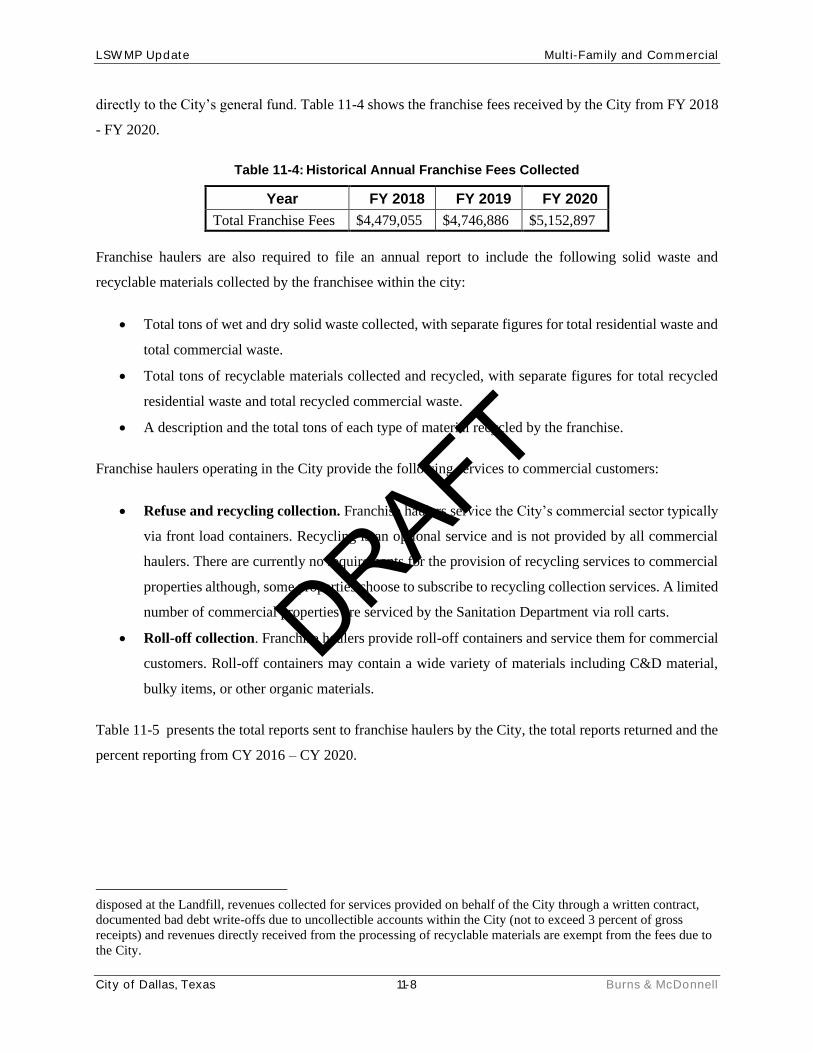
LSWMP Update Multi-Family and Commercial
City of Dallas, Texas 11-8 Burns & McDonnell
directly to the City’s general fund. Table 11-4 shows the franchise fees received by the City from FY 2018
- FY 2020.
Table 11-4: Historical Annual Franchise Fees Collected
Year FY 2018 FY 2019 FY 2020
Total Franchise Fees $4,479,055 $4,746,886 $5,152,897
Franchise haulers are also required to file an annual report to include the following solid waste and
recyclable materials collected by the franchisee within the city:
• Total tons of wet and dry solid waste collected, with separate figures for total residential waste and
total commercial waste.
• Total tons of recyclable materials collected and recycled, with separate figures for total recycled
residential waste and total recycled commercial waste.
• A description and the total tons of each type of material recycled by the franchise.
Franchise haulers operating in the City provide the following services to commercial customers:
• Refuse and recycling collection. Franchise haulers service the City’s commercial sector typically
via front load containers. Recycling is an optional service and is not provided by all commercial
haulers. There are currently no requirements for the provision of recycling services to commercial
properties although, some properties choose to subscribe to recycling collection services. A limited
number of commercial properties are serviced by the Sanitation Department via roll carts.
• Roll-off collection. Franchise haulers provide roll-off containers and service them for commercial
customers. Roll-off containers may contain a wide variety of materials including C&D material,
bulky items, or other organic materials.
Table 11-5 presents the total reports sent to franchise haulers by the City, the total reports returned and the
percent reporting from CY 2016 – CY 2020.
disposed at the Landfill, revenues collected for services provided on behalf of the City through a written contract,
documented bad debt write-offs due to uncollectible accounts within the City (not to exceed 3 percent of gross
receipts) and revenues directly received from the processing of recyclable materials are exempt from the fees due to
the City.
DRAFT
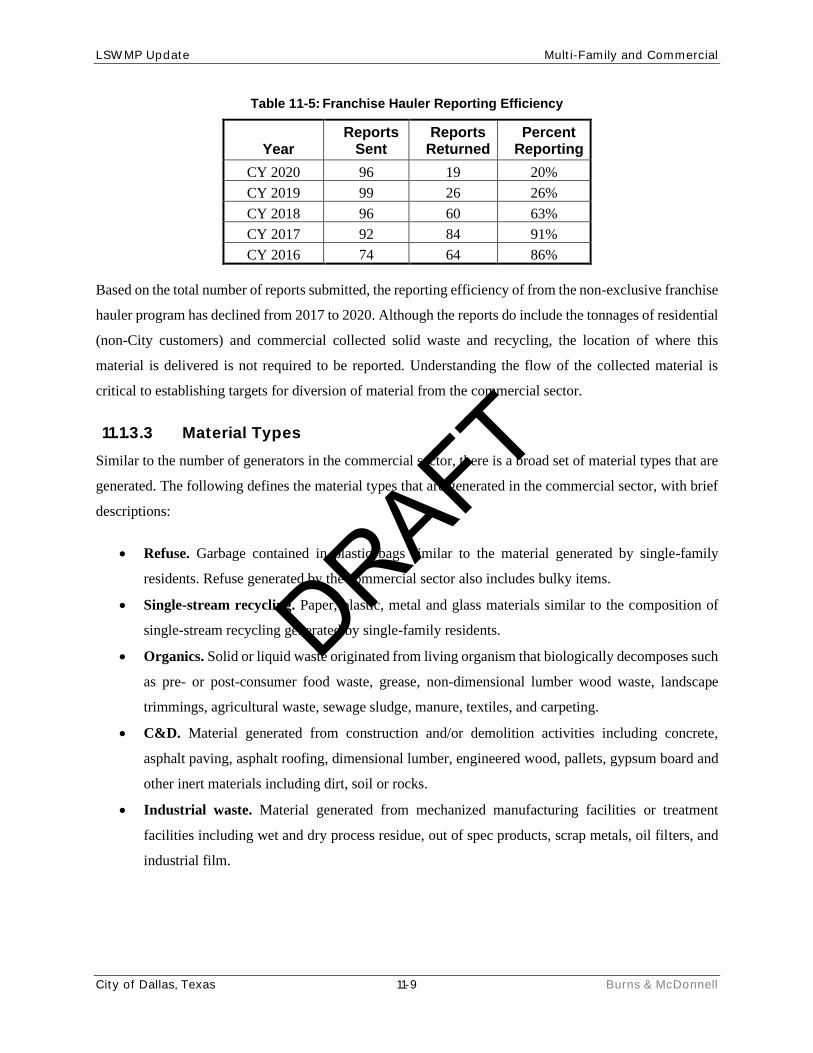
LSWMP Update Multi-Family and Commercial
City of Dallas, Texas 11-9 Burns & McDonnell
Table 11-5: Franchise Hauler Reporting Efficiency
Year Reports
Sent Reports
Returned Percent
Reporting
CY 2020 96 19 20%
CY 2019 99 26 26%
CY 2018 96 60 63%
CY 2017 92 84 91%
CY 2016 74 64 86%
Based on the total number of reports submitted, the reporting efficiency of from the non-exclusive franchise
hauler program has declined from 2017 to 2020. Although the reports do include the tonnages of residential
(non-City customers) and commercial collected solid waste and recycling, the location of where this
material is delivered is not required to be reported. Understanding the flow of the collected material is
critical to establishing targets for diversion of material from the commercial sector.
11.1.3.3 Material Types
Similar to the number of generators in the commercial sector, there is a broad set of material types that are
generated. The following defines the material types that are generated in the commercial sector, with brief
descriptions:
• Refuse. Garbage contained in plastic bags similar to the material generated by single-family
residents. Refuse generated by the commercial sector also includes bulky items.
• Single-stream recycling. Paper, plastic, metal and glass materials similar to the composition of
single-stream recycling generated by single-family residents.
• Organics. Solid or liquid waste originated from living organism that biologically decomposes such
as pre- or post-consumer food waste, grease, non-dimensional lumber wood waste, landscape
trimmings, agricultural waste, sewage sludge, manure, textiles, and carpeting.
• C&D. Material generated from construction and/or demolition activities including concrete,
asphalt paving, asphalt roofing, dimensional lumber, engineered wood, pallets, gypsum board and
other inert materials including dirt, soil or rocks.
• Industrial waste. Material generated from mechanized manufacturing facilities or treatment
facilities including wet and dry process residue, out of spec products, scrap metals, oil filters, and
industrial film.
DRAFT
LSWMP Update Multi-Family and Commercial
City of Dallas, Texas 11-10 Burns & McDonnell
• Hazardous material. Material that may not be disposed without prior treatment including hospital
and/or medical waste, ash, special wastes93, electronics, batteries, vehicle and equipment fluids,
and tires.
Facilities and business types produce quantities and categories of waste material that vary between industry
and business. For example, professional, scientific and technical service businesses may produce material
typical of an office setting, where transportation, warehousing and postal service businesses may produce
large quantities of cardboard packaging and film wrap. This presents a challenge implementing policy
initiatives that require all businesses to recycle, since there is such variability in the way that material is
generated and managed across the commercial sector.
11.2 Diversion Recycling Potential
As indicated in the 2011 LSWMP, there is a significant amount of material disposed from multi-family and
commercial sector generators and represents a key opportunity for the City to increase the amount of
material diverted from disposal each year. Unfortunately, the total amount material generated by the multi-
family and commercial sectors cannot be calculated because there is no comprehensive reporting
mechanism that requires franchise haulers to report tonnage data to the City. Although there are some
reporting requirements as part of the MFRO and hauler permit process (e.g., recycling tons collected from
multi-family complexes, refuse tonnage from commercial customers), it does not provide enough
information for the City to accurately quantify a baseline figure for what is currently recycled and disposed
from each sector and limits the ability to set and work towards its Zero Waste goals. The following sections
present information on estimated material generation and diversion potential from the multi-family and
commercial sectors.
Accounting for material generated by multi-family and commercial entities is challenging based on the data
limitations regarding material that is imported and exported (e.g., material generated in the City hauled to
landfills outside the City or material generated outside the City hauled to the Landfill) and the open market
for commercial recycling. To support the goals and objectives of the 2011 LSWMP, the City had passed an
ordinance in September 2011 mandating that all waste collected inside its borders would be hauled to the
Landfill; however, this policy was contested and ultimately removed as part of a legal settlement.
93 Special waste is a waste that requires special handling, trained people and/or special disposal methods as defined
in Title 30 Texas Administrative Code (30 TAC), Chapter 330.
DRAFT
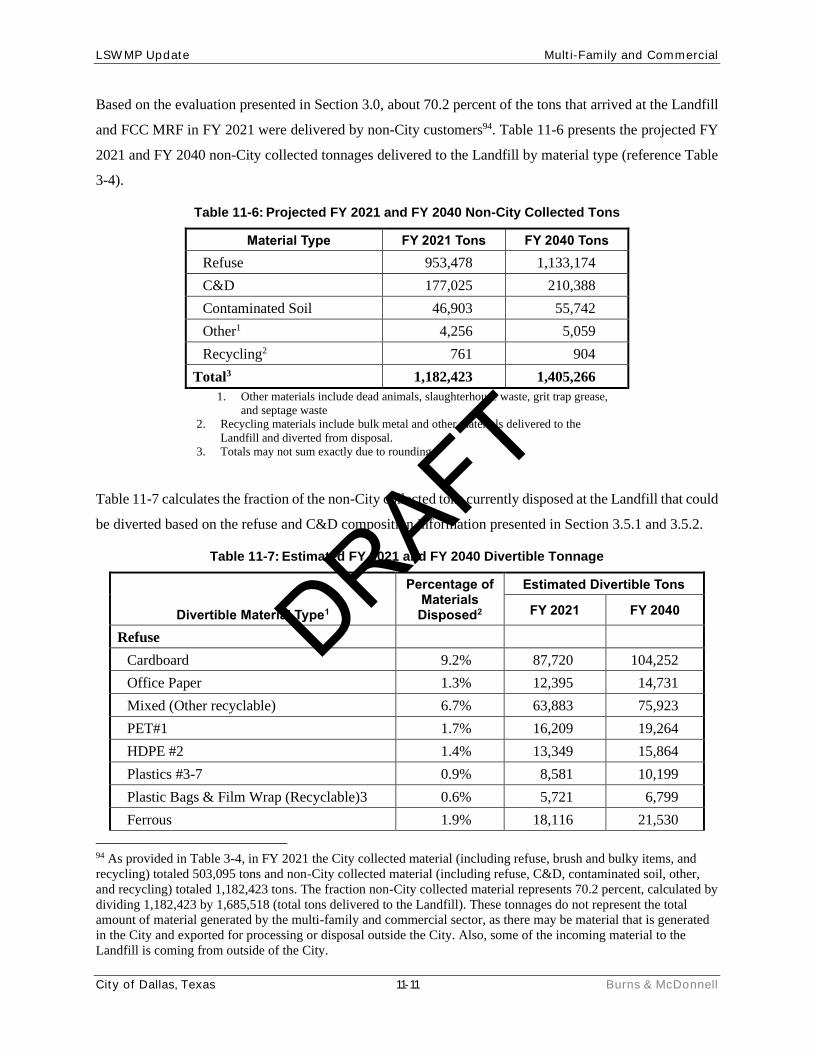
LSWMP Update Multi-Family and Commercial
City of Dallas, Texas 11-11 Burns & McDonnell
Based on the evaluation presented in Section 3.0, about 70.2 percent of the tons that arrived at the Landfill
and FCC MRF in FY 2021 were delivered by non-City customers94. Table 11-6 presents the projected FY
2021 and FY 2040 non-City collected tonnages delivered to the Landfill by material type (reference Table
3-4).
Table 11-6: Projected FY 2021 and FY 2040 Non-City Collected Tons
Material Type FY 2021 Tons FY 2040 Tons
Refuse 953,478 1,133,174
C&D 177,025 210,388
Contaminated Soil 46,903 55,742
Other1 4,256 5,059
Recycling2 761 904
Total3 1,182,423 1,405,266
1. Other materials include dead animals, slaughterhouse waste, grit trap grease,
and septage waste
2. Recycling materials include bulk metal and other materials delivered to the
Landfill and diverted from disposal.
3. Totals may not sum exactly due to rounding
Table 11-7 calculates the fraction of the non-City collected tons currently disposed at the Landfill that could
be diverted based on the refuse and C&D composition information presented in Section 3.5.1 and 3.5.2.
Table 11-7: Estimated FY 2021 and FY 2040 Divertible Tonnage
Divertible Material Type1
Percentage of Materials Disposed2
Estimated Divertible Tons
FY 2021 FY 2040
Refuse
Cardboard 9.2% 87,720 104,252
Office Paper 1.3% 12,395 14,731
Mixed (Other recyclable) 6.7% 63,883 75,923
PET#1 1.7% 16,209 19,264
HDPE #2 1.4% 13,349 15,864
Plastics #3-7 0.9% 8,581 10,199
Plastic Bags & Film Wrap (Recyclable)3 0.6% 5,721 6,799
Ferrous 1.9% 18,116 21,530
94 As provided in Table 3-4, in FY 2021 the City collected material (including refuse, brush and bulky items, and
recycling) totaled 503,095 tons and non-City collected material (including refuse, C&D, contaminated soil, other,
and recycling) totaled 1,182,423 tons. The fraction non-City collected material represents 70.2 percent, calculated by
dividing 1,182,423 by 1,685,518 (total tons delivered to the Landfill). These tonnages do not represent the total
amount of material generated by the multi-family and commercial sector, as there may be material that is generated
in the City and exported for processing or disposal outside the City. Also, some of the incoming material to the
Landfill is coming from outside of the City.
DRAFT
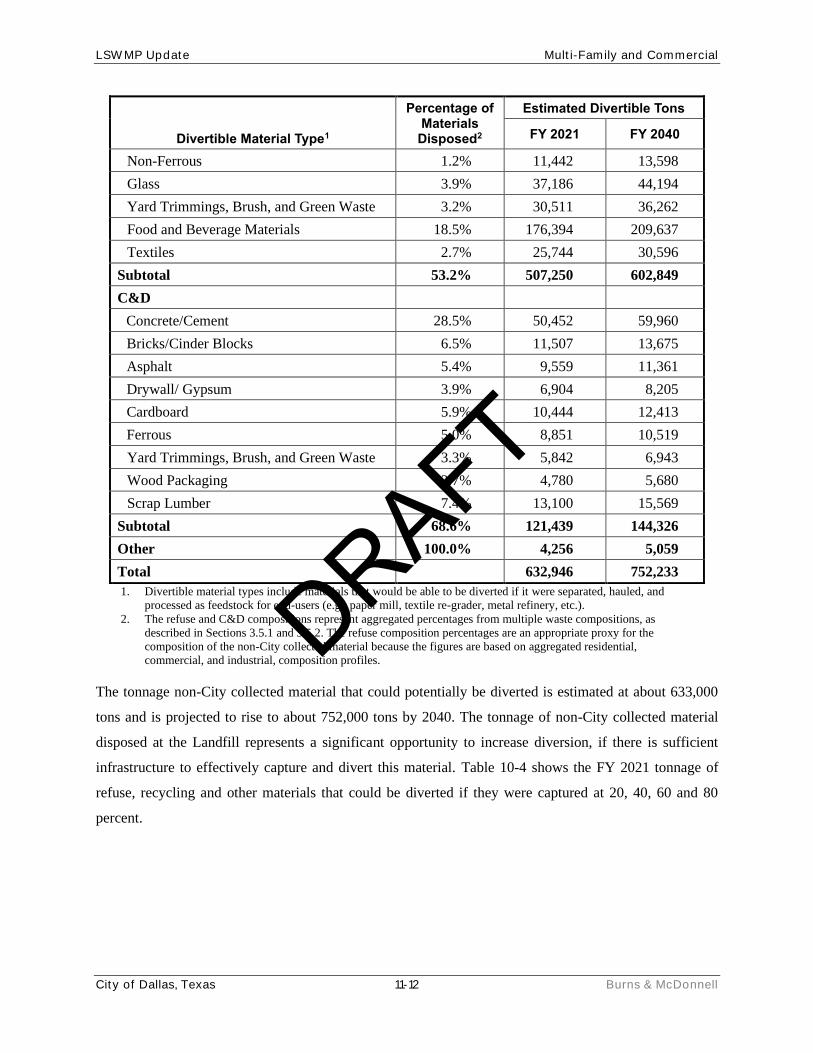
LSWMP Update Multi-Family and Commercial
City of Dallas, Texas 11-12 Burns & McDonnell
Divertible Material Type1
Percentage of Materials Disposed2
Estimated Divertible Tons
FY 2021 FY 2040
Non-Ferrous 1.2% 11,442 13,598
Glass 3.9% 37,186 44,194
Yard Trimmings, Brush, and Green Waste 3.2% 30,511 36,262
Food and Beverage Materials 18.5% 176,394 209,637
Textiles 2.7% 25,744 30,596
Subtotal 53.2% 507,250 602,849
C&D
Concrete/Cement 28.5% 50,452 59,960
Bricks/Cinder Blocks 6.5% 11,507 13,675
Asphalt 5.4% 9,559 11,361
Drywall/ Gypsum 3.9% 6,904 8,205
Cardboard 5.9% 10,444 12,413
Ferrous 5.0% 8,851 10,519
Yard Trimmings, Brush, and Green Waste 3.3% 5,842 6,943
Wood Packaging 2.7% 4,780 5,680
Scrap Lumber 7.4% 13,100 15,569
Subtotal 68.6% 121,439 144,326
Other 100.0% 4,256 5,059
Total 632,946 752,233
1. Divertible material types include materials that would be able to be diverted if it were separated, hauled, and
processed as feedstock for end-users (e.g., paper mill, textile re-grader, metal refinery, etc.).
2. The refuse and C&D compositions represent aggregated percentages from multiple waste compositions, as
described in Sections 3.5.1 and 3.5.2. The refuse composition percentages are an appropriate proxy for the
composition of the non-City collected material because the figures are based on aggregated residential,
commercial, and industrial, composition profiles.
The tonnage non-City collected material that could potentially be diverted is estimated at about 633,000
tons and is projected to rise to about 752,000 tons by 2040. The tonnage of non-City collected material
disposed at the Landfill represents a significant opportunity to increase diversion, if there is sufficient
infrastructure to effectively capture and divert this material. Table 10-4 shows the FY 2021 tonnage of
refuse, recycling and other materials that could be diverted if they were captured at 20, 40, 60 and 80
percent.
DRAFT
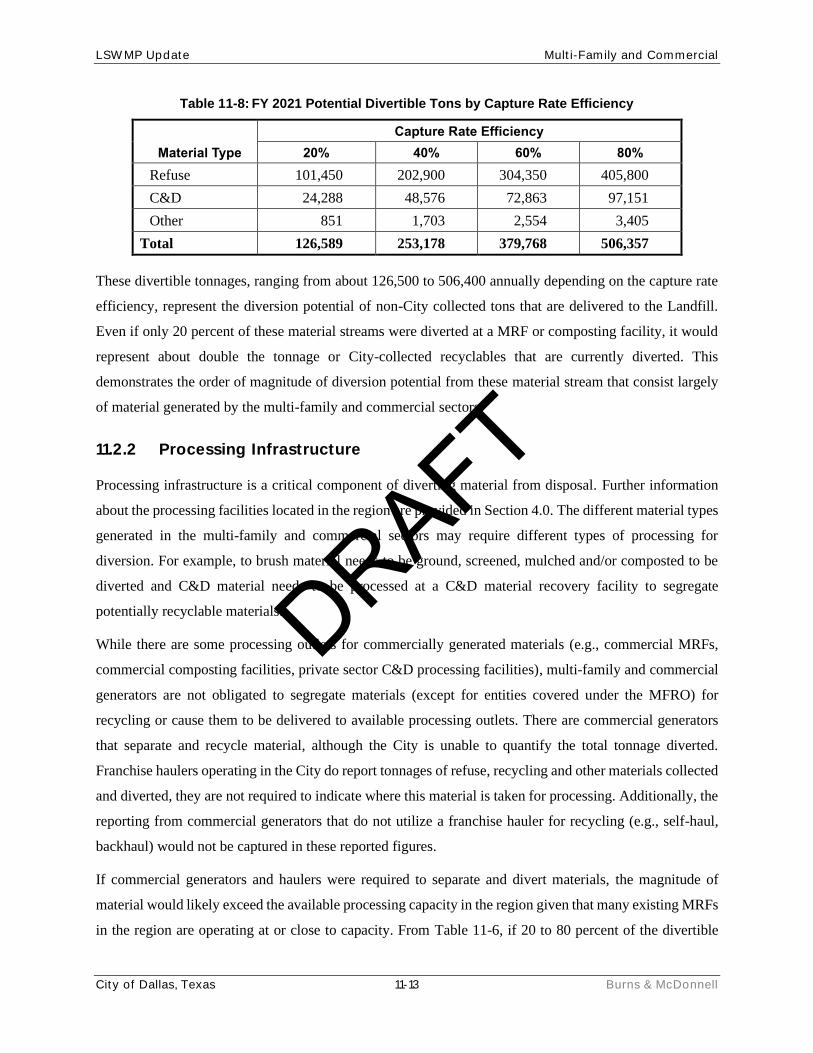
LSWMP Update Multi-Family and Commercial
City of Dallas, Texas 11-13 Burns & McDonnell
Table 11-8: FY 2021 Potential Divertible Tons by Capture Rate Efficiency
Material Type
Capture Rate Efficiency
20% 40% 60% 80%
Refuse 101,450 202,900 304,350 405,800
C&D 24,288 48,576 72,863 97,151
Other 851 1,703 2,554 3,405
Total 126,589 253,178 379,768 506,357
These divertible tonnages, ranging from about 126,500 to 506,400 annually depending on the capture rate
efficiency, represent the diversion potential of non-City collected tons that are delivered to the Landfill.
Even if only 20 percent of these material streams were diverted at a MRF or composting facility, it would
represent about double the tonnage or City-collected recyclables that are currently diverted. This
demonstrates the order of magnitude of diversion potential from these material stream that consist largely
of material generated by the multi-family and commercial sectors.
11.2.2 Processing Infrastructure
Processing infrastructure is a critical component of diverting material from disposal. Further information
about the processing facilities located in the region are provided in Section 4.0. The different material types
generated in the multi-family and commercial sectors may require different types of processing for
diversion. For example, to brush material needs to be ground, screened, mulched and/or composted to be
diverted and C&D material needs to be processed at a C&D material recovery facility to segregate
potentially recyclable materials.
While there are some processing outlets for commercially generated materials (e.g., commercial MRFs,
commercial composting facilities, private sector C&D processing facilities), multi-family and commercial
generators are not obligated to segregate materials (except for entities covered under the MFRO) for
recycling or cause them to be delivered to available processing outlets. There are commercial generators
that separate and recycle material, although the City is unable to quantify the total tonnage diverted.
Franchise haulers operating in the City do report tonnages of refuse, recycling and other materials collected
and diverted, they are not required to indicate where this material is taken for processing. Additionally, the
reporting from commercial generators that do not utilize a franchise hauler for recycling (e.g., self-haul,
backhaul) would not be captured in these reported figures.
If commercial generators and haulers were required to separate and divert materials, the magnitude of
material would likely exceed the available processing capacity in the region given that many existing MRFs
in the region are operating at or close to capacity. From Table 11-6, if 20 to 80 percent of the divertible
DRAFT
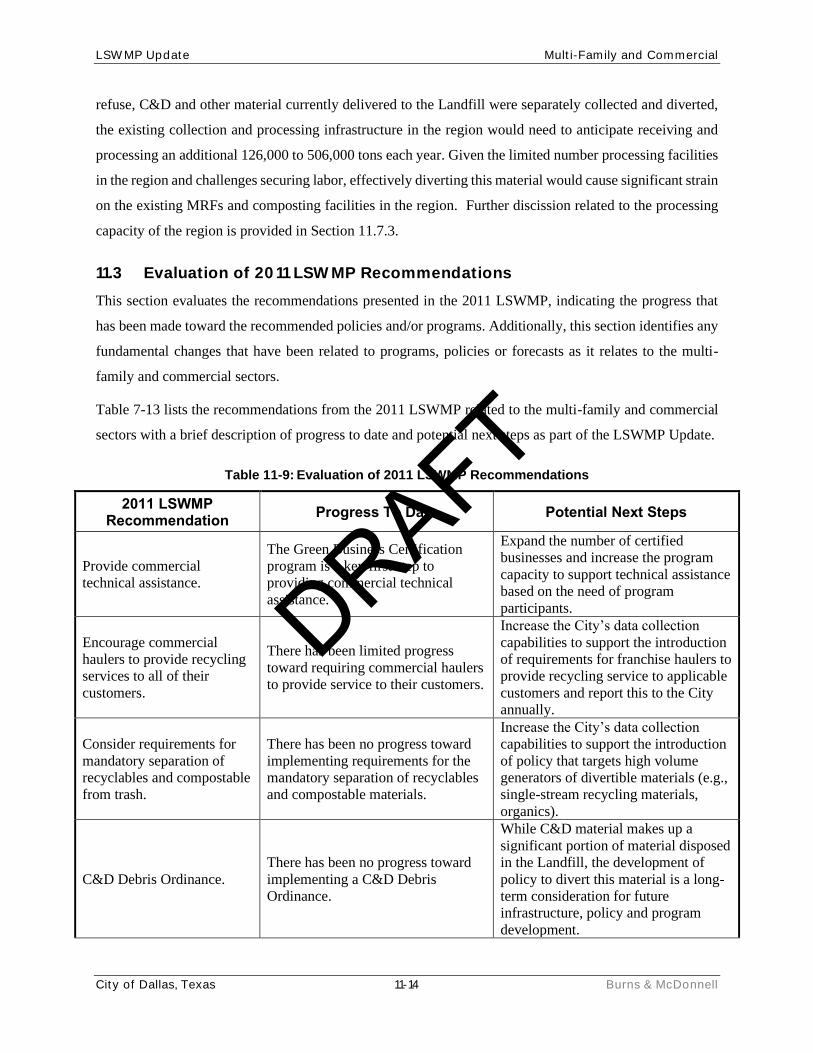
LSWMP Update Multi-Family and Commercial
City of Dallas, Texas 11-14 Burns & McDonnell
refuse, C&D and other material currently delivered to the Landfill were separately collected and diverted,
the existing collection and processing infrastructure in the region would need to anticipate receiving and
processing an additional 126,000 to 506,000 tons each year. Given the limited number processing facilities
in the region and challenges securing labor, effectively diverting this material would cause significant strain
on the existing MRFs and composting facilities in the region. Further discission related to the processing
capacity of the region is provided in Section 11.7.3.
11.3 Evaluation of 2011 LSWMP Recommendations
This section evaluates the recommendations presented in the 2011 LSWMP, indicating the progress that
has been made toward the recommended policies and/or programs. Additionally, this section identifies any
fundamental changes that have been related to programs, policies or forecasts as it relates to the multi-
family and commercial sectors.
Table 7-13 lists the recommendations from the 2011 LSWMP related to the multi-family and commercial
sectors with a brief description of progress to date and potential next steps as part of the LSWMP Update.
Table 11-9: Evaluation of 2011 LSWMP Recommendations
2011 LSWMP Recommendation
Progress To Date Potential Next Steps
Provide commercial
technical assistance.
The Green Business Certification
program is a key first step to
providing commercial technical
assistance.
Expand the number of certified
businesses and increase the program
capacity to support technical assistance
based on the need of program
participants.
Encourage commercial
haulers to provide recycling
services to all of their
customers.
There has been limited progress
toward requiring commercial haulers
to provide service to their customers.
Increase the City’s data collection
capabilities to support the introduction
of requirements for franchise haulers to
provide recycling service to applicable
customers and report this to the City
annually.
Consider requirements for
mandatory separation of
recyclables and compostable
from trash.
There has been no progress toward
implementing requirements for the
mandatory separation of recyclables
and compostable materials.
Increase the City’s data collection
capabilities to support the introduction
of policy that targets high volume
generators of divertible materials (e.g.,
single-stream recycling materials,
organics).
C&D Debris Ordinance.
There has been no progress toward
implementing a C&D Debris
Ordinance.
While C&D material makes up a
significant portion of material disposed
in the Landfill, the development of
policy to divert this material is a long-
term consideration for future
infrastructure, policy and program
development.
DRAFT
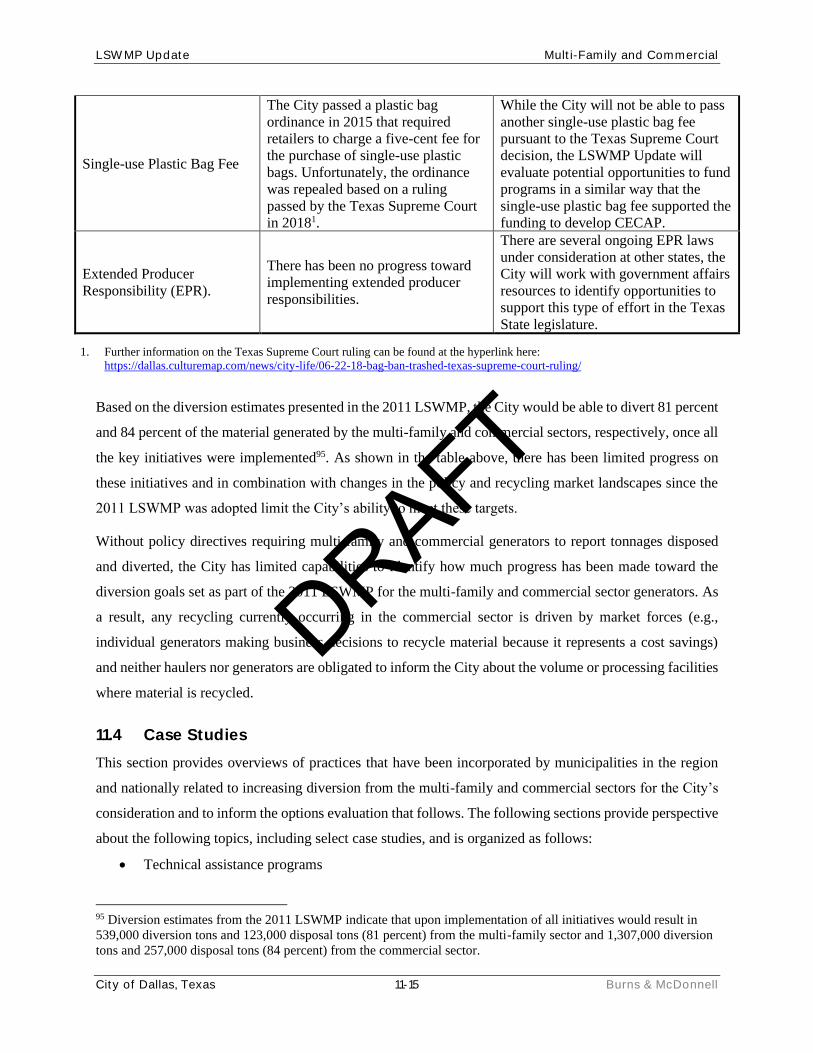
LSWMP Update Multi-Family and Commercial
City of Dallas, Texas 11-15 Burns & McDonnell
Single-use Plastic Bag Fee
The City passed a plastic bag
ordinance in 2015 that required
retailers to charge a five-cent fee for
the purchase of single-use plastic
bags. Unfortunately, the ordinance
was repealed based on a ruling
passed by the Texas Supreme Court
in 20181.
While the City will not be able to pass
another single-use plastic bag fee
pursuant to the Texas Supreme Court
decision, the LSWMP Update will
evaluate potential opportunities to fund
programs in a similar way that the
single-use plastic bag fee supported the
funding to develop CECAP.
Extended Producer
Responsibility (EPR).
There has been no progress toward
implementing extended producer
responsibilities.
There are several ongoing EPR laws
under consideration at other states, the
City will work with government affairs
resources to identify opportunities to
support this type of effort in the Texas
State legislature.
1. Further information on the Texas Supreme Court ruling can be found at the hyperlink here:
https://dallas.culturemap.com/news/city-life/06-22-18-bag-ban-trashed-texas-supreme-court-ruling/
Based on the diversion estimates presented in the 2011 LSWMP, the City would be able to divert 81 percent
and 84 percent of the material generated by the multi-family and commercial sectors, respectively, once all
the key initiatives were implemented95. As shown in the table above, there has been limited progress on
these initiatives and in combination with changes in the policy and recycling market landscapes since the
2011 LSWMP was adopted limit the City’s ability to meet these targets.
Without policy directives requiring multi-family and commercial generators to report tonnages disposed
and diverted, the City has limited capabilities to identify how much progress has been made toward the
diversion goals set as part of the 2011 LSWMP for the multi-family and commercial sector generators. As
a result, any recycling currently occurring in the commercial sector is driven by market forces (e.g.,
individual generators making business decisions to recycle material because it represents a cost savings)
and neither haulers nor generators are obligated to inform the City about the volume or processing facilities
where material is recycled.
11.4 Case Studies
This section provides overviews of practices that have been incorporated by municipalities in the region
and nationally related to increasing diversion from the multi-family and commercial sectors for the City’s
consideration and to inform the options evaluation that follows. The following sections provide perspective
about the following topics, including select case studies, and is organized as follows:
• Technical assistance programs
95 Diversion estimates from the 2011 LSWMP indicate that upon implementation of all initiatives would result in
539,000 diversion tons and 123,000 disposal tons (81 percent) from the multi-family sector and 1,307,000 diversion
tons and 257,000 disposal tons (84 percent) from the commercial sector.
DRAFT
LSWMP Update Multi-Family and Commercial
City of Dallas, Texas 11-16 Burns & McDonnell
• Hauler permit requirements
• Universal recycling ordinances (UROs)
• Exclusive or zoned franchise systems
11.4.1 Technical Assistance Programs
Technical assistance programs are designed to support commercial or multi-family generation sectors to
implement recycling programs, reduce waste generation, and achieve other sustainability-related goals
(e.g., water use reduction, environmentally preferred purchasing, etc.). While the City has successfully
implemented the Green Business Certification program, there are opportunities to expand the capability of
these efforts to provide technical assistance to program participants.
The City of San Antonio has established a business certification and technical assistance program called
ReWorksSA to provide the local business community with consultancy, resources, materials, and training
at no cost. This program is a joint endeavor between San Antonio’s Solid Waste Management Department
(SWMD) and the Office of Sustainability (OS), similar to the City’s Sanitation Department and OEQS,
serves as a promotion and recognition tool for organizations that successfully complete the program and
that receive certification as a sustainable business.
ReWorksSA helps local businesses either start or improve recycling programs in the workplace and
supports the City of San Antonio’s climate initiatives by improving the environmental and economic profile
of the business community. The certification process evaluates the number of programs and policies a
business has in the areas of recycling, energy conservation, water conservation, travel & transportation and
a reduction in multiple types of consumption. Points are awarded for both the number and the effectiveness
of the best practices.
Applicants can create an account on a dedicated web portal and review the best practices that are available.
City staff conduct an initial assessment with the business before they submit a formal application for
certification. After the application is reviewed, businesses are awarded bronze, silver, gold or pinnacle
status and certifications are valid for two years. More information related to ReWorksSA is available here:
https://www.reworkssa.org/
The City of Plano also provides technical assistance in the form of waste-stream audits, recycling training,
and assistance in preparation for Green Business Certification. These value-added services are provided to
Plano businesses at no cost. These programs are implemented by a staff of four employees who are each
responsible for a defined quadrant of the community. Plano’s Green Business Certification (GBC) program
was developed to recognize green businesses and is managed by the Environmental Waste Services
Division. The GBC program verifies these businesses are upholding a commitment to conduct their daily
DRAFT
LSWMP Update Multi-Family and Commercial
City of Dallas, Texas 11-17 Burns & McDonnell
practices to reduce the impact on our environment. The program also focuses on a checklist of green
operational practices designed for consumer businesses with a walk-in clientele.
11.4.2 Hauler Permit Requirements
Policy approaches that require commercial recycling are implemented to increase recycling efforts and
support infrastructure development to separate, processing and divert recycling generated in the commercial
sector. As part of the City’s non-exclusive franchise system, haulers are required to meet standards and
submit reports regarding the number of vehicles, and liability insurance related to their collection
operations.
Implementing changes to the franchise hauler registration requirements would provide a mechanism to
allow the City to collect data and confirm the capability of franchise haulers to support increased recycling
from commercial sector generators. These changes could also include requiring that franchise haulers offer
recycling service to customers at a specified price point, support customers to establish a recycling or
composting program, or specify that customers must be charged for all services on a single bill (rather than
multiple bills for refuse, recycling and/or organics collection).
The City of Boston, Massachusetts has implemented commercial recycling requirements where every
hauler operating in the City is required to provide recycling services. The intent of the policy is to ensure
that all businesses have access to recycling programs and increase the accountability of haulers to offer
recycling to commercial businesses. These policies serve to support Boston’s Zero Waste goals and
incentivize the infrastructure and program development to divert material from commercial sector
generators. Additionally, the policy supports the statewide waste ban of key materials including
commercial food material, recyclable materials, and other divertible materials96.
Haulers are required to renew their permit annually by submitting the following:
• Completed application and registration fee
• Registration number of each vehicle
• Signed waste hauler affidavit certifying compliance with City of Boston ordinance CBC 7-13.8
“Recycling Requirements for Waste Hauler”97
• The completed commercial hauler recycling data report
96 More information on the state of Massachusetts waste ban is provided at the following hyperlink:
https://www.mass.gov/guides/massdep-waste-disposal-bans#-about-the-waste-bans- 97 Failure to offer recycling services under CBC 7-13.8.5, failure to obtain alternate procedure approval from the
Commissioner under CBC 7-13.8.5, or failure to comply with the education requirements in CBC 7-13.8.6 shall
result in a one hundred fifty ($150.00) dollar fine for the first violation, three hundred ($300.00) dollar for the
second violation, and on a third violation the hauler's permit will be revoked by the Commissioner.
DRAFT
LSWMP Update Multi-Family and Commercial
City of Dallas, Texas 11-18 Burns & McDonnell
The commercial hauler recycling data report requires permitted haulers to provide the total number of
commercial customers, the number and percentage of customers that utilize recycling service, the total
amount of solid waste and recycling collected from Boston customers and a description of the hauler’s
education materials related to recycling service.
11.4.3 Universal Recycling Ordinances
A Universal Recycling Ordinance (URO) is a comprehensive policy approach that requires recycling from
multi-family and/or commercial generator sectors. This differs from other commercial recycling
requirements because it targets generators rather than haulers of recycling material.
The City of Austin adopted a URO in 2010, with the first set of requirements becoming effective in 2012.
Implementation was tiered and based on size (square footage) of a business, with larger businesses
becoming subject earlier, and smaller businesses becoming covered in later phases of implementation.
Austin’s URO was fully implemented in 2018 and currently covers 17,000 entities within the City
including:
• Multi-family properties (five or more dwelling units)
• Commercial properties (all non-residential properties)
• Food-permitted properties (entities required to have a food service permit)
Austin provides guidance and resources to support owners and managers of affected premises in
understanding and complying with the URO through a dedicated URO website and a business outreach
team98. Affected premises subject to the URO must meet the following requirements:
• Convenient access to services. Affected premises are required to provide employees and tenants
of the property with access to collection receptacles for single-stream recyclable materials and for
organic materials if the property is food-permitted. The URO does not include requirements to
provide diversion opportunities to the public (e.g., customers or patrons of the property or business)
and does not include requirements for actual diversion of materials or a minimum diversion rate.
• Collection and diversion. Access to diversion opportunities for recyclable and organic materials
must be provided; however, property owners may choose the method by which materials are
collected and diverted such as contracting with a licensed hauler, self-hauling materials, or source
reduction (e.g., food donation, backyard composting, etc.)
98 More information about Austin’s URO is provided at the following hyperlink: https://www.austintexas.gov/uro
DRAFT
LSWMP Update Multi-Family and Commercial
City of Dallas, Texas 11-19 Burns & McDonnell
To comply with the URO, affected premises must meeting a 50 percent recycling diversion minimum by
volume or an 85 percent minimum by weight. Multi-family properties must provide a minimum amount of
service capacity of per unit per week and food-permitted entities must provide one or more organics
diversion options (including waste reduction) to employees. URO organics diversion requirements do not
address businesses that generate organic materials (e.g., from landscaping activities) but are not food-
permitted businesses.
Generators covered by the URO must also provide education regarding recycling and diversion and submit
an annual diversion plan for single-stream or organics that includes the list of materials to be diverted,
service capabilities available, and collection methods for diverted material. Annual diversion plans provide
a reporting mechanism for Austin to compile data regarding compliance with the URO service
requirements. Generally, businesses do not report data on material quantities, so Austin relies on semi-
annual hauler reports for material tonnage data. Haulers are required to provide Austin with semi-annual
tonnage reports to maintain a hauling license with the City.
Since its implementation in 2012, the URO has driven Austin’s progress in increasing diversion activities
within the commercial and multi-family sectors and has supported progress toward reaching its Zero Waste
goal. However, Austin has faced challenges in data collection and evaluation for both generator- and hauler-
provided data. Challenges encountered in URO data collection and evaluation include
• Large numbers of commercial entities. Austin’s business outreach team is responsible for
ensuring compliance from 17,000 commercial entities including engagement, compliance, and
enforcement that requires significant investment of staff time and financial resources.
• Variety in commercial entities. The types and sizes of commercial and multi-family entities
within the City vary widely among needs, available resources and levels of engagement in diversion
activities. Due to this variation, a uniform approach to administering URO requirements, reporting,
education, and enforcement is not feasible.
• Self-reporting. Receiving responsive submissions and maintaining data quality is challenging
because businesses self-report, leading to inconsistencies or reporting error99. The representative
who submits annual reports (such as a property manager) may have limited day-to-day involvement
in waste, recycling, and organics management and therefore may not have full knowledge of actual
activities, leading to inaccurate reporting.
99 For example, reporting forms for multi-family properties differ from reporting forms for commercial properties
(non-multi-family). In 2019, approximately 15 percent of multi-family properties submitted a commercial property
reporting form, resulting in City Staff being unable to calculate service capacity compliance for those properties.
Additionally, 349 businesses submitted blank reports.
DRAFT
LSWMP Update Multi-Family and Commercial
City of Dallas, Texas 11-20 Burns & McDonnell
• Reporting and data management system. The City’s online and annual report submission was
designed to be convenient for commercial properties to encourage compliance with reporting
requirements. However, analysis of annual report data is time- and labor-intensive staff and there
is not a centralized database for generator-provided data.
11.4.4 Exclusive or Zoned Franchise Systems
The City currently has a non-exclusive franchise system for haulers operating in the City, which has the
benefits of allowing customers to select which haulers to contract with. If the City were to transition to an
exclusive or zoned (limited) franchise systems, there would be a single hauler or several haulers among
designated zones that would be selected to provide service. To transition to this type of franchise system,
the City would release a competitive procurement for one exclusive hauler to operate within the City, or
define multiple geographic zones and select one or more hauler per zone.
A typical franchise agreement grants rights to a company to haul material from specified properties (i.e.,
commercial, multifamily) and it sets specific standards, requirements, and responsibilities for the company
such as:
• Specifying where materials are to be delivered
• Stipulating the collection services that need to be offered and minimum collection frequency
• Stipulating certain operating details, such as hours of operation, condition of vehicles, condition of
containers, etc.
• Enforcing penalties and remedies for poor or non-performance
• Requiring tonnage reporting
• Requesting liability insurance information.
Franchises are commonly established over a long period of time. Contracts typically last for a base period
(usually between three and 10 years) and have one or two optional renewal periods. Some long-term
franchises may involve an annual renewal fee or a renewal fee every five years. Several municipalities in
Texas have exclusive franchise systems covering one or more generators.
The main benefit of a franchise agreement is a standardized collection system and quality of service. The
competitive bid process typically results in lower rates, even more so in an exclusive franchise. Other
environmental benefits include reducing the number of trucks on the road, reducing wear and tear and
associated greenhouse gasses. There are drawbacks to be considered as well. The transition from an open
DRAFT
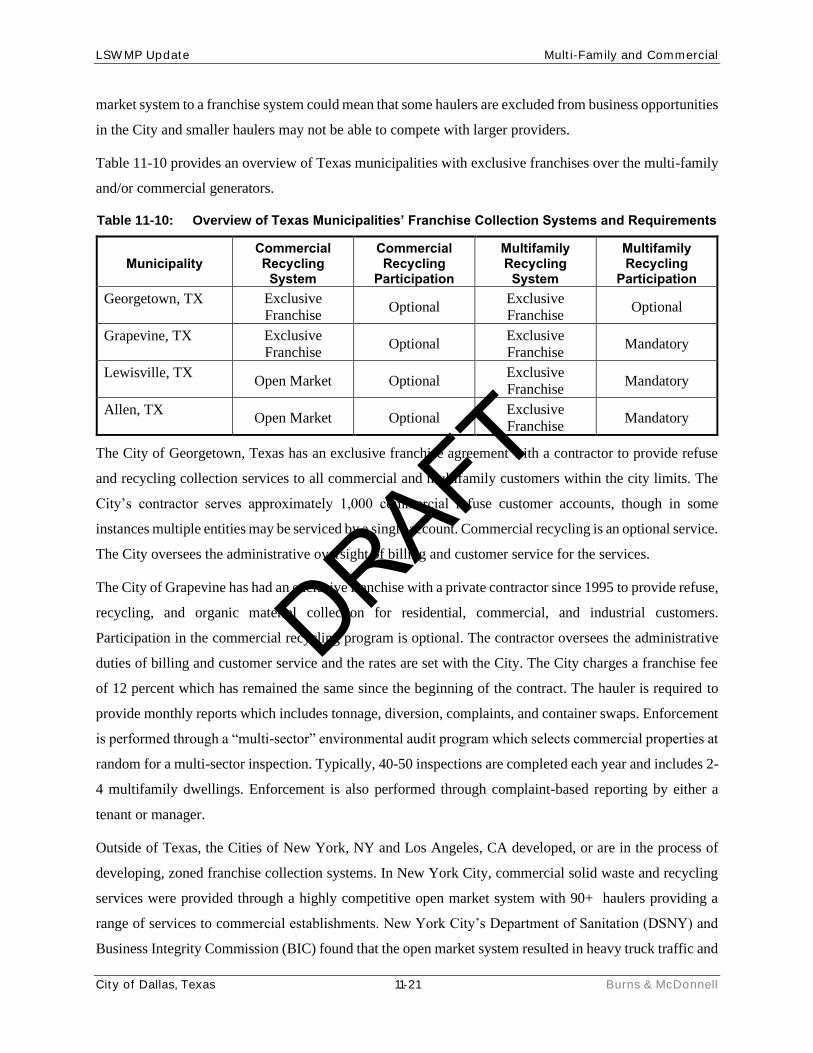
LSWMP Update Multi-Family and Commercial
City of Dallas, Texas 11-21 Burns & McDonnell
market system to a franchise system could mean that some haulers are excluded from business opportunities
in the City and smaller haulers may not be able to compete with larger providers.
Table 11-10 provides an overview of Texas municipalities with exclusive franchises over the multi-family
and/or commercial generators.
Table 11-10: Overview of Texas Municipalities’ Franchise Collection Systems and Requirements
Municipality Commercial Recycling
System
Commercial Recycling
Participation
Multifamily Recycling
System
Multifamily Recycling
Participation
Georgetown, TX Exclusive
Franchise Optional
Exclusive
Franchise Optional
Grapevine, TX Exclusive
Franchise Optional
Exclusive
Franchise Mandatory
Lewisville, TX Open Market Optional
Exclusive
Franchise Mandatory
Allen, TX Open Market Optional
Exclusive
Franchise Mandatory
The City of Georgetown, Texas has an exclusive franchise agreement with a contractor to provide refuse
and recycling collection services to all commercial and multifamily customers within the city limits. The
City’s contractor serves approximately 1,000 commercial refuse customer accounts, though in some
instances multiple entities may be serviced by a single account. Commercial recycling is an optional service.
The City oversees the administrative oversight of billing and customer service for the services.
The City of Grapevine has had an exclusive franchise with a private contractor since 1995 to provide refuse,
recycling, and organic material collection for residential, commercial, and industrial customers.
Participation in the commercial recycling program is optional. The contractor oversees the administrative
duties of billing and customer service and the rates are set with the City. The City charges a franchise fee
of 12 percent which has remained the same since the beginning of the contract. The hauler is required to
provide monthly reports which includes tonnage, diversion, complaints, and container swaps. Enforcement
is performed through a “multi-sector” environmental audit program which selects commercial properties at
random for a multi-sector inspection. Typically, 40-50 inspections are completed each year and includes 2-
4 multifamily dwellings. Enforcement is also performed through complaint-based reporting by either a
tenant or manager.
Outside of Texas, the Cities of New York, NY and Los Angeles, CA developed, or are in the process of
developing, zoned franchise collection systems. In New York City, commercial solid waste and recycling
services were provided through a highly competitive open market system with 90+ haulers providing a
range of services to commercial establishments. New York City’s Department of Sanitation (DSNY) and
Business Integrity Commission (BIC) found that the open market system resulted in heavy truck traffic and
DRAFT
LSWMP Update Multi-Family and Commercial
City of Dallas, Texas 11-22 Burns & McDonnell
related inefficiencies and worker safety incidents. Additionally, the open market system had little
transparency in customer pricing while a zoned system would provide more predictable pricing for the
City’s businesses, especially with the City imposing a rate cap. Between 2017-2020 New York City
performed stakeholder engagement, environmental reviews and released competitive solicitations, initially
for processing and disposal contracts, then for carting services in 2021. The phased transition to the zoned
franchise system is underway, and planned to be complete by 2023.
In Los Angeles, commercial solid waste and recycling services were provided through a competitive open
market with 144 permitted waste haulers. The City identified the open market system as a challenge to
reach its Zero Waste goal as many businesses and multi-family apartment tenants did not receive recycling
services through their refuse haulers. As part of the development of an exclusive franchise system, city-
wide rate tables were developed to ensure predictable pricing for customers for each service. Recycling
costs are embedded in the solid waste service costs, while organics are offered at a discount from solid
waste rates. Los Angeles hired six additional FTEs to ensure adequate staffing to develop the franchise
system, administer the competitive procurement process, oversee contracts, certify facilities, manage
customer care, and conduct field inspections.
The eight exclusive franchise haulers were selected in 2018 and currently service multi-family and
commercial generators. The contracts with franchise haulers rely on extensive liquidated damages for
nearly all requirements, coupled with intensive City enforcement. Additionally, intensive technical
assistance is provided to customers. The exclusive franchise haulers are also required to submit education
and outreach plans, conduct regular waste assessments with all customers over the life of the contract.
11.5 Options Evaluation
This section analyzes a series of options related to the multi-family and commercial sectors that have been
identified based on analysis of diversion potential from these sectors, stakeholder engagement, evaluation
of recommendations from the 2011 LSWMP, and case studies.
The following summarizes the key takeaways from the community survey and other outreach activities
conducted as part of the LSWMP Update.
• 66 percent of the respondents to the multi-family questions of the survey were tenants, and 33
percent were property owners or managers. 90 percent of the property owners/managers indicated
they have implemented recycling services at their properties but only 72 percent of tenants
indicated that their apartment complex provides recycling collection. 67 percent of respondents
indicated multi-family recycling service is provided by dumpster or cart and 21 percent indicated
they receive valet service.
DRAFT
LSWMP Update Multi-Family and Commercial
City of Dallas, Texas 11-23 Burns & McDonnell
• 71 percent of respondents that manage or own businesses in the City indicated they do not
participate in the Green Business Certification program, and 58 percent would need more
information about the program to determine if they would be willing to participate in the future. 58
percent of businesses receive regular recycling service, and those that do not or only have recycling
services provided on an as-needed basis identified constraints including not having enough space
to store material hesitation to increase costs or dedicate staff to separate material.
• 57 percent of respondents indicated that they are very supportive of leveraging the Green Business
Certification program and 61 percent are very supportive of receiving technical assistance as
compared to increasing. Businesses were much more opposed to more mandatory requirements,
where 46 percent of respondents were very opposed to increased reporting requirements and 43
percent were very opposed to recycling requirements.
• Franchise haulers already provide multiple services to meet the needs of their customers including
collection of containers including 95-gallon carts, front load containers, compactors, balers, and
semi-truck containers for industrial generators. Not all haulers provide each of these services, but
all haulers offer a variety of collection container sizes and collection frequencies. Some haulers
may offer a rebate for specific materials if generation meets defined specifications such as quality
and volume. A City enforced mechanism for better accountability and uniformity would improve
the current commercial recycling system by ensuring minimum service standards and prohibitions
on disposal of recycling material.
Further information about the methodology of the stakeholder engagement is described in Section 1.0 and
the comprehensive detailed results are provided in Appendix A.
The following presents options that are evaluated in the following sections including a brief description of
the option and evaluation approach:
• Adjust franchise hauler permit requirements. Builds on the policy mechanisms established by
the MFRO to support the City’s ability to gather and verify tonnages of refuse and recycling from
haulers servicing multi-family and commercial generators and establish minimum service
requirements for franchise haulers operating in the City.
• Expand Green Business Certification program. Evaluates the opportunity to expand the program
to include more capability for technical assistance through cross-departmental collaboration.
• Implement targeted commercial diversion requirement. Describes a phased approach to
developing a diversion requirement for commercial generators that builds on adjustments to the
DRAFT
LSWMP Update Multi-Family and Commercial
City of Dallas, Texas 11-24 Burns & McDonnell
existing franchise hauler permit requirements and requires large quantity generators of divertible
material to meet diversion targets.
Each of the following sections provide an overview of each option and specific tactics and evaluates the
impact of each options’ components based on the criteria detailed in Section 1.4.3. A high-level summary
of the evaluation criteria for each tactic within the options is provided in Section 11.6 to support the key
findings, recommendations and implementation and funding plan.
11.5.1 Adjust Franchise Hauler Permit Requirements
Overview. Based on the City’s existing reporting requirements, franchise haulers submit annual reports
indicating the annual tonnages collected and permitted recycling haulers submit the tonnages diverted from
multi-family customers. The challenge is that the annual reports submitted by franchise haulers do not break
out tonnages collected between multi-family and commercial customers and the permitted recycling haulers
are not required to submit refuse tonnage data. This leaves the City with partial data sets and limits the
ability to build a comprehensive baseline that identifies the total amount of material collected from multi-
family and commercial generators within the City and where that material is transported for processing or
disposal.
Without comprehensive baseline data, the City is unable to establish tonnage based diversion goals or
capture rate goals in the multi-family and commercial sectors. To collect data that provides a comprehensive
baseline, adjusting the existing reporting requirements to establish the data gathering and verification
mechanisms is a critical first step. Franchise haulers would need to be required to report both refuse tonnage
and recycling tonnage, broken out by customer type (either multi-family or commercial). If franchise
haulers are unable to break out tonnage by customer type (since material may be collected on a co-mingled
basis), the City would require estimates of the percentage of the reported material that is collected from
multi-family and commercial sector customers consistent with the current reporting requirements as part of
the MFRO.
Additionally, there are no requirements that franchise haulers provide recycling collection or organics
diversion service to customers. Requiring that franchise haulers offer recycling or organics diversion
services to customers at a price point that is not prohibitively expensive (compared to refuse collection
service) as a minimum permit requirement would support the City’s goal to increase diversion from the
multi-family and commercial sector. Implementing this requirement would need to be supported by data to
confirm there are sufficient customers in the multi-family and commercial sectors generating high enough
quantities of divertible material to (1) justify generators developing diversion programs and hiring franchise
haulers to collect and divert material; and to (2) assure franchise haulers that if they purchase the equipment
DRAFT
LSWMP Update Multi-Family and Commercial
City of Dallas, Texas 11-25 Burns & McDonnell
and hire staff to provide this service there will be customer demand for the service. The City would need to
implement enforcement mechanisms to ensure the adjustment are adopted and have the intended effect.
The following provide the types of enforcement activities that could be taken sequentially to ensure
compliance:
• Announced/unannounced inspections
• Written warning of the violation
• Citation or fine that increase in amount with each consecutive offense
• Increase in franchise fee, and finally
• Loss of hauling franchise.
Recycling potential. Implementing this option would increase the diversion potential by providing the City
with baseline tonnage data that ultimately supports requiring franchise haulers to offer recycling or organics
diversion services to commercial customers.
Operational impact. Adjusting the permit requirements to increase the data provided by franchise haulers
followed by requirements to provide recycling or organics service to customers would result in a
corresponding increase in the demand on City staff to verify and enforce the permit requirements. If the
City does not enforce the data collection or service provision requirements, franchise haulers will be less
likely to comply because there would not be a level playing field amongst haulers competing for business
(e.g., if franchise haulers are able to realize a competitive advantage by not providing data or required
service and are still allowed to operate in the City, other franchise haulers may follow suit). Based on the
experiences from the implementation of the MFRO, and given the commercial sector is much larger than
the multi-family sector (in terms of number of franchise haulers servicing businesses and the volume of
material generated), there would be a significant demand to administer and enforce the adjusted hauler
permit requirements from resources in the Sanitation Department and OEQS.
Financial impact. There would be a fairly significant financial impact to the franchise haulers that would
need to update data tracking and reporting procedures and dedicate resources to analyzing and submitting
information to the City. Additionally, if franchise haulers are required to offer recycling or organics
diversion services, they would need to dedicate existing equipment and personnel to providing collection
service and identify processing facilities that could effectively divert material. If franchise haulers are
unable to leverage existing processing capacity for recyclables or organics, they would need to build a
facility resulting in potentially significant capital investment. Additionally, if existing processing facilities
are not near customer bases, haulers would not be able to take advantage of route density and operational
costs would increase.
DRAFT
LSWMP Update Multi-Family and Commercial
City of Dallas, Texas 11-26 Burns & McDonnell
Environmental impact. There is no environmental impact related to adjusting data reporting requirements,
but if franchise haulers are required to offer recycling or organics diversion services, depending on the
demand for service there would be, on one hand, increased diversion and, on the other hand, additional
collection vehicles deployed. For example, if a customer only had refuse collection service on a once per
week basis and then adds recycling service at the same frequency, there would need to be two vehicles
deployed to this customer which doubles (depending on the final destination of the disposal and/or
processing facility) the vehicle emissions and road miles traveled but mitigates the emissions from the
avoided disposal of the recycling or organic materials100.
Policy impact. The main benefit of adjusting permit hauler requirements is that it can increase the provision
of and participation in recycling programs without completely revamping the existing collection system.
This can be easier to implement both politically and logistically because properties still have the freedom
to select their own hauler. There may be policy impacts if the adjusted requirements disproportionally
increase the barriers to entry for haulers seeking to enter the market.
Stakeholder “buy-in”. If the adjustments to the franchise hauler permits create an even playing field by
requiring a minimum level of service, reporting requirements, specified insurance and approved disposal
and/or processing facilities that guarantee they can accept material, the stakeholders of the system would
likely support the City in this effort. However, the current non-exclusive franchise system does not
incentivize investments in commercial recycling because it does not require that generators divert recycling
or organics diversion service. To invest in new equipment and staffing to service commercial entities in the
City, franchise haulers would seek assurances on the demand and volume of recycling or organics diversion
and that the City would have the capacity to effectively enforce the program.
Compatibility with existing programs. Adjusting the tonnage reporting requirements is highly compatible
with existing programs, but requiring minimum service from franchise haulers would not be compatible
with existing programs and would require a significant effort on City staff to administer and enforce the
adjusted program requirements.
11.5.2 Expand Green Business Certification Program
Overview. The City currently has 16 participants in the program that have been certified a green business.
Expanding this program to increase the number of certified businesses and increasing the offering of the
100 While increased vehicle emissions should be considered, the environmental benefit of avoided disposal from
recycling single-stream items and composting organics typically outweighs increased emissions from vehicles;
however, this would need to be further evaluated to quantify the environmental benefits specific to the City’s
system.
DRAFT
LSWMP Update Multi-Family and Commercial
City of Dallas, Texas 11-27 Burns & McDonnell
programs to provide technical assistance would support the other initiatives to increase diversion from the
commercial sector. Technical assistance programs include initial consultation for setting up a successful
recycling program as well as evaluating existing recycling programs for improvement. Services include
identifying materials generated to be diverted and providing a pathway for successful collection, storage,
and transfer of materials. Programs typically include the following activities:
• Waste audits to assess the waste stream;
• Identify haulers of recyclables;
• Develop collection infrastructure (e.g., collection areas, enclosures); and
• Develop employee and/or tenant educational materials.
Guidance and support from the City can shape proper participation and positive recycling program
engagement for commercial generators which increases customer satisfaction and enables progress toward
the City’s goals. Additionally, the City could leverage cross-department collaboration between the
Sanitation Department, OEQS, Development Services and code compliance to expand the capacity to
provide technical assistance and support the enforcement efforts related to future adjustments to the
franchise hauler permit requirements. Oftentimes, commercial entities have a desire to implement a
recycling program but lack the knowledge, time, or resources to initiate a program. Expanding to include
technical assistance would assist generators with proper recycling program engagement and the awards and
recognition would continue to reinforce and encourage the desired activities by the commercial generators.
Diversion Recycling potential. Expanding the program to include more dedicated technical assistance as
a cross-departmental effort would increase the number of diversion programs developed by commercial
entities and support adjustments to requirements from franchise haulers to collect and divert material from
generators.
Operational impact. Although expanding the program to provide technical assistance would require more
resources, if the City could capture synergies by expanding the program as a cross-departmental effort
among the Sanitation Department, OEQS, Development Services and code compliance the additional
efforts could be spread across departments to minimize the operational impact of expanding the program.
An example would be to leverage code compliance inspectors and sanitarians to identify businesses that
are interested in receiving technical assistance to divert as part of their recurring inspections so that OEQS
would not have to contact each business individually and could take a more targeted, focused approach.
Another example would be to leverage code compliance inspectors that issue certificates of occupancy to
identify businesses that are interested in receiving technical assistance.
DRAFT
LSWMP Update Multi-Family and Commercial
City of Dallas, Texas 11-28 Burns & McDonnell
Financial impact. The City would need to dedicate more resources to expand the program, but if the City
could capture synergies by expanding the program as a cross-departmental effort among the Sanitation
Department, OEQS, Development Services and code compliance the additional efforts could be spread
across departments to minimize the financial impact.
Environmental impact. By expanding the program, more businesses would establish diversion programs
and ultimately divert more material from disposal, allowing the City to realize environmental benefits from
the avoided disposal.
Policy impact. There is no policy impact to expanding the program.
Stakeholder “buy-in”. Since this program would be expanded on a voluntary basis, businesses would have
a high level of “buy-in” compared to more mandatory policy approaches.
Compatibility with existing programs. Expanding the program is highly compatible with existing the
existing program.
11.5.3 Implement Targeted Commercial Diversion Requirements
Overview. Implementing commercial diversion requirements can be contentious because it places a burden
on generators and/or haulers, but would support increasing material diversion from disposal. Any
commercial diversion requirements should be targeted given the wide variety of businesses and materials
in the City. Diversion requirements would ultimately target commercial generators, but there would be
challenges setting quantitative diversion requirements because (1) the City does not have a comprehensive
baseline of the volume and type of material collected or where material flows; and (2) there is limited
processing capacity available to divert recycling and organics.
For these reasons, the City would only be able to implement targeted commercial diversion requirements
after adjusting franchise hauler permit requirements, expanding the Green Business Certification program
to include technical assistance, receiving comprehensive collection, disposal and diversion reports from
franchise haulers and confirming there is sufficient processing capacity in the region to divert material.
Taking these critical steps first will provide the data to create the framework for how a targeted commercial
diversion program would take shape by identifying the volume of divertible materials that are currently
collected and where the material currently flows. Additionally, requiring haulers to offer diversion service
would support them to justify making the business decision to develop additional processing capacity that
would ultimately support the implementation of targeted commercial diversion requirements. At this point,
DRAFT
LSWMP Update Multi-Family and Commercial
City of Dallas, Texas 11-29 Burns & McDonnell
the City could consider the benefits of developing an exclusive or zoned franchise system to support the
implementation of a mandatory targeted commercial diversion requirement.
With these first steps in place, the City would be able to develop a phased approach to implementing
commercial diversion requirements of businesses that generate high quantities of divertible material, are
over a certain size (in terms of either square footage or number of employees), or are in areas with high
route density (e.g., downtown as compared to outlying areas of the City).
Recycling potential. Implementing commercial diversion requirements would increase the diversion
potential to capture more material from the commercial generators, but may cause a corresponding increase
in contamination.
Operational impact. It is critical that any commercial diversion requirements placed on generators take
into account the operational impact on businesses, particularly small businesses or those that lease space,
since the property owner/landlord may restrict the type of materials that their organizations are allowed to
recycle. Additionally, if operational decisions are determined through a business’ corporate office and is
not managed at the local level, complying with any potential requirements or changing service providers
may be challenging. From the City’s perspective, there would be a significant increase in the outreach, data
collection, data verification, and enforcement responsibility and would require additional resources are
hired or dedicated to administering the program.
Financial impact. Similar to the operational impacts, there would be a significant financial impact on
businesses that are not equipped to separately manage recycling or organics although the financial impacts
may be mitigated based on the schedule for phasing in the requirements. If there is a long lead time,
businesses may have the opportunity to prepare for the requirements and identify solutions to come into
compliance in a cost-effective way. From the City’s perspective dedicating the resources required to
administer and enforce requirements would be a consistent challenge, particularly related to educating
affected businesses of new requirements and verifying data received.
Environmental impact. There would be increased vehicle traffic to separately collect material for
diversion, but depending on the phasing schedule the volume of diverted material may offset the negative
environmental impact of increased vehicle emissions.
Policy impact. There would be a significant policy impact related to a targeted commercial diversion
requirement including requiring businesses to comply by ordinance and potentially adjusting the existing
non-exclusive franchise system to an exclusive or zoned system.
DRAFT
LSWMP Update Multi-Family and Commercial
City of Dallas, Texas 11-30 Burns & McDonnell
Stakeholder “buy-in”. Targeted commercial diversion requirements would be mandatory and there would
likely be low stakeholder buy-in among the business community. Without the buy-in from the business
community, there would likely be increased contamination among the covered entities. However,
environmental groups would support the requirements because they would divert a high volume of material
from disposal.
Compatibility with existing programs. Targeted commercial diversion requirements would require
significant changes to the current programs and how City departments interact with entities in the business
sector. There is a low level of compatibility with the current program.
11.6 Key Findings and Recommendations
This section presents a summary of the options evaluation followed by key findings and recommendations
related to program and policy approaches to increasing diversion from the City’s multi-family and
commercial sectors. Depending on the specific option and/or tactic, the evaluation may include both
quantitative and qualities assessments which support the assigned relative ratings for the criteria of each
tactic. The meaning of the rating differs for each option and/or tactic but can generally be described as
“green circle is favorable or low impact,” “yellow triangle is neutral or medium impact,” and “red square
is less favorable or higher impact.” Further description of the criteria is provided in Section 1.4.3. Table
11-11 summarizes the results of the options evaluation for each of the tactics presented.
DRAFT
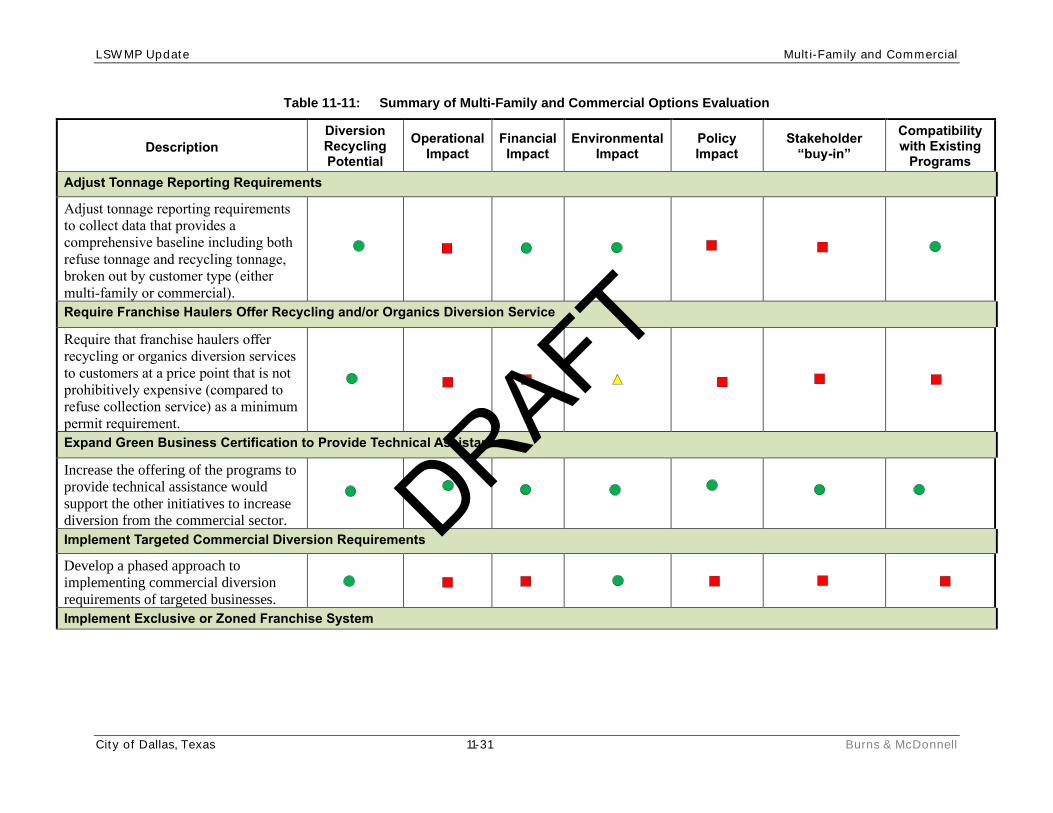
LSWMP Update Multi-Family and Commercial
City of Dallas, Texas 11-31 Burns & McDonnell
Table 11-11: Summary of Multi-Family and Commercial Options Evaluation
Description
Diversion Recycling Potential
Operational Impact
Financial Impact
Environmental Impact
Policy Impact
Stakeholder “buy-in”
Compatibility with Existing
Programs
Adjust Tonnage Reporting Requirements
Adjust tonnage reporting requirements
to collect data that provides a
comprehensive baseline including both
refuse tonnage and recycling tonnage,
broken out by customer type (either
multi-family or commercial).
Require Franchise Haulers Offer Recycling and/or Organics Diversion Service
Require that franchise haulers offer
recycling or organics diversion services
to customers at a price point that is not
prohibitively expensive (compared to
refuse collection service) as a minimum
permit requirement.
1
Expand Green Business Certification to Provide Technical Assistance
Increase the offering of the programs to
provide technical assistance would
support the other initiatives to increase
diversion from the commercial sector.
Implement Targeted Commercial Diversion Requirements
Develop a phased approach to
implementing commercial diversion
requirements of targeted businesses.
Implement Exclusive or Zoned Franchise System
DRAFT
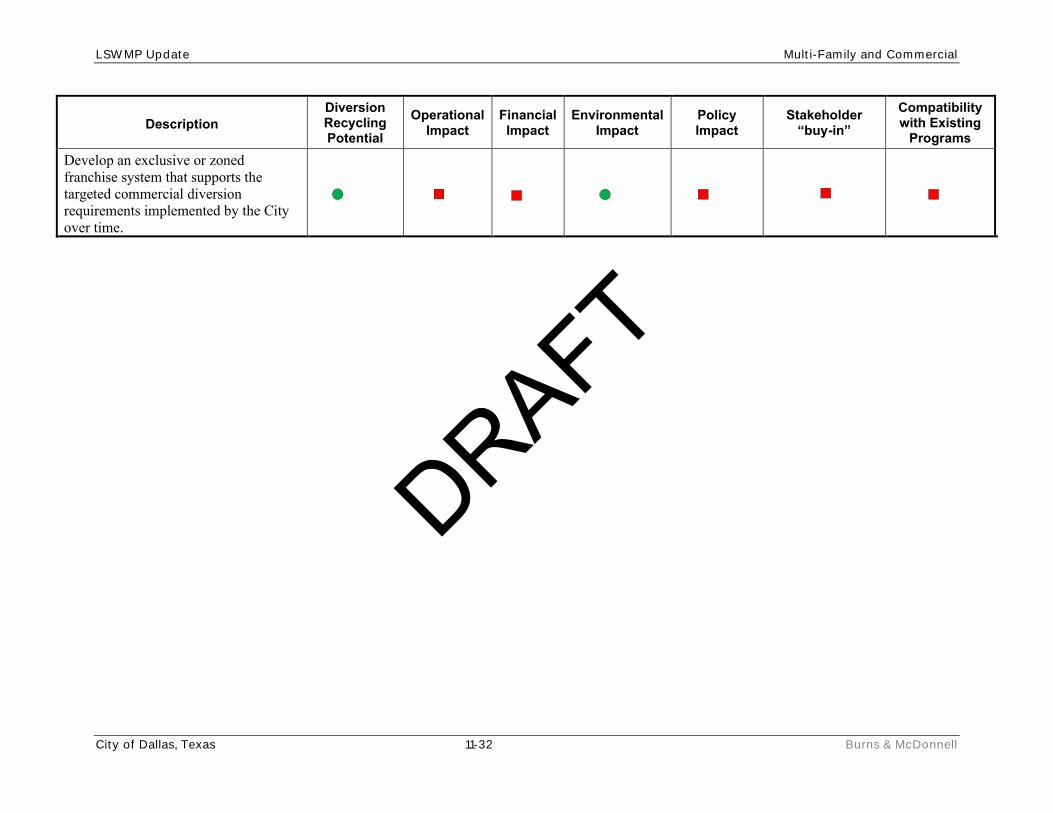
LSWMP Update Multi-Family and Commercial
City of Dallas, Texas 11-32 Burns & McDonnell
Description
Diversion Recycling Potential
Operational Impact
Financial Impact
Environmental Impact
Policy Impact
Stakeholder “buy-in”
Compatibility with Existing
Programs
Develop an exclusive or zoned
franchise system that supports the
targeted commercial diversion
requirements implemented by the City
over time.
DRAFT
LSWMP Update Multi-Family and Commercial
City of Dallas, Texas 11-33 Burns & McDonnell
11.6.1 Key Findings
Each of the following key findings supports the corresponding recommendation in the subsequent section.
1. The MFRO implemented is critical step toward increasing diversion in the multi-family and
commercial sector. The data reporting mechanism and requirements of multi-family property
owners/managers and permitted recycling haulers provides a policy platform the City can leverage
to divert more material from the multi-family and commercial sector.
2. There are opportunities to require more comprehensive reporting from franchise haulers.
While the City receives some data, having a comprehensive data set of multi-family and
commercial refuse, recycling and other divertible tons collected and the facilities where material is
processed or disposed would support future efforts to increase the City’s diversion rate.
3. The Green Business Certification program provides an excellent platform to support
diversion from commercial sector generators. Although there are currently only 16 businesses
certified, the City will continue to expand the number of participants in the program over time, and
can leverage the program to build cross-departmental capacity to provide technical assistance
services.
4. There is significant diversion potential from the multi-family and commercial sectors, but
limited processing infrastructure to effectively divert material from disposal. Although there
is an estimated 633,000 tons of divertible material currently delivered to the Landfill on an annual
basis, there would be insufficient processing capacity to divert this material if it were required to
be diverted.
11.6.2 Recommendations
Each of the following recommendations are components of the planning level Implementation & Funding
Plan provided in Appendix F.
1. Maintain the MFRO and continue to increase the percentage of covered entities in compliance
year-over-year. Continue to implement and increase the compliance from generators and haulers
as part of the MFRO, monitoring new developments that come online and continuing to support
affected entities with education and outreach.
2. Adjust franchise and permitted recycling hauler reporting requirements to include more
comprehensive tonnage data reports. Require the submission of more comprehensive data to
include refuse, recycling and other divertible tonnages currently collected and the location with
they are processed and disposed.
DRAFT
LSWMP Update Multi-Family and Commercial
City of Dallas, Texas 11-34 Burns & McDonnell
3. Require franchise haulers offer recycling and organics diversion services. After the
requirements of franchise hauler reporting has been implemented and analyzed, determine the
requirements for haulers to offer diversion services to customers and establish the enforcement
mechanisms to ensure that this maintains a level playing field among franchise haulers. The City
should consider incentivizing haulers to recycle by providing credits on franchise fees for haulers
that recycle single-stream and/or organic materials.
4. Expand the Green Business Certification to provide technical assistance leveraging cross-
departmental synergies. Expanding this program to increase the number of certified businesses
and increasing the offering of the programs to provide technical assistance would support the other
initiatives to increase diversion from the commercial sector. Additionally, leveraging cross-
department collaboration between the Sanitation Department, OEQS, Development Services and
code compliance would expand the capacity to provide technical assistance and capture efficiencies
by spreading the demand on staff time across multiple departments and streamlining efforts.
5. Implement targeted commercial diversion requirements on a phased basis. After adjusting the
franchise and permitted recycling hauler requirements and ensuring that the available processing
capacity for recycling and organics diversion would support increased tonnage, determine the
threshold of material generation quantity, facility size (square footage) or business size (number of
employees) that would make the most impact on the City’s diversion recycling rate as part of a
phased approach, where more generators are included over time and are required to contract with
franchise haulers to divert material.
6. Consider exclusive or zoned franchise system to support targeted commercial diversion
requirements. Implementation efforts of targeted commercial diversion requirements may receive
pushback from the hauler community indicating that requirements minimize their ability to achieve
efficiencies related to route density and significantly increase their cost to provide service while
prohibiting them from increasing rates for certain services. Over time, establishing an exclusive or
zoned franchise system that establishes geographic areas where service is provided to commercial
generators based on the existing customer base and location of processing infrastructure would
support the implementation of targeted commercial diversion requirements.
DRAFT
LSWMP Update HHW and Electronics Management
City of Dallas, Texas 12-1 Burns & McDonnell
12.0 HHW AND ELECTRONICS MANAGEMENT
The purpose of a HHW and electronics management program is to provide residents with access to safe and
proper disposal options for household materials that are not suitable for disposal in a landfill or for
collection with other curbside residential programs. Local provision of convenient HHW and electronics
disposal options decreases the potential for improper disposal of material or illegal dumping of
environmentally harmful materials101.
As part of the LSWMP Update, City staff visited the HCCC to review operations and have discussions with
County management. This section presents information and analysis regarding HHW and electronics
management
12.1 Current System Review
This section reviews the City’s HHW and electronics management programs including the HCCC facility
and the City’s Battery, Oil, Paint and Antifreeze (BOPA) mobile collection program.
Dallas County began offering a regional program for the collection of HHW and electronics in 1997 and
has owned and operated its permanent HCCC since 2002. Reference Appendix B showing the location of
the HCCC among the other facilities in the region. The HCCC is located in the northeast area of the City at
11234 Plano Rd, Dallas, TX 75243 and sits on three quarters of an acre of land accepts residential customers
three days per week on Tuesdays, Wednesdays and Thursdays and two Saturdays per month. Figure 12-2
shows the Dallas County HCCC.
101 Reference Section 1.2.1 for further description on the usage of HHW and electronics material and the HCCC
throughout the LSWMP Update.
DRAFT
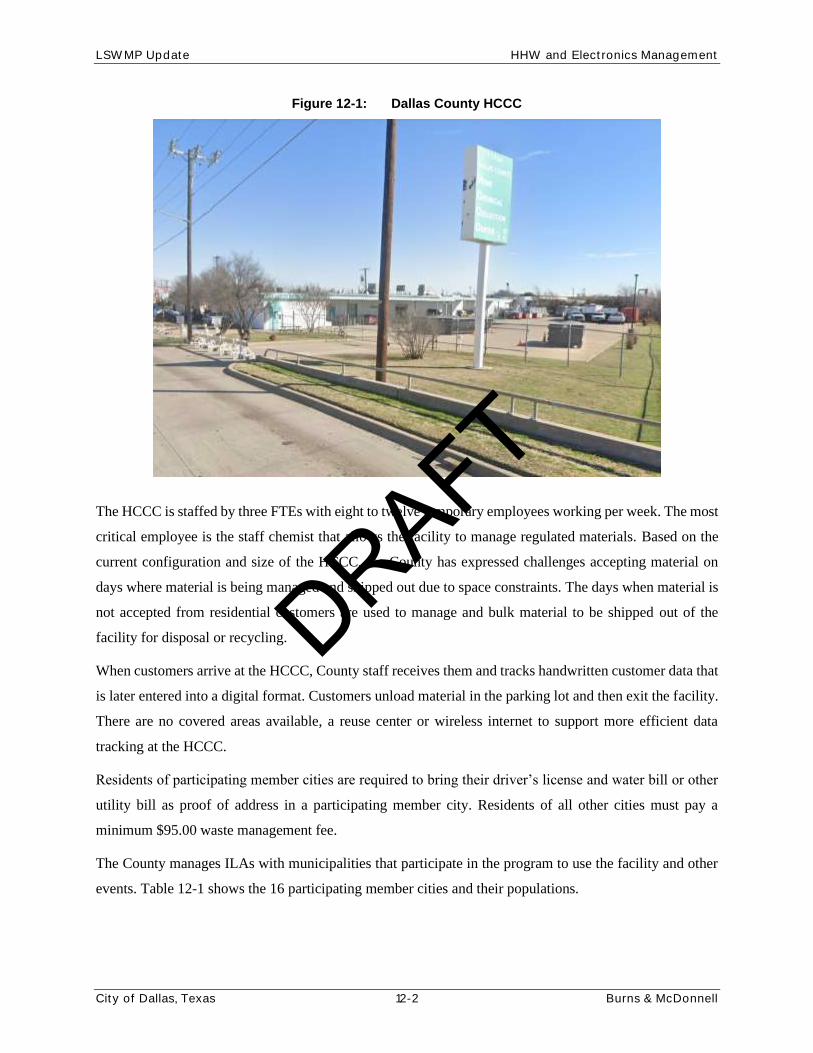
LSWMP Update HHW and Electronics Management
City of Dallas, Texas 12-2 Burns & McDonnell
Figure 12-1: Dallas County HCCC
The HCCC is staffed by three FTEs with eight to twelve temporary employees working per week. The most
critical employee is the staff chemist that allows the facility to manage regulated materials. Based on the
current configuration and size of the HCCC, the County has expressed challenges accepting material on
days where material is being managed and shipped out due to space constraints. The days when material is
not accepted from residential customers are used to manage and bulk material to be shipped out of the
facility for disposal or recycling.
When customers arrive at the HCCC, County staff receives them and tracks handwritten customer data that
is later entered into a digital format. Customers unload material in the parking lot and then exit the facility.
There are no covered areas available, a reuse center or wireless internet to support more efficient data
tracking at the HCCC.
Residents of participating member cities are required to bring their driver’s license and water bill or other
utility bill as proof of address in a participating member city. Residents of all other cities must pay a
minimum $95.00 waste management fee.
The County manages ILAs with municipalities that participate in the program to use the facility and other
events. Table 12-1 shows the 16 participating member cities and their populations.
DRAFT

LSWMP Update HHW and Electronics Management
City of Dallas, Texas 12-3 Burns & McDonnell
Table 12-1: Participating Member Cities in Dallas County ILA
Member City Population
Dallas 1,331,000
Irving 239,783
Garland 238,418
Mesquite 143,456
Richardson 116,432
Rowlett 63,793
De Soto 53,090
Duncanville 39,415
Farmer's Branch 39,039
Sachse 25,607
Seagosville 16,514
Addison 15,302
Highland Park 9,168
University Park 9,168
Sunnyvale 6,484
Wilmer 4,383
Participating cities are billed on a monthly basis after actual costs are assessed. Costs for each city are
divided into operating costs, based on the member city’s population, and disposal costs, based on the city’s
actual participation for each billing period.
Both the City and County host mobile collection events for HHW and electronic materials. The County
provides two turn-key events per year for member cities that are located in the southern part of the County.
The City hosts BOPA mobile collection events and support HHW collection events held by the Code
Compliance department. The material collected during HHW collection and BOPA events is delivered to
the HCCC. Figure 12-2 shows the mobile BOPA event vehicles used to collect and manage material
delivered during events.
DRAFT
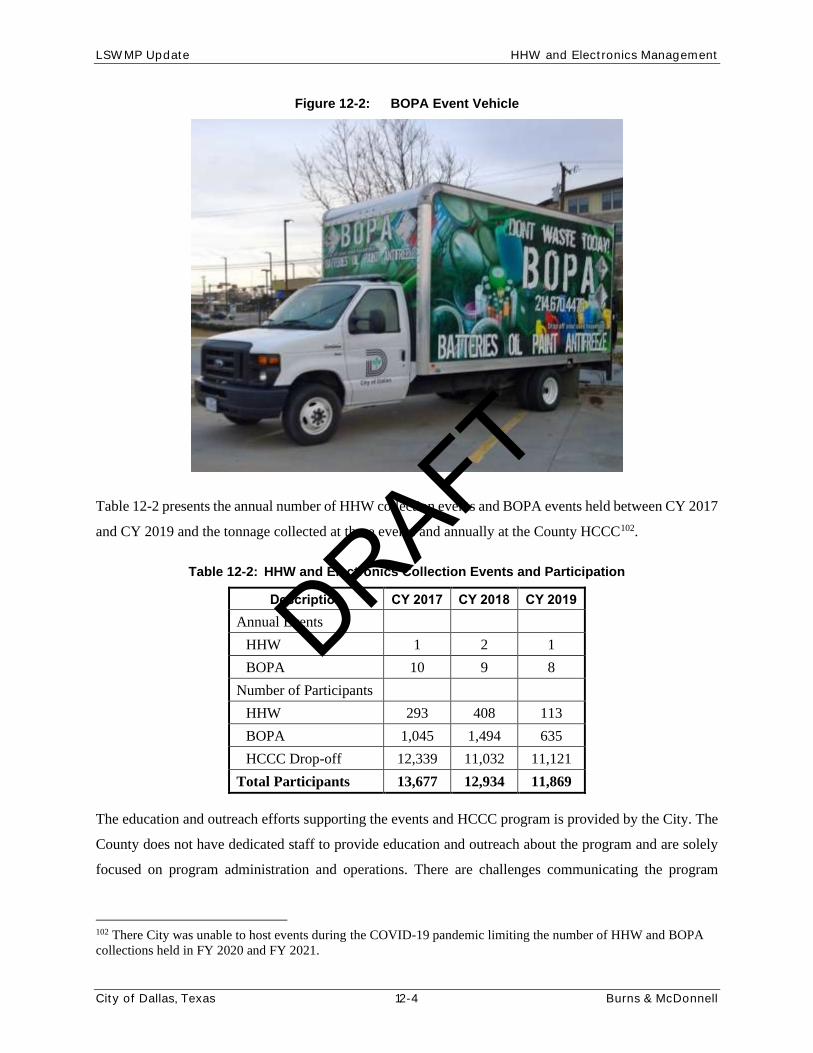
LSWMP Update HHW and Electronics Management
City of Dallas, Texas 12-4 Burns & McDonnell
Figure 12-2: BOPA Event Vehicle
Table 12-2 presents the annual number of HHW collection events and BOPA events held between CY 2017
and CY 2019 and the tonnage collected at these events and annually at the County HCCC102.
Table 12-2: HHW and Electronics Collection Events and Participation
Description CY 2017 CY 2018 CY 2019
Annual Events
HHW 1 2 1
BOPA 10 9 8
Number of Participants
HHW 293 408 113
BOPA 1,045 1,494 635
HCCC Drop-off 12,339 11,032 11,121
Total Participants 13,677 12,934 11,869
The education and outreach efforts supporting the events and HCCC program is provided by the City. The
County does not have dedicated staff to provide education and outreach about the program and are solely
focused on program administration and operations. There are challenges communicating the program
102 There City was unable to host events during the COVID-19 pandemic limiting the number of HHW and BOPA
collections held in FY 2020 and FY 2021.
DRAFT

LSWMP Update HHW and Electronics Management
City of Dallas, Texas 12-5 Burns & McDonnell
requirements and services provided to the City’s residents among the various City-operated events and
County operated HCCC facility. The key challenge is communicating which materials are accepted among
the various events and HCCC facility, especially as the types of HHW and electronics continually change
over time (e.g., increasing volumes of lithium-ion batteries that have limited recycling outlets).
Materials accepted at the City-hosted events and the County HCCC are not identical because HHW and
BOPA events do not have an on-site chemist. include the following items and tonnages delivered by City
residents. Table 12-3 describes the accepted materials, indicating if they are accepted at City-hosted events
and presents the FY 2020 tons collected.
Table 12-3: Accepted Material Descriptions at HCCC and City-Hosted Events
Accepted Materials Description FY 2020 Tons
Collected
Flammables
Flammable materials such as gas-aerosols, cylinders,
gasoline, diesel, kerosine, paint thinner, adhesives, roofing
tar, fiberglass, resin, rust removers, charcoal.
81
Corrosives Corrosive acids and bases such as bleach and cleaners. 28
Oxidizers Oxidizers such as pool chemicals and hydrogen peroxides. 8
Pesticides, Herbicides,
Fertilizers
Toxic materials such as pesticides, herbicides, fertilizers,
and paint strippers. 112
Batteries All types of batteries. Batteries are accepted at HHW and
BOPA events. 17
Automotive Fluids Non-regulated oil and antifreeze. Automotive fluids are
accepted at HHW and BOPA events. 41
Oil Filters Non-regulated oil filters. Oil filters are accepted at HHW
and BOPA events. 3
Paint Oil and latex-based paint and paint related material. Paint is
accepted at HHW and BOPA events. 809
Used Electronics Used electronics such as computers, cell phones, and other
small electronics. 62
Compact Fluorescent
Lamps and Mercury-
Containing Material
Toxic materials such as mercury containing light bulbs,
thermostats, and elemental mercury. 8
Other
Non-flammable gas and other non-regulated materials such
as asbestos, helium, oxygen, carbon dioxide cylinders and
other miscellaneous materials. Other materials are accepted
at HHW and BOPA events if they are able to be handled
without an on-site chemist.
55
Total 1,224
DRAFT
LSWMP Update HHW and Electronics Management
City of Dallas, Texas 12-6 Burns & McDonnell
Acceptance of these materials at the HCCC serves to minimize litter and illegal dumping of material. In
2018 the City completed the Litter and Illegal Dumping Assessment Study which provided
recommendations for how the City can implement a more strategic and preventative approach to combatting
litter and illegal dumping including:
• Develop a geographically-focused approach
• Improve local/regional collaboration
• Implement proactive and preventative methods
• Increase community engagement and public education
• Reduce illegal dumping from construction activities and commercial sources
• Enhance enforcement of litter and illegal dumping policies.
Since the development of this study, the City has advances some, but not all of the recommendations
provided.
Table 12-4 shows the annual costs charged to the City by the County, where the operational costs are based
on the number of City residents that use the facility and the disposal costs are the expenses incurred for
managing and disposing HHW and electronics material.
Table 12-4: Annual Dallas County HCCC Program Costs1
Description FY 2018 FY 2019 FY 2020
Operational
Cost
$380,693 $378,780 $378,744
Disposal
Costs
$530,078 $542,624 $564,797
Total $910,771 $921,404 $943,541
1. Costs are only reflective of costs incurred as part of the ILA, and not
staff or equipment costs for hosting HHW or BOPA events.
Based on the annual operating and disposal costs as part of the ILA, the cost per participant is estimated at
$84103.Based on a recent evaluation of cost of the City’s services, there is about $1,250,000 in expenses
required to manage HHW and electronics including payment to the County as part of the ILA and City
resources required to host and support HHW and BOPA events. The additional dollars above the payment
to the County include staff costs to administer, train staff and drivers and attend HHW and BOPA mobile
collection.
103 Cost per participant figure calculated by dividing the FY 2020 cost of $943,541 by the 11,121 residents that
utilized the HCCC in CY 2019
DRAFT
LSWMP Update HHW and Electronics Management
City of Dallas, Texas 12-7 Burns & McDonnell
Electronics and other types of materials are accepted at the Landfill’s Customer Convenience and Recycling
Center (CCRC) and facilities among the transfer station system. Further description of the CCRC and
materials accepted are provided in Section 8.0 and Appendix E. Further description of electronics and other
materials accepted at transfer stations is provided in Section 5.0 and Appendix C.
12.2 Case Studies and Benchmarking
This section provides descriptions of programs or operational considerations from peer cities that would
support the City’s long-term planning needs related to the future of refuse and recycling collection. The
following sections provide perspective about the following topics, and is organized as follows:
• Program types and participation rates
• Curbside collection
• Facility expansions
12.2.1 Program Types and Participation Rates
Table 12-5 compares the program types, service frequency and participation rates of benchmark cities
followed by additional of each benchmark city’s HHW collection programs facilities, events, fee model
and annual program costs. The following benchmark cities were selected to provide an understanding of
programs that are both larger and smaller than the City’s, and program that have a permanent facility only,
events only and a combination of the two.
Table 12-5: Benchmarking Cities Programs and Days of Service
Description Dallas, TX Fort Worth, TX1 Frisco, TX
Residential Customers 250,000 238,738 86,0882
Service Frequency Year-round Year-round Year-round
Type of Service Permanent Facility/
Collection Events
Permanent Facility/
Collection Events
Permanent Facility/
Collection Events
Days of Service T, W, Th Th, F, S W, S
Annual Participants 11,869 16,789 12,913
Participation Rate 4.8% 7.0% 15.0%
1. Fort Worth residential customers based on single-family residents and annual participants reflects only
Fort Worth residents that utilize the Environmental Collection Center, although there are residents from
Arlington, Grand Prairie, Grapevine, Keller and other cities that deliver material to the facility.
2. Includes all households in Frisco, Prosper, Little Elm, Melissa, Celina and Anna provided by the City of
Frisco.
Fort Worth, TX. The City of Fort Worth operates a permanent Environmental Collection Center (ECC)
drop-off facility that allows residents of Fort Worth and 52 participating cities to dispose of hazardous and
electronic waste. The ECC is open Thursdays from 11am to 7pm, Fridays from 11am to 7pm and Saturdays
DRAFT
LSWMP Update HHW and Electronics Management
City of Dallas, Texas 12-8 Burns & McDonnell
from 9am to 3pm. Additionally, Fort Worth hosts 75 mobile collection events per year. Additionally, the
program includes facilitating mobile collection events in partner cities and the option for partner cities to
perform their own door-to-door collection or mobile collection and subsequently drop off materials at the
City of Fort Worth’s permanent facility. The program utilizes a voucher system, billing participating cities
on a quarterly basis for the actual number of vouchers used during the billing period. Additionally, Fort
Worth has three drop off stations that accept HHW and electronics material from residents that is transferred
to the ECC. Based on a recent evaluation of the Forth Worth’s cost of service, the total annual cost to
operate the ECC is about $1,938,500, where Fort Worth residents represent $796,000 of the total annual
cost, or $47 per participant. Overall at Forth Worth’s ECC, the annual cost per ton to manage all materials
(including non-Fort Worth resident tons) delivered is about $917 per ton compared to the City’s $771 per
ton.
Frisco, TX. The City of Frisco operates a Household Chemical Disposal facility for its residents and
residents of surrounding cities that have entered into a partnership to use the facility. The facility is open
Wednesdays from 2pm to 5pm (extended to 6pm during the summer) and Saturdays from 8am to 1pm. The
facility accepts HHW and electronic waste from residents presenting a water bill and driver’s license (or
vouchers104). The annual cost to operate the facility and programs in 2020 was $335,700, or $26 per
participant. Frisco proactively minimizes the cost of disposal of HHW material collected by working with
Habitat for Humanity and Smarter Sorting to provide equipment, data management, and HHW reuse and
recycling services. The equipment provided by Habitat for Humanity is used to organize material and
software provided by Smarter Sorting is used to track the processing and reuse of HHW material handled
to minimize disposal costs.105 Figure 12-3 shows the scanning and weighing equipment used to process and
handle HHW material.
104 The City provides vouchers for residents from partnering cities use the Household Chemical Disposal facility for
$50 per year. 105See more information about Smarter Sorting here: https://www.smartersorting.com/
DRAFT
LSWMP Update HHW and Electronics Management
City of Dallas, Texas 12-9 Burns & McDonnell
Figure 12-3: Smarter Sorting Scanning and Weighing Equipment
12.2.2 Curbside Collection
A municipality may contract with a service provider that collects material directly from residents’ homes.
As with other contract curbside collection services, at-your-door collection service is most feasible in areas
with higher population densities. Specific service terms are negotiated between the private hauler and the
contracting municipality. Service frequencies typically vary from once per month to unlimited service
requests and may be provided on set service days or via a call-in program.
The primary consideration for an at-your-door HHW collection service is the monthly cost impact to
residents. Typically, costs for this type of service are assessed on a per household per month basis and are
included as a component of a resident’s monthly solid waste and recycling services bill. Based on
discussions with national haulers that offer this service, a cost of $1.00 per household per month is an
appropriate planning-level cost for an at-your-door HHW and electronics collection services (once per
month to unlimited collection frequency). However, this cost may be higher in less densely populated areas
of the City.
There are several peer cities that have incorporated curbside collection of HHW and electronic materials.
The Cities of Plano and Allen have implemented curbside collection program where the material is collected
by a contract service provider. Additionally, the City of Addison collects HHW and electronics material
from residents and brings the material to the Dallas County HCCC.
To understand what actual program costs would be and if any haulers would offer this service in the
Planning Area, the City would need to release a RFP to obtain pricing and confirmation that the service
DRAFT
LSWMP Update HHW and Electronics Management
City of Dallas, Texas 12-10 Burns & McDonnell
could be procured. Then, if a service provider were responsive, the cost for this service would need to be
communicated to residents to understand the likely level of participation in the program to evaluate the full
cost impact to the City.
In response to the COVID-19 pandemic and temporary closure of its permanent HHW and electronics
management facility, the City of Austin has been providing door-to-door collection on a call-in basis to all
residents. The call-in service utilizes a pick-up truck to serve a limited number of single- and multi-family
residents each day, with collections scheduled based on location for routing efficiency. Based on discussion
with City staff, the number of customers that can be served is currently limited by collection vehicle space
and additional staff. The program has proven successful and has remained cost-effective for Austin and the
City is considering expanding the program due to the positive feedback generated by stakeholders.
12.2.3 Facility Expansions and Relocations
This section provides descriptions of municipalities that have permanent HHW and electronics collection
facilities that are considering expanding or relocating.
As described in Section 12.2.1, the City of Frisco has a 15 percent participation rate and faces challenges
managing the volume of customers and tonnage of HHW and electronics received. In anticipation of the
growing number of customers due to expected population growth, the City is relocating its Household
Chemical Disposal, reuse center, and office space to a larger location in the City. The new facility is
intended to be co-located with a solid waste transfer station and will allow the City to manage growing
demand for HHW and electronics collection going forward.
Johnson County, Kansas has a population of 600,000 and owns and operates a permanent HHW and
electronics collection facility. The facility operates year-round and is available for all residents of the
county. Additionally, the City of Olathe, located within the boundaries of Johnson County, also owns and
operates a year-round, permanent HHW facility for city residents. The two facilities are located on opposite
ends of the County to provide the most convenient access to customers. The County provides funding to
the City of Olathe to allow for residents from anywhere in the County to also drop off at the Olathe facility
which provides a convenient drop off location in both the northern and southern areas of the County. Both
facilities process relatively the same amount of material annually. The County facility is in the process of
being relocated to increase the capacity while allowing the program hours of operation and staffing to
remain consistent with the current operation.
The City of Kansas City, Missouri owns and operates a permanent year-round HHW facility. The facility
serves a three county region including dozens of participating municipalities. The program also hosts twelve
satellite collection events around the community each year. The City’s permanent facility is aging and,
DRAFT
LSWMP Update HHW and Electronics Management
City of Dallas, Texas 12-11 Burns & McDonnell
similar to the Dallas County HCCC, is struggling to manage growing service demand. The City is in the
process of evaluating its program to develop an understanding of what facility assets are acceptable for use
or in need of repair replacement over the next several years, to determine an appropriate cost of services
for Kansas City, Missouri and their stakeholders and to review the safety and efficiency of the facility.
12.3 Options Evaluation
This section analyzes a series of options related to the HHW and electronics management that have been
identified based on the current system review, stakeholder engagement, evaluation of recommendations
from the 2011 LSWMP, and benchmarking.
The following summarizes the key takeaways from the community survey and other outreach activities
conducted as part of the LSWMP Update.
• 55 percent of respondents indicated that they use the HCCC facility once or twice per year and 36
percent of respondents indicated that they participate in HHW and BOPA events once or twice per
year.
• 45 percent of respondents indicated that the location and operating hours were prohibitive or very
prohibitive and negatively impacted their willingness and ability to utilize the HCCC.
• 66 percent of respondents indicated they would be supportive or very supportive of a more
conveniently located HCCC and 60 percent of respondents indicated they would be supportive or
very supportive of at-home collection.
• 57 percent of respondents indicated they would support a monthly rate increase of at least $1.00 to
have enhanced service levels of HHW and electronics management.
Further information about the methodology of the stakeholder engagement is described in Section 1.0 and
the comprehensive detailed results are provided in Appendix A.
The following presents options that are evaluated in the following sections including a brief description of
the option and evaluation approach:
• Enter new agreement with County. Evaluates the impact of entering into a new agreement with
the County with strategic adjustments to operations.
• Develop a new HCCC facility. Evaluates the needs and impact to develop a new HCCC facility
in partnership with the County to support meeting the long-term needs of the program participants.
• Increase number and materials accepted at HHW and BOPA collection events. Describes the
impact and considerations of expanding the material types accepted at HHW and BOPA events.
DRAFT
LSWMP Update HHW and Electronics Management
City of Dallas, Texas 12-12 Burns & McDonnell
Each of the following sub-sections provides an overview of the option and specific tactics and evaluates
the impact of each options’ components based on the following criteria, with brief descriptions:
Each of the following sections provide an overview of each option and specific tactics and evaluates the
impact of each options’ components based on the criteria detailed in Section 1.4.3. A high-level summary
of the evaluation criteria for each tactic within the options is provided in Section 12.4 to support the key
findings, recommendations and implementation and funding plan.
12.3.1 Enter New Agreement with County
Overview. This option would have the City enter into a one-year agreement with three one-year optional
extensions. This agreement would be similar to the existing ILA with adjustments to increase the receiving
hours at the HCCC, automate the data-tracking at the HCCC.
Recycling potential. Increasing the receiving hours would allow more material to be accepted and
ultimately recycled. This option would have a medium impact on recycling potential.
Operational impact. This option would have a high operational impact because increasing the receiving
hours at the HCCC would minimize the County’s ability to manage and ship out material during non-
receiving days and potentially limit the amount of material or customers that could be accepted at the HCCC
if there are challenges moving material for recycling or secure disposal. If the County were to automate
data tracking, it would minimize the administrative burden of data entry and analysis, but the current
operations do not have the infrastructure to implement this immediately (e.g., no wireless internet at the
HCCC or covered areas to receive customers).
Financial impact. This option has a medium financial impact because if the facility is open longer the
operating costs will be higher and if more City residents use the HCCC, the County will assess higher
operating and disposal costs. Automating data-tracking at the HCCC may require interim capital upgrades
including installation of wireless internet and a covered area to receive customers.
Environmental impact. There are low environmental impacts related to this option.
Policy impacts. As part of this option the City would need to develop and adopt a new contract with the
County, but otherwise has low policy impacts. Having the agreement structured similarly to the existing
ILA on a one-year basis ensures that the short-term needs of the City will be met but provides the flexibility
to explore other options to minimize future costs as the City continues to grow.
Stakeholder “buy-in”. There is medium stakeholder “buy-in” related to this option because even though
the County is open to expanding hours at the HCCC the decision is ultimately up to the member cities and
if they are willing to bear the cost of increasing the receiving hours.
DRAFT
LSWMP Update HHW and Electronics Management
City of Dallas, Texas 12-13 Burns & McDonnell
Compatibility with existing programs. There is high compatibility with the existing program because it
would require little changes to the current ILA program structure.
12.3.2 Develop New HCCC and/or Satellite Facility
Overview. This option includes developing a new HCCC facility or a satellite facility to increase the
accessibility for City residents since the current facility is not convenient for those located in the south areas
of the City. A satellite facility would be smaller than a larger facility but provide more convenient access
to City residents or member cities in the south area of the County where material is packed and transported
to the HCCC. A new HCCC or satellite facility would require a number of specialized building needs due
to the nature of the operation including a fully ventilated building, sprinkler system for fire suppression,
spill containment, adherence to fire codes for material storage capacity and traffic flow, adequate storage
area, and safety equipment (e.g., eyewash site, fire extinguishers, personal protective equipment). The
County is actively exploring the ability to fund a new HCCC facility and indicated they would look toward
the southwest area of the County in conjunction with their internal real estate team. A new facility would
include expanded receiving area, storage area, and potentially a reuse store.
Recycling potential. An expanded facility or satellite facility would have a medium impact on recycling
potential, since it would potentially allow for increased receiving hours and capability to accept materials
that are currently unable to be processed at the existing HCCC.
Operational impact. This option would have a low operational impact because the new facility would be
able to have more streamlined vehicle flow, more space to manage and ship materials, and the ability to
receive more customers. With a satellite facility to support a permanent HCCC, the County would have
more space at the permanent HCCC to accept customers since bulking and transferring material would be
completed at the satellite facility.
Financial impact. A new HCCC or satellite facility would have a high financial impact because of the
high capital costs for construction that would be passed along to participating member cities. Capital cost
estimates are not provided because there are several locations and/or configurations that may be considered
as part of a permanent facility (e.g., land purchase, site configuration) that could significantly alter the
capital cost requirements of a facility. Based on a recently constructed facility for Clay County, MN, the
capital costs could range from $1.5 to $5 million.
Environmental impact. With a new facility and/or satellite facility there would be less need for customers
to drive across the County to deliver materials. There would be a low environmental impact related to this
option.
Policy impacts. There would be a low policy impact related to this option.
DRAFT
LSWMP Update HHW and Electronics Management
City of Dallas, Texas 12-14 Burns & McDonnell
Stakeholder “buy-in”. There is high stakeholder “buy-in” because the development of a new facility or
satellite facility could be leveraged to attract new members to the ILA. Additionally, there is support from
City customers to pay a higher monthly rate for more convenient or expanded services.
Compatibility with existing programs. The construction of a new HCCC or satellite facility would take
time to design, procure and construct. If the current HCCC and program is able to remain operational during
construction, there would be high compatibility with the existing program.
12.3.3 Increase Number and Materials Accepted at HHW and BOPA
Collection Events
Overview. This option would increase the number of HHW and BOPA collection events and material types
that could be accepted at HHW and BOPA collection events to be consistent with the HCCC. Based on the
feedback from the stakeholder engagement, there is confusion among customers about which materials can
be accepted at the HCCC and which can be accepted at HHW and BOPA events and customers feel that
the current location of the permanent HCCC facility is prohibitively far. Increasing the number of events
would provide greater access to this service for customers that are located in the southern areas of the City
and potentially minimize illegal dumping in the City.
Recycling potential. Increasing the number of events accepted at the HHW and BOPA events would
increase the amount of material that could be recycled and would have a medium impact.
Operational impact. Increasing the number of events would potentially require additional staff to be
trained to operate HHW and BOPA events (including managing specialized materials and delivering
material to the HCCC). Increasing the number of materials accepted at HHW and BOPA events to include
the full list of material accepted at the HCCC would require a chemist present at the events. This option
would have a high operational impact.
Financial impact. Increasing the number of staff and equipment to host more events and hiring a dedicated
chemist to attend for each HHW or BOPA event would increase the cost to host these programs and have
a high financial impact. This would require a potentially significant budget increase to the program to
support bringing on additional staff and equipment.
Environmental impact. The increased amount of collection events would decrease the amount of driving
customers had to do to get to the HCCC and would have a low environmental impact.
Policy impacts. There would be a medium policy impact related to this option since the accepted materials
at City-hosted collection events would be adjusted. Additionally, the location of the additional events would
DRAFT

LSWMP Update HHW and Electronics Management
City of Dallas, Texas 12-15 Burns & McDonnell
need to be determined to ensure that they effectively increased access to services to those that are
prohibitively far from the existing HCCC facility.
Stakeholder “buy-in”. This option would have high stakeholder “buy-in” because there is support from
the residents to increase the number of HHW and BOPA events, even if it means increased monthly costs.
Compatibility with existing programs. This option has a medium compatibility with existing programs
because increasing the material types accepted at HHW and BOPA events would require programmatic
changes and additional staffing.
12.4 Key Findings and Recommendations
This section presents the key findings and recommendations related to program and policy approaches to
increasing the City’s ability to provide comprehensive HHW and electronics management services based
on the results of the overview, evaluation of case studies and stakeholder engagement. Depending on the
specific option and/or tactic, the evaluation may include both quantitative and qualities assessments which
support the assigned relative ratings for the criteria of each tactic. The meaning of the rating differs for each
option and/or tactic but can generally be described as “green circle is favorable or low impact,” “yellow
triangle is neutral or medium impact,” and “red square is less favorable or higher impact.” Further
description of the criteria is provided in Section 1.4.3. Table 12-6 provides a summary of HHW and
electronics management options evaluation.
DRAFT
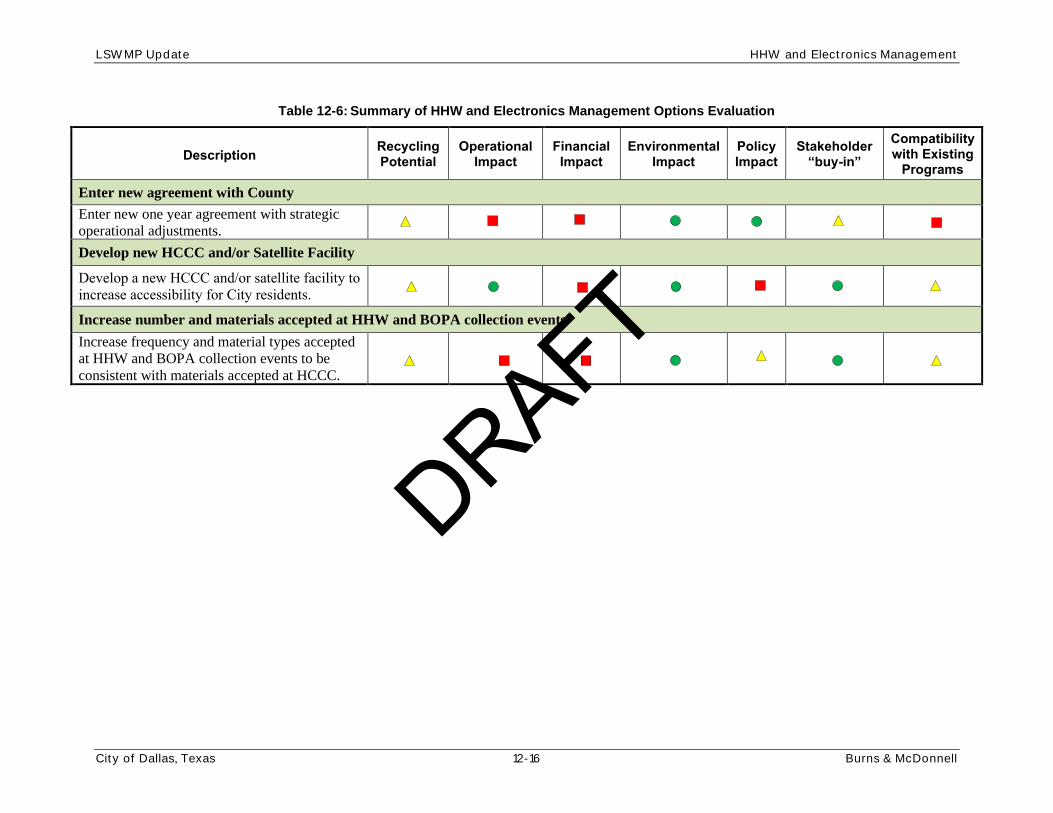
LSWMP Update HHW and Electronics Management
City of Dallas, Texas 12-16 Burns & McDonnell
Table 12-6: Summary of HHW and Electronics Management Options Evaluation
Description Recycling Potential
Operational Impact
Financial Impact
Environmental Impact
Policy Impact
Stakeholder “buy-in”
Compatibility with Existing
Programs
Enter new agreement with County
Enter new one year agreement with strategic
operational adjustments.
Develop new HCCC and/or Satellite Facility
Develop a new HCCC and/or satellite facility to
increase accessibility for City residents.
Increase number and materials accepted at HHW and BOPA collection events
Increase frequency and material types accepted
at HHW and BOPA collection events to be
consistent with materials accepted at HCCC.
DRAFT
LSWMP Update HHW and Electronics Management
City of Dallas, Texas 12-1 Burns & McDonnell
12.4.1 Key Findings
Each of the following key findings supports the corresponding recommendation in the subsequent section.
1. There are challenges providing comprehensive access to customers. Customers located in the
southern areas of the City struggle to have convenient access to service. Although there are mobile
collection events, the limited number of materials accepted at events makes it challenging for these
residents to dispose of all their material at one time.
2. The City has advanced some, but not all of the recommendations provided as part of the
Litter and Illegal Dumping Assessment Study. As the City considers options for the future of the
HCCC and BOPA programs, minimizing the amount of litter and illegal dumping activities is
critical to sustaining public health and community cleanliness.
3. There are increasing amounts of material that the existing HCCC is unable to recycle. As
material types change, there are more materials that the HCCC is unable to recycle cost-effectively
(e.g., lithium-ion batteries).
4. Other cities in the region are implementing curbside collection. Curbside collection of HHW
and electronics are being implemented by other cities in the region. This may be an approach the
City considers in the future but is not an approach that would be further considered at this time
given the existing program in place.
5. Participation rate of HCCC facility higher than other benchmark cities. The participation rate
of 4.7 percent is lower than benchmark cities, indicating that other programs attract a higher
percentage of its customers to utilize HHW and electronics collection facilities compared to the
City.
6. The cost per participant per year is higher than benchmark cities. The City’s cost per
participant per year is $84 for use of the HCCC, higher than Fort Worth ($74) and Frisco ($26)
program costs per participant per year.
7. There are challenges communicating program and service availability to customers. The
County does not provide education and outreach services to minimize confusion or mixed delivery
of information, but there are challenges communicating program and service offerings to customers
because the County operates the HCCC facility and multiple City department host mobile collection
events.
12.4.2 Recommendations
Each of the following recommendations are components of the planning level Implementation & Funding
Plan provided in Appendix F.
DRAFT
LSWMP Update HHW and Electronics Management
City of Dallas, Texas 12-2 Burns & McDonnell
1. Enter new one year contract with the County that includes three, one-year optional
extensions. Extending the current agreement in a similar structure to the existing ILA on a one-
year basis with multiple available extensions ensures that the short-term needs of the City will be
met but provides the flexibility to explore other options to minimize future costs as the City
continues to grow. Given that the cost per participant per year is higher than other benchmark
cities, the City should explore ways to minimize the annual operating or disposal cost components
of the agreement or seek other in-kind services from the County (e.g., marketing and
communications support) to bring all-in program costs in line with benchmark cities.
2. Explore the ability for the County to extend operating hours and automate data tracking and
analysis. Extending operating hours and automating data tracking would streamline operations at
the existing facility but may require capital upgrades including installation of wireless internet and
a covered area to receive customers.
3. Work with the County to increase materials that can be cost-effectively recycled to minimize
disposal costs. The City’s cost per participant is higher than peer cities in part because of the HCCC
is unable to recycle materials cost effectively and is required to dispose. The City should work with
the County to proactively establish recycling outlets for materials that are currently disposed to
minimizing disposal costs passed through as part of the ILA. This is challenging with the existing
space constraints at the HCCC, but may be more feasible at a new HCCC or satellite facility.
4. Collaborate with the County to identify locations where new HCCC or satellite facility could
be located in the southern part of the County. This collaboration should include working
together with the County and its stakeholders to establish the needs (e.g., challenges managing
service demand, rising operating costs, changing material types and recycling outlets) and benefits
(e.g., more convenient access for residents, managing costs over time) that would justify upgrading
the existing facility or developing a satellite facility. A key consideration is to ensure current
participating members support the approach and understand the benefits to their residential
customers.
5. Coordinate with the County to support increasing frequency and materials accepted at HHW
and BOPA events. The key challenges to increasing the frequency of events is the additional cost
of equipment and staff time. The key challenges to increasing the materials accepted at events is
the requirements to have a chemist on site and additional staff training. The City should coordinate
with the County to identify opportunities where the County could support these needs (e.g.,
providing use of its full-time chemist at some or all mobile collection events) may allow the City
to increase the number of collection events without incurring the full cost burden of the program
expansion.
DRAFT
LSWMP Update Public Education, Outreach and Compliance
City of Dallas, Texas 13-1 Burns & McDonnell
13.0 PUBLIC EDUCATION, OUTREACH AND COMPLIANCE
Public education, outreach and compliance is critical to managing the City’s material management system
and making progress toward its recycling goals. Guidance and support from the City can shape proper
participation and positive program engagement experiences for customers in the single-family, multi-family
and commercial generation sectors. Effective education, outreach and compliance is a multi-departmental
effort that generates feedback from customers to inform the direction of current and future programs and
policies to work toward the City’s Zero Waste goals. This section presents information and analysis
regarding education, outreach and compliance programs.
13.1 Overview of Components of a Successful Program
The following provides an overview of key components of a robust materials management education,
outreach and compliance program as follows:
• Establish program goals. This is a critical first step for any successful education, outreach and
compliance program that dictates how the program will be evaluated over time and the intended
outcomes of the program. Specific quantitative metrics, programmatic improvements, and
definitions of success should be determined to ensure that targeted action is taken to work toward
the established program goals.
• Determine financial commitment. Determining the ability to support the program financially will
ultimately dictate the long-term success of any education, outreach and compliance program.
Target annual costs, dedicated staffing, and funding sources should be established before content
is generated and distributed to ensure that a sustained effort is possible.
• Identify target audience(s). Depending on the program goals and financial commitment, the next
component of a successful education, outreach and compliance program is identifying the target
audiences. Audiences may include broader categories of customers including residential customers,
multi-family, and commercial customers or focus on more targeted audiences such as specific
housing types, collection routes, businesses, or home-owner associations.
• Develop messaging content. Generally there are two types of communication that are deployed as
part of education, outreach and compliance programs: specific program information (e.g., dates of
service, acceptable materials, set -out instructions) and general environmental services information
(e.g., why recycling is beneficial, impacts of contamination). The messaging content should be
determined based on data-driven analysis and crafted with simple and easily understood language
and graphics to communicate information in a succinct and effective manner.
DRAFT
LSWMP Update Public Education, Outreach and Compliance
City of Dallas, Texas 13-2 Burns & McDonnell
• Content distribution and public outreach. The distribution channels of content as part of any
successful education, outreach and compliance program should be based on the target audience and
the type of content. The most effective approach to reaching the target audience and impacting
behavior change is distribute the content where the audience already consumes information. This
may require many diverse forms of content distribution, including traditional bill stuffers,
traditional advertising (e.g., billboards, bus stops, radio advertising), in-person meetings or events,
social media platforms (e.g., Facebook, Instagram, NextDoor) or other publications such as
newsletters or other local print media.
• Evaluate program effectiveness. This is a critical step to having a successful long-term program
that is able to maintain consistent messaging to the target audience over a sustained duration of
time, even as members of the selected target audience change. Evaluation of program effectiveness
may include activities such as tracking data (e.g., program costs over time, engagement from target
audience), establishing a meaningful feedback loop, and consistently evaluating progress toward
goals.
• Deploy compliance measures. Holding material generators accountable is a component of having
a successful long-term education, outreach and compliance program. Compliance activities may
include cart tagging, skipping service or removing carts from consistently bad actors, implementing
service fees, and/or otherwise enforcing local regulations or ordinances.
• Regional collaboration. Approaching solid waste and recycling from a regional perspective is the
final component of having a successful long-term education, outreach and compliance program.
Regional collaboration activities include coordinating with other municipalities on the consistency
of messaging, timing of content deployment and channel(s) of distribution. NCTCOG has
developed and deployed a regional education campaign intended to support regional collaboration
among communities in North Central Texas, and is described in further detail as part of Section
13.3.2.
13.2 Current System Review
Responsibilities for public education, outreach and compliance are shared between the Sanitation
Department and OEQS. Historically these services were provided primarily through the Sanitation
Department, but the City changed its overall approach for environmental educational and outreach efforts.
Rather than have individual departments have distinct programs, the City reorganized by moving
educational and outreach staff from multiple departments to OEQS. The purpose of the change was to
provide the opportunity to develop more comprehensive programs and to increase economies of scale (e.g.
ability to share a graphics designer). The Sanitation Department is still responsible for certain aspects of
DRAFT
LSWMP Update Public Education, Outreach and Compliance
City of Dallas, Texas 13-3 Burns & McDonnell
the education, outreach and compliance programs that are specific to service information (e.g., service
delays, adjustments to collection service schedule, etc.). Additionally, OEQS and the Sanitation Department
coordinate closely with Code Compliance.
The City uses a variety of programs and services to provide public education, outreach and compliance.
This section provides a detailed summary of activities as part of the City’s program organized by the
components of a successful education, outreach and compliance program as described in the previous
section.
• Establish program goals. The City has qualitative goals to reduce contamination in the single-
stream material collected by City crews and increase the volume and frequency of material set out
for collection by residential customers. There are specific quantitative goals set by the 2011
LSWMP and CECAP to increase the recycling rate. Additionally, the City has qualitative goals to
provide a consistently high level of service to residential customers and continue to implement and
track compliance with the MFRO.
• Determine financial commitment. In addition to the division manager, there are five full-time
positions for education and outreach efforts in OEQS including a recycling coordinator, three
administrative specialists, and an event services specialist. The staff conducts research and is
responsible for compliance related to hauler registration, the MFRO, marketing, social media, inter-
departmental educational outreach efforts and coordination with event services. The Sanitation
Department also has three four staff dedicated to education and outreach related to service-based
communications and has hired an additional 10 FTEs to provide code compliance service related
to brush and bulky item set outs and enforcing compliance with prohibited or oversize set outs.
Further discussion about brush and bulky item set outs is provided in Section 7.0. There are other
direct expenses related to education and outreach including marketing materials and cost for events
that are supported, in part, from annual payments provided by FCC as part of the recycling
processing contract.
• Identify target audience(s). The City’s current communications target single-family customers,
multi-family residents and building managers, and commercial establishments.
• Develop messaging content. Messaging content related to environmental stewardship is developed
by OEQS and messaging related to collection service is developed by the Sanitation Department.
• Content distribution and public outreach. The City utilizes a variety of traditional marketing
efforts for recycling education and outreach. Examples include but are not limited to Twitter,
Facebook, ReCollect App, direct mail, utility bill inserts, web site (www.DallasZeroWaste.com),
and attending special events. Additionally, the City provides presentations to homeowner
DRAFT

LSWMP Update Public Education, Outreach and Compliance
City of Dallas, Texas 13-4 Burns & McDonnell
associations (HOAs). Based on the results of the survey conducted as part of the stakeholder
engagement for the LSWMP Updated, respondents ranked direct email (65 percent), utility bill
inserts (37 percent), and social media (27 percent) as the preferred ways to receive communications
from the City about solid waste programs and educational information. In FY 2020 the City
initiated community based marketing efforts to conduct more grass roots outreach in places where
City residents frequent (e.g. community centers, grocery stores, etc.), but transitioned away due to
COVID-19 concerns to focus on virtual communication and social media approaches through
partnerships with public libraries and universities. The City has an educational game on the website
to educate the public, but does not have a major presence educating the community in public spaces
(e.g., parks and downtown areas).
• Evaluate program effectiveness. The City gauges the effectiveness of the blue roll cart program
by tracking the total annual volume of single-stream material collected by City crews. The City
calculates the percentage of single-stream material collected compared to all the material collected
among the blue and grey roll carts. Additionally, program effectiveness is tracked by the
contamination rate of single-stream materials, the reporting compliance as part of the MFRO, and
reporting compliance as part of the City’s non-exclusive franchise hauler system. Further detail
regarding the reporting compliance related to the MFRO and non-exclusive franchise system is
provided in Section 11.0
• Deploy compliance measures. In an effort to better understand contamination levels across the
City, the Sanitation Department developed the “Take-a-Peek” program where staff will identify
areas with presumed high contamination levels and will inspect recycling carts for contamination.
With limited staff resources, the goal was to “peek” into the carts of 100 households per district
each year (500 total). Given COVID-19 concerns, the program has been suspended and will
eventually shift to a route-based approach, with a goal to check every household along a specific
route (about 1,500 total households) in four phases. Additionally, the City implemented compliance
measures related to oversize brush and bulky item set outs. Further discussion related to oversize
brush and bulky item collection is provided in Section 7.0.
• Regional and institutional collaboration. The City actively coordinates with NCTCOG, other
peer cities and local educational institutions (e.g., Dallas Independent School District) to develop
and distribute education and outreach content in an effort to improve the performance of its
recycling system.
DRAFT
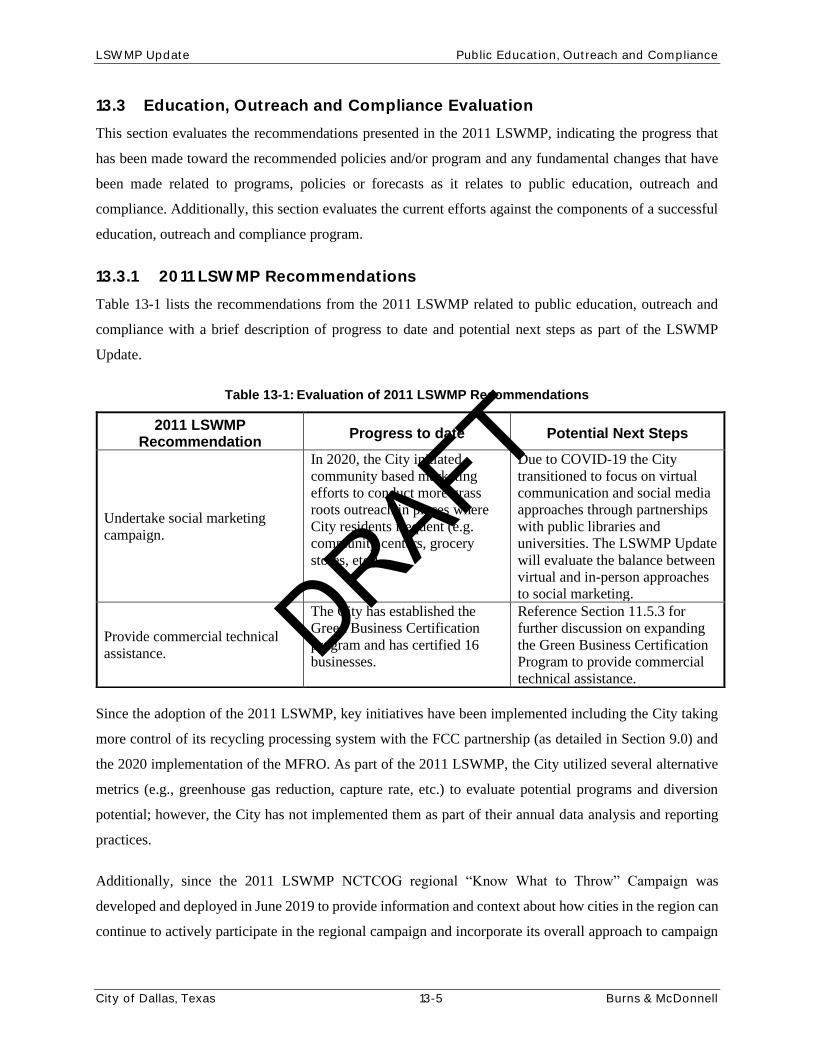
LSWMP Update Public Education, Outreach and Compliance
City of Dallas, Texas 13-5 Burns & McDonnell
13.3 Education, Outreach and Compliance Evaluation
This section evaluates the recommendations presented in the 2011 LSWMP, indicating the progress that
has been made toward the recommended policies and/or program and any fundamental changes that have
been made related to programs, policies or forecasts as it relates to public education, outreach and
compliance. Additionally, this section evaluates the current efforts against the components of a successful
education, outreach and compliance program.
13.3.1 2011 LSWMP Recommendations
Table 13-1 lists the recommendations from the 2011 LSWMP related to public education, outreach and
compliance with a brief description of progress to date and potential next steps as part of the LSWMP
Update.
Table 13-1: Evaluation of 2011 LSWMP Recommendations
Since the adoption of the 2011 LSWMP, key initiatives have been implemented including the City taking
more control of its recycling processing system with the FCC partnership (as detailed in Section 9.0) and
the 2020 implementation of the MFRO. As part of the 2011 LSWMP, the City utilized several alternative
metrics (e.g., greenhouse gas reduction, capture rate, etc.) to evaluate potential programs and diversion
potential; however, the City has not implemented them as part of their annual data analysis and reporting
practices.
Additionally, since the 2011 LSWMP NCTCOG regional “Know What to Throw” Campaign was
developed and deployed in June 2019 to provide information and context about how cities in the region can
continue to actively participate in the regional campaign and incorporate its overall approach to campaign
2011 LSWMP Recommendation
Progress to date Potential Next Steps
Undertake social marketing
campaign.
In 2020, the City initiated
community based marketing
efforts to conduct more grass
roots outreach in places where
City residents frequent (e.g.
community centers, grocery
stores, etc.).
Due to COVID-19 the City
transitioned to focus on virtual
communication and social media
approaches through partnerships
with public libraries and
universities. The LSWMP Update
will evaluate the balance between
virtual and in-person approaches
to social marketing.
Provide commercial technical
assistance.
The City has established the
Green Business Certification
program and has certified 16
businesses.
Reference Section 11.5.3 for
further discussion on expanding
the Green Business Certification
Program to provide commercial
technical assistance.
DRAFT
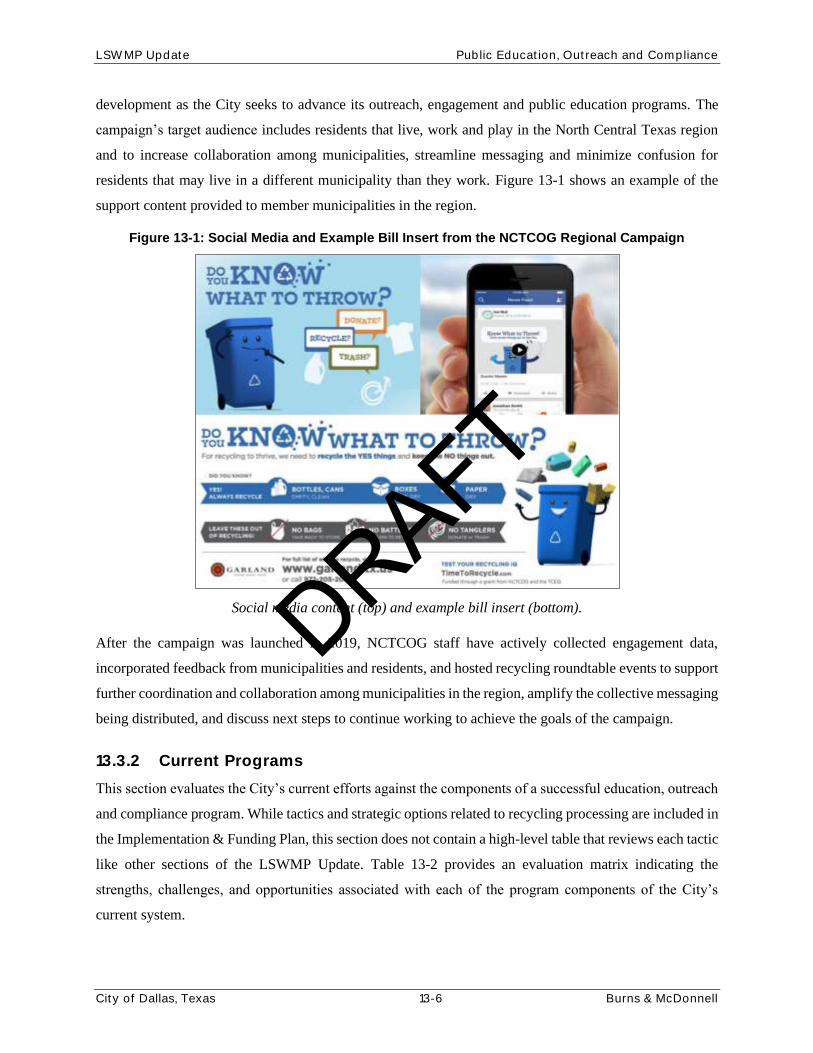
LSWMP Update Public Education, Outreach and Compliance
City of Dallas, Texas 13-6 Burns & McDonnell
development as the City seeks to advance its outreach, engagement and public education programs. The
campaign’s target audience includes residents that live, work and play in the North Central Texas region
and to increase collaboration among municipalities, streamline messaging and minimize confusion for
residents that may live in a different municipality than they work. Figure 13-1 shows an example of the
support content provided to member municipalities in the region.
Figure 13-1: Social Media and Example Bill Insert from the NCTCOG Regional Campaign
Social media content (top) and example bill insert (bottom).
After the campaign was launched in 2019, NCTCOG staff have actively collected engagement data,
incorporated feedback from municipalities and residents, and hosted recycling roundtable events to support
further coordination and collaboration among municipalities in the region, amplify the collective messaging
being distributed, and discuss next steps to continue working to achieve the goals of the campaign.
13.3.2 Current Programs
This section evaluates the City’s current efforts against the components of a successful education, outreach
and compliance program. While tactics and strategic options related to recycling processing are included in
the Implementation & Funding Plan, this section does not contain a high-level table that reviews each tactic
like other sections of the LSWMP Update. Table 13-2 provides an evaluation matrix indicating the
strengths, challenges, and opportunities associated with each of the program components of the City’s
current system.
DRAFT
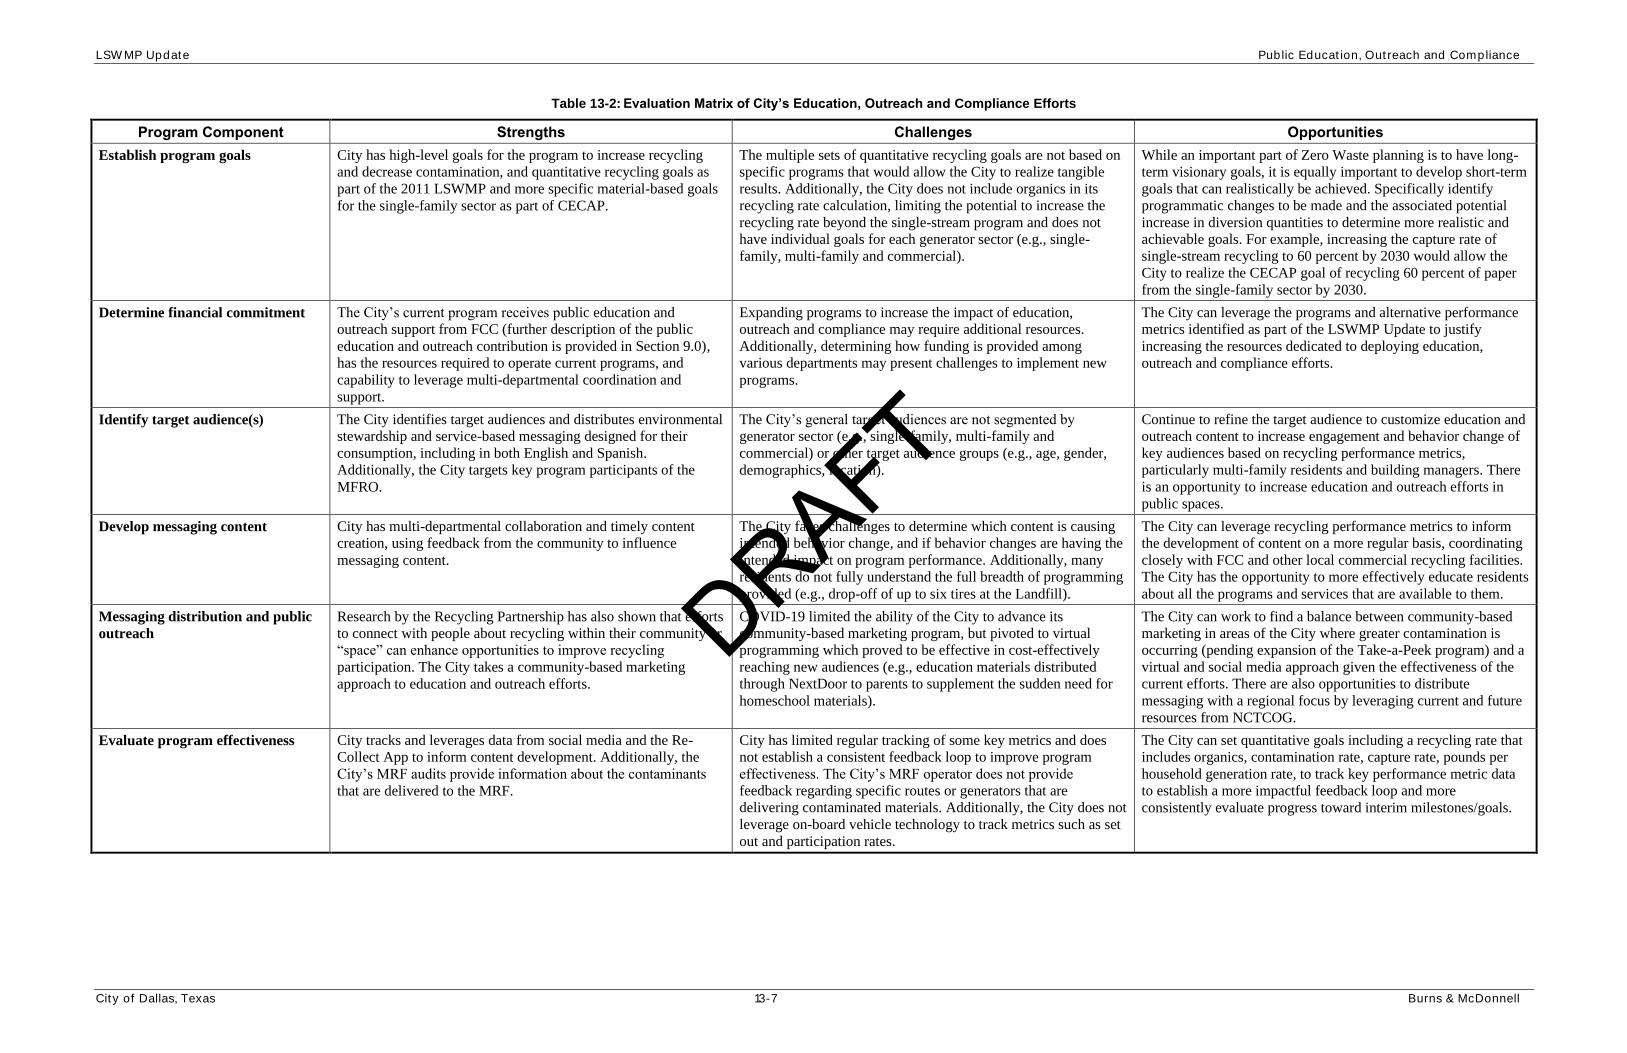
LSWMP Update Public Education, Outreach and Compliance
City of Dallas, Texas 13-7 Burns & McDonnell
Table 13-2: Evaluation Matrix of City’s Education, Outreach and Compliance Efforts
Program Component Strengths Challenges Opportunities
Establish program goals City has high-level goals for the program to increase recycling
and decrease contamination, and quantitative recycling goals as
part of the 2011 LSWMP and more specific material-based goals
for the single-family sector as part of CECAP.
The multiple sets of quantitative recycling goals are not based on
specific programs that would allow the City to realize tangible
results. Additionally, the City does not include organics in its
recycling rate calculation, limiting the potential to increase the
recycling rate beyond the single-stream program and does not
have individual goals for each generator sector (e.g., single-
family, multi-family and commercial).
While an important part of Zero Waste planning is to have long-
term visionary goals, it is equally important to develop short-term
goals that can realistically be achieved. Specifically identify
programmatic changes to be made and the associated potential
increase in diversion quantities to determine more realistic and
achievable goals. For example, increasing the capture rate of
single-stream recycling to 60 percent by 2030 would allow the
City to realize the CECAP goal of recycling 60 percent of paper
from the single-family sector by 2030.
Determine financial commitment The City’s current program receives public education and
outreach support from FCC (further description of the public
education and outreach contribution is provided in Section 9.0),
has the resources required to operate current programs, and
capability to leverage multi-departmental coordination and
support.
Expanding programs to increase the impact of education,
outreach and compliance may require additional resources.
Additionally, determining how funding is provided among
various departments may present challenges to implement new
programs.
The City can leverage the programs and alternative performance
metrics identified as part of the LSWMP Update to justify
increasing the resources dedicated to deploying education,
outreach and compliance efforts.
Identify target audience(s) The City identifies target audiences and distributes environmental
stewardship and service-based messaging designed for their
consumption, including in both English and Spanish.
Additionally, the City targets key program participants of the
MFRO.
The City’s general target audiences are not segmented by
generator sector (e.g., single-family, multi-family and
commercial) or other target audience groups (e.g., age, gender,
demographics, location).
Continue to refine the target audience to customize education and
outreach content to increase engagement and behavior change of
key audiences based on recycling performance metrics,
particularly multi-family residents and building managers. There
is an opportunity to increase education and outreach efforts in
public spaces.
Develop messaging content City has multi-departmental collaboration and timely content
creation, using feedback from the community to influence
messaging content.
The City faces challenges to determine which content is causing
intended behavior change, and if behavior changes are having the
intended impact on program performance. Additionally, many
residents do not fully understand the full breadth of programming
provided (e.g., drop-off of up to six tires at the Landfill).
The City can leverage recycling performance metrics to inform
the development of content on a more regular basis, coordinating
closely with FCC and other local commercial recycling facilities.
The City has the opportunity to more effectively educate residents
about all the programs and services that are available to them.
Messaging distribution and public
outreach
Research by the Recycling Partnership has also shown that efforts
to connect with people about recycling within their community or
“space” can enhance opportunities to improve recycling
participation. The City takes a community-based marketing
approach to education and outreach efforts.
COVID-19 limited the ability of the City to advance its
community-based marketing program, but pivoted to virtual
programming which proved to be effective in cost-effectively
reaching new audiences (e.g., education materials distributed
through NextDoor to parents to supplement the sudden need for
homeschool materials).
The City can work to find a balance between community-based
marketing in areas of the City where greater contamination is
occurring (pending expansion of the Take-a-Peek program) and a
virtual and social media approach given the effectiveness of the
current efforts. There are also opportunities to distribute
messaging with a regional focus by leveraging current and future
resources from NCTCOG.
Evaluate program effectiveness City tracks and leverages data from social media and the Re-
Collect App to inform content development. Additionally, the
City’s MRF audits provide information about the contaminants
that are delivered to the MRF.
City has limited regular tracking of some key metrics and does
not establish a consistent feedback loop to improve program
effectiveness. The City’s MRF operator does not provide
feedback regarding specific routes or generators that are
delivering contaminated materials. Additionally, the City does not
leverage on-board vehicle technology to track metrics such as set
out and participation rates.
The City can set quantitative goals including a recycling rate that
includes organics, contamination rate, capture rate, pounds per
household generation rate, to track key performance metric data
to establish a more impactful feedback loop and more
consistently evaluate progress toward interim milestones/goals.
DRAFT
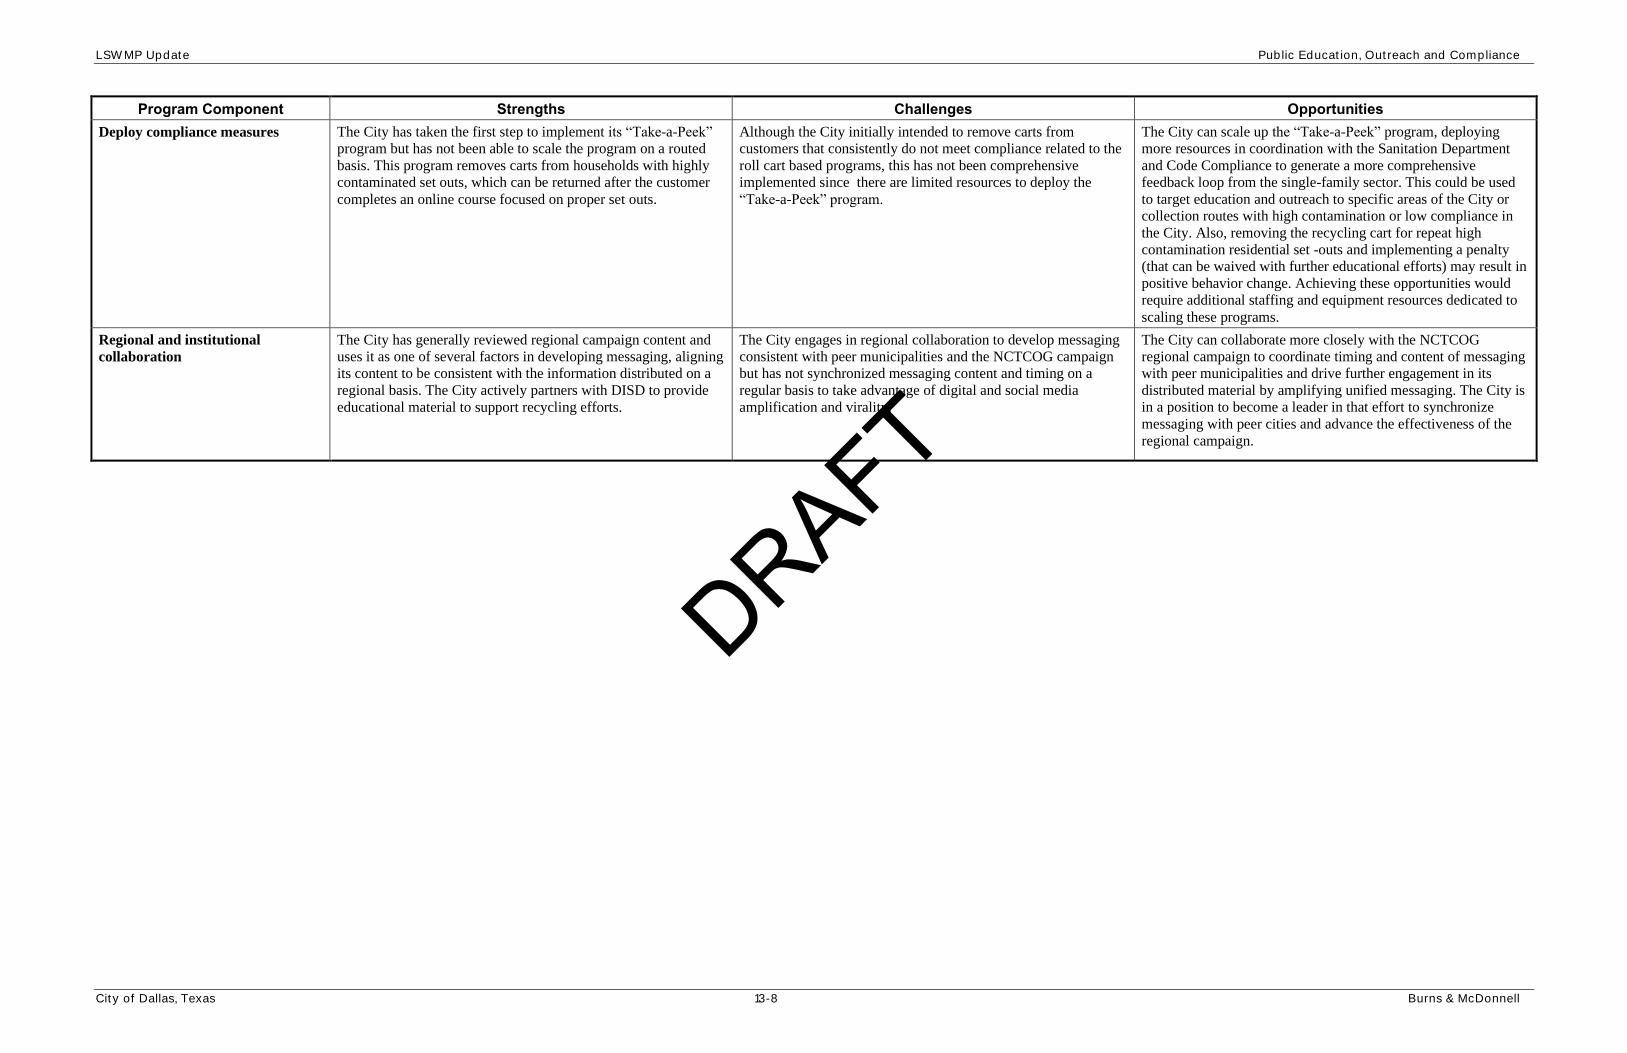
LSWMP Update Public Education, Outreach and Compliance
City of Dallas, Texas 13-8 Burns & McDonnell
Program Component Strengths Challenges Opportunities
Deploy compliance measures The City has taken the first step to implement its “Take-a-Peek”
program but has not been able to scale the program on a routed
basis. This program removes carts from households with highly
contaminated set outs, which can be returned after the customer
completes an online course focused on proper set outs.
Although the City initially intended to remove carts from
customers that consistently do not meet compliance related to the
roll cart based programs, this has not been comprehensive
implemented since there are limited resources to deploy the
“Take-a-Peek” program.
The City can scale up the “Take-a-Peek” program, deploying
more resources in coordination with the Sanitation Department
and Code Compliance to generate a more comprehensive
feedback loop from the single-family sector. This could be used
to target education and outreach to specific areas of the City or
collection routes with high contamination or low compliance in
the City. Also, removing the recycling cart for repeat high
contamination residential set -outs and implementing a penalty
(that can be waived with further educational efforts) may result in
positive behavior change. Achieving these opportunities would
require additional staffing and equipment resources dedicated to
scaling these programs.
Regional and institutional
collaboration
The City has generally reviewed regional campaign content and
uses it as one of several factors in developing messaging, aligning
its content to be consistent with the information distributed on a
regional basis. The City actively partners with DISD to provide
educational material to support recycling efforts.
The City engages in regional collaboration to develop messaging
consistent with peer municipalities and the NCTCOG campaign
but has not synchronized messaging content and timing on a
regular basis to take advantage of digital and social media
amplification and virality.
The City can collaborate more closely with the NCTCOG
regional campaign to coordinate timing and content of messaging
with peer municipalities and drive further engagement in its
distributed material by amplifying unified messaging. The City is
in a position to become a leader in that effort to synchronize
messaging with peer cities and advance the effectiveness of the
regional campaign.
DRAFT
LSWMP Update Public Education, Outreach and Compliance
City of Dallas, Texas 13-9 Burns & McDonnell
13.4 Case Studies and Benchmarking
This section provides descriptions of programs or operational considerations from peer cities that would
support the City’s long-term planning needs related to the future of education, outreach and compliance
programs. The next sub-sections provide perspective about the following topics:
• Targeted education, outreach and compliance efforts
• Compliance strategies
• Interactive online learning modules
• Technology integration for program feedback
• Recycling market development
13.4.1 Targeted Education, Outreach and Compliance Efforts
Targeting key audiences as part of education, outreach and compliance efforts is an approach that is based
on an effective feedback loop to understand exactly which customer types,
After conducting a waste characterization study the City of Atlanta found that one-third of residential
curbside recycling was contamination, with half of contamination being due to recycling being bagged.
Based on this data collection and analysis, Atlanta deployed cart checkers in four target areas of the city to
check and reject carts with contamination, distributing information through mail and nearby signage. Based
on this targeted education, outreach and compliance effort, the overall contamination in the test areas fell
by 57 percent following implementation of the strategy. Atlanta determined this by conducting a follow on
waste characterization effort in these target areas to determine the effectiveness of the approach.
The City of Denver found that 48 percent of aluminum cans generated by households were not being
recycled based on a waste characterization. The city developed a campaign to increase the capture of this
specific material targeted nearly 5,000 households with messaging through social media, mailed postcards,
collection truck signage, and half of targeted households receiving aluminum can-specific cart tags. Based
on the results of a follow on waste characterization effort, the city determined that the targeted education
and outreach effort resulted in a 25 percent increase in recycling of aluminum cans among households that
received the cart tags.
The City of Denton works closely with its MRF operator to identify the loads and routes that are generating
high levels of contamination and the types of contaminants present. This information is incorporated as part
of Denton’s feedback loop to inform the content and distribution of education and outreach materials and
compliance efforts.
DRAFT
LSWMP Update Public Education, Outreach and Compliance
City of Dallas, Texas 13-10 Burns & McDonnell
13.4.2 Compliance Strategies
The City of Fort Worth’s “Blue Crew” checks the contents of residential set outs each day and leaves tags
to inform the resident of any contamination that are found in recycling carts. The Blue Crew removes and
bags items/articles that are identified as contaminated and attach a tag to the bag or cart explaining the
situation to the customer. The Blue Crew staffing level of 6 to 7.5 full time employees (FTEs) allows Fort
Worth to effectively educate customers at the point of generation collaboratively with its contracted
recycling collection provider. Those who repeatedly are found to have put non-programmatic recyclable
goods in the recycling carts can be charged additional garbage fees, and have their recycling carts taken
away. Additionally, Fort Worth has found that by informing the community of the importance of reduction
contamination, there are few complaints about the auditing of set outs from residents.
The Cities of San Antonio and Garland have policies that incentivize compliance with their solid waste and
recycling programs. These policy approaches have been summarized to provide context as the City
considers enhancing program compliance.
The City of San Antonio’s SWMD issues violations and collects fees for cart contamination that are added
to residents’ monthly utility bills from CPS Energy. SWMD staff (consisting of 25 FTEs dedicated to
planning, strategy, performance, education and outreach based on the analysis conducted as part of the
Initial Operations Assessment) conducts cart audits and customers whose set outs are identified as
contaminated are issued an initial warning tag on the cart and a letter sent in the mail that informs residents
of the problem. SWMD staff members conducting the audit collect data including a picture of the cart, the
serial number on the cart, a picture of the home and pictures of the contaminated items to ensure that
violations are sent to the correct customer and information regarding the cart audit can be tracked. The
second time that a cart is identified as contaminated, SWMD staff leave a contamination fee tag to indicate
that a fee will be placed on the resident’s next utility bill.
Generally, contamination fees are $25 but increases to $50 for diaper contamination. Increased fees for
diaper contamination were added in 2018 because this specific contaminant represented a major problem
for San Antonio’s MRF. Another addition to the program has been the ability to wave a contamination fee.
If a resident is assessed a fee, they can have it removed from the upcoming monthly utility bill by
participating in an online educational activity within 10 days of the date of the fee notice letter. SWMD
allocates the revenue collected through contamination fees to fund the dispatch of a collection truck to haul
contaminated material for disposal rather than recycling.
The City of Austin has also implemented compliance strategies for its various programs including strict
adherence to its separated yard trimmings, brush and bulky item collection program and targeted outreach
to areas of the city that are identified has having low capture rate of recycling material including single-
DRAFT
LSWMP Update Public Education, Outreach and Compliance
City of Dallas, Texas 13-11 Burns & McDonnell
stream and organics via roll cart collection. The planning, strategy, performance, education and outreach
staffing includes 47 FTEs based on research conducted as part of the Initial Operations Assessment.
City of Garland residents receive recycling service and are able to opt out of their program, meaning they
can ask the City not to provide recycling service. For this reason, only about 42,500 of the 63,000 total
refuse collection customers receive recycling collection service. Garland collection vehicle operators
identify and track customers that set out consistently contaminated carts by visually inspecting the carts and
recycling material as it is tipped into the collection vehicle from the cab.
Garland employs a “three-strike” rule to incentivize compliance with the recycling program. If the driver
encounters a contaminated recycling set out, the cart is tagged. If that same household has a second
unacceptable set out, the resident is sent a letter in the mail providing an official warning. Upon the third
unacceptable set out, the resident receives a call from the recycling outreach coordinator and their cart is
removed.
Although cart removal provides an incentive to remain in compliance with the program requirements for
minimizing contamination and proper set outs, if a resident’s cart is removed they are able to get it back
upon request from the City and there are no further penalties, financial or otherwise, to further enforce
compliance.
13.4.3 Technology Integration for Program Feedback
Increasingly, cities and haulers are incorporating artificial intelligence (AI) into waste and recycling
collection through on-board technology such as radio-frequency identification (RFID) enabled carts, on-
board cameras and hopper cameras, and in-cab driver assistance to collect and analyze data that supports
customizing education, outreach and compliance efforts to reach target audiences and support service
verification. Integration of on-board technology allows for software assisted program and fleet management
such as route optimization and service verification. These systems and software can also provide valuable
information and feedback. For example, by identifying areas of low participation (based on set outs or RFID
data) or high contamination (using hopper cameras and AI), cities can target campaigns and track changes
in these metrics to understand the success of outreach, engagement, and public education campaigns.
The City of Denton has integrated data from its on-board technology provider, Rubicon Global (Rubicon)
as part of its recycling contamination cart tagging campaign. The technology assists with the identification
and tracking of contaminated residential recycling carts, allowing the Denton to hold customers accountable
while also streamlining the process for its drivers. Denton has seen a decrease in contamination which has
been associated with the integration of the Rubicon system into the City’s outreach and compliance efforts.
DRAFT
LSWMP Update Public Education, Outreach and Compliance
City of Dallas, Texas 13-12 Burns & McDonnell
The City of Fort Worth is working with its contract collection provider to install on-board technology to
support service verification and provide data that staff can incorporate as part of its education and outreach
efforts. Waste Management’s “Smart Truck” technology equipped with proprietary technology designed to
improve customer service by validating service by using GPS mapping and dedicated cameras to
photograph or video every cart serviced. While the technology has not been rolled out across its fleet at this
point, the intent is to deploy “Smart Truck” on-board equipment and software to increase knowledge of
overloaded carts, participation rates, damaged carts, and other key visual data captured of the collection
environments on route.
13.4.4 Interactive Online Learning Modules
Interactive online components, such as learning modules or quizzes, can drive engagement with a program’s
website and other information. The City of Plano provides multiple online learning modules to residents
through its Live Green in Plano initiative. These online learning modules include content on a variety of
topics (e.g., water conservation, stormwater, green building, solid waste and recycling), including three
related to waste and recycling: “Taking Care of the Trash” about how to correctly participate the city’s
curbside and HHW programs, “Backyard Composting” about how to start composting yard trimmings, and
“Composting Food Waste” about options to compost food waste at home. These innovative modules
provide information through photos, behind-the-scenes videos (e.g., MRF processing), how-to instructions,
interactive games, and quizzes. The modules also connect residents to additional resources to learn more
(e.g., recommended books available at the public library). To incentivize participation, Plano ran a six-
month drawing in which residents were could enter to win a $50 gift card by completing the “Taking Care
of the Trash” module and submitting the certificate of completion.
13.4.5 Recycling Market Development
Recycling market development is a method of increasing the demand for recovered materials so that end
markets for the materials are established, improved or stabilized and thereby become more reliable. The
FCC MRF provides a critical outlet for the City and other entities in the region to recycle single-stream
materials. Recycling market development efforts support the development of facilities that process
potentially recyclable materials not collected as part of single-stream programs or that become process
residue and contamination (e.g., Styrofoam, food, shredded paper, etc.). Table 13-3 presents material types
that are challenging or cause concerns when introduced into the existing single-stream recycling processing
system and could be targeted as part of recycling market development initiatives.
DRAFT
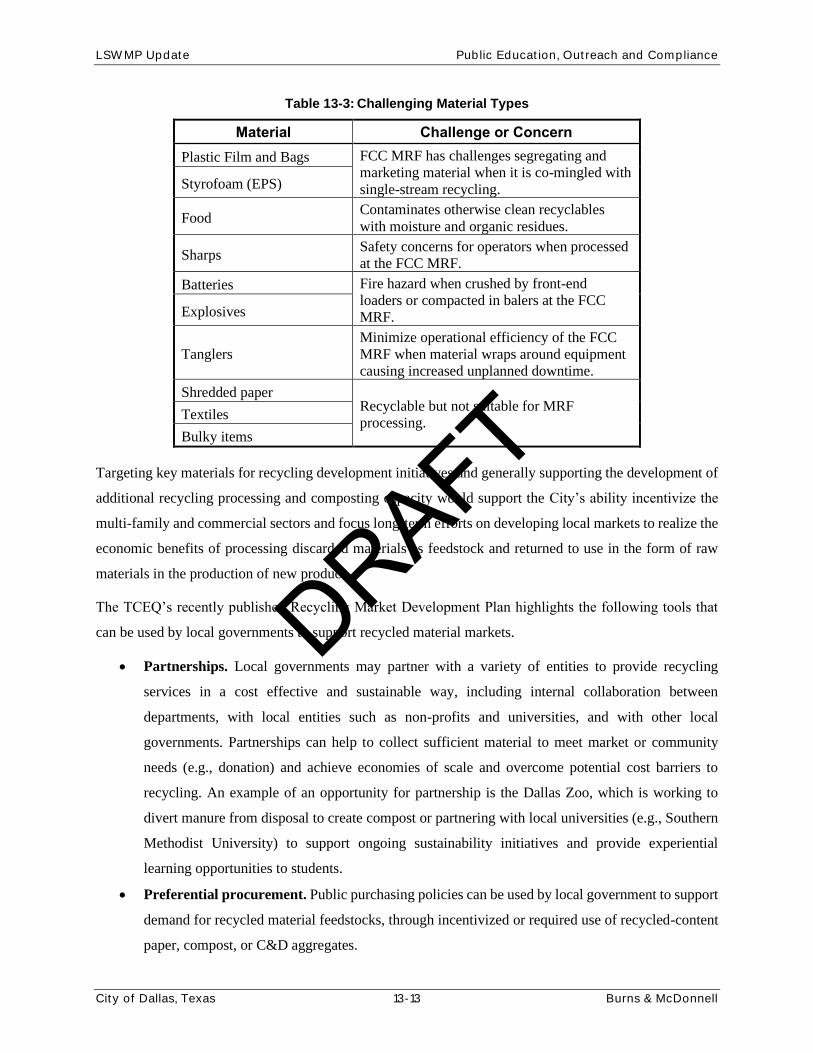
LSWMP Update Public Education, Outreach and Compliance
City of Dallas, Texas 13-13 Burns & McDonnell
Table 13-3: Challenging Material Types
Material Challenge or Concern
Plastic Film and Bags FCC MRF has challenges segregating and
marketing material when it is co-mingled with
single-stream recycling. Styrofoam (EPS)
Food Contaminates otherwise clean recyclables
with moisture and organic residues.
Sharps Safety concerns for operators when processed
at the FCC MRF.
Batteries Fire hazard when crushed by front-end
loaders or compacted in balers at the FCC
MRF. Explosives
Tanglers
Minimize operational efficiency of the FCC
MRF when material wraps around equipment
causing increased unplanned downtime.
Shredded paper Recyclable but not suitable for MRF
processing. Textiles
Bulky items
Targeting key materials for recycling development initiatives and generally supporting the development of
additional recycling processing and composting capacity would support the City’s ability incentivize the
multi-family and commercial sectors and focus long-term efforts on developing local markets to realize the
economic benefits of processing discarded materials as feedstock and returned to use in the form of raw
materials in the production of new product.
The TCEQ’s recently published Recycling Market Development Plan highlights the following tools that
can be used by local governments to support recycled material markets.
• Partnerships. Local governments may partner with a variety of entities to provide recycling
services in a cost effective and sustainable way, including internal collaboration between
departments, with local entities such as non-profits and universities, and with other local
governments. Partnerships can help to collect sufficient material to meet market or community
needs (e.g., donation) and achieve economies of scale and overcome potential cost barriers to
recycling. An example of an opportunity for partnership is the Dallas Zoo, which is working to
divert manure from disposal to create compost or partnering with local universities (e.g., Southern
Methodist University) to support ongoing sustainability initiatives and provide experiential
learning opportunities to students.
• Preferential procurement. Public purchasing policies can be used by local government to support
demand for recycled material feedstocks, through incentivized or required use of recycled-content
paper, compost, or C&D aggregates.
DRAFT
LSWMP Update Public Education, Outreach and Compliance
City of Dallas, Texas 13-14 Burns & McDonnell
• Service provision mandates. Mandated service provisions are ordinances enacted by local
government to require specific sectors (e.g., commercial, multi-family, C&D) to contract for
recycling services. These policies can be effective in supporting recycling markets for materials in
areas with low participation/access to recycling programs. Policies can include mandatory
recycling of certain materials and universal recycling ordinances. Further discussion regarding the
use of service provision mandates to increase recycling from the multi-family and commercial
sectors is discussed in more detail in Section 11.0.
• Economic development initiatives. Cities may offer recycling-related businesses certain
incentives to encourage the enhanced use of recovered materials from local, regional, or statewide
sources. Example incentives include a reduced rate for waste disposal, reduced taxes/tax
exemptions, and reduced utility rates. One approach local governments might consider is
establishing recycling market development zones (RMDZs), which is particularly appropriate
where local governments wish to concentrate such industry in one or more geographic areas.
13.5 Key Findings and Recommendations
This section presents the key findings and recommendations related to program and policy approaches to
increasing the effectiveness of education, outreach and compliance approaches based on the results of the
evaluation, case studies, benchmarking and stakeholder engagement.
13.5.1 Key Findings
Each of the following key findings supports the corresponding recommendation in the subsequent section.
1. Education, outreach and compliance efforts are critical to the success of current and future
policy, program and infrastructure developments. Continued data collection, analysis and
reporting and multi-departmental coordination are essential to establishing a consistent feedback
loop that can be incorporated into the education and outreach content and compliance measures
deployed by the City.
2. The responsibilities for education, outreach and compliance efforts are split among three
departments. The Sanitation Department, OEQS and Code Compliance each manage a part of the
education, outreach and compliance efforts. While this multi-departmental effort is effective to
manage the current programs, the distributed effort may present challenges related to scaling future
program implementation and compliance efforts.
3. Existing goals should be adjusted to establish practical pathway to achieve success. The City
has the opportunity to align its current data tracking and program implementation to achieve the
DRAFT
LSWMP Update Public Education, Outreach and Compliance
City of Dallas, Texas 13-15 Burns & McDonnell
recycling rate goals adopted as part of CECAP for the single-family sector and utilize more
effective metrics in the multi-family and commercial sectors, where the City can only influence
material management rather than directly controlling it. For example, the City could look to include
organics in its recycling rate calculation for the single-family sector and set more granular,
reporting compliance-based goals for the multi-family and commercial generator sectors.
4. There are challenges deploying the resources to comprehensively expand the “Take-a-Peek”
program. The initial development of the program had been stalled by COVID-19 and is currently
not robust enough to provide a consistent feedback loop to inform education and outreach content
for the single-family sector.
5. There is opportunity to expand education, outreach and compliance programs for the
commercial sector. Although a key focus to increase capture rate of single-stream material is on
the single-family sector, there is opportunity to increase the focus on education, outreach and
compliance for commercial customers to support future policy efforts to increase recycling from
this sector.
6. City has fewer planning, strategy, performance, education and outreach resources and
compliance measures in place compared to peer cities. While the City has implemented fees
related to oversize brush and bulky item set outs, there are limited compliance measures related to
contamination of single-stream recycling. Additionally, the “Take-a -Peek” program is limited
based on the currently available resources to scale the program to become route-based. City has
fewer staff among the Sanitation Department and OEQS (13 staff in Sanitation Department and
five in OEQS, totaling 18) compared to San Antonio and Austin’s 25 and 47 staff dedicated to
strategy planning and education and outreach.
7. On-board technology not in place to collect and track key performance metrics. Although the
City has installed on-board vehicle technology, the data collected is not currently used to track and
evaluate key performance metrics such as service verification, participation/set out rate.
Additionally, advanced data analytics such as AI to see what customers are setting out and levels
of contamination are not evaluated to increase the effectiveness of education, outreach and
compliance programs.
8. Increasing the capture rate of single stream recyclables to 60 percent and separately
collecting and recycling organics would support the CECAP goals of recycling 35 percent of
organics, 60 percent of paper, and reducing landfill disposal by 35 percent by 2030. Education,
outreach and compliance efforts focused on the single-family recycling collection to increase
DRAFT
LSWMP Update Public Education, Outreach and Compliance
City of Dallas, Texas 13-16 Burns & McDonnell
capture rate to 60 percent and implement organics separation and recycling would result in
successfully achieving the goals set out by CECAP. This could be accomplished by leveraging the
City’s existing programs and coordinating with the NCTCOG regional campaign to increase
capture rate and, most importantly, implementing separate collection and recycling of organics
from the single-family sector.
13.5.2 Recommendations
Each of the following recommendations are components of the planning level Implementation & Funding
Plan provided in Appendix F.
1. Adjust performance metrics and recycling rate methodology. Utilize performance metrics
including contamination rate, capture rate, and pounds per household generation rate as key
recycling performance metrics and update the City’s recycling rate to includes organics. Evaluate
these performance metrics on a consistent and recurring basis. Leverage these recycling
performance metrics to inform the development of content on a more regular basis, coordinating
closely with FCC and other local commercial recycling facilities to increase the effectiveness of
education, outreach and compliance efforts.
2. Expand “Take-a-Peek” program and other compliance efforts in the single-family sector.
Expand the “Take-a-Peek” program to increase the feedback loop generated from single-family
customer set outs and target outreach to areas of the City or specific routes with high levels of
contamination. Recycling carts should be removed from customers that are not in compliance,
returning their cart if customers participate in online modules. Chronic offenders (e.g., after having
their cart removed one or more times) setting out heavily contaminated carts should be cited with
a service fee. To expand these programs to a similar scale to San Antonio or Austin, the City would
need to consider hiring or re-purposing between seven and 29 additional FTEs with vehicles and
data collection equipment (e.g., tablets). The City should also consider leveraging on-board vehicle
technology to support with service verification and compliance efforts.
3. Expand the Green Business Certification program. Add more responsibility to the existing staff
to provide technical assistance as part of the Green Business Certification program, as available.
As the Green Business Certification program continues to grow, there may be a need to hire
additional FTEs to provide technical assistance on a dedicated basis, coordinating closely with
Code Compliance to increase the feedback look with commercial sector generators.
4. Amplify regional NCTCOG campaign and coordinate with DISD. The City should continue
implementation of education, outreach and compliance measure in coordination with the NCTCOG
DRAFT
LSWMP Update Public Education, Outreach and Compliance
City of Dallas, Texas 13-17 Burns & McDonnell
regional campaign and continue efforts to coordinate with DISD. The City is in a position to
become a leader in that effort to synchronize messaging with peer cities and local educational
institutions to advance the effectiveness of the regional campaign. Additionally, the City should
leverage grant opportunities focused on regional collaboration to amplify education and outreach
efforts to reach more generators among single-family, multi-family and commercial.
5. Maximize voluntary programs in the near term to increase the single-stream capture rate
from 50 percent to 60 percent. Leverage voluntary programs including expanding the “Take-a-
Peek” program and on-board vehicle technology to increase the effectiveness of the existing
education, outreach and compliance programs to achieve an increase in capture rate from 50 to 60
percent. Increasing the feedback loop in the single-family sector to inform the development of
programs and improve the effectiveness of the multi-departmental education and outreach program
is essential to increasing the capture rate of single-stream recycling, organics recycling and moving
the needle to achieving the City’s Zero Waste goal.
6. Support separate collection and recycling of organics with critical education, outreach and
compliance measures. Deploy education, outreach and compliance staff from the Sanitation
Department to education customers about any new or adjusted separate collection programs and
enforce compliance measures regarding separate collection of organics would position the City to
achieve its goals of 35 percent organics recycling and 35 percent reduction of landfill disposal by
2030. Leverage these resources dedicated to brush and bulky item collection to support compliance
efforts of single-stream recycling, as available.
7. Implement mandatory programs in the long term to increase capture rate from 60 to 80
percent in the single-family sector. When voluntary programs have been shown to drive up the
capture rate from the single-stream recycling program, reduce disposal on a per household basis,
and increase recycling quantities on a per household basis, the City should implement mandatory
programs such as material bans and residential recycling requirements to increase the capture rate
of single-stream recyclables from 60 to 80 percent. Mandatory programs should be considered after
the City successfully implements the other recommendations described in this section.
Implementing mandatory programs would increase the staff demand for compliance efforts and
may require additional staff or resources to effectively hold customers to account and realize a
further increase in the recycling rate.
DRAFT
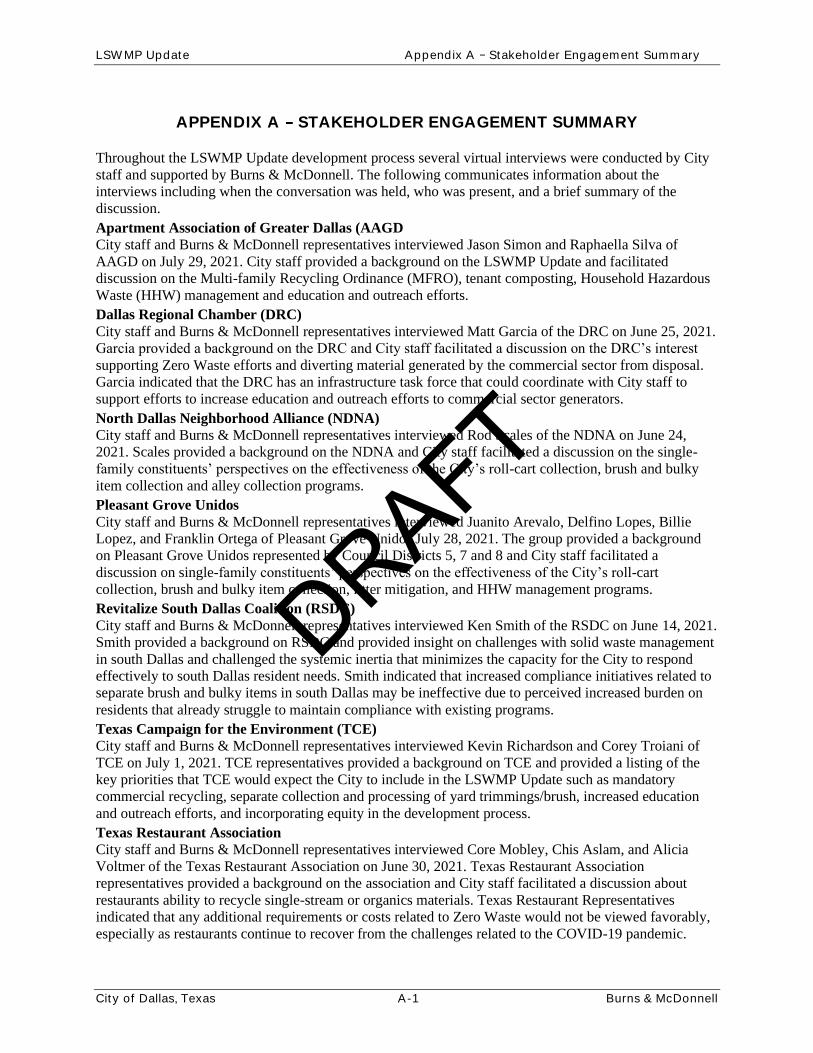
LSWMP Update Appendix A Stakeholder Engagement Summary
City of Dallas, Texas A-1 Burns & McDonnell
APPENDIX A STAKEHOLDER ENGAGEMENT SUMMARY
Throughout the LSWMP Update development process several virtual interviews were conducted by City
staff and supported by Burns & McDonnell. The following communicates information about the
interviews including when the conversation was held, who was present, and a brief summary of the
discussion.
Apartment Association of Greater Dallas (AAGD
City staff and Burns & McDonnell representatives interviewed Jason Simon and Raphaella Silva of
AAGD on July 29, 2021. City staff provided a background on the LSWMP Update and facilitated
discussion on the Multi-family Recycling Ordinance (MFRO), tenant composting, Household Hazardous
Waste (HHW) management and education and outreach efforts.
Dallas Regional Chamber (DRC)
City staff and Burns & McDonnell representatives interviewed Matt Garcia of the DRC on June 25, 2021.
Garcia provided a background on the DRC and City staff facilitated a discussion on the DRC’s interest
supporting Zero Waste efforts and diverting material generated by the commercial sector from disposal.
Garcia indicated that the DRC has an infrastructure task force that could coordinate with City staff to
support efforts to increase education and outreach efforts to commercial sector generators.
North Dallas Neighborhood Alliance (NDNA)
City staff and Burns & McDonnell representatives interviewed Rod Scales of the NDNA on June 24,
2021. Scales provided a background on the NDNA and City staff facilitated a discussion on the single-
family constituents’ perspectives on the effectiveness of the City’s roll-cart collection, brush and bulky
item collection and alley collection programs.
Pleasant Grove Unidos
City staff and Burns & McDonnell representatives interviewed Juanito Arevalo, Delfino Lopes, Billie
Lopez, and Franklin Ortega of Pleasant Grove Unidos July 28, 2021. The group provided a background
on Pleasant Grove Unidos represented by Council Districts 5, 7 and 8 and City staff facilitated a
discussion on single-family constituents’ perspectives on the effectiveness of the City’s roll-cart
collection, brush and bulky item collection, litter mitigation, and HHW management programs.
Revitalize South Dallas Coalition (RSDC)
City staff and Burns & McDonnell representatives interviewed Ken Smith of the RSDC on June 14, 2021.
Smith provided a background on RSDC and provided insight on challenges with solid waste management
in south Dallas and challenged the systemic inertia that minimizes the capacity for the City to respond
effectively to south Dallas resident needs. Smith indicated that increased compliance initiatives related to
separate brush and bulky items in south Dallas may be ineffective due to perceived increased burden on
residents that already struggle to maintain compliance with existing programs.
Texas Campaign for the Environment (TCE)
City staff and Burns & McDonnell representatives interviewed Kevin Richardson and Corey Troiani of
TCE on July 1, 2021. TCE representatives provided a background on TCE and provided a listing of the
key priorities that TCE would expect the City to include in the LSWMP Update such as mandatory
commercial recycling, separate collection and processing of yard trimmings/brush, increased education
and outreach efforts, and incorporating equity in the development process.
Texas Restaurant Association
City staff and Burns & McDonnell representatives interviewed Core Mobley, Chis Aslam, and Alicia
Voltmer of the Texas Restaurant Association on June 30, 2021. Texas Restaurant Association
representatives provided a background on the association and City staff facilitated a discussion about
restaurants ability to recycle single-stream or organics materials. Texas Restaurant Representatives
indicated that any additional requirements or costs related to Zero Waste would not be viewed favorably,
especially as restaurants continue to recover from the challenges related to the COVID-19 pandemic.
DRAFT
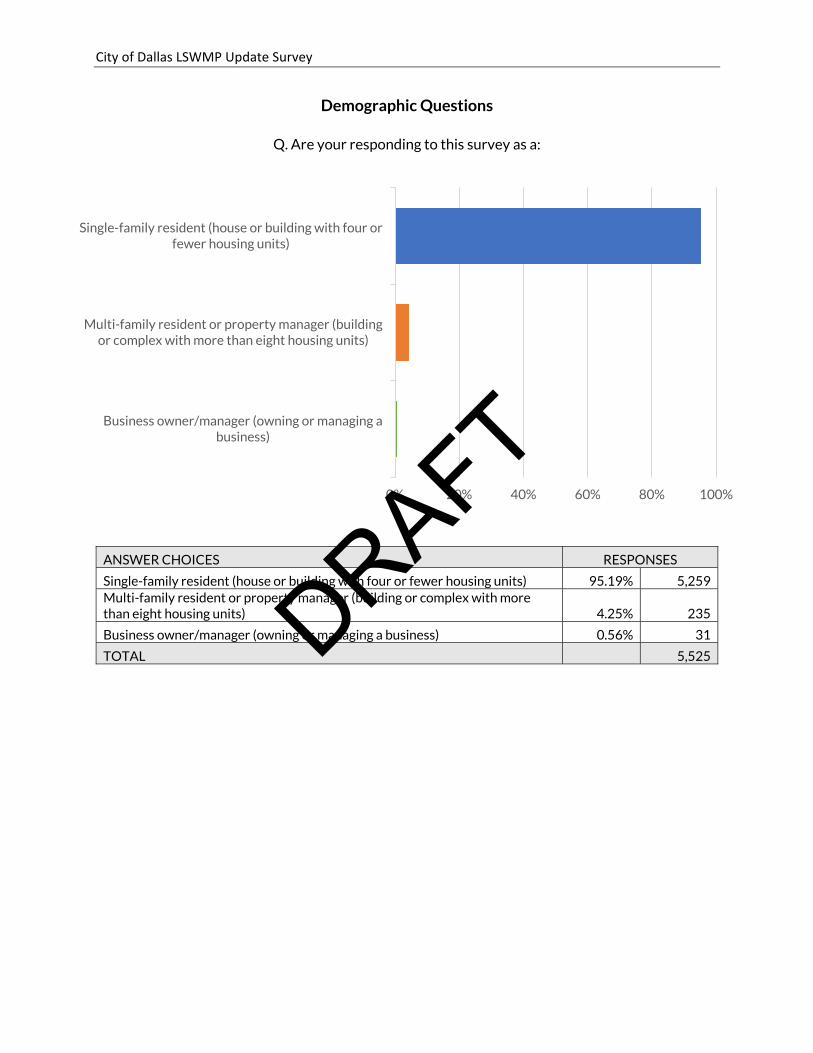
City of Dallas LSWMP Update Survey
Demographic Questions
Q. Are your responding to this survey as a:
ANSWER CHOICES RESPONSES
Single-family resident (house or building with four or fewer housing units) 95.19% 5,259 Multi-family resident or property manager (building or complex with more than eight housing units) 4.25% 235
Business owner/manager (owning or managing a business) 0.56% 31
TOTAL 5,525
0% 20% 40% 60% 80% 100%
Business owner/manager (owning or managing abusiness)
Multi-family resident or property manager (buildingor complex with more than eight housing units)
Single-family resident (house or building with four orfewer housing units)
DRAFT
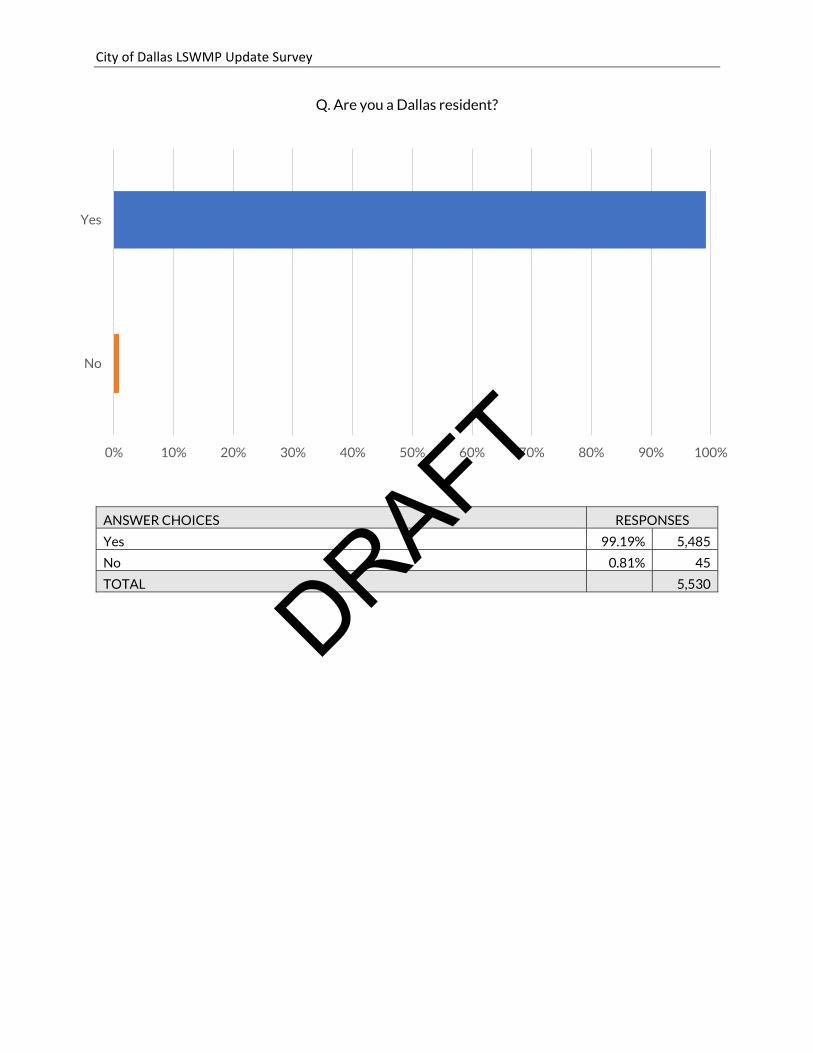
City of Dallas LSWMP Update Survey
Q. Are you a Dallas resident?
ANSWER CHOICES RESPONSES
Yes 99.19% 5,485
No 0.81% 45
TOTAL 5,530
0% 10% 20% 30% 40% 50% 60% 70% 80% 90% 100%
No
Yes
DRAFT
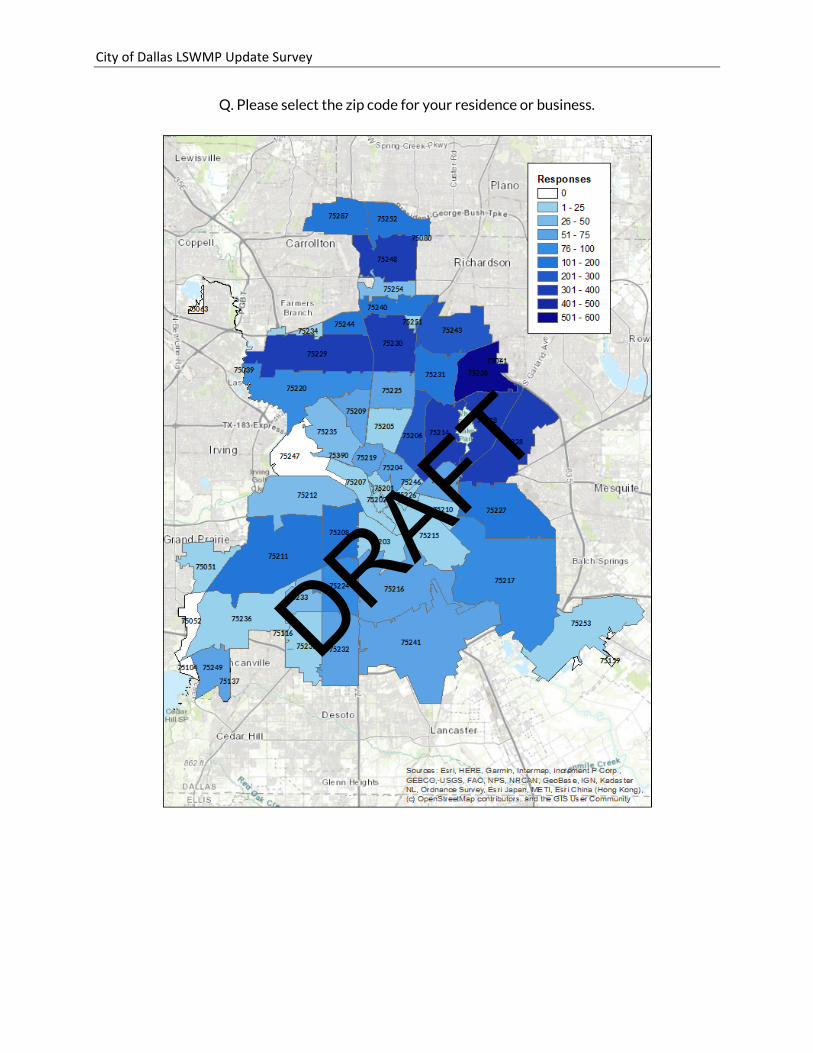
City of Dallas LSWMP Update Survey
Q. Please select the zip code for your residence or business.
DRAFT
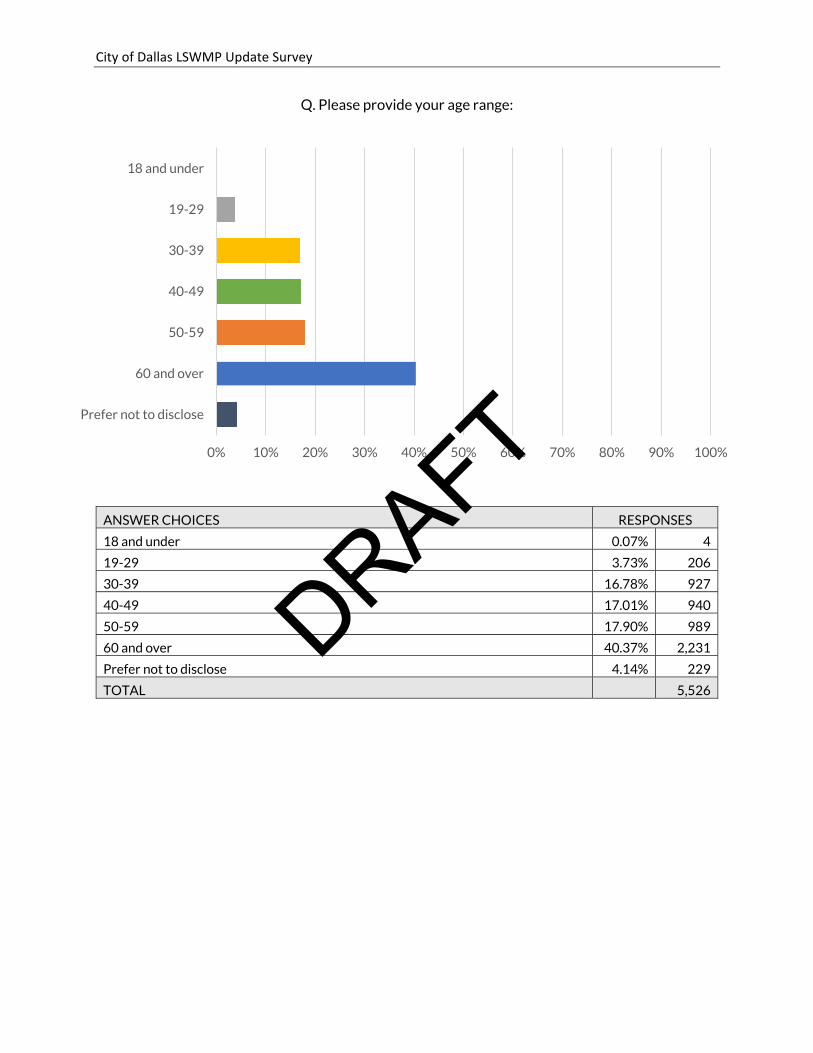
City of Dallas LSWMP Update Survey
Q. Please provide your age range:
ANSWER CHOICES RESPONSES
18 and under 0.07% 4
19-29 3.73% 206
30-39 16.78% 927
40-49 17.01% 940
50-59 17.90% 989
60 and over 40.37% 2,231
Prefer not to disclose 4.14% 229
TOTAL 5,526
0% 10% 20% 30% 40% 50% 60% 70% 80% 90% 100%
Prefer not to disclose
60 and over
50-59
40-49
30-39
19-29
18 and under
DRAFT
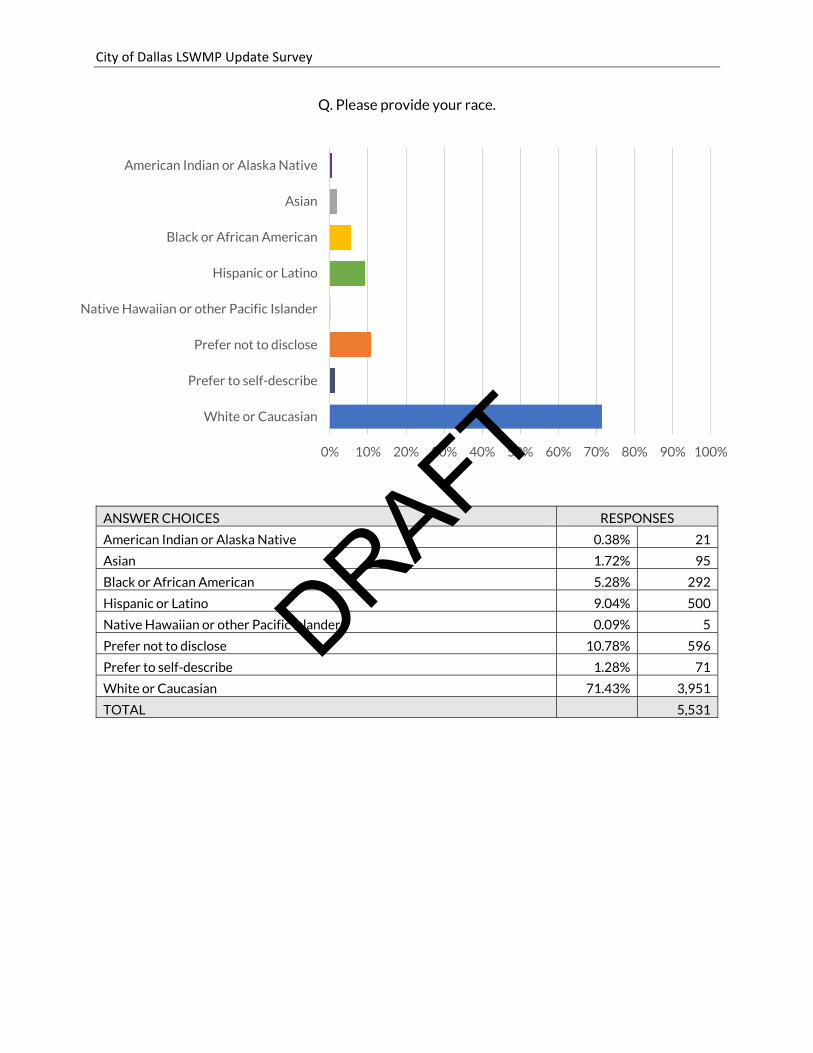
City of Dallas LSWMP Update Survey
Q. Please provide your race.
ANSWER CHOICES RESPONSES
American Indian or Alaska Native 0.38% 21
Asian 1.72% 95
Black or African American 5.28% 292
Hispanic or Latino 9.04% 500
Native Hawaiian or other Pacific Islander 0.09% 5
Prefer not to disclose 10.78% 596
Prefer to self-describe 1.28% 71
White or Caucasian 71.43% 3,951
TOTAL 5,531
0% 10% 20% 30% 40% 50% 60% 70% 80% 90% 100%
White or Caucasian
Prefer to self-describe
Prefer not to disclose
Native Hawaiian or other Pacific Islander
Hispanic or Latino
Black or African American
Asian
American Indian or Alaska Native
DRAFT
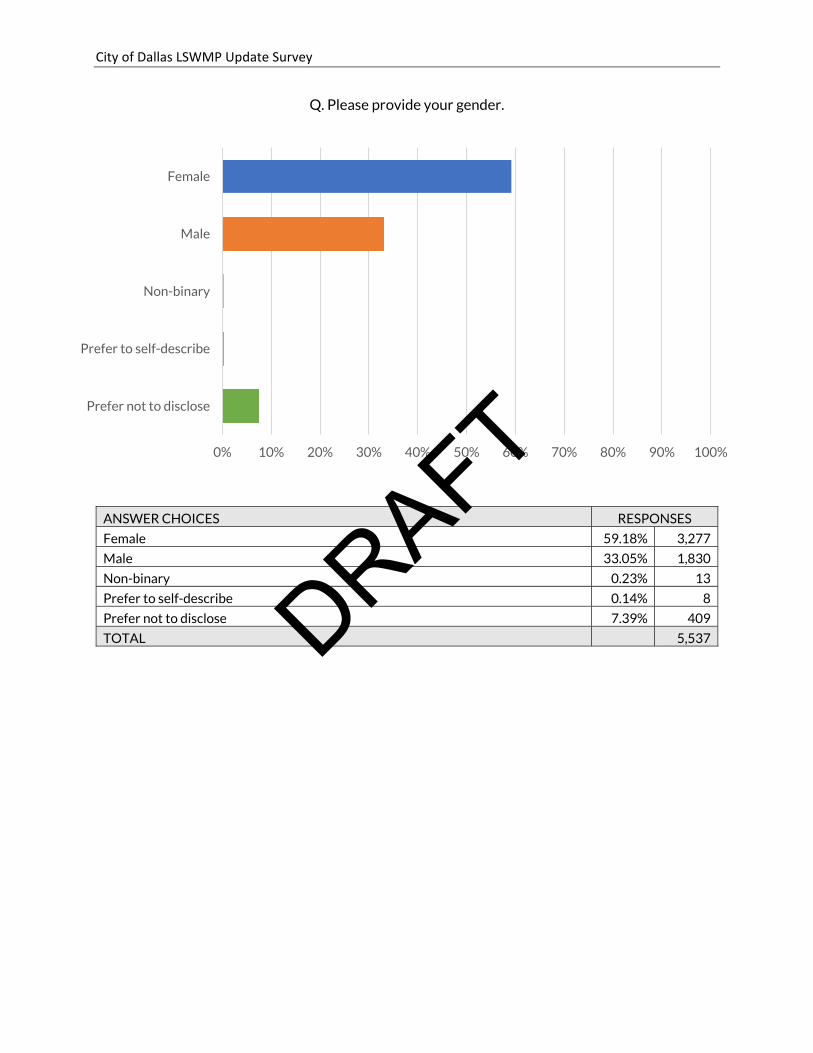
City of Dallas LSWMP Update Survey
Q. Please provide your gender.
ANSWER CHOICES RESPONSES
Female 59.18% 3,277
Male 33.05% 1,830
Non-binary 0.23% 13
Prefer to self-describe 0.14% 8
Prefer not to disclose 7.39% 409
TOTAL 5,537
0% 10% 20% 30% 40% 50% 60% 70% 80% 90% 100%
Prefer not to disclose
Prefer to self-describe
Non-binary
Male
Female
DRAFT
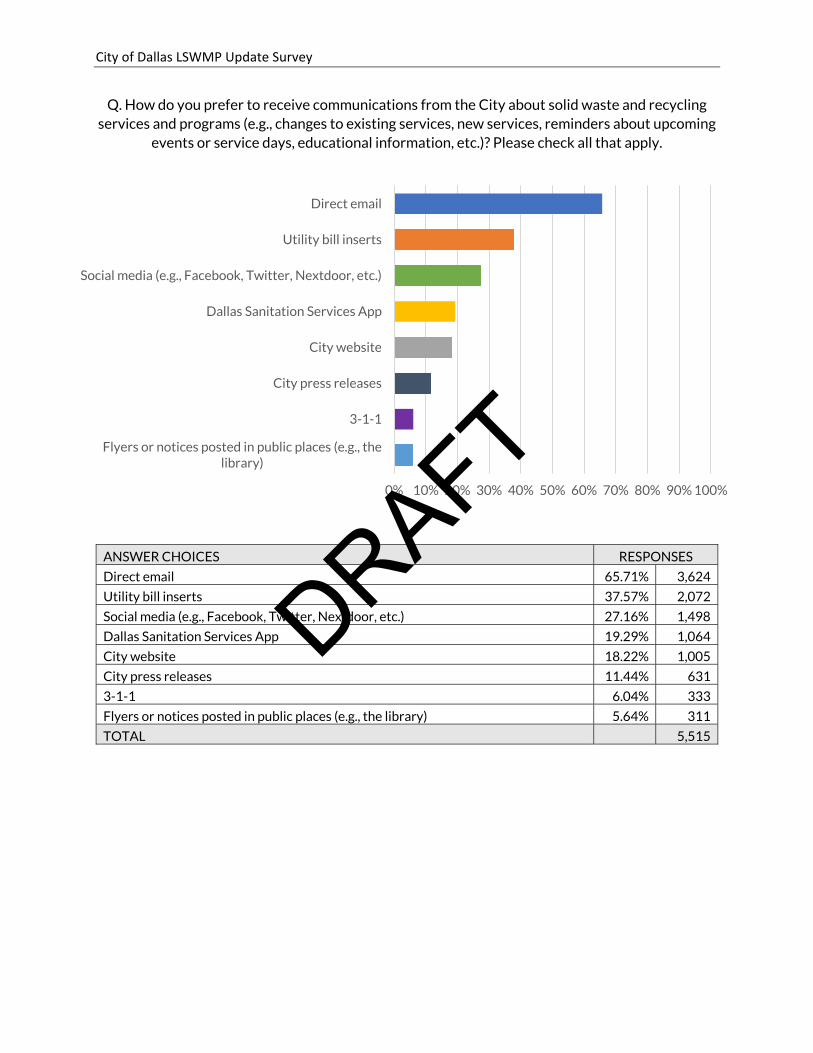
City of Dallas LSWMP Update Survey
Q. How do you prefer to receive communications from the City about solid waste and recycling services and programs (e.g., changes to existing services, new services, reminders about upcoming
events or service days, educational information, etc.)? Please check all that apply.
ANSWER CHOICES RESPONSES
Direct email 65.71% 3,624
Utility bill inserts 37.57% 2,072
Social media (e.g., Facebook, Twitter, Nextdoor, etc.) 27.16% 1,498
Dallas Sanitation Services App 19.29% 1,064
City website 18.22% 1,005
City press releases 11.44% 631
3-1-1 6.04% 333
Flyers or notices posted in public places (e.g., the library) 5.64% 311
TOTAL 5,515
0% 10% 20% 30% 40% 50% 60% 70% 80% 90% 100%
Flyers or notices posted in public places (e.g., thelibrary)
3-1-1
City press releases
City website
Dallas Sanitation Services App
Social media (e.g., Facebook, Twitter, Nextdoor, etc.)
Utility bill inserts
Direct email
DRAFT
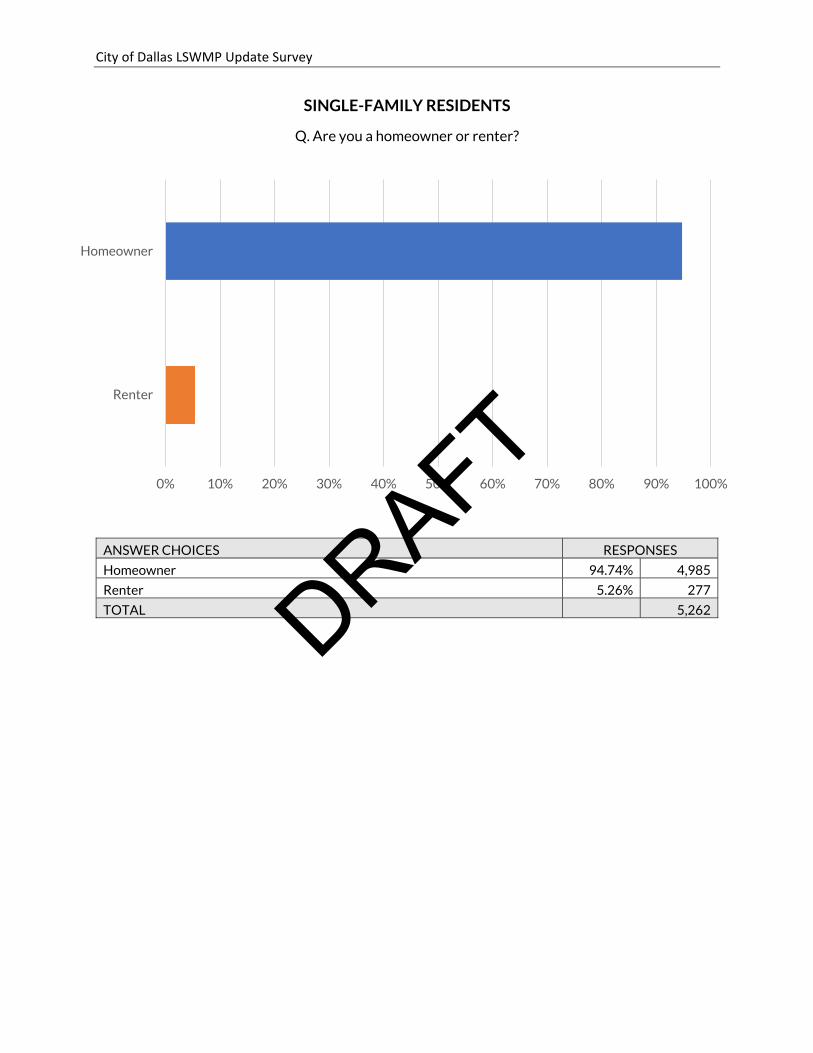
City of Dallas LSWMP Update Survey
SINGLE-FAMILY RESIDENTS
Q. Are you a homeowner or renter?
ANSWER CHOICES RESPONSES
Homeowner 94.74% 4,985
Renter 5.26% 277
TOTAL 5,262
0% 10% 20% 30% 40% 50% 60% 70% 80% 90% 100%
Renter
Homeowner
DRAFT
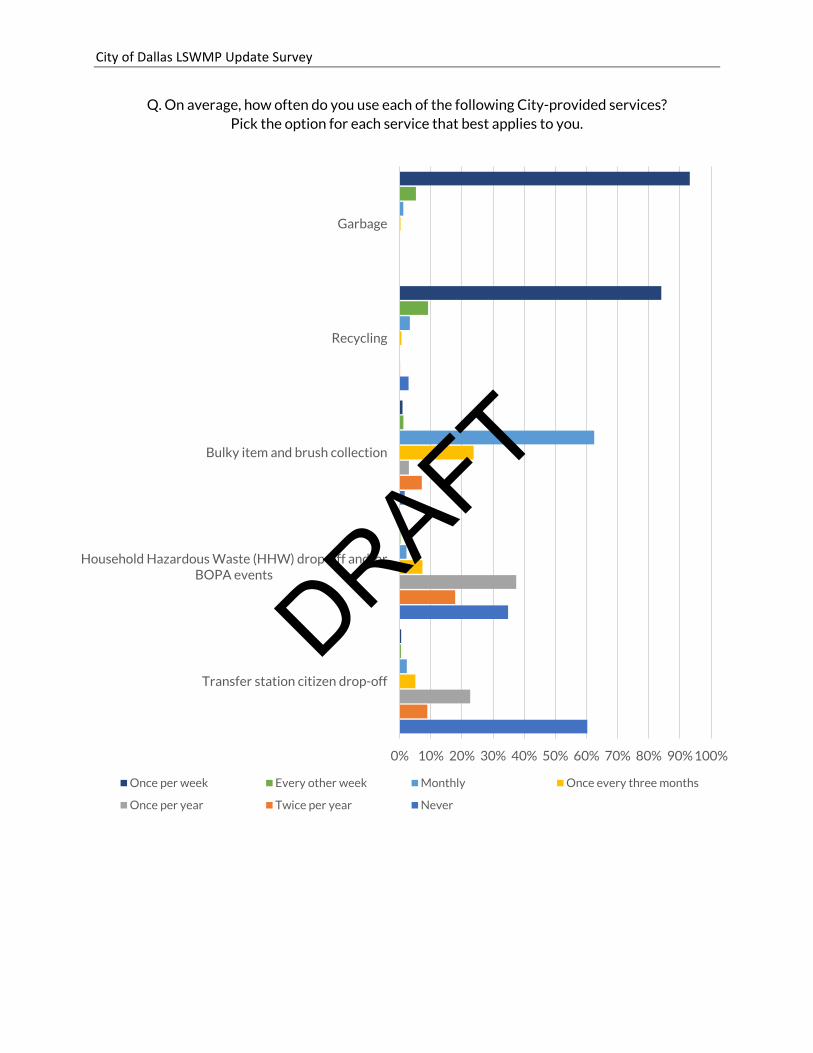
City of Dallas LSWMP Update Survey
Q. On average, how often do you use each of the following City-provided services? Pick the option for each service that best applies to you.
0% 10% 20% 30% 40% 50% 60% 70% 80% 90% 100%
Transfer station citizen drop-off
Household Hazardous Waste (HHW) drop-off and/orBOPA events
Bulky item and brush collection
Recycling
Garbage
Once per week Every other week Monthly Once every three months
Once per year Twice per year Never
DRAFT
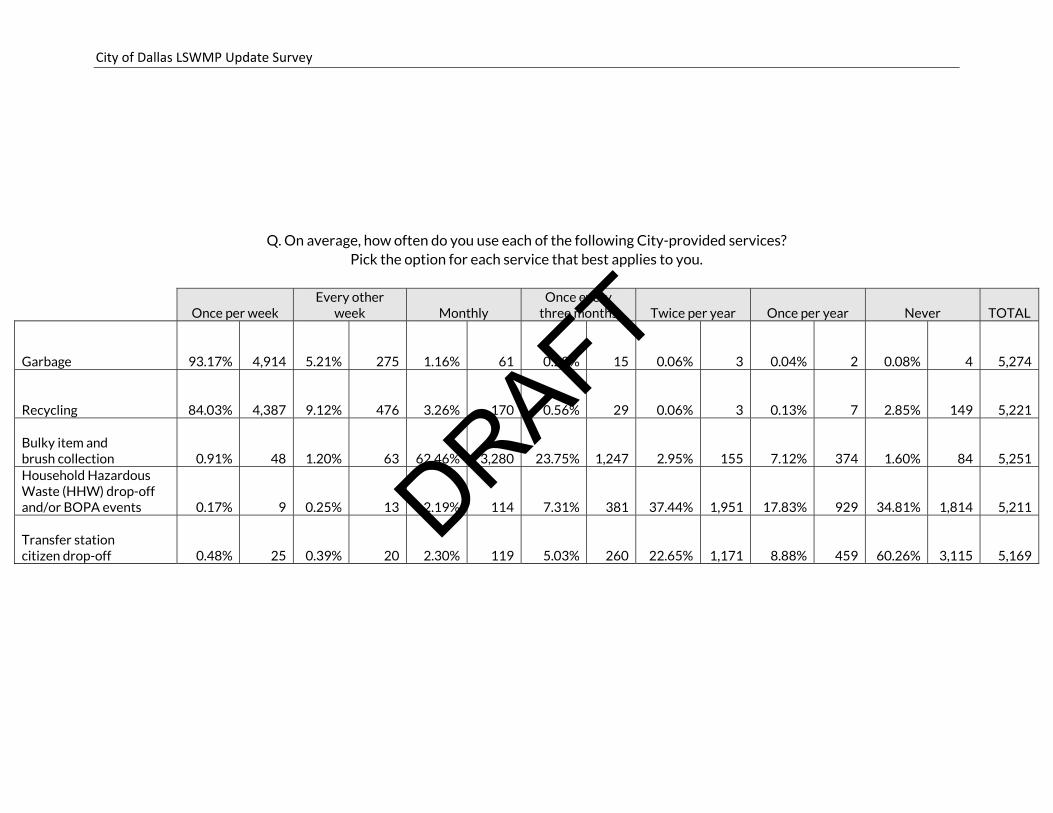
City of Dallas LSWMP Update Survey
Q. On average, how often do you use each of the following City-provided services?
Pick the option for each service that best applies to you.
Once per week Every other
week Monthly Once every
three months Twice per year Once per year Never TOTAL
Garbage 93.17% 4,914 5.21% 275 1.16% 61 0.28% 15 0.06% 3 0.04% 2 0.08% 4 5,274
Recycling 84.03% 4,387 9.12% 476 3.26% 170 0.56% 29 0.06% 3 0.13% 7 2.85% 149 5,221
Bulky item and brush collection 0.91% 48 1.20% 63 62.46% 3,280 23.75% 1,247 2.95% 155 7.12% 374 1.60% 84 5,251 Household Hazardous Waste (HHW) drop-off and/or BOPA events 0.17% 9 0.25% 13 2.19% 114 7.31% 381 37.44% 1,951 17.83% 929 34.81% 1,814 5,211
Transfer station citizen drop-off 0.48% 25 0.39% 20 2.30% 119 5.03% 260 22.65% 1,171 8.88% 459 60.26% 3,115 5,169
DRAFT
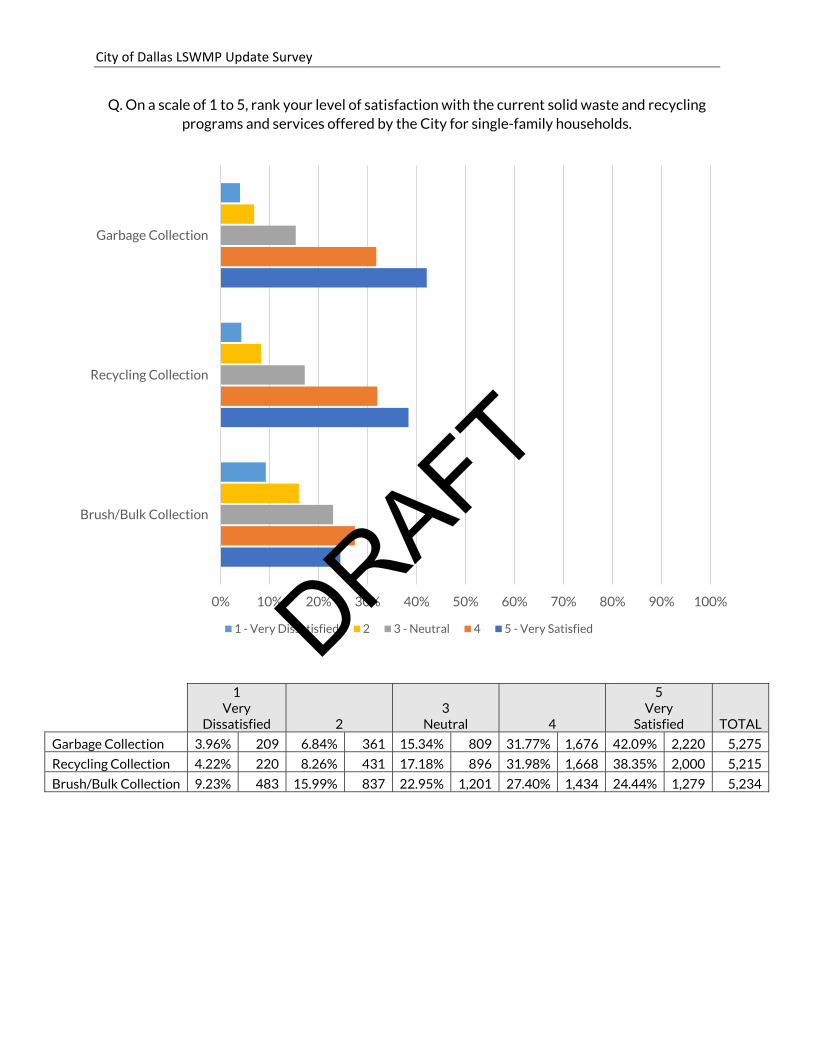
City of Dallas LSWMP Update Survey
Q. On a scale of 1 to 5, rank your level of satisfaction with the current solid waste and recycling programs and services offered by the City for single-family households.
1 Very
Dissatisfied 2 3
Neutral 4
5 Very
Satisfied TOTAL
Garbage Collection 3.96% 209 6.84% 361 15.34% 809 31.77% 1,676 42.09% 2,220 5,275
Recycling Collection 4.22% 220 8.26% 431 17.18% 896 31.98% 1,668 38.35% 2,000 5,215
Brush/Bulk Collection 9.23% 483 15.99% 837 22.95% 1,201 27.40% 1,434 24.44% 1,279 5,234
0% 10% 20% 30% 40% 50% 60% 70% 80% 90% 100%
Brush/Bulk Collection
Recycling Collection
Garbage Collection
1 - Very Dissatisfied 2 3 - Neutral 4 5 - Very SatisfiedDRAFT
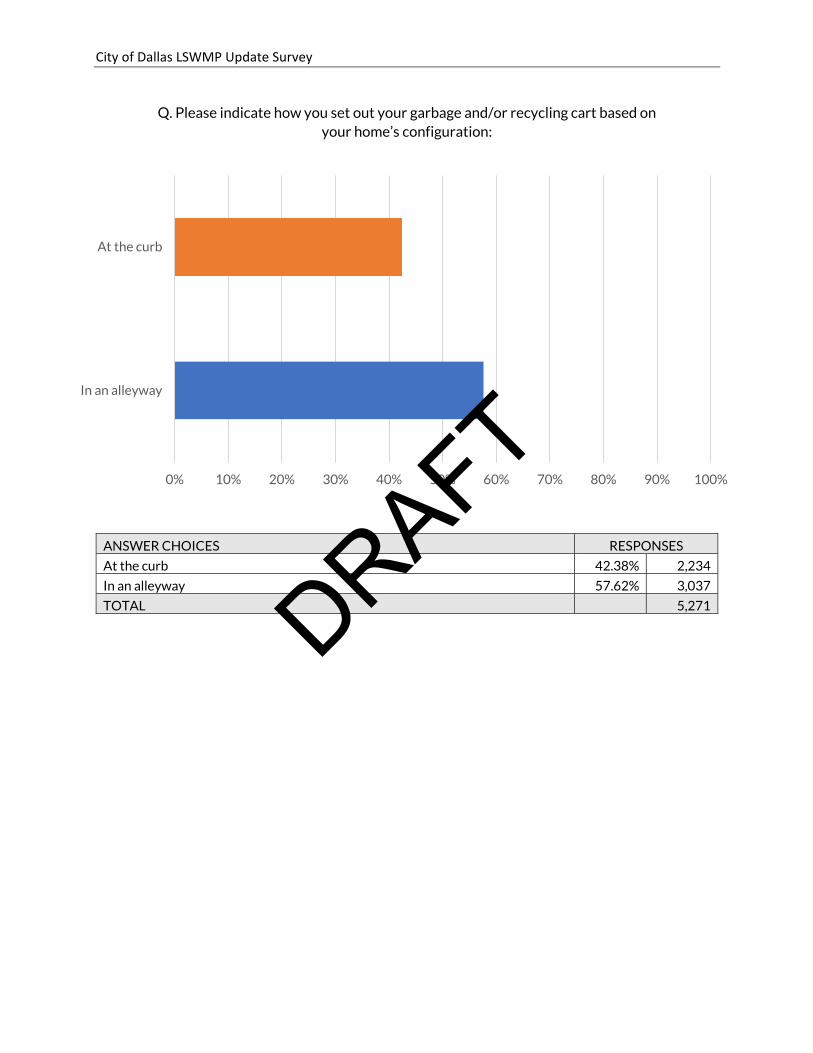
City of Dallas LSWMP Update Survey
Q. Please indicate how you set out your garbage and/or recycling cart based on your home’s configuration:
ANSWER CHOICES RESPONSES
At the curb 42.38% 2,234
In an alleyway 57.62% 3,037
TOTAL 5,271
0% 10% 20% 30% 40% 50% 60% 70% 80% 90% 100%
In an alleyway
At the curb
DRAFT
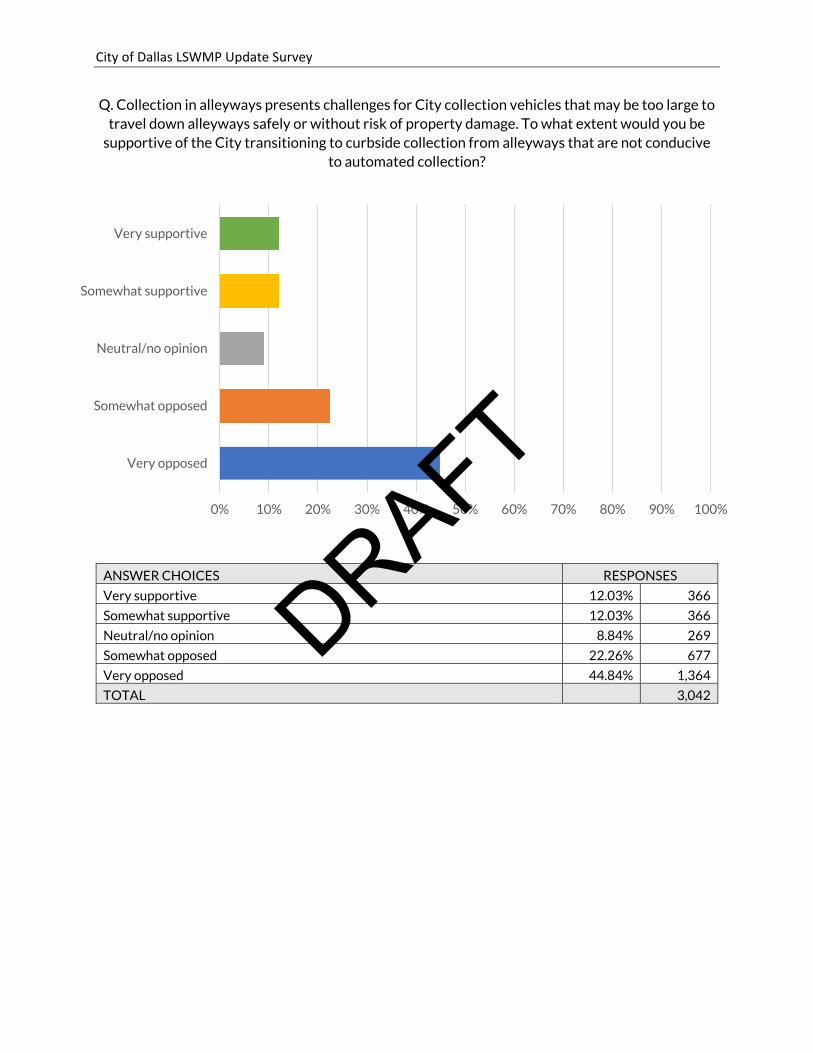
City of Dallas LSWMP Update Survey
Q. Collection in alleyways presents challenges for City collection vehicles that may be too large to travel down alleyways safely or without risk of property damage. To what extent would you be
supportive of the City transitioning to curbside collection from alleyways that are not conducive to automated collection?
ANSWER CHOICES RESPONSES
Very supportive 12.03% 366
Somewhat supportive 12.03% 366
Neutral/no opinion 8.84% 269
Somewhat opposed 22.26% 677
Very opposed 44.84% 1,364
TOTAL 3,042
0% 10% 20% 30% 40% 50% 60% 70% 80% 90% 100%
Very opposed
Somewhat opposed
Neutral/no opinion
Somewhat supportive
Very supportive
DRAFT
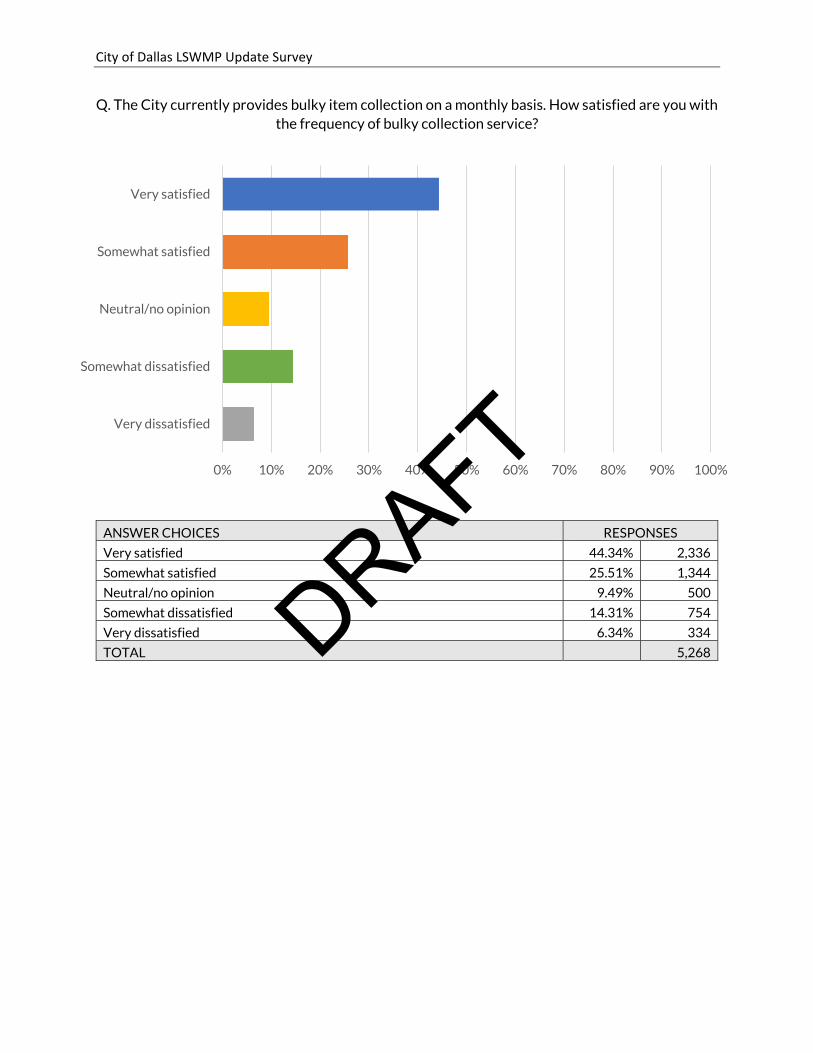
City of Dallas LSWMP Update Survey
Q. The City currently provides bulky item collection on a monthly basis. How satisfied are you with the frequency of bulky collection service?
ANSWER CHOICES RESPONSES
Very satisfied 44.34% 2,336
Somewhat satisfied 25.51% 1,344
Neutral/no opinion 9.49% 500
Somewhat dissatisfied 14.31% 754
Very dissatisfied 6.34% 334
TOTAL 5,268
0% 10% 20% 30% 40% 50% 60% 70% 80% 90% 100%
Very dissatisfied
Somewhat dissatisfied
Neutral/no opinion
Somewhat satisfied
Very satisfied
DRAFT
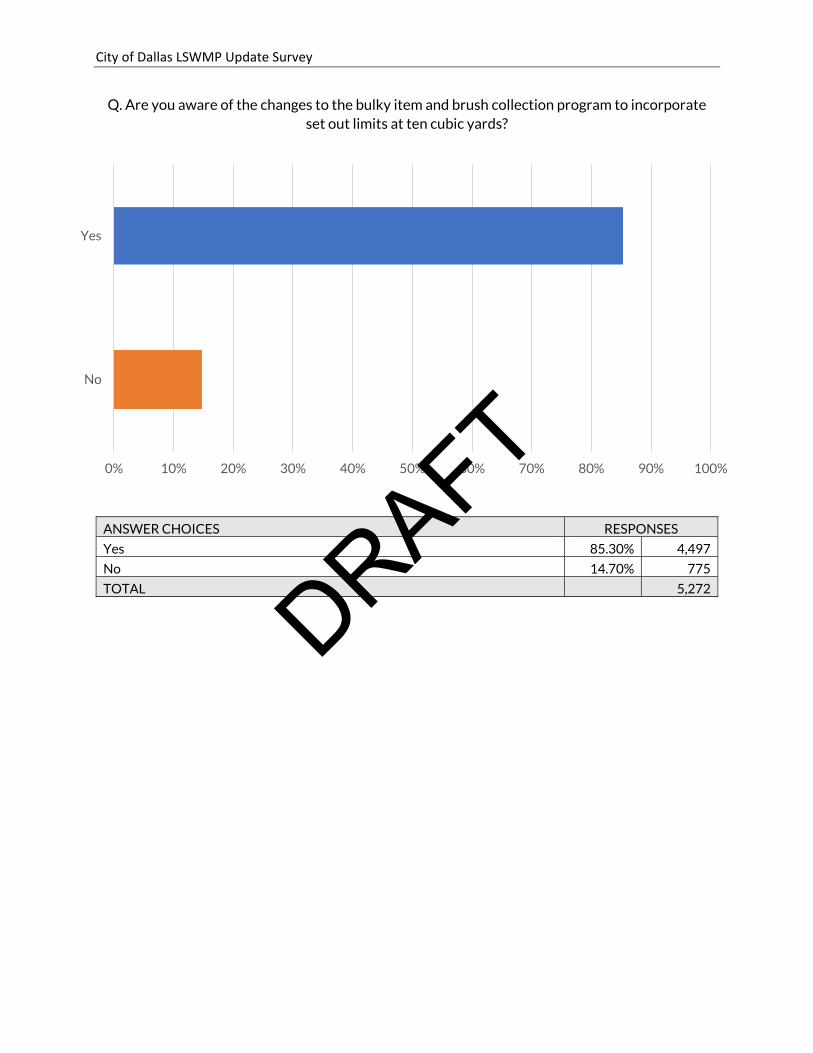
City of Dallas LSWMP Update Survey
Q. Are you aware of the changes to the bulky item and brush collection program to incorporate set out limits at ten cubic yards?
ANSWER CHOICES RESPONSES
Yes 85.30% 4,497
No 14.70% 775
TOTAL 5,272
0% 10% 20% 30% 40% 50% 60% 70% 80% 90% 100%
No
Yes
DRAFT
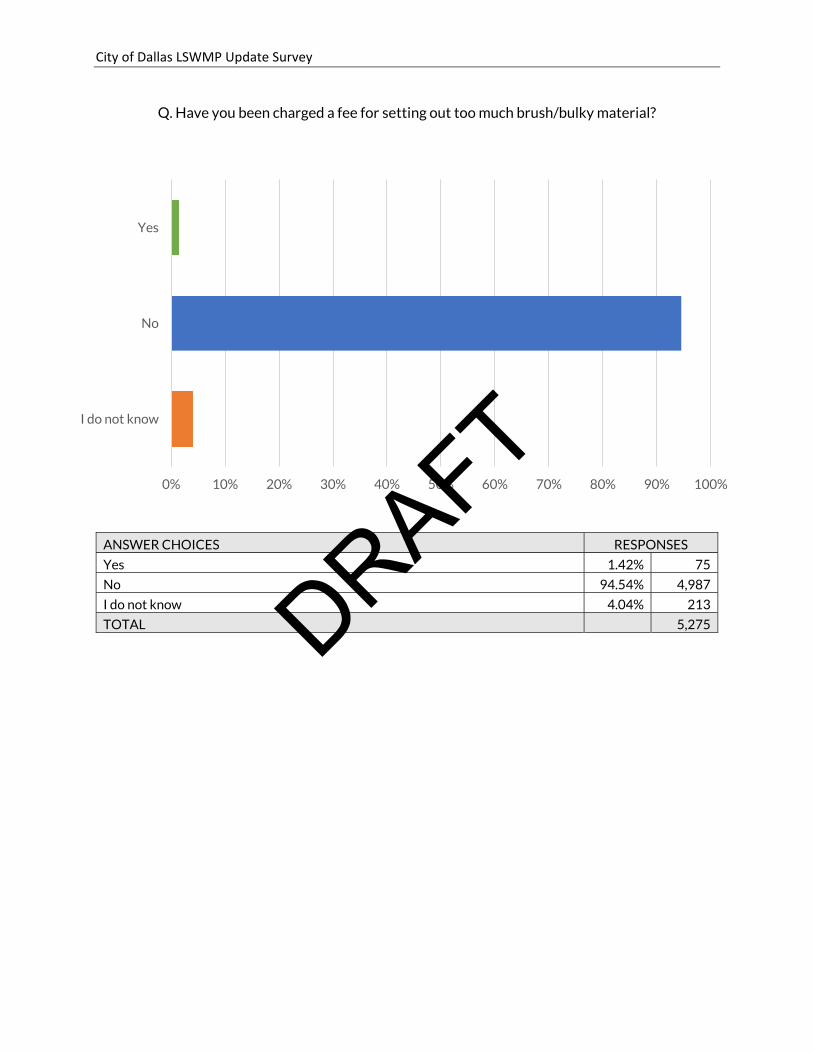
City of Dallas LSWMP Update Survey
Q. Have you been charged a fee for setting out too much brush/bulky material?
ANSWER CHOICES RESPONSES
Yes 1.42% 75
No 94.54% 4,987
I do not know 4.04% 213
TOTAL 5,275
0% 10% 20% 30% 40% 50% 60% 70% 80% 90% 100%
I do not know
No
Yes
DRAFT
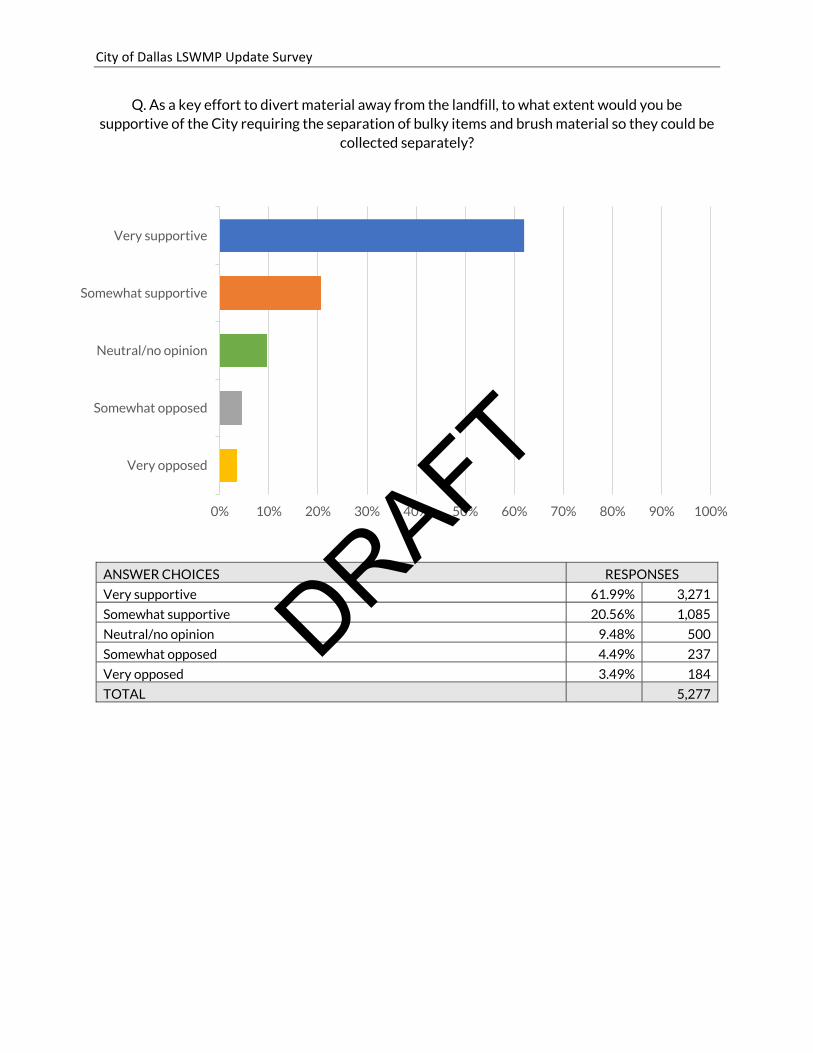
City of Dallas LSWMP Update Survey
Q. As a key effort to divert material away from the landfill, to what extent would you be supportive of the City requiring the separation of bulky items and brush material so they could be
collected separately?
ANSWER CHOICES RESPONSES
Very supportive 61.99% 3,271
Somewhat supportive 20.56% 1,085
Neutral/no opinion 9.48% 500
Somewhat opposed 4.49% 237
Very opposed 3.49% 184
TOTAL 5,277
0% 10% 20% 30% 40% 50% 60% 70% 80% 90% 100%
Very opposed
Somewhat opposed
Neutral/no opinion
Somewhat supportive
Very supportive
DRAFT
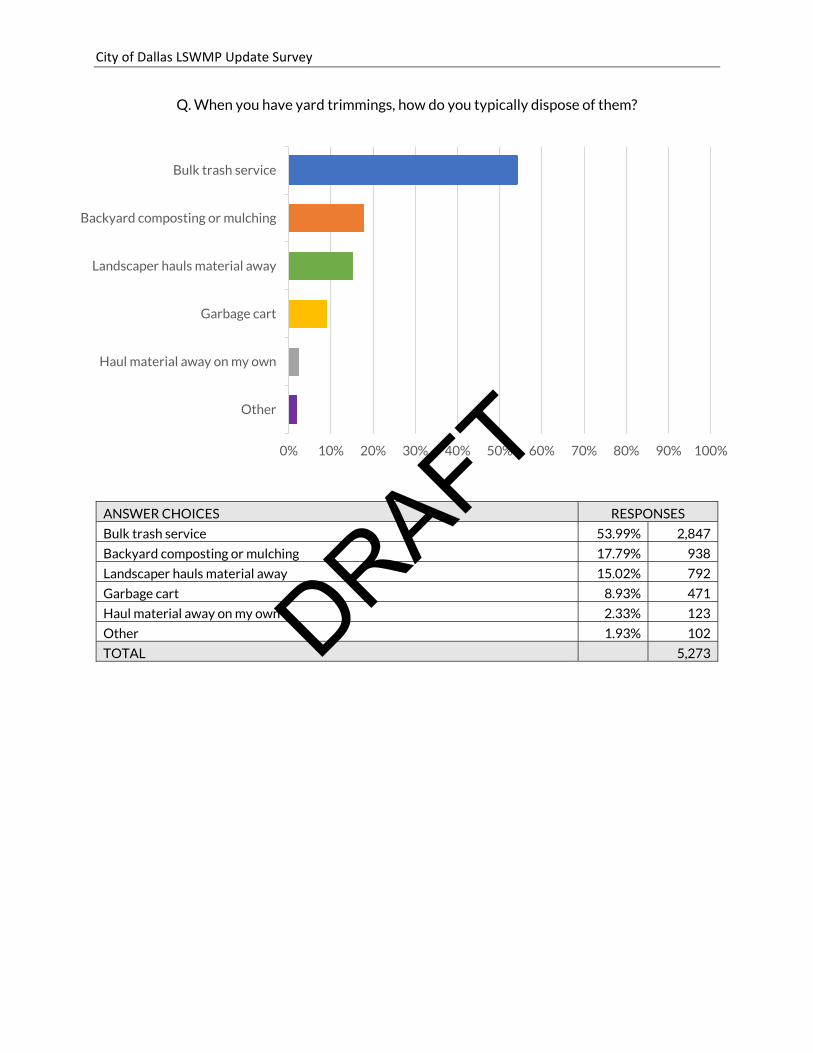
City of Dallas LSWMP Update Survey
Q. When you have yard trimmings, how do you typically dispose of them?
ANSWER CHOICES RESPONSES
Bulk trash service 53.99% 2,847
Backyard composting or mulching 17.79% 938
Landscaper hauls material away 15.02% 792
Garbage cart 8.93% 471
Haul material away on my own 2.33% 123
Other 1.93% 102
TOTAL 5,273
0% 10% 20% 30% 40% 50% 60% 70% 80% 90% 100%
Other
Haul material away on my own
Garbage cart
Landscaper hauls material away
Backyard composting or mulching
Bulk trash service
DRAFT
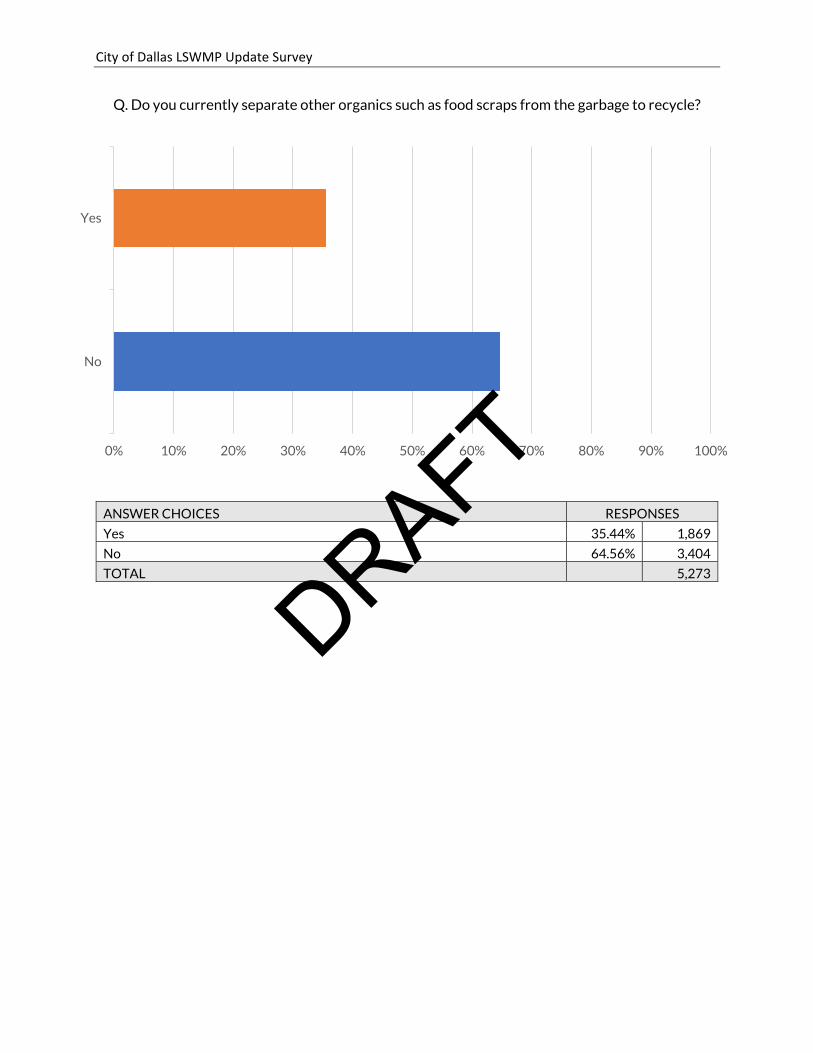
City of Dallas LSWMP Update Survey
Q. Do you currently separate other organics such as food scraps from the garbage to recycle?
ANSWER CHOICES RESPONSES
Yes 35.44% 1,869
No 64.56% 3,404
TOTAL 5,273
0% 10% 20% 30% 40% 50% 60% 70% 80% 90% 100%
No
Yes
DRAFT
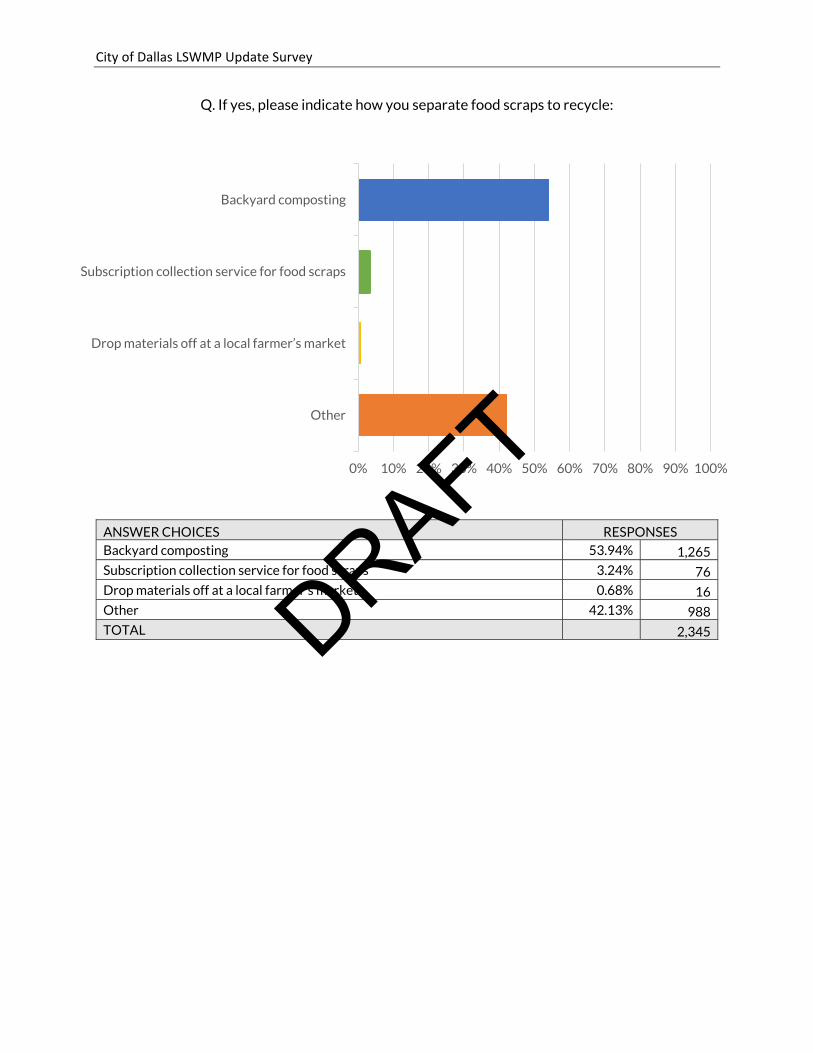
City of Dallas LSWMP Update Survey
Q. If yes, please indicate how you separate food scraps to recycle:
ANSWER CHOICES RESPONSES Backyard composting 53.94% 1,265 Subscription collection service for food scraps 3.24% 76 Drop materials off at a local farmer’s market 0.68% 16 Other 42.13% 988 TOTAL 2,345
0% 10% 20% 30% 40% 50% 60% 70% 80% 90% 100%
Other
Drop materials off at a local farmer’s market
Subscription collection service for food scraps
Backyard composting
DRAFT
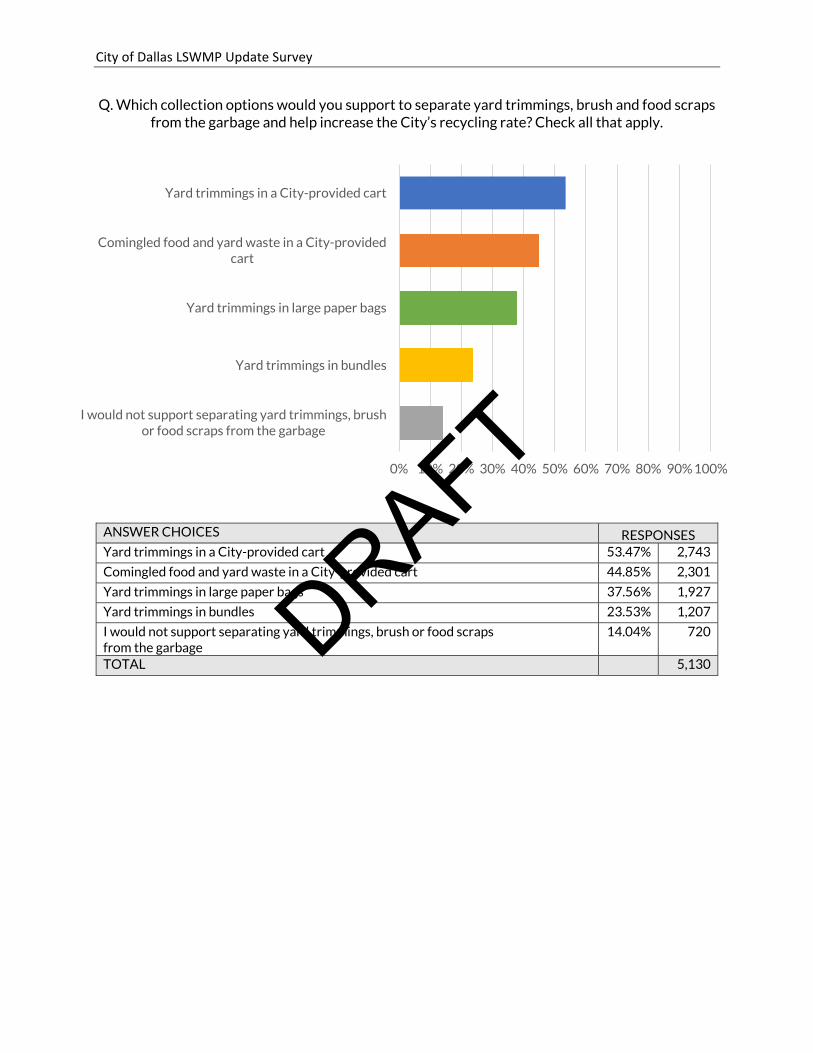
City of Dallas LSWMP Update Survey
Q. Which collection options would you support to separate yard trimmings, brush and food scraps from the garbage and help increase the City’s recycling rate? Check all that apply.
ANSWER CHOICES RESPONSES Yard trimmings in a City-provided cart 53.47% 2,743
Comingled food and yard waste in a City-provided cart 44.85% 2,301
Yard trimmings in large paper bags 37.56% 1,927
Yard trimmings in bundles 23.53% 1,207
I would not support separating yard trimmings, brush or food scraps from the garbage
14.04% 720
TOTAL 5,130
0% 10% 20% 30% 40% 50% 60% 70% 80% 90% 100%
I would not support separating yard trimmings, brushor food scraps from the garbage
Yard trimmings in bundles
Yard trimmings in large paper bags
Comingled food and yard waste in a City-providedcart
Yard trimmings in a City-provided cart
DRAFT
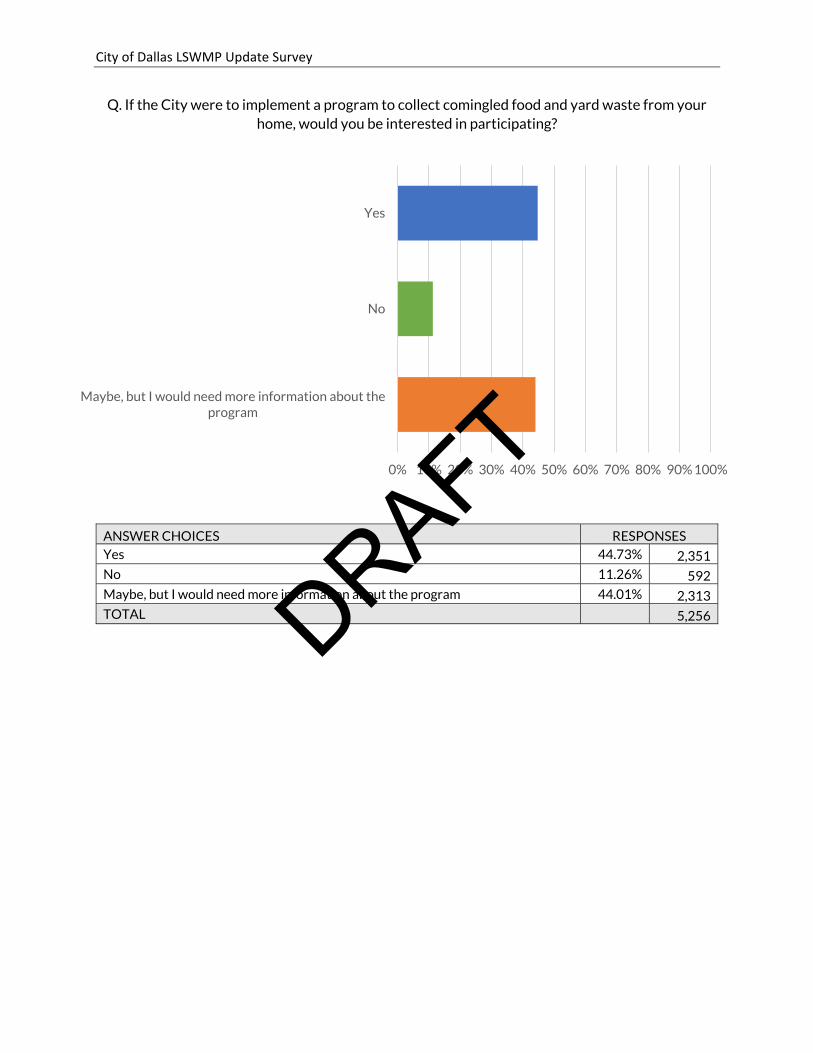
City of Dallas LSWMP Update Survey
Q. If the City were to implement a program to collect comingled food and yard waste from your home, would you be interested in participating?
ANSWER CHOICES RESPONSES Yes 44.73% 2,351 No 11.26% 592 Maybe, but I would need more information about the program 44.01% 2,313 TOTAL 5,256
0% 10% 20% 30% 40% 50% 60% 70% 80% 90% 100%
Maybe, but I would need more information about theprogram
No
Yes
DRAFT
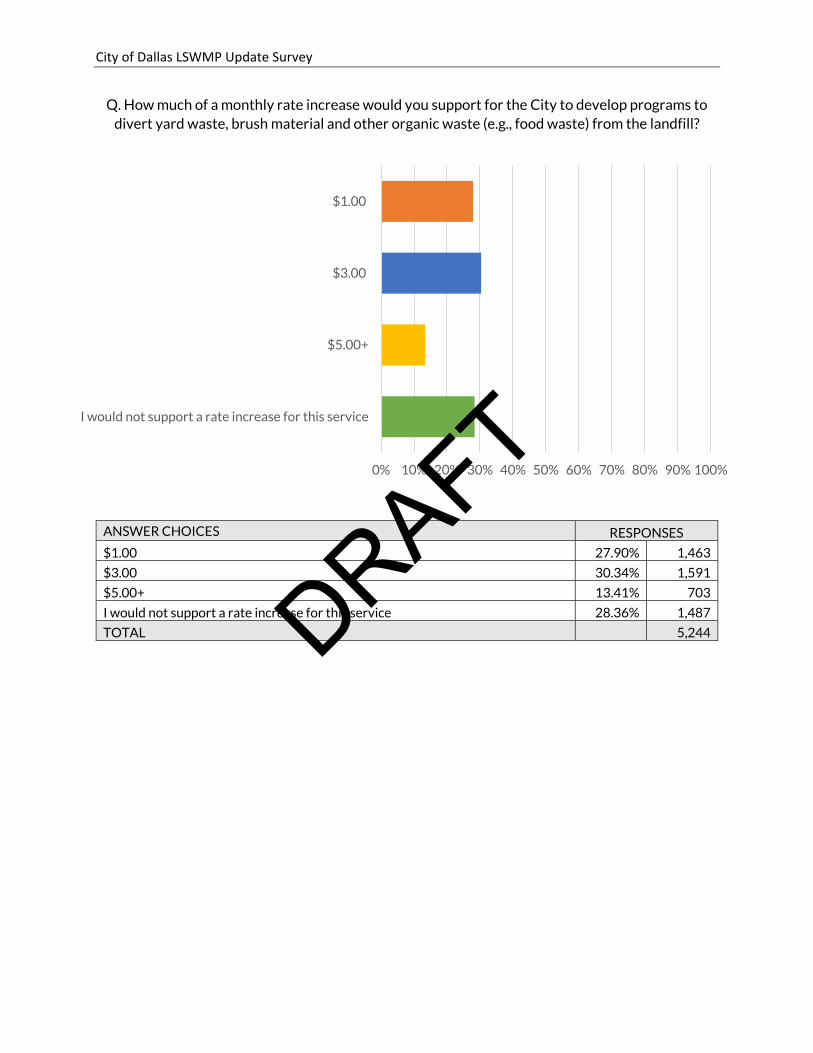
City of Dallas LSWMP Update Survey
Q. How much of a monthly rate increase would you support for the City to develop programs to divert yard waste, brush material and other organic waste (e.g., food waste) from the landfill?
ANSWER CHOICES RESPONSES
$1.00 27.90% 1,463
$3.00 30.34% 1,591
$5.00+ 13.41% 703
I would not support a rate increase for this service 28.36% 1,487
TOTAL 5,244
0% 10% 20% 30% 40% 50% 60% 70% 80% 90% 100%
I would not support a rate increase for this service
$5.00+
$3.00
$1.00
DRAFT
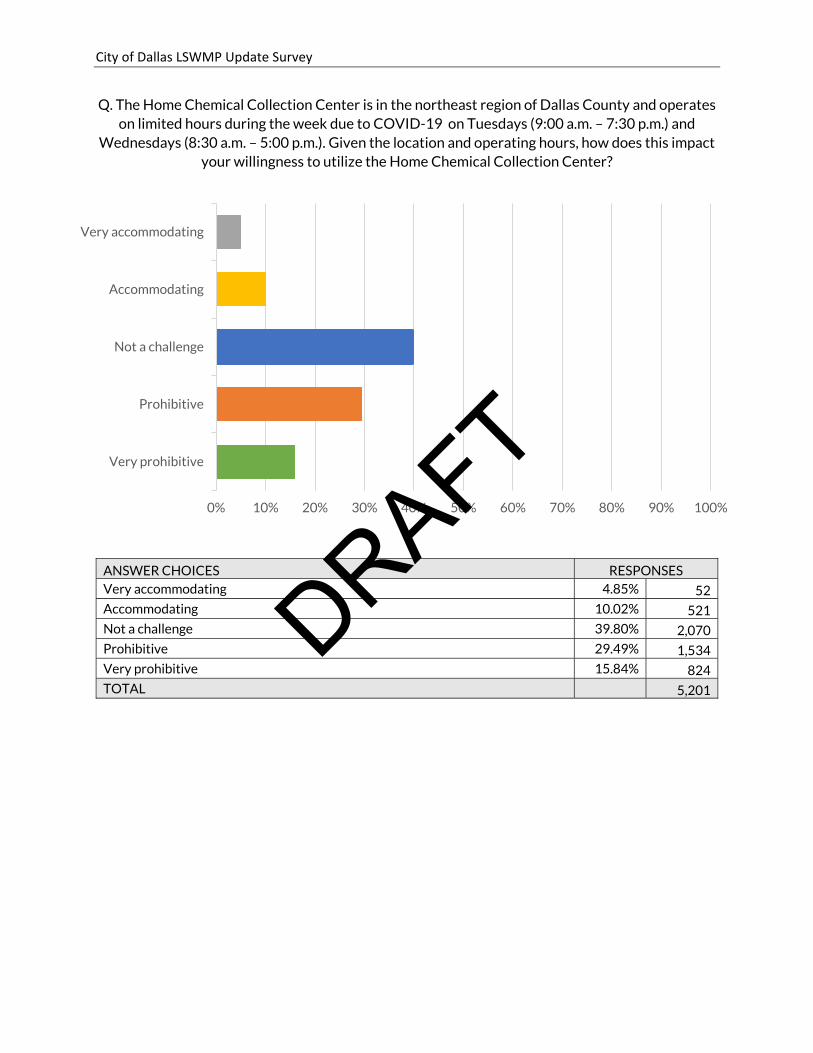
City of Dallas LSWMP Update Survey
Q. The Home Chemical Collection Center is in the northeast region of Dallas County and operates on limited hours during the week due to COVID-19 on Tuesdays (9:00 a.m. – 7:30 p.m.) and
Wednesdays (8:30 a.m. – 5:00 p.m.). Given the location and operating hours, how does this impact your willingness to utilize the Home Chemical Collection Center?
ANSWER CHOICES RESPONSES Very accommodating 4.85% 52 Accommodating 10.02% 521 Not a challenge 39.80% 2,070 Prohibitive 29.49% 1,534 Very prohibitive 15.84% 824 TOTAL 5,201
0% 10% 20% 30% 40% 50% 60% 70% 80% 90% 100%
Very prohibitive
Prohibitive
Not a challenge
Accommodating
Very accommodating
DRAFT
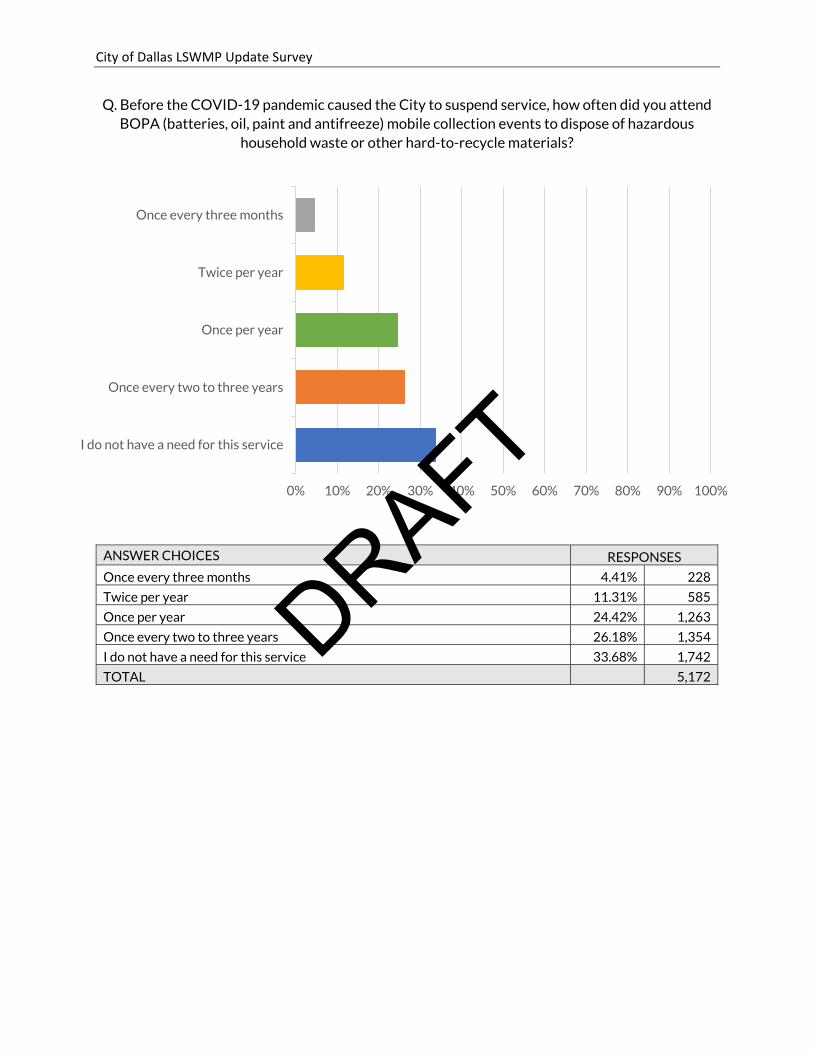
City of Dallas LSWMP Update Survey
Q. Before the COVID-19 pandemic caused the City to suspend service, how often did you attend BOPA (batteries, oil, paint and antifreeze) mobile collection events to dispose of hazardous
household waste or other hard-to-recycle materials?
ANSWER CHOICES RESPONSES
Once every three months 4.41% 228
Twice per year 11.31% 585
Once per year 24.42% 1,263
Once every two to three years 26.18% 1,354
I do not have a need for this service 33.68% 1,742
TOTAL 5,172
0% 10% 20% 30% 40% 50% 60% 70% 80% 90% 100%
I do not have a need for this service
Once every two to three years
Once per year
Twice per year
Once every three months
DRAFT
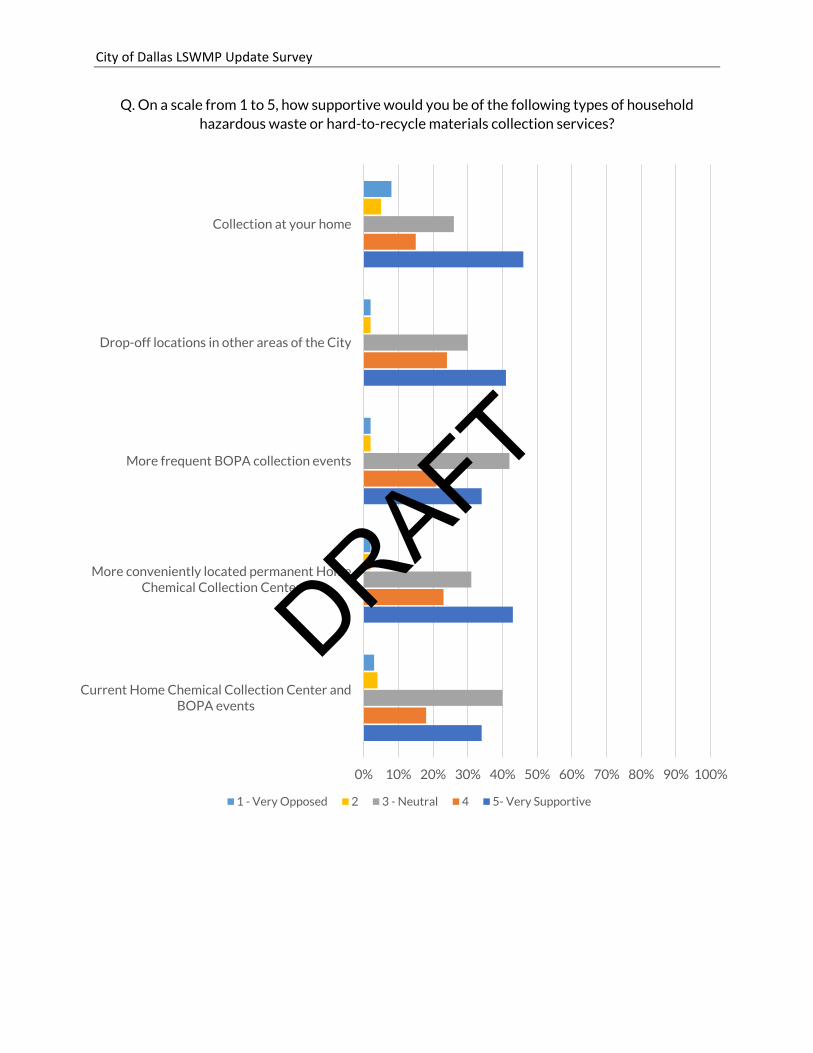
City of Dallas LSWMP Update Survey
Q. On a scale from 1 to 5, how supportive would you be of the following types of household hazardous waste or hard-to-recycle materials collection services?
0% 10% 20% 30% 40% 50% 60% 70% 80% 90% 100%
Current Home Chemical Collection Center andBOPA events
More conveniently located permanent HomeChemical Collection Center
More frequent BOPA collection events
Drop-off locations in other areas of the City
Collection at your home
1 - Very Opposed 2 3 - Neutral 4 5- Very Supportive
DRAFT
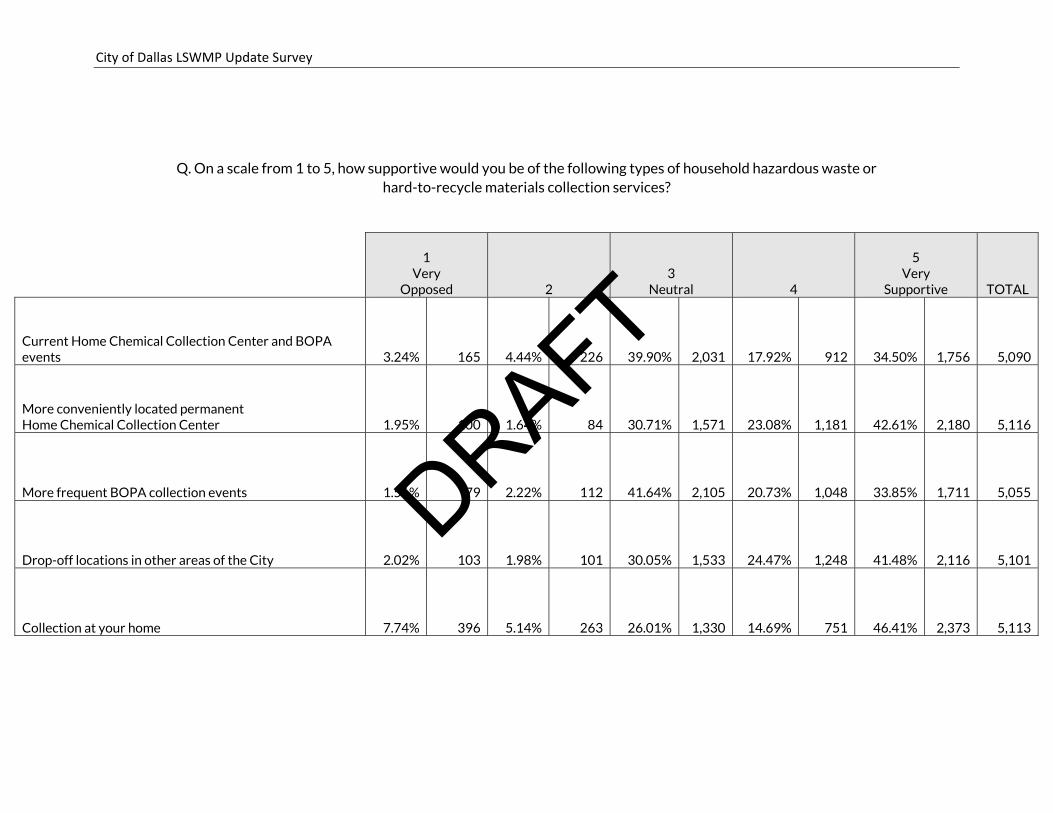
City of Dallas LSWMP Update Survey
Q. On a scale from 1 to 5, how supportive would you be of the following types of household hazardous waste or hard-to-recycle materials collection services?
1 Very
Opposed
2
3
Neutral
4
5
Very Supportive TOTAL
Current Home Chemical Collection Center and BOPA events 3.24% 165 4.44% 226 39.90% 2,031 17.92% 912 34.50% 1,756 5,090
More conveniently located permanent Home Chemical Collection Center 1.95% 100 1.64% 84 30.71% 1,571 23.08% 1,181 42.61% 2,180 5,116
More frequent BOPA collection events 1.56% 79 2.22% 112 41.64% 2,105 20.73% 1,048 33.85% 1,711 5,055
Drop-off locations in other areas of the City 2.02% 103 1.98% 101 30.05% 1,533 24.47% 1,248 41.48% 2,116 5,101
Collection at your home 7.74% 396 5.14% 263 26.01% 1,330 14.69% 751 46.41% 2,373 5,113 DRAFT
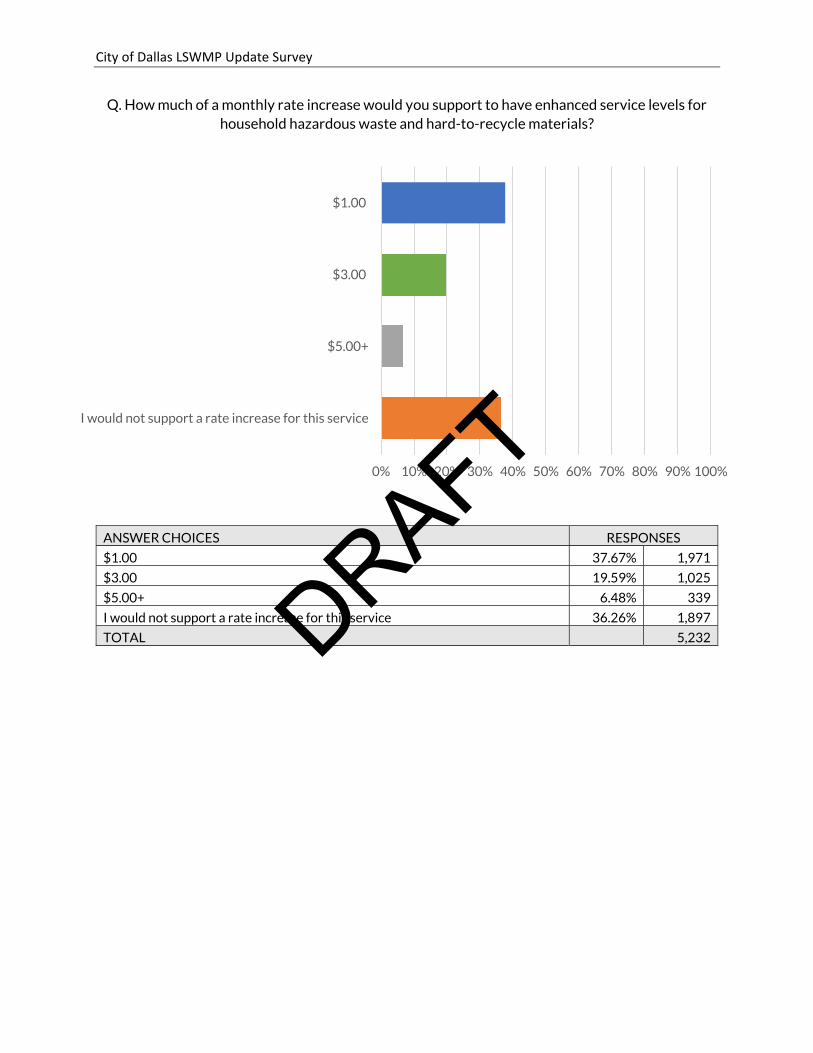
City of Dallas LSWMP Update Survey
Q. How much of a monthly rate increase would you support to have enhanced service levels for household hazardous waste and hard-to-recycle materials?
ANSWER CHOICES RESPONSES
$1.00 37.67% 1,971
$3.00 19.59% 1,025
$5.00+ 6.48% 339
I would not support a rate increase for this service 36.26% 1,897
TOTAL 5,232
0% 10% 20% 30% 40% 50% 60% 70% 80% 90% 100%
I would not support a rate increase for this service
$5.00+
$3.00
$1.00
DRAFT
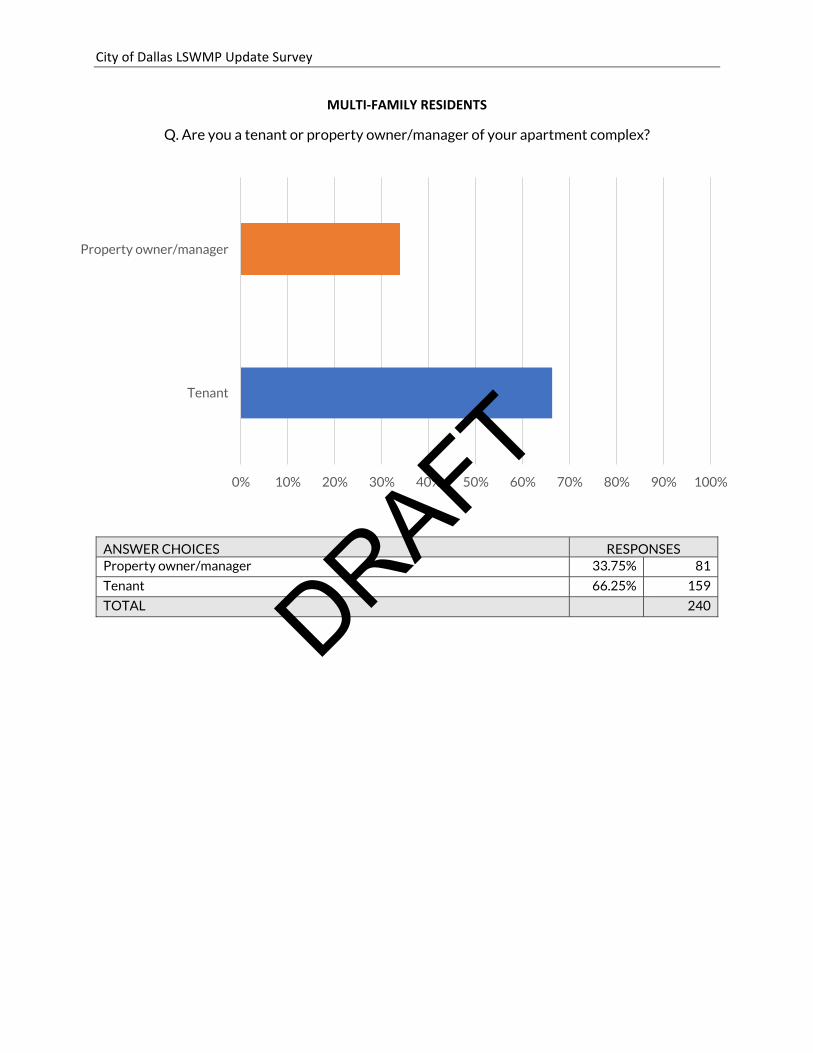
City of Dallas LSWMP Update Survey
MULTI‐FAMILY RESIDENTS
Q. Are you a tenant or property owner/manager of your apartment complex?
ANSWER CHOICES RESPONSES Property owner/manager 33.75% 81
Tenant 66.25% 159
TOTAL 240
0% 10% 20% 30% 40% 50% 60% 70% 80% 90% 100%
Tenant
Property owner/manager
DRAFT
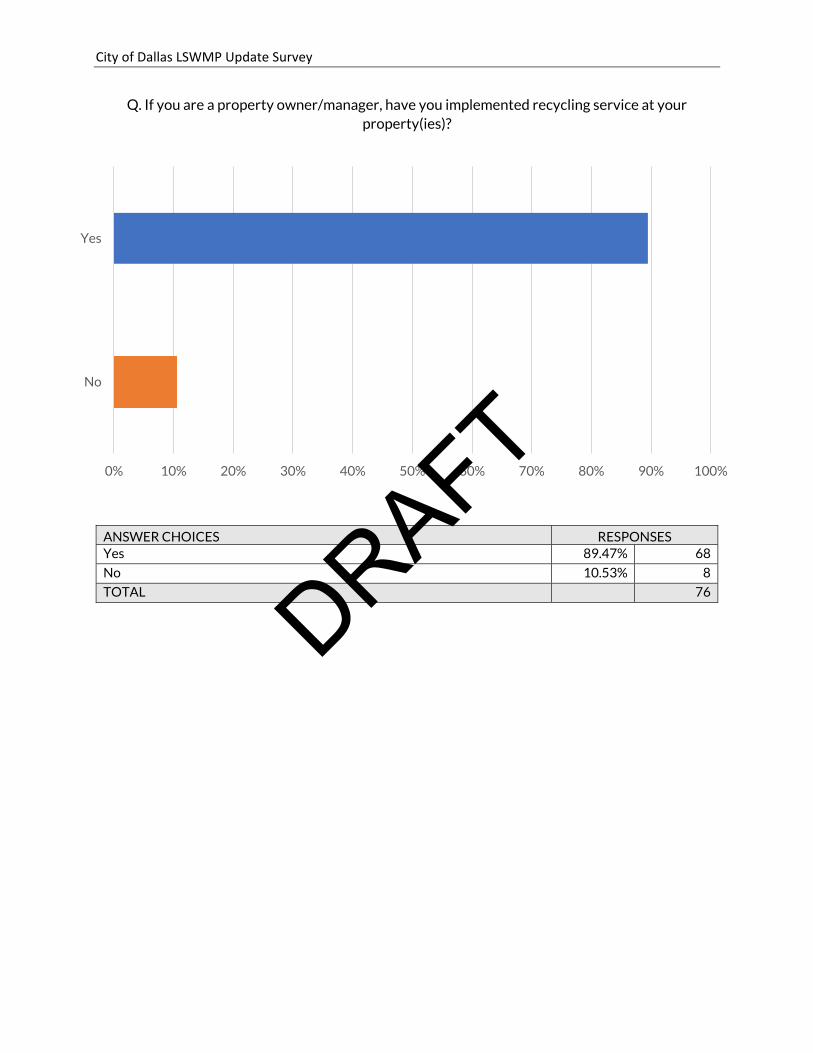
City of Dallas LSWMP Update Survey
Q. If you are a property owner/manager, have you implemented recycling service at your property(ies)?
ANSWER CHOICES RESPONSES Yes 89.47% 68
No 10.53% 8
TOTAL
76
0% 10% 20% 30% 40% 50% 60% 70% 80% 90% 100%
No
Yes
DRAFT
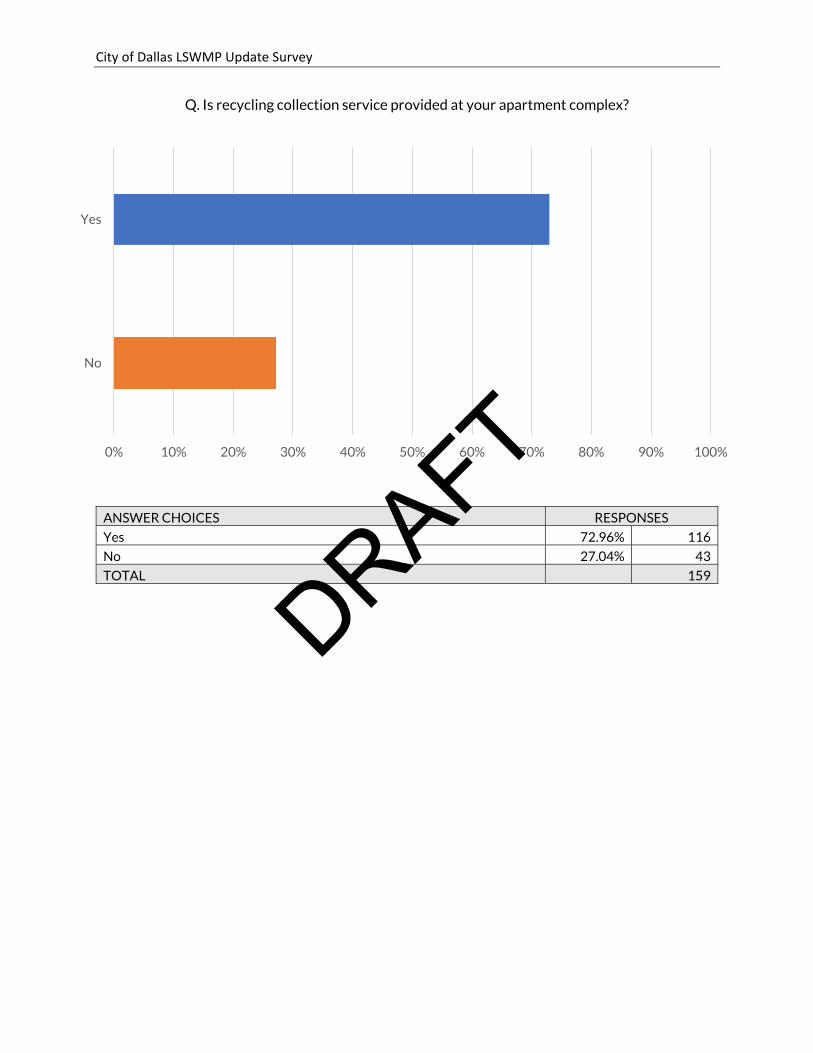
City of Dallas LSWMP Update Survey
Q. Is recycling collection service provided at your apartment complex?
ANSWER CHOICES RESPONSES
Yes 72.96% 116
No 27.04% 43
TOTAL 159
0% 10% 20% 30% 40% 50% 60% 70% 80% 90% 100%
No
Yes
DRAFT
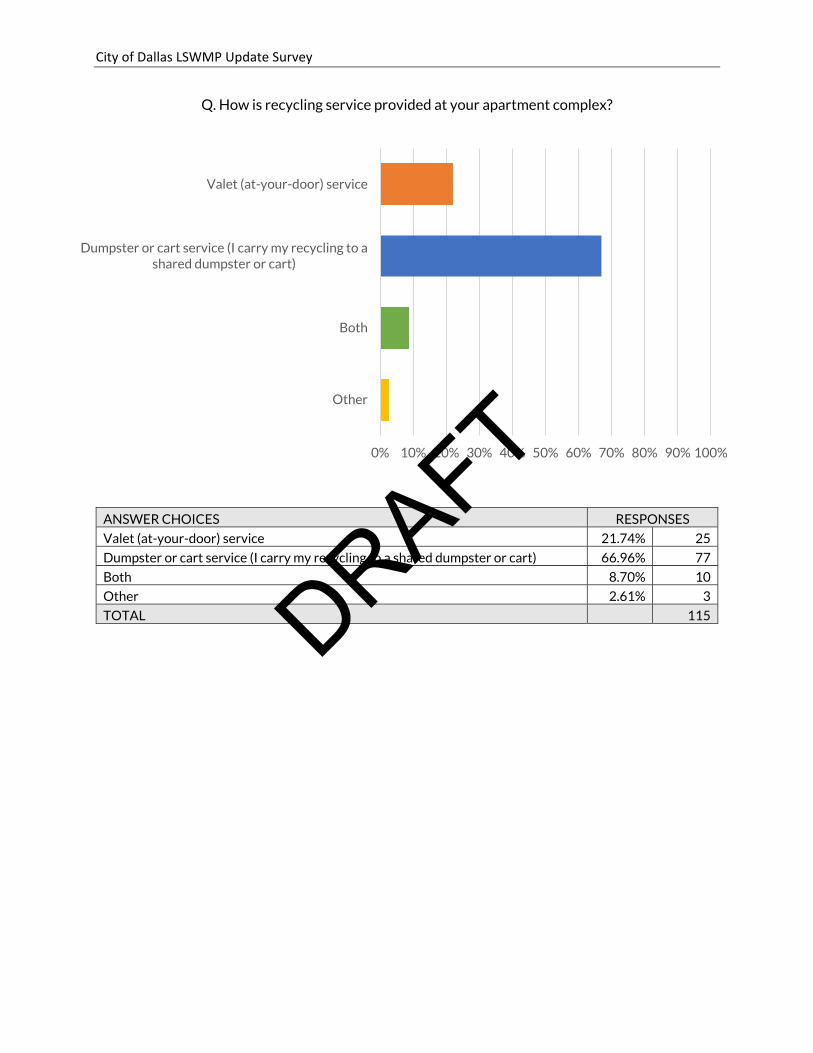
City of Dallas LSWMP Update Survey
Q. How is recycling service provided at your apartment complex?
ANSWER CHOICES RESPONSES
Valet (at-your-door) service 21.74% 25
Dumpster or cart service (I carry my recycling to a shared dumpster or cart) 66.96% 77
Both 8.70% 10
Other 2.61% 3
TOTAL 115
0% 10% 20% 30% 40% 50% 60% 70% 80% 90% 100%
Other
Both
Dumpster or cart service (I carry my recycling to ashared dumpster or cart)
Valet (at-your-door) service
DRAFT
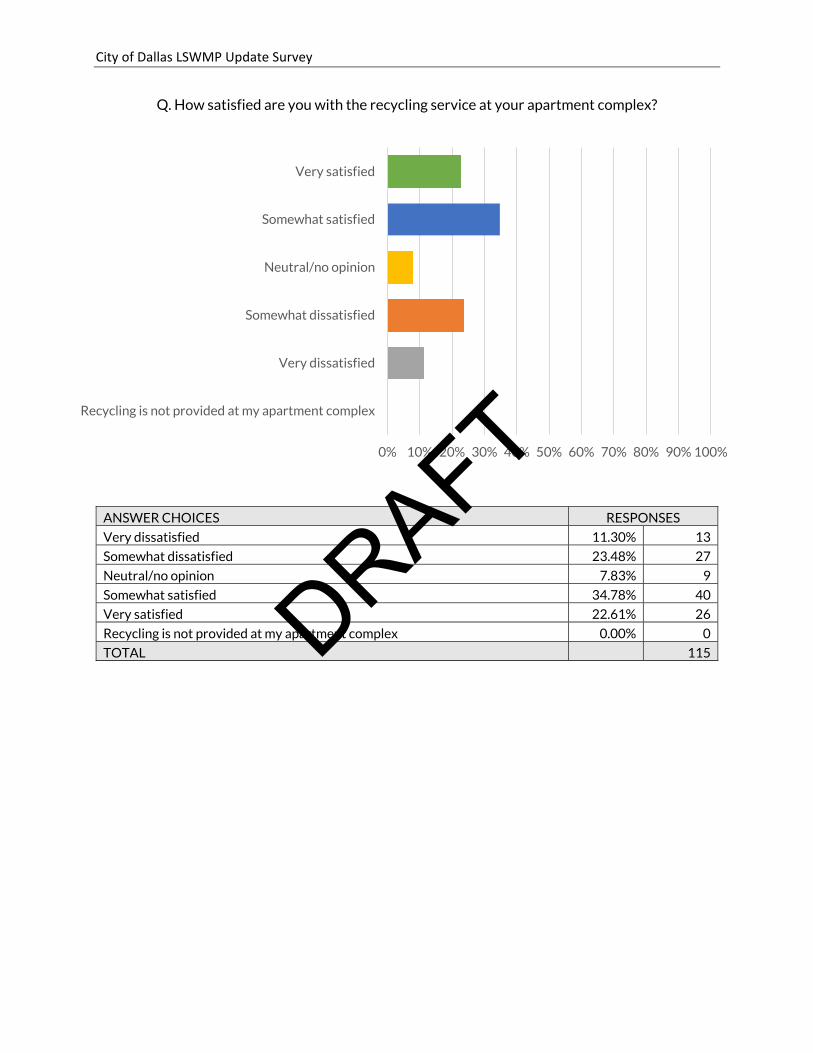
City of Dallas LSWMP Update Survey
Q. How satisfied are you with the recycling service at your apartment complex?
ANSWER CHOICES RESPONSES
Very dissatisfied 11.30% 13
Somewhat dissatisfied 23.48% 27
Neutral/no opinion 7.83% 9
Somewhat satisfied 34.78% 40
Very satisfied 22.61% 26
Recycling is not provided at my apartment complex 0.00% 0
TOTAL 115
0% 10% 20% 30% 40% 50% 60% 70% 80% 90% 100%
Recycling is not provided at my apartment complex
Very dissatisfied
Somewhat dissatisfied
Neutral/no opinion
Somewhat satisfied
Very satisfied
DRAFT
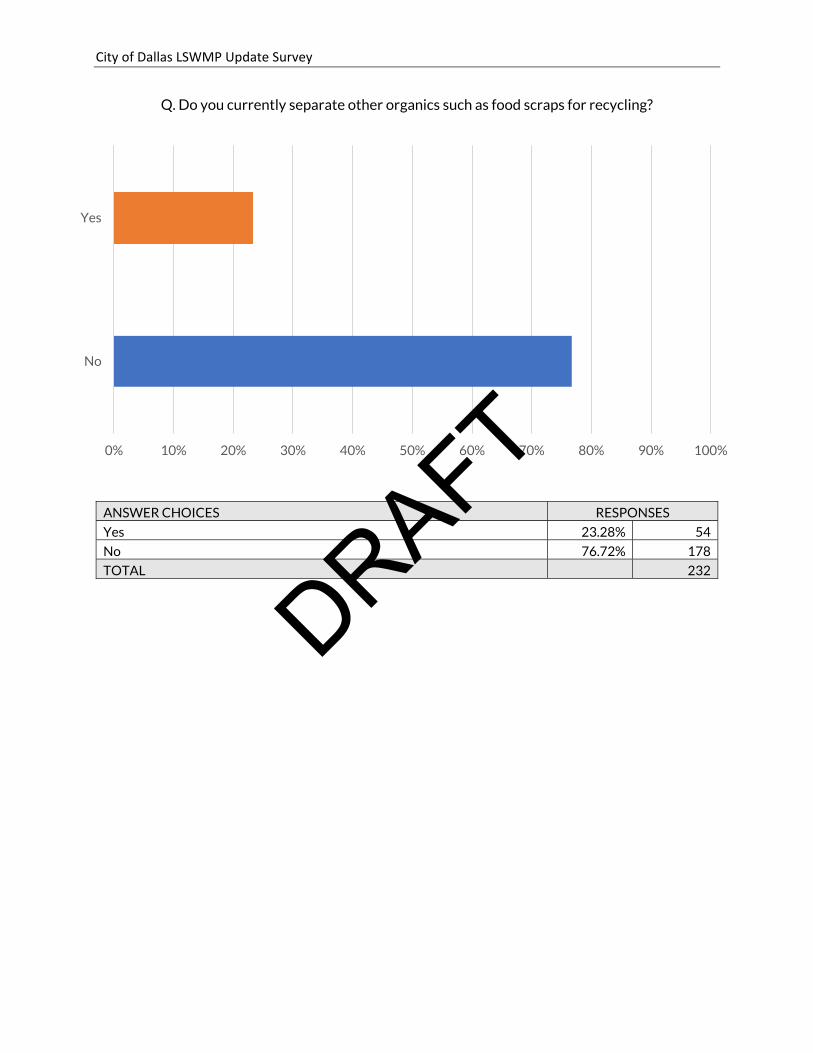
City of Dallas LSWMP Update Survey
Q. Do you currently separate other organics such as food scraps for recycling?
ANSWER CHOICES RESPONSES
Yes 23.28% 54
No 76.72% 178
TOTAL 232
0% 10% 20% 30% 40% 50% 60% 70% 80% 90% 100%
No
Yes
DRAFT
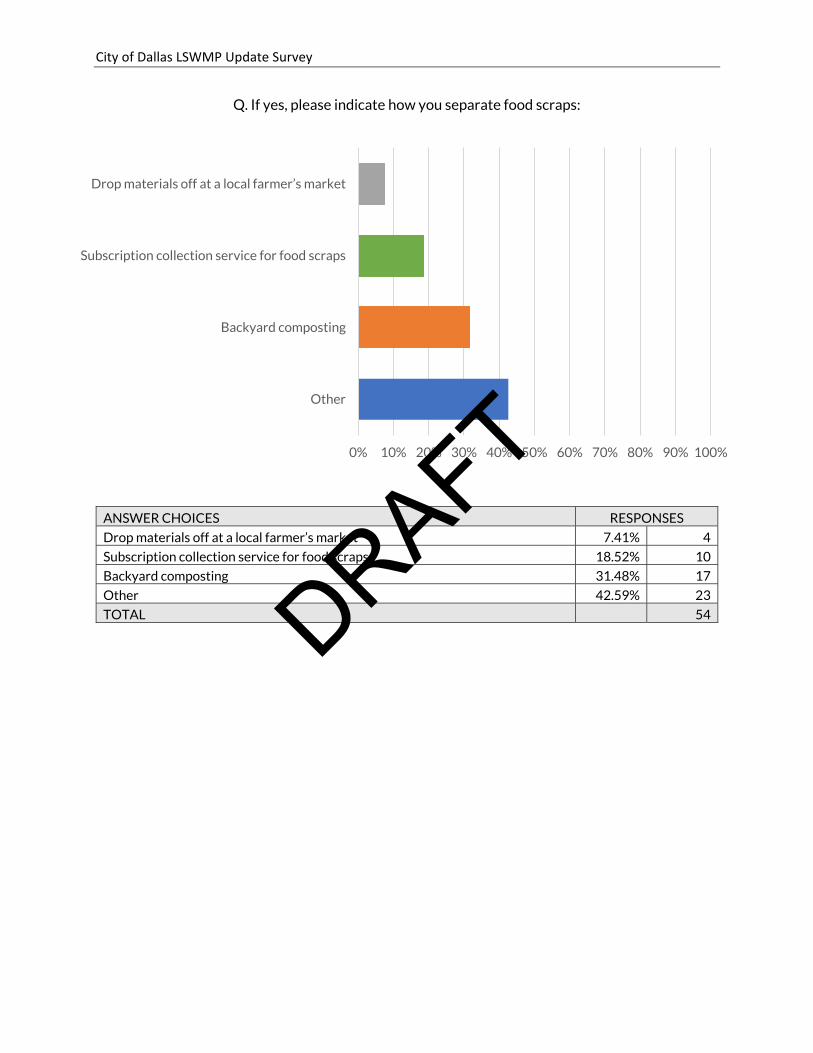
City of Dallas LSWMP Update Survey
Q. If yes, please indicate how you separate food scraps:
ANSWER CHOICES RESPONSES
Drop materials off at a local farmer’s market 7.41% 4
Subscription collection service for food scraps 18.52% 10
Backyard composting 31.48% 17
Other 42.59% 23
TOTAL 54
0% 10% 20% 30% 40% 50% 60% 70% 80% 90% 100%
Other
Backyard composting
Subscription collection service for food scraps
Drop materials off at a local farmer’s market
DRAFT
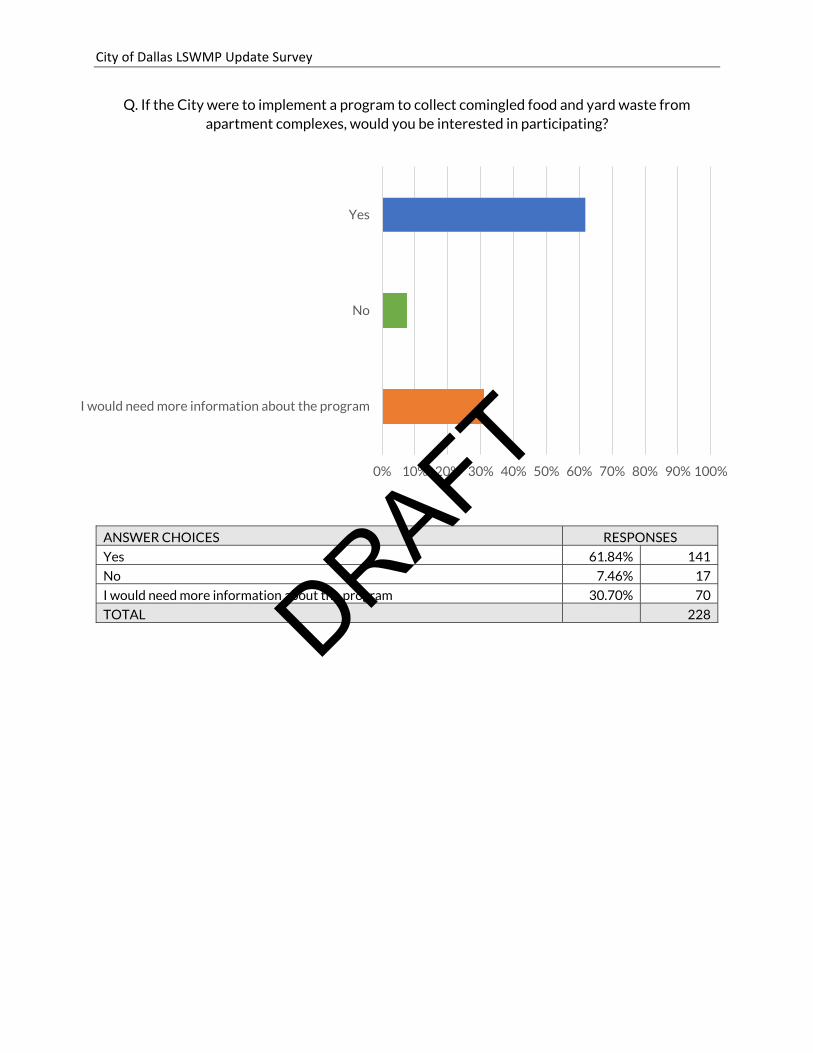
City of Dallas LSWMP Update Survey
Q. If the City were to implement a program to collect comingled food and yard waste from apartment complexes, would you be interested in participating?
ANSWER CHOICES RESPONSES
Yes 61.84% 141
No 7.46% 17
I would need more information about the program 30.70% 70
TOTAL 228
0% 10% 20% 30% 40% 50% 60% 70% 80% 90% 100%
I would need more information about the program
No
Yes
DRAFT
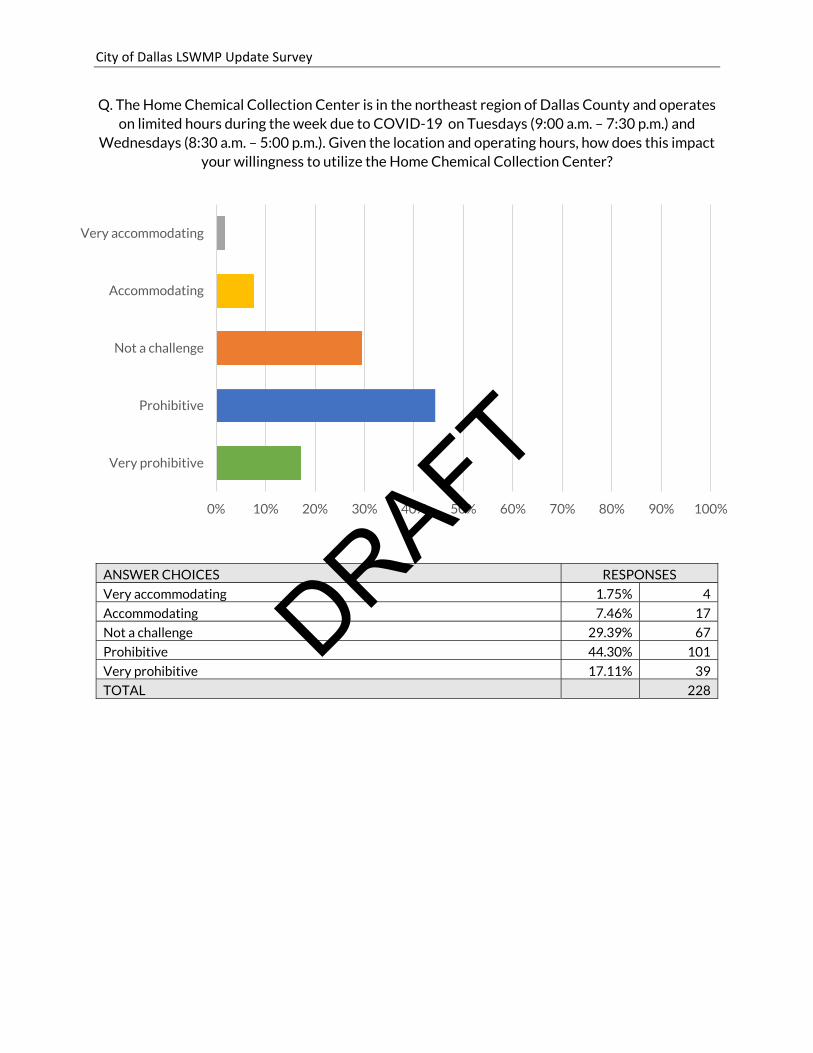
City of Dallas LSWMP Update Survey
Q. The Home Chemical Collection Center is in the northeast region of Dallas County and operates on limited hours during the week due to COVID-19 on Tuesdays (9:00 a.m. – 7:30 p.m.) and
Wednesdays (8:30 a.m. – 5:00 p.m.). Given the location and operating hours, how does this impact your willingness to utilize the Home Chemical Collection Center?
ANSWER CHOICES RESPONSES
Very accommodating 1.75% 4
Accommodating 7.46% 17
Not a challenge 29.39% 67
Prohibitive 44.30% 101
Very prohibitive 17.11% 39
TOTAL 228
0% 10% 20% 30% 40% 50% 60% 70% 80% 90% 100%
Very prohibitive
Prohibitive
Not a challenge
Accommodating
Very accommodating
DRAFT
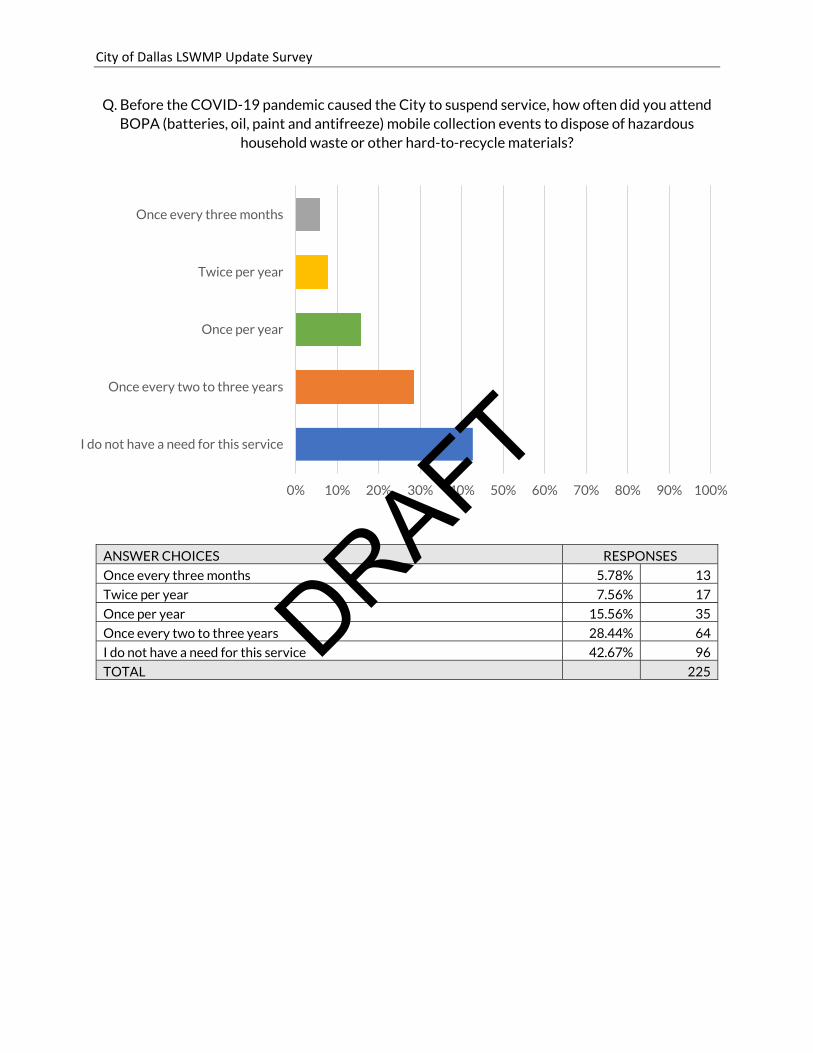
City of Dallas LSWMP Update Survey
Q. Before the COVID-19 pandemic caused the City to suspend service, how often did you attend BOPA (batteries, oil, paint and antifreeze) mobile collection events to dispose of hazardous
household waste or other hard-to-recycle materials?
ANSWER CHOICES RESPONSES
Once every three months 5.78% 13
Twice per year 7.56% 17
Once per year 15.56% 35
Once every two to three years 28.44% 64
I do not have a need for this service 42.67% 96
TOTAL 225
0% 10% 20% 30% 40% 50% 60% 70% 80% 90% 100%
I do not have a need for this service
Once every two to three years
Once per year
Twice per year
Once every three months
DRAFT
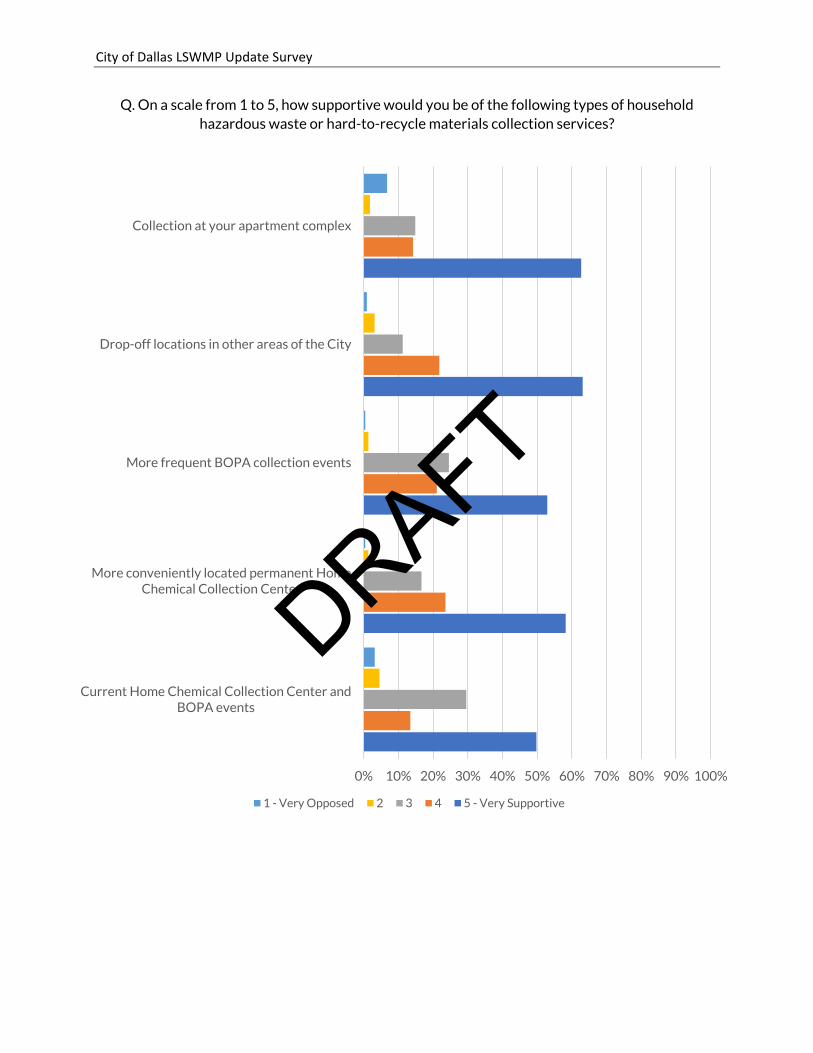
City of Dallas LSWMP Update Survey
Q. On a scale from 1 to 5, how supportive would you be of the following types of household hazardous waste or hard-to-recycle materials collection services?
0% 10% 20% 30% 40% 50% 60% 70% 80% 90% 100%
Current Home Chemical Collection Center andBOPA events
More conveniently located permanent HomeChemical Collection Center
More frequent BOPA collection events
Drop-off locations in other areas of the City
Collection at your apartment complex
1 - Very Opposed 2 3 4 5 - Very Supportive
DRAFT
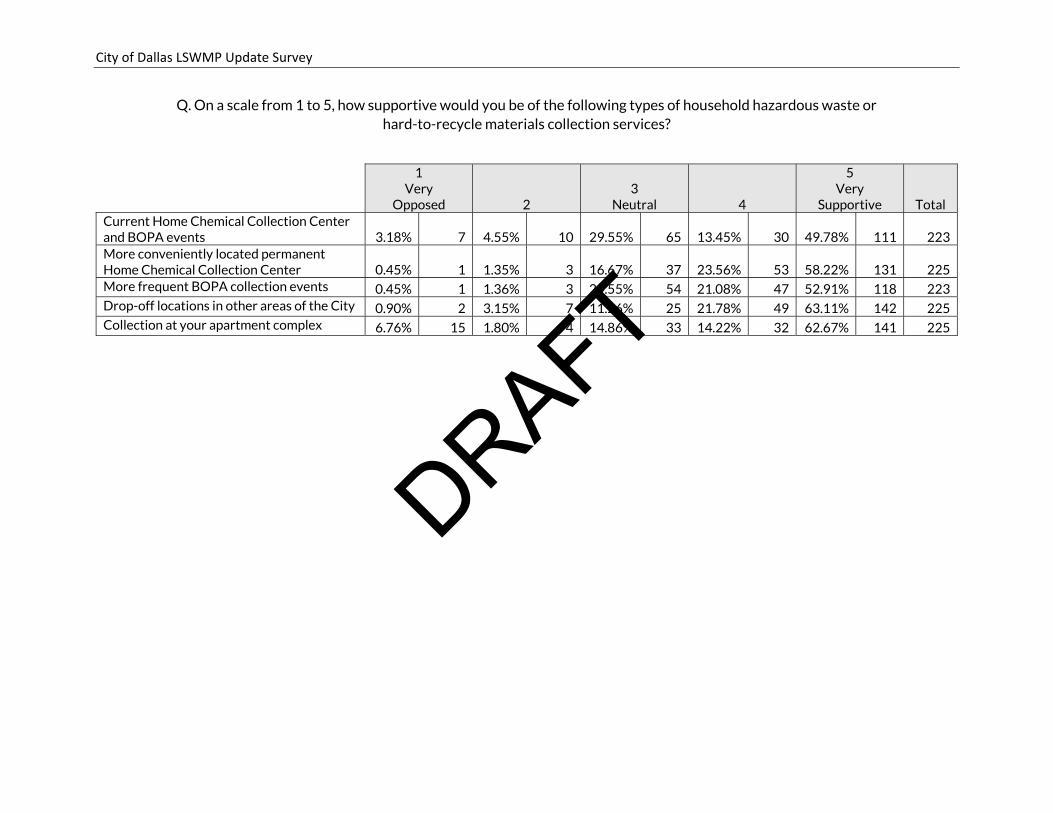
City of Dallas LSWMP Update Survey
Q. On a scale from 1 to 5, how supportive would you be of the following types of household hazardous waste or hard-to-recycle materials collection services?
1 Very
Opposed 2 3
Neutral 4
5 Very
Supportive Total Current Home Chemical Collection Center and BOPA events 3.18% 7 4.55% 10 29.55% 65 13.45% 30 49.78% 111 223 More conveniently located permanent Home Chemical Collection Center 0.45% 1 1.35% 3 16.67% 37 23.56% 53 58.22% 131 225 More frequent BOPA collection events 0.45% 1 1.36% 3 24.55% 54 21.08% 47 52.91% 118 223 Drop-off locations in other areas of the City 0.90% 2 3.15% 7 11.26% 25 21.78% 49 63.11% 142 225 Collection at your apartment complex 6.76% 15 1.80% 4 14.86% 33 14.22% 32 62.67% 141 225
DRAFT
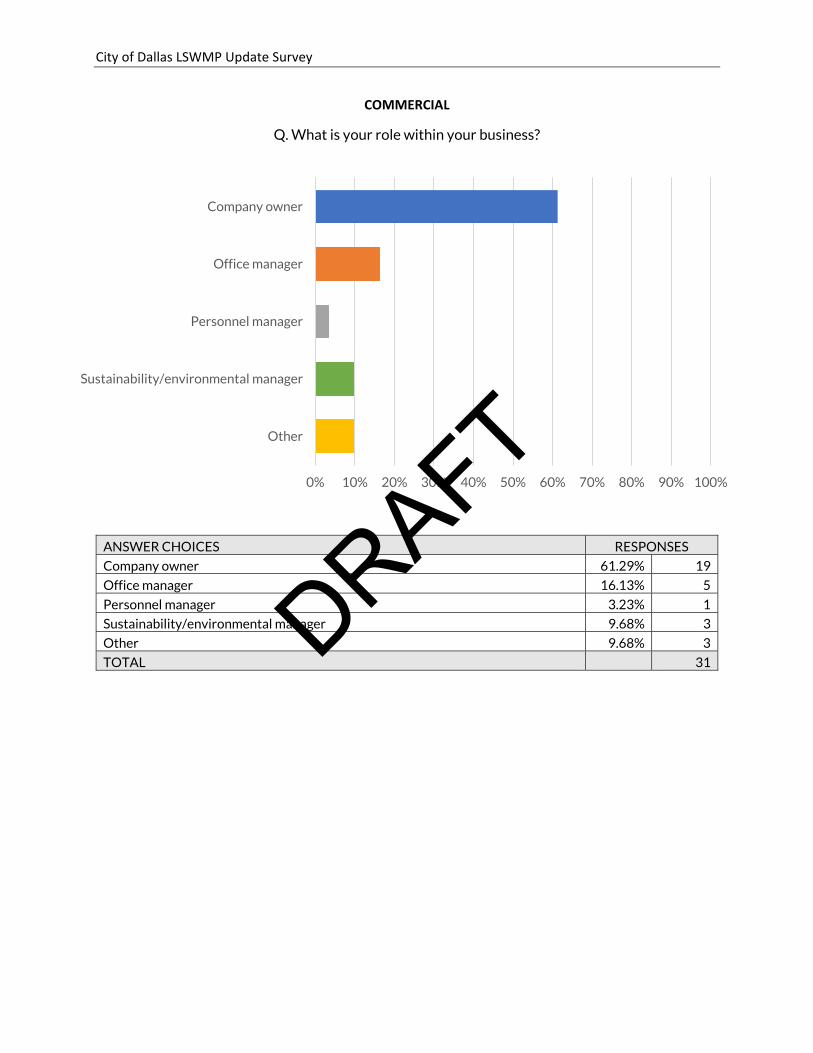
City of Dallas LSWMP Update Survey
COMMERCIAL
Q. What is your role within your business?
ANSWER CHOICES RESPONSES
Company owner 61.29% 19
Office manager 16.13% 5
Personnel manager 3.23% 1
Sustainability/environmental manager 9.68% 3
Other 9.68% 3
TOTAL 31
0% 10% 20% 30% 40% 50% 60% 70% 80% 90% 100%
Other
Sustainability/environmental manager
Personnel manager
Office manager
Company owner
DRAFT
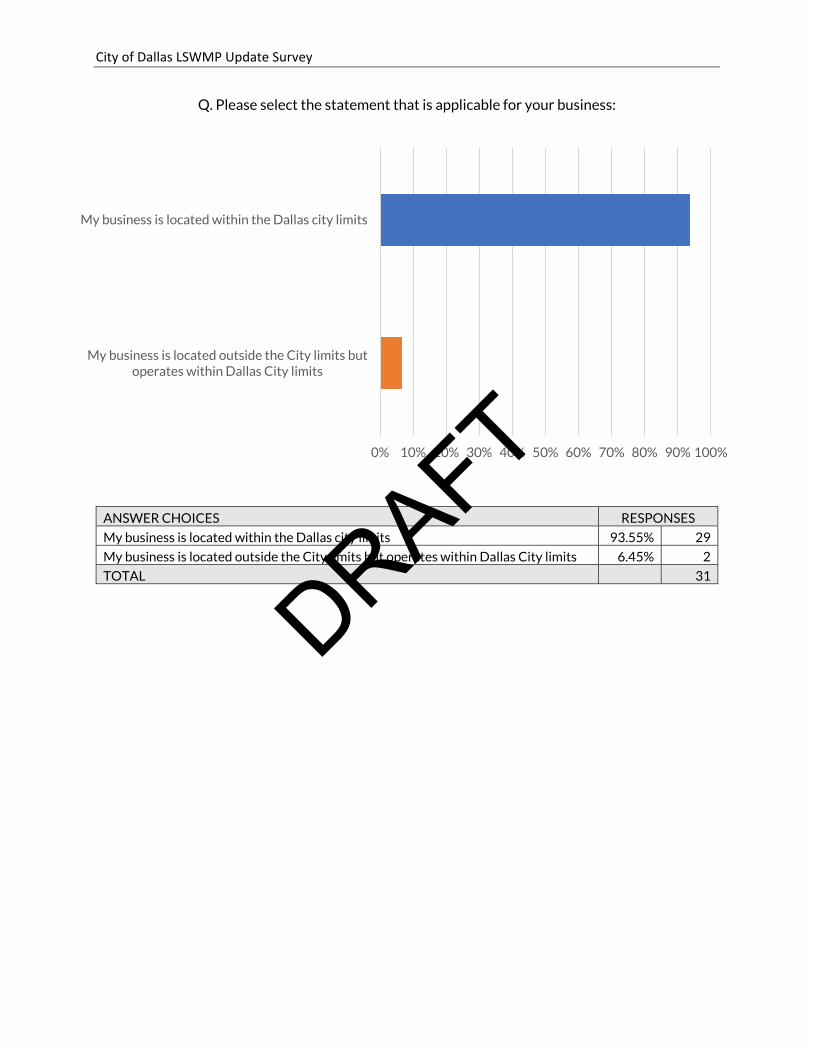
City of Dallas LSWMP Update Survey
Q. Please select the statement that is applicable for your business:
ANSWER CHOICES RESPONSES
My business is located within the Dallas city limits 93.55% 29
My business is located outside the City limits but operates within Dallas City limits 6.45% 2
TOTAL 31
0% 10% 20% 30% 40% 50% 60% 70% 80% 90% 100%
My business is located outside the City limits butoperates within Dallas City limits
My business is located within the Dallas city limits
DRAFT
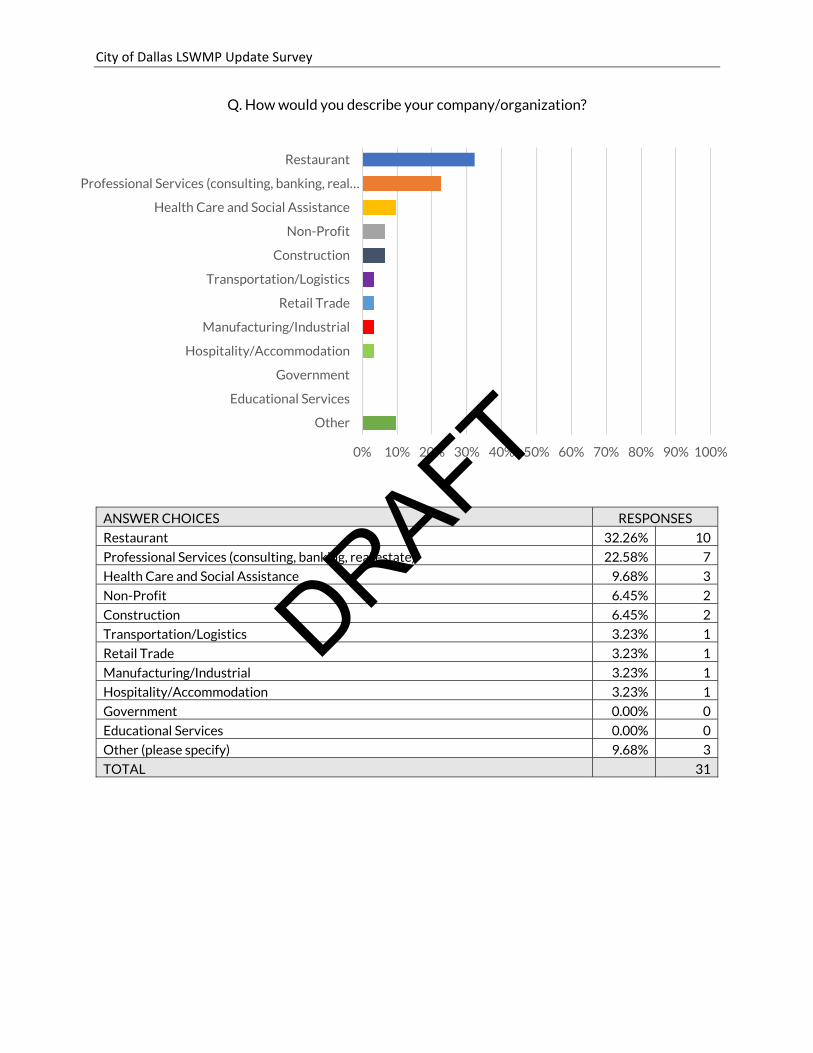
City of Dallas LSWMP Update Survey
Q. How would you describe your company/organization?
ANSWER CHOICES RESPONSES
Restaurant 32.26% 10
Professional Services (consulting, banking, real estate) 22.58% 7
Health Care and Social Assistance 9.68% 3
Non-Profit 6.45% 2
Construction 6.45% 2
Transportation/Logistics 3.23% 1
Retail Trade 3.23% 1
Manufacturing/Industrial 3.23% 1
Hospitality/Accommodation 3.23% 1
Government 0.00% 0
Educational Services 0.00% 0
Other (please specify) 9.68% 3
TOTAL 31
0% 10% 20% 30% 40% 50% 60% 70% 80% 90% 100%
Other
Educational Services
Government
Hospitality/Accommodation
Manufacturing/Industrial
Retail Trade
Transportation/Logistics
Construction
Non-Profit
Health Care and Social Assistance
Professional Services (consulting, banking, real…
Restaurant
DRAFT
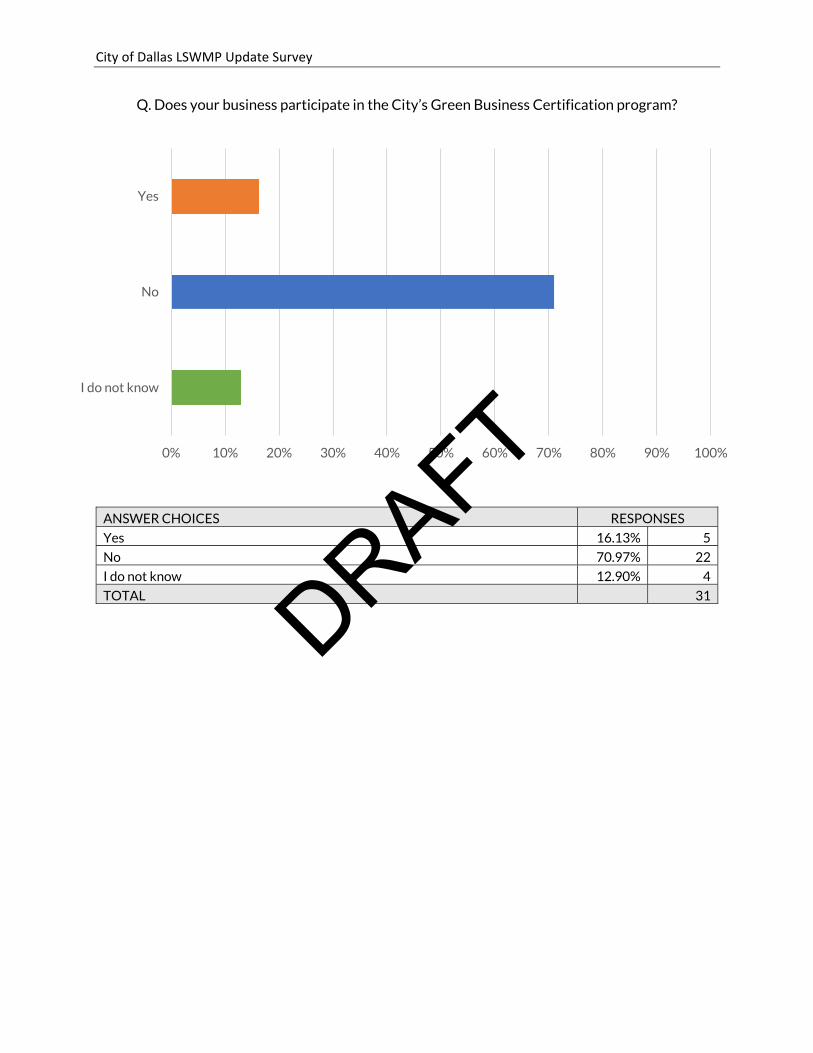
City of Dallas LSWMP Update Survey
Q. Does your business participate in the City’s Green Business Certification program?
ANSWER CHOICES RESPONSES
Yes 16.13% 5
No 70.97% 22
I do not know 12.90% 4
TOTAL 31
0% 10% 20% 30% 40% 50% 60% 70% 80% 90% 100%
I do not know
No
Yes
DRAFT
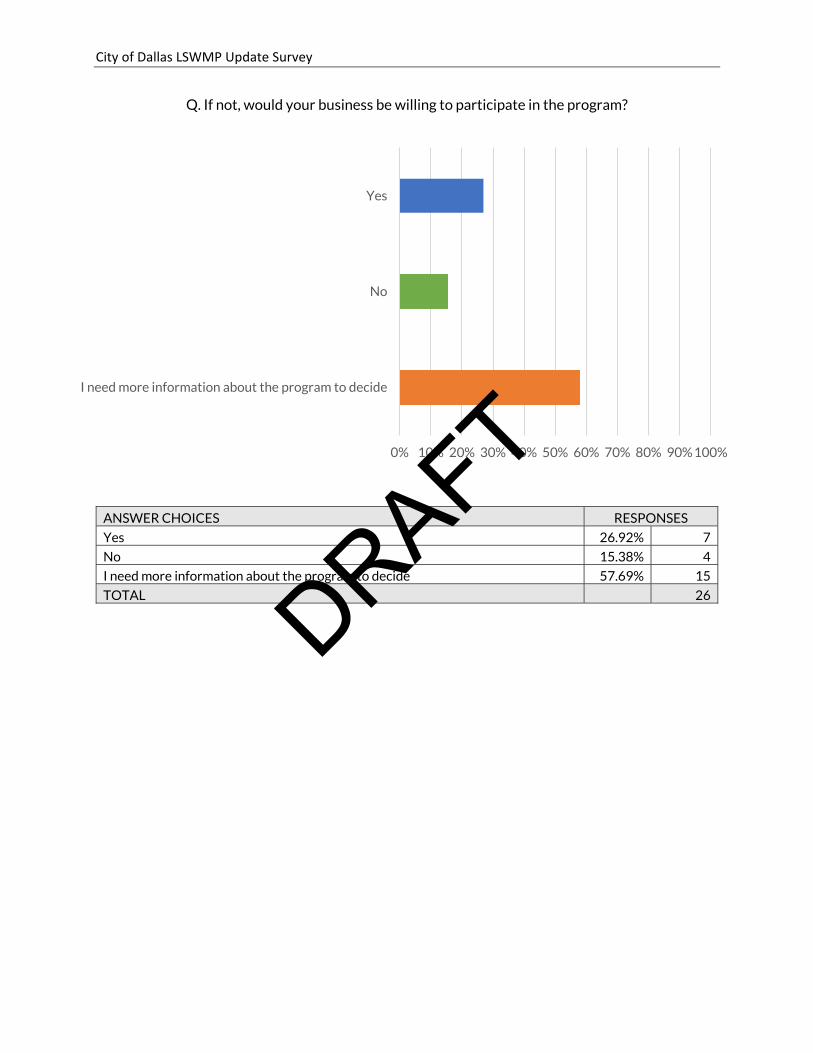
City of Dallas LSWMP Update Survey
Q. If not, would your business be willing to participate in the program?
ANSWER CHOICES RESPONSES
Yes 26.92% 7
No 15.38% 4
I need more information about the program to decide 57.69% 15
TOTAL 26
0% 10% 20% 30% 40% 50% 60% 70% 80% 90% 100%
I need more information about the program to decide
No
Yes
DRAFT
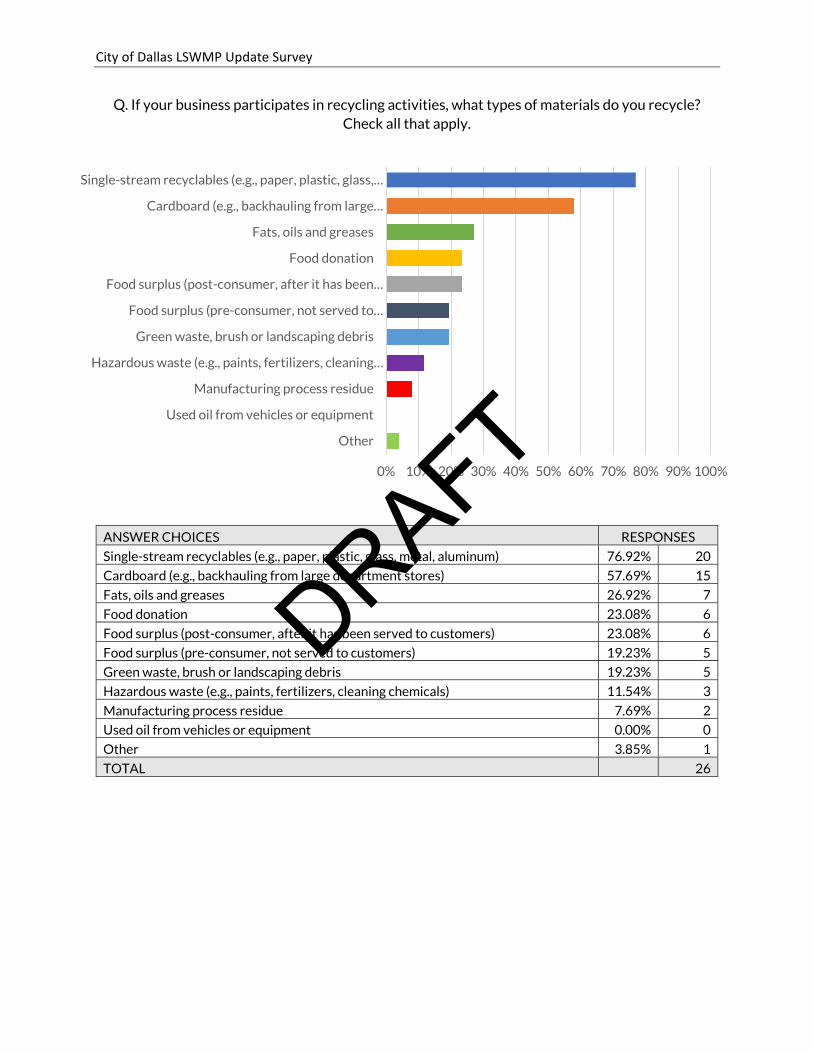
City of Dallas LSWMP Update Survey
Q. If your business participates in recycling activities, what types of materials do you recycle? Check all that apply.
ANSWER CHOICES RESPONSES
Single-stream recyclables (e.g., paper, plastic, glass, metal, aluminum) 76.92% 20
Cardboard (e.g., backhauling from large department stores) 57.69% 15
Fats, oils and greases 26.92% 7
Food donation 23.08% 6
Food surplus (post-consumer, after it has been served to customers) 23.08% 6
Food surplus (pre-consumer, not served to customers) 19.23% 5
Green waste, brush or landscaping debris 19.23% 5
Hazardous waste (e.g., paints, fertilizers, cleaning chemicals) 11.54% 3
Manufacturing process residue 7.69% 2
Used oil from vehicles or equipment 0.00% 0
Other 3.85% 1
TOTAL 26
0% 10% 20% 30% 40% 50% 60% 70% 80% 90% 100%
Other
Used oil from vehicles or equipment
Manufacturing process residue
Hazardous waste (e.g., paints, fertilizers, cleaning…
Green waste, brush or landscaping debris
Food surplus (pre-consumer, not served to…
Food surplus (post-consumer, after it has been…
Food donation
Fats, oils and greases
Cardboard (e.g., backhauling from large…
Single-stream recyclables (e.g., paper, plastic, glass,…
DRAFT
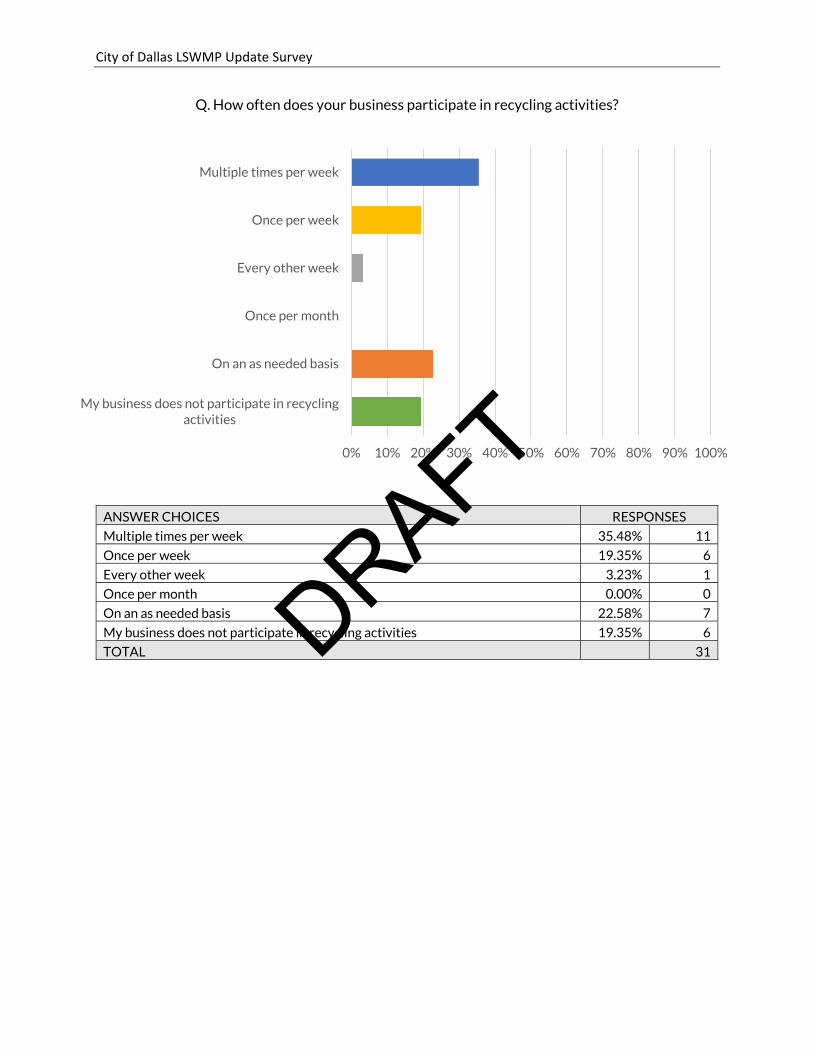
City of Dallas LSWMP Update Survey
Q. How often does your business participate in recycling activities?
ANSWER CHOICES RESPONSES
Multiple times per week 35.48% 11
Once per week 19.35% 6
Every other week 3.23% 1
Once per month 0.00% 0
On an as needed basis 22.58% 7
My business does not participate in recycling activities 19.35% 6
TOTAL 31
0% 10% 20% 30% 40% 50% 60% 70% 80% 90% 100%
My business does not participate in recyclingactivities
On an as needed basis
Once per month
Every other week
Once per week
Multiple times per week
DRAFT
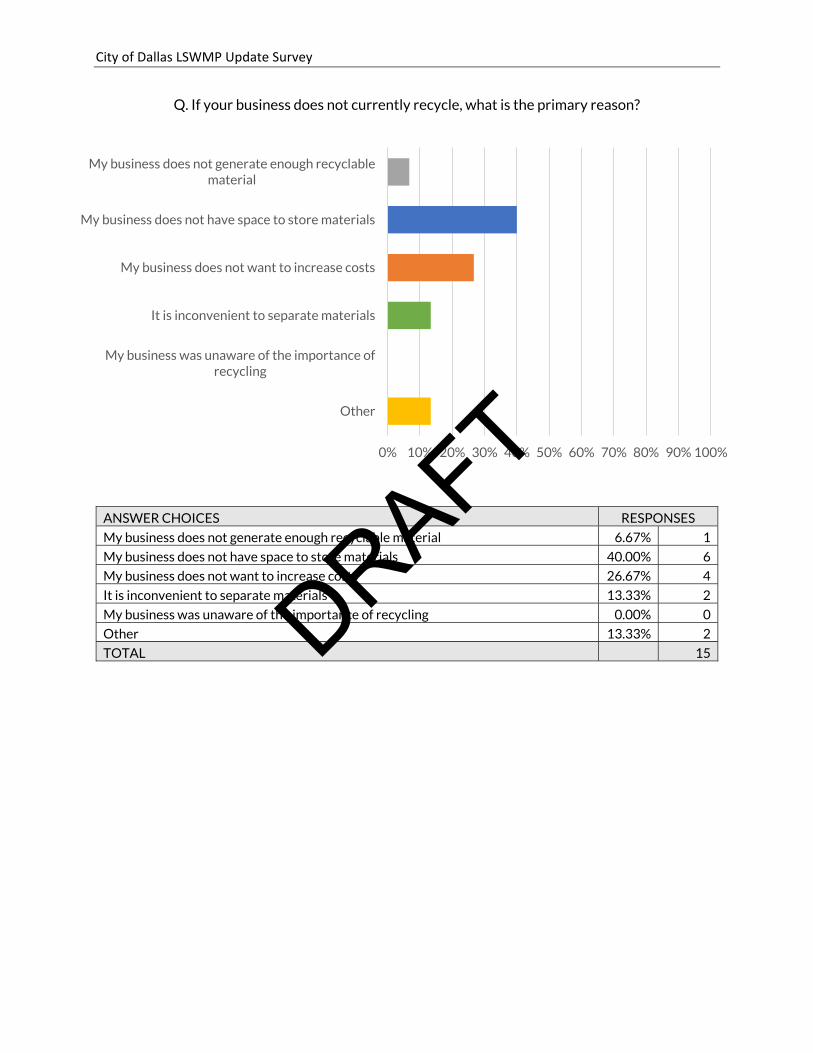
City of Dallas LSWMP Update Survey
Q. If your business does not currently recycle, what is the primary reason?
ANSWER CHOICES RESPONSES
My business does not generate enough recyclable material 6.67% 1
My business does not have space to store materials 40.00% 6
My business does not want to increase costs 26.67% 4
It is inconvenient to separate materials 13.33% 2
My business was unaware of the importance of recycling 0.00% 0
Other 13.33% 2
TOTAL 15
0% 10% 20% 30% 40% 50% 60% 70% 80% 90% 100%
Other
My business was unaware of the importance ofrecycling
It is inconvenient to separate materials
My business does not want to increase costs
My business does not have space to store materials
My business does not generate enough recyclablematerial
DRAFT
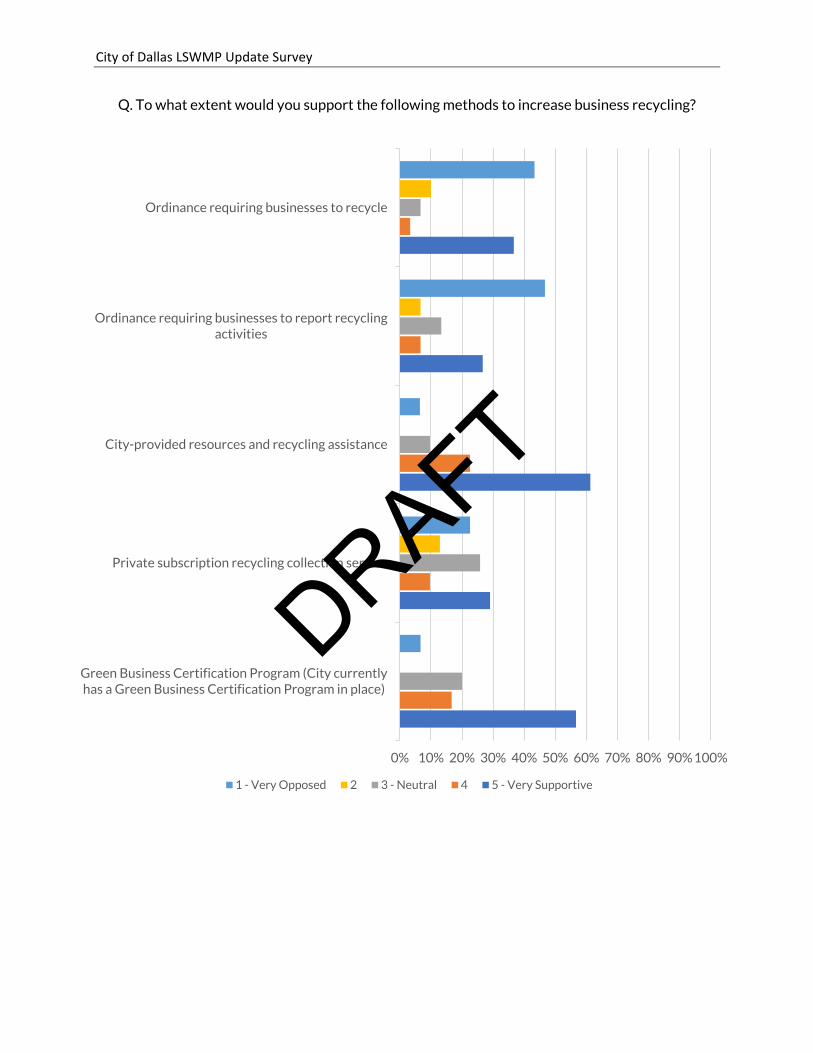
City of Dallas LSWMP Update Survey
Q. To what extent would you support the following methods to increase business recycling?
0% 10% 20% 30% 40% 50% 60% 70% 80% 90% 100%
Green Business Certification Program (City currentlyhas a Green Business Certification Program in place)
Private subscription recycling collection service
City-provided resources and recycling assistance
Ordinance requiring businesses to report recyclingactivities
Ordinance requiring businesses to recycle
1 - Very Opposed 2 3 - Neutral 4 5 - Very Supportive
DRAFT
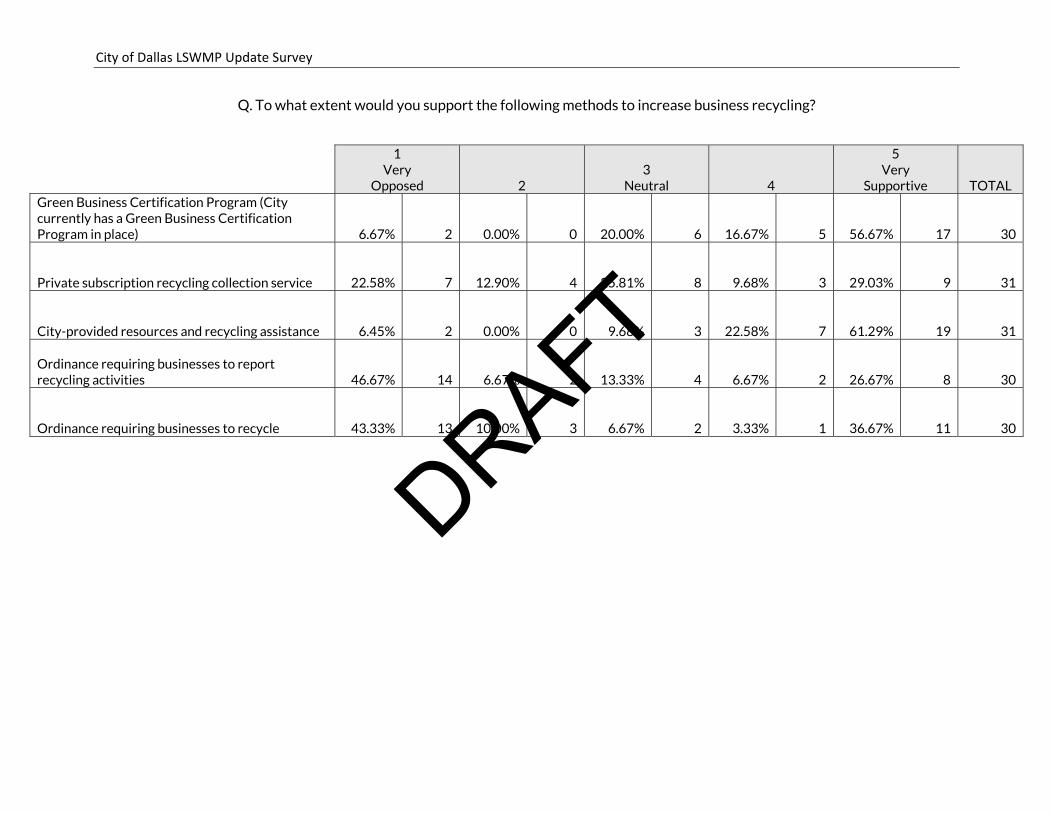
City of Dallas LSWMP Update Survey
Q. To what extent would you support the following methods to increase business recycling?
1 Very
Opposed 2 3
Neutral 4
5 Very
Supportive TOTAL Green Business Certification Program (City currently has a Green Business Certification Program in place) 6.67% 2 0.00% 0 20.00% 6 16.67% 5 56.67% 17 30
Private subscription recycling collection service 22.58% 7 12.90% 4 25.81% 8 9.68% 3 29.03% 9 31
City-provided resources and recycling assistance 6.45% 2 0.00% 0 9.68% 3 22.58% 7 61.29% 19 31
Ordinance requiring businesses to report recycling activities 46.67% 14 6.67% 2 13.33% 4 6.67% 2 26.67% 8 30
Ordinance requiring businesses to recycle 43.33% 13 10.00% 3 6.67% 2 3.33% 1 36.67% 11 30
DRAFT
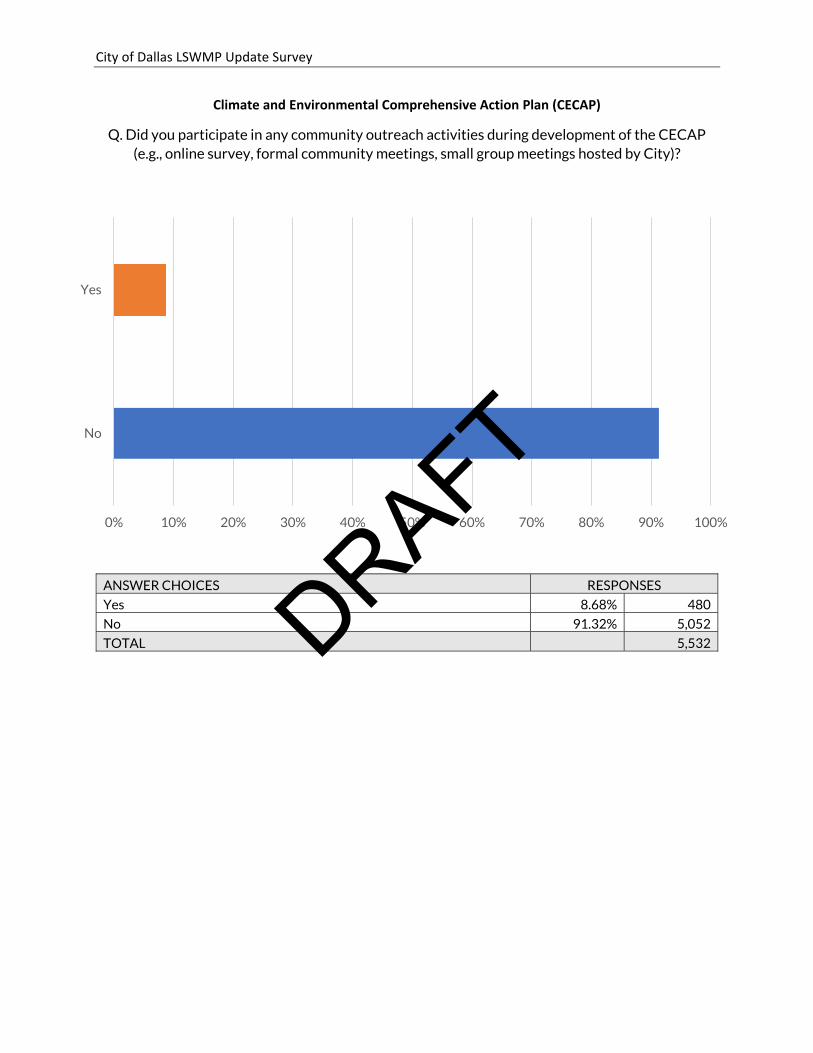
City of Dallas LSWMP Update Survey
Climate and Environmental Comprehensive Action Plan (CECAP)
Q. Did you participate in any community outreach activities during development of the CECAP (e.g., online survey, formal community meetings, small group meetings hosted by City)?
ANSWER CHOICES RESPONSES
Yes 8.68% 480
No 91.32% 5,052
TOTAL 5,532
0% 10% 20% 30% 40% 50% 60% 70% 80% 90% 100%
No
Yes
DRAFT
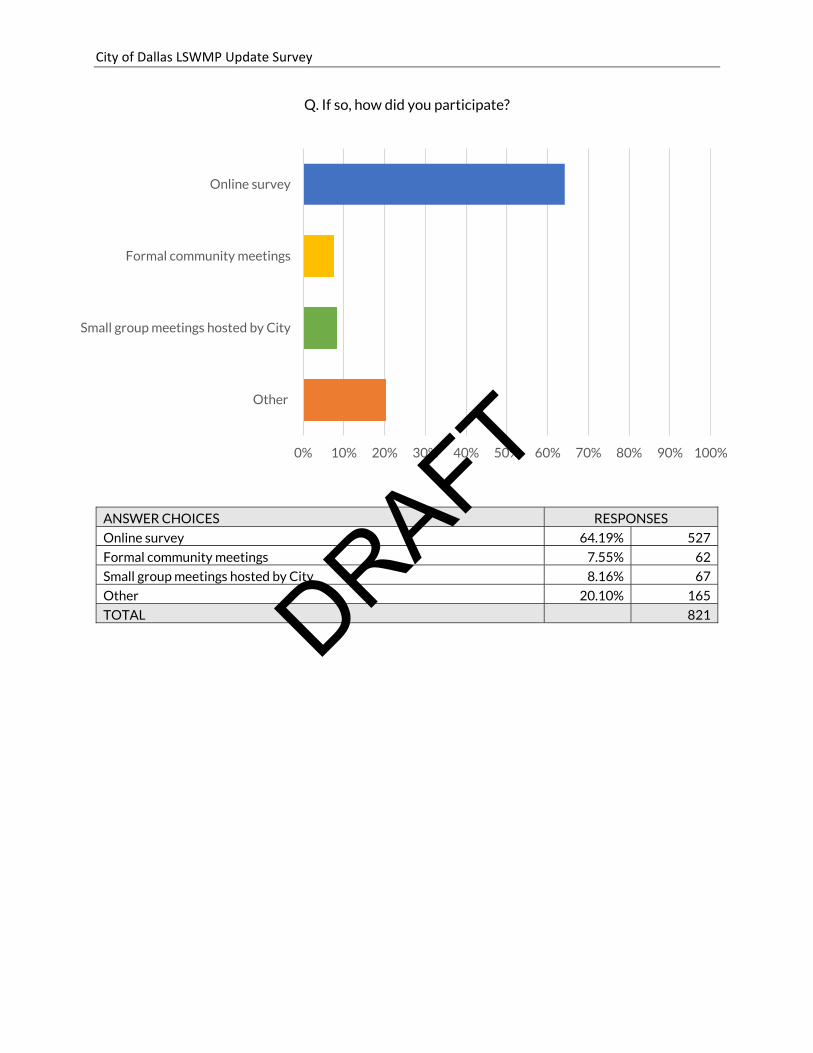
City of Dallas LSWMP Update Survey
Q. If so, how did you participate?
ANSWER CHOICES RESPONSES
Online survey 64.19% 527
Formal community meetings 7.55% 62
Small group meetings hosted by City 8.16% 67
Other 20.10% 165
TOTAL 821
0% 10% 20% 30% 40% 50% 60% 70% 80% 90% 100%
Other
Small group meetings hosted by City
Formal community meetings
Online survey
DRAFT
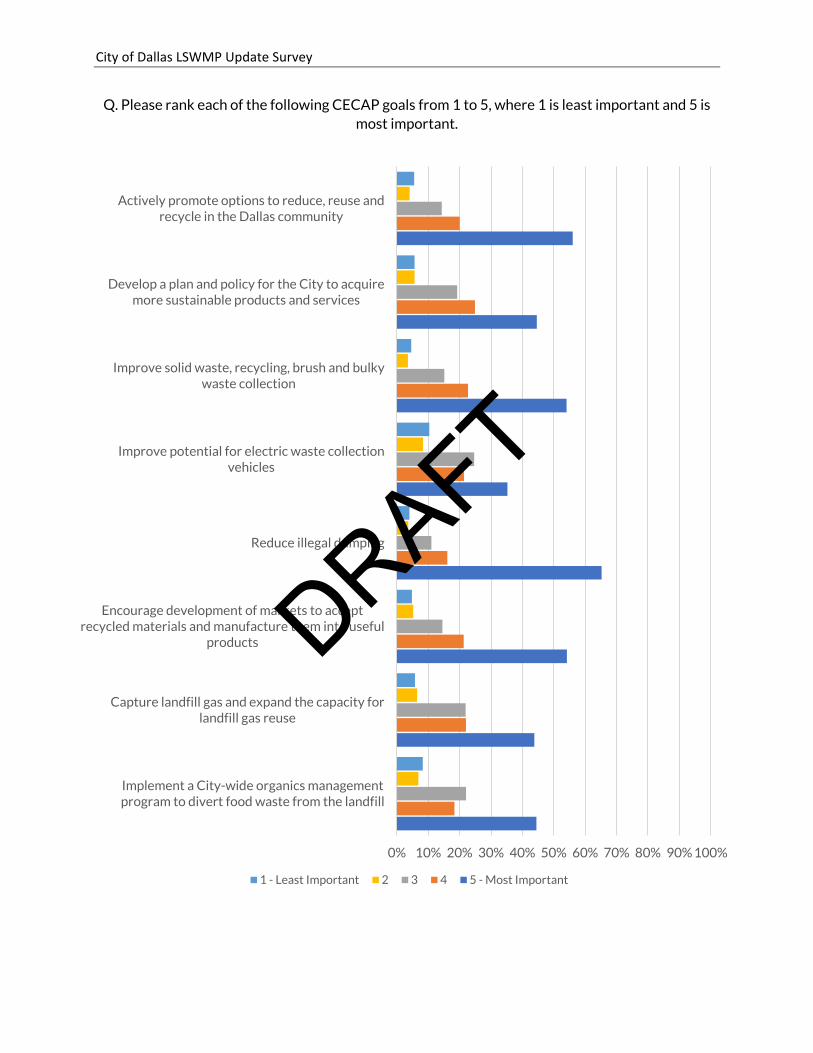
City of Dallas LSWMP Update Survey
Q. Please rank each of the following CECAP goals from 1 to 5, where 1 is least important and 5 is most important.
0% 10% 20% 30% 40% 50% 60% 70% 80% 90% 100%
Implement a City-wide organics managementprogram to divert food waste from the landfill
Capture landfill gas and expand the capacity forlandfill gas reuse
Encourage development of markets to acceptrecycled materials and manufacture them into useful
products
Reduce illegal dumping
Improve potential for electric waste collectionvehicles
Improve solid waste, recycling, brush and bulkywaste collection
Develop a plan and policy for the City to acquiremore sustainable products and services
Actively promote options to reduce, reuse andrecycle in the Dallas community
1 - Least Important 2 3 4 5 - Most Important
DRAFT
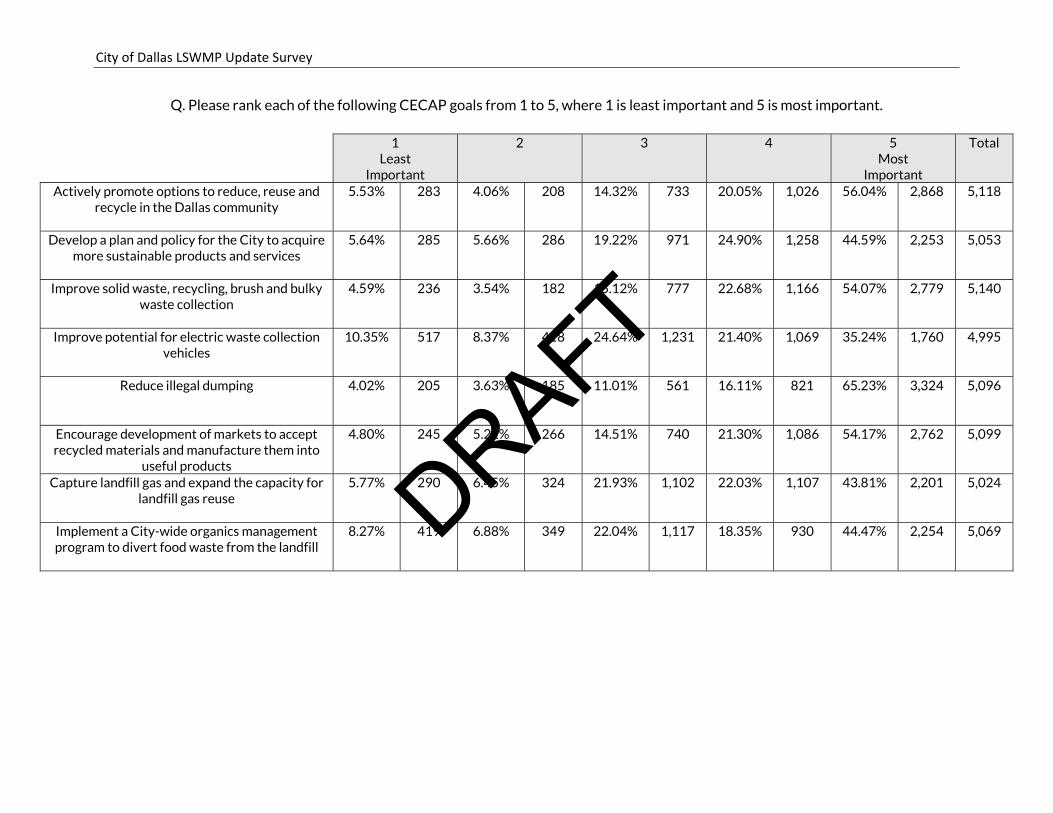
City of Dallas LSWMP Update Survey
Q. Please rank each of the following CECAP goals from 1 to 5, where 1 is least important and 5 is most important.
1 Least
Important
2 3 4 5 Most
Important
Total
Actively promote options to reduce, reuse and recycle in the Dallas community
5.53% 283 4.06% 208 14.32% 733 20.05% 1,026 56.04% 2,868 5,118
Develop a plan and policy for the City to acquire more sustainable products and services
5.64% 285 5.66% 286 19.22% 971 24.90% 1,258 44.59% 2,253 5,053
Improve solid waste, recycling, brush and bulky waste collection
4.59% 236 3.54% 182 15.12% 777 22.68% 1,166 54.07% 2,779 5,140
Improve potential for electric waste collection vehicles
10.35% 517 8.37% 418 24.64% 1,231 21.40% 1,069 35.24% 1,760 4,995
Reduce illegal dumping 4.02% 205 3.63% 185 11.01% 561 16.11% 821 65.23% 3,324 5,096
Encourage development of markets to accept recycled materials and manufacture them into
useful products
4.80% 245 5.22% 266 14.51% 740 21.30% 1,086 54.17% 2,762 5,099
Capture landfill gas and expand the capacity for landfill gas reuse
5.77% 290 6.45% 324 21.93% 1,102 22.03% 1,107 43.81% 2,201 5,024
Implement a City-wide organics management program to divert food waste from the landfill
8.27% 419 6.88% 349 22.04% 1,117 18.35% 930 44.47% 2,254 5,069
DRAFT
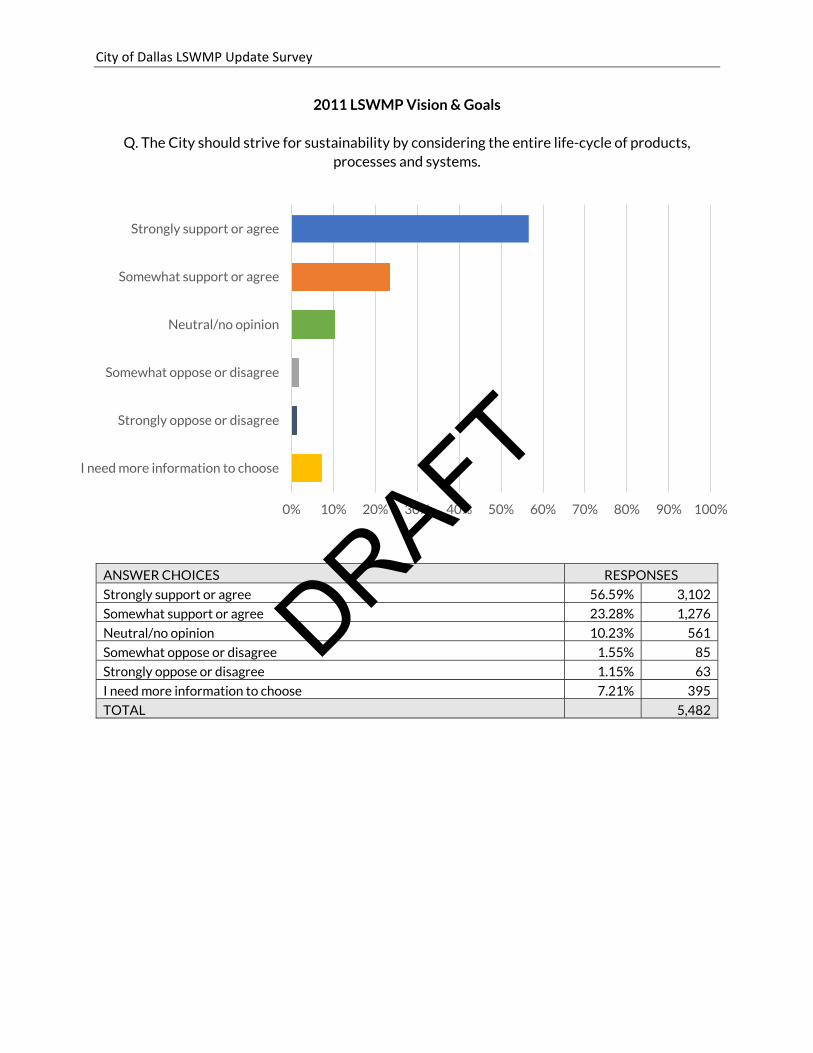
City of Dallas LSWMP Update Survey
2011 LSWMP Vision & Goals
Q. The City should strive for sustainability by considering the entire life-cycle of products, processes and systems.
ANSWER CHOICES RESPONSES
Strongly support or agree 56.59% 3,102
Somewhat support or agree 23.28% 1,276
Neutral/no opinion 10.23% 561
Somewhat oppose or disagree 1.55% 85
Strongly oppose or disagree 1.15% 63
I need more information to choose 7.21% 395
TOTAL 5,482
0% 10% 20% 30% 40% 50% 60% 70% 80% 90% 100%
I need more information to choose
Strongly oppose or disagree
Somewhat oppose or disagree
Neutral/no opinion
Somewhat support or agree
Strongly support or agree
DRAFT
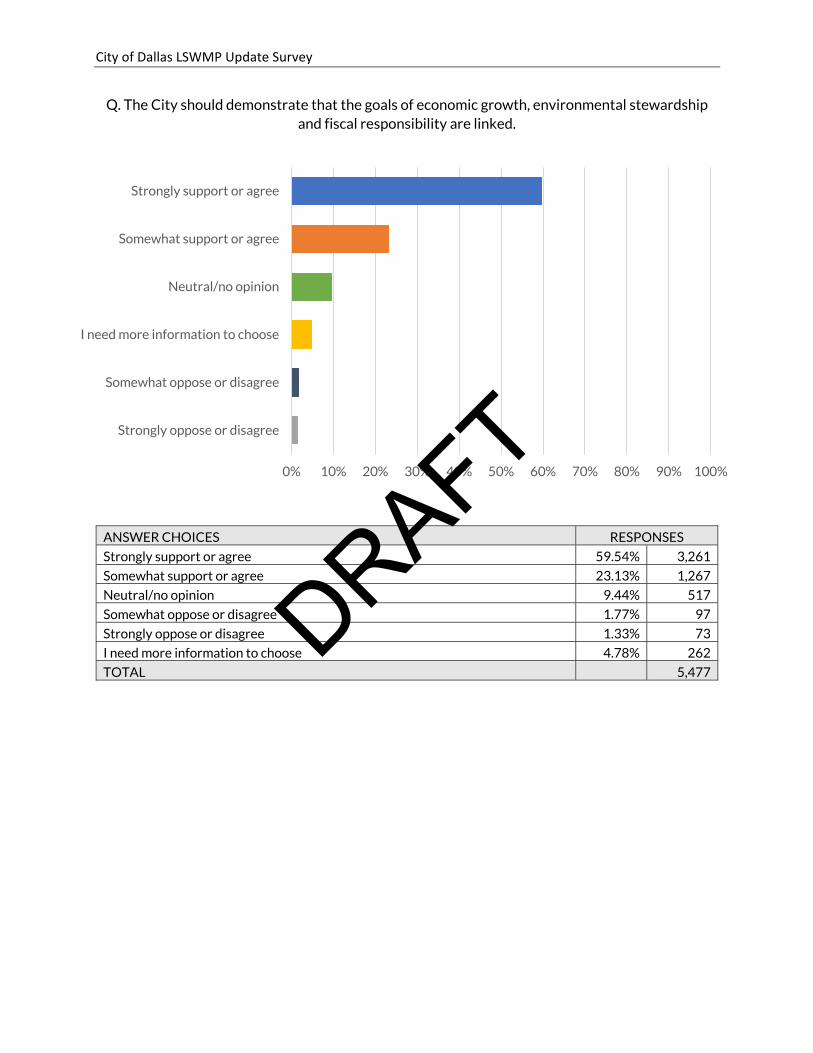
City of Dallas LSWMP Update Survey
Q. The City should demonstrate that the goals of economic growth, environmental stewardship and fiscal responsibility are linked.
ANSWER CHOICES RESPONSES
Strongly support or agree 59.54% 3,261
Somewhat support or agree 23.13% 1,267
Neutral/no opinion 9.44% 517
Somewhat oppose or disagree 1.77% 97
Strongly oppose or disagree 1.33% 73
I need more information to choose 4.78% 262
TOTAL 5,477
0% 10% 20% 30% 40% 50% 60% 70% 80% 90% 100%
Strongly oppose or disagree
Somewhat oppose or disagree
I need more information to choose
Neutral/no opinion
Somewhat support or agree
Strongly support or agree
DRAFT

City of Dallas LSWMP Update Survey
Q. The City should reduce the volume of toxicity of discarded materials and maximize diversion from disposal.
ANSWER CHOICES RESPONSES
Strongly support or agree 61.16% 3,346
Somewhat support or agree 21.04% 1,151
Neutral/no opinion 8.94% 489
Somewhat oppose or disagree 2.03% 111
Strongly oppose or disagree 1.04% 57
I need more information to choose 5.79% 317
TOTAL 5,471
0% 10% 20% 30% 40% 50% 60% 70% 80% 90% 100%
I need more information to choose
Strongly oppose or disagree
Somewhat oppose or disagree
Neutral/no opinion
Somewhat support or agree
Strongly support or agree
DRAFT
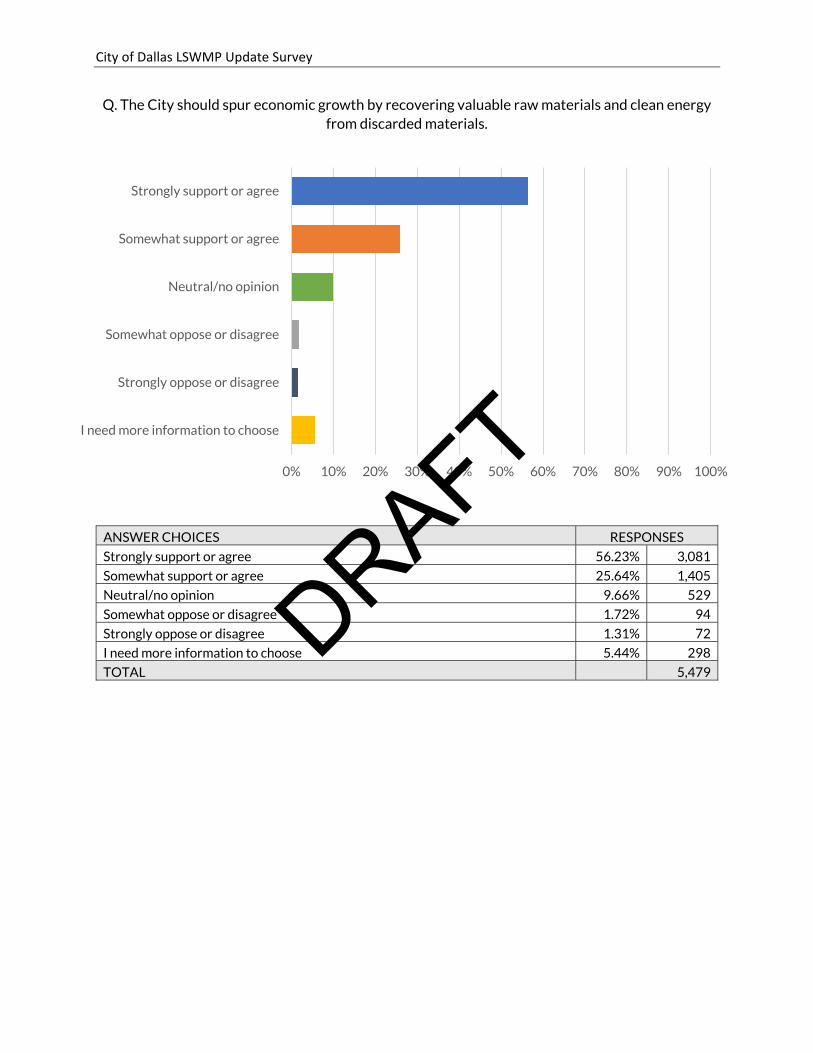
City of Dallas LSWMP Update Survey
Q. The City should spur economic growth by recovering valuable raw materials and clean energy from discarded materials.
ANSWER CHOICES RESPONSES
Strongly support or agree 56.23% 3,081
Somewhat support or agree 25.64% 1,405
Neutral/no opinion 9.66% 529
Somewhat oppose or disagree 1.72% 94
Strongly oppose or disagree 1.31% 72
I need more information to choose 5.44% 298
TOTAL 5,479
0% 10% 20% 30% 40% 50% 60% 70% 80% 90% 100%
I need more information to choose
Strongly oppose or disagree
Somewhat oppose or disagree
Neutral/no opinion
Somewhat support or agree
Strongly support or agree
DRAFT
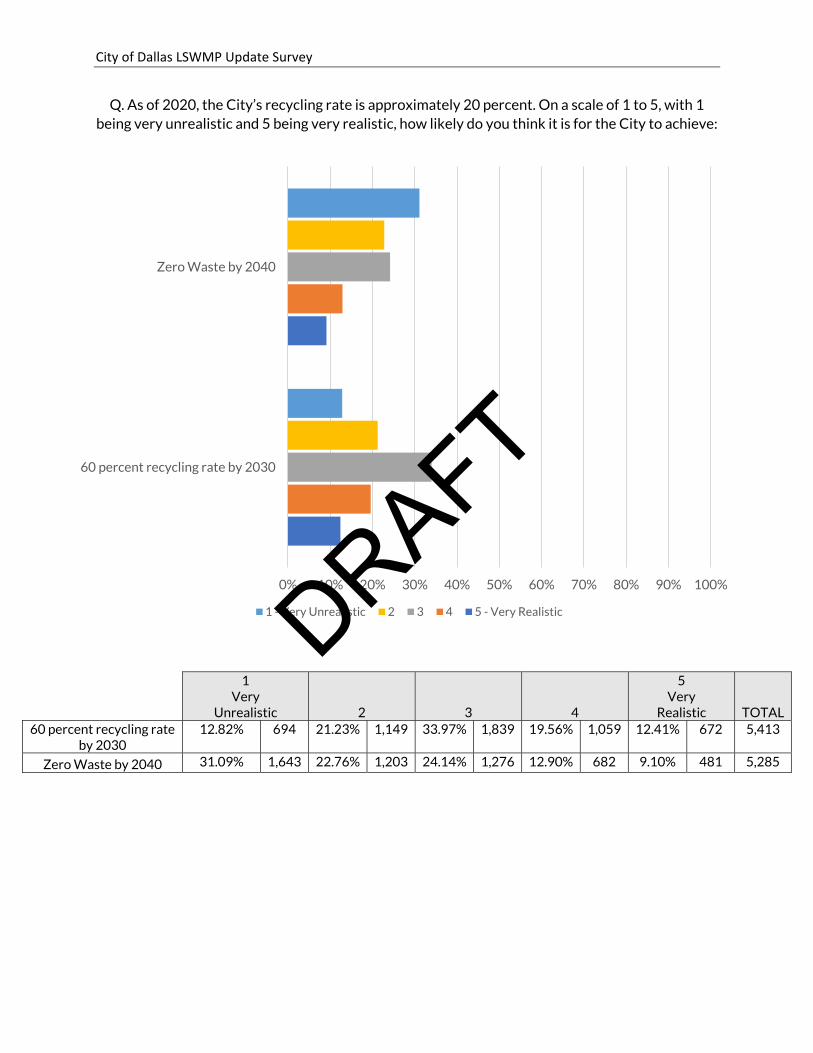
City of Dallas LSWMP Update Survey
Q. As of 2020, the City’s recycling rate is approximately 20 percent. On a scale of 1 to 5, with 1 being very unrealistic and 5 being very realistic, how likely do you think it is for the City to achieve:
1 Very
Unrealistic 2 3 4
5 Very
Realistic TOTAL 60 percent recycling rate
by 2030 12.82% 694 21.23% 1,149 33.97% 1,839 19.56% 1,059 12.41% 672 5,413
Zero Waste by 2040 31.09% 1,643 22.76% 1,203 24.14% 1,276 12.90% 682 9.10% 481 5,285
0% 10% 20% 30% 40% 50% 60% 70% 80% 90% 100%
60 percent recycling rate by 2030
Zero Waste by 2040
1 - Very Unrealistic 2 3 4 5 - Very RealisticDRAFT
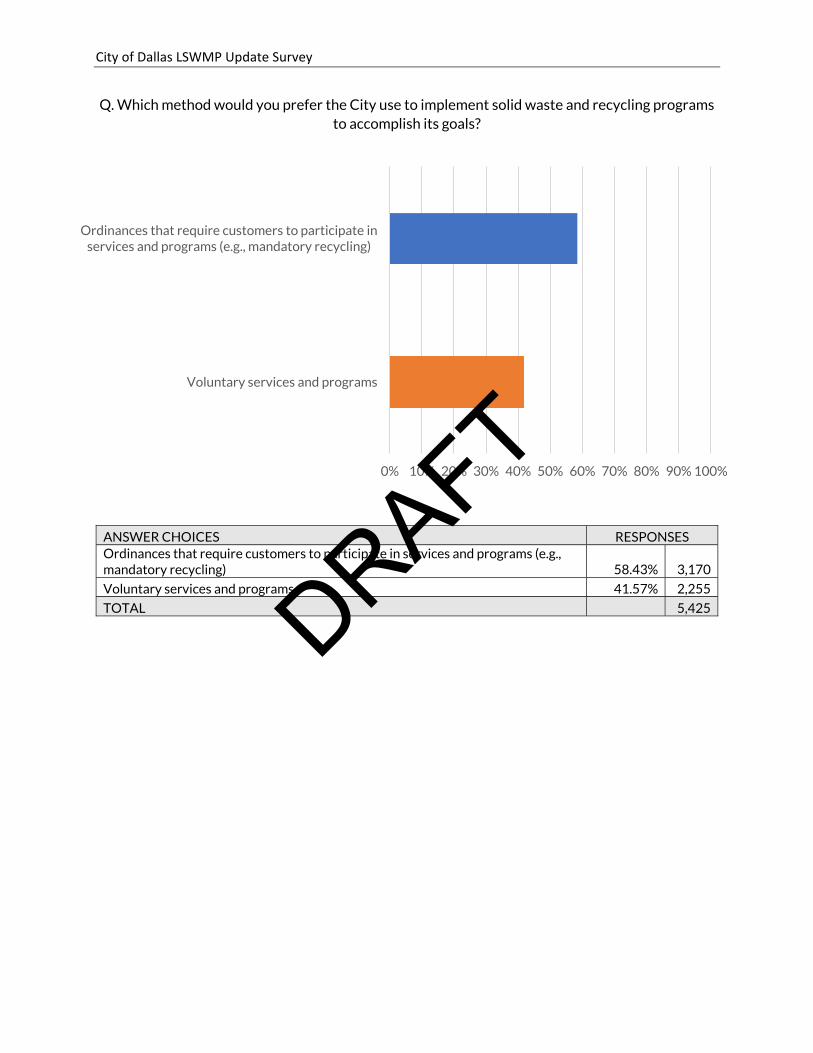
City of Dallas LSWMP Update Survey
Q. Which method would you prefer the City use to implement solid waste and recycling programs to accomplish its goals?
ANSWER CHOICES RESPONSES Ordinances that require customers to participate in services and programs (e.g., mandatory recycling) 58.43% 3,170
Voluntary services and programs 41.57% 2,255
TOTAL 5,425
0% 10% 20% 30% 40% 50% 60% 70% 80% 90% 100%
Voluntary services and programs
Ordinances that require customers to participate inservices and programs (e.g., mandatory recycling)
DRAFT

Local Solid Waste Management Plan (LSWMP) Update
City of Dallas, Texas
Environmental and Sustainability Task Force
April 16, 2021
DRAFT
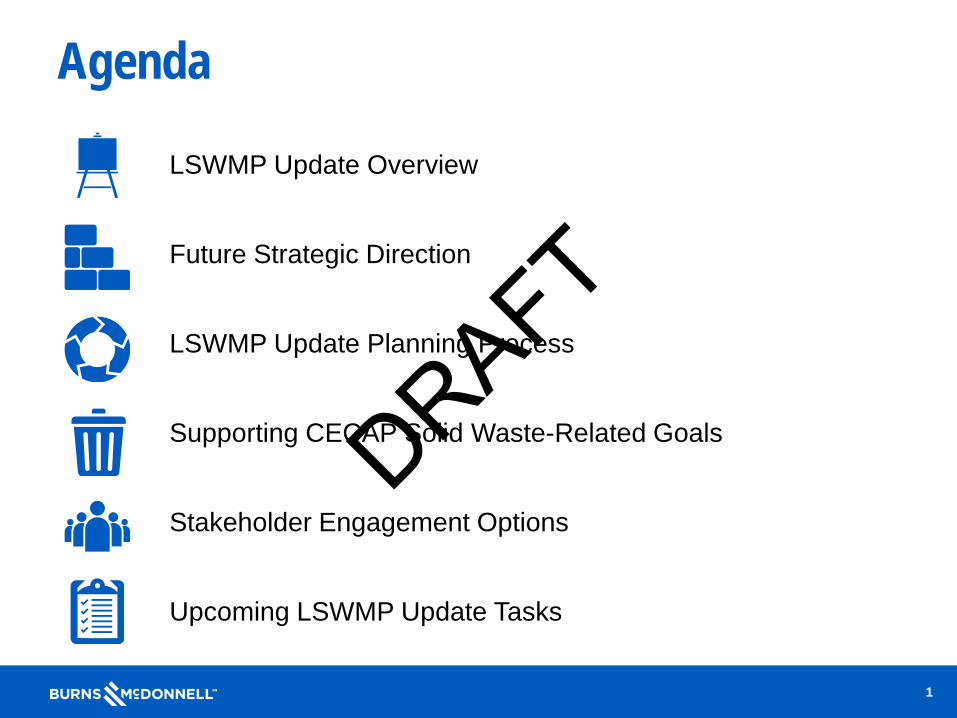
Agenda
LSWMP Update Overview
Future Strategic Direction
LSWMP Update Planning Process
Supporting CECAP Solid Waste-Related Goals
Stakeholder Engagement Options
Upcoming LSWMP Update Tasks
1
DRAFT
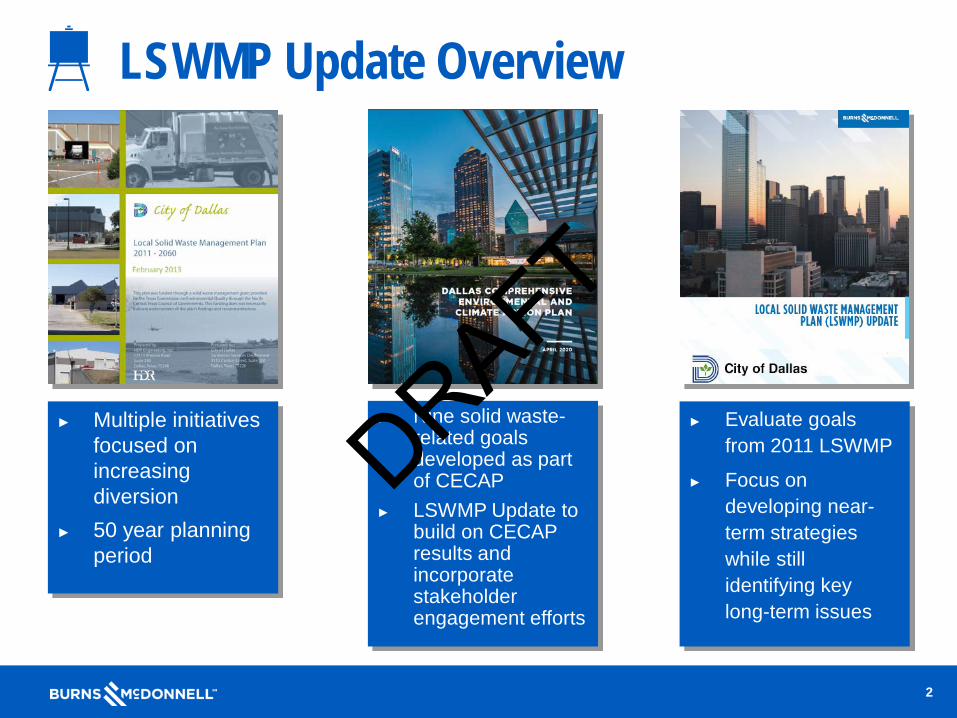
LSWMP Update Overview
► Multiple initiatives
focused on
increasing
diversion
► 50 year planning
period
2
► Evaluate goals
from 2011 LSWMP
► Focus on
developing near-
term strategies
while still
identifying key
long-term issues
► Nine solid waste-related goals developed as part of CECAP
► LSWMP Update to build on CECAP results and incorporate stakeholder engagement efforts
DRAFT
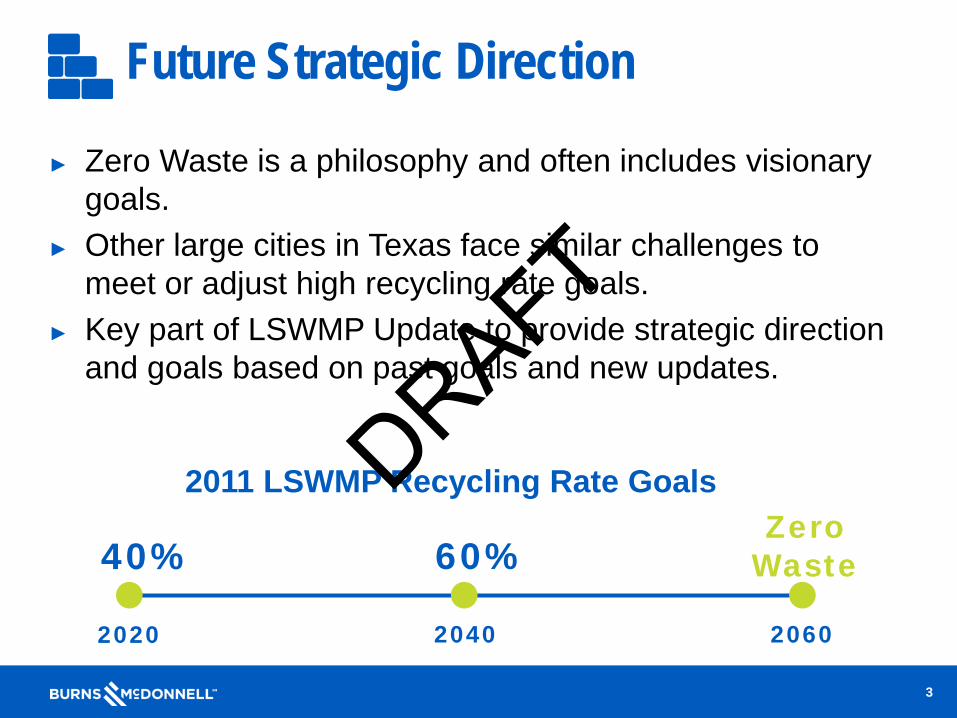
Future Strategic Direction
2011 LSWMP Recycling Rate Goals
3
► Zero Waste is a philosophy and often includes visionary
goals.
► Other large cities in Texas face similar challenges to
meet or adjust high recycling rate goals.
► Key part of LSWMP Update to provide strategic direction
and goals based on past goals and new updates.
Zero Waste
2020 20602040
40% 60%
DRAFT
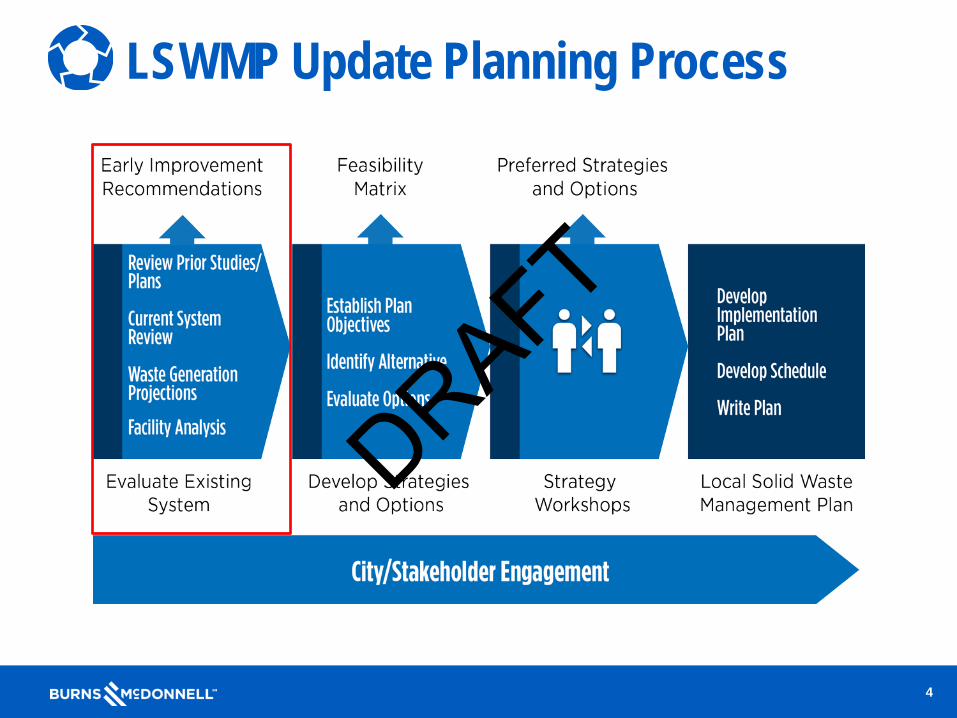
4
LSWMP Update Planning Process
DRAFT
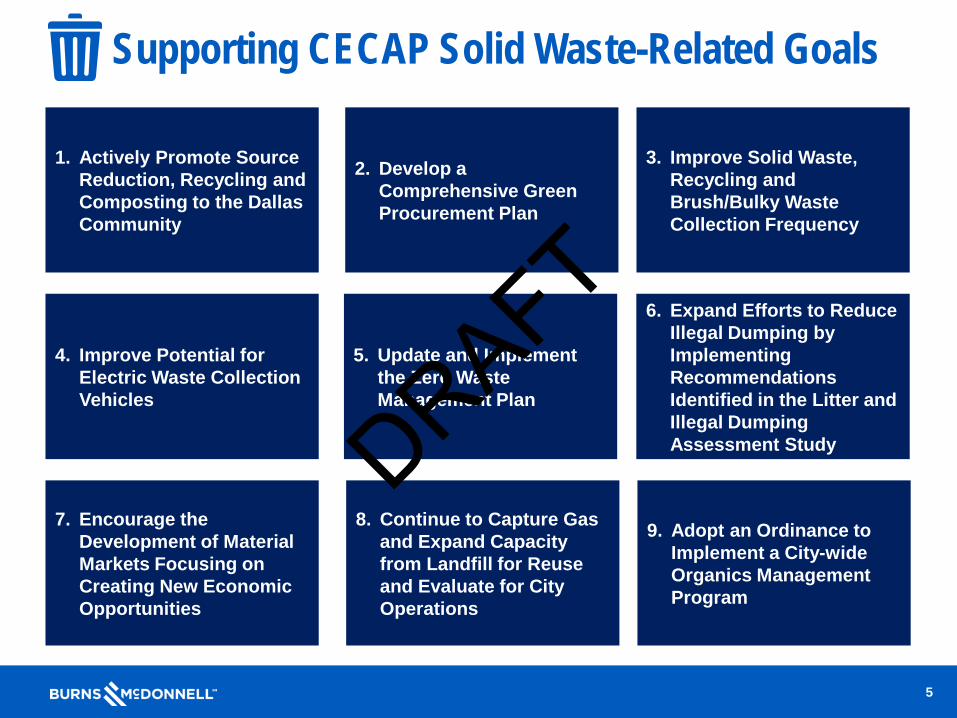
Supporting CECAP Solid Waste-Related Goals
5
1. Actively Promote Source
Reduction, Recycling and
Composting to the Dallas
Community
2. Develop a
Comprehensive Green
Procurement Plan
3. Improve Solid Waste,
Recycling and
Brush/Bulky Waste
Collection Frequency
4. Improve Potential for
Electric Waste Collection
Vehicles
5. Update and Implement
the Zero Waste
Management Plan
6. Expand Efforts to Reduce
Illegal Dumping by
Implementing
Recommendations
Identified in the Litter and
Illegal Dumping
Assessment Study
7. Encourage the
Development of Material
Markets Focusing on
Creating New Economic
Opportunities
8. Continue to Capture Gas
and Expand Capacity
from Landfill for Reuse
and Evaluate for City
Operations
9. Adopt an Ordinance to
Implement a City-wide
Organics Management
Program
DRAFT
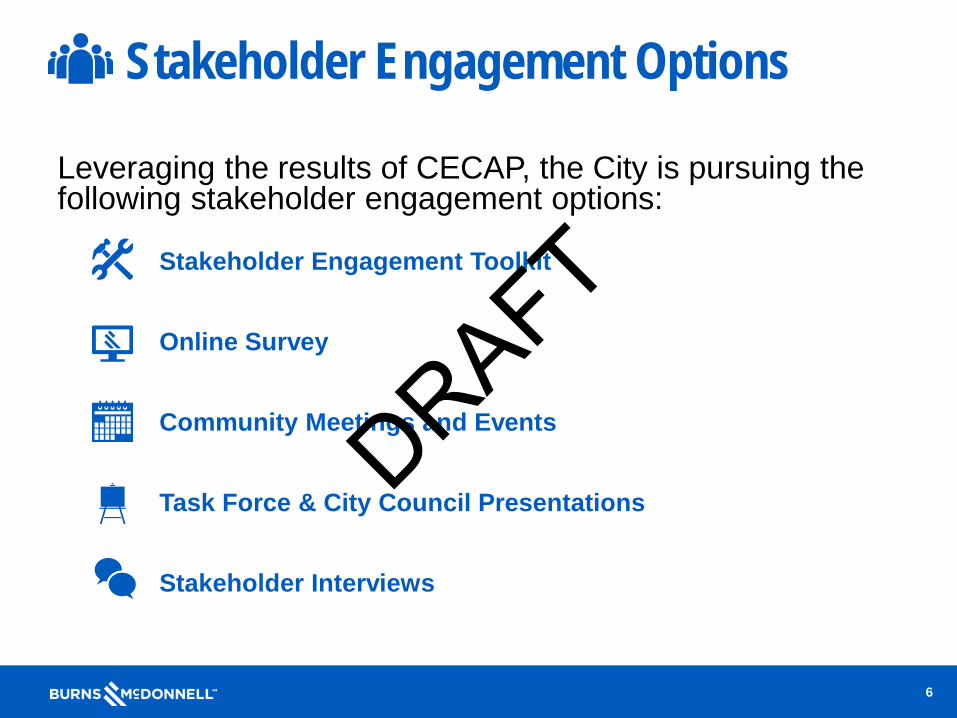
Stakeholder Engagement Options
Leveraging the results of CECAP, the City is pursuing the following stakeholder engagement options:
Stakeholder Engagement Toolkit
Online Survey
Community Meetings and Events
Task Force & City Council Presentations
Stakeholder Interviews
6
DRAFT

LSWMP Update Key Milestones (Draft)
7
Spring 2021
Winter 2021
Summer 2021
Fall2021
Field work, site
visits and analysis
Begin stakeholder
engagement
process
Evaluate
effectiveness of
2011 LSWMP
implementation
strategies with City
staff
Establish LSWMP
Update goals and
objectives
Identify alternative
strategies and
evaluate options
Develop 5-year
Implementation/
Funding plan Council Adoption
Indicates City Council Task Force/Subcommittee Presentations
DRAFT
Local Solid Waste Management Plan (LSWMP) Update
City of Dallas, Texas
Environmental and Sustainability Committee
May 3, 2021
DRAFT
Agenda
LSWMP Update Overview
Future Strategic Direction
LSWMP Update Planning Process
Supporting CECAP Solid Waste-Related Goals
Stakeholder Engagement Options
Upcoming LSWMP Update Tasks
1
DRAFT
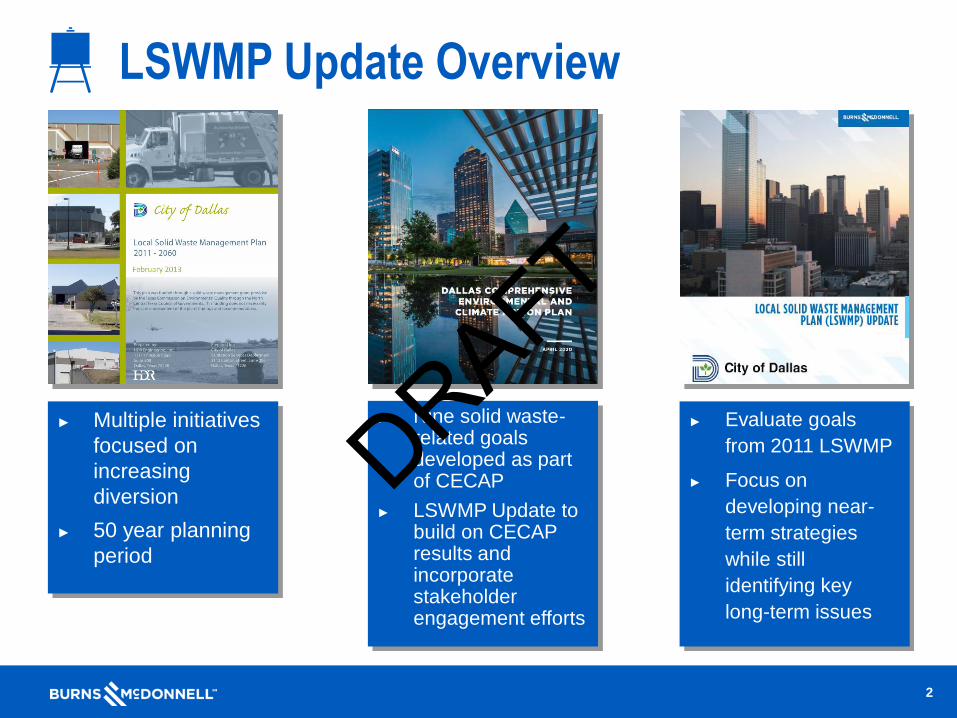
LSWMP Update Overview
► Multiple initiatives
focused on
increasing
diversion
► 50 year planning
period
2
► Evaluate goals
from 2011 LSWMP
► Focus on
developing near-
term strategies
while still
identifying key
long-term issues
► Nine solid waste-related goals developed as part of CECAP
► LSWMP Update to build on CECAP results and incorporate stakeholder engagement efforts
DRAFT
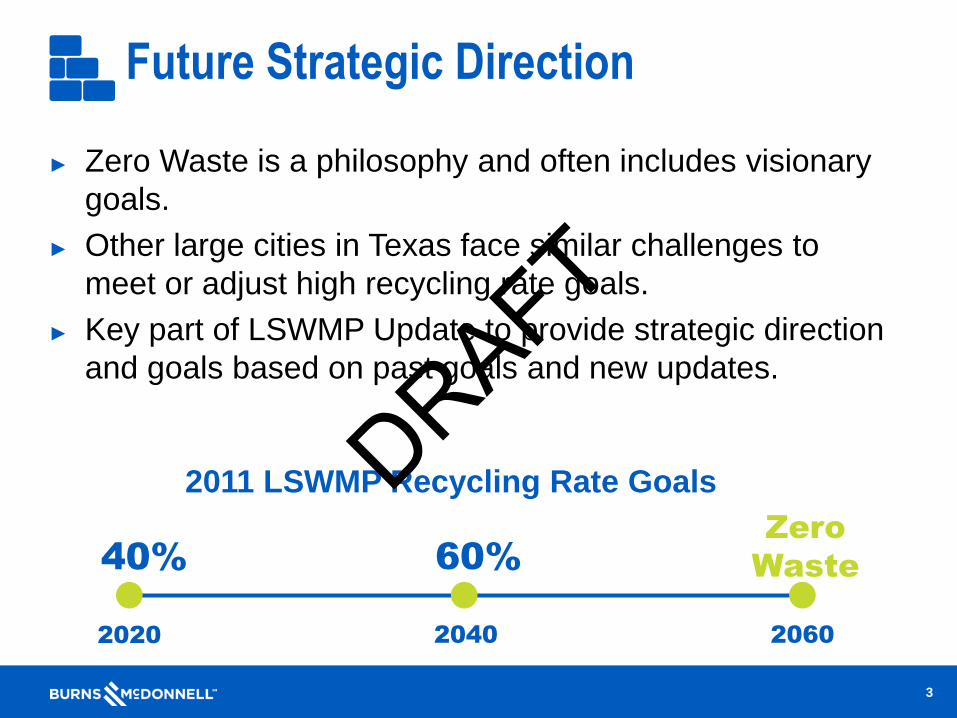
Future Strategic Direction
2011 LSWMP Recycling Rate Goals
3
► Zero Waste is a philosophy and often includes visionary
goals.
► Other large cities in Texas face similar challenges to
meet or adjust high recycling rate goals.
► Key part of LSWMP Update to provide strategic direction
and goals based on past goals and new updates.
Zero
Waste
2020 20602040
40% 60%
DRAFT
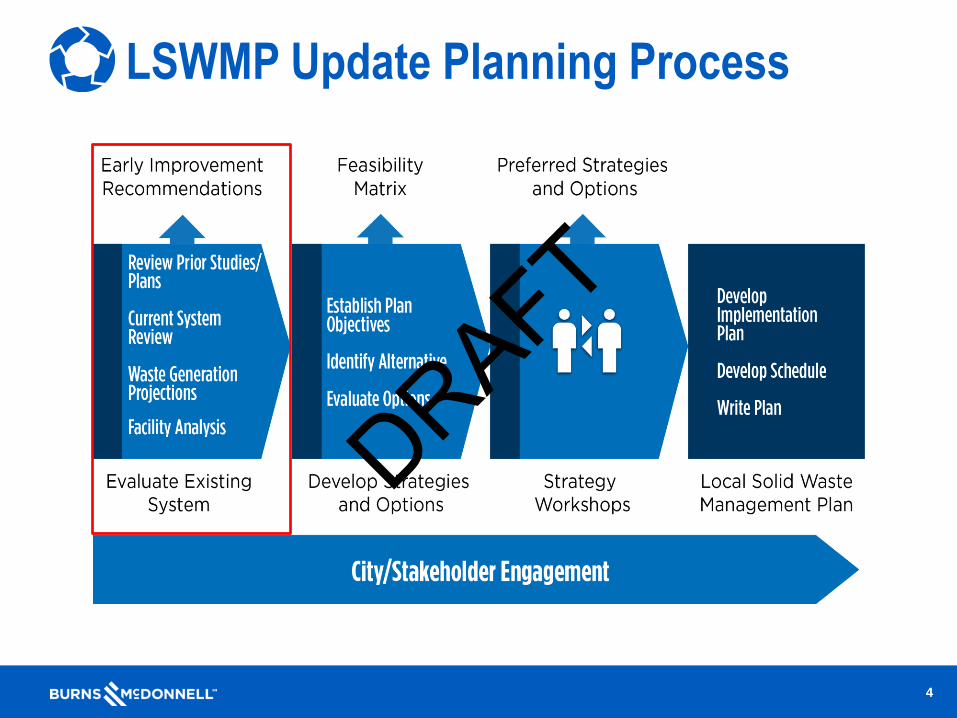
4
LSWMP Update Planning Process
DRAFT

Supporting CECAP Solid Waste-Related Goals
5
1. Actively Promote Source
Reduction, Recycling and
Composting to the Dallas
Community
2. Develop a
Comprehensive Green
Procurement Plan
3. Improve Solid Waste,
Recycling and
Brush/Bulky Waste
Collection Frequency
4. Improve Potential for
Electric Waste Collection
Vehicles
5. Update and Implement
the Zero Waste
Management Plan
6. Expand Efforts to Reduce
Illegal Dumping by
Implementing
Recommendations
Identified in the Litter and
Illegal Dumping
Assessment Study
7. Encourage the
Development of Material
Markets Focusing on
Creating New Economic
Opportunities
8. Continue to Capture Gas
and Expand Capacity
from Landfill for Reuse
and Evaluate for City
Operations
9. Adopt an Ordinance to
Implement a City-wide
Organics Management
Program
DRAFT
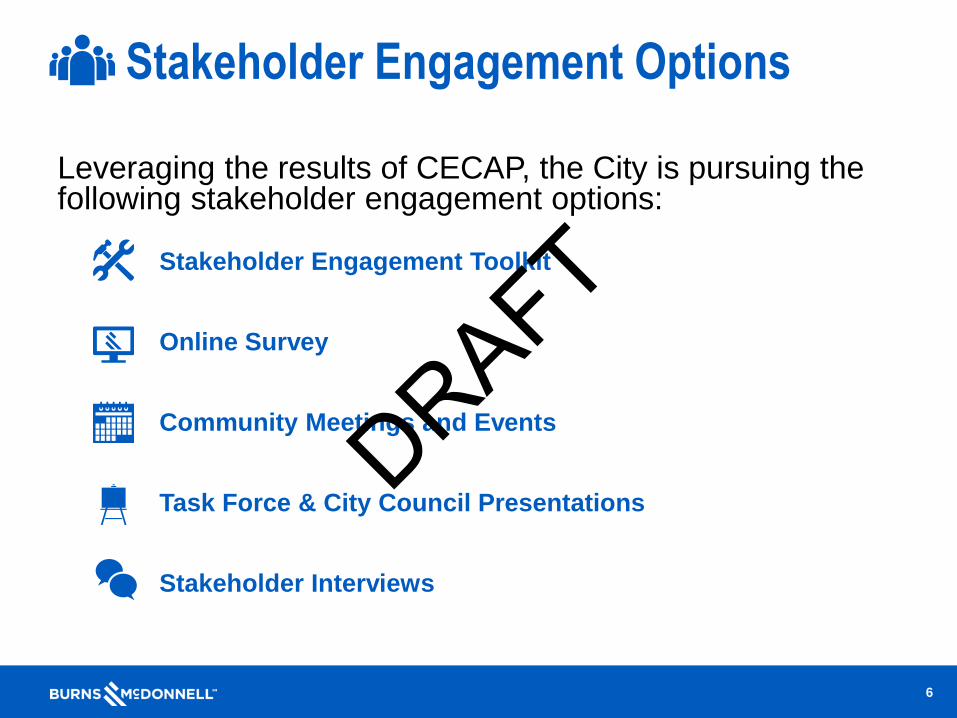
Stakeholder Engagement Options
Leveraging the results of CECAP, the City is pursuing the following stakeholder engagement options:
Stakeholder Engagement Toolkit
Online Survey
Community Meetings and Events
Task Force & City Council Presentations
Stakeholder Interviews
6
DRAFT
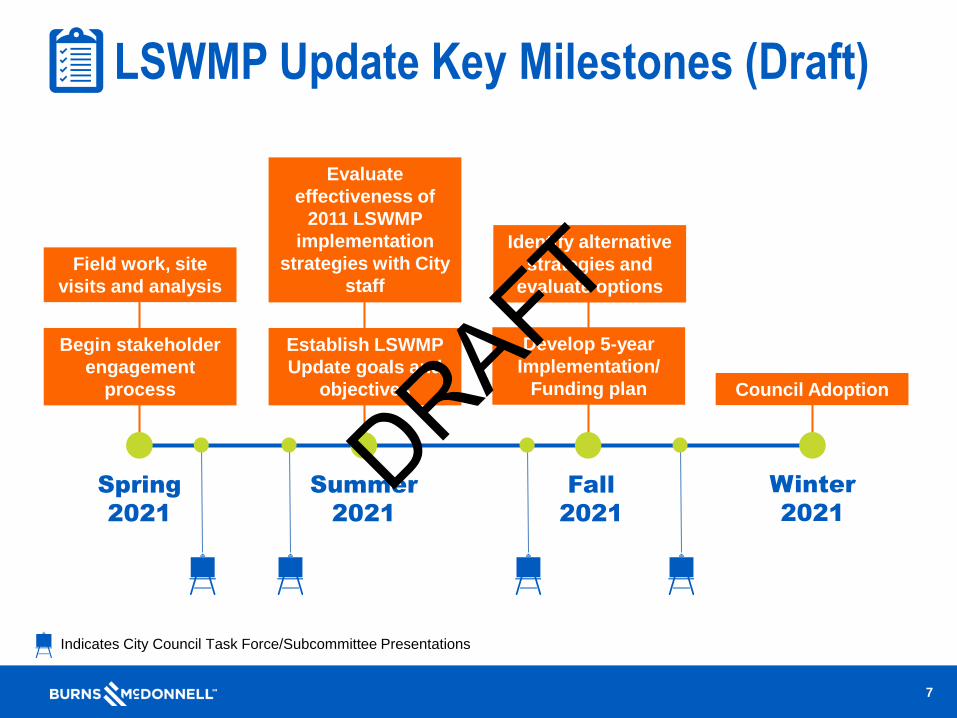
LSWMP Update Key Milestones (Draft)
7
Spring
2021
Winter
2021
Summer
2021
Fall
2021
Field work, site
visits and analysis
Begin stakeholder
engagement
process
Evaluate
effectiveness of
2011 LSWMP
implementation
strategies with City
staff
Establish LSWMP
Update goals and
objectives
Identify alternative
strategies and
evaluate options
Develop 5-year
Implementation/
Funding plan Council Adoption
Indicates City Council Task Force/Subcommittee Presentations
DRAFT
Jay Council, DirectorDepartment of Sanitation Services
City of Dallas
Sanitation ServicesPerformance &
Initiatives Update
Environment and Sustainability Committee
November 1, 2021
1
DRAFT
Presentation Overview
• Background• 2021 Operational & Business Issues• Performance Update• Brush and Bulky Item Separation Pilot Update• Local Solid Waste Management Plan Update• New Initiatives for 2022• Next Steps
2
DRAFT
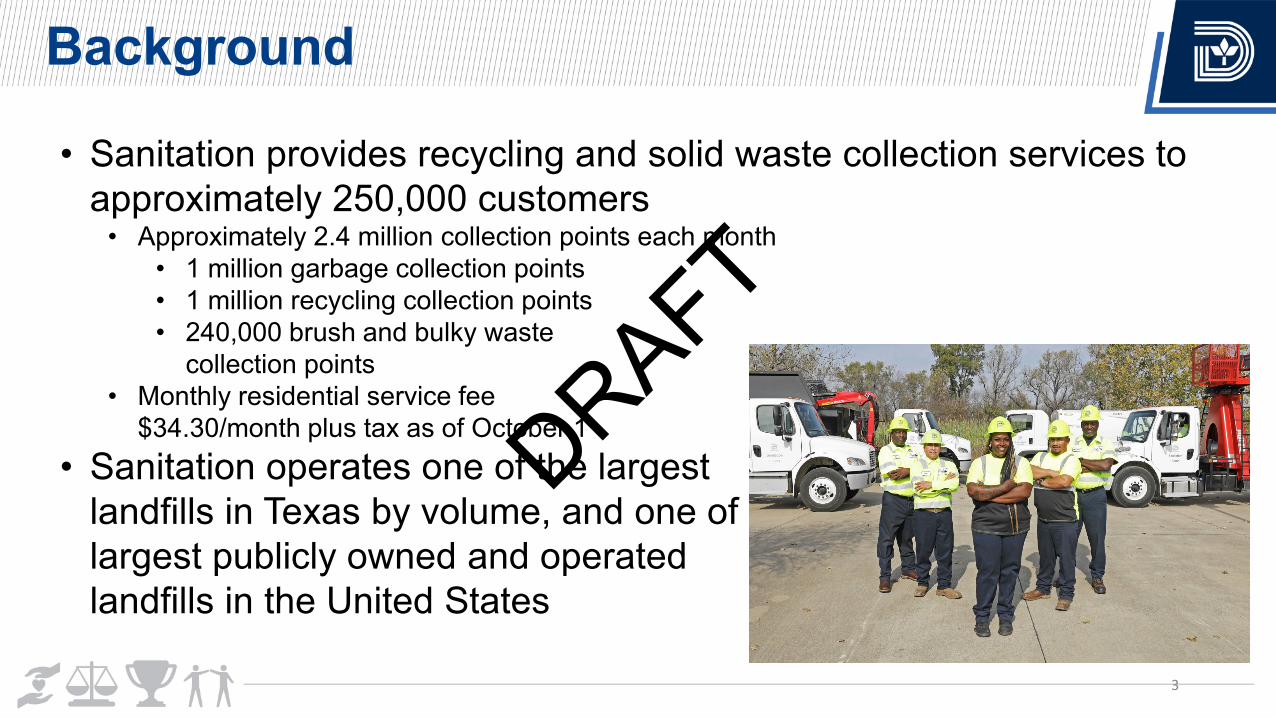
Background
• Sanitation provides recycling and solid waste collection services to approximately 250,000 customers
• Approximately 2.4 million collection points each month• 1 million garbage collection points• 1 million recycling collection points• 240,000 brush and bulky waste
collection points• Monthly residential service fee
$34.30/month plus tax as of October 1• Sanitation operates one of the largest
landfills in Texas by volume, and one of largest publicly owned and operated landfills in the United States
3
DRAFT
Background
• FY 2021-22 operating budget of approximately $140 million• 594 full-time positions and 215 temporary laborer positions• Approximately 375 vehicles and heavy equipment units• Two Major Operational Divisions
• Recycling & Solid Waste Operations• Public-facing component• Recycling, garbage, brush and bulky waste collections
• Post-Collection Operations• Final disposal component• McCommas Bluff Landfill, Materials Recovery Facility, Transfer Stations
• Support Services: Environmental, Safety, Business Operations, Customer Service, Community Affairs
4
DRAFT

Presentation Overview
• Background• 2021 Operational & Business Issues• Performance Update• Brush and Bulky Item Separation Pilot Update• Local Solid Waste Management Plan Update• New Initiatives for 2022• Next Steps
5
DRAFT
2021 Operational & Business Issues• Brush & Bulky Item Collection Delays Due to Winter Storm
• Larger than the usual Spring volume of debris set out in March began a cascade of brush collection delays lasting through May
• 40 contract crews brought in assist with collections• Cost of $5.6 million
• Garbage and Recycling Collection Delays Due to Staffing • June through August• Temporary Laborer Contract
• Contract on a one-year extension at $12.38/hour living wage• Vendor not awarded new contract• Two factors resulted in shortage of helpers
• Sanitation Truck Drivers• Pronounced effect of industry-wide shortage of CDL drivers began in May• Operational adjustments made, prioritizing garbage collection, extending workdays
and work weeks
6
DRAFT

Presentation Overview
• Background• 2021 Operational & Business Issues• Performance Update• Brush and Bulky Item Separation Pilot Update• Local Solid Waste Management Plan Update• New Initiatives for 2022• Next Steps
7
DRAFT
Performance Update
• Reduction in number of missed collection service requests since peak in June
• New Temporary Laborer Contract effective August 16, 2021• Provided an average 95% of required laborers daily
• Staffing goal of 240 truck drivers• Approximately 200 in mid-August• 222 on staff as of October 27, 2021• 15 candidates have received offer letters, in on-boarding
process
8
DRAFT
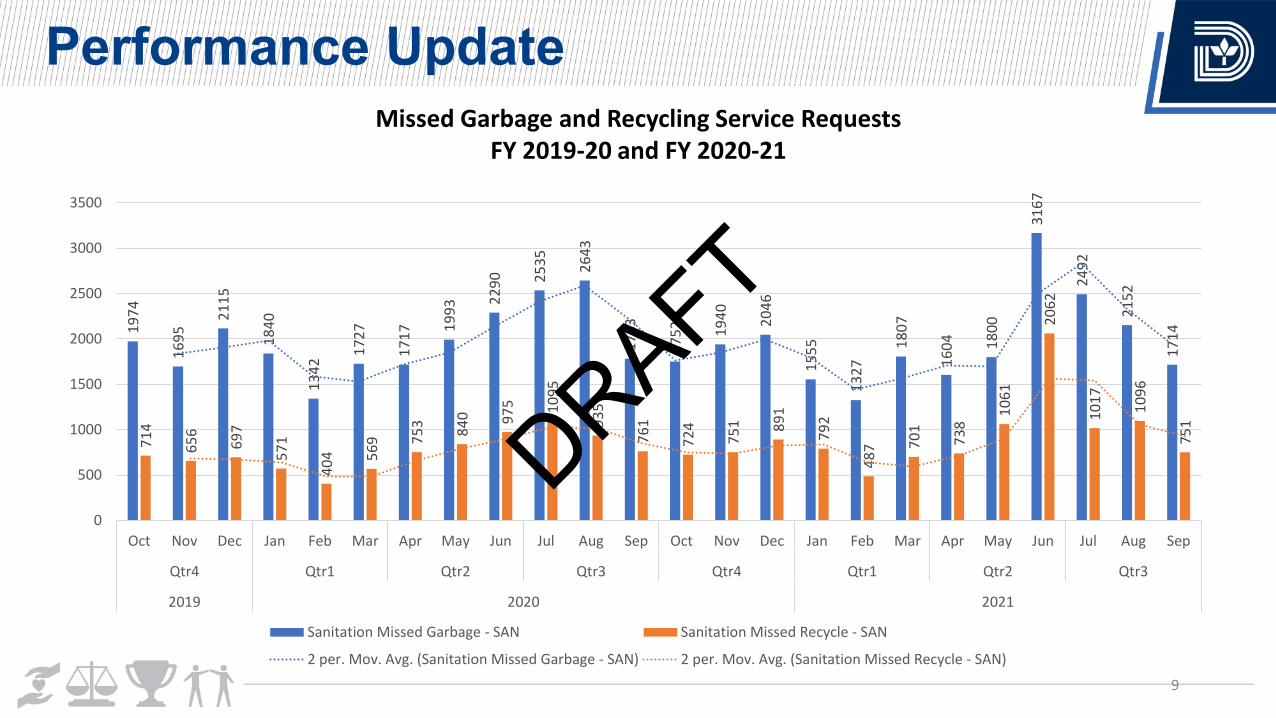
Performance Update19
74
1695
2115
1840
1342
1727
1717 19
93
2290 25
35 2643
1783
1752 19
40 2046
1555
1327
1807
1604 18
00
3167
2492
2152
1714
714
656
697
571
404 56
9 753 84
0 975 10
95
935
761
724
751 89
1
792
487 70
1
738
1061
2062
1017 1096
751
0
500
1000
1500
2000
2500
3000
3500
Oct Nov Dec Jan Feb Mar Apr May Jun Jul Aug Sep Oct Nov Dec Jan Feb Mar Apr May Jun Jul Aug Sep
Qtr4 Qtr1 Qtr2 Qtr3 Qtr4 Qtr1 Qtr2 Qtr3
2019 2020 2021
Sanitation Missed Garbage - SAN Sanitation Missed Recycle - SAN
2 per. Mov. Avg. (Sanitation Missed Garbage - SAN) 2 per. Mov. Avg. (Sanitation Missed Recycle - SAN)
Missed Garbage and Recycling Service Requests FY 2019-20 and FY 2020-21
9
DRAFT
Performance Update• Brush and bulky waste collections on time since June
• Supplemental contractor assistance still required• Compliance with program guidelines challenging
• 10 cubic yard limit (once annual 20 cubic yard oversize collection)• Prohibited items and placement
• Service provided at a loss over the last several years• Increased volumes, labor and equipment costs• Cost included in residential fee
• Ongoing discussions with Council on ways to achieve a cost-efficient program aligned with the Comprehensive Environmental and Climate Action Plan (CECAP) goals
• A 90-day pilot program in 6 neighborhoods began in October
10
DRAFT
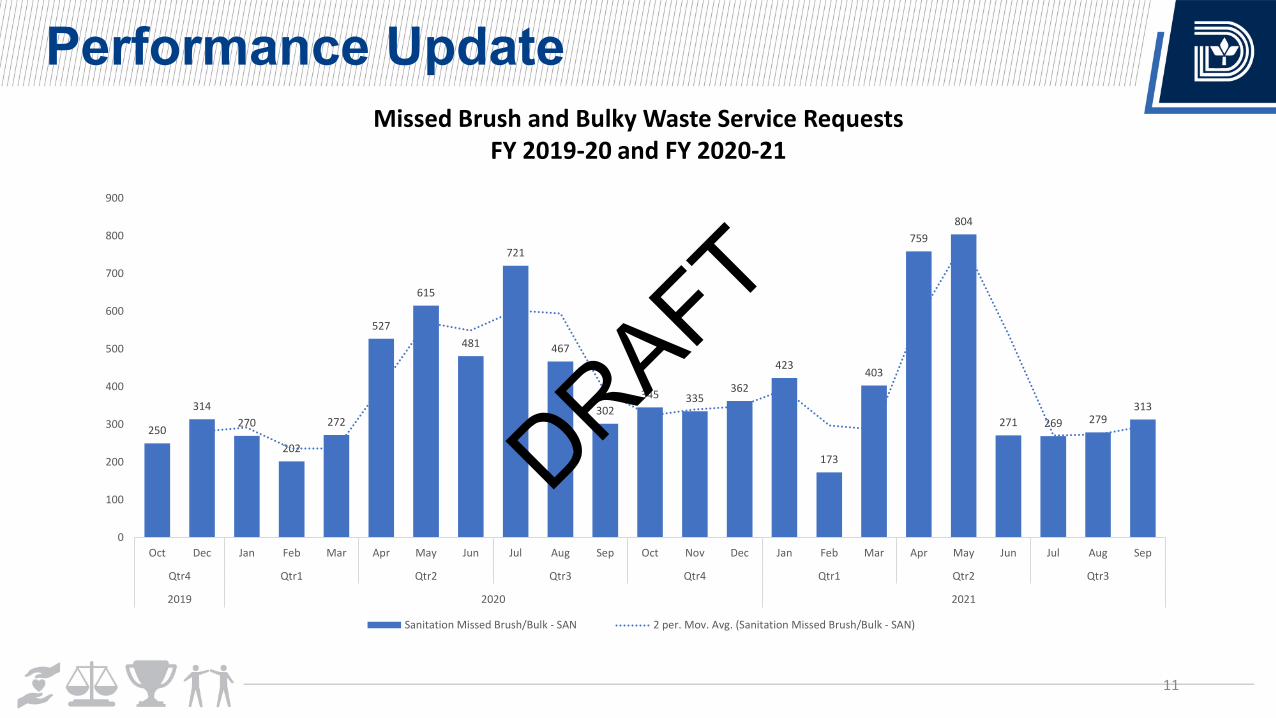
Performance UpdateMissed Brush and Bulky Waste Service Requests
FY 2019-20 and FY 2020-21
250
314270
202
272
527
615
481
721
467
302345 335
362
423
173
403
759804
271 269 279313
0
100
200
300
400
500
600
700
800
900
Oct Dec Jan Feb Mar Apr May Jun Jul Aug Sep Oct Nov Dec Jan Feb Mar Apr May Jun Jul Aug Sep
Qtr4 Qtr1 Qtr2 Qtr3 Qtr4 Qtr1 Qtr2 Qtr3
2019 2020 2021
Sanitation Missed Brush/Bulk - SAN 2 per. Mov. Avg. (Sanitation Missed Brush/Bulk - SAN)
11
DRAFT
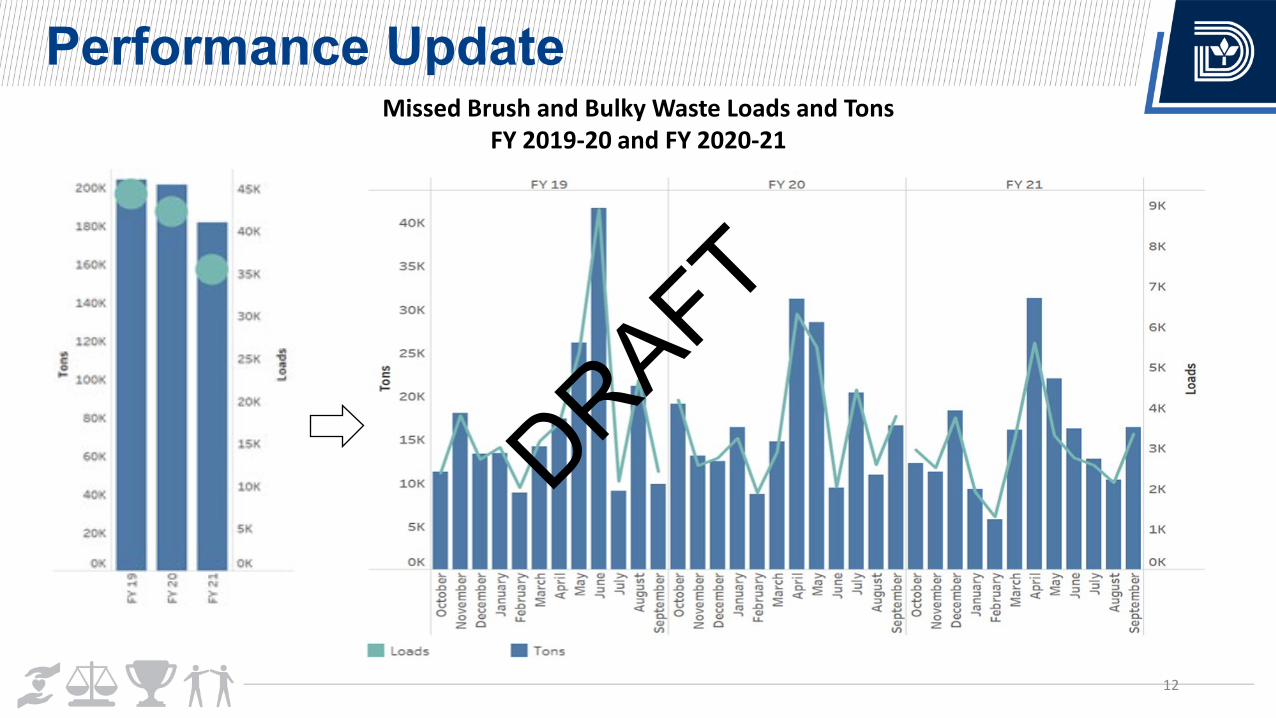
Performance UpdateMissed Brush and Bulky Waste Loads and Tons
FY 2019-20 and FY 2020-21
12
DRAFT

Presentation Overview
• Background• 2021 Operational & Business Issues• Performance Update• Brush and Bulky Item Separation Pilot Update• Local Solid Waste Management Plan Update• New Initiatives for 2022• Next Steps
13
DRAFT
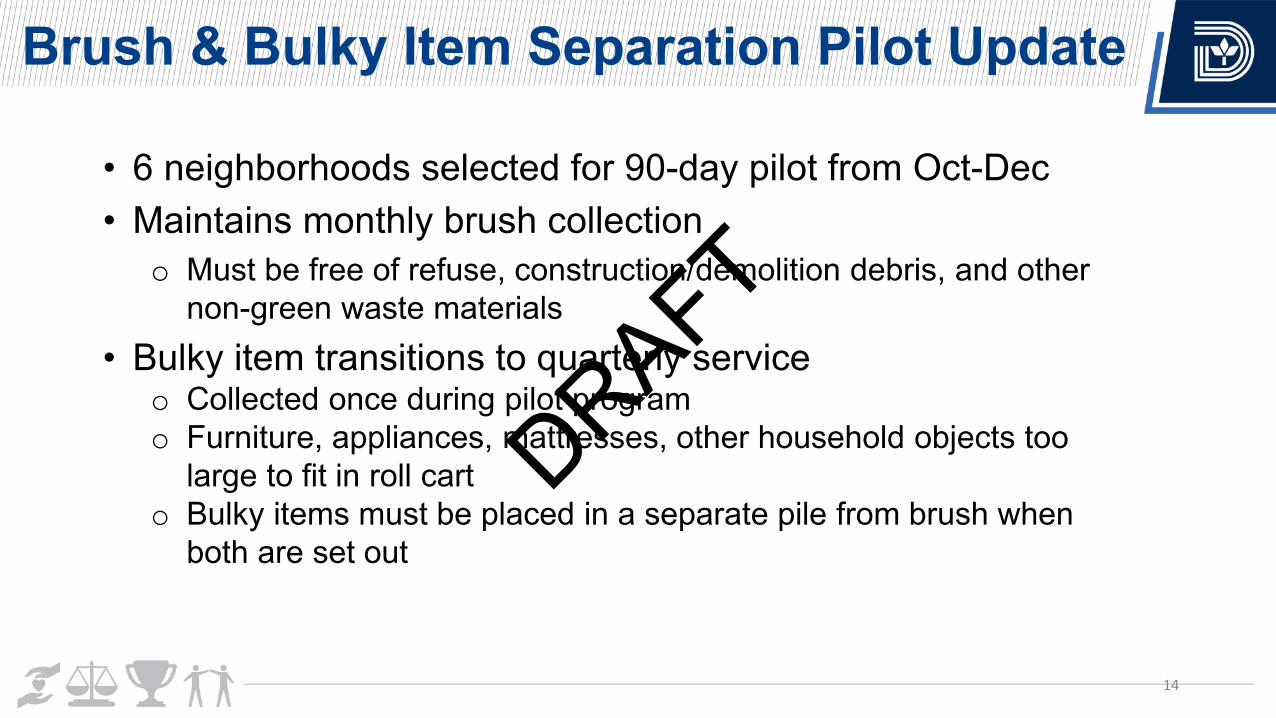
Brush & Bulky Item Separation Pilot Update
• 6 neighborhoods selected for 90-day pilot from Oct-Dec• Maintains monthly brush collection
o Must be free of refuse, construction/demolition debris, and other non-green waste materials
• Bulky item transitions to quarterly serviceo Collected once during pilot programo Furniture, appliances, mattresses, other household objects too
large to fit in roll carto Bulky items must be placed in a separate pile from brush when
both are set out
14
DRAFT
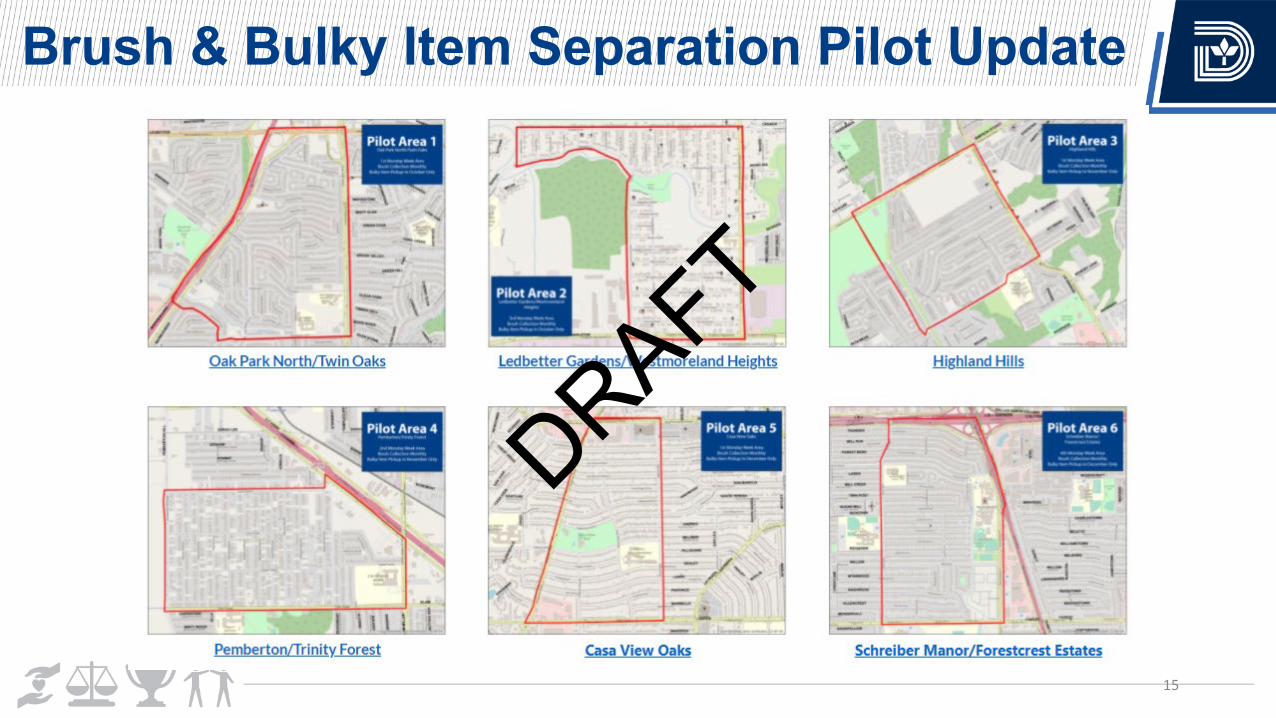
Brush & Bulky Item Separation Pilot Update
15
DRAFT
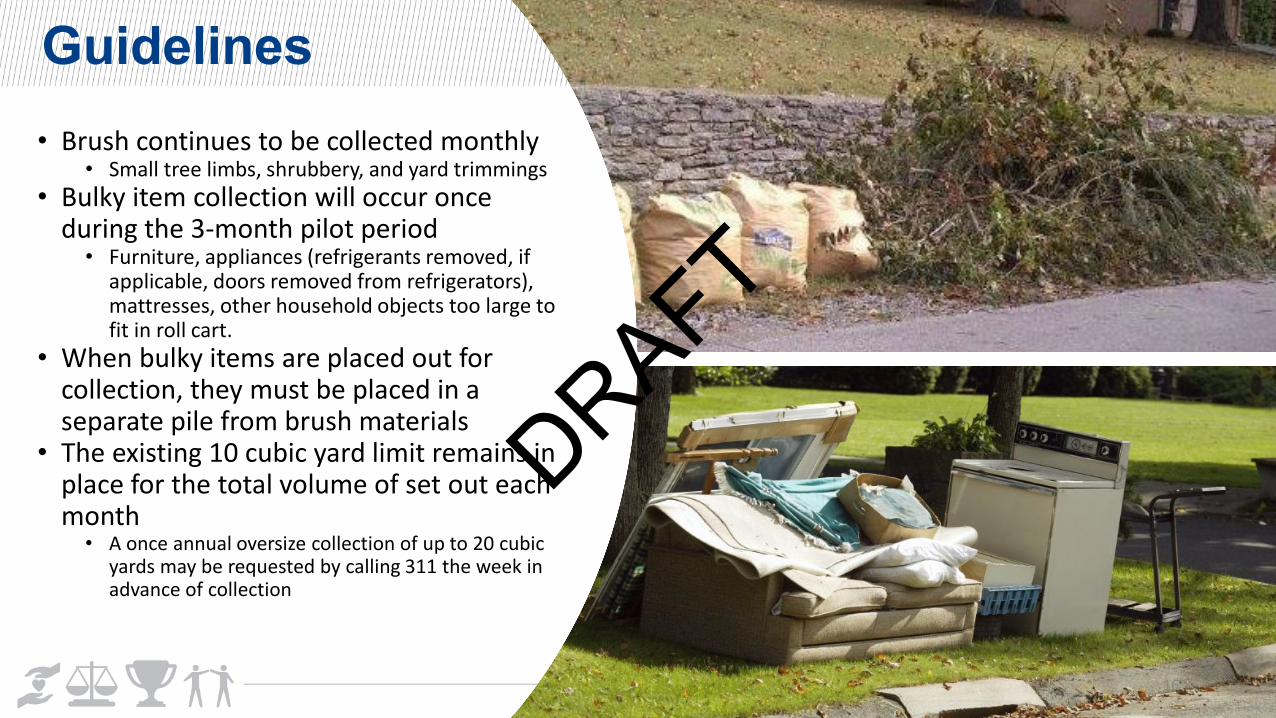
• Brush continues to be collected monthly• Small tree limbs, shrubbery, and yard trimmings
• Bulky item collection will occur once during the 3-month pilot period
• Furniture, appliances (refrigerants removed, if applicable, doors removed from refrigerators), mattresses, other household objects too large to fit in roll cart.
• When bulky items are placed out for collection, they must be placed in a separate pile from brush materials
• The existing 10 cubic yard limit remains in place for the total volume of set out each month
• A once annual oversize collection of up to 20 cubic yards may be requested by calling 311 the week in advance of collection
Guidelines
16
DRAFT
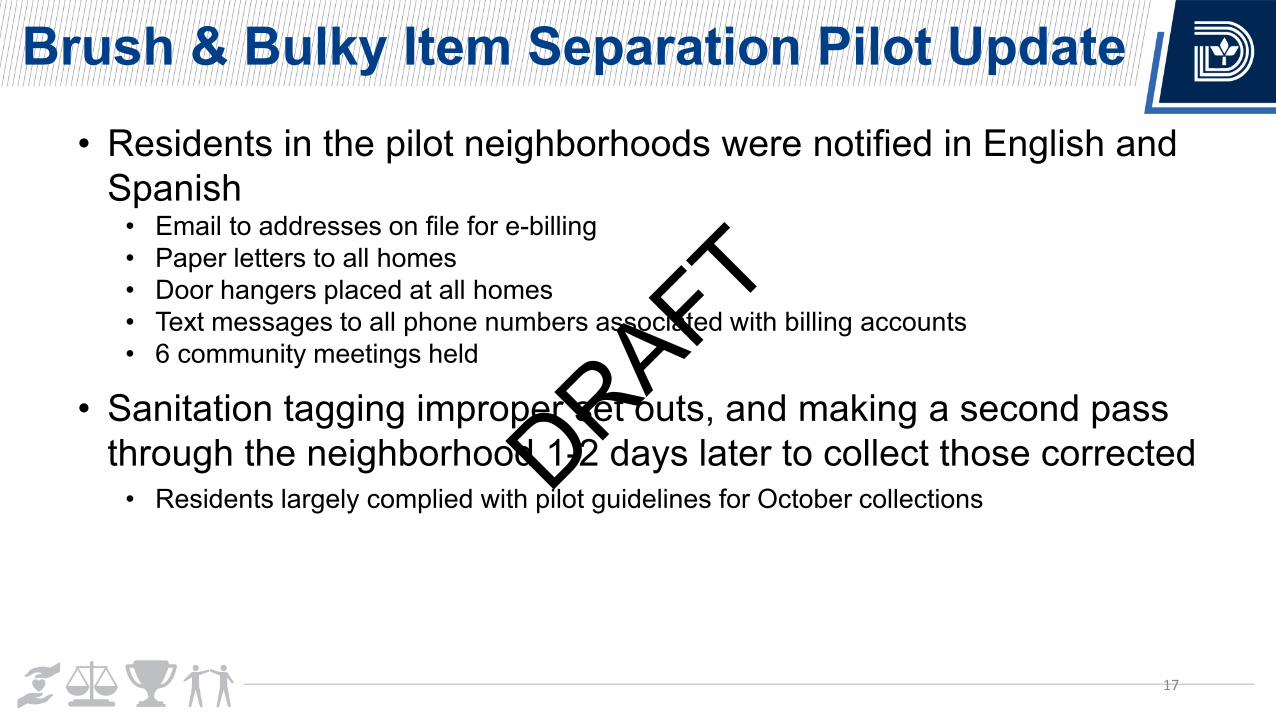
Brush & Bulky Item Separation Pilot Update• Residents in the pilot neighborhoods were notified in English and
Spanish• Email to addresses on file for e-billing• Paper letters to all homes• Door hangers placed at all homes• Text messages to all phone numbers associated with billing accounts• 6 community meetings held
• Sanitation tagging improper set outs, and making a second pass through the neighborhood 1-2 days later to collect those corrected
• Residents largely complied with pilot guidelines for October collections
17
DRAFT
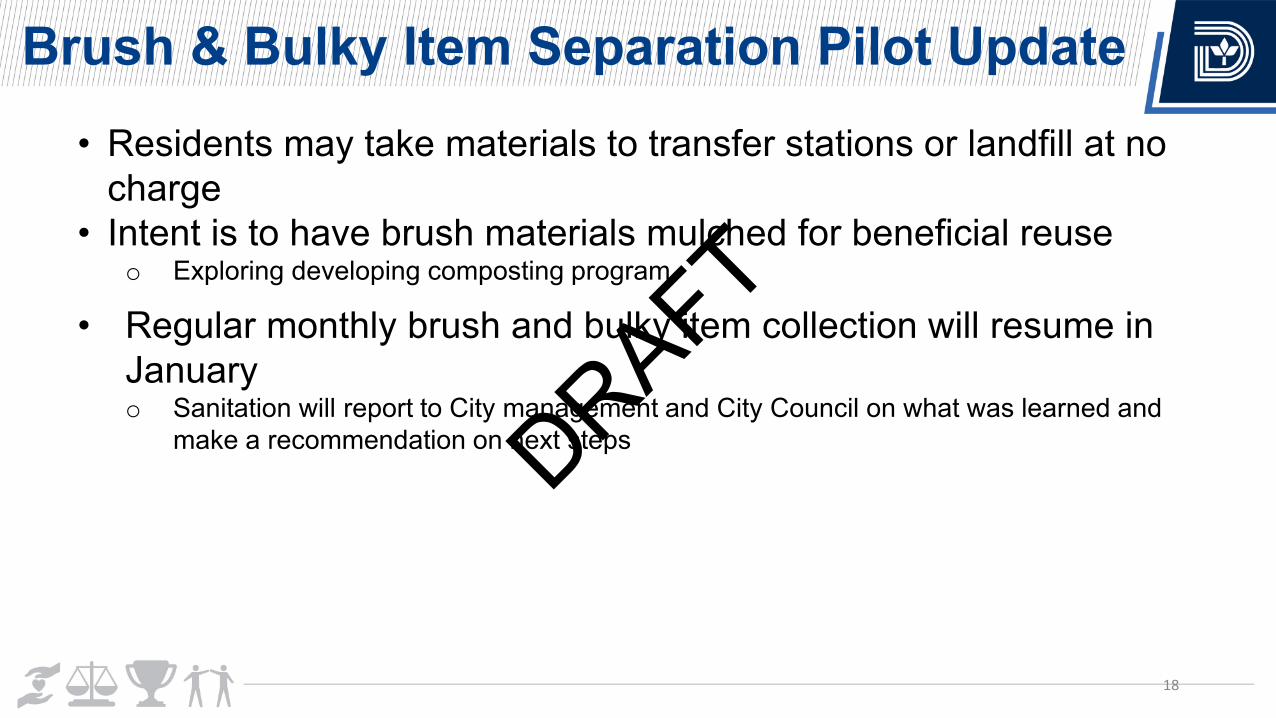
Brush & Bulky Item Separation Pilot Update• Residents may take materials to transfer stations or landfill at no
charge• Intent is to have brush materials mulched for beneficial reuse
o Exploring developing composting program
• Regular monthly brush and bulky item collection will resume in January o Sanitation will report to City management and City Council on what was learned and
make a recommendation on next steps
18
DRAFT
Presentation Overview
• Background• 2021 Operational & Business Issues• Performance Update• Brush and Bulky Item Separation Pilot Update• Local Solid Waste Management Plan Update• New Initiatives for 2022• Next Steps
19
DRAFT
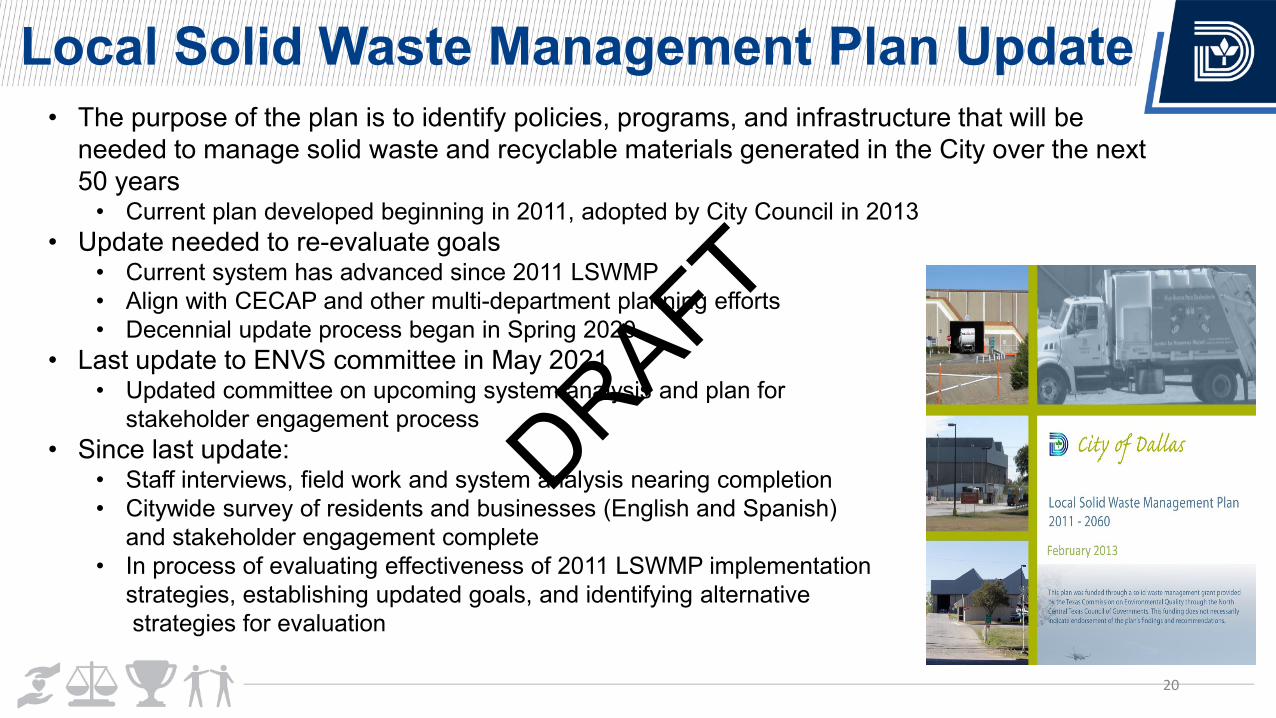
Local Solid Waste Management Plan Update• The purpose of the plan is to identify policies, programs, and infrastructure that will be
needed to manage solid waste and recyclable materials generated in the City over the next 50 years
• Current plan developed beginning in 2011, adopted by City Council in 2013• Update needed to re-evaluate goals
• Current system has advanced since 2011 LSWMP• Align with CECAP and other multi-department planning efforts• Decennial update process began in Spring 2020
• Last update to ENVS committee in May 2021• Updated committee on upcoming system analysis and plan for
stakeholder engagement process• Since last update:
• Staff interviews, field work and system analysis nearing completion• Citywide survey of residents and businesses (English and Spanish)
and stakeholder engagement complete• In process of evaluating effectiveness of 2011 LSWMP implementation
strategies, establishing updated goals, and identifying alternativestrategies for evaluation
20
DRAFT
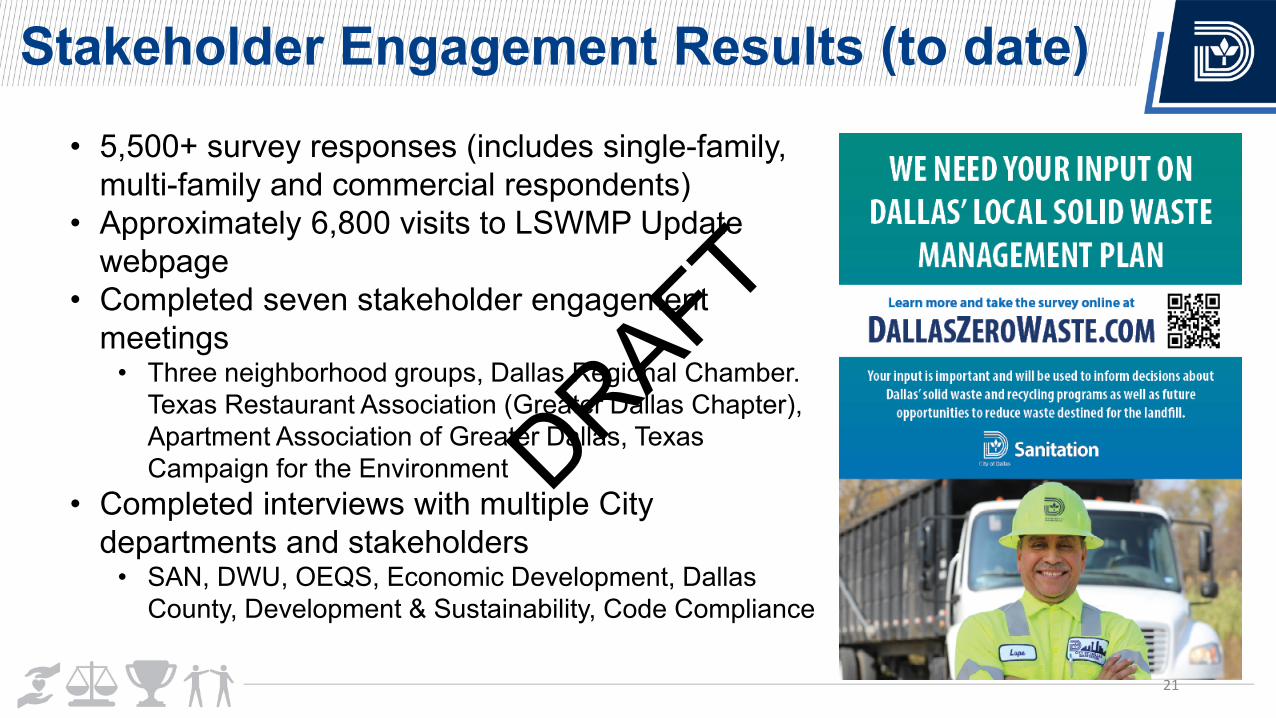
Stakeholder Engagement Results (to date)• 5,500+ survey responses (includes single-family,
multi-family and commercial respondents)• Approximately 6,800 visits to LSWMP Update
webpage• Completed seven stakeholder engagement
meetings• Three neighborhood groups, Dallas Regional Chamber.
Texas Restaurant Association (Greater Dallas Chapter), Apartment Association of Greater Dallas, Texas Campaign for the Environment
• Completed interviews with multiple City departments and stakeholders
• SAN, DWU, OEQS, Economic Development, Dallas County, Development & Sustainability, Code Compliance
21
DRAFT
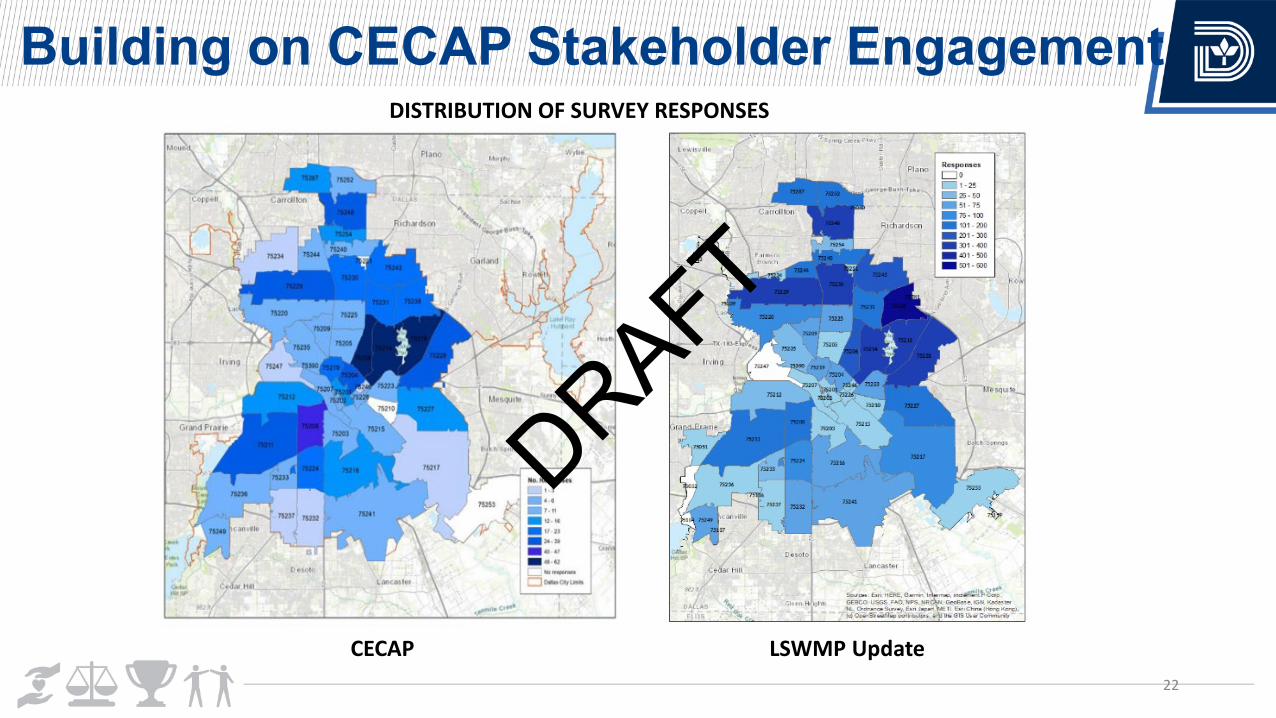
Building on CECAP Stakeholder EngagementDISTRIBUTION OF SURVEY RESPONSES
CECAP LSWMP Update22
DRAFT
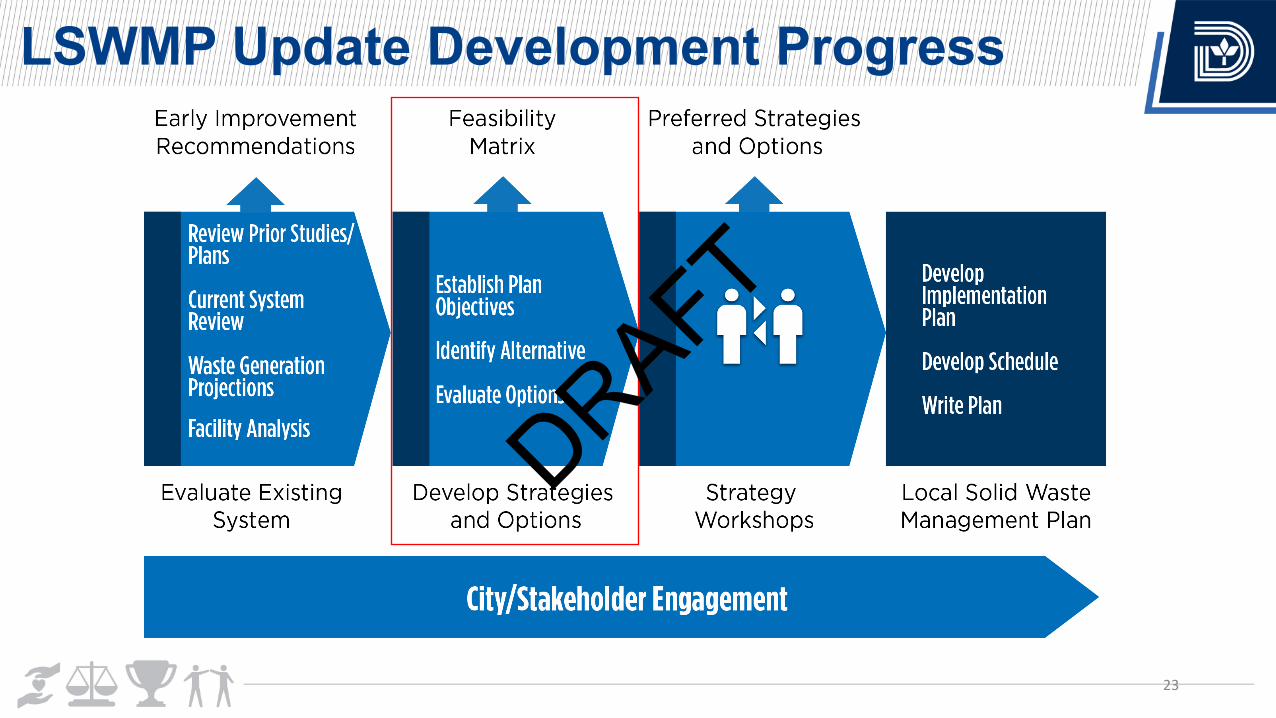
LSWMP Update Development Progress
23
DRAFT
Next Steps in LSWMP Update Development
• Finalize results of the current system and facility capacity analysis• Evaluate effectiveness of 2011 LSWMP implementation, update
goals and determine future strategy options• Continue stakeholder engagement efforts
• Re-engage community stakeholders in early 2022• Identify community meetings and events to share information (with help from ENVS
committee/council to identify opportunities)• Share results of current system analysis and collect feedback on future strategy options
• Evaluate options for the City’s future solid waste management needs
• Develop 5-year implementation/funding plan• Submit LSWMP Update for council adoption
24
DRAFT

Presentation Overview
• Background• 2021 Operational & Business Issues• Performance Update• Brush and Bulky Item Separation Pilot Update• Local Solid Waste Management Plan Update• New Initiatives for 2022• Next Steps
25
DRAFT
New Initiatives for 2022
• Implement an organizational reroute that balance all routes and service days
• Change from a 4/10 to a 5/8 work week to improve service delivery, reduce overtime, and reduce the need for contract labor
• Continue to shift from manual to automated collection vehicles, further reducing the need for temporary labor
26
DRAFT

Presentation Overview
• Background• 2021 Operational & Business Issues• Performance Update• Brush and Bulky Item Separation Pilot Update• Local Solid Waste Management Plan Update• New Initiatives for 2022• Next Steps
27
DRAFT
Next Steps
• Evaluate the viability of monthly brush and quarterly bulk trash collection for citywide implementation
• Develop the capacity to transfer and process organics citywide• Develop tiered options for residential collection in rear alley and
front of house • Host meetings with neighborhood associations and community
advocates on planned service changes, to ensure awareness, and compliance
28
DRAFT
5/11/2022
1
1
Welcome To This Local Solid Waste Management Plan
Update Public Workshop
Scan this QR code, or visit PlanMeeting.DSAN.us, to access meeting materials.
Please also let us know you were here by clicking on the “Register Attendance” button on this site.
LSWMP Update Public Workshop
March 31, 2022
Jay CouncilDirector of Sanitation Services
Cliff GillespieAssistant Director of Sanitation Services
1
2
DRAFT
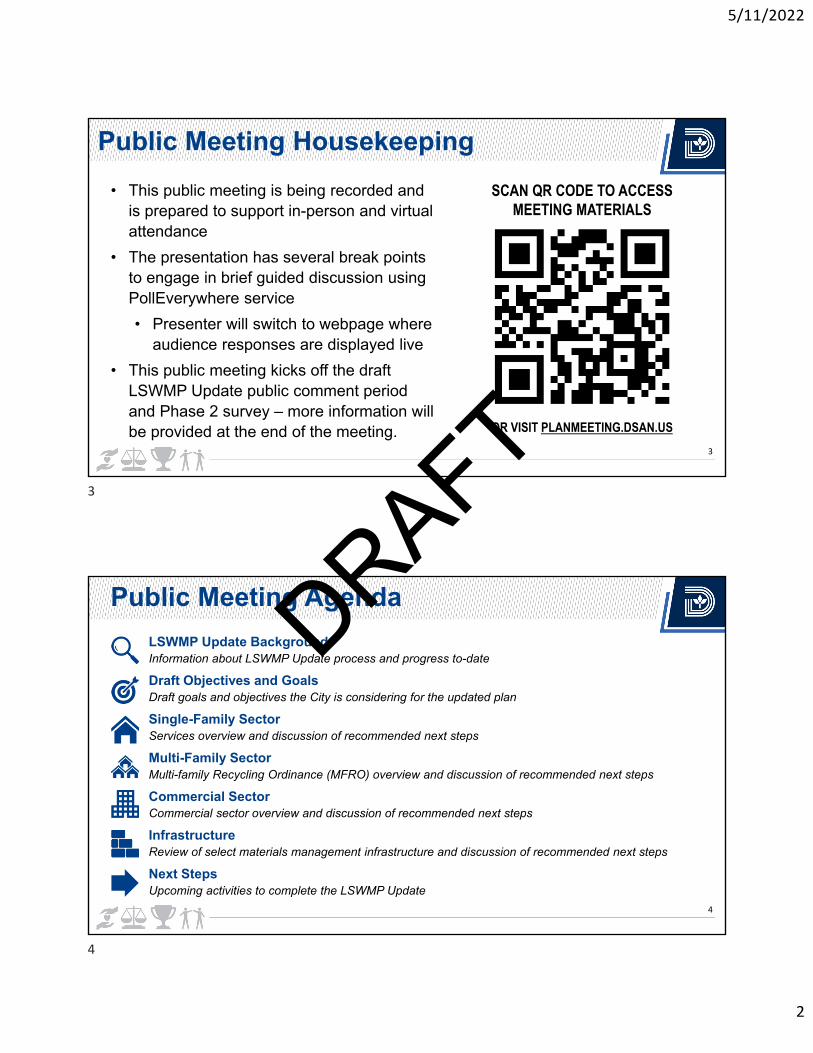
5/11/2022
2
Public Meeting Housekeeping
• This public meeting is being recorded and is prepared to support in-person and virtual attendance
• The presentation has several break points to engage in brief guided discussion using PollEverywhere service
• Presenter will switch to webpage where audience responses are displayed live
• This public meeting kicks off the draft LSWMP Update public comment period and Phase 2 survey – more information will be provided at the end of the meeting.
3
SCAN QR CODE TO ACCESS MEETING MATERIALS
OR VISIT PLANMEETING.DSAN.US
Public Meeting Agenda
LSWMP Update BackgroundInformation about LSWMP Update process and progress to-date
Draft Objectives and GoalsDraft goals and objectives the City is considering for the updated plan
Single-Family SectorServices overview and discussion of recommended next steps
Multi-Family SectorMulti-family Recycling Ordinance (MFRO) overview and discussion of recommended next steps
Commercial SectorCommercial sector overview and discussion of recommended next steps
InfrastructureReview of select materials management infrastructure and discussion of recommended next steps
Next StepsUpcoming activities to complete the LSWMP Update
4
3
4
DRAFT
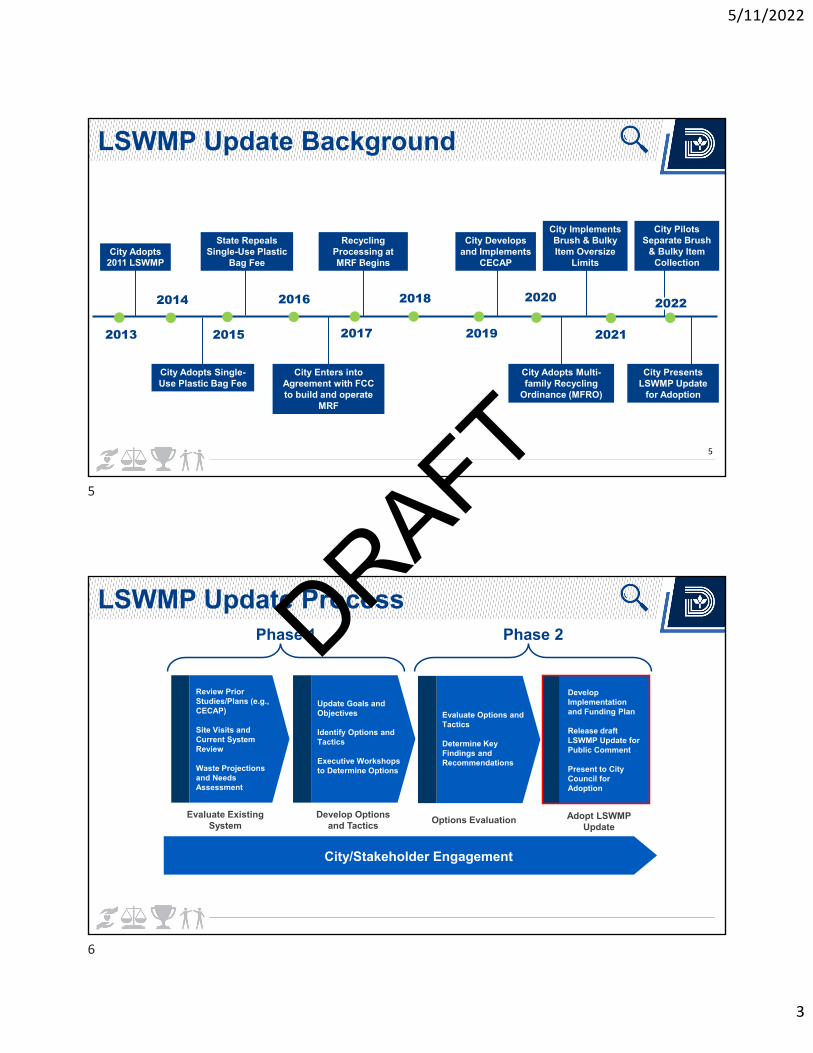
5/11/2022
3
LSWMP Update Background
2015 2017
State Repeals Single-Use Plastic
Bag Fee
City Pilots Separate Brush
& Bulky Item Collection
City Enters into Agreement with FCC to build and operate
MRF
City Develops and Implements
CECAP
City Adopts Multi-family Recycling
Ordinance (MFRO)
20182014
2013
2016
City Adopts 2011 LSWMP
City Adopts Single-Use Plastic Bag Fee
5
2019
2020
2021
2022
City Presents LSWMP Update
for Adoption
Recycling Processing at MRF Begins
City Implements Brush & Bulky Item Oversize
Limits
LSWMP Update Process
Evaluate Existing System
Develop Options and Tactics
Adopt LSWMP Update
City/Stakeholder Engagement
Review Prior Studies/Plans (e.g., CECAP)
Site Visits and Current System Review
Waste Projections and Needs Assessment
Update Goals and Objectives
Identify Options and Tactics
Executive Workshops to Determine Options
Develop Implementation and Funding Plan
Release draft LSWMP Update for Public Comment
Present to City Council for Adoption
Evaluate Options and Tactics
Determine Key Findings and Recommendations
Options Evaluation
Phase 1 Phase 2
5
6
DRAFT
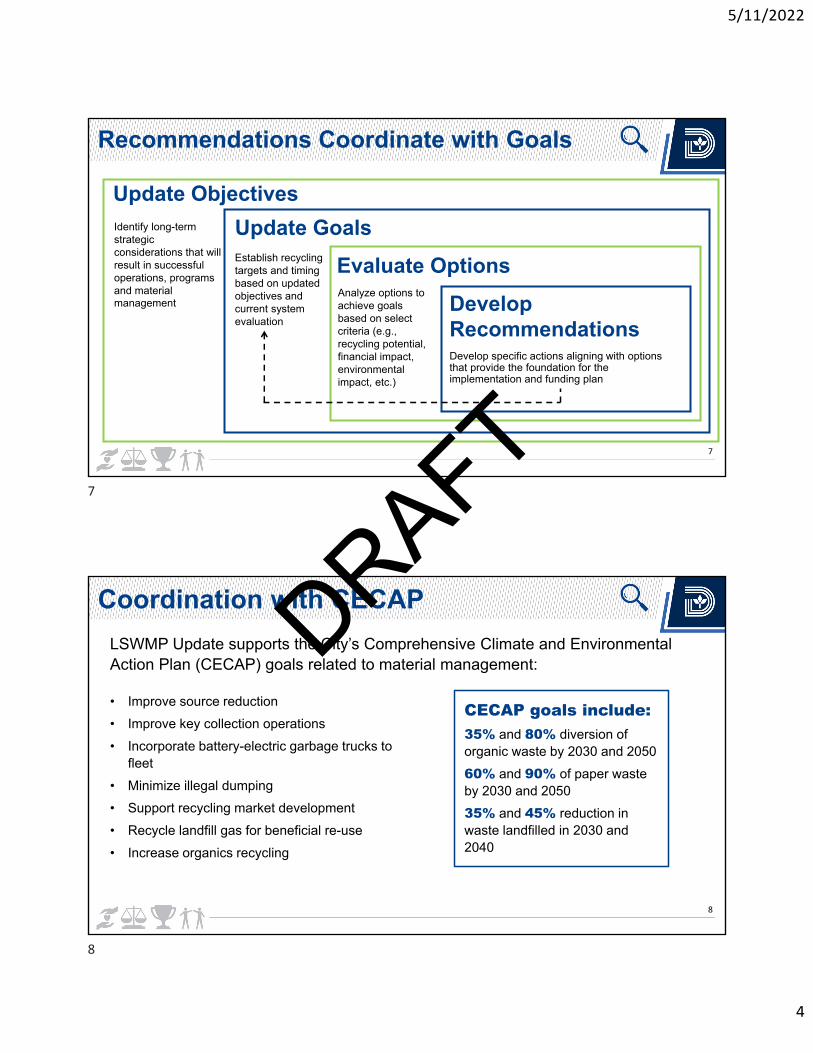
5/11/2022
4
Recommendations Coordinate with Goals
Update Goals
Evaluate Options
Develop RecommendationsDevelop specific actions aligning with options that provide the foundation for the implementation and funding plan
Update Objectives
Analyze options to achieve goals based on select criteria (e.g., recycling potential, financial impact, environmental impact, etc.)
Establish recycling targets and timing based on updated objectives and current system evaluation
Identify long-term strategic considerations that will result in successful operations, programs and material management
7
Coordination with CECAP
CECAP goals include:35% and 80% diversion of organic waste by 2030 and 2050
60% and 90% of paper waste by 2030 and 2050
35% and 45% reduction in waste landfilled in 2030 and 2040
LSWMP Update supports the City’s Comprehensive Climate and Environmental Action Plan (CECAP) goals related to material management:
8
• Improve source reduction
• Improve key collection operations
• Incorporate battery-electric garbage trucks to fleet
• Minimize illegal dumping
• Support recycling market development
• Recycle landfill gas for beneficial re-use
• Increase organics recycling
7
8
DRAFT
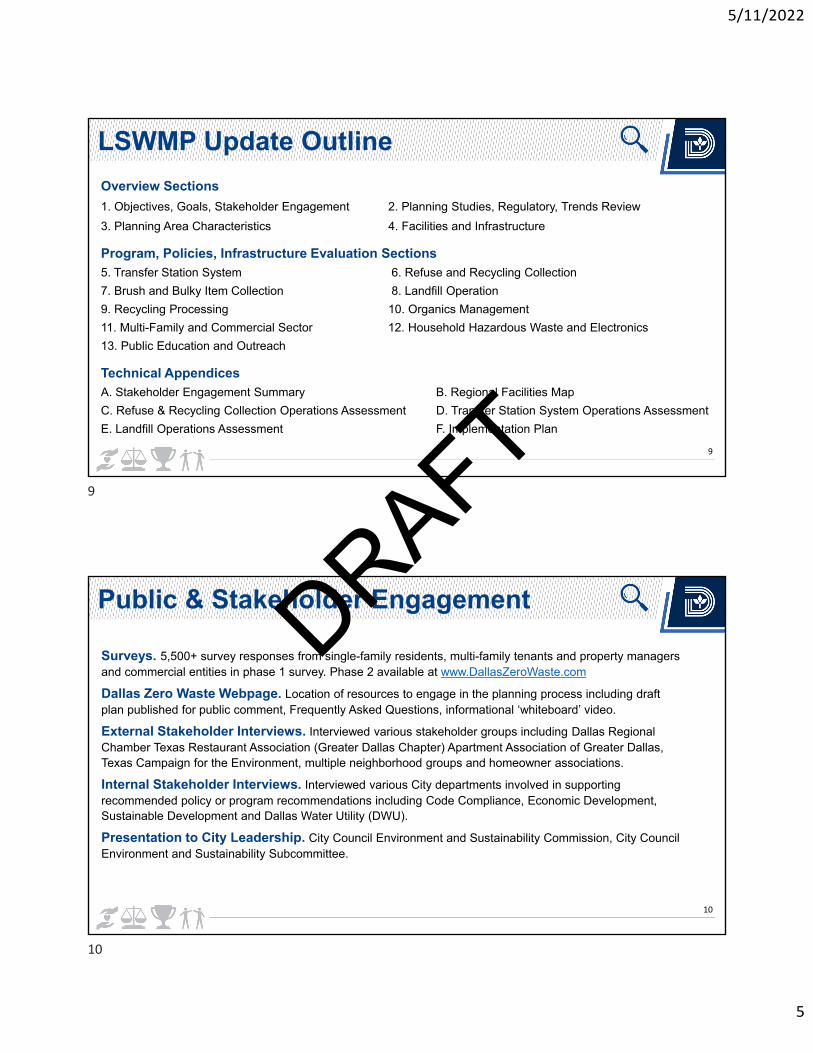
5/11/2022
5
LSWMP Update Outline
Overview Sections
1. Objectives, Goals, Stakeholder Engagement 2. Planning Studies, Regulatory, Trends Review
3. Planning Area Characteristics 4. Facilities and Infrastructure
Program, Policies, Infrastructure Evaluation Sections
5. Transfer Station System 6. Refuse and Recycling Collection
7. Brush and Bulky Item Collection 8. Landfill Operation
9. Recycling Processing 10. Organics Management
11. Multi-Family and Commercial Sector 12. Household Hazardous Waste and Electronics
13. Public Education and Outreach
Technical Appendices
A. Stakeholder Engagement Summary B. Regional Facilities Map
C. Refuse & Recycling Collection Operations Assessment D. Transfer Station System Operations Assessment
E. Landfill Operations Assessment F. Implementation Plan
9
Public & Stakeholder Engagement
Surveys. 5,500+ survey responses from single-family residents, multi-family tenants and property managers and commercial entities in phase 1 survey. Phase 2 available at www.DallasZeroWaste.com
Dallas Zero Waste Webpage. Location of resources to engage in the planning process including draft plan published for public comment, Frequently Asked Questions, informational ‘whiteboard’ video.
External Stakeholder Interviews. Interviewed various stakeholder groups including Dallas Regional Chamber Texas Restaurant Association (Greater Dallas Chapter) Apartment Association of Greater Dallas, Texas Campaign for the Environment, multiple neighborhood groups and homeowner associations.
Internal Stakeholder Interviews. Interviewed various City departments involved in supporting recommended policy or program recommendations including Code Compliance, Economic Development, Sustainable Development and Dallas Water Utility (DWU).
Presentation to City Leadership. City Council Environment and Sustainability Commission, City Council Environment and Sustainability Subcommittee.
10
9
10
DRAFT
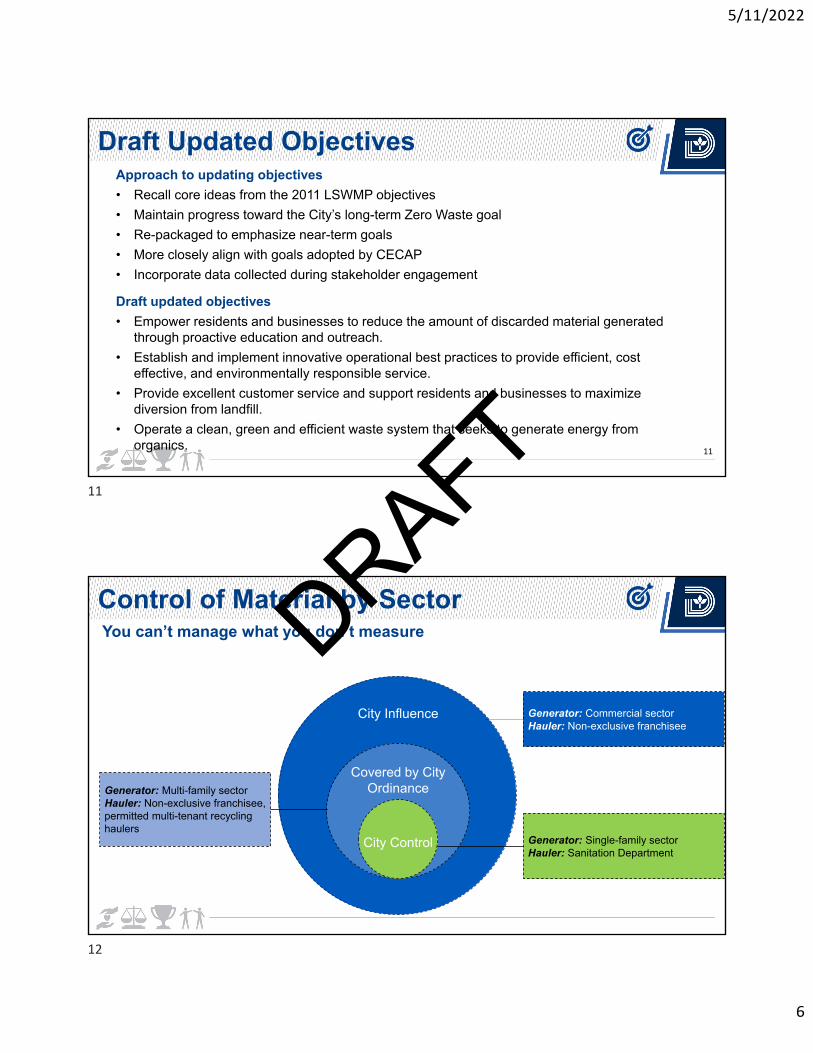
5/11/2022
6
Draft Updated Objectives
11
Draft updated objectives
• Empower residents and businesses to reduce the amount of discarded material generated through proactive education and outreach.
• Establish and implement innovative operational best practices to provide efficient, cost effective, and environmentally responsible service.
• Provide excellent customer service and support residents and businesses to maximize diversion from landfill.
• Operate a clean, green and efficient waste system that seeks to generate energy from organics.
Approach to updating objectives
• Recall core ideas from the 2011 LSWMP objectives
• Maintain progress toward the City’s long-term Zero Waste goal
• Re-packaged to emphasize near-term goals
• More closely align with goals adopted by CECAP
• Incorporate data collected during stakeholder engagement
1 2
City Influence
Control of Material by Sector
City Control
Covered by City Ordinance
Generator: Single-family sectorHauler: Sanitation Department
Generator: Commercial sectorHauler: Non-exclusive franchisee
Generator: Multi-family sectorHauler: Non-exclusive franchisee, permitted multi-tenant recycling haulers
You can’t manage what you don’t measure
11
12
DRAFT
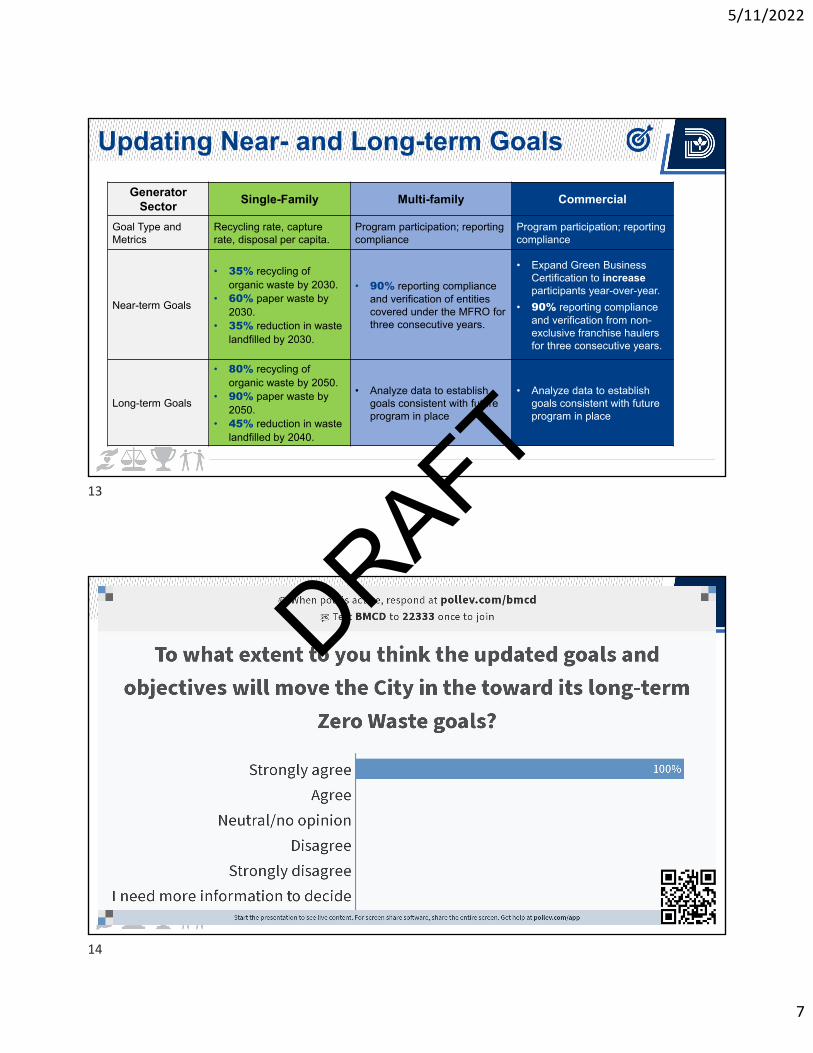
5/11/2022
7
1 3
Updating Near- and Long-term Goals
Generator Sector
Single-Family Multi-family Commercial
Goal Type and Metrics
Recycling rate, capture rate, disposal per capita.
Program participation; reporting compliance
Program participation; reporting compliance
Near-term Goals
• 35% recycling of organic waste by 2030.
• 60% paper waste by 2030.
• 35% reduction in waste landfilled by 2030.
• 90% reporting compliance and verification of entities covered under the MFRO for three consecutive years.
• Expand Green Business Certification to increase participants year-over-year.
• 90% reporting compliance and verification from non-exclusive franchise haulers for three consecutive years.
Long-term Goals
• 80% recycling of organic waste by 2050.
• 90% paper waste by 2050.
• 45% reduction in waste landfilled by 2040.
• Analyze data to establish goals consistent with future program in place
• Analyze data to establish goals consistent with future program in place
14
13
14
DRAFT
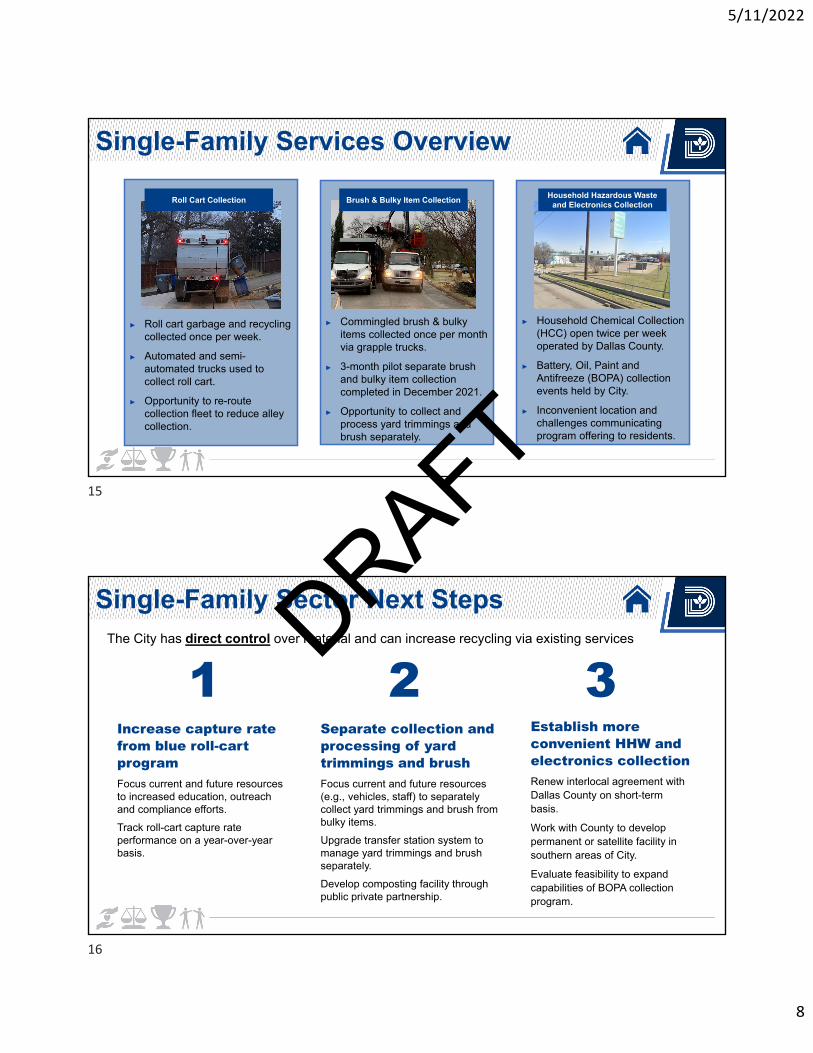
5/11/2022
8
1 5
Single-Family Services OverviewBrush & Bulky Item Collection
Mixed waste processing
Brush & Bulky Item CollectionHousehold Hazardous Waste
and Electronics Collection
► Roll cart garbage and recycling collected once per week.
► Automated and semi-automated trucks used to collect roll cart.
► Opportunity to re-route collection fleet to reduce alley collection.
► Commingled brush & bulky items collected once per month via grapple trucks.
► 3-month pilot separate brush and bulky item collection completed in December 2021.
► Opportunity to collect and process yard trimmings and brush separately.
► Household Chemical Collection (HCC) open twice per week operated by Dallas County.
► Battery, Oil, Paint and Antifreeze (BOPA) collection events held by City.
► Inconvenient location and challenges communicating program offering to residents.
Roll Cart Collection
1 6
Single-Family Sector Next Steps
Increase capture rate from blue roll-cart programFocus current and future resources to increased education, outreach and compliance efforts.
Track roll-cart capture rate performance on a year-over-year basis.
Separate collection and processing of yard trimmings and brushFocus current and future resources (e.g., vehicles, staff) to separately collect yard trimmings and brush from bulky items.
Upgrade transfer station system to manage yard trimmings and brush separately.
Develop composting facility through public private partnership.
Establish more convenient HHW and electronics collectionRenew interlocal agreement with Dallas County on short-term basis.
Work with County to develop permanent or satellite facility in southern areas of City.
Evaluate feasibility to expand capabilities of BOPA collection program.
1 2 3The City has direct control over material and can increase recycling via existing services
15
16
DRAFT
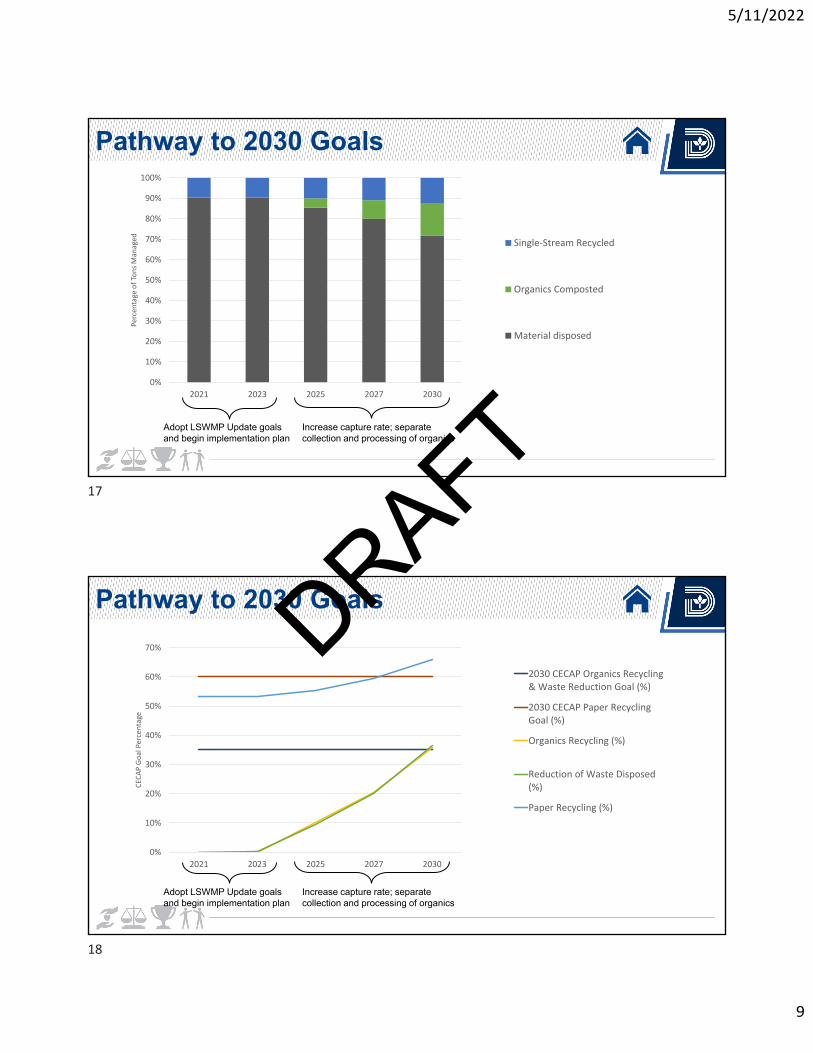
5/11/2022
9
1 7
Pathway to 2030 Goals
Adopt LSWMP Update goals and begin implementation plan
Increase capture rate; separate collection and processing of organics
0%
10%
20%
30%
40%
50%
60%
70%
80%
90%
100%
2021 2023 2025 2027 2030
Percentage of Tons Managed
Single‐Stream Recycled
Organics Composted
Material disposed
1 8
Pathway to 2030 Goals
Adopt LSWMP Update goals and begin implementation plan
Increase capture rate; separate collection and processing of organics
0%
10%
20%
30%
40%
50%
60%
70%
2021 2023 2025 2027 2030
CECAP Goal Percentage
2030 CECAP Organics Recycling& Waste Reduction Goal (%)
2030 CECAP Paper RecyclingGoal (%)
Organics Recycling (%)
Reduction of Waste Disposed(%)
Paper Recycling (%)
17
18
DRAFT
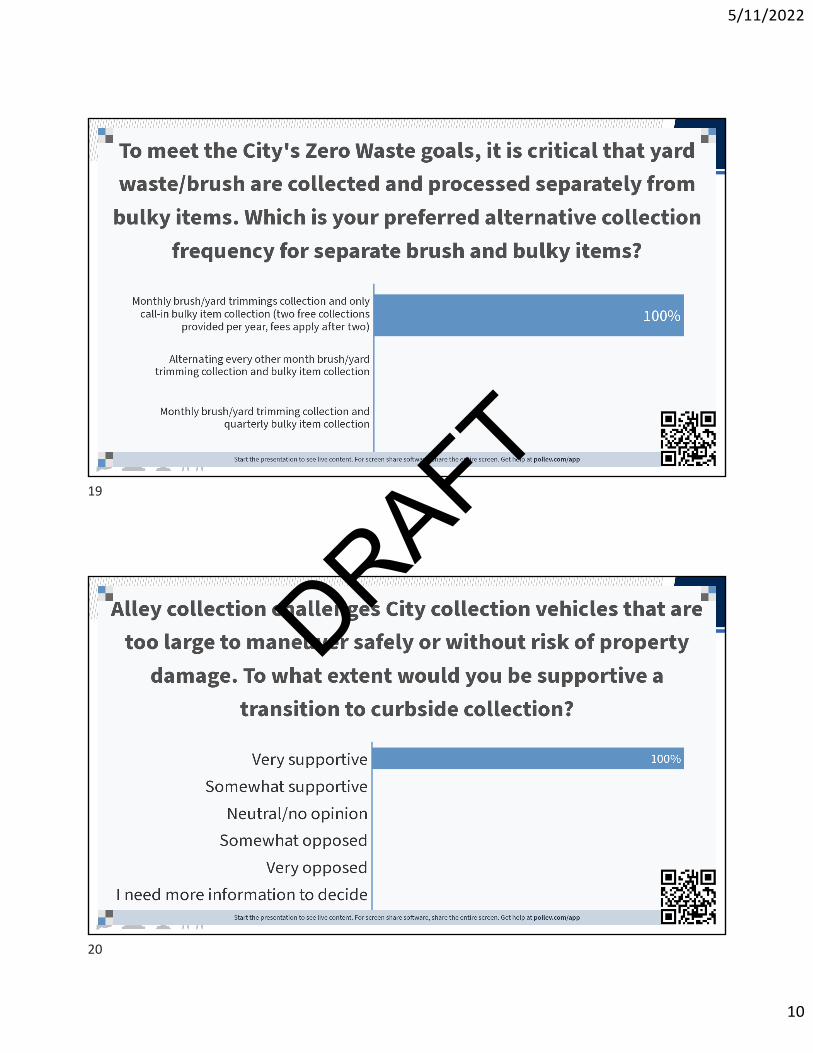
5/11/2022
10
19
20
19
20
DRAFT
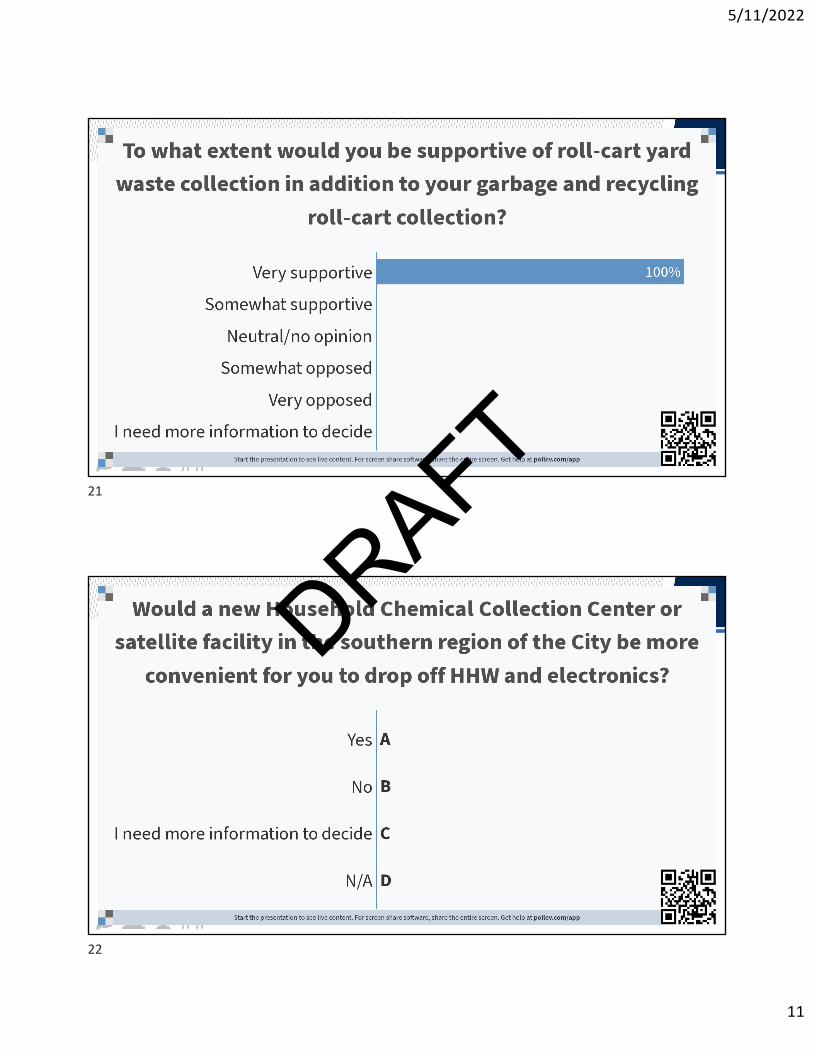
5/11/2022
11
21
22
21
22
DRAFT
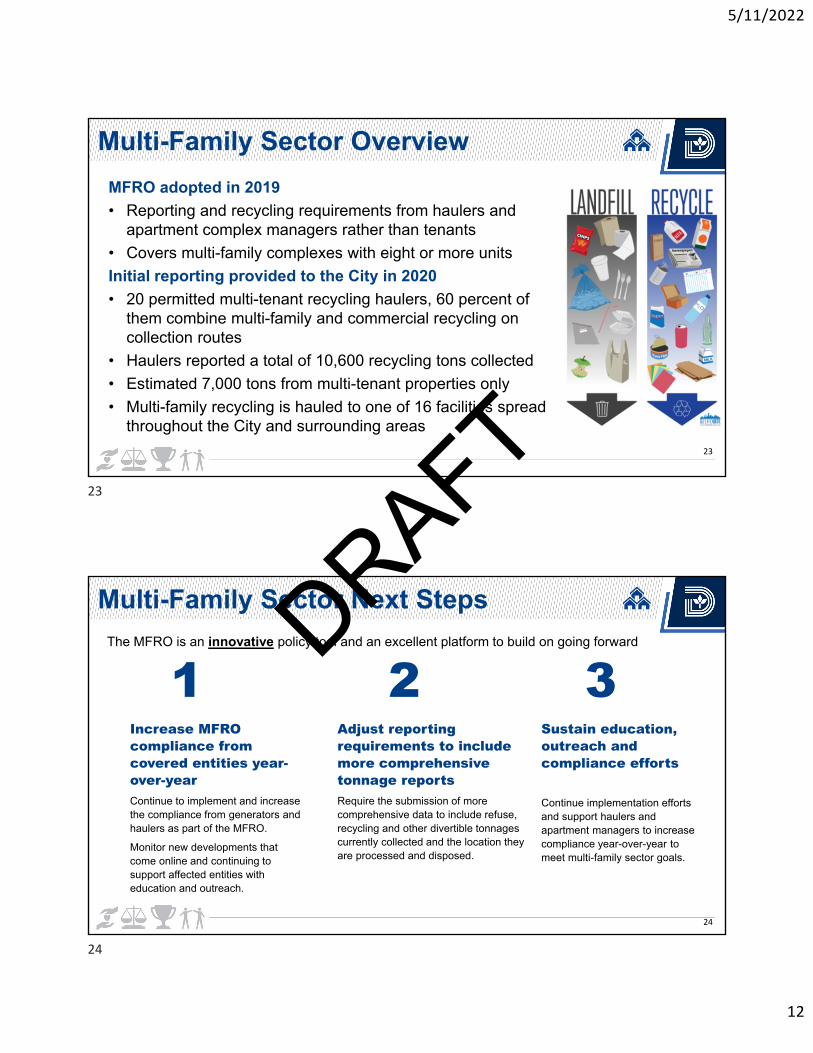
5/11/2022
12
Multi-Family Sector Overview
MFRO adopted in 2019
• Reporting and recycling requirements from haulers and apartment complex managers rather than tenants
• Covers multi-family complexes with eight or more units
Initial reporting provided to the City in 2020
• 20 permitted multi-tenant recycling haulers, 60 percent of them combine multi-family and commercial recycling on collection routes
• Haulers reported a total of 10,600 recycling tons collected
• Estimated 7,000 tons from multi-tenant properties only
• Multi-family recycling is hauled to one of 16 facilities spread throughout the City and surrounding areas
23
Multi-Family Sector Next Steps
24
Increase MFRO compliance from covered entities year-over-yearContinue to implement and increase the compliance from generators and haulers as part of the MFRO.
Monitor new developments that come online and continuing to support affected entities with education and outreach.
Adjust reporting requirements to include more comprehensive tonnage reportsRequire the submission of more comprehensive data to include refuse, recycling and other divertible tonnages currently collected and the location they are processed and disposed.
Sustain education, outreach and compliance efforts
Continue implementation efforts and support haulers and apartment managers to increase compliance year-over-year to meet multi-family sector goals.
1 2 3The MFRO is an innovative policy tool and an excellent platform to build on going forward
23
24
DRAFT
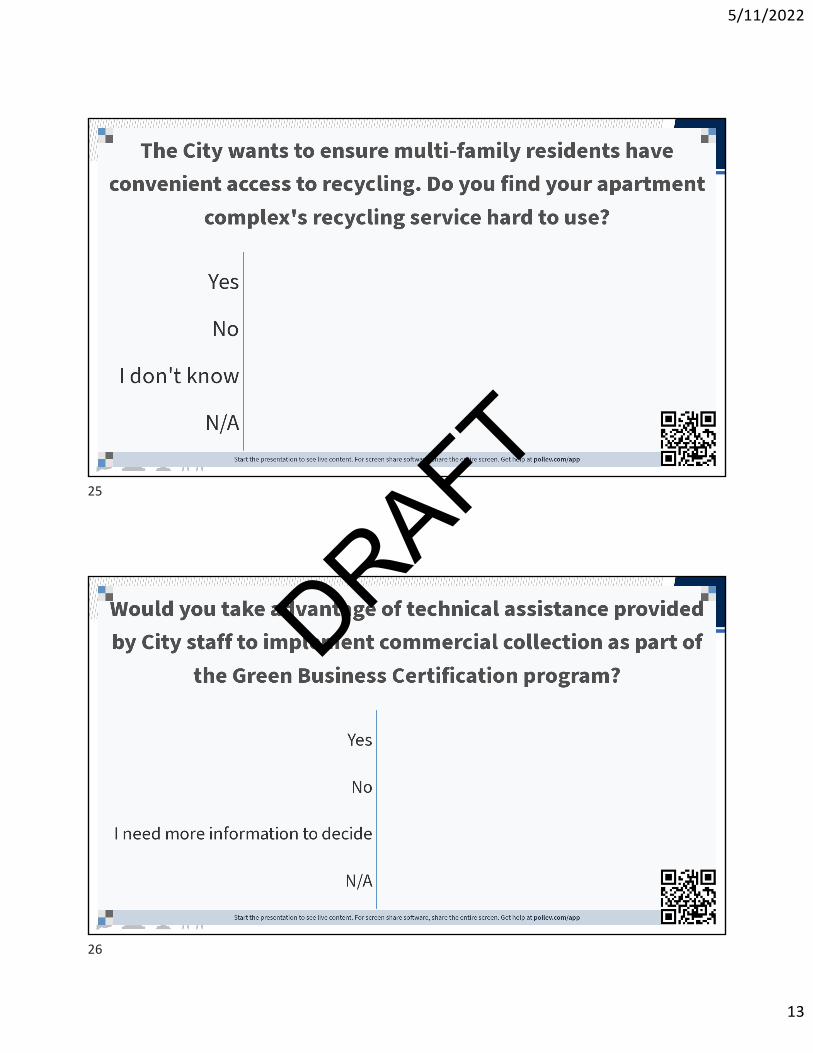
5/11/2022
13
25
26
25
26
DRAFT
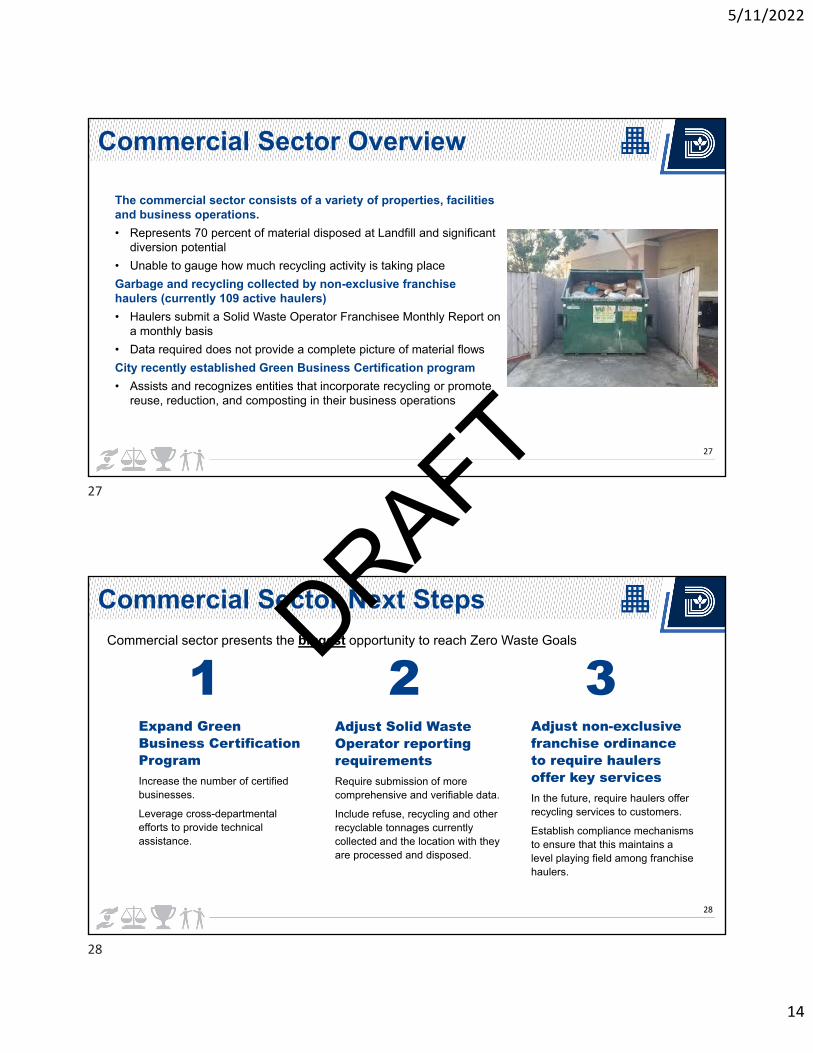
5/11/2022
14
Commercial Sector Overview
The commercial sector consists of a variety of properties, facilities and business operations.
• Represents 70 percent of material disposed at Landfill and significant diversion potential
• Unable to gauge how much recycling activity is taking place
Garbage and recycling collected by non-exclusive franchise haulers (currently 109 active haulers)
• Haulers submit a Solid Waste Operator Franchisee Monthly Report on a monthly basis
• Data required does not provide a complete picture of material flows
City recently established Green Business Certification program
• Assists and recognizes entities that incorporate recycling or promote reuse, reduction, and composting in their business operations
27
Commercial Sector Next Steps
28
Adjust Solid Waste Operator reporting requirements Require submission of more comprehensive and verifiable data.
Include refuse, recycling and other recyclable tonnages currently collected and the location with they are processed and disposed.
Adjust non-exclusive franchise ordinance to require haulers offer key servicesIn the future, require haulers offer recycling services to customers.
Establish compliance mechanisms to ensure that this maintains a level playing field among franchise haulers.
1 2 3Expand Green Business Certification ProgramIncrease the number of certified businesses.
Leverage cross-departmental efforts to provide technical assistance.
Commercial sector presents the biggest opportunity to reach Zero Waste Goals
27
28
DRAFT
5/11/2022
15
29
30
29
30
DRAFT
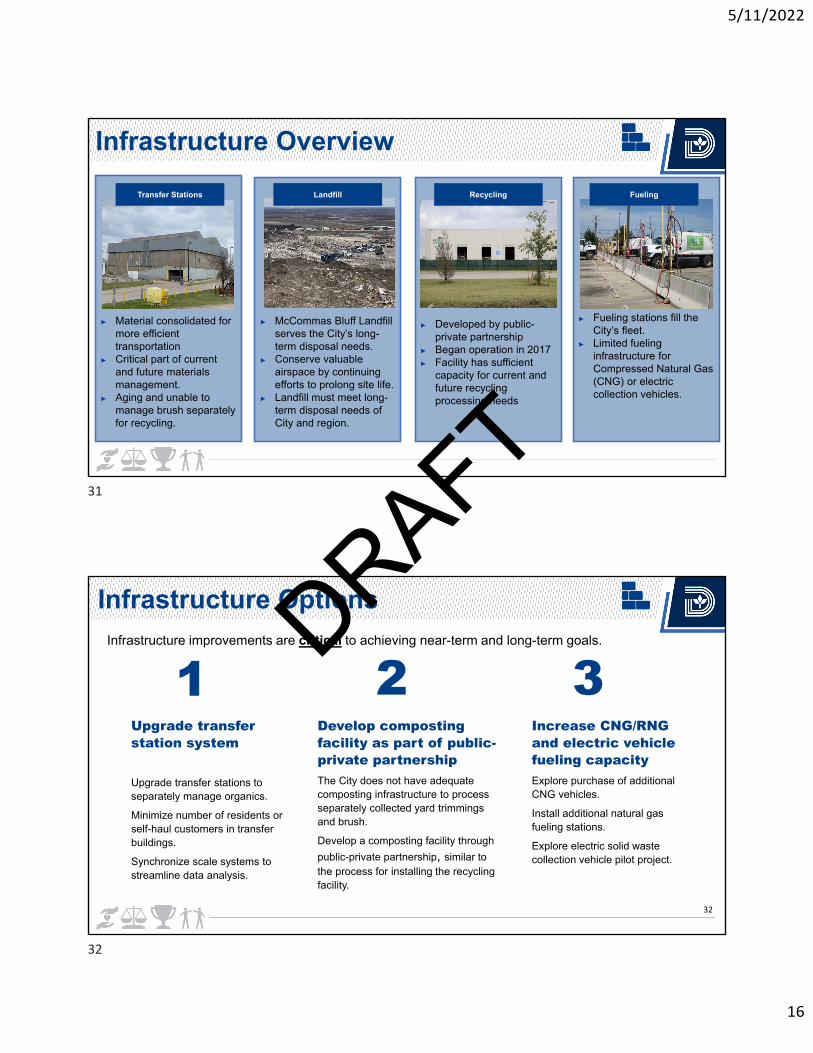
5/11/2022
16
3 1
Infrastructure OverviewBrush & Bulky Item Collection
Mixed waste processing
► Material consolidated for more efficient transportation
► Critical part of current and future materials management.
► Aging and unable to manage brush separately for recycling.
► McCommas Bluff Landfill serves the City’s long-term disposal needs.
► Conserve valuable airspace by continuing efforts to prolong site life.
► Landfill must meet long-term disposal needs of City and region.
► Developed by public-private partnership
► Began operation in 2017 ► Facility has sufficient
capacity for current and future recycling processing needs
Transfer Stations Landfill
► Fueling stations fill the City’s fleet.
► Limited fueling infrastructure for Compressed Natural Gas (CNG) or electric collection vehicles.
FuelingRecycling
Infrastructure OptionsInfrastructure improvements are critical to achieving near-term and long-term goals.
32
Develop composting facility as part of public-private partnershipThe City does not have adequate composting infrastructure to process separately collected yard trimmings and brush.
Develop a composting facility through
public-private partnership, similar to the process for installing the recycling facility.
Increase CNG/RNG and electric vehicle fueling capacityExplore purchase of additional CNG vehicles.
Install additional natural gas fueling stations.
Explore electric solid waste collection vehicle pilot project.
1 2 3Upgrade transfer station system
Upgrade transfer stations to separately manage organics.
Minimize number of residents or self-haul customers in transfer buildings.
Synchronize scale systems to streamline data analysis.
31
32
DRAFT
5/11/2022
17
33
34
33
34
DRAFT
5/11/2022
18
Next Steps
35
1. Evaluate results from public meeting, phase 2 survey and public comment period
2. Incorporate results of survey and public comments to draft LSWMP Update
3. Finalize implementation/funding plan
4. Present LSWMP Update to City Council for adoption in May (tentative)
5. Begin tasks based on implementation/funding plan
Jay CouncilDirector of Sanitation Services
Cliff GillespieAssistant Director of Sanitation Services
35
36
DRAFT
LSWMP Update Appendix B Regional Facility Maps
City of Dallas, Texas B-1 Burns & McDonnell
APPENDIX B REGIONAL FACILITY MAPS
(This page intentionally left blank)
DRAFT
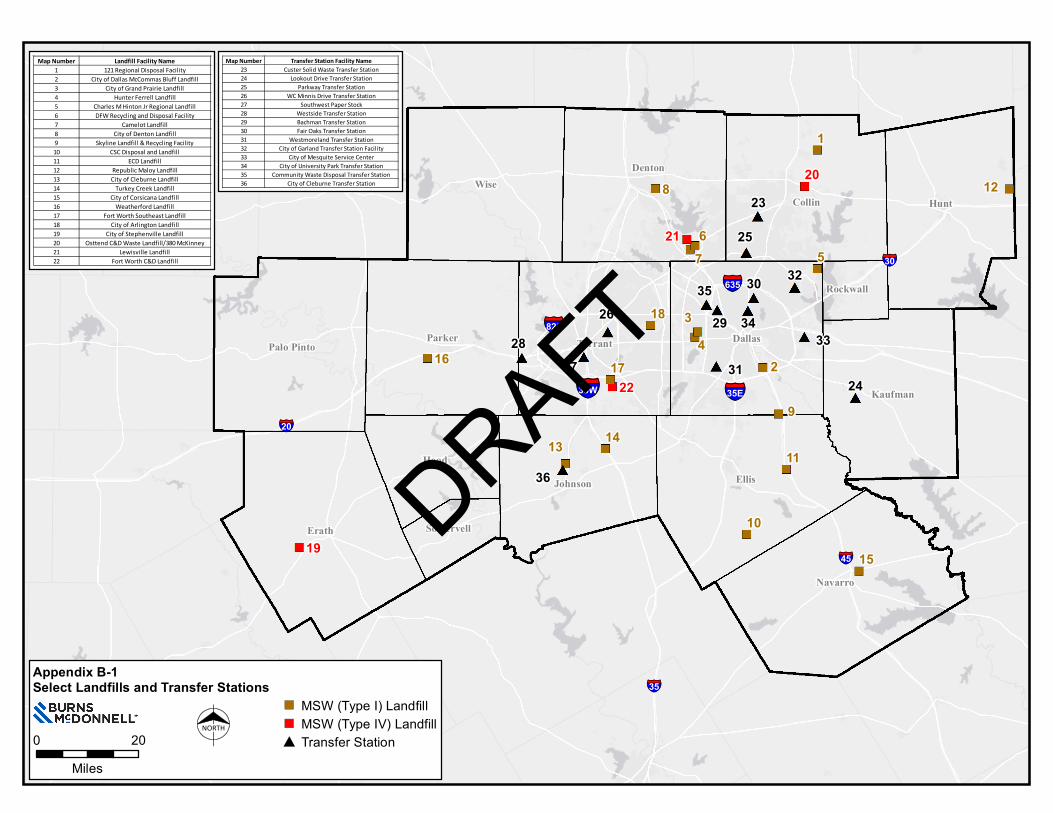
Wise
Palo Pinto Parker
Rockwall
Erath
HuntCollin
Dallas
Kaufman
EllisHood
Johnson
Navarro
Somervell
Denton
Tarrant
1
2
34
56
7
8
9
11
12
13
15
16
18
17
14
10
20
21
19
22
29
32
3331
34
23
27
26
36
35
24
30
25
28
§̈¦45
§̈¦35
§̈¦820
§̈¦30
§̈¦35W
§̈¦635
§̈¦20
§̈¦35E
Map Number Transfer Station Facility Name23 Custer Solid Waste Transfer Station24 Lookout Drive Transfer Station25 Parkway Transfer Station26 WC Minnis Drive Transfer Station27 Southwest Paper Stock28 Westside Transfer Station29 Bachman Transfer Station30 Fair Oaks Transfer Station31 Westmoreland Transfer Station32 City of Garland Transfer Station Facility33 City of Mesquite Service Center34 City of University Park Transfer Station35 Community Waste Disposal Transfer Station36 City of Cleburne Transfer Station
Map Number Landfill Facility Name1 121 Regional Disposal Facility2 City of Dallas McCommas Bluff Landfill3 City of Grand Prairie Landfill4 Hunter Ferrell Landfill5 Charles M Hinton Jr Regional Landfill6 DFW Recycling and Disposal Facility7 Camelot Landfill8 City of Denton Landfill9 Skyline Landfill & Recycling Facility10 CSC Disposal and Landfill11 ECD Landfill12 Republic Maloy Landfill13 City of Cleburne Landfill14 Turkey Creek Landfill15 City of Corsicana Landfill16 Weatherford Landfill17 Fort Worth Southeast Landfill18 City of Arlington Landfill19 City of Stephenville Landfill20 Osttend C&D Waste Landfill/380 McKinney21 Lewisville Landfill22 Fort Worth C&D Landfill
NORTH0 20
Miles
Appendix B-1Select Landfills and Transfer Stations
") MSW (Type I) Landfill") MSW (Type IV) Landfill# Transfer Station
DRAFT
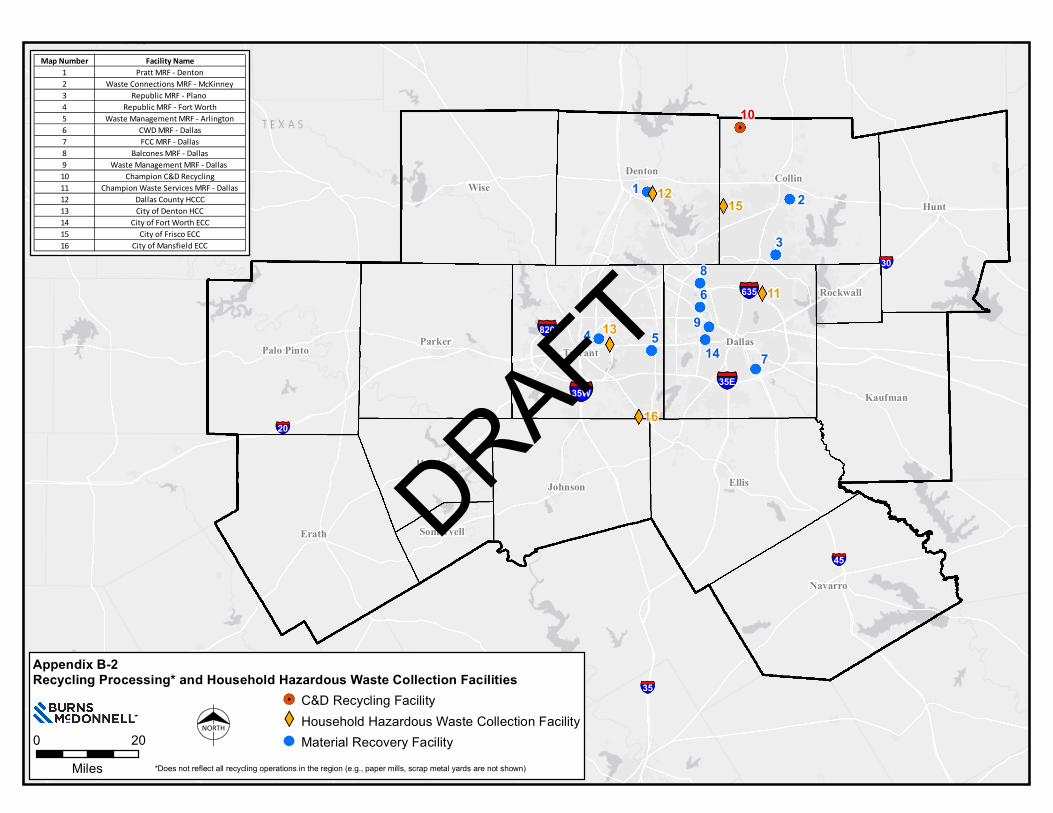
Wise
Palo Pinto Parker
Rockwall
Erath
Hunt
Collin
Dallas
Kaufman
EllisHood
Johnson
Navarro
Somervell
Denton
Tarrant 14
6
3
4
2
5
1
7
8
913
12
11
15
16
10
§̈¦45
§̈¦35
§̈¦820
§̈¦30
§̈¦35W
§̈¦635
§̈¦20
§̈¦35E
NORTH0 20
Miles
Appendix B-2Recycling Processing* and Household Hazardous Waste Collection Facilities
!. C&D Recycling Facility
XW Household Hazardous Waste Collection FacilityMaterial Recovery Facility
*Does not reflect all recycling operations in the region (e.g., paper mills, scrap metal yards are not shown)
Map Number Facility Name1 Pratt MRF - Denton2 Waste Connections MRF - McKinney3 Republic MRF - Plano 4 Republic MRF - Fort Worth5 Waste Management MRF - Arlington6 CWD MRF - Dallas7 FCC MRF - Dallas8 Balcones MRF - Dallas9 Waste Management MRF - Dallas 10 Champion C&D Recycling11 Champion Waste Services MRF - Dallas12 Dallas County HCCC13 City of Denton HCC14 City of Fort Worth ECC15 City of Frisco ECC16 City of Mansfield ECC
DRAFT
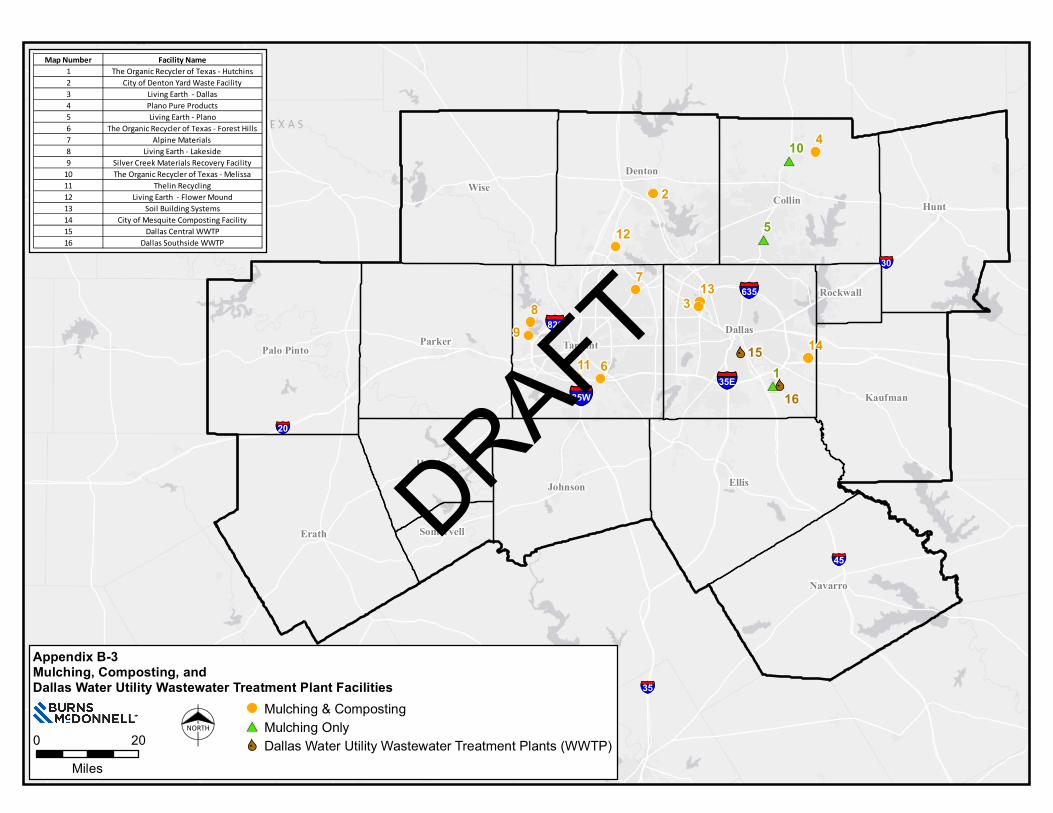
#*
#*
po
po
#*
Wise
Palo Pinto Parker
Rockwall
Erath
HuntCollin
Dallas
Kaufman
EllisHood
Johnson
Navarro
Somervell
Denton
Tarrant 15
161
10
5
9
7
4
813
12
2
3
11 614
§̈¦45
§̈¦35
§̈¦820
§̈¦30
§̈¦35W
§̈¦635
§̈¦20
§̈¦35E
NORTH0 20
Miles
Appendix B-3Mulching, Composting, and Dallas Water Utility Wastewater Treatment Plant Facilities
Mulching & Composting#* Mulching Onlypo Dallas Water Utility Wastewater Treatment Plants (WWTP)
Map Number Facility Name1 The Organic Recycler of Texas - Hutchins2 City of Denton Yard Waste Facility3 Living Earth - Dallas4 Plano Pure Products5 Living Earth - Plano6 The Organic Recycler of Texas - Forest Hills7 Alpine Materials 8 Living Earth - Lakeside9 Silver Creek Materials Recovery Facility
10 The Organic Recycler of Texas - Melissa11 Thelin Recycling12 Living Earth - Flower Mound13 Soil Building Systems14 City of Mesquite Composting Facility15 Dallas Central WWTP16 Dallas Southside WWTP
DRAFT
LSWMP Update Appendix C - Transfer Station System Review
City of Dallas, Texas C-1 Burns & McDonnell
APPENDIX C - TRANSFER STATION SYSTEM REVIEW
This technical appendix describes the evaluation methodology, overviews the transfer station system, and
identifies system challenges. Further evaluation and presentation of options related to the transfer station
system is provided in Section 5.0.
Methodology
As part of the LSWMP Update, Burns & McDonnell observed the transfer station system over the course
of three calendar days on February 8, 9 and 10, 2021 (Transfer Station Site Visit). Burns & McDonnell
conducted on-site observations of operations at Bachman Transfer Station (Bachman), Fair Oaks Transfer
Station (Fair Oaks), Westmoreland Transfer Station (Westmoreland), and the Landfill (to the extent that it
impacts transfer station system operations). Operational activities reviewed included, but were not limited
to:
• Facility configuration
• Process flow
• Equipment types and maintenance
• Staffing levels
• Transfer operations
Additionally, discussions were held with various members of management and staff to discuss ongoing
operations and collect data which is incorporated in this section. Based on the Transfer Station Site Visit
and data analysis, the following provides an overview of the transfer station system and describes current
challenges to inform the development of options for the City’s consideration.
System Overview
The transfer station system consists of the City’s three transfer station facilities that collectively shorten
haul times for the Sanitation Department’s collection system. All material accepted at the transfer stations
are hauled to the Landfill for disposal and to the MRF for recycling and are operated via City-owned
equipment and City personnel.
The transfer stations are geographically located in the northeast, northwest and southwest areas of the City
so the system allows for more efficient transfer and disposal of material. The transfer station system is
designed where Bachman is the largest facility and is supported by the smaller Fair Oaks and Westmoreland
facilities. Each facility has at least two names (e.g., the Northwest Transfer Station is also called the Fair
Oaks Transfer Station). For the purposes of this analysis the facilities in the transfer station system are
DRAFT
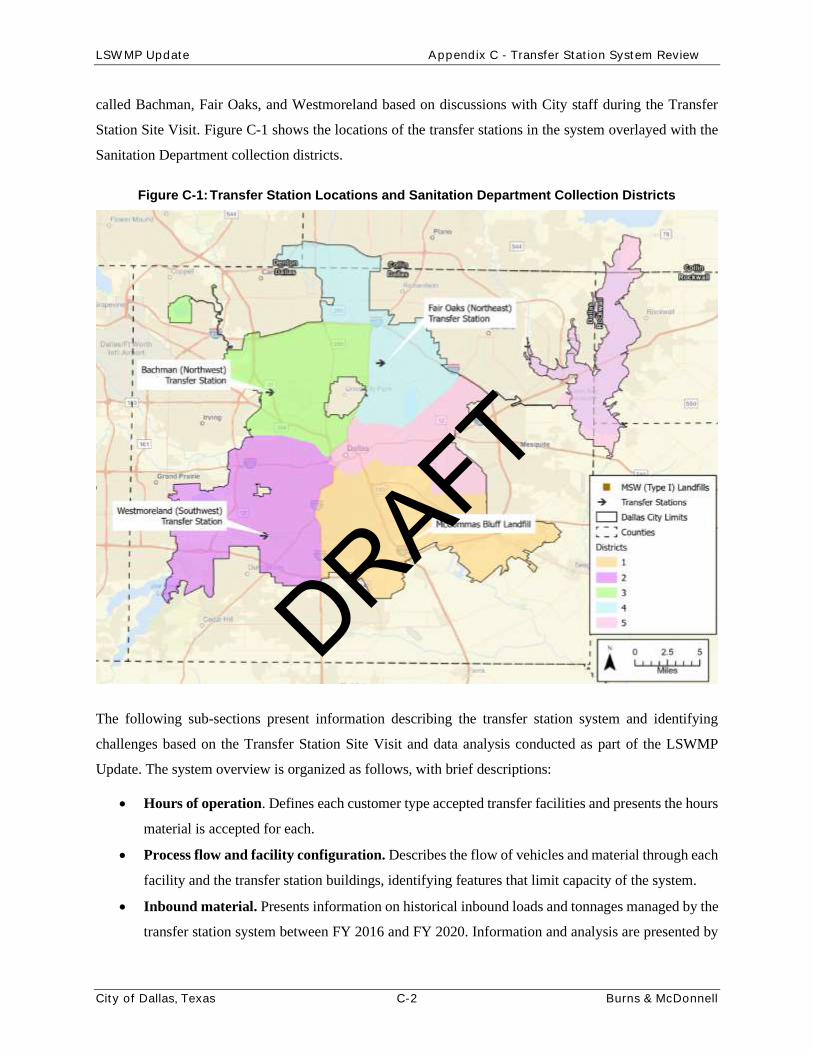
LSWMP Update Appendix C - Transfer Station System Review
City of Dallas, Texas C-2 Burns & McDonnell
called Bachman, Fair Oaks, and Westmoreland based on discussions with City staff during the Transfer
Station Site Visit. Figure C-1 shows the locations of the transfer stations in the system overlayed with the
Sanitation Department collection districts.
Figure C-1: Transfer Station Locations and Sanitation Department Collection Districts
The following sub-sections present information describing the transfer station system and identifying
challenges based on the Transfer Station Site Visit and data analysis conducted as part of the LSWMP
Update. The system overview is organized as follows, with brief descriptions:
• Hours of operation. Defines each customer type accepted transfer facilities and presents the hours
material is accepted for each.
• Process flow and facility configuration. Describes the flow of vehicles and material through each
facility and the transfer station buildings, identifying features that limit capacity of the system.
• Inbound material. Presents information on historical inbound loads and tonnages managed by the
transfer station system between FY 2016 and FY 2020. Information and analysis are presented by
DRAFT
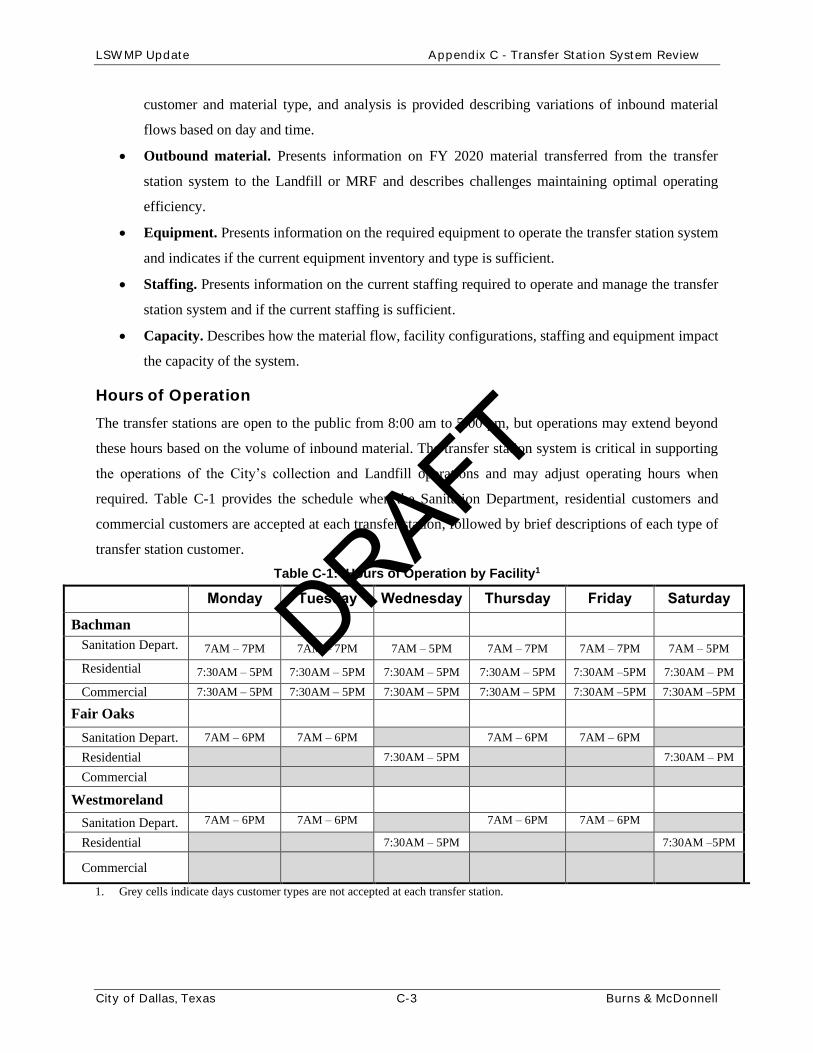
LSWMP Update Appendix C - Transfer Station System Review
City of Dallas, Texas C-3 Burns & McDonnell
customer and material type, and analysis is provided describing variations of inbound material
flows based on day and time.
• Outbound material. Presents information on FY 2020 material transferred from the transfer
station system to the Landfill or MRF and describes challenges maintaining optimal operating
efficiency.
• Equipment. Presents information on the required equipment to operate the transfer station system
and indicates if the current equipment inventory and type is sufficient.
• Staffing. Presents information on the current staffing required to operate and manage the transfer
station system and if the current staffing is sufficient.
• Capacity. Describes how the material flow, facility configurations, staffing and equipment impact
the capacity of the system.
Hours of Operation
The transfer stations are open to the public from 8:00 am to 5:00 pm, but operations may extend beyond
these hours based on the volume of inbound material. The transfer station system is critical in supporting
the operations of the City’s collection and Landfill operations and may adjust operating hours when
required. Table C-1 provides the schedule when the Sanitation Department, residential customers and
commercial customers are accepted at each transfer station, followed by brief descriptions of each type of
transfer station customer.
Table C-1: Hours of Operation by Facility1
Monday Tuesday Wednesday Thursday Friday Saturday
Bachman
Sanitation Depart. 7AM – 7PM 7AM – 7PM 7AM – 5PM 7AM – 7PM 7AM – 7PM 7AM – 5PM
Residential 7:30AM – 5PM 7:30AM – 5PM 7:30AM – 5PM 7:30AM – 5PM 7:30AM –5PM 7:30AM – PM
Commercial 7:30AM – 5PM 7:30AM – 5PM 7:30AM – 5PM 7:30AM – 5PM 7:30AM –5PM 7:30AM –5PM
Fair Oaks
Sanitation Depart. 7AM – 6PM 7AM – 6PM 7AM – 6PM 7AM – 6PM
Residential 7:30AM – 5PM 7:30AM – PM
Commercial
Westmoreland
Sanitation Depart. 7AM – 6PM 7AM – 6PM 7AM – 6PM 7AM – 6PM
Residential 7:30AM – 5PM 7:30AM –5PM
Commercial
1. Grey cells indicate days customer types are not accepted at each transfer station.
DRAFT
LSWMP Update Appendix C - Transfer Station System Review
City of Dallas, Texas C-4 Burns & McDonnell
• Sanitation Department. City-operated waste collection vehicles, which have tared weights,
including automated side-load or rear load compactor trucks that deliver larger loads collected from
the City’s residential customers and from City department locations.
• Residential customers. City of Dallas residents that can drop off materials using light-duty
vehicles such as pickup trucks or small trailers that deliver small loads that are self-hauled six days
per week at Bachman and on Wednesday and Saturdays at Fair Oaks and Westmoreland.
• Commercial customers. Cash and account customers that use residential or light-duty vehicles
such as pickup trucks or small trailers that deliver small loads that are self-hauled including roofing,
scrap metal or other C&D material. Commercial customers with roll-off or compacting vehicles
are accepted at Bachman. City-operated light-duty or pickup vehicles providing material generated
from various City department operations (e.g., parks and recreation) are included with commercial
customers.
Bachman accepts all three customer types six days per week, providing two extra hours per day for
Sanitation Department customers that complete collection routes after 5:00 pm. The Fair Oaks and
Westmoreland facilities accept only Sanitation Department collection vehicles Monday, Tuesday, Thursday
and Friday and hold dedicated residential customer collection days on Wednesday and Saturday.
Based on discussion with City staff, there are times when the transfer station system becomes inundated
with material (e.g., following a storm event). In these cases, the facilities do not remain open to the public
and operating hours may be extended from 7:00 am to 8:00 pm to accommodate the increased volumes. In
addition, Bachman may operate on Sunday from 7:00 am to 12:00 pm on an as needed basis.
Process Flow and Facility Configurations
During the Transfer Station Site Visit the flow of traffic and waste both into and out of each of the transfer
stations were observed and current facility configurations evaluated. The process flow and facility
configurations determine the throughput capacity of each transfer station and ultimately dictates the
efficiency of the transfer station system as a whole. The facility configuration for each transfer station is
critical to the effectiveness of the system, as the location and size of the built features have implications on
the throughput capacity of customers and tonnages. All the transfer station facilities in the system were
designed with some or all of the following components, with brief descriptions:
• Scale/Scalehouse. Designated location where customers enter each facility.
• Customer entrance/exit. Designated locations where customers enter and exit each transfer
building.
DRAFT
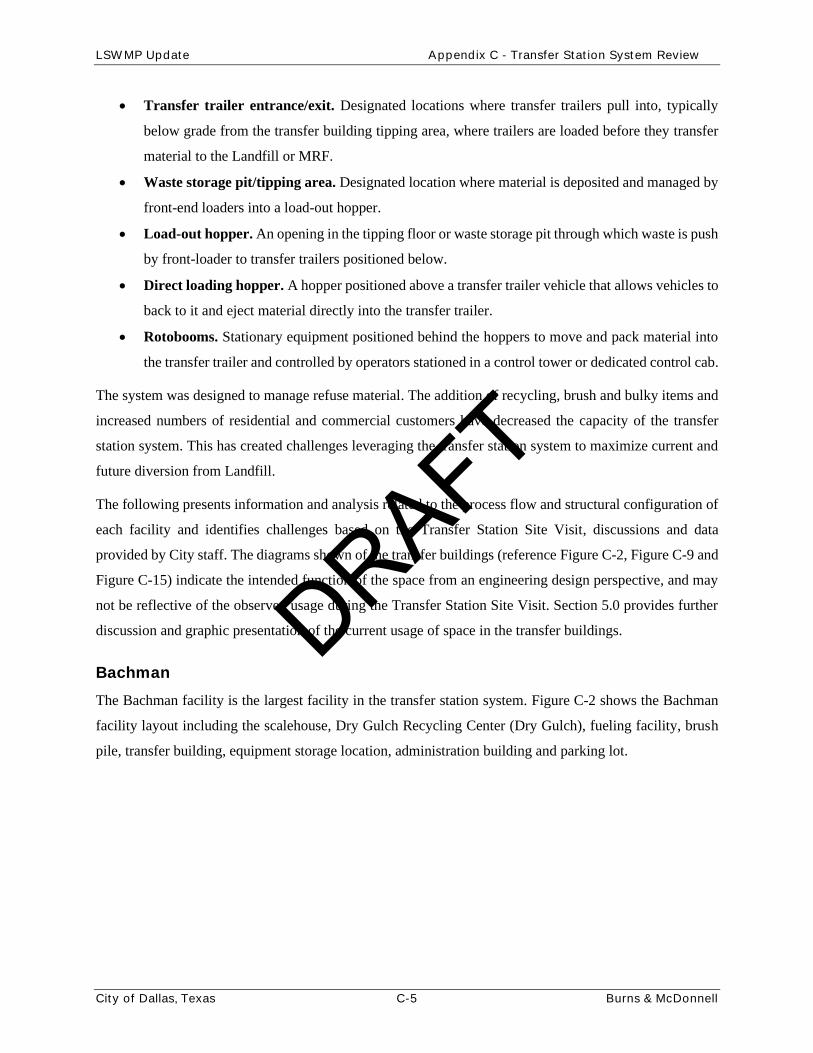
LSWMP Update Appendix C - Transfer Station System Review
City of Dallas, Texas C-5 Burns & McDonnell
• Transfer trailer entrance/exit. Designated locations where transfer trailers pull into, typically
below grade from the transfer building tipping area, where trailers are loaded before they transfer
material to the Landfill or MRF.
• Waste storage pit/tipping area. Designated location where material is deposited and managed by
front-end loaders into a load-out hopper.
• Load-out hopper. An opening in the tipping floor or waste storage pit through which waste is push
by front-loader to transfer trailers positioned below.
• Direct loading hopper. A hopper positioned above a transfer trailer vehicle that allows vehicles to
back to it and eject material directly into the transfer trailer.
• Rotobooms. Stationary equipment positioned behind the hoppers to move and pack material into
the transfer trailer and controlled by operators stationed in a control tower or dedicated control cab.
The system was designed to manage refuse material. The addition of recycling, brush and bulky items and
increased numbers of residential and commercial customers have decreased the capacity of the transfer
station system. This has created challenges leveraging the transfer station system to maximize current and
future diversion from Landfill.
The following presents information and analysis related to the process flow and structural configuration of
each facility and identifies challenges based on the Transfer Station Site Visit, discussions and data
provided by City staff. The diagrams shown of the transfer buildings (reference Figure C-2, Figure C-9 and
Figure C-15) indicate the intended function of the space from an engineering design perspective, and may
not be reflective of the observed usage during the Transfer Station Site Visit. Section 5.0 provides further
discussion and graphic presentation of the current usage of space in the transfer buildings.
Bachman
The Bachman facility is the largest facility in the transfer station system. Figure C-2 shows the Bachman
facility layout including the scalehouse, Dry Gulch Recycling Center (Dry Gulch), fueling facility, brush
pile, transfer building, equipment storage location, administration building and parking lot.
DRAFT
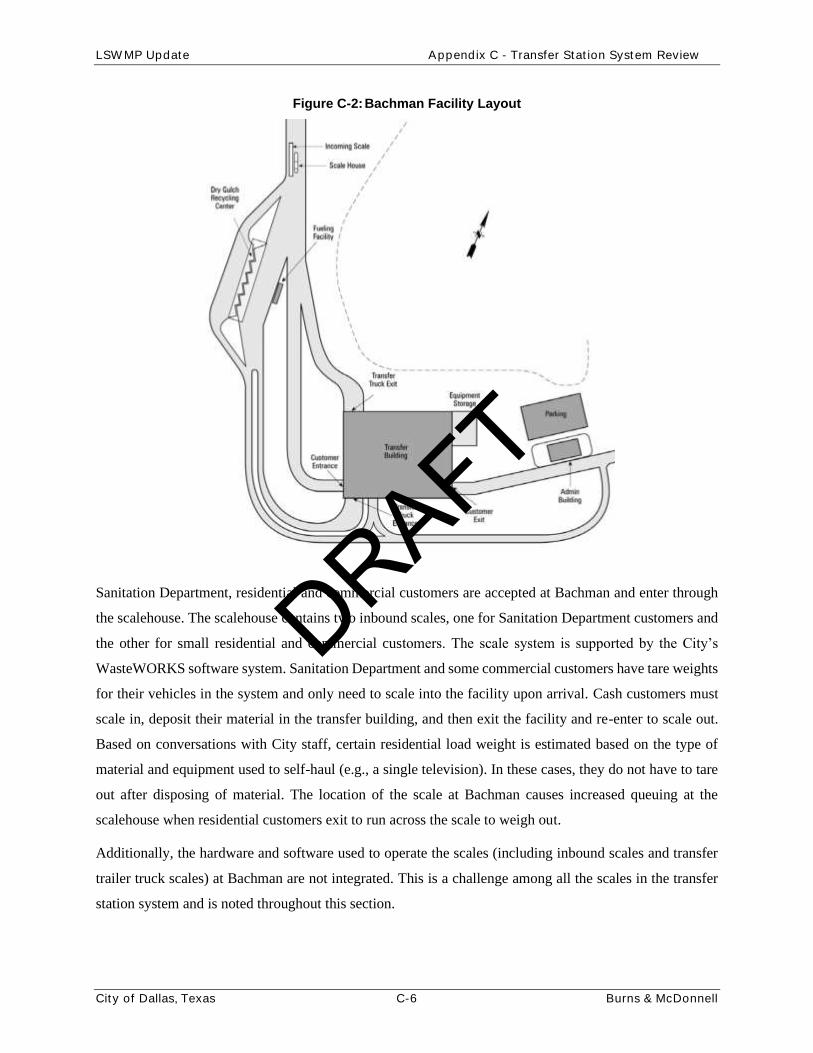
LSWMP Update Appendix C - Transfer Station System Review
City of Dallas, Texas C-6 Burns & McDonnell
Figure C-2: Bachman Facility Layout
Sanitation Department, residential and commercial customers are accepted at Bachman and enter through
the scalehouse. The scalehouse contains two inbound scales, one for Sanitation Department customers and
the other for small residential and commercial customers. The scale system is supported by the City’s
WasteWORKS software system. Sanitation Department and some commercial customers have tare weights
for their vehicles in the system and only need to scale into the facility upon arrival. Cash customers must
scale in, deposit their material in the transfer building, and then exit the facility and re-enter to scale out.
Based on conversations with City staff, certain residential load weight is estimated based on the type of
material and equipment used to self-haul (e.g., a single television). In these cases, they do not have to tare
out after disposing of material. The location of the scale at Bachman causes increased queuing at the
scalehouse when residential customers exit to run across the scale to weigh out.
Additionally, the hardware and software used to operate the scales (including inbound scales and transfer
trailer truck scales) at Bachman are not integrated. This is a challenge among all the scales in the transfer
station system and is noted throughout this section.
DRAFT
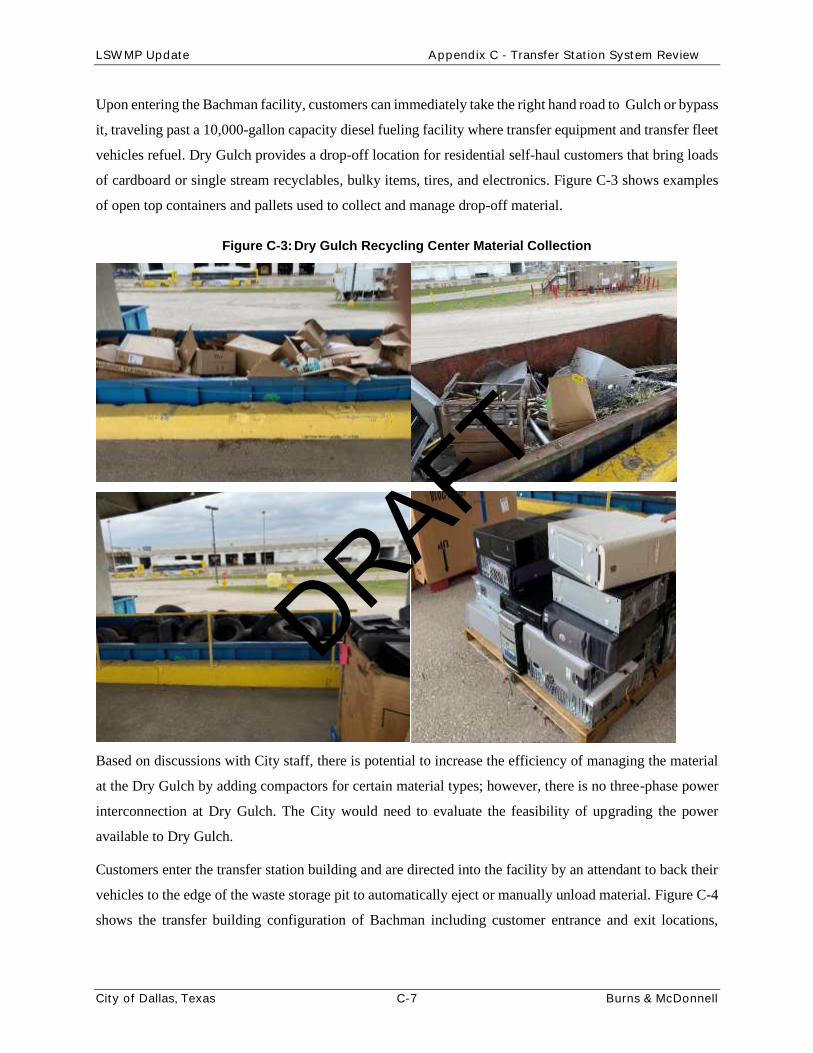
LSWMP Update Appendix C - Transfer Station System Review
City of Dallas, Texas C-7 Burns & McDonnell
Upon entering the Bachman facility, customers can immediately take the right hand road to Gulch or bypass
it, traveling past a 10,000-gallon capacity diesel fueling facility where transfer equipment and transfer fleet
vehicles refuel. Dry Gulch provides a drop-off location for residential self-haul customers that bring loads
of cardboard or single stream recyclables, bulky items, tires, and electronics. Figure C-3 shows examples
of open top containers and pallets used to collect and manage drop-off material.
Figure C-3: Dry Gulch Recycling Center Material Collection
Based on discussions with City staff, there is potential to increase the efficiency of managing the material
at the Dry Gulch by adding compactors for certain material types; however, there is no three-phase power
interconnection at Dry Gulch. The City would need to evaluate the feasibility of upgrading the power
available to Dry Gulch.
Customers enter the transfer station building and are directed into the facility by an attendant to back their
vehicles to the edge of the waste storage pit to automatically eject or manually unload material. Figure C-4
shows the transfer building configuration of Bachman including customer entrance and exit locations,
DRAFT
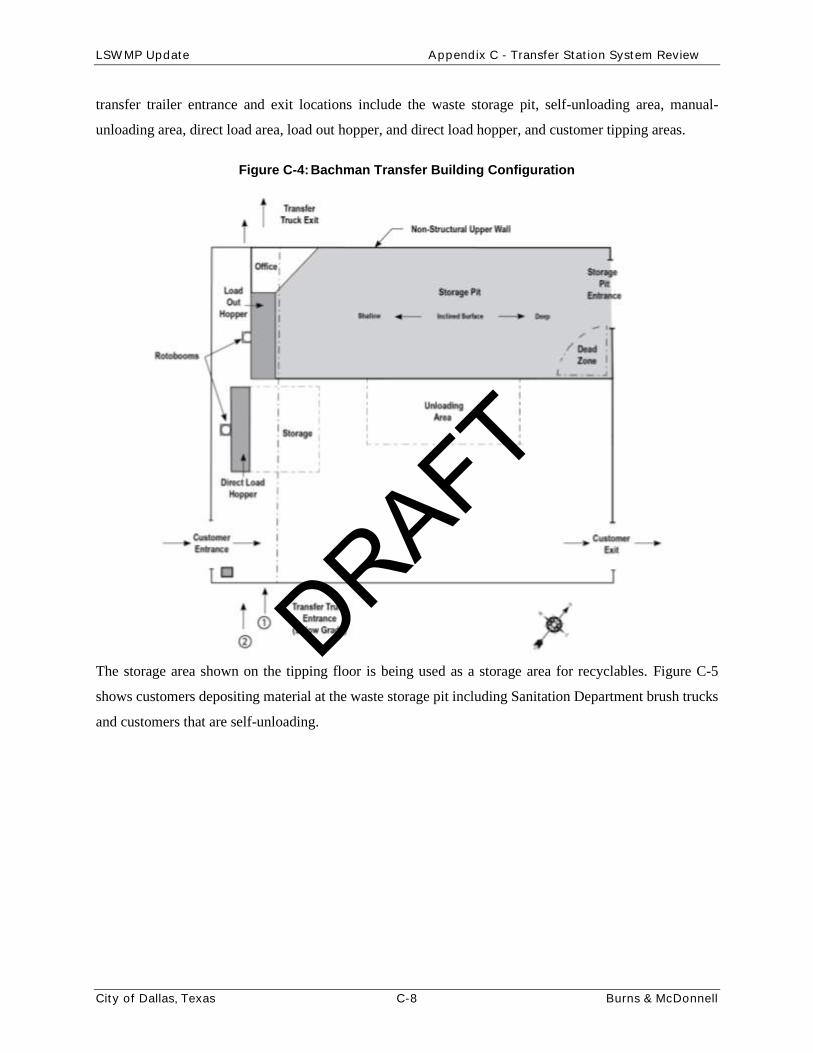
LSWMP Update Appendix C - Transfer Station System Review
City of Dallas, Texas C-8 Burns & McDonnell
transfer trailer entrance and exit locations include the waste storage pit, self-unloading area, manual-
unloading area, direct load area, load out hopper, and direct load hopper, and customer tipping areas.
Figure C-4: Bachman Transfer Building Configuration
The storage area shown on the tipping floor is being used as a storage area for recyclables. Figure C-5
shows customers depositing material at the waste storage pit including Sanitation Department brush trucks
and customers that are self-unloading.
DRAFT
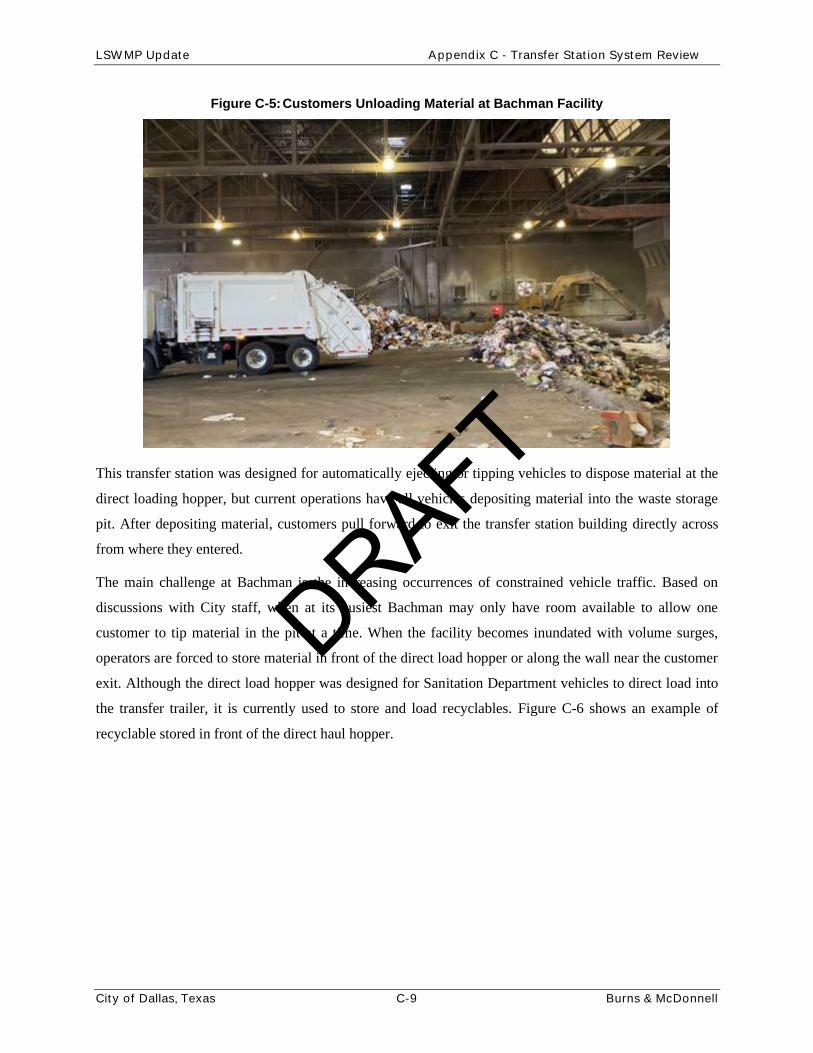
LSWMP Update Appendix C - Transfer Station System Review
City of Dallas, Texas C-9 Burns & McDonnell
Figure C-5: Customers Unloading Material at Bachman Facility
This transfer station was designed for automatically ejecting or tipping vehicles to dispose material at the
direct loading hopper, but current operations have all vehicles depositing material into the waste storage
pit. After depositing material, customers pull forward to exit the transfer station building directly across
from where they entered.
The main challenge at Bachman is the increasing occurrences of constrained vehicle traffic. Based on
discussions with City staff, when at its busiest Bachman may only have room available to allow one
customer to tip material in the pit at a time. When the facility becomes inundated with volume surges,
operators are forced to store material in front of the direct load hopper or along the wall near the customer
exit. Although the direct load hopper was designed for Sanitation Department vehicles to direct load into
the transfer trailer, it is currently used to store and load recyclables. Figure C-6 shows an example of
recyclable stored in front of the direct haul hopper.
DRAFT
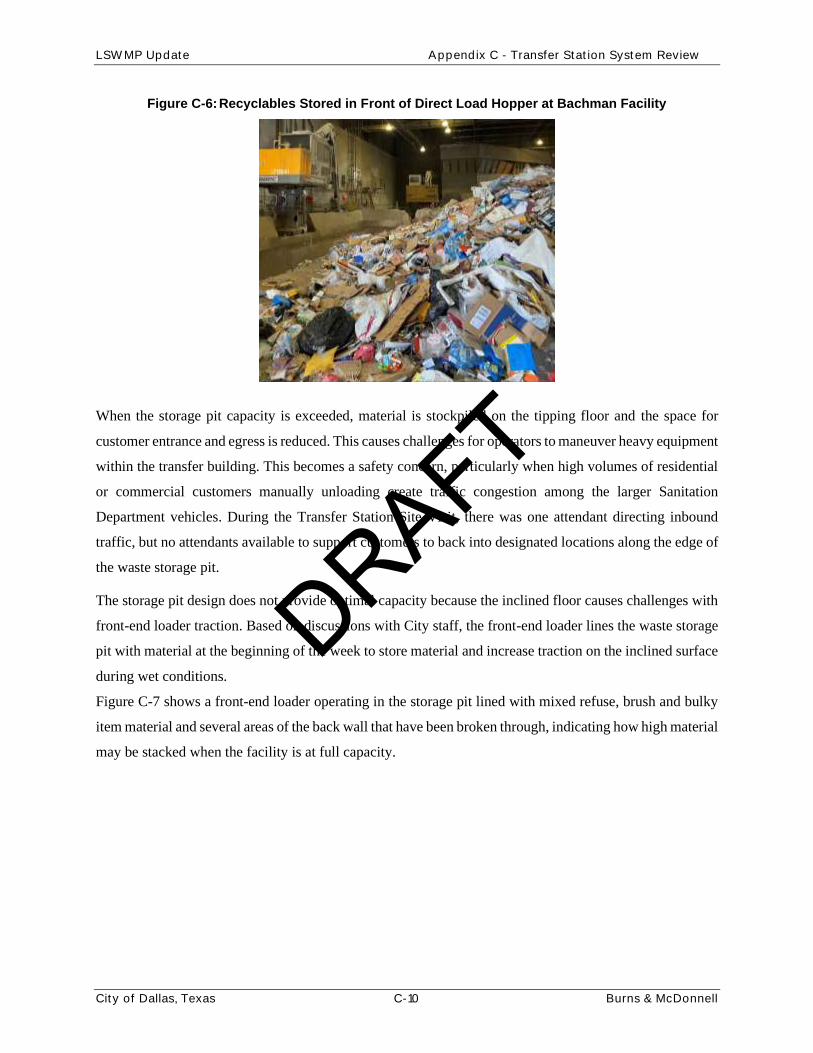
LSWMP Update Appendix C - Transfer Station System Review
City of Dallas, Texas C-10 Burns & McDonnell
Figure C-6: Recyclables Stored in Front of Direct Load Hopper at Bachman Facility
When the storage pit capacity is exceeded, material is stockpiled on the tipping floor and the space for
customer entrance and egress is reduced. This causes challenges for operators to maneuver heavy equipment
within the transfer building. This becomes a safety concern, particularly when high volumes of residential
or commercial customers manually unloading create traffic congestion among the larger Sanitation
Department vehicles. During the Transfer Station Site Visit, there was one attendant directing inbound
traffic, but no attendants available to support customers to back into designated locations along the edge of
the waste storage pit.
The storage pit design does not provide optimal capacity because the inclined floor causes challenges with
front-end loader traction. Based on discussions with City staff, the front-end loader lines the waste storage
pit with material at the beginning of the week to store material and increase traction on the inclined surface
during wet conditions.
Figure C-7 shows a front-end loader operating in the storage pit lined with mixed refuse, brush and bulky
item material and several areas of the back wall that have been broken through, indicating how high material
may be stacked when the facility is at full capacity.
DRAFT
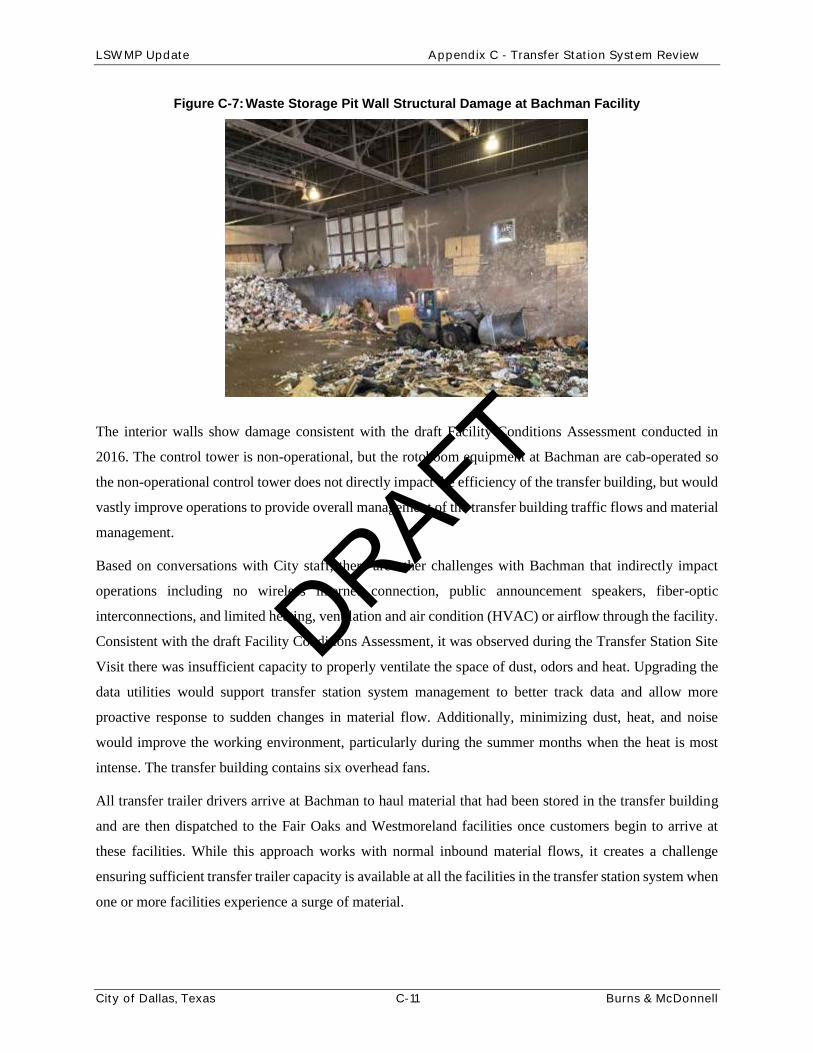
LSWMP Update Appendix C - Transfer Station System Review
City of Dallas, Texas C-11 Burns & McDonnell
Figure C-7: Waste Storage Pit Wall Structural Damage at Bachman Facility
The interior walls show damage consistent with the draft Facility Conditions Assessment conducted in
2016. The control tower is non-operational, but the rotoboom equipment at Bachman are cab-operated so
the non-operational control tower does not directly impact the efficiency of the transfer building, but would
vastly improve operations to provide overall management of the transfer building traffic flows and material
management.
Based on conversations with City staff, there are other challenges with Bachman that indirectly impact
operations including no wireless internet connection, public announcement speakers, fiber-optic
interconnections, and limited heating, ventilation and air condition (HVAC) or airflow through the facility.
Consistent with the draft Facility Conditions Assessment, it was observed during the Transfer Station Site
Visit there was insufficient capacity to properly ventilate the space of dust, odors and heat. Upgrading the
data utilities would support transfer station system management to better track data and allow more
proactive response to sudden changes in material flow. Additionally, minimizing dust, heat, and noise
would improve the working environment, particularly during the summer months when the heat is most
intense. The transfer building contains six overhead fans.
All transfer trailer drivers arrive at Bachman to haul material that had been stored in the transfer building
and are then dispatched to the Fair Oaks and Westmoreland facilities once customers begin to arrive at
these facilities. While this approach works with normal inbound material flows, it creates a challenge
ensuring sufficient transfer trailer capacity is available at all the facilities in the transfer station system when
one or more facilities experience a surge of material.
DRAFT
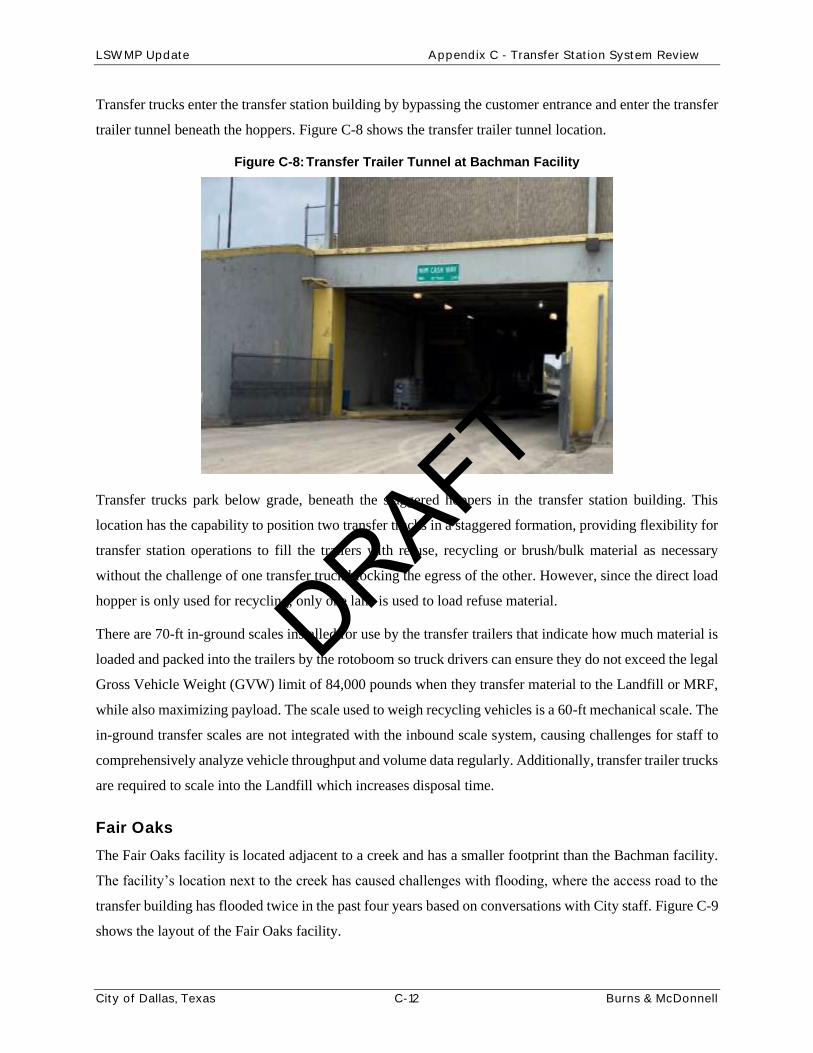
LSWMP Update Appendix C - Transfer Station System Review
City of Dallas, Texas C-12 Burns & McDonnell
Transfer trucks enter the transfer station building by bypassing the customer entrance and enter the transfer
trailer tunnel beneath the hoppers. Figure C-8 shows the transfer trailer tunnel location.
Figure C-8: Transfer Trailer Tunnel at Bachman Facility
Transfer trucks park below grade, beneath the staggered hoppers in the transfer station building. This
location has the capability to position two transfer trucks in a staggered formation, providing flexibility for
transfer station operations to fill the trailers with refuse, recycling or brush/bulk material as necessary
without the challenge of one transfer truck blocking the egress of the other. However, since the direct load
hopper is only used for recycling, only one lane is used to load refuse material.
There are 70-ft in-ground scales installed for use by the transfer trailers that indicate how much material is
loaded and packed into the trailers by the rotoboom so truck drivers can ensure they do not exceed the legal
Gross Vehicle Weight (GVW) limit of 84,000 pounds when they transfer material to the Landfill or MRF,
while also maximizing payload. The scale used to weigh recycling vehicles is a 60-ft mechanical scale. The
in-ground transfer scales are not integrated with the inbound scale system, causing challenges for staff to
comprehensively analyze vehicle throughput and volume data regularly. Additionally, transfer trailer trucks
are required to scale into the Landfill which increases disposal time.
Fair Oaks
The Fair Oaks facility is located adjacent to a creek and has a smaller footprint than the Bachman facility.
The facility’s location next to the creek has caused challenges with flooding, where the access road to the
transfer building has flooded twice in the past four years based on conversations with City staff. Figure C-9
shows the layout of the Fair Oaks facility.
DRAFT
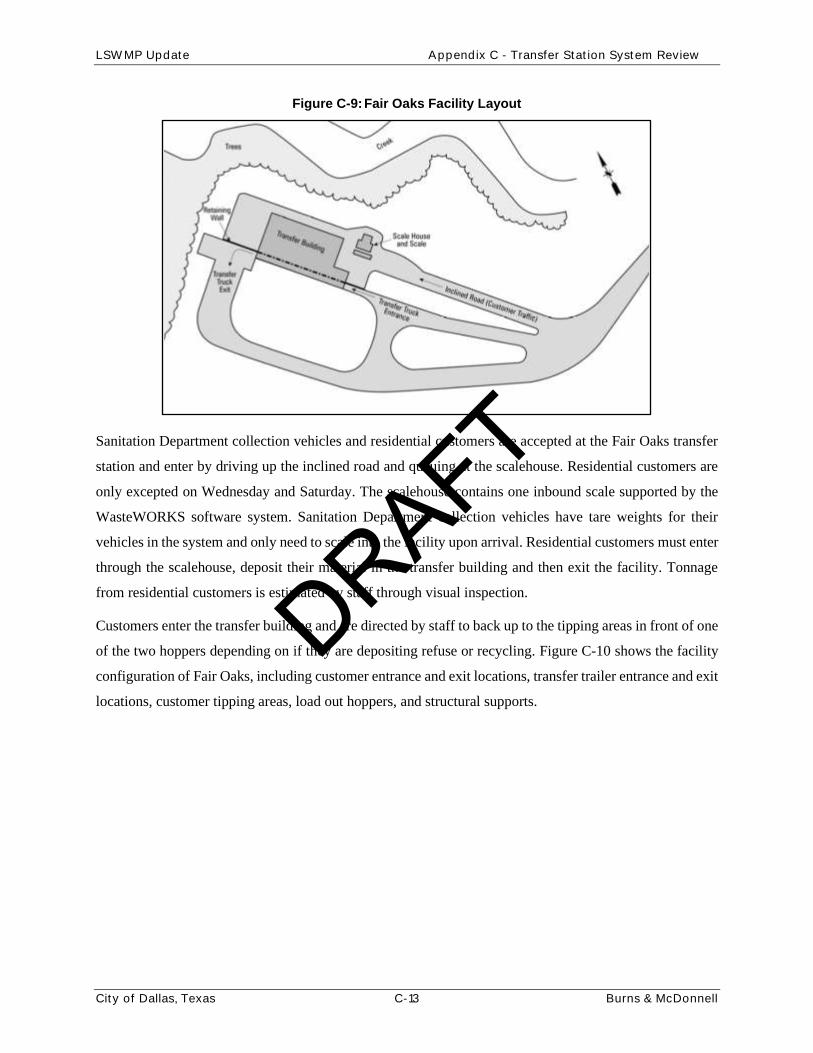
LSWMP Update Appendix C - Transfer Station System Review
City of Dallas, Texas C-13 Burns & McDonnell
Figure C-9: Fair Oaks Facility Layout
Sanitation Department collection vehicles and residential customers are accepted at the Fair Oaks transfer
station and enter by driving up the inclined road and queuing at the scalehouse. Residential customers are
only excepted on Wednesday and Saturday. The scalehouse contains one inbound scale supported by the
WasteWORKS software system. Sanitation Department collection vehicles have tare weights for their
vehicles in the system and only need to scale into the facility upon arrival. Residential customers must enter
through the scalehouse, deposit their material in the transfer building and then exit the facility. Tonnage
from residential customers is estimated by staff through visual inspection.
Customers enter the transfer building and are directed by staff to back up to the tipping areas in front of one
of the two hoppers depending on if they are depositing refuse or recycling. Figure C-10 shows the facility
configuration of Fair Oaks, including customer entrance and exit locations, transfer trailer entrance and exit
locations, customer tipping areas, load out hoppers, and structural supports.
DRAFT
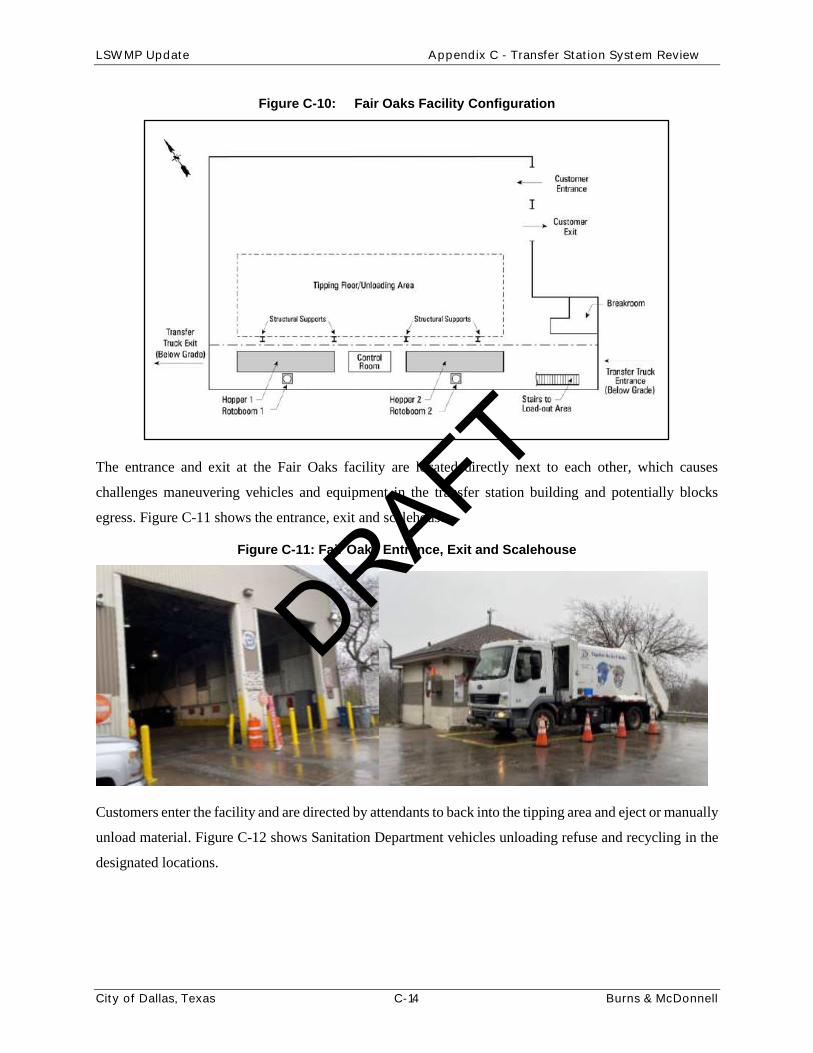
LSWMP Update Appendix C - Transfer Station System Review
City of Dallas, Texas C-14 Burns & McDonnell
Figure C-10: Fair Oaks Facility Configuration
The entrance and exit at the Fair Oaks facility are located directly next to each other, which causes
challenges maneuvering vehicles and equipment in the transfer station building and potentially blocks
egress. Figure C-11 shows the entrance, exit and scalehouse.
Figure C-11: Fair Oaks Entrance, Exit and Scalehouse
Customers enter the facility and are directed by attendants to back into the tipping area and eject or manually
unload material. Figure C-12 shows Sanitation Department vehicles unloading refuse and recycling in the
designated locations.
DRAFT
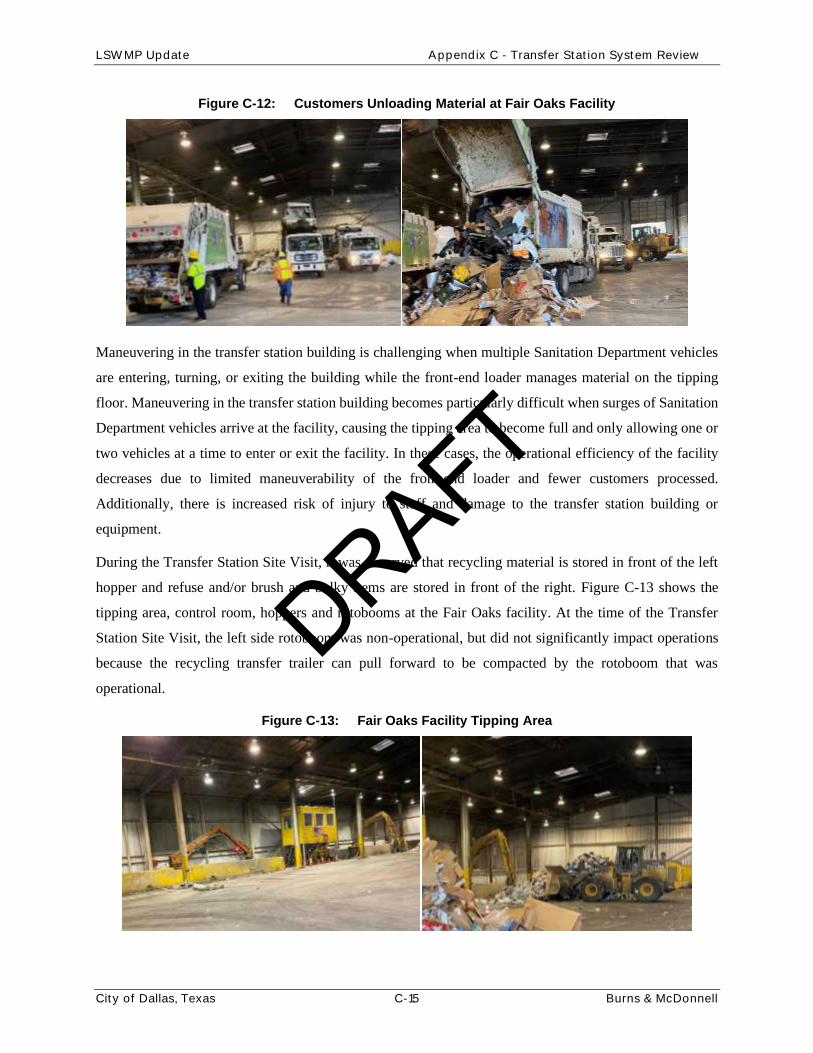
LSWMP Update Appendix C - Transfer Station System Review
City of Dallas, Texas C-15 Burns & McDonnell
Figure C-12: Customers Unloading Material at Fair Oaks Facility
Maneuvering in the transfer station building is challenging when multiple Sanitation Department vehicles
are entering, turning, or exiting the building while the front-end loader manages material on the tipping
floor. Maneuvering in the transfer station building becomes particularly difficult when surges of Sanitation
Department vehicles arrive at the facility, causing the tipping area to become full and only allowing one or
two vehicles at a time to enter or exit the facility. In these cases, the operational efficiency of the facility
decreases due to limited maneuverability of the front-end loader and fewer customers processed.
Additionally, there is increased risk of injury to staff and damage to the transfer station building or
equipment.
During the Transfer Station Site Visit, it was observed that recycling material is stored in front of the left
hopper and refuse and/or brush and bulky items are stored in front of the right. Figure C-13 shows the
tipping area, control room, hoppers and rotobooms at the Fair Oaks facility. At the time of the Transfer
Station Site Visit, the left side rotoboom was non-operational, but did not significantly impact operations
because the recycling transfer trailer can pull forward to be compacted by the rotoboom that was
operational.
Figure C-13: Fair Oaks Facility Tipping Area
DRAFT
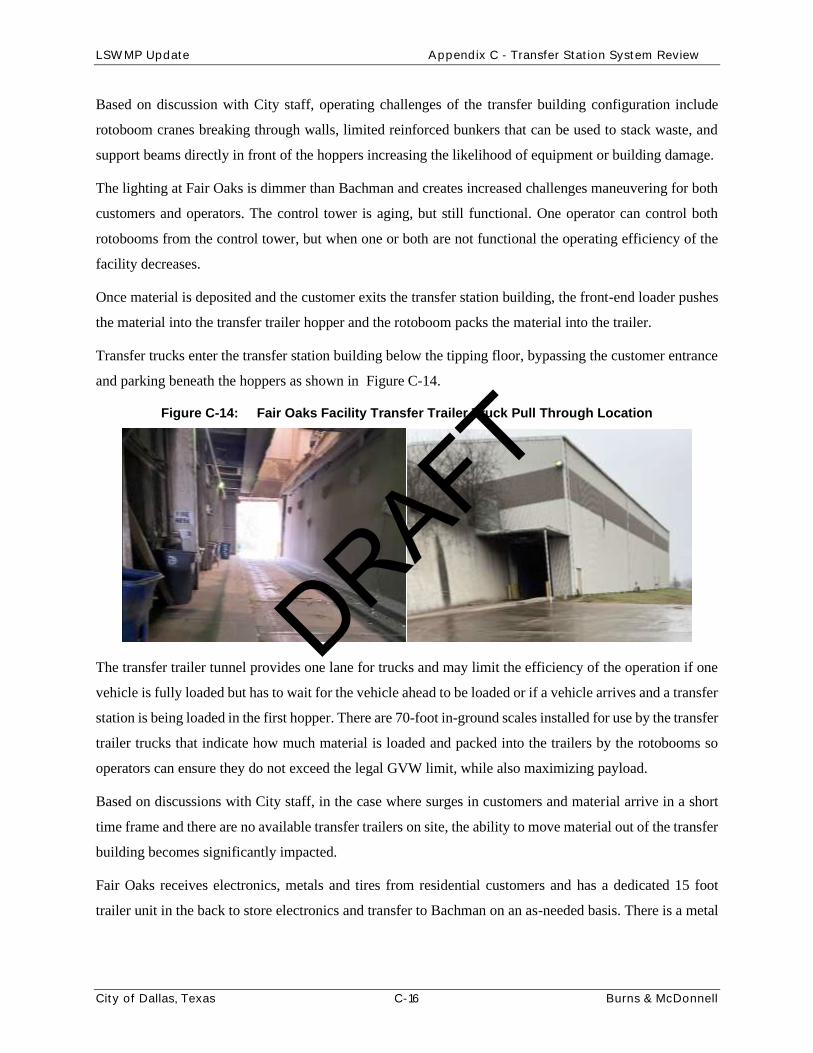
LSWMP Update Appendix C - Transfer Station System Review
City of Dallas, Texas C-16 Burns & McDonnell
Based on discussion with City staff, operating challenges of the transfer building configuration include
rotoboom cranes breaking through walls, limited reinforced bunkers that can be used to stack waste, and
support beams directly in front of the hoppers increasing the likelihood of equipment or building damage.
The lighting at Fair Oaks is dimmer than Bachman and creates increased challenges maneuvering for both
customers and operators. The control tower is aging, but still functional. One operator can control both
rotobooms from the control tower, but when one or both are not functional the operating efficiency of the
facility decreases.
Once material is deposited and the customer exits the transfer station building, the front-end loader pushes
the material into the transfer trailer hopper and the rotoboom packs the material into the trailer.
Transfer trucks enter the transfer station building below the tipping floor, bypassing the customer entrance
and parking beneath the hoppers as shown in Figure C-14.
Figure C-14: Fair Oaks Facility Transfer Trailer Truck Pull Through Location
The transfer trailer tunnel provides one lane for trucks and may limit the efficiency of the operation if one
vehicle is fully loaded but has to wait for the vehicle ahead to be loaded or if a vehicle arrives and a transfer
station is being loaded in the first hopper. There are 70-foot in-ground scales installed for use by the transfer
trailer trucks that indicate how much material is loaded and packed into the trailers by the rotobooms so
operators can ensure they do not exceed the legal GVW limit, while also maximizing payload.
Based on discussions with City staff, in the case where surges in customers and material arrive in a short
time frame and there are no available transfer trailers on site, the ability to move material out of the transfer
building becomes significantly impacted.
Fair Oaks receives electronics, metals and tires from residential customers and has a dedicated 15 foot
trailer unit in the back to store electronics and transfer to Bachman on an as-needed basis. There is a metal
DRAFT
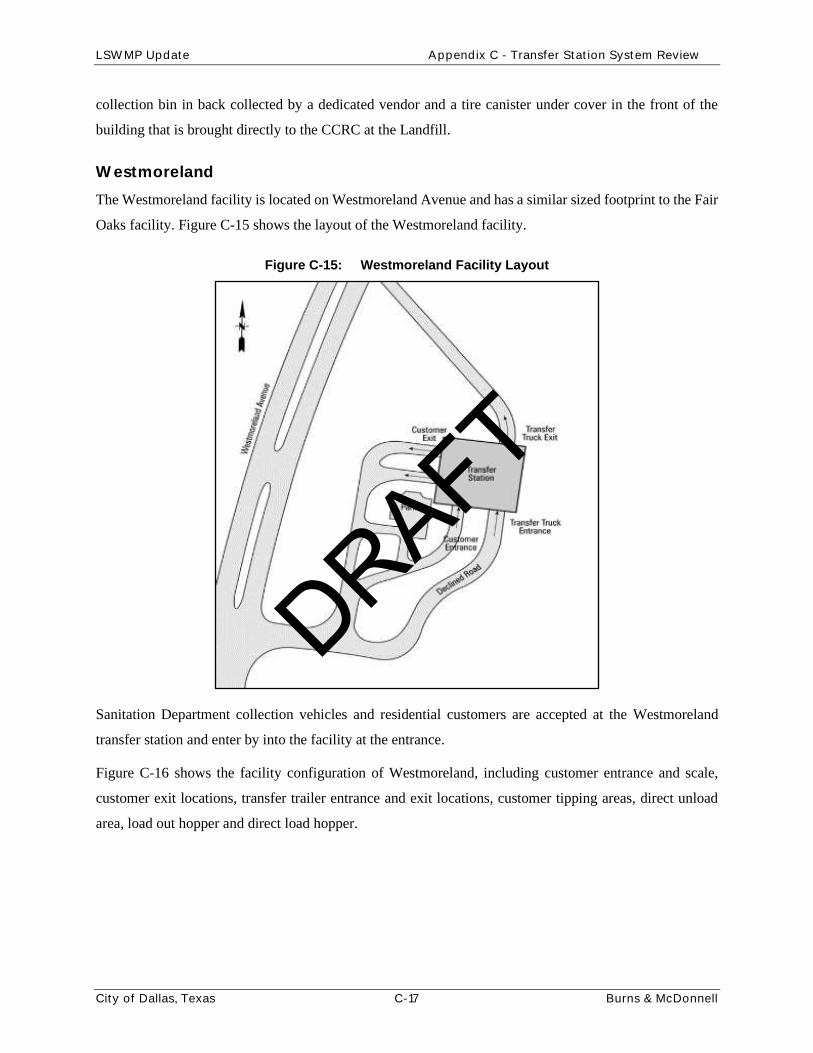
LSWMP Update Appendix C - Transfer Station System Review
City of Dallas, Texas C-17 Burns & McDonnell
collection bin in back collected by a dedicated vendor and a tire canister under cover in the front of the
building that is brought directly to the CCRC at the Landfill.
Westmoreland
The Westmoreland facility is located on Westmoreland Avenue and has a similar sized footprint to the Fair
Oaks facility. Figure C-15 shows the layout of the Westmoreland facility.
Figure C-15: Westmoreland Facility Layout
Sanitation Department collection vehicles and residential customers are accepted at the Westmoreland
transfer station and enter by into the facility at the entrance.
Figure C-16 shows the facility configuration of Westmoreland, including customer entrance and scale,
customer exit locations, transfer trailer entrance and exit locations, customer tipping areas, direct unload
area, load out hopper and direct load hopper.
DRAFT
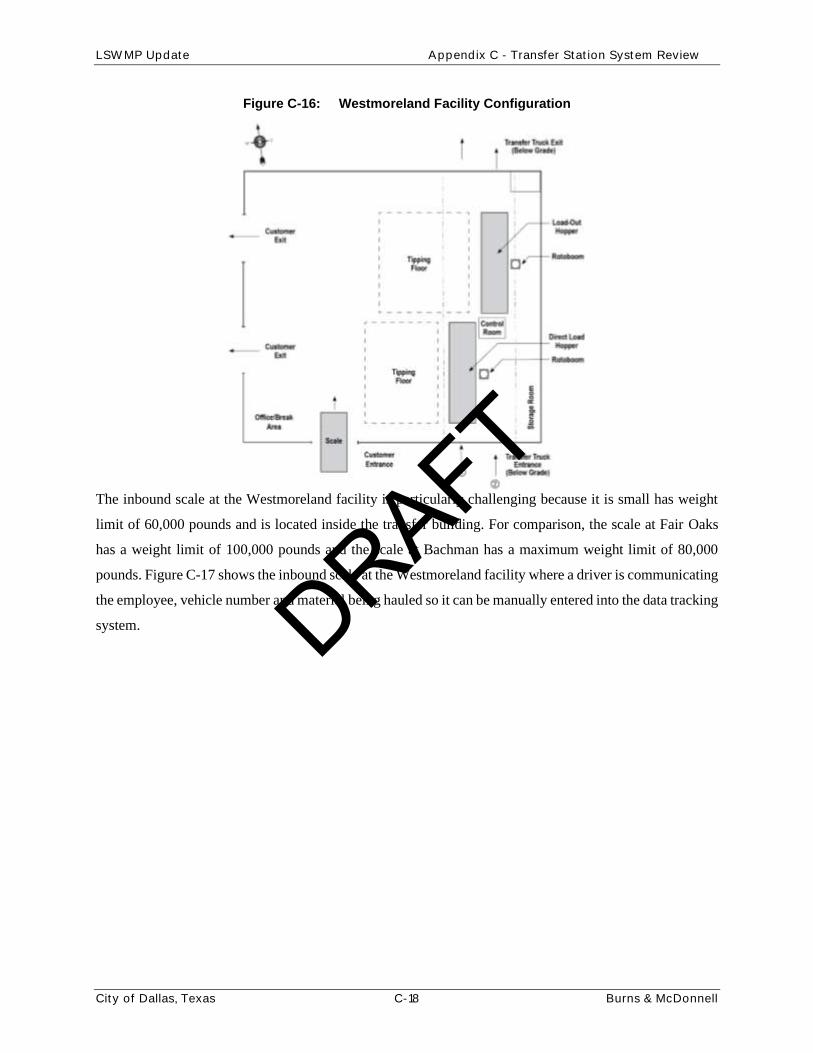
LSWMP Update Appendix C - Transfer Station System Review
City of Dallas, Texas C-18 Burns & McDonnell
Figure C-16: Westmoreland Facility Configuration
The inbound scale at the Westmoreland facility is particularly challenging because it is small has weight
limit of 60,000 pounds and is located inside the transfer building. For comparison, the scale at Fair Oaks
has a weight limit of 100,000 pounds and the scale at Bachman has a maximum weight limit of 80,000
pounds. Figure C-17 shows the inbound scale at the Westmoreland facility where a driver is communicating
the employee, vehicle number and material being hauled so it can be manually entered into the data tracking
system. DRAFT
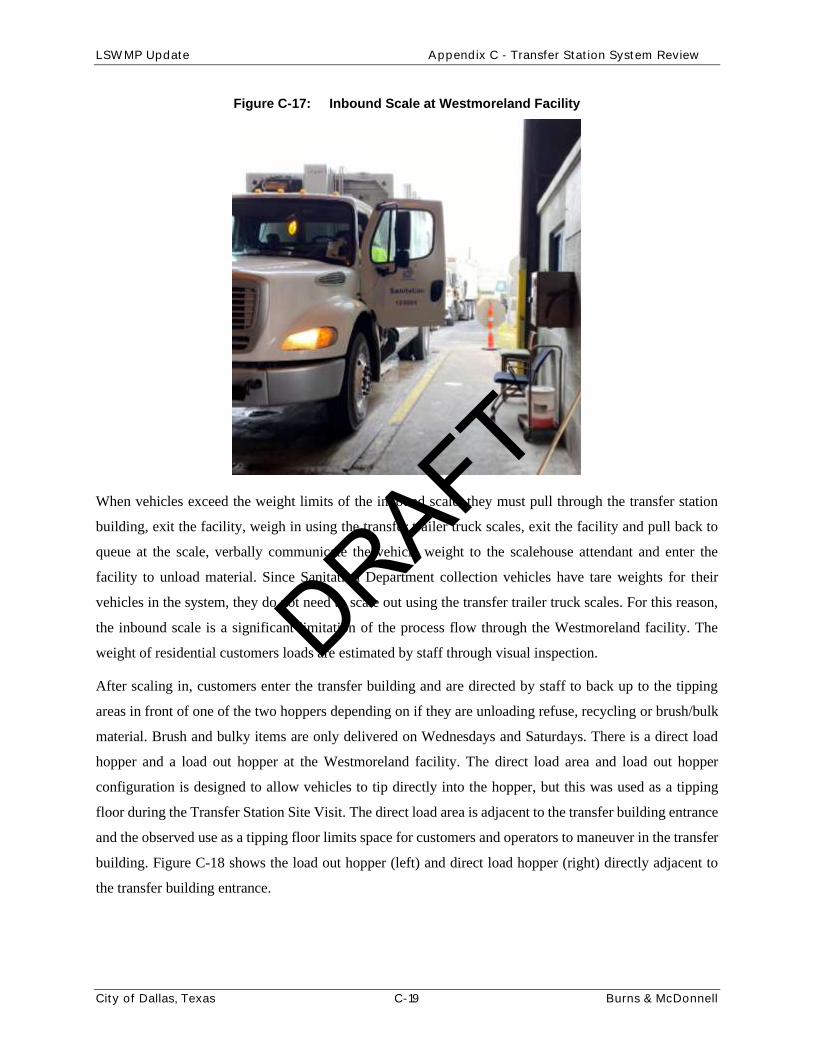
LSWMP Update Appendix C - Transfer Station System Review
City of Dallas, Texas C-19 Burns & McDonnell
Figure C-17: Inbound Scale at Westmoreland Facility
When vehicles exceed the weight limits of the inbound scale, they must pull through the transfer station
building, exit the facility, weigh in using the transfer trailer truck scales, exit the facility and pull back to
queue at the scale, verbally communicate the vehicle weight to the scalehouse attendant and enter the
facility to unload material. Since Sanitation Department collection vehicles have tare weights for their
vehicles in the system, they do not need to scale out using the transfer trailer truck scales. For this reason,
the inbound scale is a significant limitation of the process flow through the Westmoreland facility. The
weight of residential customers loads are estimated by staff through visual inspection.
After scaling in, customers enter the transfer building and are directed by staff to back up to the tipping
areas in front of one of the two hoppers depending on if they are unloading refuse, recycling or brush/bulk
material. Brush and bulky items are only delivered on Wednesdays and Saturdays. There is a direct load
hopper and a load out hopper at the Westmoreland facility. The direct load area and load out hopper
configuration is designed to allow vehicles to tip directly into the hopper, but this was used as a tipping
floor during the Transfer Station Site Visit. The direct load area is adjacent to the transfer building entrance
and the observed use as a tipping floor limits space for customers and operators to maneuver in the transfer
building. Figure C-18 shows the load out hopper (left) and direct load hopper (right) directly adjacent to
the transfer building entrance.
DRAFT
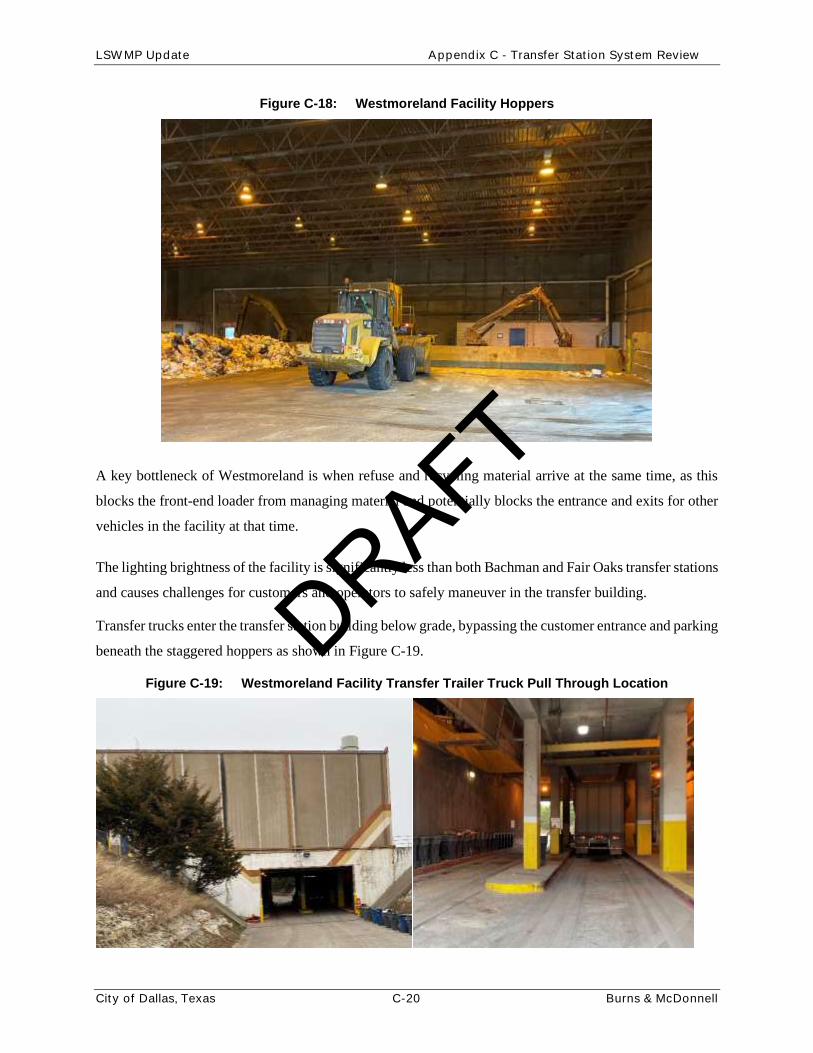
LSWMP Update Appendix C - Transfer Station System Review
City of Dallas, Texas C-20 Burns & McDonnell
Figure C-18: Westmoreland Facility Hoppers
A key bottleneck of Westmoreland is when refuse and recycling material arrive at the same time, as this
blocks the front-end loader from managing material and potentially blocks the entrance and exits for other
vehicles in the facility at that time.
The lighting brightness of the facility is significantly less than both Bachman and Fair Oaks transfer stations
and causes challenges for customers and operators to safely maneuver in the transfer building.
Transfer trucks enter the transfer station building below grade, bypassing the customer entrance and parking
beneath the staggered hoppers as shown in Figure C-19.
Figure C-19: Westmoreland Facility Transfer Trailer Truck Pull Through Location
DRAFT
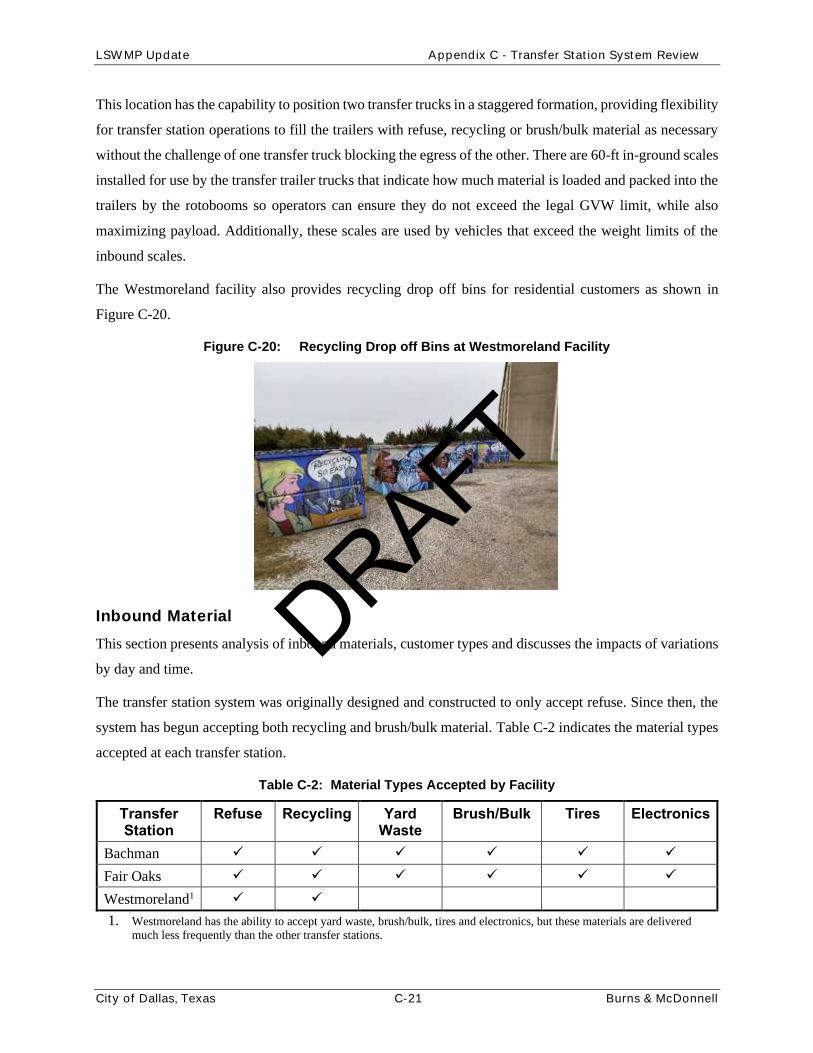
LSWMP Update Appendix C - Transfer Station System Review
City of Dallas, Texas C-21 Burns & McDonnell
This location has the capability to position two transfer trucks in a staggered formation, providing flexibility
for transfer station operations to fill the trailers with refuse, recycling or brush/bulk material as necessary
without the challenge of one transfer truck blocking the egress of the other. There are 60-ft in-ground scales
installed for use by the transfer trailer trucks that indicate how much material is loaded and packed into the
trailers by the rotobooms so operators can ensure they do not exceed the legal GVW limit, while also
maximizing payload. Additionally, these scales are used by vehicles that exceed the weight limits of the
inbound scales.
The Westmoreland facility also provides recycling drop off bins for residential customers as shown in
Figure C-20.
Figure C-20: Recycling Drop off Bins at Westmoreland Facility
Inbound Material
This section presents analysis of inbound materials, customer types and discusses the impacts of variations
by day and time.
The transfer station system was originally designed and constructed to only accept refuse. Since then, the
system has begun accepting both recycling and brush/bulk material. Table C-2 indicates the material types
accepted at each transfer station.
Table C-2: Material Types Accepted by Facility
Transfer Station
Refuse Recycling Yard Waste
Brush/Bulk Tires Electronics
Bachman ✓ ✓ ✓ ✓ ✓ ✓
Fair Oaks ✓ ✓ ✓ ✓ ✓ ✓
Westmoreland1 ✓ ✓
1. Westmoreland has the ability to accept yard waste, brush/bulk, tires and electronics, but these materials are delivered
much less frequently than the other transfer stations.
DRAFT
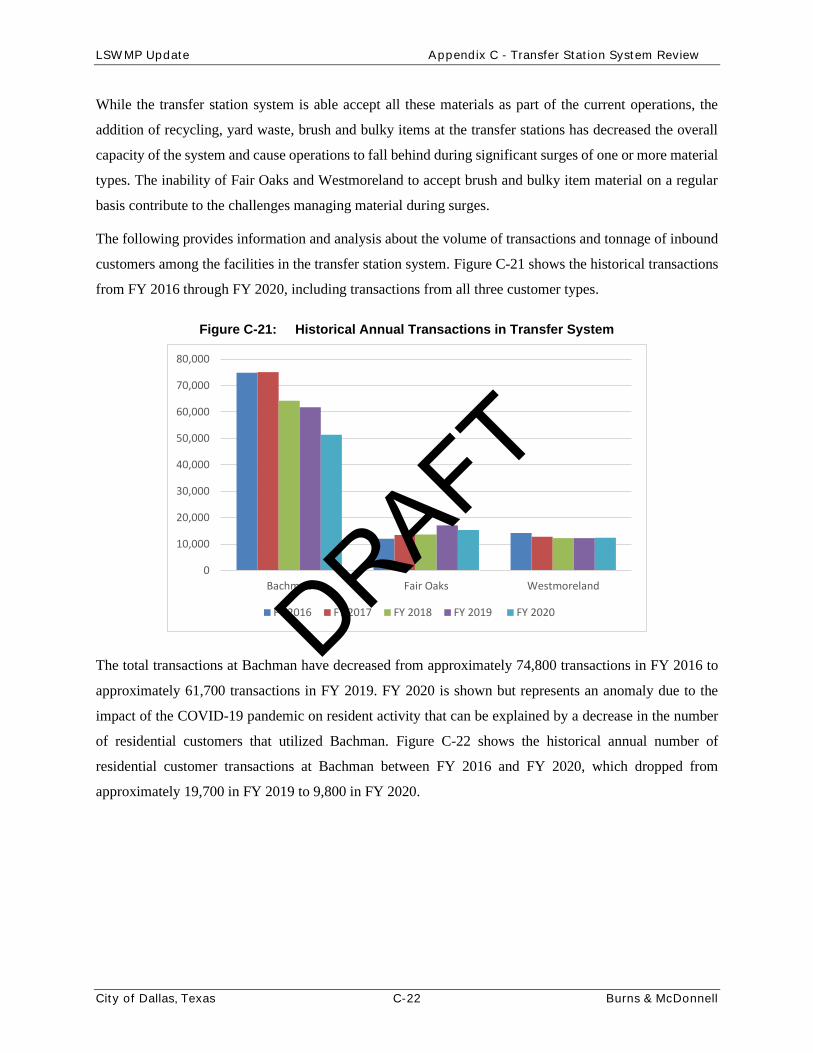
LSWMP Update Appendix C - Transfer Station System Review
City of Dallas, Texas C-22 Burns & McDonnell
While the transfer station system is able accept all these materials as part of the current operations, the
addition of recycling, yard waste, brush and bulky items at the transfer stations has decreased the overall
capacity of the system and cause operations to fall behind during significant surges of one or more material
types. The inability of Fair Oaks and Westmoreland to accept brush and bulky item material on a regular
basis contribute to the challenges managing material during surges.
The following provides information and analysis about the volume of transactions and tonnage of inbound
customers among the facilities in the transfer station system. Figure C-21 shows the historical transactions
from FY 2016 through FY 2020, including transactions from all three customer types.
Figure C-21: Historical Annual Transactions in Transfer System
The total transactions at Bachman have decreased from approximately 74,800 transactions in FY 2016 to
approximately 61,700 transactions in FY 2019. FY 2020 is shown but represents an anomaly due to the
impact of the COVID-19 pandemic on resident activity that can be explained by a decrease in the number
of residential customers that utilized Bachman. Figure C-22 shows the historical annual number of
residential customer transactions at Bachman between FY 2016 and FY 2020, which dropped from
approximately 19,700 in FY 2019 to 9,800 in FY 2020.
0
10,000
20,000
30,000
40,000
50,000
60,000
70,000
80,000
Bachman Fair Oaks Westmoreland
FY 2016 FY 2017 FY 2018 FY 2019 FY 2020DRAFT
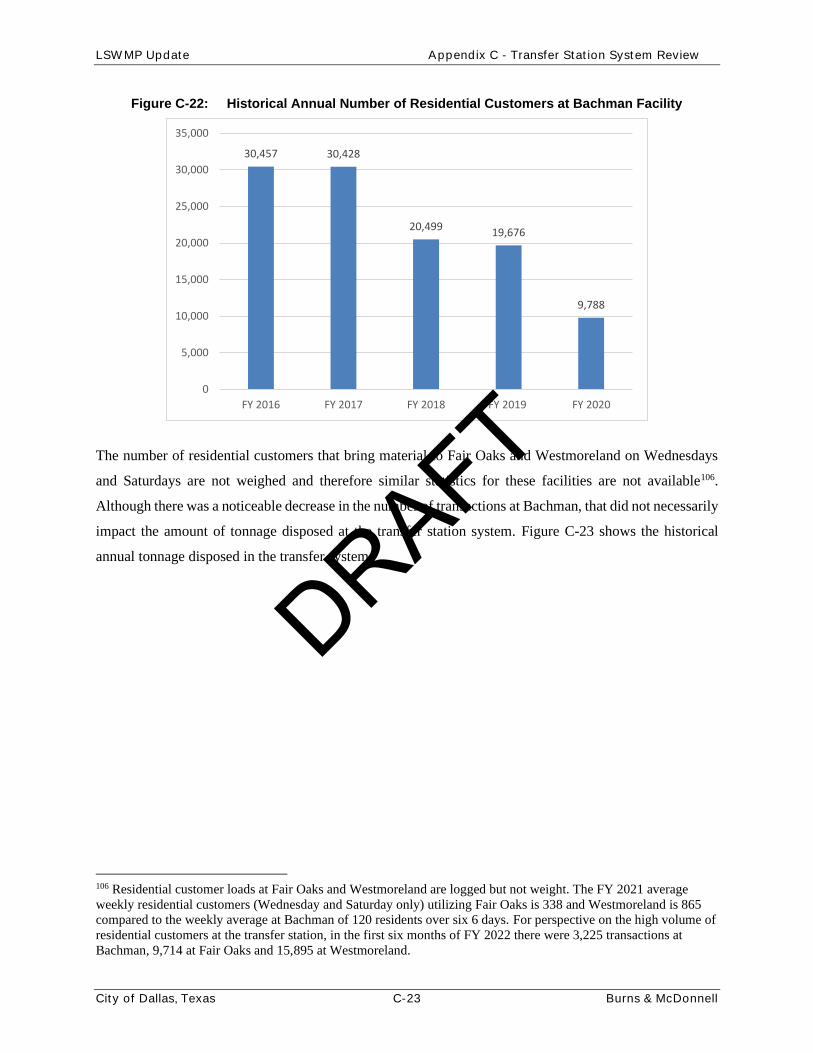
LSWMP Update Appendix C - Transfer Station System Review
City of Dallas, Texas C-23 Burns & McDonnell
Figure C-22: Historical Annual Number of Residential Customers at Bachman Facility
The number of residential customers that bring material to Fair Oaks and Westmoreland on Wednesdays
and Saturdays are not weighed and therefore similar statistics for these facilities are not available106.
Although there was a noticeable decrease in the number of transactions at Bachman, that did not necessarily
impact the amount of tonnage disposed at the transfer station system. Figure C-23 shows the historical
annual tonnage disposed in the transfer system.
106 Residential customer loads at Fair Oaks and Westmoreland are logged but not weight. The FY 2021 average
weekly residential customers (Wednesday and Saturday only) utilizing Fair Oaks is 338 and Westmoreland is 865
compared to the weekly average at Bachman of 120 residents over six 6 days. For perspective on the high volume of
residential customers at the transfer station, in the first six months of FY 2022 there were 3,225 transactions at
Bachman, 9,714 at Fair Oaks and 15,895 at Westmoreland.
30,457 30,428
20,49919,676
9,788
0
5,000
10,000
15,000
20,000
25,000
30,000
35,000
FY 2016 FY 2017 FY 2018 FY 2019 FY 2020
DRAFT
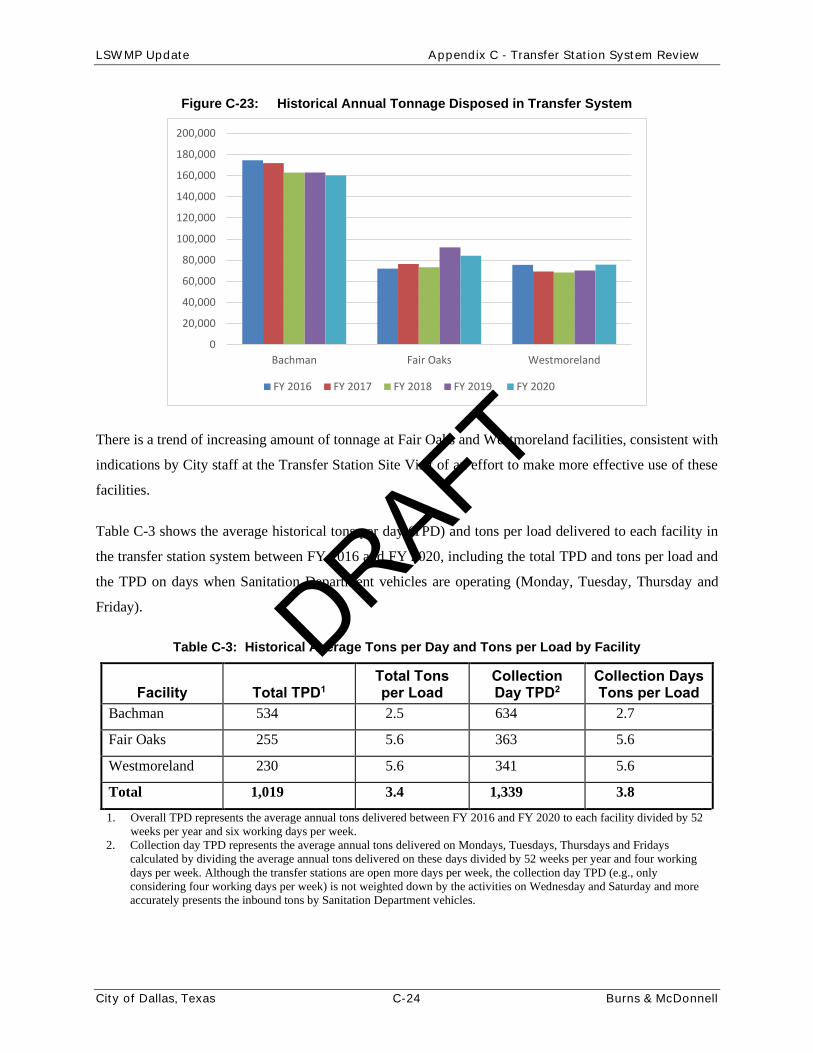
LSWMP Update Appendix C - Transfer Station System Review
City of Dallas, Texas C-24 Burns & McDonnell
Figure C-23: Historical Annual Tonnage Disposed in Transfer System
There is a trend of increasing amount of tonnage at Fair Oaks and Westmoreland facilities, consistent with
indications by City staff at the Transfer Station Site Visit of an effort to make more effective use of these
facilities.
Table C-3 shows the average historical tons per day (TPD) and tons per load delivered to each facility in
the transfer station system between FY 2016 and FY 2020, including the total TPD and tons per load and
the TPD on days when Sanitation Department vehicles are operating (Monday, Tuesday, Thursday and
Friday).
Table C-3: Historical Average Tons per Day and Tons per Load by Facility
Facility Total TPD1 Total Tons per Load
Collection Day TPD2
Collection Days Tons per Load
Bachman 534 2.5 634 2.7
Fair Oaks 255 5.6 363 5.6
Westmoreland 230 5.6 341 5.6
Total 1,019 3.4 1,339 3.8
1. Overall TPD represents the average annual tons delivered between FY 2016 and FY 2020 to each facility divided by 52
weeks per year and six working days per week. 2. Collection day TPD represents the average annual tons delivered on Mondays, Tuesdays, Thursdays and Fridays
calculated by dividing the average annual tons delivered on these days divided by 52 weeks per year and four working
days per week. Although the transfer stations are open more days per week, the collection day TPD (e.g., only
considering four working days per week) is not weighted down by the activities on Wednesday and Saturday and more
accurately presents the inbound tons by Sanitation Department vehicles.
0
20,000
40,000
60,000
80,000
100,000
120,000
140,000
160,000
180,000
200,000
Bachman Fair Oaks Westmoreland
FY 2016 FY 2017 FY 2018 FY 2019 FY 2020
DRAFT
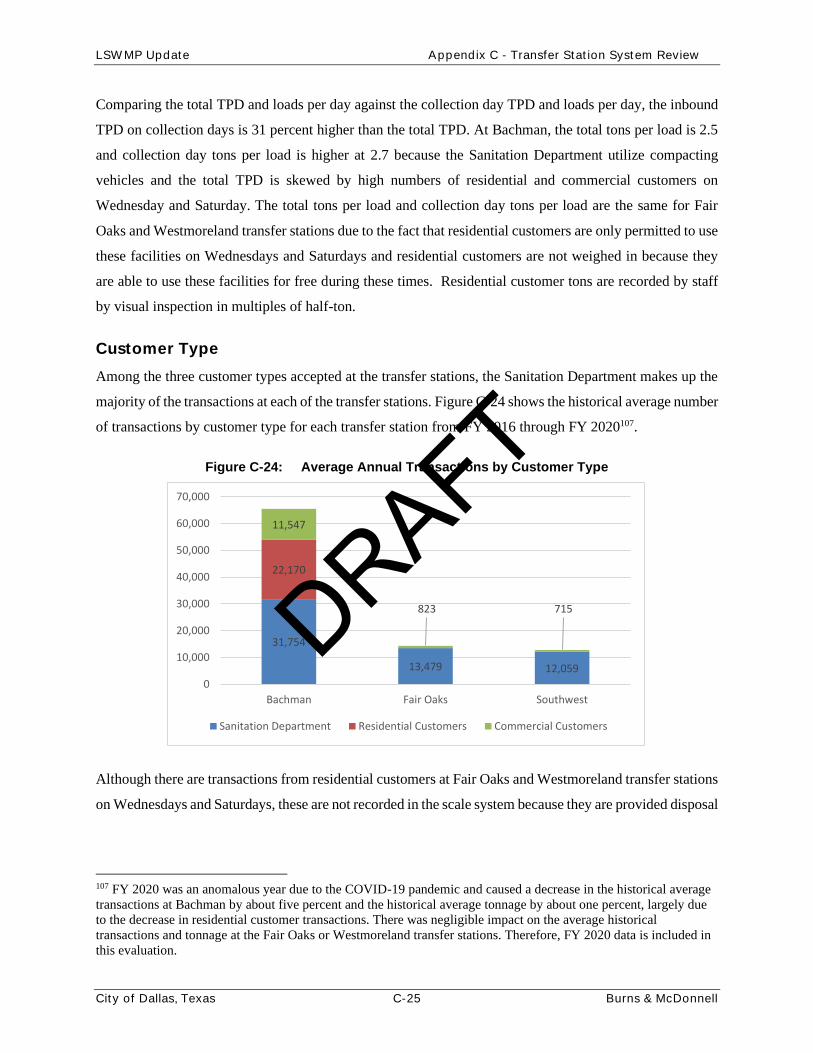
LSWMP Update Appendix C - Transfer Station System Review
City of Dallas, Texas C-25 Burns & McDonnell
Comparing the total TPD and loads per day against the collection day TPD and loads per day, the inbound
TPD on collection days is 31 percent higher than the total TPD. At Bachman, the total tons per load is 2.5
and collection day tons per load is higher at 2.7 because the Sanitation Department utilize compacting
vehicles and the total TPD is skewed by high numbers of residential and commercial customers on
Wednesday and Saturday. The total tons per load and collection day tons per load are the same for Fair
Oaks and Westmoreland transfer stations due to the fact that residential customers are only permitted to use
these facilities on Wednesdays and Saturdays and residential customers are not weighed in because they
are able to use these facilities for free during these times. Residential customer tons are recorded by staff
by visual inspection in multiples of half-ton.
Customer Type
Among the three customer types accepted at the transfer stations, the Sanitation Department makes up the
majority of the transactions at each of the transfer stations. Figure C-24 shows the historical average number
of transactions by customer type for each transfer station from FY 2016 through FY 2020107.
Figure C-24: Average Annual Transactions by Customer Type
Although there are transactions from residential customers at Fair Oaks and Westmoreland transfer stations
on Wednesdays and Saturdays, these are not recorded in the scale system because they are provided disposal
107 FY 2020 was an anomalous year due to the COVID-19 pandemic and caused a decrease in the historical average
transactions at Bachman by about five percent and the historical average tonnage by about one percent, largely due
to the decrease in residential customer transactions. There was negligible impact on the average historical
transactions and tonnage at the Fair Oaks or Westmoreland transfer stations. Therefore, FY 2020 data is included in
this evaluation.
31,754
13,479 12,059
22,170
11,547
823 715
0
10,000
20,000
30,000
40,000
50,000
60,000
70,000
Bachman Fair Oaks Southwest
Sanitation Department Residential Customers Commercial Customers
DRAFT
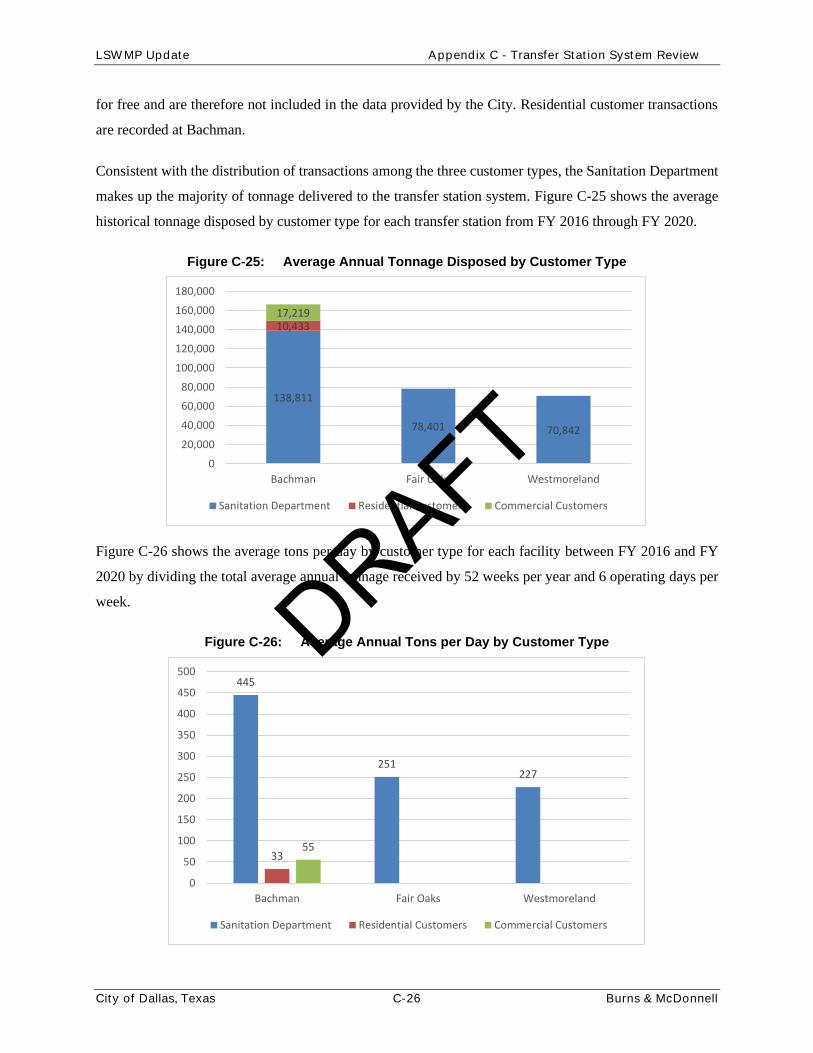
LSWMP Update Appendix C - Transfer Station System Review
City of Dallas, Texas C-26 Burns & McDonnell
for free and are therefore not included in the data provided by the City. Residential customer transactions
are recorded at Bachman.
Consistent with the distribution of transactions among the three customer types, the Sanitation Department
makes up the majority of tonnage delivered to the transfer station system. Figure C-25 shows the average
historical tonnage disposed by customer type for each transfer station from FY 2016 through FY 2020.
Figure C-25: Average Annual Tonnage Disposed by Customer Type
Figure C-26 shows the average tons per day by customer type for each facility between FY 2016 and FY
2020 by dividing the total average annual tonnage received by 52 weeks per year and 6 operating days per
week.
Figure C-26: Average Annual Tons per Day by Customer Type
138,811
78,401 70,842
10,43317,219
0
20,000
40,000
60,000
80,000
100,000
120,000
140,000
160,000
180,000
Bachman Fair Oaks Westmoreland
Sanitation Department Residential Customers Commercial Customers
445
251227
3355
0
50
100
150
200
250
300
350
400
450
500
Bachman Fair Oaks Westmoreland
Sanitation Department Residential Customers Commercial Customers
DRAFT
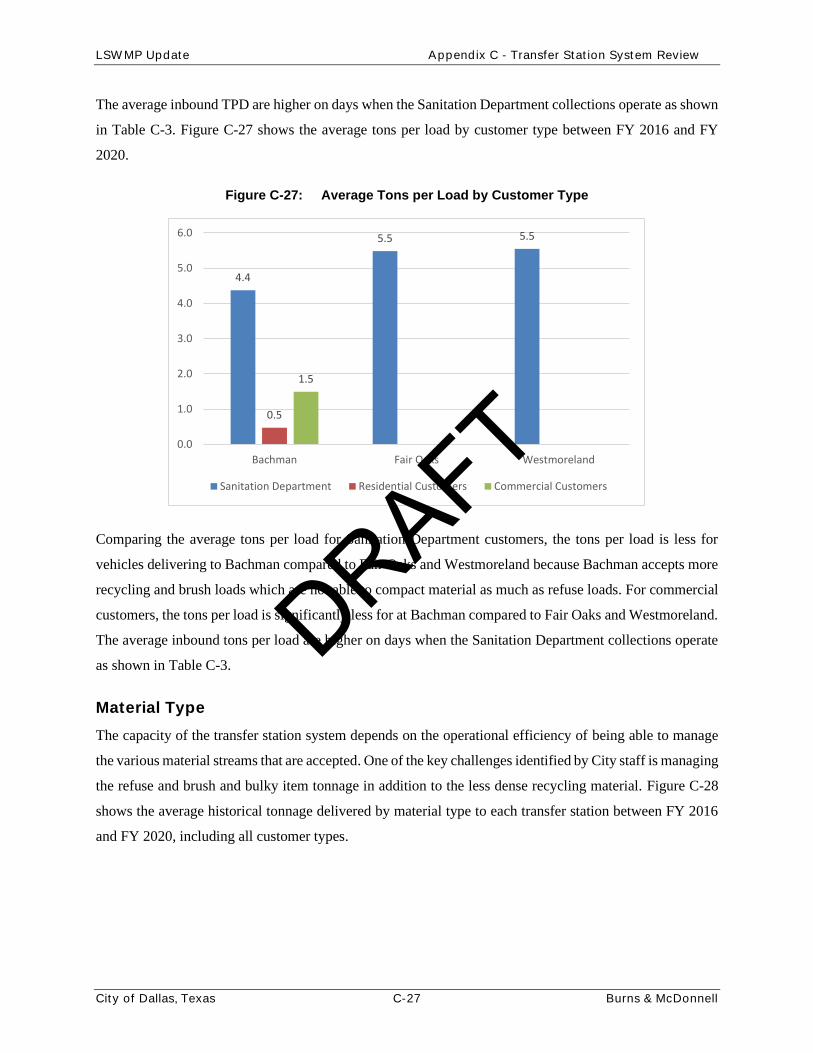
LSWMP Update Appendix C - Transfer Station System Review
City of Dallas, Texas C-27 Burns & McDonnell
The average inbound TPD are higher on days when the Sanitation Department collections operate as shown
in Table C-3. Figure C-27 shows the average tons per load by customer type between FY 2016 and FY
2020.
Figure C-27: Average Tons per Load by Customer Type
Comparing the average tons per load for Sanitation Department customers, the tons per load is less for
vehicles delivering to Bachman compared to Fair Oaks and Westmoreland because Bachman accepts more
recycling and brush loads which are not able to compact material as much as refuse loads. For commercial
customers, the tons per load is significantly less for at Bachman compared to Fair Oaks and Westmoreland.
The average inbound tons per load are higher on days when the Sanitation Department collections operate
as shown in Table C-3.
Material Type
The capacity of the transfer station system depends on the operational efficiency of being able to manage
the various material streams that are accepted. One of the key challenges identified by City staff is managing
the refuse and brush and bulky item tonnage in addition to the less dense recycling material. Figure C-28
shows the average historical tonnage delivered by material type to each transfer station between FY 2016
and FY 2020, including all customer types.
4.4
5.5 5.5
0.5
1.5
0.0
1.0
2.0
3.0
4.0
5.0
6.0
Bachman Fair Oaks Westmoreland
Sanitation Department Residential Customers Commercial Customers
DRAFT
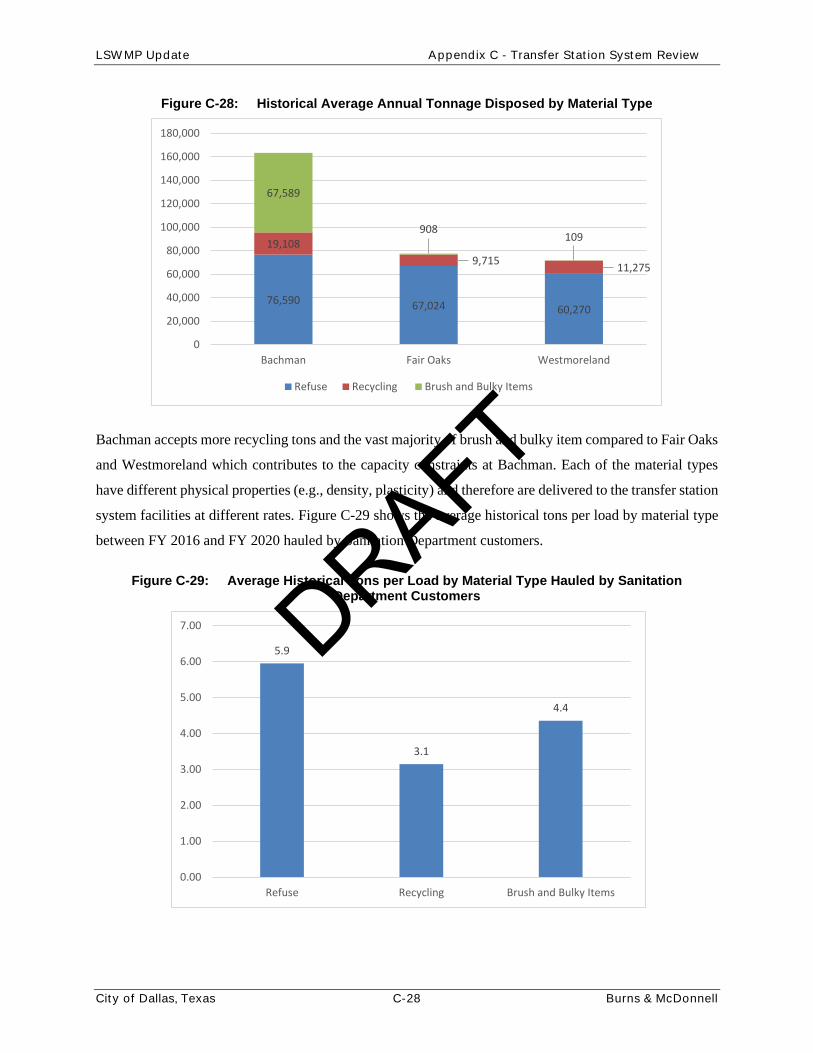
LSWMP Update Appendix C - Transfer Station System Review
City of Dallas, Texas C-28 Burns & McDonnell
Figure C-28: Historical Average Annual Tonnage Disposed by Material Type
Bachman accepts more recycling tons and the vast majority of brush and bulky item compared to Fair Oaks
and Westmoreland which contributes to the capacity constraints at Bachman. Each of the material types
have different physical properties (e.g., density, plasticity) and therefore are delivered to the transfer station
system facilities at different rates. Figure C-29 shows the average historical tons per load by material type
between FY 2016 and FY 2020 hauled by Sanitation Department customers.
Figure C-29: Average Historical Tons per Load by Material Type Hauled by Sanitation Department Customers
76,590 67,024 60,270
19,108
9,71511,275
67,589
908109
0
20,000
40,000
60,000
80,000
100,000
120,000
140,000
160,000
180,000
Bachman Fair Oaks Westmoreland
Refuse Recycling Brush and Bulky Items
5.9
3.1
4.4
0.00
1.00
2.00
3.00
4.00
5.00
6.00
7.00
Refuse Recycling Brush and Bulky Items
DRAFT
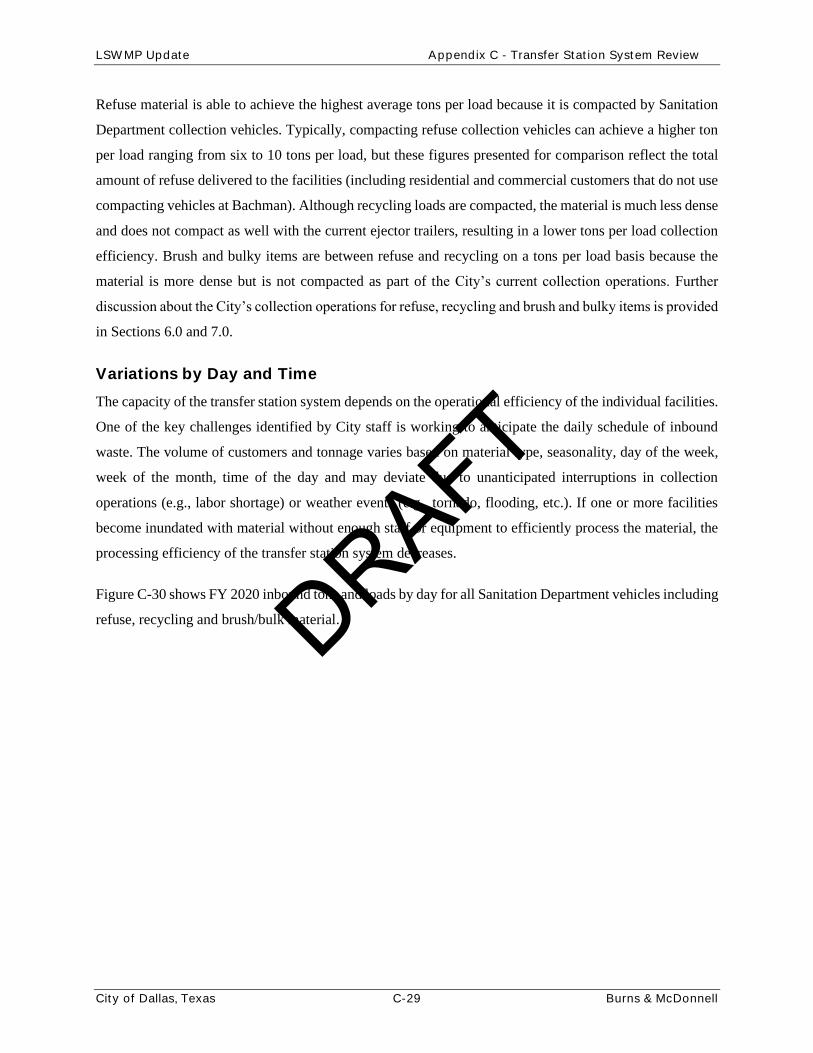
LSWMP Update Appendix C - Transfer Station System Review
City of Dallas, Texas C-29 Burns & McDonnell
Refuse material is able to achieve the highest average tons per load because it is compacted by Sanitation
Department collection vehicles. Typically, compacting refuse collection vehicles can achieve a higher ton
per load ranging from six to 10 tons per load, but these figures presented for comparison reflect the total
amount of refuse delivered to the facilities (including residential and commercial customers that do not use
compacting vehicles at Bachman). Although recycling loads are compacted, the material is much less dense
and does not compact as well with the current ejector trailers, resulting in a lower tons per load collection
efficiency. Brush and bulky items are between refuse and recycling on a tons per load basis because the
material is more dense but is not compacted as part of the City’s current collection operations. Further
discussion about the City’s collection operations for refuse, recycling and brush and bulky items is provided
in Sections 6.0 and 7.0.
Variations by Day and Time
The capacity of the transfer station system depends on the operational efficiency of the individual facilities.
One of the key challenges identified by City staff is working to anticipate the daily schedule of inbound
waste. The volume of customers and tonnage varies based on material type, seasonality, day of the week,
week of the month, time of the day and may deviate due to unanticipated interruptions in collection
operations (e.g., labor shortage) or weather events (e.g., tornado, flooding, etc.). If one or more facilities
become inundated with material without enough staff or equipment to efficiently process the material, the
processing efficiency of the transfer station system decreases.
Figure C-30 shows FY 2020 inbound tons and loads by day for all Sanitation Department vehicles including
refuse, recycling and brush/bulk material.
DRAFT
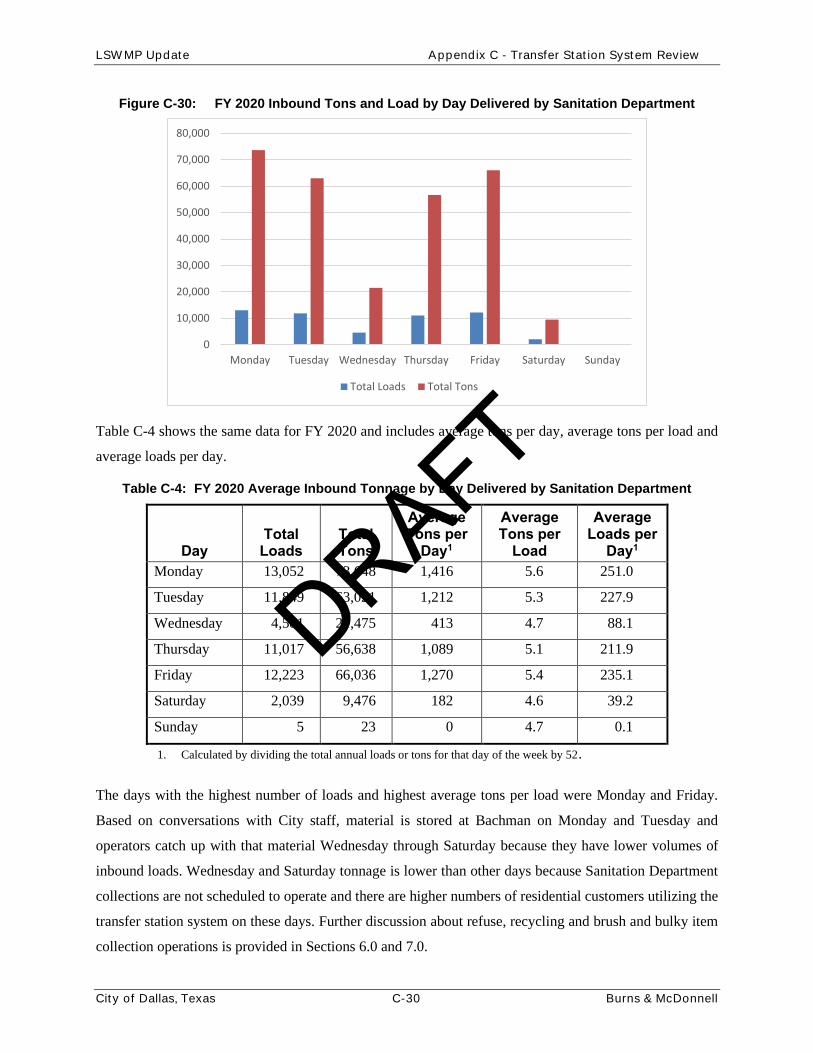
LSWMP Update Appendix C - Transfer Station System Review
City of Dallas, Texas C-30 Burns & McDonnell
Figure C-30: FY 2020 Inbound Tons and Load by Day Delivered by Sanitation Department
Table C-4 shows the same data for FY 2020 and includes average tons per day, average tons per load and
average loads per day.
Table C-4: FY 2020 Average Inbound Tonnage by Day Delivered by Sanitation Department
Day Total
Loads Total Tons
Average Tons per
Day1
Average Tons per
Load
Average Loads per
Day1
Monday 13,052 73,648 1,416 5.6 251.0
Tuesday 11,849 63,021 1,212 5.3 227.9
Wednesday 4,581 21,475 413 4.7 88.1
Thursday 11,017 56,638 1,089 5.1 211.9
Friday 12,223 66,036 1,270 5.4 235.1
Saturday 2,039 9,476 182 4.6 39.2
Sunday 5 23 0 4.7 0.1
1. Calculated by dividing the total annual loads or tons for that day of the week by 52.
The days with the highest number of loads and highest average tons per load were Monday and Friday.
Based on conversations with City staff, material is stored at Bachman on Monday and Tuesday and
operators catch up with that material Wednesday through Saturday because they have lower volumes of
inbound loads. Wednesday and Saturday tonnage is lower than other days because Sanitation Department
collections are not scheduled to operate and there are higher numbers of residential customers utilizing the
transfer station system on these days. Further discussion about refuse, recycling and brush and bulky item
collection operations is provided in Sections 6.0 and 7.0.
0
10,000
20,000
30,000
40,000
50,000
60,000
70,000
80,000
Monday Tuesday Wednesday Thursday Friday Saturday Sunday
Total Loads Total Tons
DRAFT
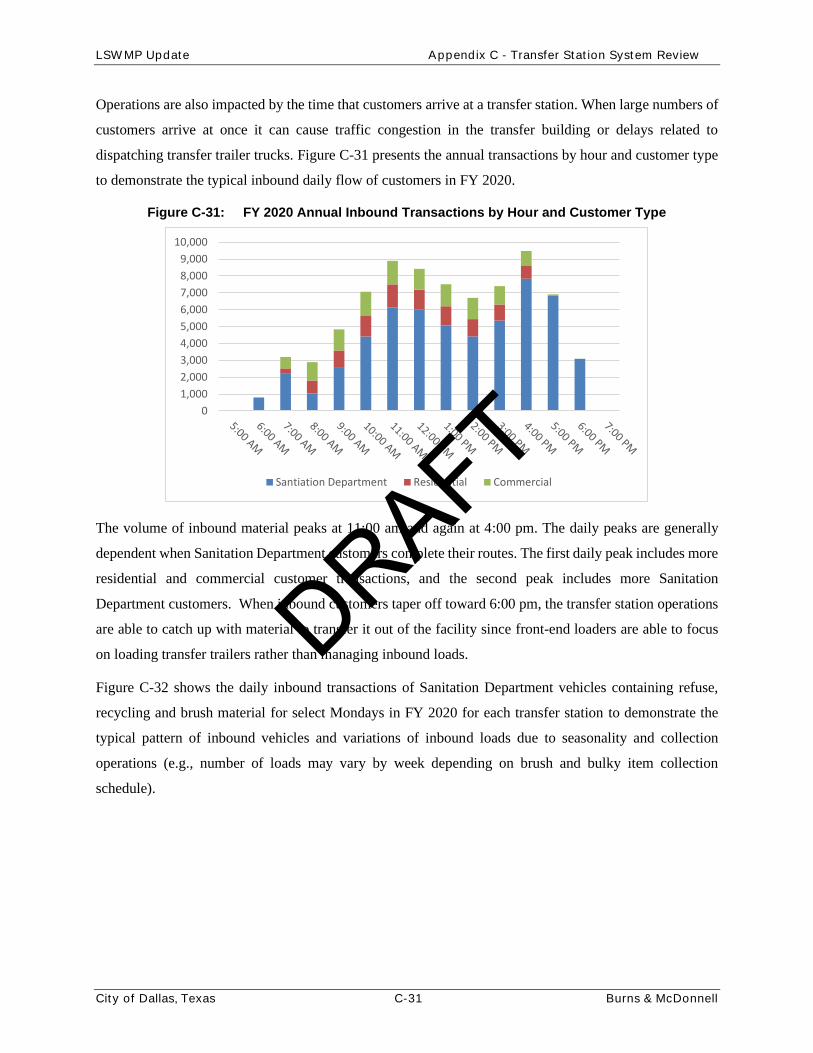
LSWMP Update Appendix C - Transfer Station System Review
City of Dallas, Texas C-31 Burns & McDonnell
Operations are also impacted by the time that customers arrive at a transfer station. When large numbers of
customers arrive at once it can cause traffic congestion in the transfer building or delays related to
dispatching transfer trailer trucks. Figure C-31 presents the annual transactions by hour and customer type
to demonstrate the typical inbound daily flow of customers in FY 2020.
Figure C-31: FY 2020 Annual Inbound Transactions by Hour and Customer Type
The volume of inbound material peaks at 11:00 am and again at 4:00 pm. The daily peaks are generally
dependent when Sanitation Department customers complete their routes. The first daily peak includes more
residential and commercial customer transactions, and the second peak includes more Sanitation
Department customers. When inbound customers taper off toward 6:00 pm, the transfer station operations
are able to catch up with material to transfer it out of the facility since front-end loaders are able to focus
on loading transfer trailers rather than managing inbound loads.
Figure C-32 shows the daily inbound transactions of Sanitation Department vehicles containing refuse,
recycling and brush material for select Mondays in FY 2020 for each transfer station to demonstrate the
typical pattern of inbound vehicles and variations of inbound loads due to seasonality and collection
operations (e.g., number of loads may vary by week depending on brush and bulky item collection
schedule).
0
1,000
2,000
3,000
4,000
5,000
6,000
7,000
8,000
9,000
10,000
Santiation Department Residential Commercial
DRAFT
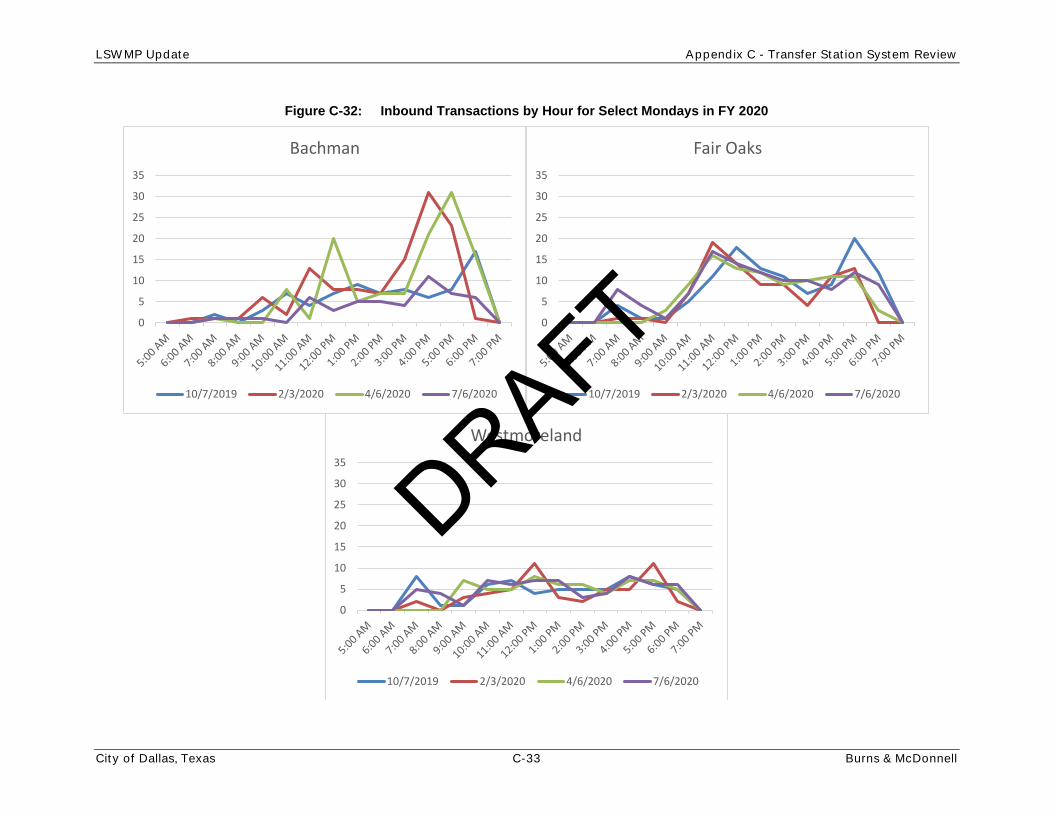
LSWMP Update Appendix C - Transfer Station System Review
City of Dallas, Texas C-33 Burns & McDonnell
Figure C-32: Inbound Transactions by Hour for Select Mondays in FY 2020
0
5
10
15
20
25
30
35
Bachman
10/7/2019 2/3/2020 4/6/2020 7/6/2020
0
5
10
15
20
25
30
35
Fair Oaks
10/7/2019 2/3/2020 4/6/2020 7/6/2020
0
5
10
15
20
25
30
35
Westmoreland
10/7/2019 2/3/2020 4/6/2020 7/6/2020
DRAFT
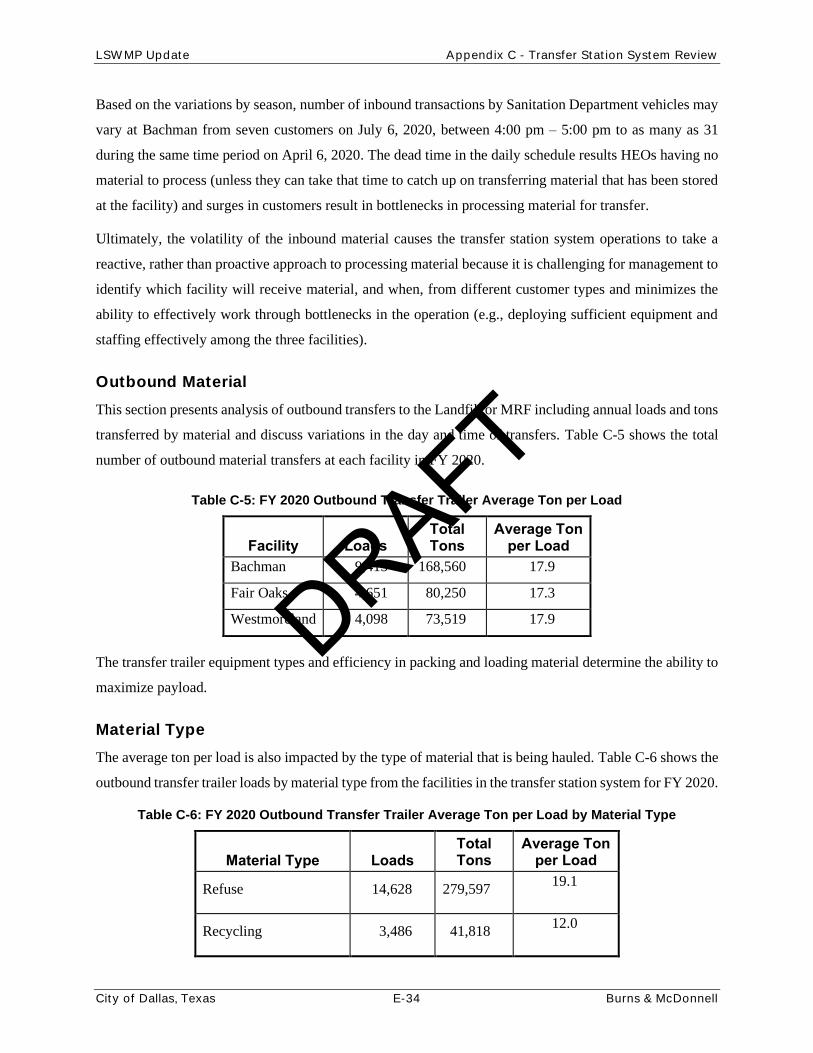
LSWMP Update Appendix C - Transfer Station System Review
City of Dallas, Texas E-34 Burns & McDonnell
Based on the variations by season, number of inbound transactions by Sanitation Department vehicles may
vary at Bachman from seven customers on July 6, 2020, between 4:00 pm – 5:00 pm to as many as 31
during the same time period on April 6, 2020. The dead time in the daily schedule results HEOs having no
material to process (unless they can take that time to catch up on transferring material that has been stored
at the facility) and surges in customers result in bottlenecks in processing material for transfer.
Ultimately, the volatility of the inbound material causes the transfer station system operations to take a
reactive, rather than proactive approach to processing material because it is challenging for management to
identify which facility will receive material, and when, from different customer types and minimizes the
ability to effectively work through bottlenecks in the operation (e.g., deploying sufficient equipment and
staffing effectively among the three facilities).
Outbound Material
This section presents analysis of outbound transfers to the Landfill or MRF including annual loads and tons
transferred by material and discuss variations in the day and time of transfers. Table C-5 shows the total
number of outbound material transfers at each facility in FY 2020.
Table C-5: FY 2020 Outbound Transfer Trailer Average Ton per Load
Facility Loads Total Tons
Average Ton per Load
Bachman 9,415 168,560 17.9
Fair Oaks 4,651 80,250 17.3
Westmoreland 4,098 73,519 17.9
The transfer trailer equipment types and efficiency in packing and loading material determine the ability to
maximize payload.
Material Type
The average ton per load is also impacted by the type of material that is being hauled. Table C-6 shows the
outbound transfer trailer loads by material type from the facilities in the transfer station system for FY 2020.
Table C-6: FY 2020 Outbound Transfer Trailer Average Ton per Load by Material Type
Material Type Loads Total Tons
Average Ton per Load
Refuse 14,628 279,597 19.1
Recycling 3,486 41,818 12.0
DRAFT
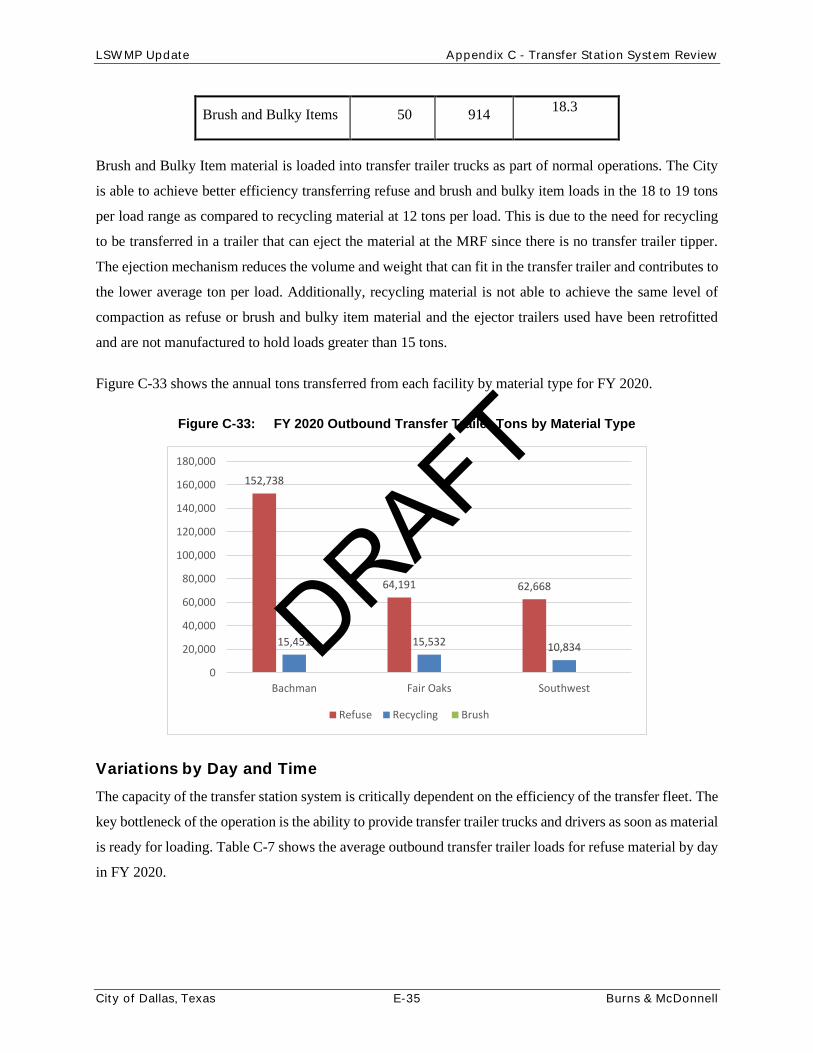
LSWMP Update Appendix C - Transfer Station System Review
City of Dallas, Texas E-35 Burns & McDonnell
Brush and Bulky Items 50 914 18.3
Brush and Bulky Item material is loaded into transfer trailer trucks as part of normal operations. The City
is able to achieve better efficiency transferring refuse and brush and bulky item loads in the 18 to 19 tons
per load range as compared to recycling material at 12 tons per load. This is due to the need for recycling
to be transferred in a trailer that can eject the material at the MRF since there is no transfer trailer tipper.
The ejection mechanism reduces the volume and weight that can fit in the transfer trailer and contributes to
the lower average ton per load. Additionally, recycling material is not able to achieve the same level of
compaction as refuse or brush and bulky item material and the ejector trailers used have been retrofitted
and are not manufactured to hold loads greater than 15 tons.
Figure C-33 shows the annual tons transferred from each facility by material type for FY 2020.
Figure C-33: FY 2020 Outbound Transfer Trailer Tons by Material Type
Variations by Day and Time
The capacity of the transfer station system is critically dependent on the efficiency of the transfer fleet. The
key bottleneck of the operation is the ability to provide transfer trailer trucks and drivers as soon as material
is ready for loading. Table C-7 shows the average outbound transfer trailer loads for refuse material by day
in FY 2020.
152,738
64,191 62,668
15,451 15,532 10,834
0
20,000
40,000
60,000
80,000
100,000
120,000
140,000
160,000
180,000
Bachman Fair Oaks Southwest
Refuse Recycling Brush
DRAFT
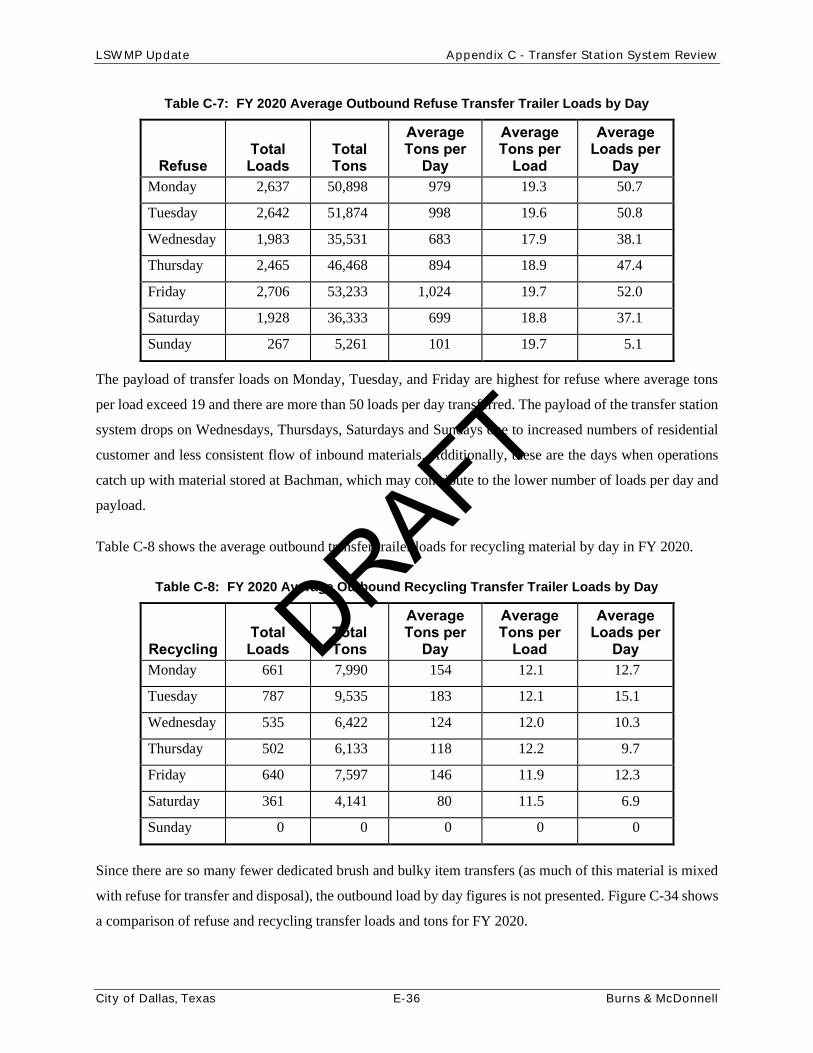
LSWMP Update Appendix C - Transfer Station System Review
City of Dallas, Texas E-36 Burns & McDonnell
Table C-7: FY 2020 Average Outbound Refuse Transfer Trailer Loads by Day
Refuse Total Loads
Total Tons
Average Tons per
Day
Average Tons per
Load
Average Loads per
Day
Monday 2,637 50,898 979 19.3 50.7
Tuesday 2,642 51,874 998 19.6 50.8
Wednesday 1,983 35,531 683 17.9 38.1
Thursday 2,465 46,468 894 18.9 47.4
Friday 2,706 53,233 1,024 19.7 52.0
Saturday 1,928 36,333 699 18.8 37.1
Sunday 267 5,261 101 19.7 5.1
The payload of transfer loads on Monday, Tuesday, and Friday are highest for refuse where average tons
per load exceed 19 and there are more than 50 loads per day transferred. The payload of the transfer station
system drops on Wednesdays, Thursdays, Saturdays and Sundays due to increased numbers of residential
customer and less consistent flow of inbound materials. Additionally, these are the days when operations
catch up with material stored at Bachman, which may contribute to the lower number of loads per day and
payload.
Table C-8 shows the average outbound transfer trailer loads for recycling material by day in FY 2020.
Table C-8: FY 2020 Average Outbound Recycling Transfer Trailer Loads by Day
Recycling Total Loads
Total Tons
Average Tons per
Day
Average Tons per
Load
Average Loads per
Day
Monday 661 7,990 154 12.1 12.7
Tuesday 787 9,535 183 12.1 15.1
Wednesday 535 6,422 124 12.0 10.3
Thursday 502 6,133 118 12.2 9.7
Friday 640 7,597 146 11.9 12.3
Saturday 361 4,141 80 11.5 6.9
Sunday 0 0 0 0 0
Since there are so many fewer dedicated brush and bulky item transfers (as much of this material is mixed
with refuse for transfer and disposal), the outbound load by day figures is not presented. Figure C-34 shows
a comparison of refuse and recycling transfer loads and tons for FY 2020.
DRAFT
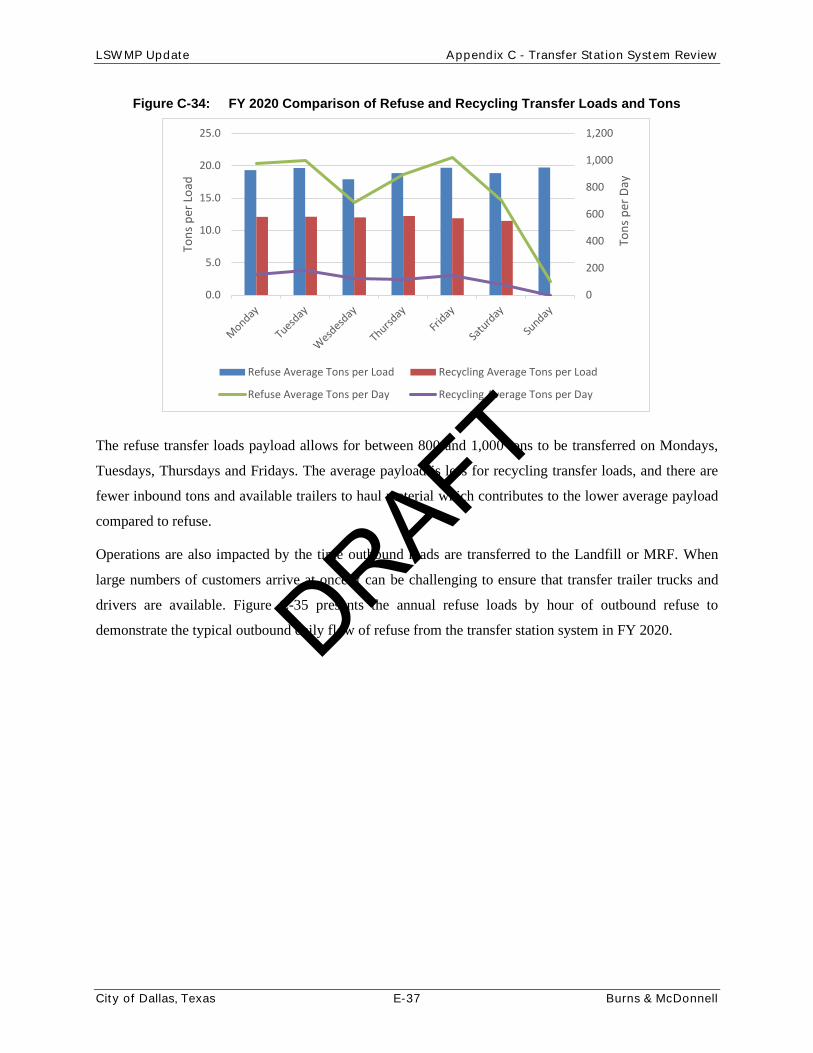
LSWMP Update Appendix C - Transfer Station System Review
City of Dallas, Texas E-37 Burns & McDonnell
Figure C-34: FY 2020 Comparison of Refuse and Recycling Transfer Loads and Tons
The refuse transfer loads payload allows for between 800 and 1,000 tons to be transferred on Mondays,
Tuesdays, Thursdays and Fridays. The average payload is less for recycling transfer loads, and there are
fewer inbound tons and available trailers to haul material which contributes to the lower average payload
compared to refuse.
Operations are also impacted by the time outbound loads are transferred to the Landfill or MRF. When
large numbers of customers arrive at once it can be challenging to ensure that transfer trailer trucks and
drivers are available. Figure C-35 presents the annual refuse loads by hour of outbound refuse to
demonstrate the typical outbound daily flow of refuse from the transfer station system in FY 2020.
0
200
400
600
800
1,000
1,200
0.0
5.0
10.0
15.0
20.0
25.0
Ton
s p
er D
ay
Ton
s p
er L
oad
Refuse Average Tons per Load Recycling Average Tons per Load
Refuse Average Tons per Day Recycling Average Tons per Day
DRAFT
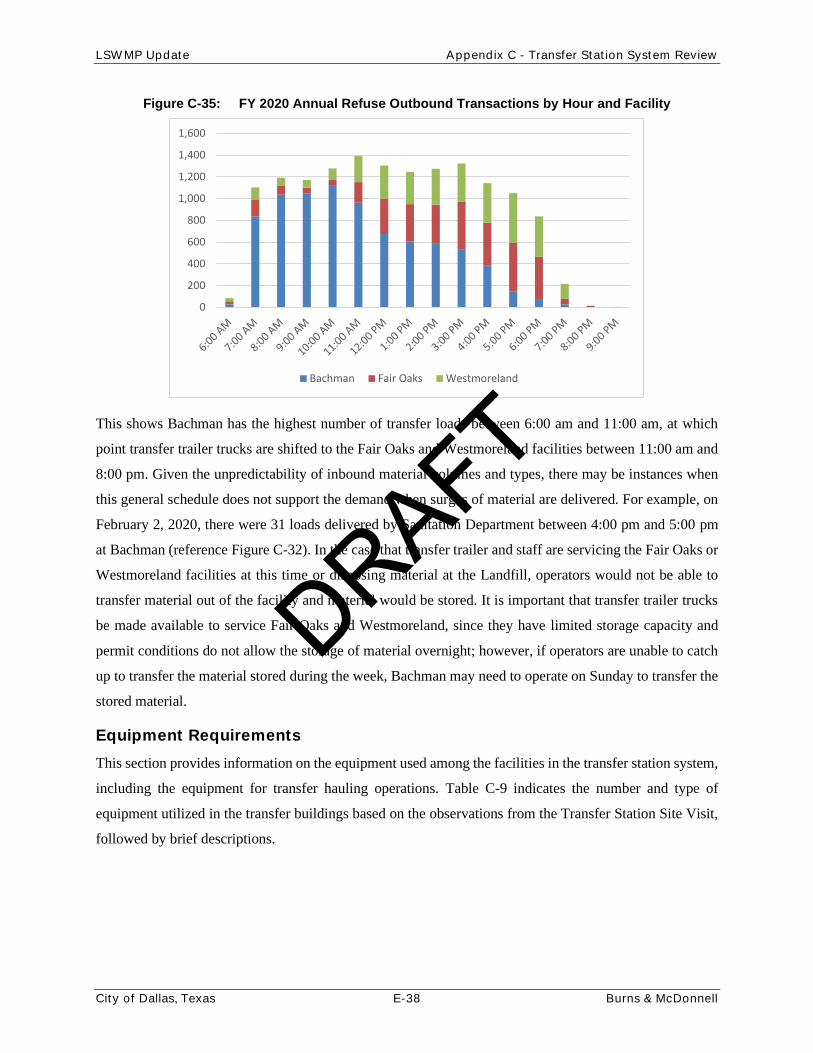
LSWMP Update Appendix C - Transfer Station System Review
City of Dallas, Texas E-38 Burns & McDonnell
Figure C-35: FY 2020 Annual Refuse Outbound Transactions by Hour and Facility
This shows Bachman has the highest number of transfer loads between 6:00 am and 11:00 am, at which
point transfer trailer trucks are shifted to the Fair Oaks and Westmoreland facilities between 11:00 am and
8:00 pm. Given the unpredictability of inbound material volumes and types, there may be instances when
this general schedule does not support the demand when surges of material are delivered. For example, on
February 2, 2020, there were 31 loads delivered by Sanitation Department between 4:00 pm and 5:00 pm
at Bachman (reference Figure C-32). In the case that transfer trailer and staff are servicing the Fair Oaks or
Westmoreland facilities at this time or disposing material at the Landfill, operators would not be able to
transfer material out of the facility and material would be stored. It is important that transfer trailer trucks
be made available to service Fair Oaks and Westmoreland, since they have limited storage capacity and
permit conditions do not allow the storage of material overnight; however, if operators are unable to catch
up to transfer the material stored during the week, Bachman may need to operate on Sunday to transfer the
stored material.
Equipment Requirements
This section provides information on the equipment used among the facilities in the transfer station system,
including the equipment for transfer hauling operations. Table C-9 indicates the number and type of
equipment utilized in the transfer buildings based on the observations from the Transfer Station Site Visit,
followed by brief descriptions.
0
200
400
600
800
1,000
1,200
1,400
1,600
Bachman Fair Oaks Westmoreland
DRAFT
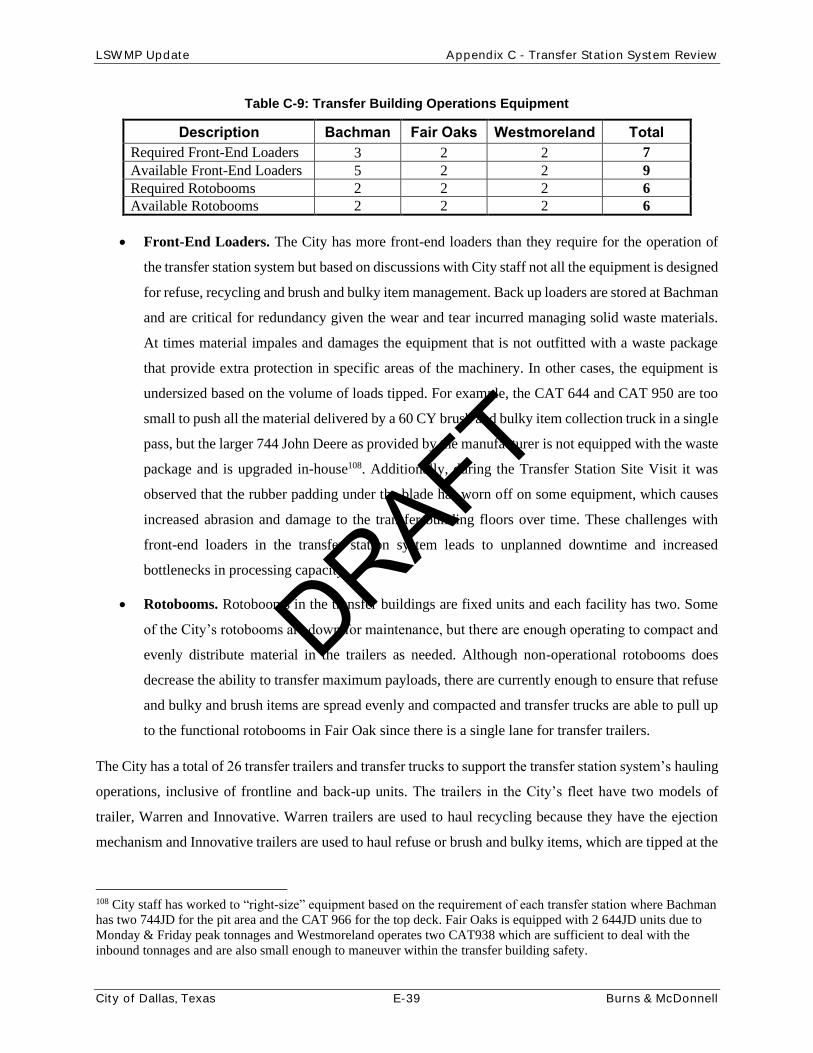
LSWMP Update Appendix C - Transfer Station System Review
City of Dallas, Texas E-39 Burns & McDonnell
Table C-9: Transfer Building Operations Equipment
Description Bachman Fair Oaks Westmoreland Total
Required Front-End Loaders 3 2 2 7
Available Front-End Loaders 5 2 2 9
Required Rotobooms 2 2 2 6
Available Rotobooms 2 2 2 6
• Front-End Loaders. The City has more front-end loaders than they require for the operation of
the transfer station system but based on discussions with City staff not all the equipment is designed
for refuse, recycling and brush and bulky item management. Back up loaders are stored at Bachman
and are critical for redundancy given the wear and tear incurred managing solid waste materials.
At times material impales and damages the equipment that is not outfitted with a waste package
that provide extra protection in specific areas of the machinery. In other cases, the equipment is
undersized based on the volume of loads tipped. For example, the CAT 644 and CAT 950 are too
small to push all the material delivered by a 60 CY brush and bulky item collection truck in a single
pass, but the larger 744 John Deere as provided by the manufacturer is not equipped with the waste
package and is upgraded in-house108. Additionally, during the Transfer Station Site Visit it was
observed that the rubber padding under the blade has worn off on some equipment, which causes
increased abrasion and damage to the transfer building floors over time. These challenges with
front-end loaders in the transfer station system leads to unplanned downtime and increased
bottlenecks in processing capacity.
• Rotobooms. Rotobooms in the transfer buildings are fixed units and each facility has two. Some
of the City’s rotobooms are down for maintenance, but there are enough operating to compact and
evenly distribute material in the trailers as needed. Although non-operational rotobooms does
decrease the ability to transfer maximum payloads, there are currently enough to ensure that refuse
and bulky and brush items are spread evenly and compacted and transfer trucks are able to pull up
to the functional rotobooms in Fair Oak since there is a single lane for transfer trailers.
The City has a total of 26 transfer trailers and transfer trucks to support the transfer station system’s hauling
operations, inclusive of frontline and back-up units. The trailers in the City’s fleet have two models of
trailer, Warren and Innovative. Warren trailers are used to haul recycling because they have the ejection
mechanism and Innovative trailers are used to haul refuse or brush and bulky items, which are tipped at the
108 City staff has worked to “right-size” equipment based on the requirement of each transfer station where Bachman
has two 744JD for the pit area and the CAT 966 for the top deck. Fair Oaks is equipped with 2 644JD units due to
Monday & Friday peak tonnages and Westmoreland operates two CAT938 which are sufficient to deal with the
inbound tonnages and are also small enough to maneuver within the transfer building safety.
DRAFT
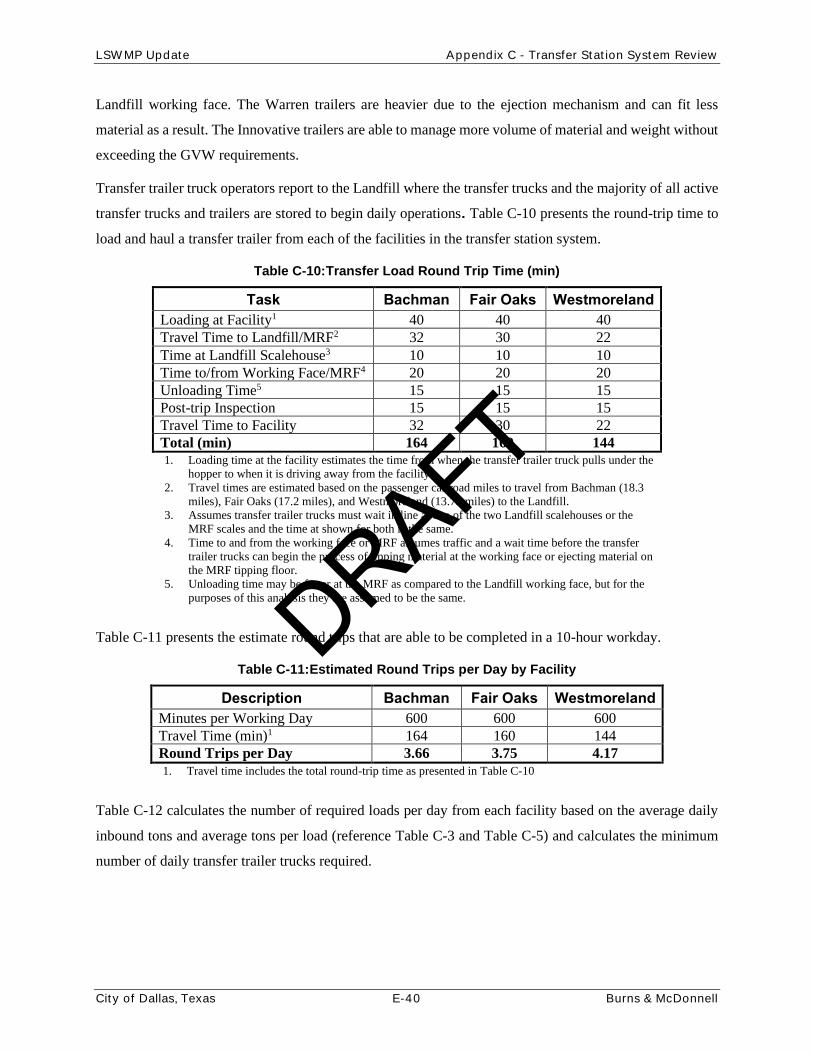
LSWMP Update Appendix C - Transfer Station System Review
City of Dallas, Texas E-40 Burns & McDonnell
Landfill working face. The Warren trailers are heavier due to the ejection mechanism and can fit less
material as a result. The Innovative trailers are able to manage more volume of material and weight without
exceeding the GVW requirements.
Transfer trailer truck operators report to the Landfill where the transfer trucks and the majority of all active
transfer trucks and trailers are stored to begin daily operations. Table C-10 presents the round-trip time to
load and haul a transfer trailer from each of the facilities in the transfer station system.
Table C-10: Transfer Load Round Trip Time (min)
Task Bachman Fair Oaks Westmoreland
Loading at Facility1 40 40 40
Travel Time to Landfill/MRF2 32 30 22
Time at Landfill Scalehouse3 10 10 10
Time to/from Working Face/MRF4 20 20 20
Unloading Time5 15 15 15
Post-trip Inspection 15 15 15
Travel Time to Facility 32 30 22
Total (min) 164 160 144
1. Loading time at the facility estimates the time from when the transfer trailer truck pulls under the
hopper to when it is driving away from the facility.
2. Travel times are estimated based on the passenger car road miles to travel from Bachman (18.3
miles), Fair Oaks (17.2 miles), and Westmoreland (13.75 miles) to the Landfill.
3. Assumes transfer trailer trucks must wait in line at one of the two Landfill scalehouses or the
MRF scales and the time at shown for both is the same.
4. Time to and from the working face or MRF assumes traffic and a wait time before the transfer
trailer trucks can begin the process of tipping material at the working face or ejecting material on
the MRF tipping floor.
5. Unloading time may be faster at the MRF as compared to the Landfill working face, but for the
purposes of this analysis they are assumed to be the same.
Table C-11 presents the estimate round trips that are able to be completed in a 10-hour workday.
Table C-11: Estimated Round Trips per Day by Facility
Description Bachman Fair Oaks Westmoreland
Minutes per Working Day 600 600 600
Travel Time (min)1 164 160 144
Round Trips per Day 3.66 3.75 4.17
1. Travel time includes the total round-trip time as presented in Table C-10
Table C-12 calculates the number of required loads per day from each facility based on the average daily
inbound tons and average tons per load (reference Table C-3 and Table C-5) and calculates the minimum
number of daily transfer trailer trucks required.
DRAFT
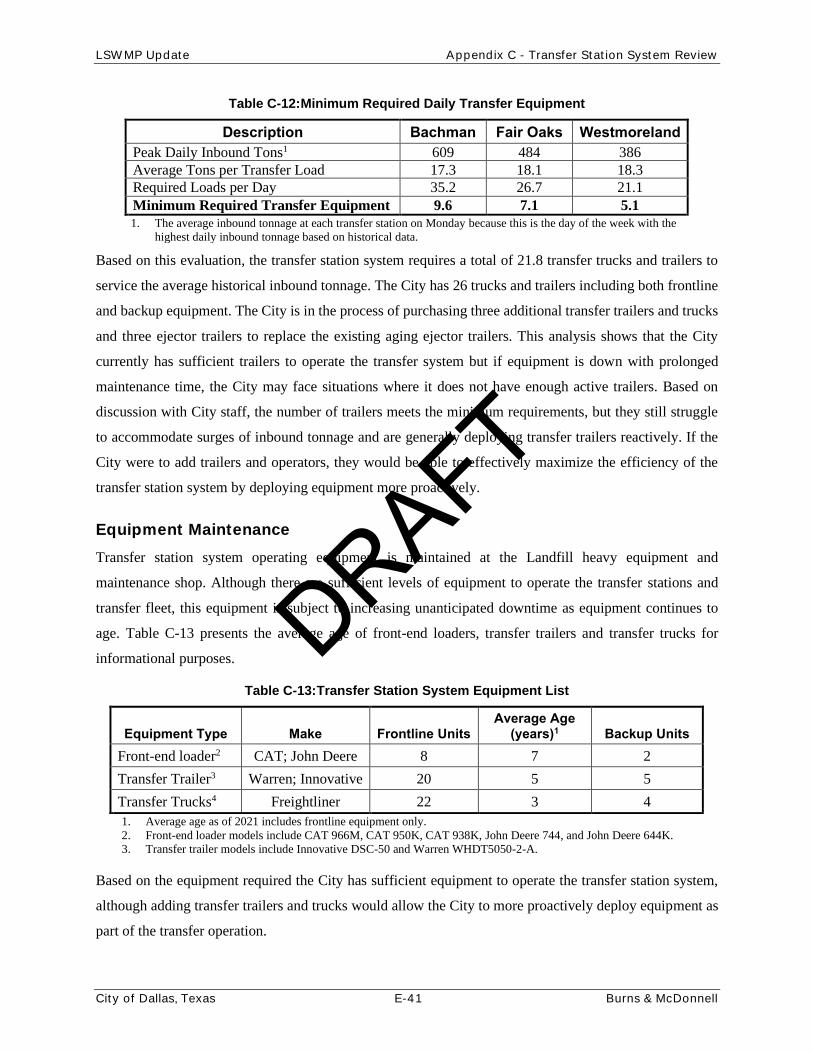
LSWMP Update Appendix C - Transfer Station System Review
City of Dallas, Texas E-41 Burns & McDonnell
Table C-12: Minimum Required Daily Transfer Equipment
Description Bachman Fair Oaks Westmoreland
Peak Daily Inbound Tons1 609 484 386
Average Tons per Transfer Load 17.3 18.1 18.3
Required Loads per Day 35.2 26.7 21.1
Minimum Required Transfer Equipment 9.6 7.1 5.1
1. The average inbound tonnage at each transfer station on Monday because this is the day of the week with the
highest daily inbound tonnage based on historical data.
Based on this evaluation, the transfer station system requires a total of 21.8 transfer trucks and trailers to
service the average historical inbound tonnage. The City has 26 trucks and trailers including both frontline
and backup equipment. The City is in the process of purchasing three additional transfer trailers and trucks
and three ejector trailers to replace the existing aging ejector trailers. This analysis shows that the City
currently has sufficient trailers to operate the transfer system but if equipment is down with prolonged
maintenance time, the City may face situations where it does not have enough active trailers. Based on
discussion with City staff, the number of trailers meets the minimum requirements, but they still struggle
to accommodate surges of inbound tonnage and are generally deploying transfer trailers reactively. If the
City were to add trailers and operators, they would be able to effectively maximize the efficiency of the
transfer station system by deploying equipment more proactively.
Equipment Maintenance
Transfer station system operating equipment is maintained at the Landfill heavy equipment and
maintenance shop. Although there are sufficient levels of equipment to operate the transfer stations and
transfer fleet, this equipment is subject to increasing unanticipated downtime as equipment continues to
age. Table C-13 presents the average age of front-end loaders, transfer trailers and transfer trucks for
informational purposes.
Table C-13: Transfer Station System Equipment List
Equipment Type Make Frontline Units Average Age
(years)1 Backup Units
Front-end loader2 CAT; John Deere 8 7 2
Transfer Trailer3 Warren; Innovative 20 5 5
Transfer Trucks4 Freightliner 22 3 4
1. Average age as of 2021 includes frontline equipment only.
2. Front-end loader models include CAT 966M, CAT 950K, CAT 938K, John Deere 744, and John Deere 644K.
3. Transfer trailer models include Innovative DSC-50 and Warren WHDT5050-2-A.
Based on the equipment required the City has sufficient equipment to operate the transfer station system,
although adding transfer trailers and trucks would allow the City to more proactively deploy equipment as
part of the transfer operation.
DRAFT
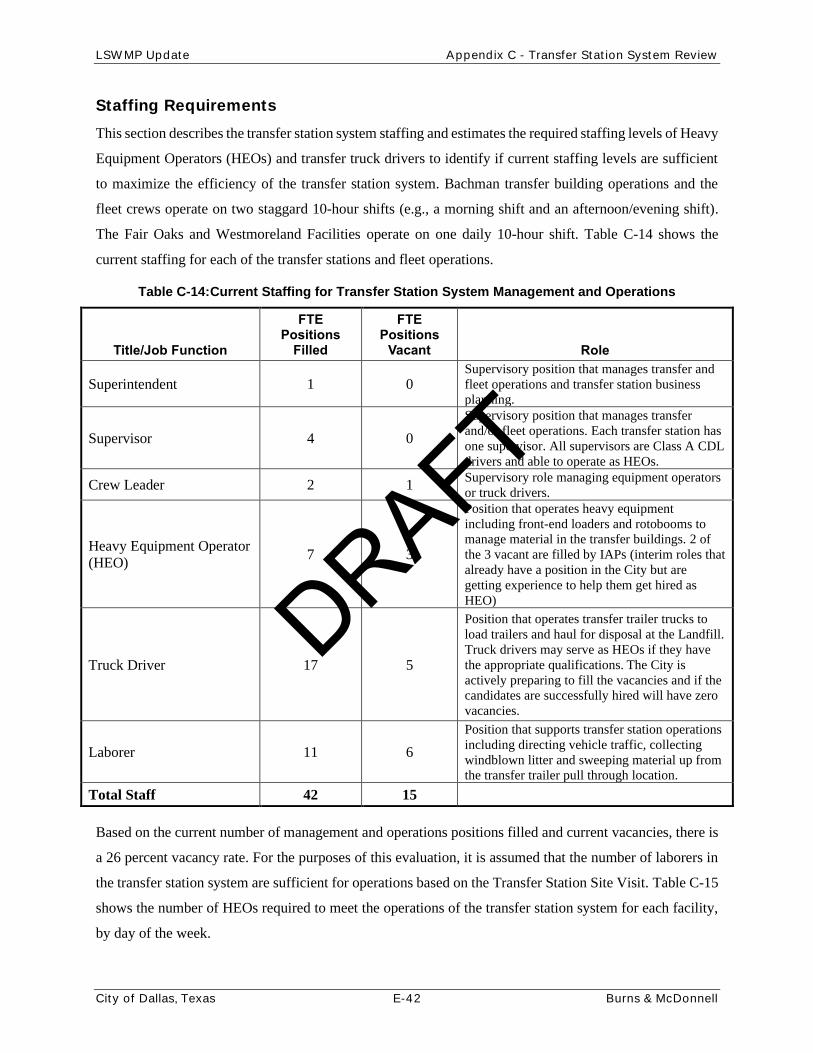
LSWMP Update Appendix C - Transfer Station System Review
City of Dallas, Texas E-42 Burns & McDonnell
Staffing Requirements
This section describes the transfer station system staffing and estimates the required staffing levels of Heavy
Equipment Operators (HEOs) and transfer truck drivers to identify if current staffing levels are sufficient
to maximize the efficiency of the transfer station system. Bachman transfer building operations and the
fleet crews operate on two staggard 10-hour shifts (e.g., a morning shift and an afternoon/evening shift).
The Fair Oaks and Westmoreland Facilities operate on one daily 10-hour shift. Table C-14 shows the
current staffing for each of the transfer stations and fleet operations.
Table C-14: Current Staffing for Transfer Station System Management and Operations
Title/Job Function
FTE Positions
Filled
FTE Positions
Vacant Role
Superintendent 1 0 Supervisory position that manages transfer and
fleet operations and transfer station business
planning.
Supervisor 4 0
Supervisory position that manages transfer
and/or fleet operations. Each transfer station has
one supervisor. All supervisors are Class A CDL
drivers and able to operate as HEOs.
Crew Leader 2 1 Supervisory role managing equipment operators
or truck drivers.
Heavy Equipment Operator
(HEO) 7 3
Position that operates heavy equipment
including front-end loaders and rotobooms to
manage material in the transfer buildings. 2 of
the 3 vacant are filled by IAPs (interim roles that
already have a position in the City but are
getting experience to help them get hired as
HEO)
Truck Driver 17 5
Position that operates transfer trailer trucks to
load trailers and haul for disposal at the Landfill.
Truck drivers may serve as HEOs if they have
the appropriate qualifications. The City is
actively preparing to fill the vacancies and if the
candidates are successfully hired will have zero
vacancies.
Laborer 11 6
Position that supports transfer station operations
including directing vehicle traffic, collecting
windblown litter and sweeping material up from
the transfer trailer pull through location.
Total Staff 42 15
Based on the current number of management and operations positions filled and current vacancies, there is
a 26 percent vacancy rate. For the purposes of this evaluation, it is assumed that the number of laborers in
the transfer station system are sufficient for operations based on the Transfer Station Site Visit. Table C-15
shows the number of HEOs required to meet the operations of the transfer station system for each facility,
by day of the week.
DRAFT
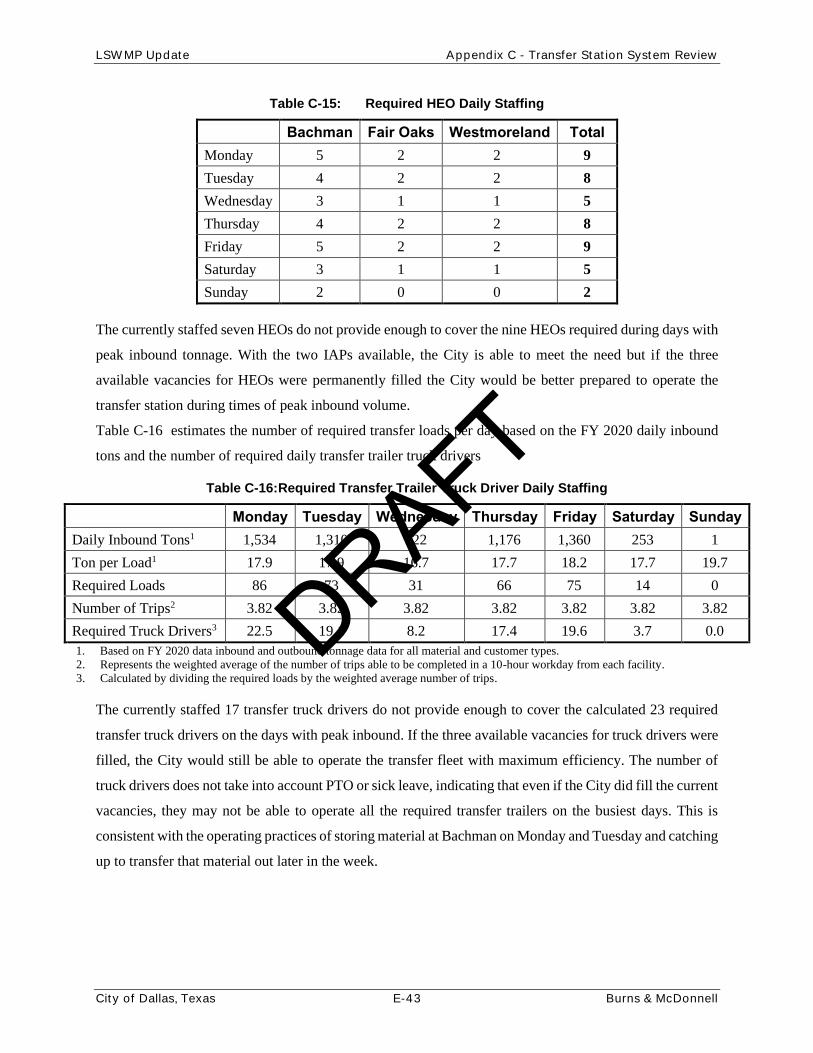
LSWMP Update Appendix C - Transfer Station System Review
City of Dallas, Texas E-43 Burns & McDonnell
Table C-15: Required HEO Daily Staffing
Bachman Fair Oaks Westmoreland Total
Monday 5 2 2 9
Tuesday 4 2 2 8
Wednesday 3 1 1 5
Thursday 4 2 2 8
Friday 5 2 2 9
Saturday 3 1 1 5
Sunday 2 0 0 2
The currently staffed seven HEOs do not provide enough to cover the nine HEOs required during days with
peak inbound tonnage. With the two IAPs available, the City is able to meet the need but if the three
available vacancies for HEOs were permanently filled the City would be better prepared to operate the
transfer station during times of peak inbound volume.
Table C-16 estimates the number of required transfer loads per day based on the FY 2020 daily inbound
tons and the number of required daily transfer trailer truck drivers
Table C-16: Required Transfer Trailer Truck Driver Daily Staffing
Monday Tuesday Wednesday Thursday Friday Saturday Sunday
Daily Inbound Tons1 1,534 1,310 522 1,176 1,360 253 1
Ton per Load1 17.9 17.9 16.7 17.7 18.2 17.7 19.7
Required Loads 86 73 31 66 75 14 0
Number of Trips2 3.82 3.82 3.82 3.82 3.82 3.82 3.82
Required Truck Drivers3 22.5 19.1 8.2 17.4 19.6 3.7 0.0
1. Based on FY 2020 data inbound and outbound tonnage data for all material and customer types.
2. Represents the weighted average of the number of trips able to be completed in a 10-hour workday from each facility.
3. Calculated by dividing the required loads by the weighted average number of trips.
The currently staffed 17 transfer truck drivers do not provide enough to cover the calculated 23 required
transfer truck drivers on the days with peak inbound. If the three available vacancies for truck drivers were
filled, the City would still be able to operate the transfer fleet with maximum efficiency. The number of
truck drivers does not take into account PTO or sick leave, indicating that even if the City did fill the current
vacancies, they may not be able to operate all the required transfer trailers on the busiest days. This is
consistent with the operating practices of storing material at Bachman on Monday and Tuesday and catching
up to transfer that material out later in the week.
DRAFT
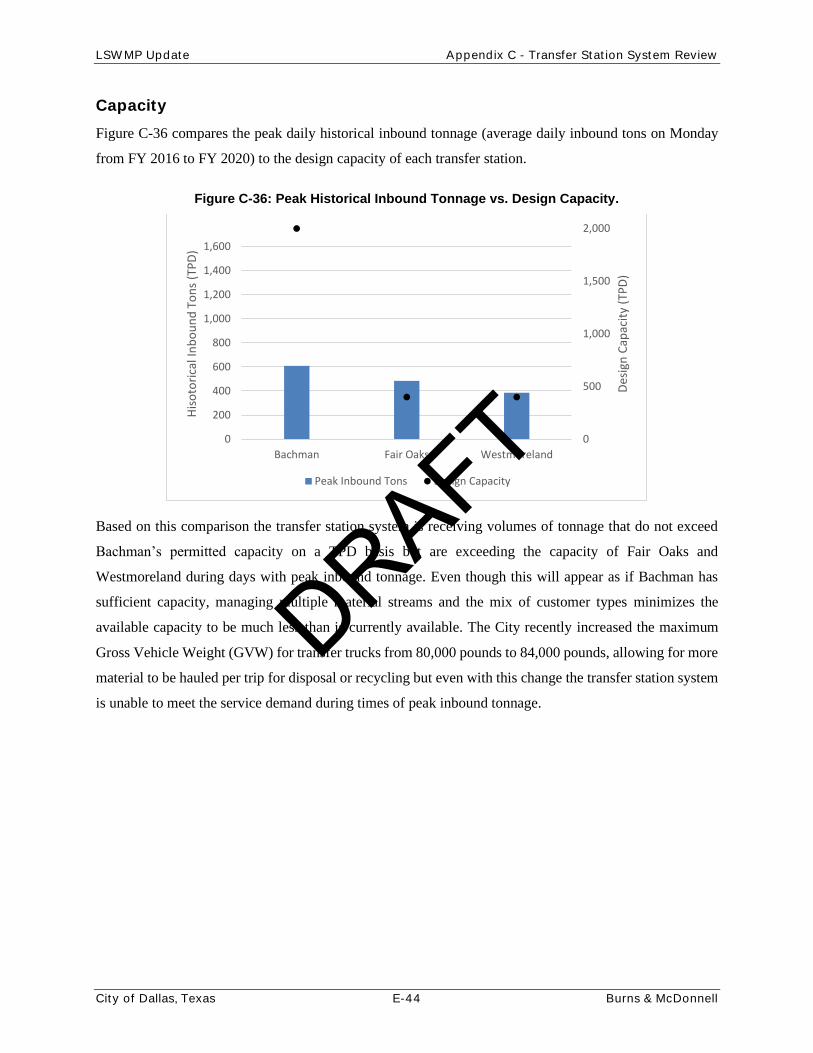
LSWMP Update Appendix C - Transfer Station System Review
City of Dallas, Texas E-44 Burns & McDonnell
Capacity
Figure C-36 compares the peak daily historical inbound tonnage (average daily inbound tons on Monday
from FY 2016 to FY 2020) to the design capacity of each transfer station.
Figure C-36: Peak Historical Inbound Tonnage vs. Design Capacity.
Based on this comparison the transfer station system is receiving volumes of tonnage that do not exceed
Bachman’s permitted capacity on a TPD basis but are exceeding the capacity of Fair Oaks and
Westmoreland during days with peak inbound tonnage. Even though this will appear as if Bachman has
sufficient capacity, managing multiple material streams and the mix of customer types minimizes the
available capacity to be much less than is currently available. The City recently increased the maximum
Gross Vehicle Weight (GVW) for transfer trucks from 80,000 pounds to 84,000 pounds, allowing for more
material to be hauled per trip for disposal or recycling but even with this change the transfer station system
is unable to meet the service demand during times of peak inbound tonnage.
0
500
1,000
1,500
2,000
0
200
400
600
800
1,000
1,200
1,400
1,600
Bachman Fair Oaks Westmoreland
Des
ign
Cap
acit
y (T
PD
)
His
oto
rica
l In
bo
un
d T
on
s (T
PD
)
Peak Inbound Tons Design Capacity
DRAFT
LSWMP Update Appendix D - Refuse and Recycling Collection
City of Dallas, Texas E-1 Burns & McDonnell
APPENDIX D - REFUSE AND RECYCLING COLLECTION
Methodology
As part of the LSWMP Update, select on-route refuse and recycling collection operations were observed
on February 8 and 9, 2021 (Collection Operation Observations) including alley and curbside service
provided by Automated Side Load (ASL) and Semi-Automated (SA) collection vehicles. Additionally,
discussions were held with various members of management and staff to discuss ongoing operations and
collect data which is incorporated in this section.
Based on Collection Operation Observations, data analysis and discussions with City staff the following
provides an overview of the refuse and recycling collection operation and current challenges to inform the
development of options for the City’s consideration.
Collection Overview
The City’s refuse and recycling collection operation services approximately 250,000 households from
among five collection districts. The following refuse and recycling collection services are provided by the
Sanitation Department (further discussion of brush and bulky item collection services, including yard
trimmings, is provided in Section 7.0):
1. Refuse. Once per week collection and disposal of refuse contained in 64 and 96-gallon carts from
approximately 250,000 households. All residential customers receive refuse collection from City
crews and residents are able to request additional carts for a fee. The City also provides Packout
services at an additional charge for collection on private drives.
2. Recycling. Once per week collection and processing of recyclables contained in 96-gallon carts
from approximately 250,000 households. Recycling collection is voluntary, and residential
customers may elect not to receive this service resulting in fewer recycling households serviced.
3. Commercial. Collection is provided to a limited number of commercial customers via roll carts.
Multi-family and commercial properties may receive service for up to 10 refuse and 10 recycling
roll carts. The City collects a small number of larger solid waste dumpsters.
Chapter 18 of the City’s Code of Ordinances establishes that collection services, including collection,
removal, disposal and processing of refuse and recycling must be provided by the Sanitation Department
for all residences and duplexes. Collection service may not be performed by other entities. Chapter 18-4
defines the collection of refuse and recycling from residences and duplexes by any other entities besides
the Sanitation Department as an offense unless they are:
DRAFT
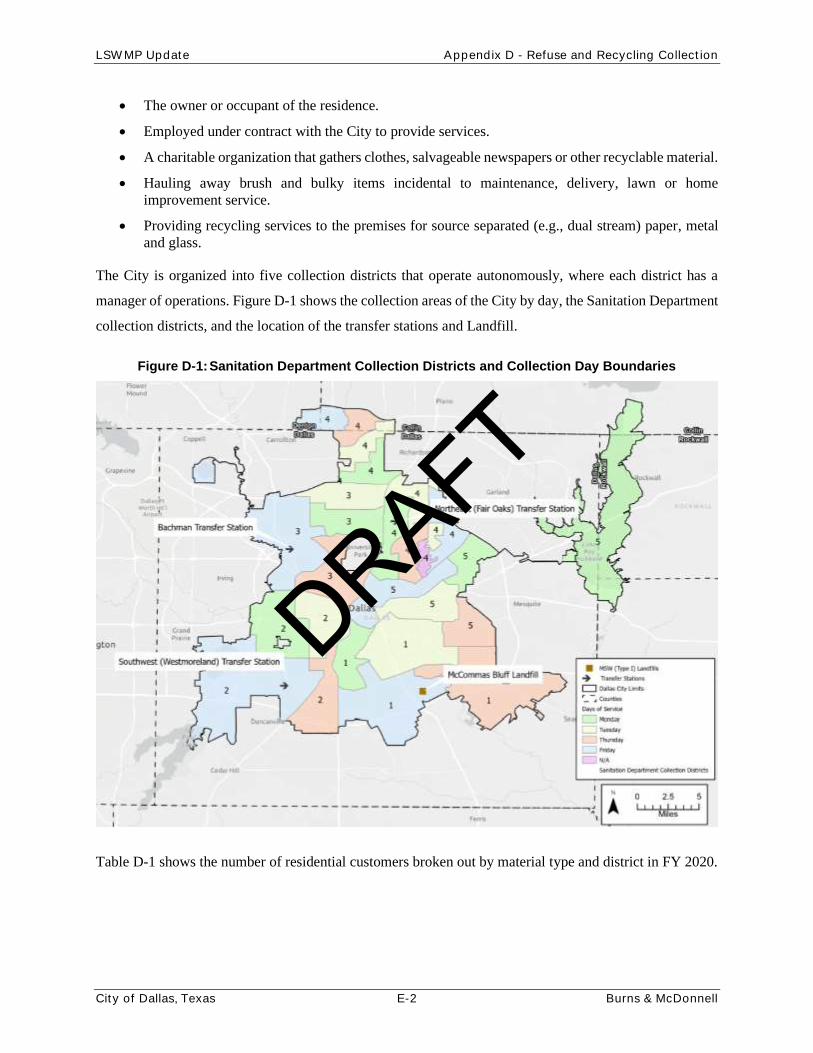
LSWMP Update Appendix D - Refuse and Recycling Collection
City of Dallas, Texas E-2 Burns & McDonnell
• The owner or occupant of the residence.
• Employed under contract with the City to provide services.
• A charitable organization that gathers clothes, salvageable newspapers or other recyclable material.
• Hauling away brush and bulky items incidental to maintenance, delivery, lawn or home
improvement service.
• Providing recycling services to the premises for source separated (e.g., dual stream) paper, metal
and glass.
The City is organized into five collection districts that operate autonomously, where each district has a
manager of operations. Figure D-1 shows the collection areas of the City by day, the Sanitation Department
collection districts, and the location of the transfer stations and Landfill.
Figure D-1: Sanitation Department Collection Districts and Collection Day Boundaries
Table D-1 shows the number of residential customers broken out by material type and district in FY 2020.
DRAFT
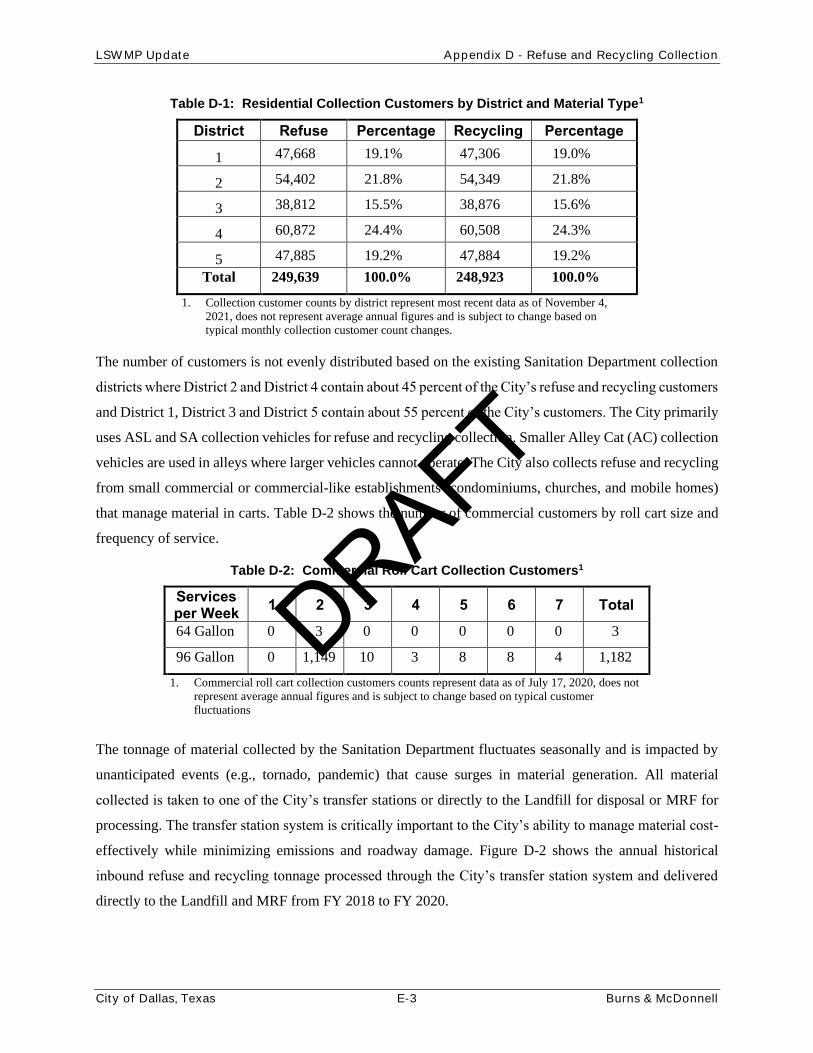
LSWMP Update Appendix D - Refuse and Recycling Collection
City of Dallas, Texas E-3 Burns & McDonnell
Table D-1: Residential Collection Customers by District and Material Type1
District Refuse Percentage Recycling Percentage
1 47,668 19.1% 47,306 19.0%
2 54,402 21.8% 54,349 21.8%
3 38,812 15.5% 38,876 15.6%
4 60,872 24.4% 60,508 24.3%
5 47,885 19.2% 47,884 19.2%
Total 249,639 100.0% 248,923 100.0%
1. Collection customer counts by district represent most recent data as of November 4,
2021, does not represent average annual figures and is subject to change based on
typical monthly collection customer count changes.
The number of customers is not evenly distributed based on the existing Sanitation Department collection
districts where District 2 and District 4 contain about 45 percent of the City’s refuse and recycling customers
and District 1, District 3 and District 5 contain about 55 percent of the City’s customers. The City primarily
uses ASL and SA collection vehicles for refuse and recycling collection. Smaller Alley Cat (AC) collection
vehicles are used in alleys where larger vehicles cannot operate. The City also collects refuse and recycling
from small commercial or commercial-like establishments (condominiums, churches, and mobile homes)
that manage material in carts. Table D-2 shows the number of commercial customers by roll cart size and
frequency of service.
Table D-2: Commercial Roll Cart Collection Customers1
Services per Week
1 2 3 4 5 6 7 Total
64 Gallon 0 3 0 0 0 0 0 3
96 Gallon 0 1,149 10 3 8 8 4 1,182
1. Commercial roll cart collection customers counts represent data as of July 17, 2020, does not
represent average annual figures and is subject to change based on typical customer
fluctuations
The tonnage of material collected by the Sanitation Department fluctuates seasonally and is impacted by
unanticipated events (e.g., tornado, pandemic) that cause surges in material generation. All material
collected is taken to one of the City’s transfer stations or directly to the Landfill for disposal or MRF for
processing. The transfer station system is critically important to the City’s ability to manage material cost-
effectively while minimizing emissions and roadway damage. Figure D-2 shows the annual historical
inbound refuse and recycling tonnage processed through the City’s transfer station system and delivered
directly to the Landfill and MRF from FY 2018 to FY 2020.
DRAFT
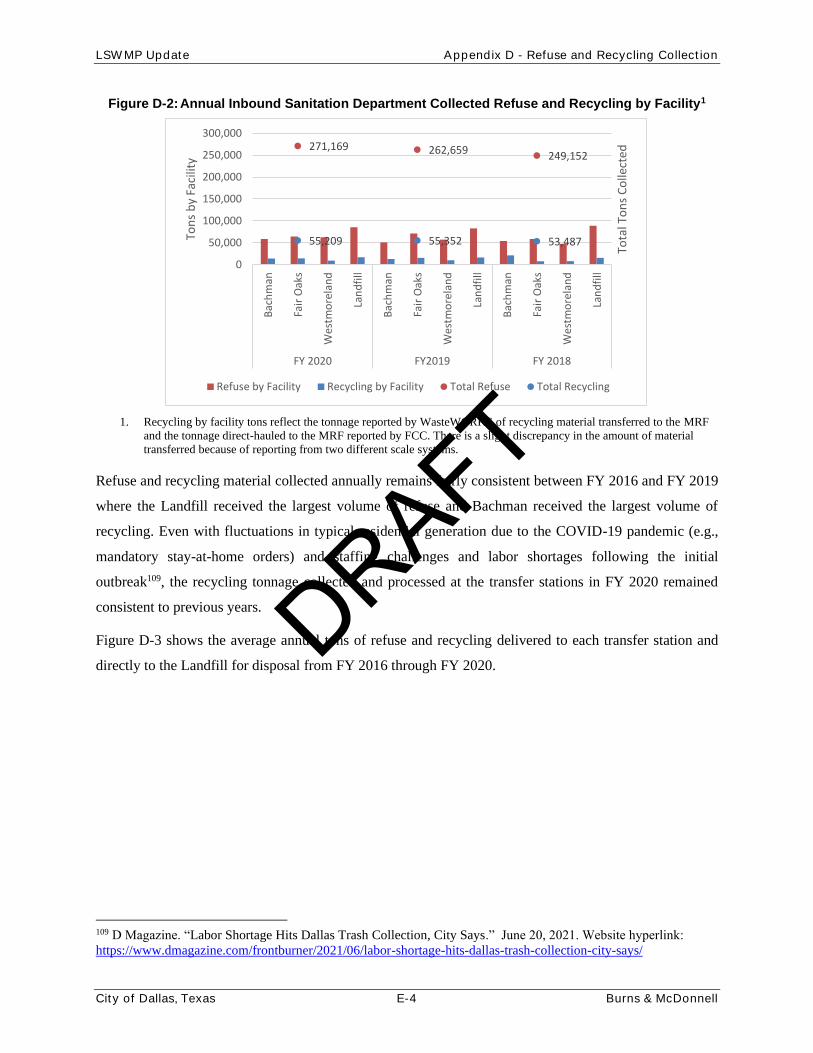
LSWMP Update Appendix D - Refuse and Recycling Collection
City of Dallas, Texas E-4 Burns & McDonnell
Figure D-2: Annual Inbound Sanitation Department Collected Refuse and Recycling by Facility1
1. Recycling by facility tons reflect the tonnage reported by WasteWORKS of recycling material transferred to the MRF
and the tonnage direct-hauled to the MRF reported by FCC. There is a slight discrepancy in the amount of material
transferred because of reporting from two different scale systems.
Refuse and recycling material collected annually remains fairly consistent between FY 2016 and FY 2019
where the Landfill received the largest volume of refuse and Bachman received the largest volume of
recycling. Even with fluctuations in typical residential generation due to the COVID-19 pandemic (e.g.,
mandatory stay-at-home orders) and staffing challenges and labor shortages following the initial
outbreak109, the recycling tonnage collected and processed at the transfer stations in FY 2020 remained
consistent to previous years.
Figure D-3 shows the average annual tons of refuse and recycling delivered to each transfer station and
directly to the Landfill for disposal from FY 2016 through FY 2020.
109 D Magazine. “Labor Shortage Hits Dallas Trash Collection, City Says.” June 20, 2021. Website hyperlink:
https://www.dmagazine.com/frontburner/2021/06/labor-shortage-hits-dallas-trash-collection-city-says/
271,169 262,659 249,152
55,209 55,352 53,487
0
50,000
100,000
150,000
200,000
250,000
300,000
Bac
hm
an
Fair
Oak
s
Wes
tmo
rela
nd
Lan
dfi
ll
Bac
hm
an
Fair
Oak
s
Wes
tmo
rela
nd
Lan
dfi
ll
Bac
hm
an
Fair
Oak
s
Wes
tmo
rela
nd
Lan
dfi
ll
FY 2020 FY2019 FY 2018
Tota
l To
ns
Co
llect
ed
Ton
s b
y Fa
cilit
y
Refuse by Facility Recycling by Facility Total Refuse Total Recycling
DRAFT
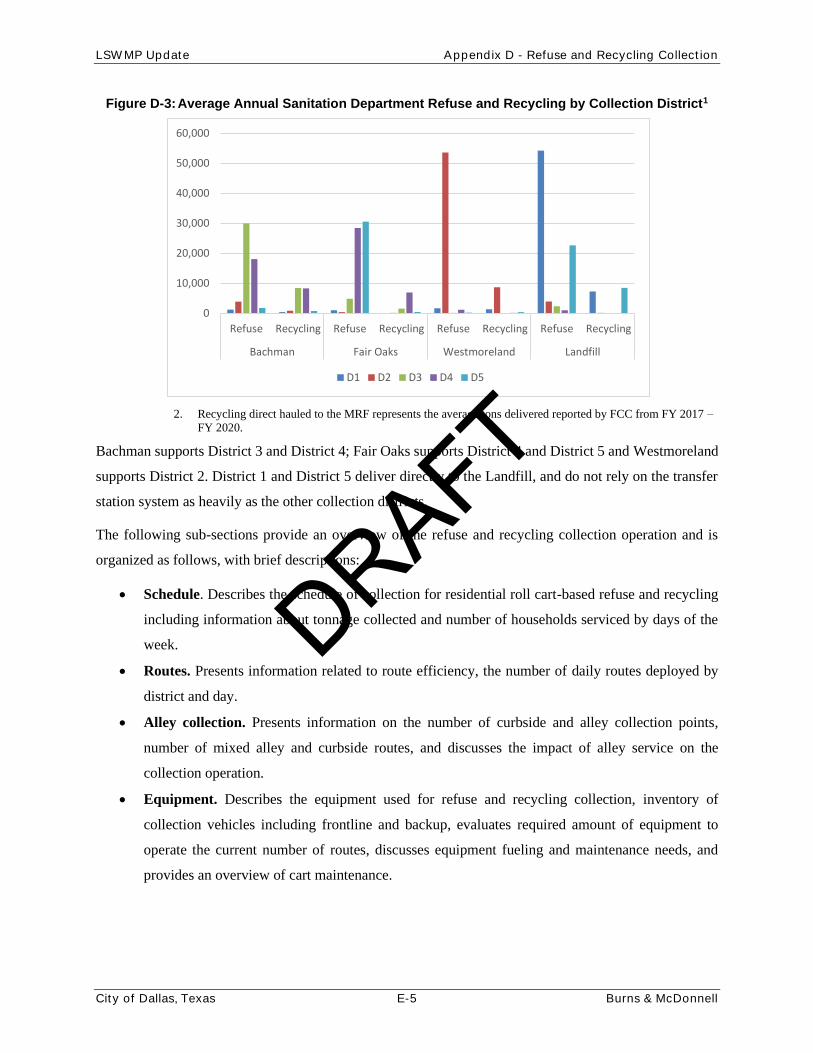
LSWMP Update Appendix D - Refuse and Recycling Collection
City of Dallas, Texas E-5 Burns & McDonnell
Figure D-3: Average Annual Sanitation Department Refuse and Recycling by Collection District1
2. Recycling direct hauled to the MRF represents the average tons delivered reported by FCC from FY 2017 –
FY 2020.
Bachman supports District 3 and District 4; Fair Oaks supports District 4 and District 5 and Westmoreland
supports District 2. District 1 and District 5 deliver directly to the Landfill, and do not rely on the transfer
station system as heavily as the other collection districts.
The following sub-sections provide an overview of the refuse and recycling collection operation and is
organized as follows, with brief descriptions:
• Schedule. Describes the schedule of collection for residential roll cart-based refuse and recycling
including information about tonnage collected and number of households serviced by days of the
week.
• Routes. Presents information related to route efficiency, the number of daily routes deployed by
district and day.
• Alley collection. Presents information on the number of curbside and alley collection points,
number of mixed alley and curbside routes, and discusses the impact of alley service on the
collection operation.
• Equipment. Describes the equipment used for refuse and recycling collection, inventory of
collection vehicles including frontline and backup, evaluates required amount of equipment to
operate the current number of routes, discusses equipment fueling and maintenance needs, and
provides an overview of cart maintenance.
0
10,000
20,000
30,000
40,000
50,000
60,000
Refuse Recycling Refuse Recycling Refuse Recycling Refuse Recycling
Bachman Fair Oaks Westmoreland Landfill
D1 D2 D3 D4 D5
DRAFT
LSWMP Update Appendix D - Refuse and Recycling Collection
City of Dallas, Texas E-6 Burns & McDonnell
• Staffing requirements. Presents information on the current staffing positions by district and
evaluates staffing requirements to operate the residential cart-based refuse and recycling collection
system.
• Customer service. Describes the current customer service system and data related to the number
of customer service inquiries related to refuse and recycling collection.
Collection Schedule
The City currently services customers four days per week operating on a 10-hour per day schedule. Refuse
and recycling collection operations occurs year-round, with the exception of City-designated holidays.
Collection operations begin at 6:00 am (collection staff may arrive at this time, although vehicles may not
reach households until later) and target completion of routes by 4:00 pm. However, routes may finish later
during times of heavy set out or staffing shortages. Residents are asked to set out their roll carts no earlier
than 6:00 pm the night before collection and no later than 7:00 am the day of collection.
The current four day per week operating schedule allows district managers to deploy refuse and recycling
collection staff across the operation to support brush and bulky item collection operations on Wednesdays
and Saturdays, which results in overtime pay for refuse and recycling staff. Based on discussions with City
staff during the Collection Operations Observations, the refuse and recycling collection program is typically
able to complete daily routes; however, with tonnage surges in residential refuse and recycling due to
COVID-19 in combination with anticipated seasonal or holiday-based surges, collection operations have
fallen behind at certain times. When there are surges in refuse and recycling material or challenges
maintaining staffing levels, the overall collection operation becomes strained.
Although the current collection districts and schedule support the City’s existing needs, adjusting the
collection districts and/or transitioning to a five days per week, eight hour per day schedule may provide
refuse and recycling collection more flexibility to adjust routes to meet seasonal and holiday surges,
unanticipated surges (e.g., storm events) and overall growing volumes due to increasing residential
customers. However, with a five-day work schedule, there would be less ability to shift refuse and recycling
staff to support brush and bulky item collection or other aspects of the operation when needed.
Table D-3 and Table D-4 show the number of households that are provided refuse and recycling service by
district and day.
DRAFT
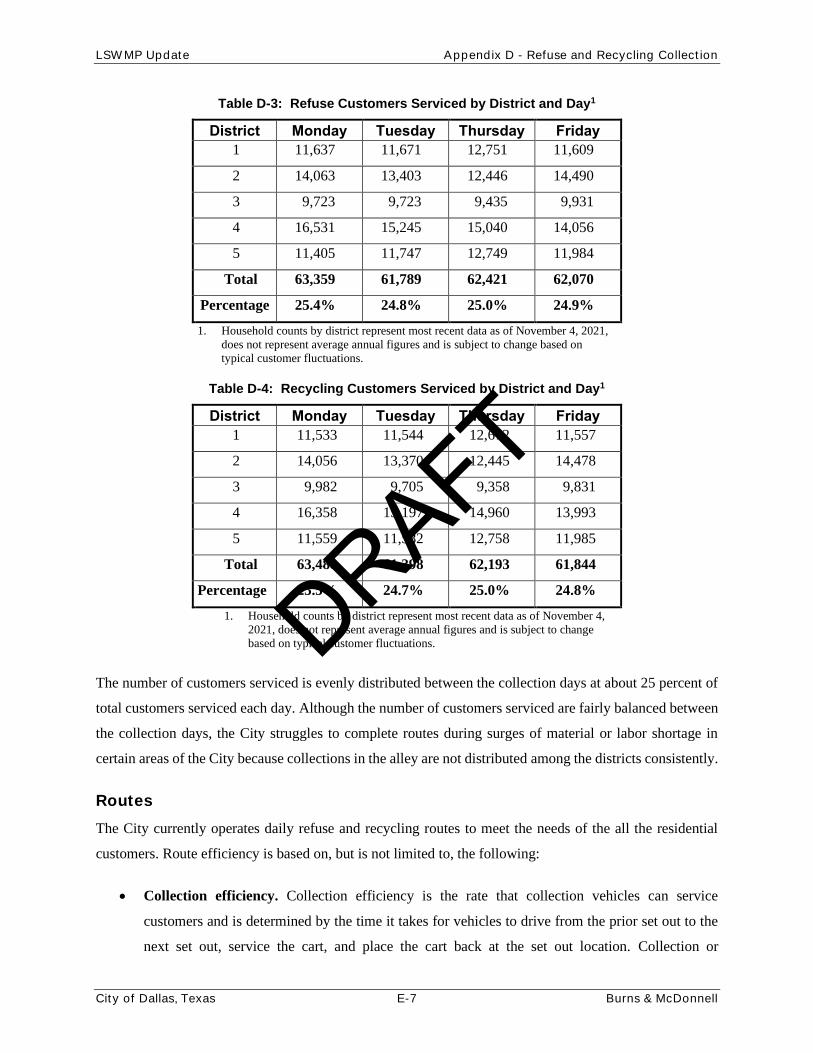
LSWMP Update Appendix D - Refuse and Recycling Collection
City of Dallas, Texas E-7 Burns & McDonnell
Table D-3: Refuse Customers Serviced by District and Day1
District Monday Tuesday Thursday Friday
1 11,637 11,671 12,751 11,609
2 14,063 13,403 12,446 14,490
3 9,723 9,723 9,435 9,931
4 16,531 15,245 15,040 14,056
5 11,405 11,747 12,749 11,984
Total 63,359 61,789 62,421 62,070
Percentage 25.4% 24.8% 25.0% 24.9%
1. Household counts by district represent most recent data as of November 4, 2021,
does not represent average annual figures and is subject to change based on
typical customer fluctuations.
Table D-4: Recycling Customers Serviced by District and Day1
District Monday Tuesday Thursday Friday
1 11,533 11,544 12,672 11,557
2 14,056 13,370 12,445 14,478
3 9,982 9,705 9,358 9,831
4 16,358 15,197 14,960 13,993
5 11,559 11,582 12,758 11,985
Total 63,488 61,398 62,193 61,844
Percentage 25.5% 24.7% 25.0% 24.8%
1. Household counts by district represent most recent data as of November 4,
2021, does not represent average annual figures and is subject to change
based on typical customer fluctuations.
The number of customers serviced is evenly distributed between the collection days at about 25 percent of
total customers serviced each day. Although the number of customers serviced are fairly balanced between
the collection days, the City struggles to complete routes during surges of material or labor shortage in
certain areas of the City because collections in the alley are not distributed among the districts consistently.
Routes
The City currently operates daily refuse and recycling routes to meet the needs of the all the residential
customers. Route efficiency is based on, but is not limited to, the following:
• Collection efficiency. Collection efficiency is the rate that collection vehicles can service
customers and is determined by the time it takes for vehicles to drive from the prior set out to the
next set out, service the cart, and place the cart back at the set out location. Collection or
DRAFT
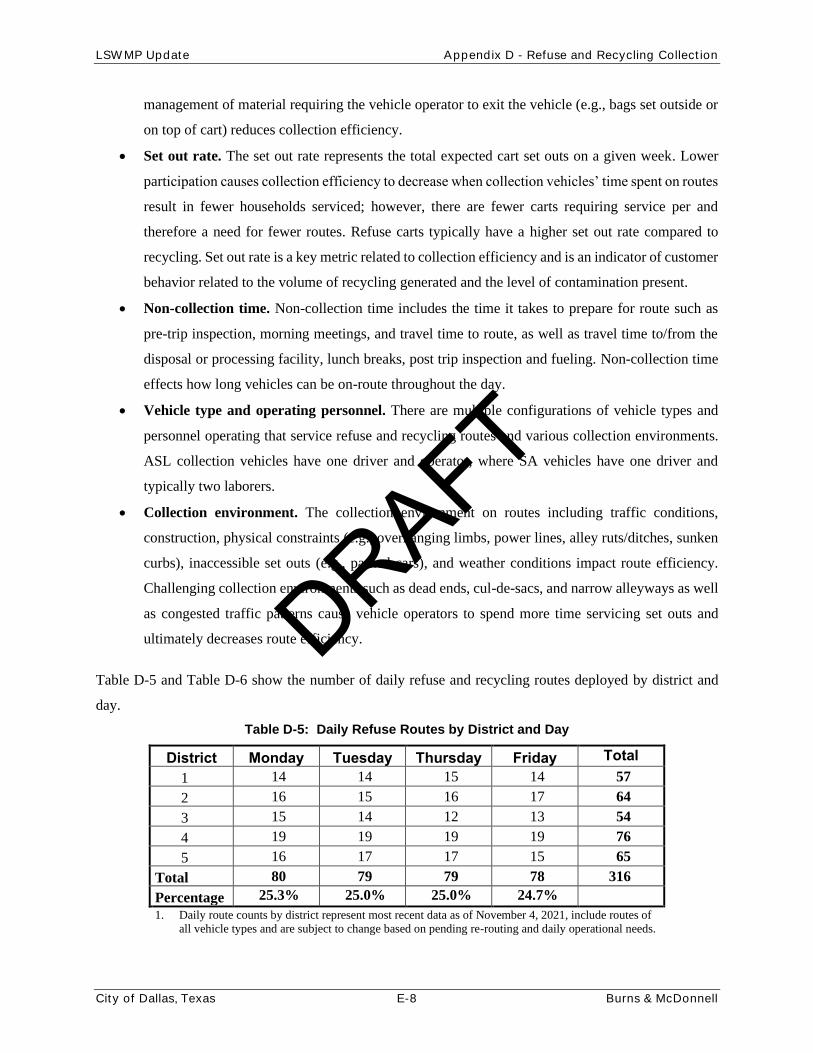
LSWMP Update Appendix D - Refuse and Recycling Collection
City of Dallas, Texas E-8 Burns & McDonnell
management of material requiring the vehicle operator to exit the vehicle (e.g., bags set outside or
on top of cart) reduces collection efficiency.
• Set out rate. The set out rate represents the total expected cart set outs on a given week. Lower
participation causes collection efficiency to decrease when collection vehicles’ time spent on routes
result in fewer households serviced; however, there are fewer carts requiring service per and
therefore a need for fewer routes. Refuse carts typically have a higher set out rate compared to
recycling. Set out rate is a key metric related to collection efficiency and is an indicator of customer
behavior related to the volume of recycling generated and the level of contamination present.
• Non-collection time. Non-collection time includes the time it takes to prepare for route such as
pre-trip inspection, morning meetings, and travel time to route, as well as travel time to/from the
disposal or processing facility, lunch breaks, post trip inspection and fueling. Non-collection time
effects how long vehicles can be on-route throughout the day.
• Vehicle type and operating personnel. There are multiple configurations of vehicle types and
personnel operating that service refuse and recycling routes and various collection environments.
ASL collection vehicles have one driver and operator, where SA vehicles have one driver and
typically two laborers.
• Collection environment. The collection environment on routes including traffic conditions,
construction, physical constraints (e.g., overhanging limbs, power lines, alley ruts/ditches, sunken
curbs), inaccessible set outs (e.g., parked cars), and weather conditions impact route efficiency.
Challenging collection environments such as dead ends, cul-de-sacs, and narrow alleyways as well
as congested traffic patterns cause vehicle operators to spend more time servicing set outs and
ultimately decreases route efficiency.
Table D-5 and Table D-6 show the number of daily refuse and recycling routes deployed by district and
day.
Table D-5: Daily Refuse Routes by District and Day
District Monday Tuesday Thursday Friday Total
1 14 14 15 14 57
2 16 15 16 17 64
3 15 14 12 13 54
4 19 19 19 19 76
5 16 17 17 15 65
Total 80 79 79 78 316
Percentage 25.3% 25.0% 25.0% 24.7%
1. Daily route counts by district represent most recent data as of November 4, 2021, include routes of
all vehicle types and are subject to change based on pending re-routing and daily operational needs.
DRAFT
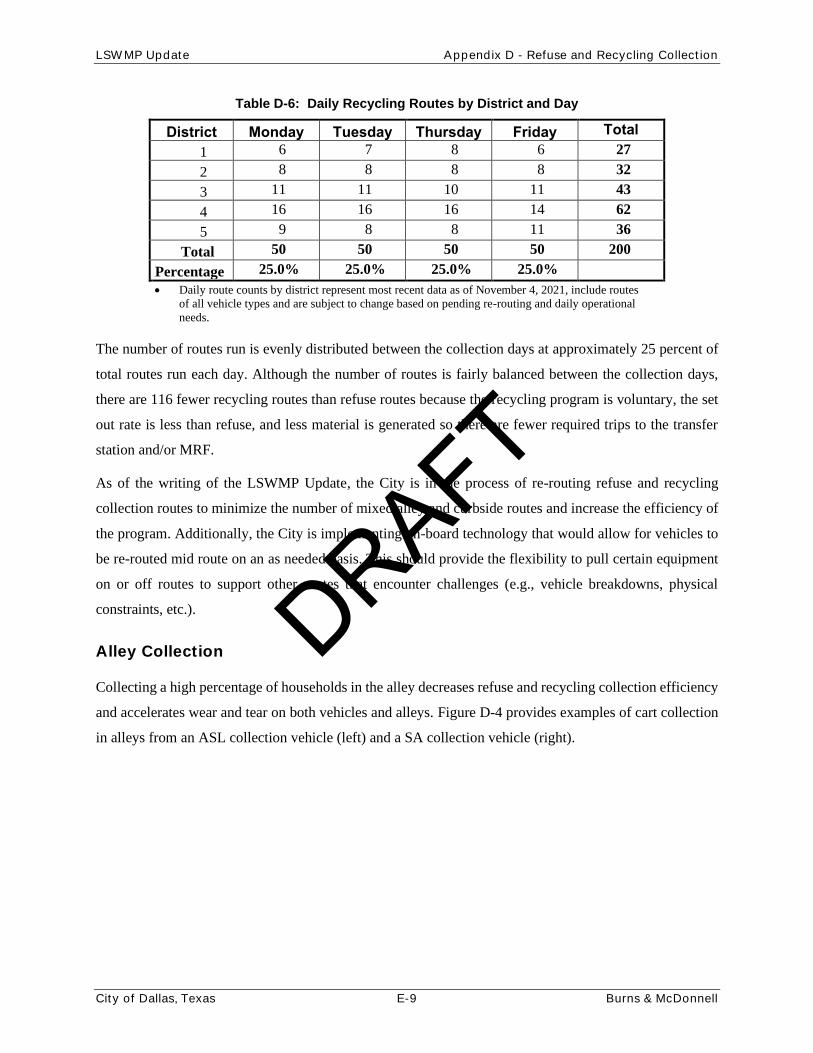
LSWMP Update Appendix D - Refuse and Recycling Collection
City of Dallas, Texas E-9 Burns & McDonnell
Table D-6: Daily Recycling Routes by District and Day
District Monday Tuesday Thursday Friday Total
1 6 7 8 6 27
2 8 8 8 8 32
3 11 11 10 11 43
4 16 16 16 14 62
5 9 8 8 11 36
Total 50 50 50 50 200
Percentage 25.0% 25.0% 25.0% 25.0%
• Daily route counts by district represent most recent data as of November 4, 2021, include routes
of all vehicle types and are subject to change based on pending re-routing and daily operational
needs.
The number of routes run is evenly distributed between the collection days at approximately 25 percent of
total routes run each day. Although the number of routes is fairly balanced between the collection days,
there are 116 fewer recycling routes than refuse routes because the recycling program is voluntary, the set
out rate is less than refuse, and less material is generated so there are fewer required trips to the transfer
station and/or MRF.
As of the writing of the LSWMP Update, the City is in the process of re-routing refuse and recycling
collection routes to minimize the number of mixed alley and curbside routes and increase the efficiency of
the program. Additionally, the City is implementing on-board technology that would allow for vehicles to
be re-routed mid route on an as needed basis. This should provide the flexibility to pull certain equipment
on or off routes to support other routes that encounter challenges (e.g., vehicle breakdowns, physical
constraints, etc.).
Alley Collection
Collecting a high percentage of households in the alley decreases refuse and recycling collection efficiency
and accelerates wear and tear on both vehicles and alleys. Figure D-4 provides examples of cart collection
in alleys from an ASL collection vehicle (left) and a SA collection vehicle (right).
DRAFT
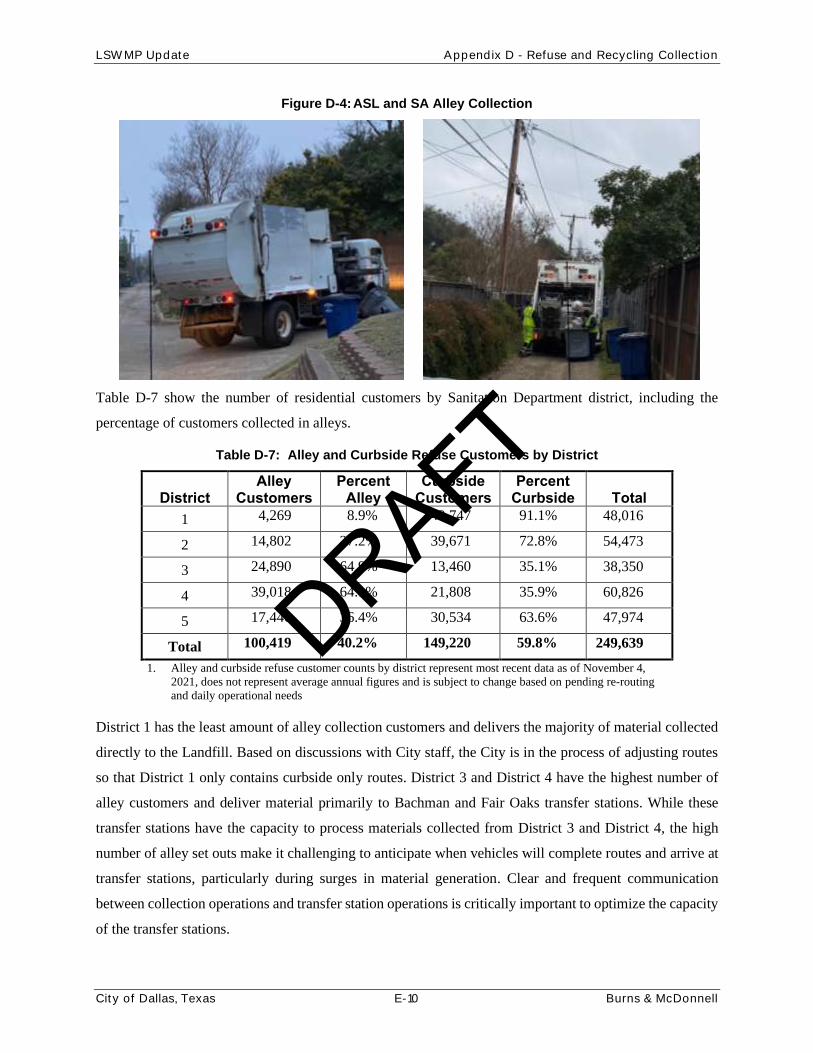
LSWMP Update Appendix D - Refuse and Recycling Collection
City of Dallas, Texas E-10 Burns & McDonnell
Figure D-4: ASL and SA Alley Collection
Table D-7 show the number of residential customers by Sanitation Department district, including the
percentage of customers collected in alleys.
Table D-7: Alley and Curbside Refuse Customers by District
District Alley
Customers Percent
Alley Curbside
Customers Percent
Curbside Total
1 4,269 8.9% 43,747 91.1% 48,016
2 14,802 27.2% 39,671 72.8% 54,473
3 24,890 64.9% 13,460 35.1% 38,350
4 39,018 64.1% 21,808 35.9% 60,826
5 17,440 36.4% 30,534 63.6% 47,974
Total 100,419 40.2% 149,220 59.8% 249,639
1. Alley and curbside refuse customer counts by district represent most recent data as of November 4,
2021, does not represent average annual figures and is subject to change based on pending re-routing
and daily operational needs
District 1 has the least amount of alley collection customers and delivers the majority of material collected
directly to the Landfill. Based on discussions with City staff, the City is in the process of adjusting routes
so that District 1 only contains curbside only routes. District 3 and District 4 have the highest number of
alley customers and deliver material primarily to Bachman and Fair Oaks transfer stations. While these
transfer stations have the capacity to process materials collected from District 3 and District 4, the high
number of alley set outs make it challenging to anticipate when vehicles will complete routes and arrive at
transfer stations, particularly during surges in material generation. Clear and frequent communication
between collection operations and transfer station operations is critically important to optimize the capacity
of the transfer stations.
DRAFT
LSWMP Update Appendix D - Refuse and Recycling Collection
City of Dallas, Texas E-11 Burns & McDonnell
The following provides brief descriptions of the key impacts that collecting carts in alleys has on collection
efficiency.
• Size of vehicle. In order to collect in the City’s narrow alleys, the vehicles are smaller with less
hauling capacity. The City primarily operates 20 or 22 CY capacity ASL collection vehicles to
service alley set outs since the larger 28 CY capacity collection vehicles are too large to travel
down some of the City’s alleys. Routes that contain alleys require smaller vehicles and are not able
to collect as much material before traveling to the transfer station, Landfill or MRF to tip material,
reducing the route efficiency.
• Size of alleys. The size of the City’s alleys widely varies depending on surface conditions,
vegetation, and powerlines. In narrower alleys with protruding trees and vegetation, collection can
take considerably longer than on the street, especially in those alleys where the surface conditions
are also poor. Low hanging power and cable lines may obstruct trucks from passing through an
alley and also present a safety concern to drivers. Damage to the alleys or collection vehicles
causes the City’s maintenance costs to rise.
• Less space for carts. For ASL collection vehicles, carts should be placed at least three to five feet
apart to allow adequate clearance for the collection arm. The City directs residents to place roll
carts facing the point of collection with three feet of space on all sides. In many alleys, the space
constraints often result in little or no space between the carts. The driver needs to either get out of
the vehicle to maneuver the carts or spend additional time guiding the arm to collect the carts.
Additionally, fences, utilities lines, gas meters, etc. often interfere with the collection arm on ASL
collection vehicles.
• Checking carts. For households collected in the street, residents must place their cart at the curb
for their collection day and retrieve it afterward. Therefore, it is easy for a driver to determine
which carts need to be collected. In areas where the recycling participation is lower, there are few
recycling carts on the street and therefore the driver can focus on those carts that have been set at
the curb for collection. In the alleys, most customers store carts in the same place where they are
collected. Consequently, ASL collection vehicles must service every cart, even though many may
be empty, and semi-automated rear-load crews have to manually check every cart before
collection, decreasing collection efficiency.
• Equipment type. ASL collection vehicles collecting material in the alleys can only collect one
side of the alley at a time, and there is less space for carts making ASL collection vehicles less
efficient in the alleys.
DRAFT
LSWMP Update Appendix D - Refuse and Recycling Collection
City of Dallas, Texas E-12 Burns & McDonnell
The inefficiencies associated with servicing high numbers of customers in the alleys causes challenges for
collection crews to complete routes in certain districts or days of the week. When this occurs, routes may
not be completed until the following day causing the collection operation to fall behind schedule. These
challenges are compounded when the demand of brush and bulky item collection requires refuse and
recycling collection staff to help across the operation. Additionally, when refuse and recycling collections
fall behind it becomes harder to predict when vehicles will complete routes and when inbound tonnage to
the transfer stations will arrive at the transfer stations.
One of the key challenges of the refuse and recycling collection operation is that some routes service both
alley and curbside set outs where other routes are only curbside. When ASL collection vehicles are required
to collect both curbside and alley set outs on a single route, the City must use smaller collection vehicles
that cannot haul as much and will have to stop collecting to dispose material at a transfer station, Landfill
or MRF sooner than a larger vehicle would; however, larger vehicles may not be able to collect portions of
the route with alleys due to physical constraints and challenging collection environments.
Although the City has previously evaluated the positive impact of minimizing the number of routes mixed
between curbside and alley collection and should continue to minimize the number of mixed routes, service
at the curb presents its own set of challenges for certain housing types. Street parking and challenging
collection environments are physical constraints that minimize efficiency and safety, while increasing the
risk of property damage in some areas of the City.
Equipment
Refuse and recycling collection operations utilize the following vehicles provided with technical
descriptions:
• Automated Side Load (ASL). ASL collection vehicles operate an automated arm to tip material
into the body of the truck for compaction. A one-man crew is able to operate the vehicle and
collection arm. The City owns ASLs with 20, 22, 26 and 30 CY of capacity that can collect between
six to eight tons of refuse before disposing. The 26 and 30 CY ASL collection vehicles were
recently added to the vehicle fleet. The smaller 20 and 22 CY models are able to navigate certain
collection environments that 26 and 30 CY models cannot; however, smaller body models cannot
hold as much material and are required to leave routes to dispose of collected material sooner than
the larger body models. The larger 30 CY model is primarily used for curbside collection and the
20 CY model is used for both curbside and alley collection of both refuse and recycling. Figure
D-5 shows an ASL collecting a residential refuse cart.
DRAFT
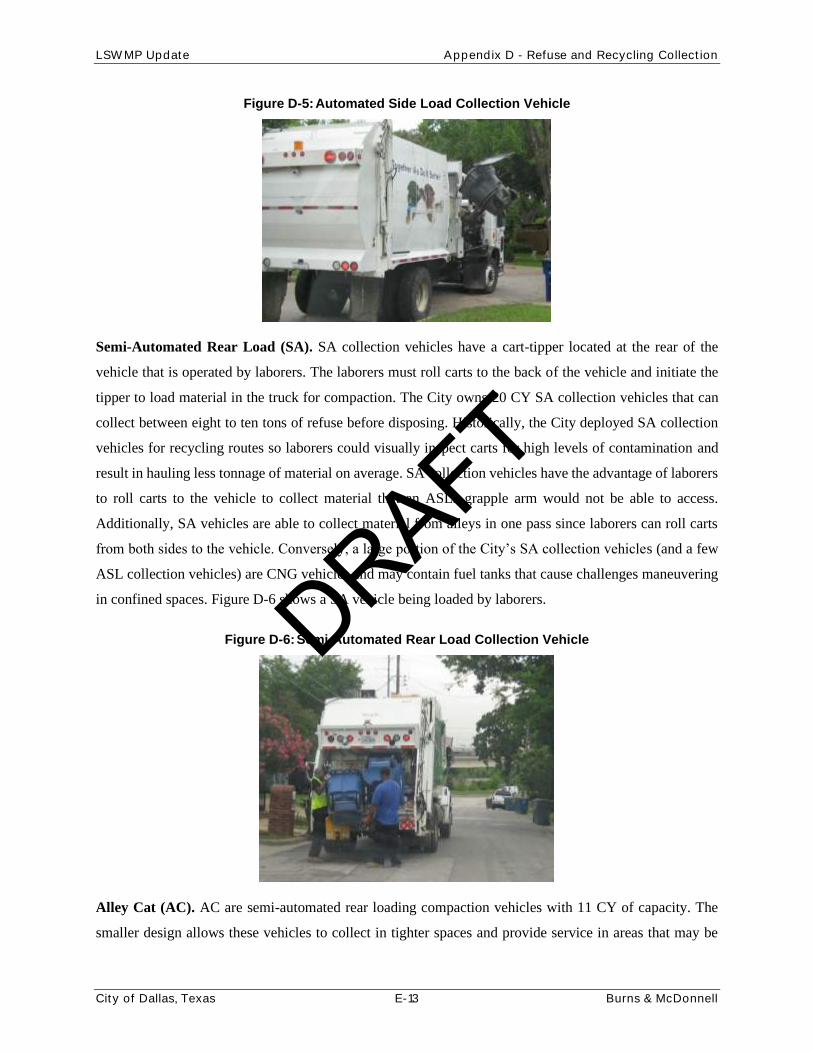
LSWMP Update Appendix D - Refuse and Recycling Collection
City of Dallas, Texas E-13 Burns & McDonnell
Figure D-5: Automated Side Load Collection Vehicle
Semi-Automated Rear Load (SA). SA collection vehicles have a cart-tipper located at the rear of the
vehicle that is operated by laborers. The laborers must roll carts to the back of the vehicle and initiate the
tipper to load material in the truck for compaction. The City owns 20 CY SA collection vehicles that can
collect between eight to ten tons of refuse before disposing. Historically, the City deployed SA collection
vehicles for recycling routes so laborers could visually inspect carts for high levels of contamination and
result in hauling less tonnage of material on average. SA collection vehicles have the advantage of laborers
to roll carts to the vehicle to collect material that an ASLs grapple arm would not be able to access.
Additionally, SA vehicles are able to collect material from alleys in one pass since laborers can roll carts
from both sides to the vehicle. Conversely, a large portion of the City’s SA collection vehicles (and a few
ASL collection vehicles) are CNG vehicles and may contain fuel tanks that cause challenges maneuvering
in confined spaces. Figure D-6 shows a SA vehicle being loaded by laborers.
Figure D-6: Semi-Automated Rear Load Collection Vehicle
Alley Cat (AC). AC are semi-automated rear loading compaction vehicles with 11 CY of capacity. The
smaller design allows these vehicles to collect in tighter spaces and provide service in areas that may be
DRAFT
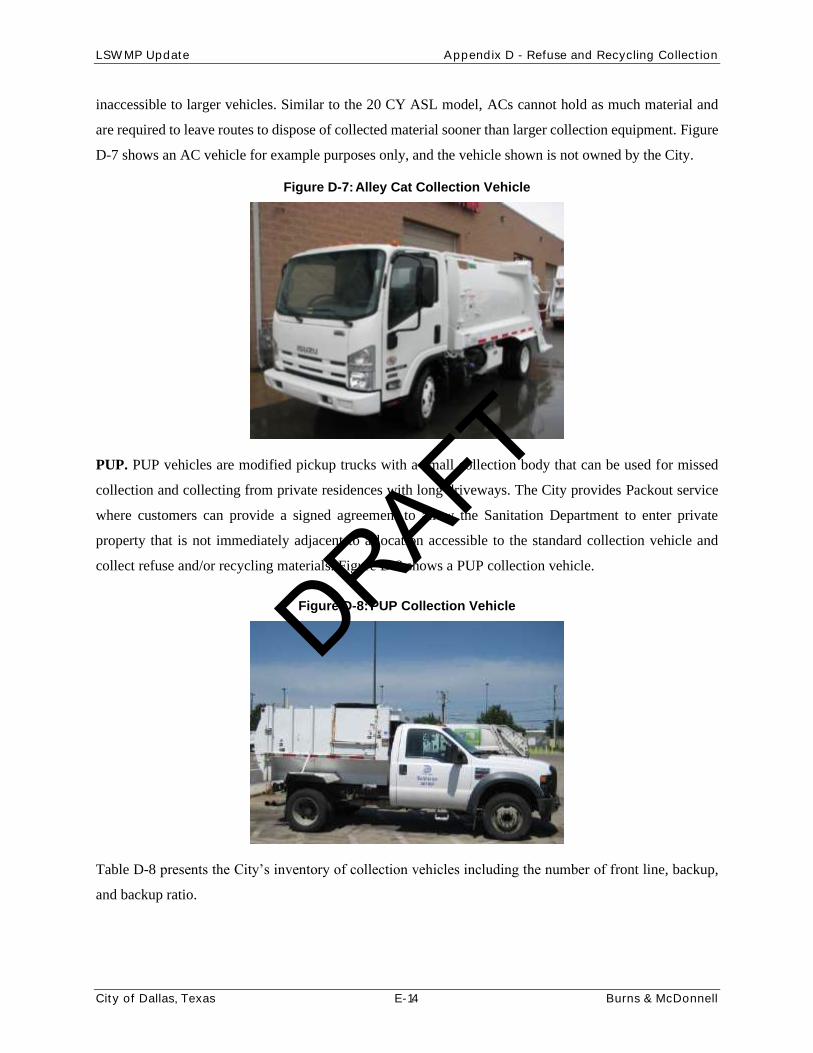
LSWMP Update Appendix D - Refuse and Recycling Collection
City of Dallas, Texas E-14 Burns & McDonnell
inaccessible to larger vehicles. Similar to the 20 CY ASL model, ACs cannot hold as much material and
are required to leave routes to dispose of collected material sooner than larger collection equipment. Figure
D-7 shows an AC vehicle for example purposes only, and the vehicle shown is not owned by the City.
Figure D-7: Alley Cat Collection Vehicle
PUP. PUP vehicles are modified pickup trucks with a small collection body that can be used for missed
collection and collecting from private residences with long driveways. The City provides Packout service
where customers can provide a signed agreement to allow the Sanitation Department to enter private
property that is not immediately adjacent to a location accessible to the standard collection vehicle and
collect refuse and/or recycling materials. Figure D-8 shows a PUP collection vehicle.
Figure D-8: PUP Collection Vehicle
Table D-8 presents the City’s inventory of collection vehicles including the number of front line, backup,
and backup ratio.
DRAFT
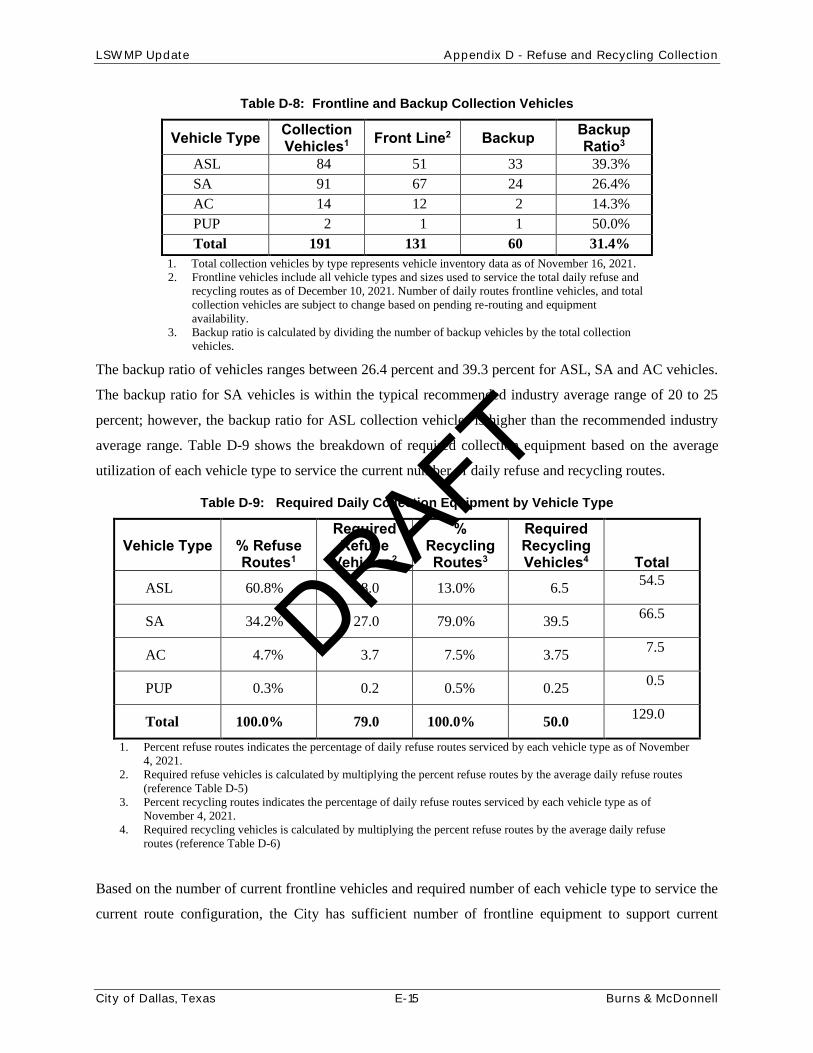
LSWMP Update Appendix D - Refuse and Recycling Collection
City of Dallas, Texas E-15 Burns & McDonnell
Table D-8: Frontline and Backup Collection Vehicles
Vehicle Type Collection Vehicles1
Front Line2 Backup Backup Ratio3
ASL 84 51 33 39.3%
SA 91 67 24 26.4%
AC 14 12 2 14.3%
PUP 2 1 1 50.0%
Total 191 131 60 31.4%
1. Total collection vehicles by type represents vehicle inventory data as of November 16, 2021.
2. Frontline vehicles include all vehicle types and sizes used to service the total daily refuse and
recycling routes as of December 10, 2021. Number of daily routes frontline vehicles, and total
collection vehicles are subject to change based on pending re-routing and equipment
availability. 3. Backup ratio is calculated by dividing the number of backup vehicles by the total collection
vehicles.
The backup ratio of vehicles ranges between 26.4 percent and 39.3 percent for ASL, SA and AC vehicles.
The backup ratio for SA vehicles is within the typical recommended industry average range of 20 to 25
percent; however, the backup ratio for ASL collection vehicles is higher than the recommended industry
average range. Table D-9 shows the breakdown of required collection equipment based on the average
utilization of each vehicle type to service the current number of daily refuse and recycling routes.
Table D-9: Required Daily Collection Equipment by Vehicle Type
Vehicle Type % Refuse Routes1
Required Refuse
Vehicles2
% Recycling Routes3
Required Recycling Vehicles4 Total
ASL 60.8% 48.0 13.0% 6.5 54.5
SA 34.2% 27.0 79.0% 39.5 66.5
AC 4.7% 3.7 7.5% 3.75 7.5
PUP 0.3% 0.2 0.5% 0.25 0.5
Total 100.0% 79.0 100.0% 50.0 129.0
1. Percent refuse routes indicates the percentage of daily refuse routes serviced by each vehicle type as of November
4, 2021.
2. Required refuse vehicles is calculated by multiplying the percent refuse routes by the average daily refuse routes
(reference Table D-5)
3. Percent recycling routes indicates the percentage of daily refuse routes serviced by each vehicle type as of
November 4, 2021.
4. Required recycling vehicles is calculated by multiplying the percent refuse routes by the average daily refuse
routes (reference Table D-6)
Based on the number of current frontline vehicles and required number of each vehicle type to service the
current route configuration, the City has sufficient number of frontline equipment to support current
DRAFT
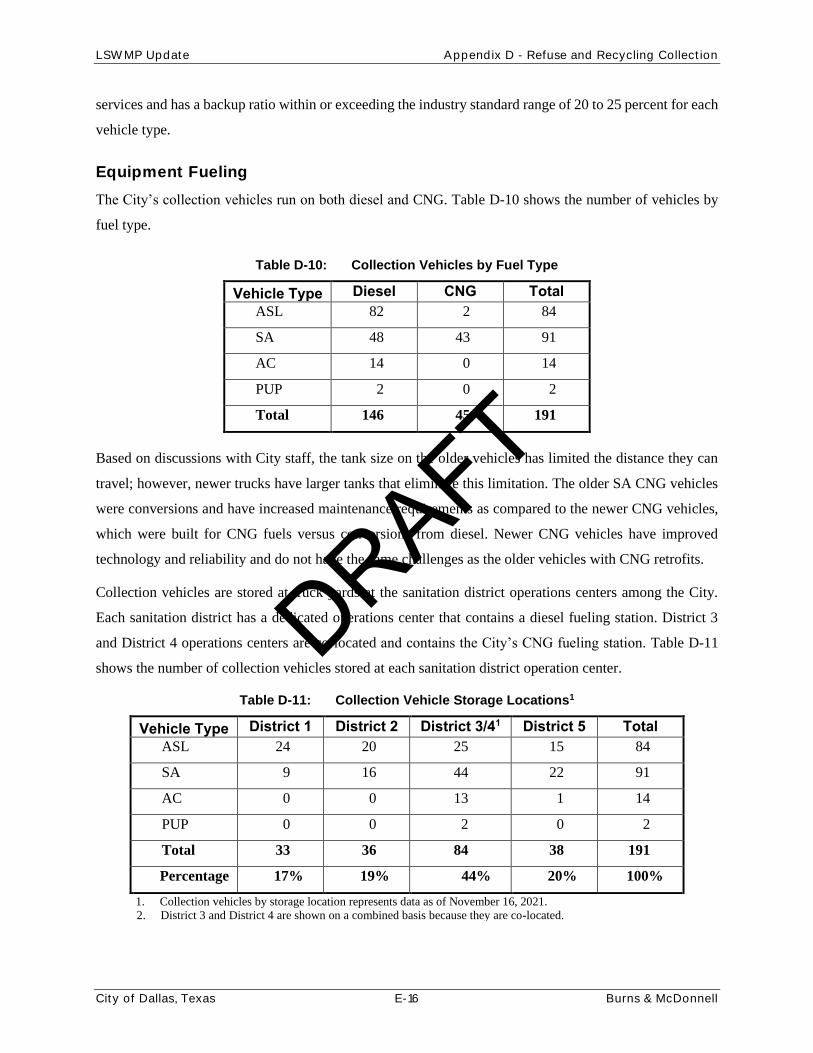
LSWMP Update Appendix D - Refuse and Recycling Collection
City of Dallas, Texas E-16 Burns & McDonnell
services and has a backup ratio within or exceeding the industry standard range of 20 to 25 percent for each
vehicle type.
Equipment Fueling
The City’s collection vehicles run on both diesel and CNG. Table D-10 shows the number of vehicles by
fuel type.
Table D-10: Collection Vehicles by Fuel Type
Vehicle Type Diesel CNG Total
ASL 82 2 84
SA 48 43 91
AC 14 0 14
PUP 2 0 2
Total 146 45 191
Based on discussions with City staff, the tank size on the older vehicles has limited the distance they can
travel; however, newer trucks have larger tanks that eliminate this limitation. The older SA CNG vehicles
were conversions and have increased maintenance requirements as compared to the newer CNG vehicles,
which were built for CNG fuels versus conversions from diesel. Newer CNG vehicles have improved
technology and reliability and do not have the same challenges as the older vehicles with CNG retrofits.
Collection vehicles are stored at truck yards at the sanitation district operations centers among the City.
Each sanitation district has a dedicated operations center that contains a diesel fueling station. District 3
and District 4 operations centers are co-located and contains the City’s CNG fueling station. Table D-11
shows the number of collection vehicles stored at each sanitation district operation center.
Table D-11: Collection Vehicle Storage Locations1
Vehicle Type District 1 District 2 District 3/41 District 5 Total
ASL 24 20 25 15 84
SA 9 16 44 22 91
AC 0 0 13 1 14
PUP 0 0 2 0 2
Total 33 36 84 38 191
Percentage 17% 19% 44% 20% 100%
1. Collection vehicles by storage location represents data as of November 16, 2021. 2. District 3 and District 4 are shown on a combined basis because they are co-located.
DRAFT
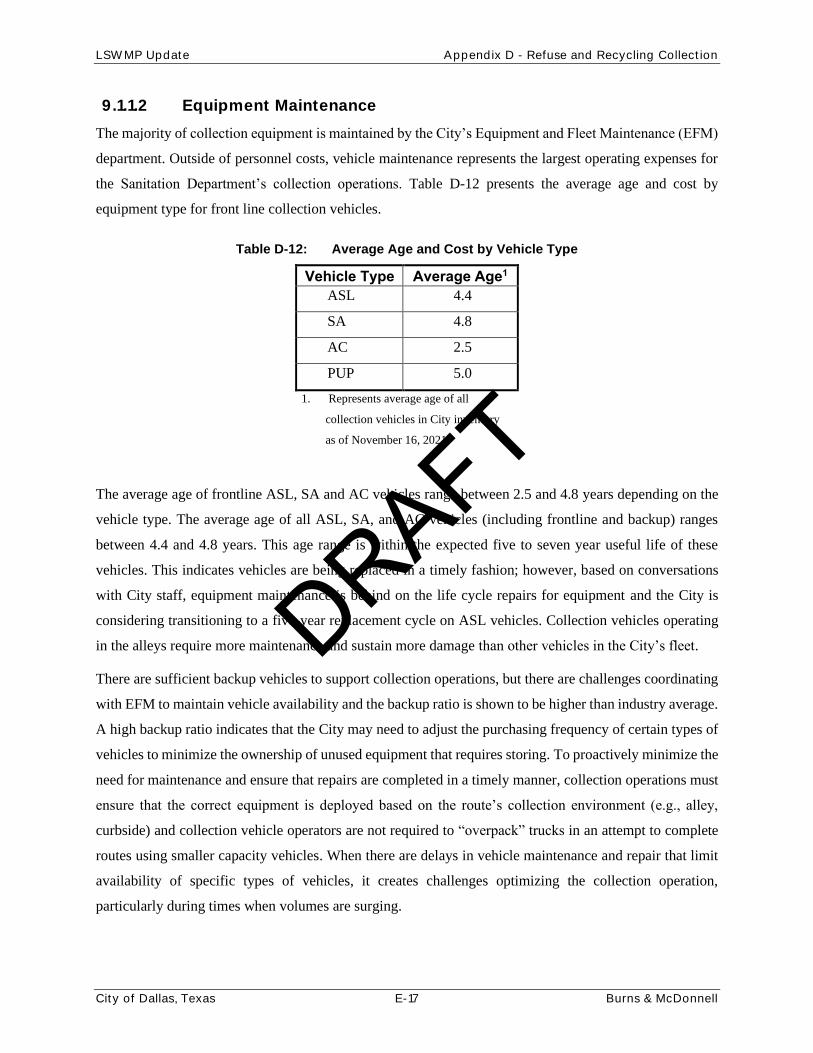
LSWMP Update Appendix D - Refuse and Recycling Collection
City of Dallas, Texas E-17 Burns & McDonnell
9.1.1.2 Equipment Maintenance
The majority of collection equipment is maintained by the City’s Equipment and Fleet Maintenance (EFM)
department. Outside of personnel costs, vehicle maintenance represents the largest operating expenses for
the Sanitation Department’s collection operations. Table D-12 presents the average age and cost by
equipment type for front line collection vehicles.
Table D-12: Average Age and Cost by Vehicle Type
Vehicle Type Average Age1
ASL 4.4
SA 4.8
AC 2.5
PUP 5.0
1. Represents average age of all
collection vehicles in City inventory
as of November 16, 2021
The average age of frontline ASL, SA and AC vehicles range between 2.5 and 4.8 years depending on the
vehicle type. The average age of all ASL, SA, and AC vehicles (including frontline and backup) ranges
between 4.4 and 4.8 years. This age range is within the expected five to seven year useful life of these
vehicles. This indicates vehicles are being replaced in a timely fashion; however, based on conversations
with City staff, equipment maintenance is behind on the life cycle repairs for equipment and the City is
considering transitioning to a five-year replacement cycle on ASL vehicles. Collection vehicles operating
in the alleys require more maintenance and sustain more damage than other vehicles in the City’s fleet.
There are sufficient backup vehicles to support collection operations, but there are challenges coordinating
with EFM to maintain vehicle availability and the backup ratio is shown to be higher than industry average.
A high backup ratio indicates that the City may need to adjust the purchasing frequency of certain types of
vehicles to minimize the ownership of unused equipment that requires storing. To proactively minimize the
need for maintenance and ensure that repairs are completed in a timely manner, collection operations must
ensure that the correct equipment is deployed based on the route’s collection environment (e.g., alley,
curbside) and collection vehicle operators are not required to “overpack” trucks in an attempt to complete
routes using smaller capacity vehicles. When there are delays in vehicle maintenance and repair that limit
availability of specific types of vehicles, it creates challenges optimizing the collection operation,
particularly during times when volumes are surging.
DRAFT

LSWMP Update Appendix D - Refuse and Recycling Collection
City of Dallas, Texas E-18 Burns & McDonnell
Cart Management
This section provides a description of the City’s cart management including the resources deployed to
provide this service. City staff provides cart maintenance, repair, collection, delivery and inventory
management for refuse and recycling carts. Approximately 80 percent of carts are managed and stored at
the special services building and the additional 20 percent of cart inventory is stored at Bachman.
Cart management is a critical part of providing refuse and recycling collection service and consists of cart
collection/delivery, assembly, repair, maintenance, cleaning, and inventorying. The capability to provide
this service in-house allows the City to be responsive to customer service requests as it relates to requesting
or removing carts, since they do not have to work with a third party to respond to these requests.
If the City has challenges maintaining staff or equipment related to cart management, hiring a third party
could be considered to allow for increased responsiveness to cart management requests, but would come at
a cost of paying the third party for service. Some other cities in the region outsource the management of
carts to a third-party vendors either by contracting directly with the cart vendor or hiring an outside group
to provide maintenance, repair, collection and delivery only.
Staffing Requirements
This section describes the refuse and recycling collection system staffing and estimates the required staffing
levels of supervisors and collection operators to identify if the current staffing levels are sufficient to
maximize the efficiency of the refuse and recycling collection system. Table D-13 shows the current
staffing for the refuse and recycling collection operation. DRAFT
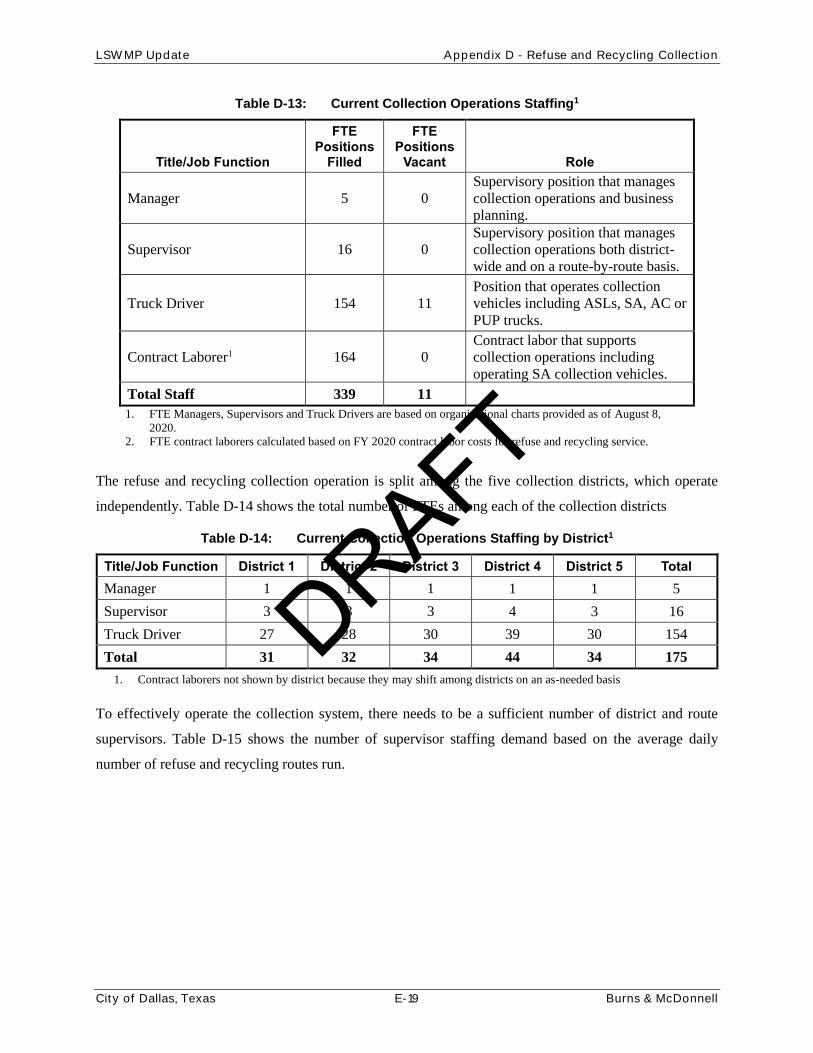
LSWMP Update Appendix D - Refuse and Recycling Collection
City of Dallas, Texas E-19 Burns & McDonnell
Table D-13: Current Collection Operations Staffing1
Title/Job Function
FTE Positions
Filled
FTE Positions
Vacant Role
Manager 5 0
Supervisory position that manages
collection operations and business
planning.
Supervisor 16 0
Supervisory position that manages
collection operations both district-
wide and on a route-by-route basis.
Truck Driver 154 11
Position that operates collection
vehicles including ASLs, SA, AC or
PUP trucks.
Contract Laborer1 164 0
Contract labor that supports
collection operations including
operating SA collection vehicles.
Total Staff 339 11
1. FTE Managers, Supervisors and Truck Drivers are based on organizational charts provided as of August 8,
2020.
2. FTE contract laborers calculated based on FY 2020 contract labor costs for refuse and recycling service.
The refuse and recycling collection operation is split among the five collection districts, which operate
independently. Table D-14 shows the total number of FTEs among each of the collection districts
Table D-14: Current Collection Operations Staffing by District1
Title/Job Function District 1 District 2 District 3 District 4 District 5 Total
Manager 1 1 1 1 1 5
Supervisor 3 3 3 4 3 16
Truck Driver 27 28 30 39 30 154
Total 31 32 34 44 34 175
1. Contract laborers not shown by district because they may shift among districts on an as-needed basis
To effectively operate the collection system, there needs to be a sufficient number of district and route
supervisors. Table D-15 shows the number of supervisor staffing demand based on the average daily
number of refuse and recycling routes run.
DRAFT
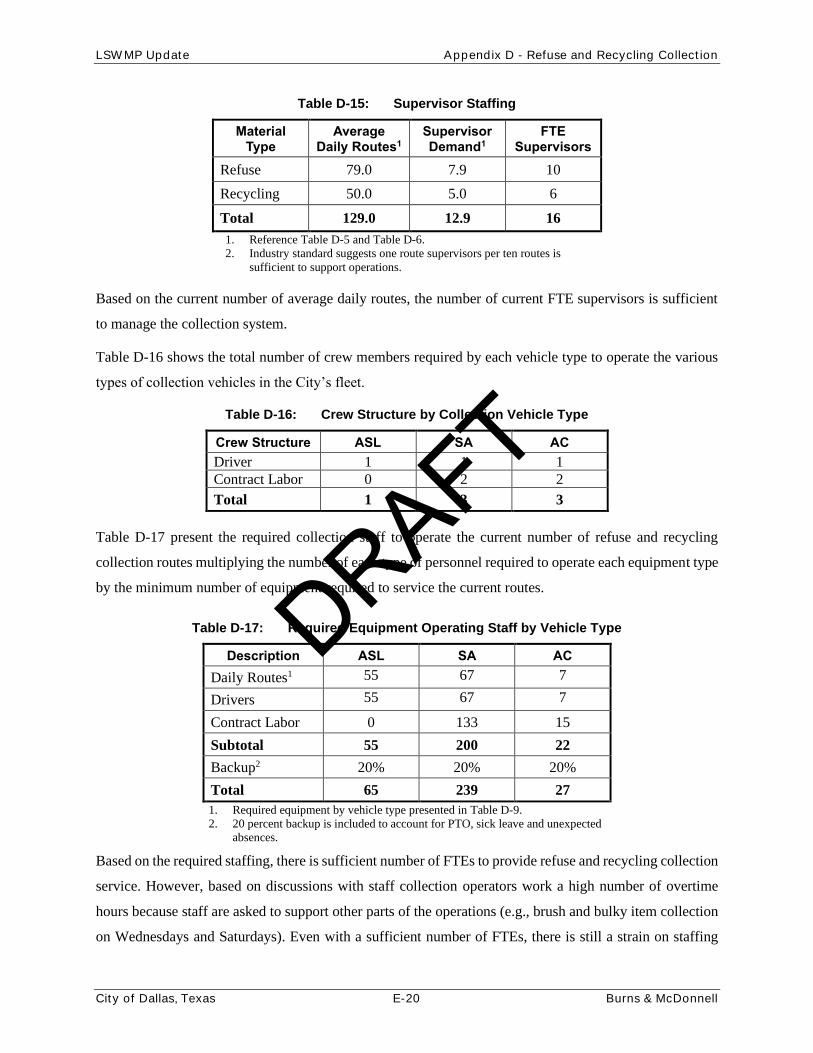
LSWMP Update Appendix D - Refuse and Recycling Collection
City of Dallas, Texas E-20 Burns & McDonnell
Table D-15: Supervisor Staffing
Material Type
Average Daily Routes1
Supervisor Demand1
FTE Supervisors
Refuse 79.0 7.9 10
Recycling 50.0 5.0 6
Total 129.0 12.9 16
1. Reference Table D-5 and Table D-6. 2. Industry standard suggests one route supervisors per ten routes is
sufficient to support operations.
Based on the current number of average daily routes, the number of current FTE supervisors is sufficient
to manage the collection system.
Table D-16 shows the total number of crew members required by each vehicle type to operate the various
types of collection vehicles in the City’s fleet.
Table D-16: Crew Structure by Collection Vehicle Type
Crew Structure ASL SA AC
Driver 1 1 1
Contract Labor 0 2 2
Total 1 3 3
Table D-17 present the required collection staff to operate the current number of refuse and recycling
collection routes multiplying the number of each type of personnel required to operate each equipment type
by the minimum number of equipment required to service the current routes.
Table D-17: Required Equipment Operating Staff by Vehicle Type
Description ASL SA AC
Daily Routes1 55 67 7
Drivers 55 67 7
Contract Labor 0 133 15
Subtotal 55 200 22
Backup2 20% 20% 20%
Total 65 239 27
1. Required equipment by vehicle type presented in Table D-9.
2. 20 percent backup is included to account for PTO, sick leave and unexpected
absences.
Based on the required staffing, there is sufficient number of FTEs to provide refuse and recycling collection
service. However, based on discussions with staff collection operators work a high number of overtime
hours because staff are asked to support other parts of the operations (e.g., brush and bulky item collection
on Wednesdays and Saturdays). Even with a sufficient number of FTEs, there is still a strain on staffing
DRAFT
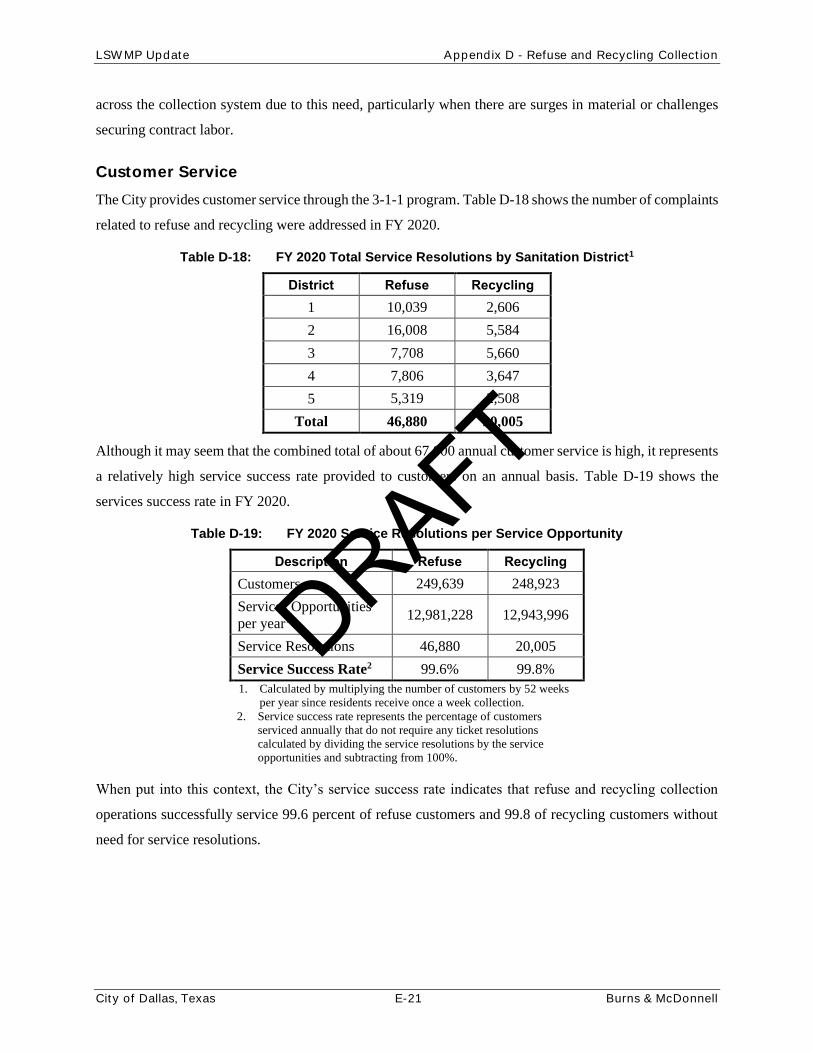
LSWMP Update Appendix D - Refuse and Recycling Collection
City of Dallas, Texas E-21 Burns & McDonnell
across the collection system due to this need, particularly when there are surges in material or challenges
securing contract labor.
Customer Service
The City provides customer service through the 3-1-1 program. Table D-18 shows the number of complaints
related to refuse and recycling were addressed in FY 2020.
Table D-18: FY 2020 Total Service Resolutions by Sanitation District1
District Refuse Recycling
1 10,039 2,606
2 16,008 5,584
3 7,708 5,660
4 7,806 3,647
5 5,319 2,508
Total 46,880 20,005
Although it may seem that the combined total of about 67,000 annual customer service is high, it represents
a relatively high service success rate provided to customers on an annual basis. Table D-19 shows the
services success rate in FY 2020.
Table D-19: FY 2020 Service Resolutions per Service Opportunity
Description Refuse Recycling
Customers 249,639 248,923
Services Opportunities
per year1 12,981,228 12,943,996
Service Resolutions 46,880 20,005
Service Success Rate2 99.6% 99.8%
1. Calculated by multiplying the number of customers by 52 weeks
per year since residents receive once a week collection. 2. Service success rate represents the percentage of customers
serviced annually that do not require any ticket resolutions
calculated by dividing the service resolutions by the service
opportunities and subtracting from 100%.
When put into this context, the City’s service success rate indicates that refuse and recycling collection
operations successfully service 99.6 percent of refuse customers and 99.8 of recycling customers without
need for service resolutions.
DRAFT
LSWMP Update Appendix E - Landfill Operation Evaluation
City of Dallas, Texas E-1 Burns & McDonnell
APPENDIX E - LANDFILL OPERATION EVALUATION
This section describes the evaluation methodology, overviews the Landfill facility operation and identifies
operational challenges.
Methodology
As part of the LSWMP Update, a full working day of operations were observed at the Landfill on April 27
and 28, 2021 (Landfill Site Visit). Operational activities reviewed included, but were not limited to:
• General operations and procedures
• Facility opening and closing
• Waste flow and traffic control
• Staffing levels
• Equipment types and maintenance
• Site development progress
• Leachate collection systems
• Gas collection and control system (GCCS)
• Stormwater management
Additionally, discussions were held with various members of management and staff to discuss ongoing
operations and collect data which is incorporated in this section. Based on the Landfill Site Visit and data
analysis, the following provides a detailed overview of the Landfill operations and describes current
challenges to inform the development of options for the City’s consideration.
Landfill Operation Overview
The Landfill manages high tonnage and volume of daily customers. The City owns and operates the
Landfill, located at 5100 Youngblood Road just north of the intersection of Interstates 45 and 20. The
Landfill is open to customers from 5:00 am to 8:00 pm Monday through Friday and 6:00 am to 4:00 pm on
Saturday; however, the facility is permitted to operate 24 hours per day. Table E-1 provides the permits and
registrations that have been issued by the TCEQ or are currently pending.
DRAFT
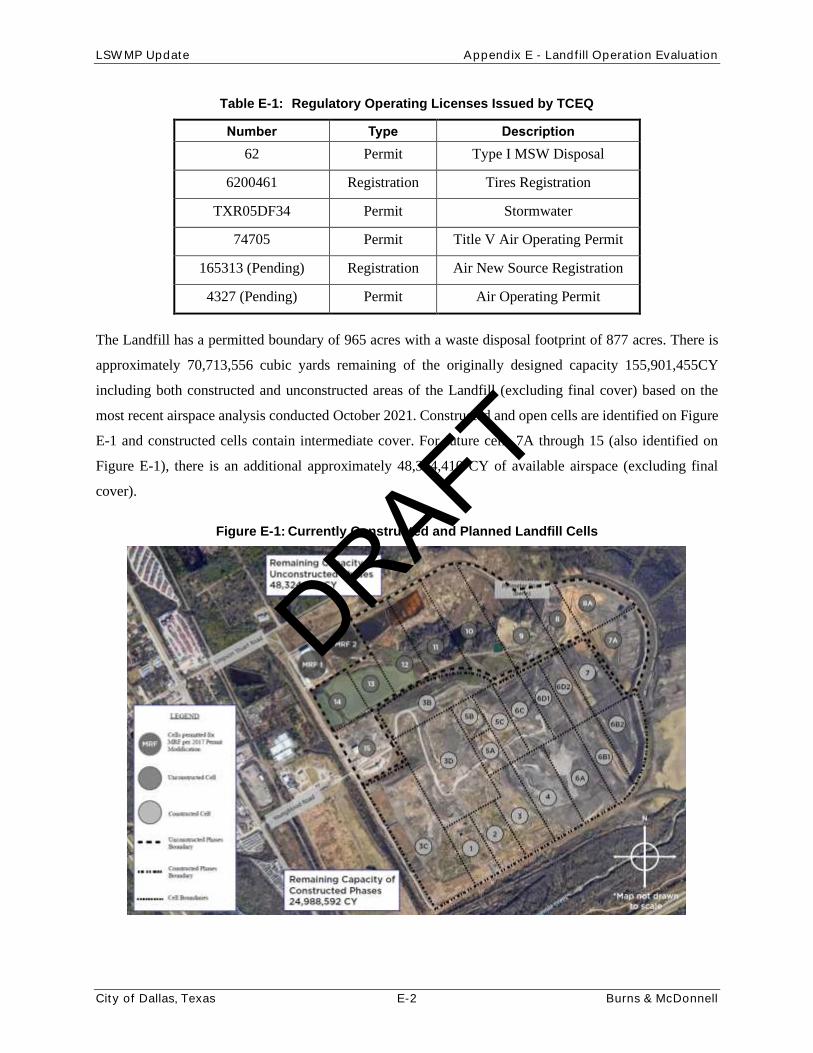
LSWMP Update Appendix E - Landfill Operation Evaluation
City of Dallas, Texas E-2 Burns & McDonnell
Table E-1: Regulatory Operating Licenses Issued by TCEQ
Number Type Description
62 Permit Type I MSW Disposal
6200461 Registration Tires Registration
TXR05DF34 Permit Stormwater
74705 Permit Title V Air Operating Permit
165313 (Pending) Registration Air New Source Registration
4327 (Pending) Permit Air Operating Permit
The Landfill has a permitted boundary of 965 acres with a waste disposal footprint of 877 acres. There is
approximately 70,713,556 cubic yards remaining of the originally designed capacity 155,901,455CY
including both constructed and unconstructed areas of the Landfill (excluding final cover) based on the
most recent airspace analysis conducted October 2021. Constructed and open cells are identified on Figure
E-1 and constructed cells contain intermediate cover. For future cells 7A through 15 (also identified on
Figure E-1), there is an additional approximately 48,324,410 CY of available airspace (excluding final
cover).
Figure E-1: Currently Constructed and Planned Landfill Cells
DRAFT
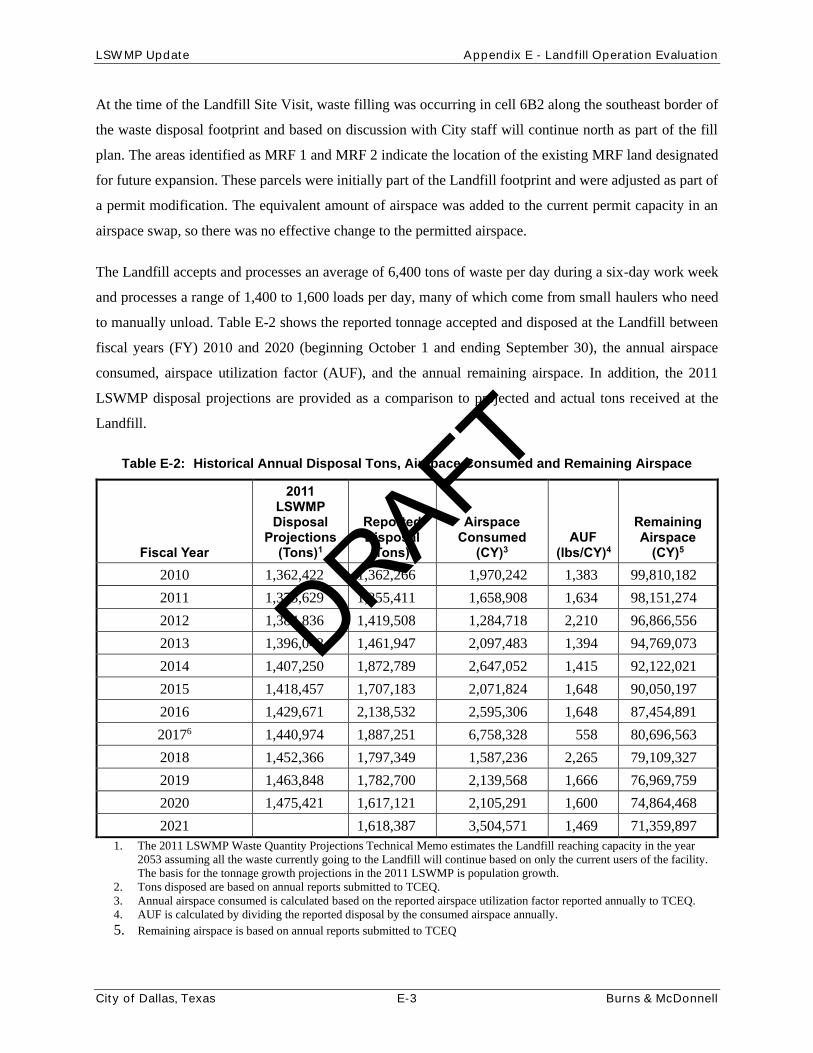
LSWMP Update Appendix E - Landfill Operation Evaluation
City of Dallas, Texas E-3 Burns & McDonnell
At the time of the Landfill Site Visit, waste filling was occurring in cell 6B2 along the southeast border of
the waste disposal footprint and based on discussion with City staff will continue north as part of the fill
plan. The areas identified as MRF 1 and MRF 2 indicate the location of the existing MRF land designated
for future expansion. These parcels were initially part of the Landfill footprint and were adjusted as part of
a permit modification. The equivalent amount of airspace was added to the current permit capacity in an
airspace swap, so there was no effective change to the permitted airspace.
The Landfill accepts and processes an average of 6,400 tons of waste per day during a six-day work week
and processes a range of 1,400 to 1,600 loads per day, many of which come from small haulers who need
to manually unload. Table E-2 shows the reported tonnage accepted and disposed at the Landfill between
fiscal years (FY) 2010 and 2020 (beginning October 1 and ending September 30), the annual airspace
consumed, airspace utilization factor (AUF), and the annual remaining airspace. In addition, the 2011
LSWMP disposal projections are provided as a comparison to projected and actual tons received at the
Landfill.
Table E-2: Historical Annual Disposal Tons, Airspace Consumed and Remaining Airspace
Fiscal Year
2011 LSWMP Disposal
Projections (Tons)1
Reported Disposal (Tons)2
Airspace Consumed
(CY)3 AUF
(lbs/CY)4
Remaining Airspace
(CY)5
2010 1,362,422 1,362,266 1,970,242 1,383 99,810,182
2011 1,373,629 1,355,411 1,658,908 1,634 98,151,274
2012 1,384,836 1,419,508 1,284,718 2,210 96,866,556
2013 1,396,043 1,461,947 2,097,483 1,394 94,769,073
2014 1,407,250 1,872,789 2,647,052 1,415 92,122,021
2015 1,418,457 1,707,183 2,071,824 1,648 90,050,197
2016 1,429,671 2,138,532 2,595,306 1,648 87,454,891
20176 1,440,974 1,887,251 6,758,328 558 80,696,563
2018 1,452,366 1,797,349 1,587,236 2,265 79,109,327
2019 1,463,848 1,782,700 2,139,568 1,666 76,969,759
2020 1,475,421 1,617,121 2,105,291 1,600 74,864,468
2021 1,618,387 3,504,571 1,469 71,359,897
1. The 2011 LSWMP Waste Quantity Projections Technical Memo estimates the Landfill reaching capacity in the year
2053 assuming all the waste currently going to the Landfill will continue based on only the current users of the facility.
The basis for the tonnage growth projections in the 2011 LSWMP is population growth.
2. Tons disposed are based on annual reports submitted to TCEQ.
3. Annual airspace consumed is calculated based on the reported airspace utilization factor reported annually to TCEQ.
4. AUF is calculated by dividing the reported disposal by the consumed airspace annually.
5. Remaining airspace is based on annual reports submitted to TCEQ
DRAFT
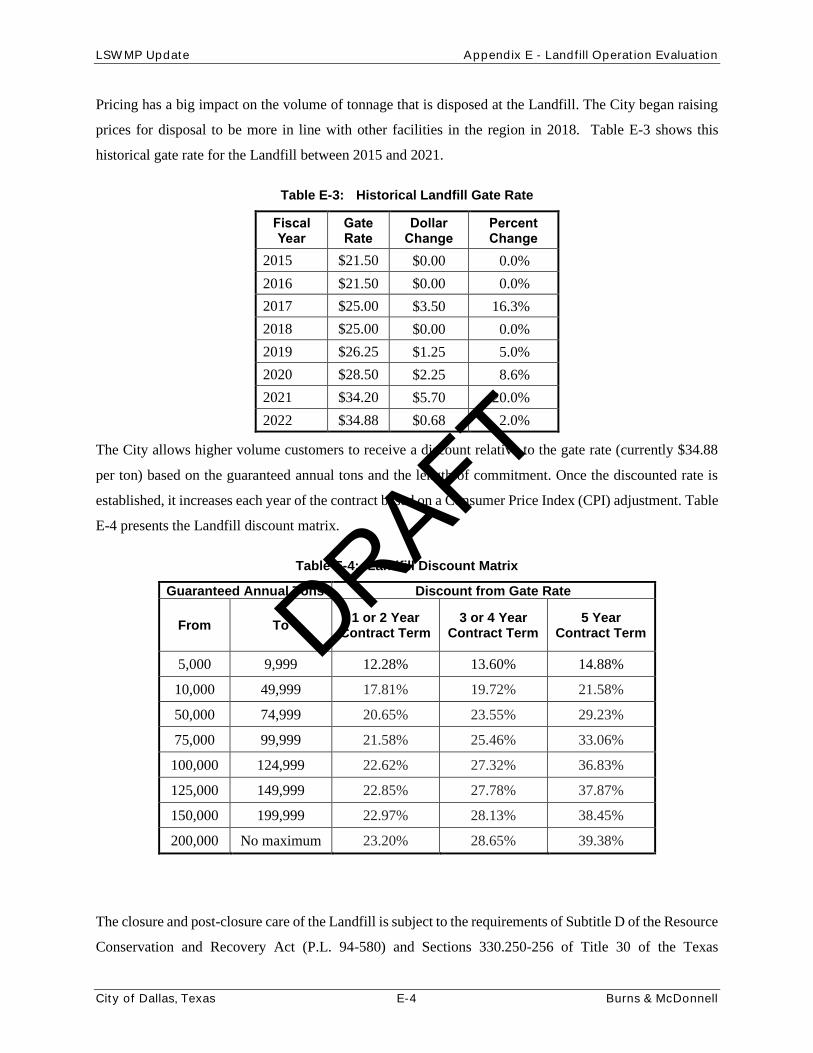
LSWMP Update Appendix E - Landfill Operation Evaluation
City of Dallas, Texas E-4 Burns & McDonnell
Pricing has a big impact on the volume of tonnage that is disposed at the Landfill. The City began raising
prices for disposal to be more in line with other facilities in the region in 2018. Table E-3 shows this
historical gate rate for the Landfill between 2015 and 2021.
Table E-3: Historical Landfill Gate Rate
Fiscal Year
Gate Rate
Dollar Change
Percent Change
2015 $21.50 $0.00 0.0%
2016 $21.50 $0.00 0.0%
2017 $25.00 $3.50 16.3%
2018 $25.00 $0.00 0.0%
2019 $26.25 $1.25 5.0%
2020 $28.50 $2.25 8.6%
2021 $34.20 $5.70 20.0%
2022 $34.88 $0.68 2.0%
The City allows higher volume customers to receive a discount relative to the gate rate (currently $34.88
per ton) based on the guaranteed annual tons and the length of commitment. Once the discounted rate is
established, it increases each year of the contract based on a Consumer Price Index (CPI) adjustment. Table
E-4 presents the Landfill discount matrix.
Table E-4: Landfill Discount Matrix
Guaranteed Annual Tons Discount from Gate Rate
From To 1 or 2 Year
Contract Term 3 or 4 Year
Contract Term 5 Year
Contract Term
5,000 9,999 12.28% 13.60% 14.88%
10,000 49,999 17.81% 19.72% 21.58%
50,000 74,999 20.65% 23.55% 29.23%
75,000 99,999 21.58% 25.46% 33.06%
100,000 124,999 22.62% 27.32% 36.83%
125,000 149,999 22.85% 27.78% 37.87%
150,000 199,999 22.97% 28.13% 38.45%
200,000 No maximum 23.20% 28.65% 39.38%
The closure and post-closure care of the Landfill is subject to the requirements of Subtitle D of the Resource
Conservation and Recovery Act (P.L. 94-580) and Sections 330.250-256 of Title 30 of the Texas
DRAFT
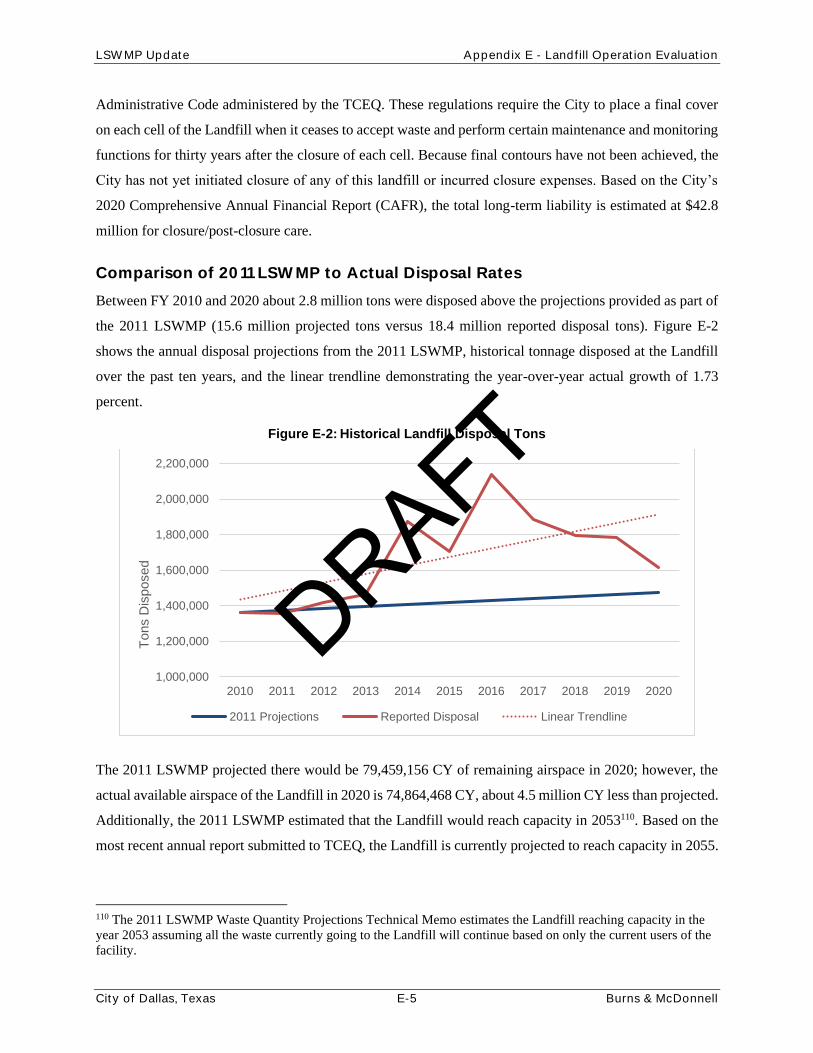
LSWMP Update Appendix E - Landfill Operation Evaluation
City of Dallas, Texas E-5 Burns & McDonnell
Administrative Code administered by the TCEQ. These regulations require the City to place a final cover
on each cell of the Landfill when it ceases to accept waste and perform certain maintenance and monitoring
functions for thirty years after the closure of each cell. Because final contours have not been achieved, the
City has not yet initiated closure of any of this landfill or incurred closure expenses. Based on the City’s
2020 Comprehensive Annual Financial Report (CAFR), the total long-term liability is estimated at $42.8
million for closure/post-closure care.
Comparison of 2011 LSWMP to Actual Disposal Rates
Between FY 2010 and 2020 about 2.8 million tons were disposed above the projections provided as part of
the 2011 LSWMP (15.6 million projected tons versus 18.4 million reported disposal tons). Figure E-2
shows the annual disposal projections from the 2011 LSWMP, historical tonnage disposed at the Landfill
over the past ten years, and the linear trendline demonstrating the year-over-year actual growth of 1.73
percent.
Figure E-2: Historical Landfill Disposal Tons
The 2011 LSWMP projected there would be 79,459,156 CY of remaining airspace in 2020; however, the
actual available airspace of the Landfill in 2020 is 74,864,468 CY, about 4.5 million CY less than projected.
Additionally, the 2011 LSWMP estimated that the Landfill would reach capacity in 2053110. Based on the
most recent annual report submitted to TCEQ, the Landfill is currently projected to reach capacity in 2055.
110 The 2011 LSWMP Waste Quantity Projections Technical Memo estimates the Landfill reaching capacity in the
year 2053 assuming all the waste currently going to the Landfill will continue based on only the current users of the
facility.
1,000,000
1,200,000
1,400,000
1,600,000
1,800,000
2,000,000
2,200,000
2010 2011 2012 2013 2014 2015 2016 2017 2018 2019 2020
Tons D
isposed
2011 Projections Reported Disposal Linear Trendline
DRAFT
LSWMP Update Appendix E - Landfill Operation Evaluation
City of Dallas, Texas E-6 Burns & McDonnell
Airspace Utilization Factor
The Landfill’s AUF is key to understanding how well waste disposal is being managed to conserve airspace
and is a critical component of projecting remaining Landfill life and planning for future cell constructions
and closures. The AUF is a measure of the total airspace consumed by the tonnage of waste disposed. To
calculate the AUF, the following information is required:
• Tonnage of the waste disposed in the Landfill during a period of time
• Airspace utilized in cubic yards during the same period of time
The AUF is calculated by the following equation:
𝐴𝑈𝐹 (𝑝𝑜𝑢𝑛𝑑𝑠
𝐶𝑌) =
𝑊𝑎𝑠𝑡𝑒 𝐷𝑖𝑠𝑝𝑜𝑠𝑒𝑑 (𝑡𝑜𝑛𝑠) × 2,000𝑝𝑜𝑢𝑛𝑑𝑠
𝑡𝑜𝑛𝑇𝑜𝑡𝑎𝑙 𝐴𝑖𝑟𝑠𝑝𝑎𝑐𝑒 𝐶𝑜𝑛𝑠𝑢𝑚𝑒𝑑 (𝐶𝑌)
The average historic annual AUF based on the data reported to TCEQ between 2010 and 2020 is about
1,600 pounds per cubic yard (lbs/CY). Based on industry experience, an AUF of greater than 1,400 lbs/CY
is achievable if the staffing and equipment is deployed strategically. The City is currently exceeding this
based on calculations. Cover soil is excavated from the levee surrounding the east side of the Landfill
adjacent to the Trinity River as part of an ongoing floodplain project. Although operations are able to
achieve economies of scale to minimize the amount of soil used for cover, staff indicated during the Landfill
Site Visit that soil usage ranges between 15 and 30 percent of the disposed material, including 18 inches of
intermediate cover. Using soil at a rate of 15 to 20 percent of material disposed is more typical for a facility
of this size; however, the City is able to mitigate litter, erosion and fugitive emissions with the application
of 18 inches of intermediate cover.
Staffing
This section describes the Landfill required staffing levels, vacancies, training, and safety considerations.
Staff operate two shifts from (1) 3:30 am to 3:00 pm and (2) 10:30 am to close on a four days per week 10
hours per day schedule. Table E-5 shows the current staffing for the Landfill management and operations
staff involved in the direct operations of the Landfill (e.g., environmental coordinators, hazardous waste
inspectors, and office assistance are not included).
DRAFT
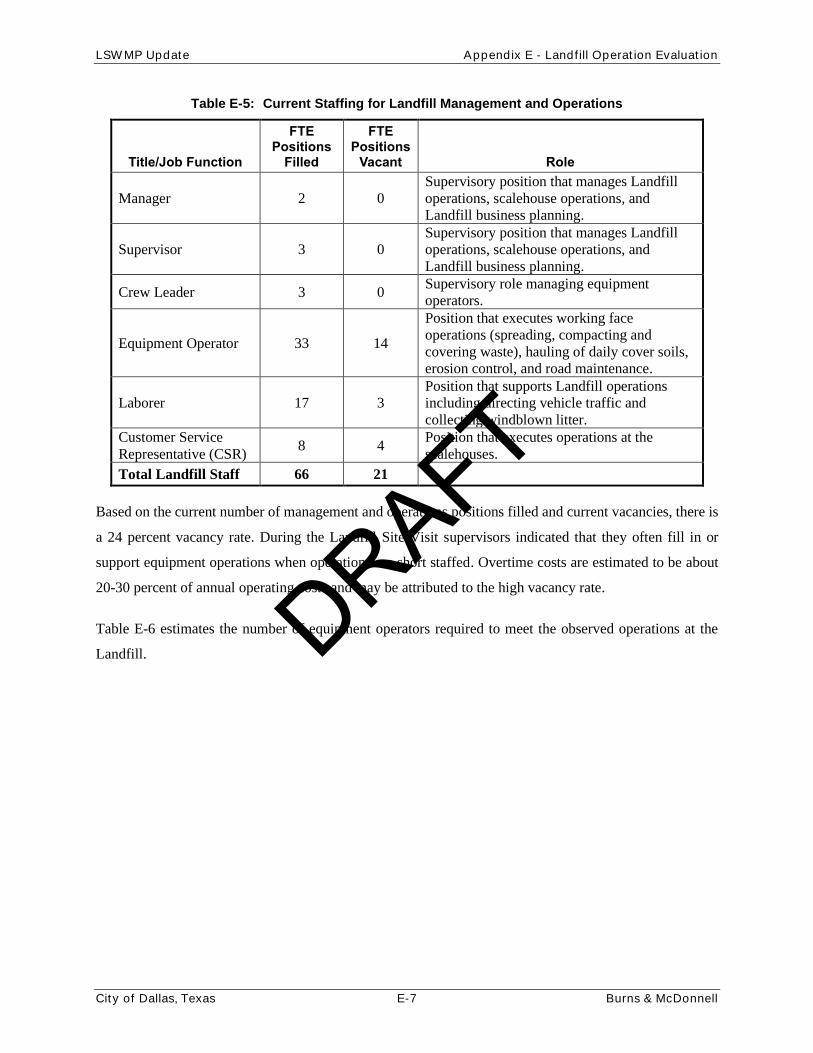
LSWMP Update Appendix E - Landfill Operation Evaluation
City of Dallas, Texas E-7 Burns & McDonnell
Table E-5: Current Staffing for Landfill Management and Operations
Title/Job Function
FTE Positions
Filled
FTE Positions
Vacant Role
Manager 2 0
Supervisory position that manages Landfill
operations, scalehouse operations, and
Landfill business planning.
Supervisor 3 0
Supervisory position that manages Landfill
operations, scalehouse operations, and
Landfill business planning.
Crew Leader 3 0 Supervisory role managing equipment
operators.
Equipment Operator 33 14
Position that executes working face
operations (spreading, compacting and
covering waste), hauling of daily cover soils,
erosion control, and road maintenance.
Laborer 17 3
Position that supports Landfill operations
including directing vehicle traffic and
collecting windblown litter.
Customer Service
Representative (CSR) 8 4
Position that executes operations at the
scalehouses.
Total Landfill Staff 66 21
Based on the current number of management and operations positions filled and current vacancies, there is
a 24 percent vacancy rate. During the Landfill Site Visit supervisors indicated that they often fill in or
support equipment operations when operations are short staffed. Overtime costs are estimated to be about
20-30 percent of annual operating costs and may be attributed to the high vacancy rate.
Table E-6 estimates the number of equipment operators required to meet the observed operations at the
Landfill. DRAFT
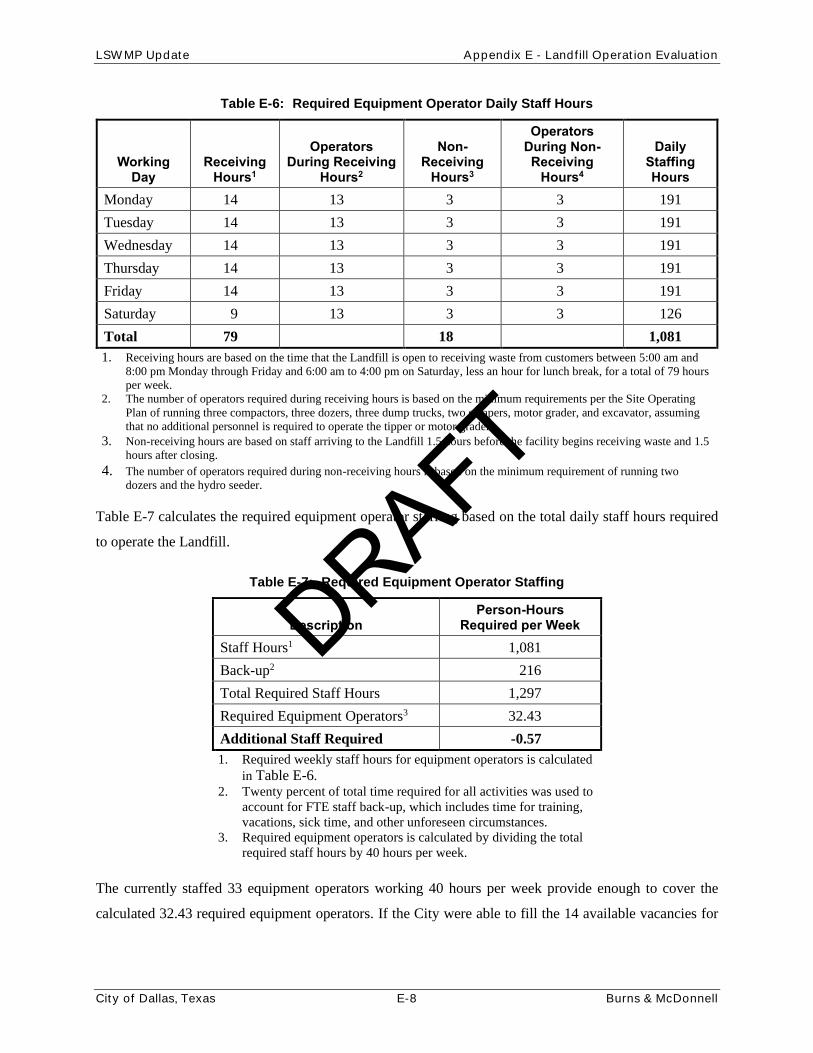
LSWMP Update Appendix E - Landfill Operation Evaluation
City of Dallas, Texas E-8 Burns & McDonnell
Table E-6: Required Equipment Operator Daily Staff Hours
Working Day
Receiving Hours1
Operators During Receiving
Hours2
Non-Receiving
Hours3
Operators During Non-Receiving
Hours4
Daily Staffing Hours
Monday 14 13 3 3 191
Tuesday 14 13 3 3 191
Wednesday 14 13 3 3 191
Thursday 14 13 3 3 191
Friday 14 13 3 3 191
Saturday 9 13 3 3 126
Total 79 18 1,081
1. Receiving hours are based on the time that the Landfill is open to receiving waste from customers between 5:00 am and
8:00 pm Monday through Friday and 6:00 am to 4:00 pm on Saturday, less an hour for lunch break, for a total of 79 hours
per week. 2. The number of operators required during receiving hours is based on the minimum requirements per the Site Operating
Plan of running three compactors, three dozers, three dump trucks, two scrapers, motor grader, and excavator, assuming
that no additional personnel is required to operate the tipper or motor grader.
3. Non-receiving hours are based on staff arriving to the Landfill 1.5 hours before the facility begins receiving waste and 1.5
hours after closing.
4. The number of operators required during non-receiving hours is based on the minimum requirement of running two
dozers and the hydro seeder.
Table E-7 calculates the required equipment operator staffing based on the total daily staff hours required
to operate the Landfill.
Table E-7: Required Equipment Operator Staffing
Description Person-Hours
Required per Week
Staff Hours1 1,081
Back-up2 216
Total Required Staff Hours 1,297
Required Equipment Operators3 32.43
Additional Staff Required -0.57
1. Required weekly staff hours for equipment operators is calculated
in Table E-6.
2. Twenty percent of total time required for all activities was used to
account for FTE staff back-up, which includes time for training,
vacations, sick time, and other unforeseen circumstances.
3. Required equipment operators is calculated by dividing the total
required staff hours by 40 hours per week.
The currently staffed 33 equipment operators working 40 hours per week provide enough to cover the
calculated 32.43 required equipment operators. If the City were able to fill the 14 available vacancies for
DRAFT
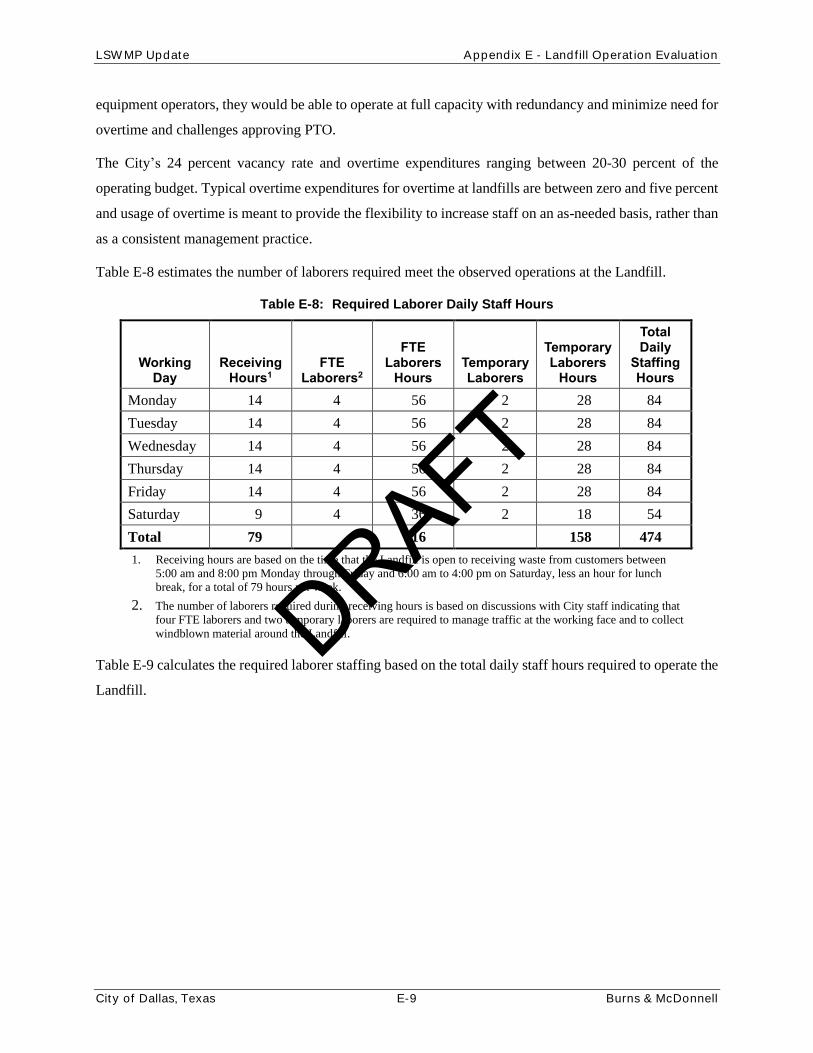
LSWMP Update Appendix E - Landfill Operation Evaluation
City of Dallas, Texas E-9 Burns & McDonnell
equipment operators, they would be able to operate at full capacity with redundancy and minimize need for
overtime and challenges approving PTO.
The City’s 24 percent vacancy rate and overtime expenditures ranging between 20-30 percent of the
operating budget. Typical overtime expenditures for overtime at landfills are between zero and five percent
and usage of overtime is meant to provide the flexibility to increase staff on an as-needed basis, rather than
as a consistent management practice.
Table E-8 estimates the number of laborers required meet the observed operations at the Landfill.
Table E-8: Required Laborer Daily Staff Hours
Working Day
Receiving Hours1
FTE Laborers2
FTE Laborers
Hours Temporary Laborers
Temporary Laborers
Hours
Total Daily
Staffing Hours
Monday 14 4 56 2 28 84
Tuesday 14 4 56 2 28 84
Wednesday 14 4 56 2 28 84
Thursday 14 4 56 2 28 84
Friday 14 4 56 2 28 84
Saturday 9 4 36 2 18 54
Total 79 316 158 474
1. Receiving hours are based on the time that the Landfill is open to receiving waste from customers between
5:00 am and 8:00 pm Monday through Friday and 6:00 am to 4:00 pm on Saturday, less an hour for lunch
break, for a total of 79 hours per week.
2. The number of laborers required during receiving hours is based on discussions with City staff indicating that
four FTE laborers and two temporary laborers are required to manage traffic at the working face and to collect
windblown material around the Landfill.
Table E-9 calculates the required laborer staffing based on the total daily staff hours required to operate the
Landfill.
DRAFT
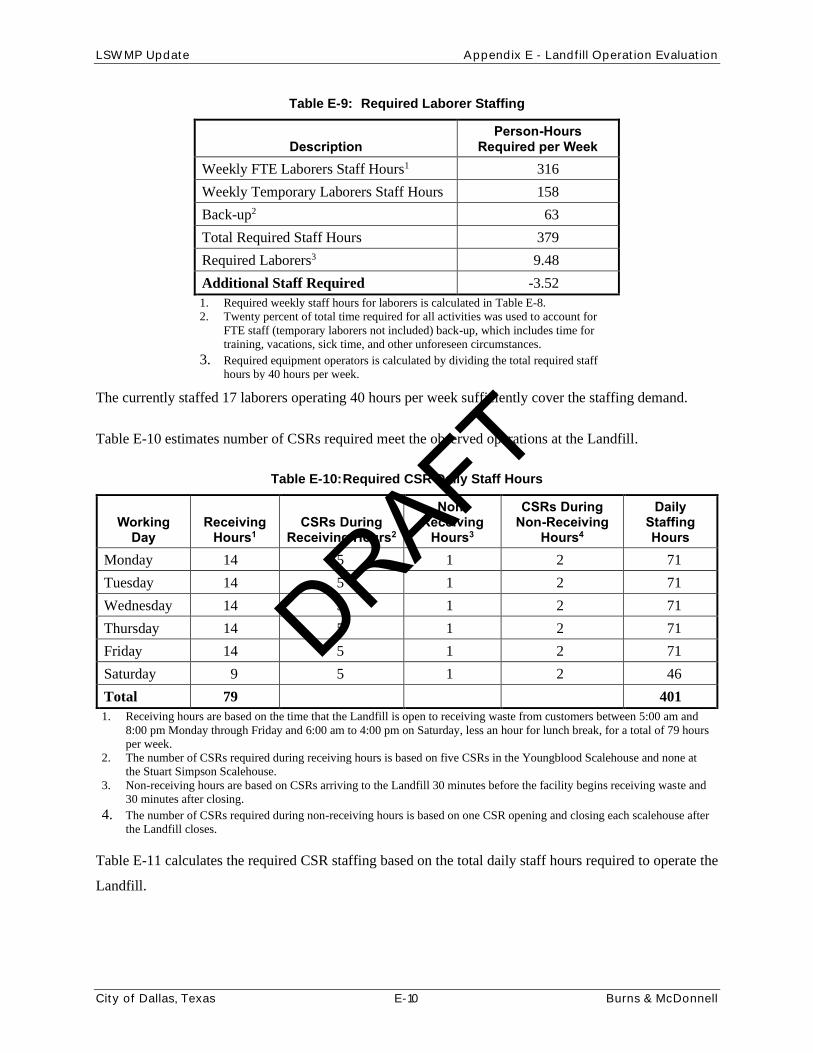
LSWMP Update Appendix E - Landfill Operation Evaluation
City of Dallas, Texas E-10 Burns & McDonnell
Table E-9: Required Laborer Staffing
Description Person-Hours
Required per Week
Weekly FTE Laborers Staff Hours1 316
Weekly Temporary Laborers Staff Hours 158
Back-up2 63
Total Required Staff Hours 379
Required Laborers3 9.48
Additional Staff Required -3.52
1. Required weekly staff hours for laborers is calculated in Table E-8.
2. Twenty percent of total time required for all activities was used to account for
FTE staff (temporary laborers not included) back-up, which includes time for
training, vacations, sick time, and other unforeseen circumstances.
3. Required equipment operators is calculated by dividing the total required staff
hours by 40 hours per week.
The currently staffed 17 laborers operating 40 hours per week sufficiently cover the staffing demand.
Table E-10 estimates number of CSRs required meet the observed operations at the Landfill.
Table E-10: Required CSR Daily Staff Hours
Working Day
Receiving Hours1
CSRs During Receiving Hours2
Non-Receiving
Hours3
CSRs During Non-Receiving
Hours4
Daily Staffing Hours
Monday 14 5 1 2 71
Tuesday 14 5 1 2 71
Wednesday 14 5 1 2 71
Thursday 14 5 1 2 71
Friday 14 5 1 2 71
Saturday 9 5 1 2 46
Total 79 401
1. Receiving hours are based on the time that the Landfill is open to receiving waste from customers between 5:00 am and
8:00 pm Monday through Friday and 6:00 am to 4:00 pm on Saturday, less an hour for lunch break, for a total of 79 hours
per week.
2. The number of CSRs required during receiving hours is based on five CSRs in the Youngblood Scalehouse and none at
the Stuart Simpson Scalehouse.
3. Non-receiving hours are based on CSRs arriving to the Landfill 30 minutes before the facility begins receiving waste and
30 minutes after closing.
4. The number of CSRs required during non-receiving hours is based on one CSR opening and closing each scalehouse after
the Landfill closes.
Table E-11 calculates the required CSR staffing based on the total daily staff hours required to operate the
Landfill.
DRAFT
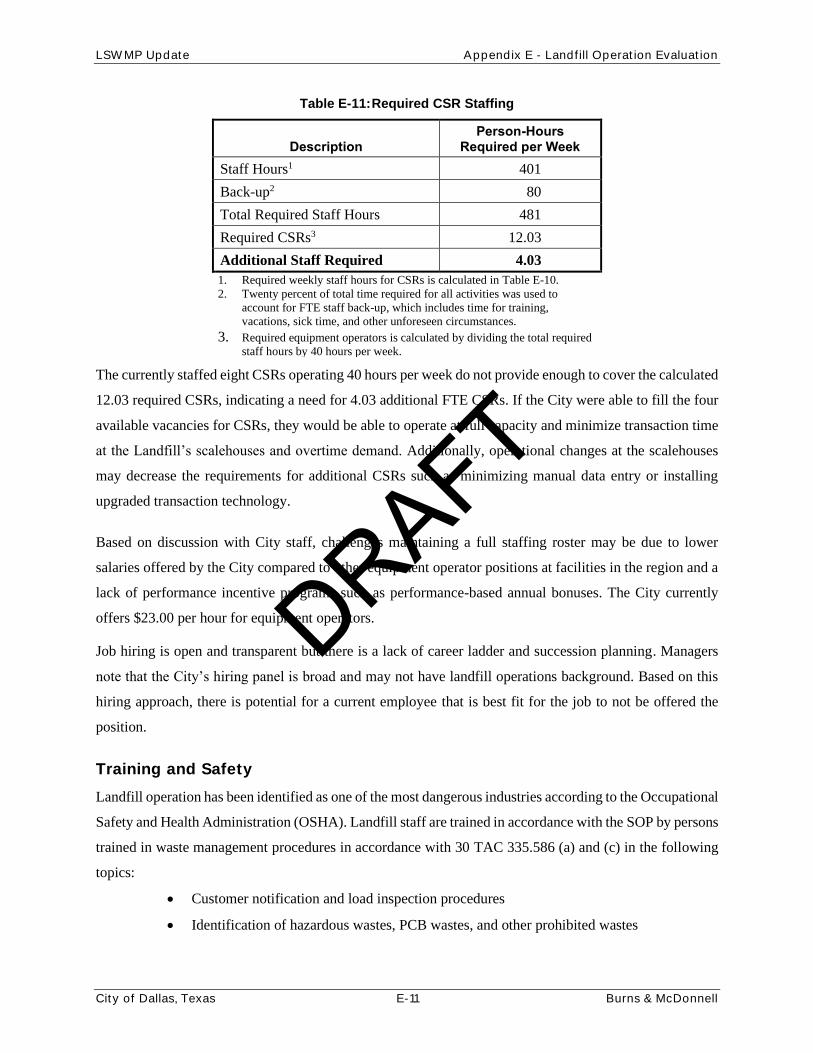
LSWMP Update Appendix E - Landfill Operation Evaluation
City of Dallas, Texas E-11 Burns & McDonnell
Table E-11: Required CSR Staffing
Description Person-Hours
Required per Week
Staff Hours1 401
Back-up2 80
Total Required Staff Hours 481
Required CSRs3 12.03
Additional Staff Required 4.03
1. Required weekly staff hours for CSRs is calculated in Table E-10.
2. Twenty percent of total time required for all activities was used to
account for FTE staff back-up, which includes time for training,
vacations, sick time, and other unforeseen circumstances.
3. Required equipment operators is calculated by dividing the total required
staff hours by 40 hours per week.
The currently staffed eight CSRs operating 40 hours per week do not provide enough to cover the calculated
12.03 required CSRs, indicating a need for 4.03 additional FTE CSRs. If the City were able to fill the four
available vacancies for CSRs, they would be able to operate at full capacity and minimize transaction time
at the Landfill’s scalehouses and overtime demand. Additionally, operational changes at the scalehouses
may decrease the requirements for additional CSRs such as minimizing manual data entry or installing
upgraded transaction technology.
Based on discussion with City staff, challenges maintaining a full staffing roster may be due to lower
salaries offered by the City compared to other equipment operator positions at facilities in the region and a
lack of performance incentive programs such as performance-based annual bonuses. The City currently
offers $23.00 per hour for equipment operators.
Job hiring is open and transparent but there is a lack of career ladder and succession planning. Managers
note that the City’s hiring panel is broad and may not have landfill operations background. Based on this
hiring approach, there is potential for a current employee that is best fit for the job to not be offered the
position.
Training and Safety
Landfill operation has been identified as one of the most dangerous industries according to the Occupational
Safety and Health Administration (OSHA). Landfill staff are trained in accordance with the SOP by persons
trained in waste management procedures in accordance with 30 TAC 335.586 (a) and (c) in the following
topics:
• Customer notification and load inspection procedures
• Identification of hazardous wastes, PCB wastes, and other prohibited wastes
DRAFT
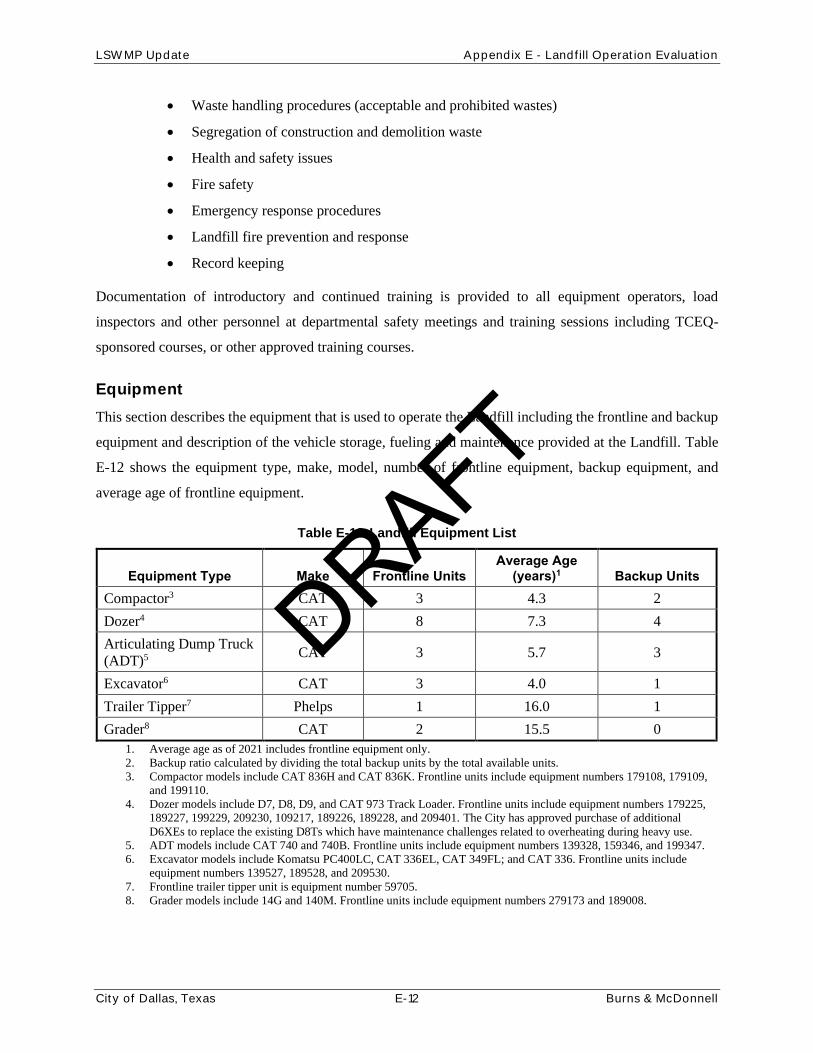
LSWMP Update Appendix E - Landfill Operation Evaluation
City of Dallas, Texas E-12 Burns & McDonnell
• Waste handling procedures (acceptable and prohibited wastes)
• Segregation of construction and demolition waste
• Health and safety issues
• Fire safety
• Emergency response procedures
• Landfill fire prevention and response
• Record keeping
Documentation of introductory and continued training is provided to all equipment operators, load
inspectors and other personnel at departmental safety meetings and training sessions including TCEQ-
sponsored courses, or other approved training courses.
Equipment
This section describes the equipment that is used to operate the Landfill including the frontline and backup
equipment and description of the vehicle storage, fueling and maintenance provided at the Landfill. Table
E-12 shows the equipment type, make, model, number of frontline equipment, backup equipment, and
average age of frontline equipment.
Table E-12: Landfill Equipment List
Equipment Type Make Frontline Units Average Age
(years)1 Backup Units
Compactor3 CAT 3 4.3 2
Dozer4 CAT 8 7.3 4
Articulating Dump Truck
(ADT)5 CAT 3 5.7 3
Excavator6 CAT 3 4.0 1
Trailer Tipper7 Phelps 1 16.0 1
Grader8 CAT 2 15.5 0
1. Average age as of 2021 includes frontline equipment only.
2. Backup ratio calculated by dividing the total backup units by the total available units.
3. Compactor models include CAT 836H and CAT 836K. Frontline units include equipment numbers 179108, 179109,
and 199110.
4. Dozer models include D7, D8, D9, and CAT 973 Track Loader. Frontline units include equipment numbers 179225,
189227, 199229, 209230, 109217, 189226, 189228, and 209401. The City has approved purchase of additional
D6XEs to replace the existing D8Ts which have maintenance challenges related to overheating during heavy use.
5. ADT models include CAT 740 and 740B. Frontline units include equipment numbers 139328, 159346, and 199347.
6. Excavator models include Komatsu PC400LC, CAT 336EL, CAT 349FL; and CAT 336. Frontline units include
equipment numbers 139527, 189528, and 209530.
7. Frontline trailer tipper unit is equipment number 59705.
8. Grader models include 14G and 140M. Frontline units include equipment numbers 279173 and 189008.
DRAFT
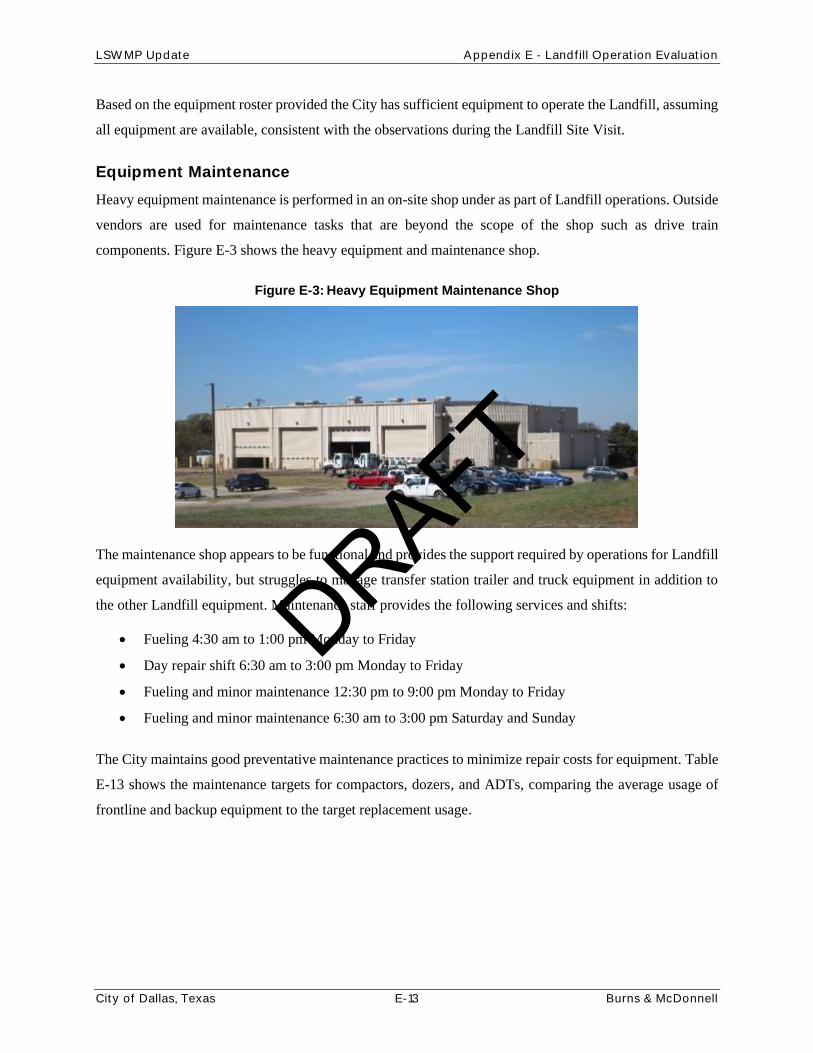
LSWMP Update Appendix E - Landfill Operation Evaluation
City of Dallas, Texas E-13 Burns & McDonnell
Based on the equipment roster provided the City has sufficient equipment to operate the Landfill, assuming
all equipment are available, consistent with the observations during the Landfill Site Visit.
Equipment Maintenance
Heavy equipment maintenance is performed in an on-site shop under as part of Landfill operations. Outside
vendors are used for maintenance tasks that are beyond the scope of the shop such as drive train
components. Figure E-3 shows the heavy equipment and maintenance shop.
Figure E-3: Heavy Equipment Maintenance Shop
The maintenance shop appears to be functional and provides the support required by operations for Landfill
equipment availability, but struggles to manage transfer station trailer and truck equipment in addition to
the other Landfill equipment. Maintenance staff provides the following services and shifts:
• Fueling 4:30 am to 1:00 pm Monday to Friday
• Day repair shift 6:30 am to 3:00 pm Monday to Friday
• Fueling and minor maintenance 12:30 pm to 9:00 pm Monday to Friday
• Fueling and minor maintenance 6:30 am to 3:00 pm Saturday and Sunday
The City maintains good preventative maintenance practices to minimize repair costs for equipment. Table
E-13 shows the maintenance targets for compactors, dozers, and ADTs, comparing the average usage of
frontline and backup equipment to the target replacement usage.
DRAFT
LSWMP Update Appendix E - Landfill Operation Evaluation
City of Dallas, Texas E-14 Burns & McDonnell
Table E-13: Equipment Replacement
Equipment Type
Target Replacement Usage (hours)
Average Frontline Usage to Date
Average Backup Usage to Date
Compactor 25,000 5,781 31,545
Bulldozer 25,000 12,487 18,180
Articulating Dump Truck 20,000 8,574 20,011
The PM practices in place include doing a certified powertrain (CPT) rebuild between 10,000 – 13,000
hours of run time and CAT performs undercarriage maintenance. The City experiences challenges meeting
equipment maintenance demand. Based on discussions with City staff, the heavy equipment and
maintenance shop is “worn out” and undersized and suffers from a lack of electrical infrastructure that was
diverted for other uses around the Landfill (e.g., unattended scale and wheel wash facility). Additionally,
manual forms and information tracking are utilized, which decreases operational capacity. This could be
addressed by implementing information technology upgrades for data entry and analysis.
In addition to the Landfill equipment, the heavy equipment and maintenance shop is also responsible for
maintaining the transfer station fleet. The rest of collection equipment is maintained by the Equipment and
Fleet Maintenance (EFM) department which causes challenges related to managing parts inventory and
storage, since collection vehicle parts would be stored to two different locations. Based on discussions with
City staff, more fleet equipment has been transferred over to the heavy equipment and maintenance shop
over time which has caused the facility to become too small for the equipment maintenance demand.
This section does not provide a dedicated analysis on maintenance staffing; however, during the Landfill
Site Visit City staff communicated there was a high turnover in maintenance staff and challenges filling
vacancies, have a limited inventory of parts. The maintenance shop has 15 mechanics and five vacancies.
Falling behind on equipment maintenance causes challenges with Landfill operations when there is
unplanned downtime for compactors, dozers, ADTs or other equipment. When the number of required units
are not available for these equipment types, Landfill operators may not be able to manage material as
efficiently from the tipping deck to the working face, achieve intended compaction rates, or haul material
(e.g., cover soil) around the site.
Waste Acceptance and Traffic Control
This section discusses the scalehouse operations, inbound vehicles, customer types, and the traffic control
measures implemented to manage vehicles traveling within the facility and to the working face.
DRAFT
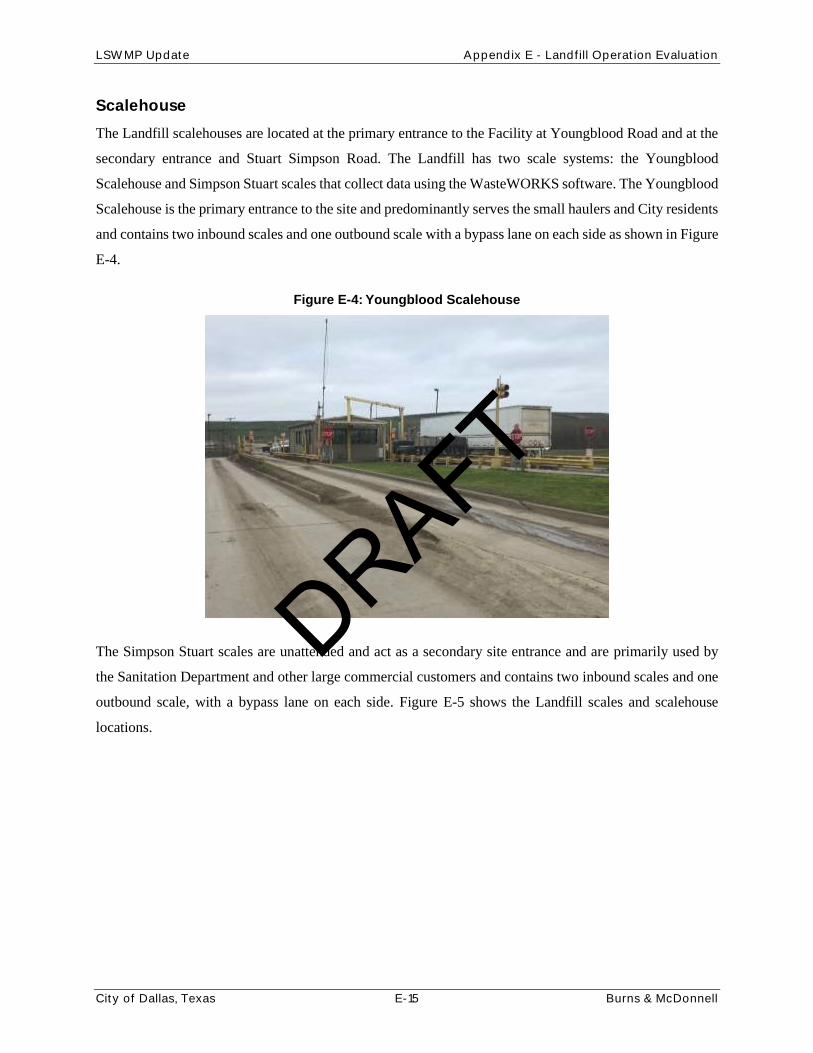
LSWMP Update Appendix E - Landfill Operation Evaluation
City of Dallas, Texas E-15 Burns & McDonnell
Scalehouse
The Landfill scalehouses are located at the primary entrance to the Facility at Youngblood Road and at the
secondary entrance and Stuart Simpson Road. The Landfill has two scale systems: the Youngblood
Scalehouse and Simpson Stuart scales that collect data using the WasteWORKS software. The Youngblood
Scalehouse is the primary entrance to the site and predominantly serves the small haulers and City residents
and contains two inbound scales and one outbound scale with a bypass lane on each side as shown in Figure
E-4.
Figure E-4: Youngblood Scalehouse
The Simpson Stuart scales are unattended and act as a secondary site entrance and are primarily used by
the Sanitation Department and other large commercial customers and contains two inbound scales and one
outbound scale, with a bypass lane on each side. Figure E-5 shows the Landfill scales and scalehouse
locations.
DRAFT
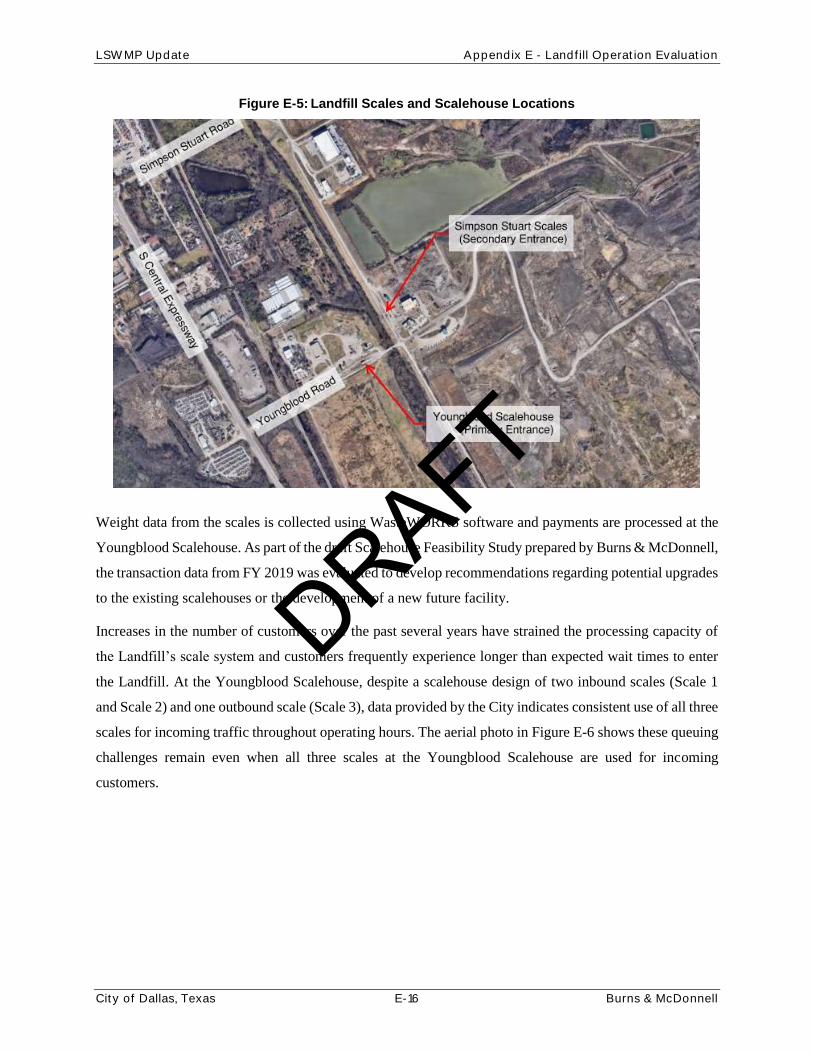
LSWMP Update Appendix E - Landfill Operation Evaluation
City of Dallas, Texas E-16 Burns & McDonnell
Figure E-5: Landfill Scales and Scalehouse Locations
Weight data from the scales is collected using WasteWORKS software and payments are processed at the
Youngblood Scalehouse. As part of the draft Scalehouse Feasibility Study prepared by Burns & McDonnell,
the transaction data from FY 2019 was evaluated to develop recommendations regarding potential upgrades
to the existing scalehouses or the development of a new future facility.
Increases in the number of customers over the past several years have strained the processing capacity of
the Landfill’s scale system and customers frequently experience longer than expected wait times to enter
the Landfill. At the Youngblood Scalehouse, despite a scalehouse design of two inbound scales (Scale 1
and Scale 2) and one outbound scale (Scale 3), data provided by the City indicates consistent use of all three
scales for incoming traffic throughout operating hours. The aerial photo in Figure E-6 shows these queuing
challenges remain even when all three scales at the Youngblood Scalehouse are used for incoming
customers.
DRAFT
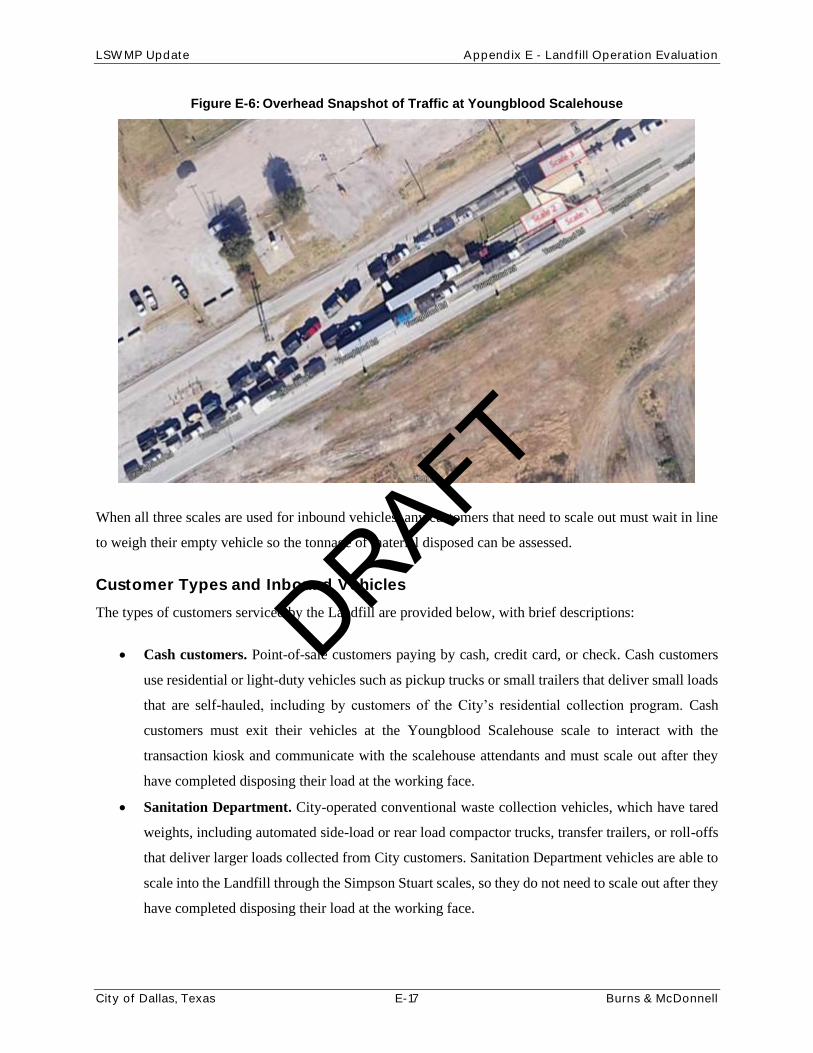
LSWMP Update Appendix E - Landfill Operation Evaluation
City of Dallas, Texas E-17 Burns & McDonnell
Figure E-6: Overhead Snapshot of Traffic at Youngblood Scalehouse
When all three scales are used for inbound vehicles, any customers that need to scale out must wait in line
to weigh their empty vehicle so the tonnage of material disposed can be assessed.
Customer Types and Inbound Vehicles
The types of customers serviced by the Landfill are provided below, with brief descriptions:
• Cash customers. Point-of-sale customers paying by cash, credit card, or check. Cash customers
use residential or light-duty vehicles such as pickup trucks or small trailers that deliver small loads
that are self-hauled, including by customers of the City’s residential collection program. Cash
customers must exit their vehicles at the Youngblood Scalehouse scale to interact with the
transaction kiosk and communicate with the scalehouse attendants and must scale out after they
have completed disposing their load at the working face.
• Sanitation Department. City-operated conventional waste collection vehicles, which have tared
weights, including automated side-load or rear load compactor trucks, transfer trailers, or roll-offs
that deliver larger loads collected from City customers. Sanitation Department vehicles are able to
scale into the Landfill through the Simpson Stuart scales, so they do not need to scale out after they
have completed disposing their load at the working face.
DRAFT
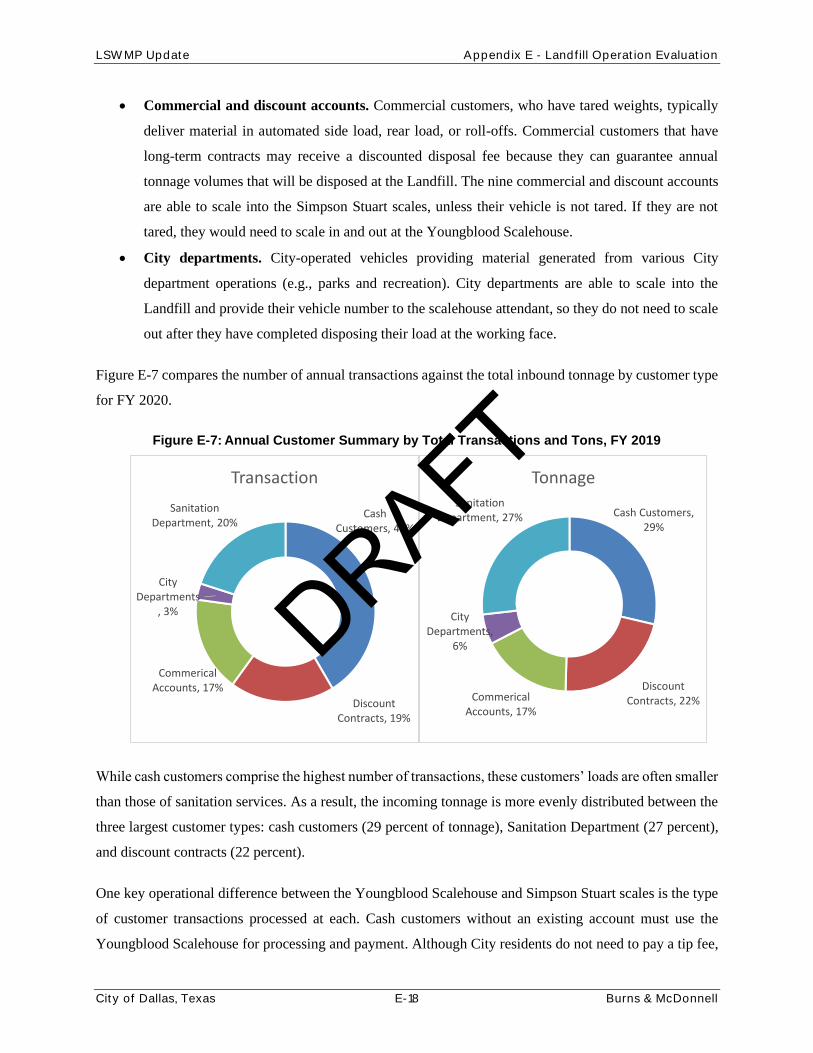
LSWMP Update Appendix E - Landfill Operation Evaluation
City of Dallas, Texas E-18 Burns & McDonnell
• Commercial and discount accounts. Commercial customers, who have tared weights, typically
deliver material in automated side load, rear load, or roll-offs. Commercial customers that have
long-term contracts may receive a discounted disposal fee because they can guarantee annual
tonnage volumes that will be disposed at the Landfill. The nine commercial and discount accounts
are able to scale into the Simpson Stuart scales, unless their vehicle is not tared. If they are not
tared, they would need to scale in and out at the Youngblood Scalehouse.
• City departments. City-operated vehicles providing material generated from various City
department operations (e.g., parks and recreation). City departments are able to scale into the
Landfill and provide their vehicle number to the scalehouse attendant, so they do not need to scale
out after they have completed disposing their load at the working face.
Figure E-7 compares the number of annual transactions against the total inbound tonnage by customer type
for FY 2020.
Figure E-7: Annual Customer Summary by Total Transactions and Tons, FY 2019
While cash customers comprise the highest number of transactions, these customers’ loads are often smaller
than those of sanitation services. As a result, the incoming tonnage is more evenly distributed between the
three largest customer types: cash customers (29 percent of tonnage), Sanitation Department (27 percent),
and discount contracts (22 percent).
One key operational difference between the Youngblood Scalehouse and Simpson Stuart scales is the type
of customer transactions processed at each. Cash customers without an existing account must use the
Youngblood Scalehouse for processing and payment. Although City residents do not need to pay a tip fee,
Cash Customers, 41%
Discount Contracts, 19%
Commerical Accounts, 17%
City Departments
, 3%
Sanitation Department, 20%
Transaction
Cash Customers, 29%
Discount Contracts, 22%Commerical
Accounts, 17%
City Departments,
6%
Sanitation Department, 27%
Tonnage
DRAFT
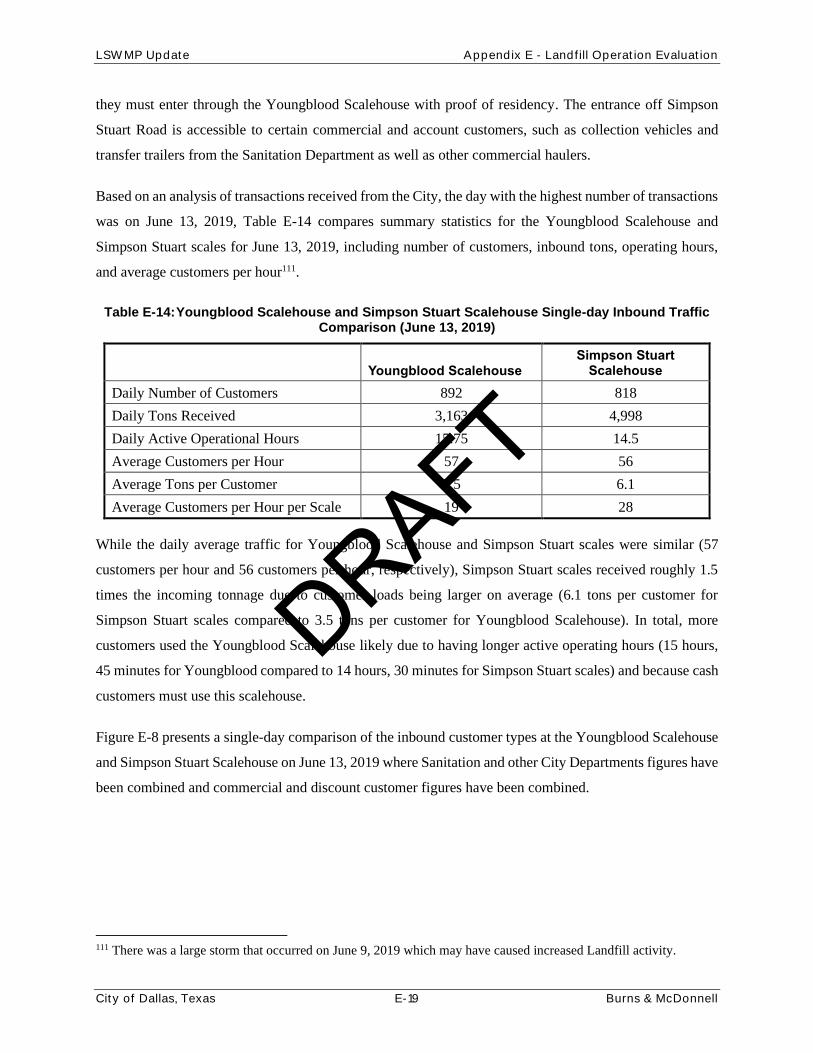
LSWMP Update Appendix E - Landfill Operation Evaluation
City of Dallas, Texas E-19 Burns & McDonnell
they must enter through the Youngblood Scalehouse with proof of residency. The entrance off Simpson
Stuart Road is accessible to certain commercial and account customers, such as collection vehicles and
transfer trailers from the Sanitation Department as well as other commercial haulers.
Based on an analysis of transactions received from the City, the day with the highest number of transactions
was on June 13, 2019, Table E-14 compares summary statistics for the Youngblood Scalehouse and
Simpson Stuart scales for June 13, 2019, including number of customers, inbound tons, operating hours,
and average customers per hour111.
Table E-14: Youngblood Scalehouse and Simpson Stuart Scalehouse Single-day Inbound Traffic Comparison (June 13, 2019)
Youngblood Scalehouse Simpson Stuart
Scalehouse
Daily Number of Customers 892 818
Daily Tons Received 3,163 4,998
Daily Active Operational Hours 15.75 14.5
Average Customers per Hour 57 56
Average Tons per Customer 3.5 6.1
Average Customers per Hour per Scale 19 28
While the daily average traffic for Youngblood Scalehouse and Simpson Stuart scales were similar (57
customers per hour and 56 customers per hour, respectively), Simpson Stuart scales received roughly 1.5
times the incoming tonnage due to customer loads being larger on average (6.1 tons per customer for
Simpson Stuart scales compared to 3.5 tons per customer for Youngblood Scalehouse). In total, more
customers used the Youngblood Scalehouse likely due to having longer active operating hours (15 hours,
45 minutes for Youngblood compared to 14 hours, 30 minutes for Simpson Stuart scales) and because cash
customers must use this scalehouse.
Figure E-8 presents a single-day comparison of the inbound customer types at the Youngblood Scalehouse
and Simpson Stuart Scalehouse on June 13, 2019 where Sanitation and other City Departments figures have
been combined and commercial and discount customer figures have been combined.
111 There was a large storm that occurred on June 9, 2019 which may have caused increased Landfill activity.
DRAFT
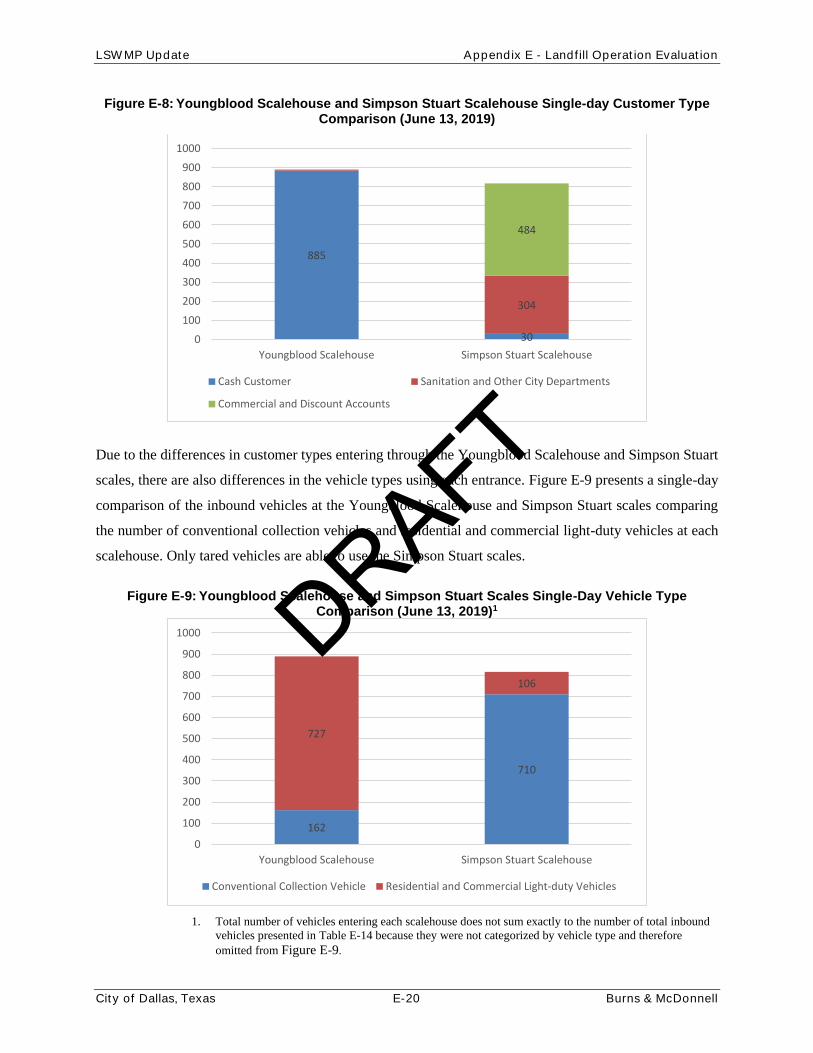
LSWMP Update Appendix E - Landfill Operation Evaluation
City of Dallas, Texas E-20 Burns & McDonnell
Figure E-8: Youngblood Scalehouse and Simpson Stuart Scalehouse Single-day Customer Type Comparison (June 13, 2019)
Due to the differences in customer types entering through the Youngblood Scalehouse and Simpson Stuart
scales, there are also differences in the vehicle types using each entrance. Figure E-9 presents a single-day
comparison of the inbound vehicles at the Youngblood Scalehouse and Simpson Stuart scales comparing
the number of conventional collection vehicles and residential and commercial light-duty vehicles at each
scalehouse. Only tared vehicles are able to use the Simpson Stuart scales.
Figure E-9: Youngblood Scalehouse and Simpson Stuart Scales Single-Day Vehicle Type Comparison (June 13, 2019)1
1. Total number of vehicles entering each scalehouse does not sum exactly to the number of total inbound
vehicles presented in Table E-14 because they were not categorized by vehicle type and therefore
omitted from Figure E-9.
885
30
304
484
0
100
200
300
400
500
600
700
800
900
1000
Youngblood Scalehouse Simpson Stuart Scalehouse
Cash Customer Sanitation and Other City Departments
Commercial and Discount Accounts
162
710
727
106
0
100
200
300
400
500
600
700
800
900
1000
Youngblood Scalehouse Simpson Stuart Scalehouse
Conventional Collection Vehicle Residential and Commercial Light-duty Vehicles
DRAFT
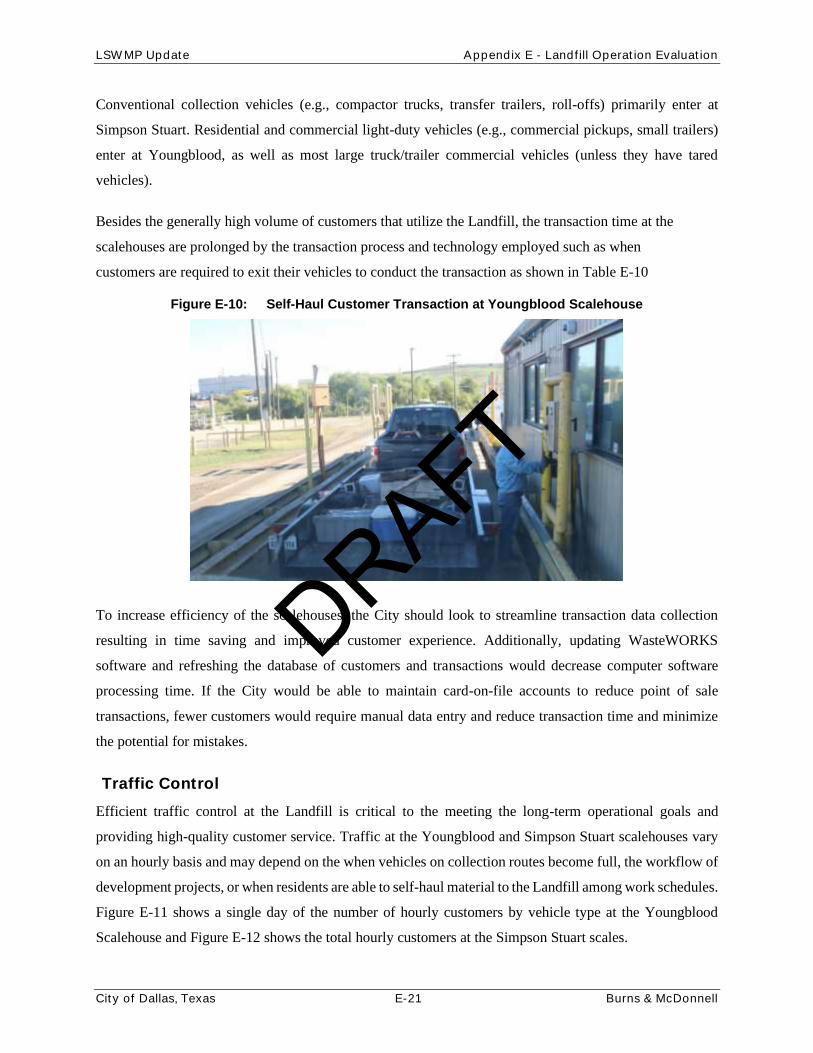
LSWMP Update Appendix E - Landfill Operation Evaluation
City of Dallas, Texas E-21 Burns & McDonnell
Conventional collection vehicles (e.g., compactor trucks, transfer trailers, roll-offs) primarily enter at
Simpson Stuart. Residential and commercial light-duty vehicles (e.g., commercial pickups, small trailers)
enter at Youngblood, as well as most large truck/trailer commercial vehicles (unless they have tared
vehicles).
Besides the generally high volume of customers that utilize the Landfill, the transaction time at the
scalehouses are prolonged by the transaction process and technology employed such as when
customers are required to exit their vehicles to conduct the transaction as shown in Table E-10
Figure E-10: Self-Haul Customer Transaction at Youngblood Scalehouse
To increase efficiency of the scalehouses, the City should look to streamline transaction data collection
resulting in time saving and improved customer experience. Additionally, updating WasteWORKS
software and refreshing the database of customers and transactions would decrease computer software
processing time. If the City would be able to maintain card-on-file accounts to reduce point of sale
transactions, fewer customers would require manual data entry and reduce transaction time and minimize
the potential for mistakes.
Traffic Control
Efficient traffic control at the Landfill is critical to the meeting the long-term operational goals and
providing high-quality customer service. Traffic at the Youngblood and Simpson Stuart scalehouses vary
on an hourly basis and may depend on the when vehicles on collection routes become full, the workflow of
development projects, or when residents are able to self-haul material to the Landfill among work schedules.
Figure E-11 shows a single day of the number of hourly customers by vehicle type at the Youngblood
Scalehouse and Figure E-12 shows the total hourly customers at the Simpson Stuart scales.
DRAFT
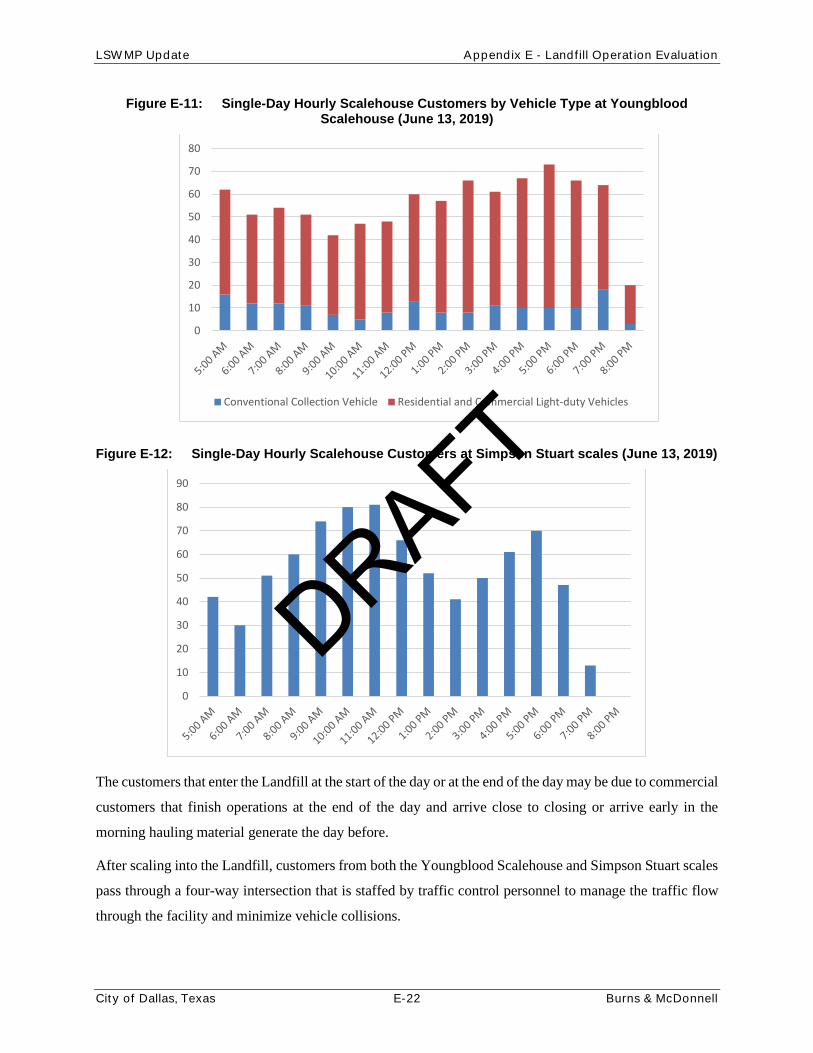
LSWMP Update Appendix E - Landfill Operation Evaluation
City of Dallas, Texas E-22 Burns & McDonnell
Figure E-11: Single-Day Hourly Scalehouse Customers by Vehicle Type at Youngblood Scalehouse (June 13, 2019)
Figure E-12: Single-Day Hourly Scalehouse Customers at Simpson Stuart scales (June 13, 2019)
The customers that enter the Landfill at the start of the day or at the end of the day may be due to commercial
customers that finish operations at the end of the day and arrive close to closing or arrive early in the
morning hauling material generate the day before.
After scaling into the Landfill, customers from both the Youngblood Scalehouse and Simpson Stuart scales
pass through a four-way intersection that is staffed by traffic control personnel to manage the traffic flow
through the facility and minimize vehicle collisions.
0
10
20
30
40
50
60
70
80
Conventional Collection Vehicle Residential and Commercial Light-duty Vehicles
0
10
20
30
40
50
60
70
80
90
DRAFT
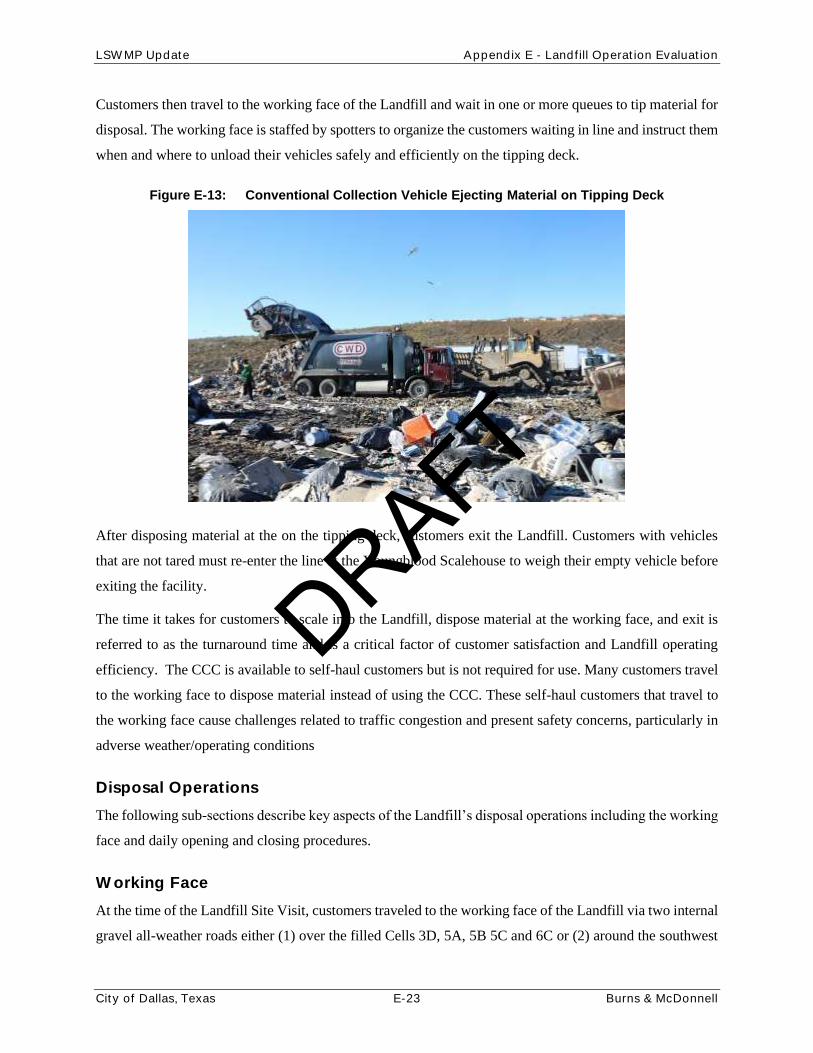
LSWMP Update Appendix E - Landfill Operation Evaluation
City of Dallas, Texas E-23 Burns & McDonnell
Customers then travel to the working face of the Landfill and wait in one or more queues to tip material for
disposal. The working face is staffed by spotters to organize the customers waiting in line and instruct them
when and where to unload their vehicles safely and efficiently on the tipping deck.
Figure E-13: Conventional Collection Vehicle Ejecting Material on Tipping Deck
After disposing material at the on the tipping deck, customers exit the Landfill. Customers with vehicles
that are not tared must re-enter the line at the Youngblood Scalehouse to weigh their empty vehicle before
exiting the facility.
The time it takes for customers to scale into the Landfill, dispose material at the working face, and exit is
referred to as the turnaround time and is a critical factor of customer satisfaction and Landfill operating
efficiency. The CCC is available to self-haul customers but is not required for use. Many customers travel
to the working face to dispose material instead of using the CCC. These self-haul customers that travel to
the working face cause challenges related to traffic congestion and present safety concerns, particularly in
adverse weather/operating conditions
Disposal Operations
The following sub-sections describe key aspects of the Landfill’s disposal operations including the working
face and daily opening and closing procedures.
Working Face
At the time of the Landfill Site Visit, customers traveled to the working face of the Landfill via two internal
gravel all-weather roads either (1) over the filled Cells 3D, 5A, 5B 5C and 6C or (2) around the southwest
DRAFT
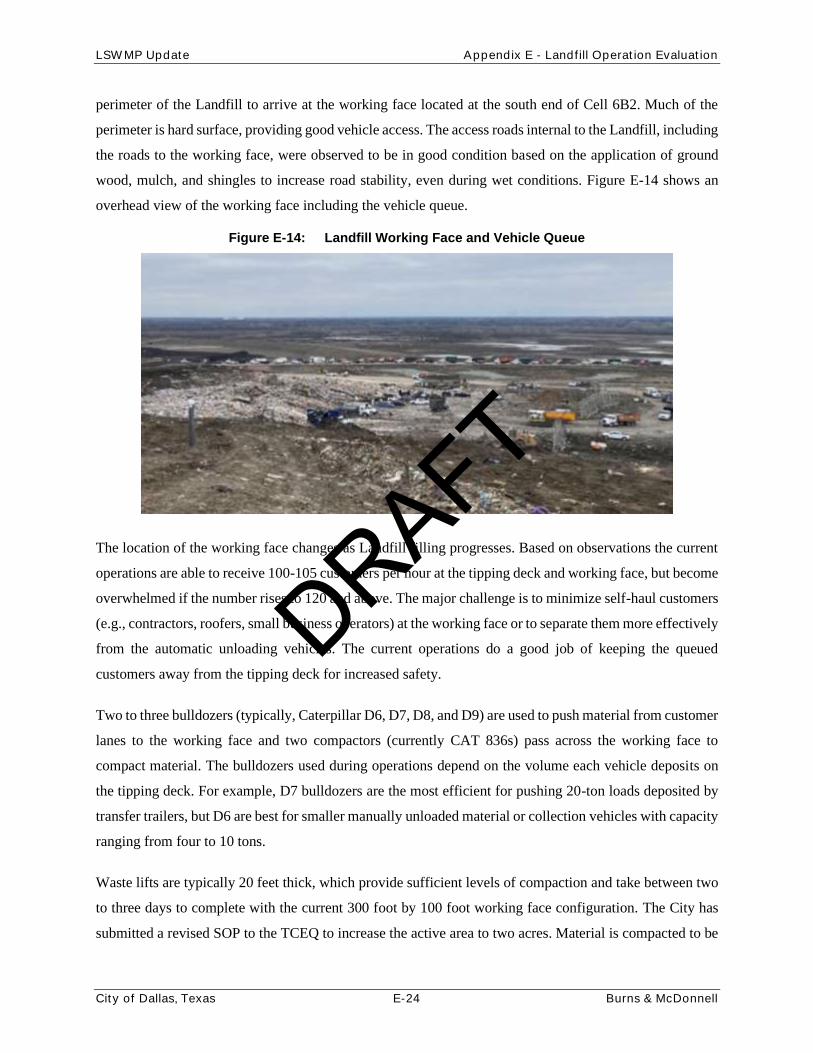
LSWMP Update Appendix E - Landfill Operation Evaluation
City of Dallas, Texas E-24 Burns & McDonnell
perimeter of the Landfill to arrive at the working face located at the south end of Cell 6B2. Much of the
perimeter is hard surface, providing good vehicle access. The access roads internal to the Landfill, including
the roads to the working face, were observed to be in good condition based on the application of ground
wood, mulch, and shingles to increase road stability, even during wet conditions. Figure E-14 shows an
overhead view of the working face including the vehicle queue.
Figure E-14: Landfill Working Face and Vehicle Queue
The location of the working face changes as Landfill filling progresses. Based on observations the current
operations are able to receive 100-105 customers per hour at the tipping deck and working face, but become
overwhelmed if the number rises to 120 and above. The major challenge is to minimize self-haul customers
(e.g., contractors, roofers, small business operators) at the working face or to separate them more effectively
from the automatic unloading vehicles. The current operations do a good job of keeping the queued
customers away from the tipping deck for increased safety.
Two to three bulldozers (typically, Caterpillar D6, D7, D8, and D9) are used to push material from customer
lanes to the working face and two compactors (currently CAT 836s) pass across the working face to
compact material. The bulldozers used during operations depend on the volume each vehicle deposits on
the tipping deck. For example, D7 bulldozers are the most efficient for pushing 20-ton loads deposited by
transfer trailers, but D6 are best for smaller manually unloaded material or collection vehicles with capacity
ranging from four to 10 tons.
Waste lifts are typically 20 feet thick, which provide sufficient levels of compaction and take between two
to three days to complete with the current 300 foot by 100 foot working face configuration. The City has
submitted a revised SOP to the TCEQ to increase the active area to two acres. Material is compacted to be
DRAFT
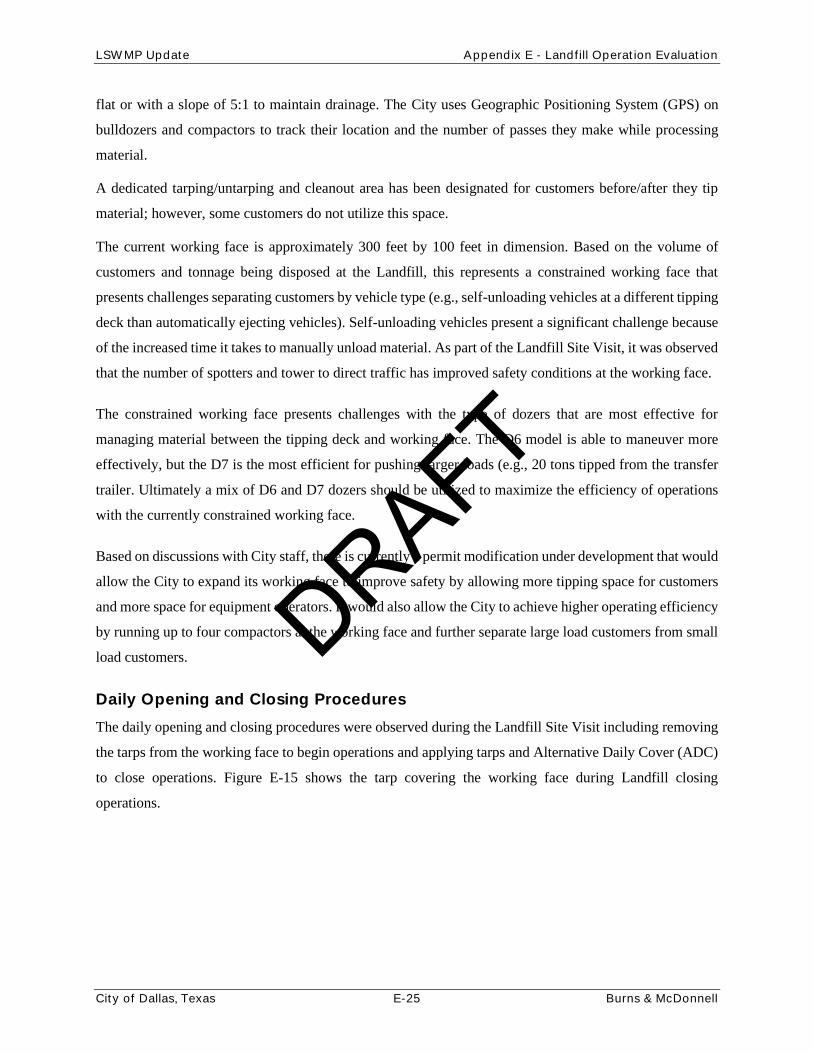
LSWMP Update Appendix E - Landfill Operation Evaluation
City of Dallas, Texas E-25 Burns & McDonnell
flat or with a slope of 5:1 to maintain drainage. The City uses Geographic Positioning System (GPS) on
bulldozers and compactors to track their location and the number of passes they make while processing
material.
A dedicated tarping/untarping and cleanout area has been designated for customers before/after they tip
material; however, some customers do not utilize this space.
The current working face is approximately 300 feet by 100 feet in dimension. Based on the volume of
customers and tonnage being disposed at the Landfill, this represents a constrained working face that
presents challenges separating customers by vehicle type (e.g., self-unloading vehicles at a different tipping
deck than automatically ejecting vehicles). Self-unloading vehicles present a significant challenge because
of the increased time it takes to manually unload material. As part of the Landfill Site Visit, it was observed
that the number of spotters and tower to direct traffic has improved safety conditions at the working face.
The constrained working face presents challenges with the type of dozers that are most effective for
managing material between the tipping deck and working face. The D6 model is able to maneuver more
effectively, but the D7 is the most efficient for pushing larger loads (e.g., 20 tons tipped from the transfer
trailer. Ultimately a mix of D6 and D7 dozers should be utilized to maximize the efficiency of operations
with the currently constrained working face.
Based on discussions with City staff, there is currently a permit modification under development that would
allow the City to expand its working face to improve safety by allowing more tipping space for customers
and more space for equipment operators. It would also allow the City to achieve higher operating efficiency
by running up to four compactors at the working face and further separate large load customers from small
load customers.
Daily Opening and Closing Procedures
The daily opening and closing procedures were observed during the Landfill Site Visit including removing
the tarps from the working face to begin operations and applying tarps and Alternative Daily Cover (ADC)
to close operations. Figure E-15 shows the tarp covering the working face during Landfill closing
operations.
DRAFT
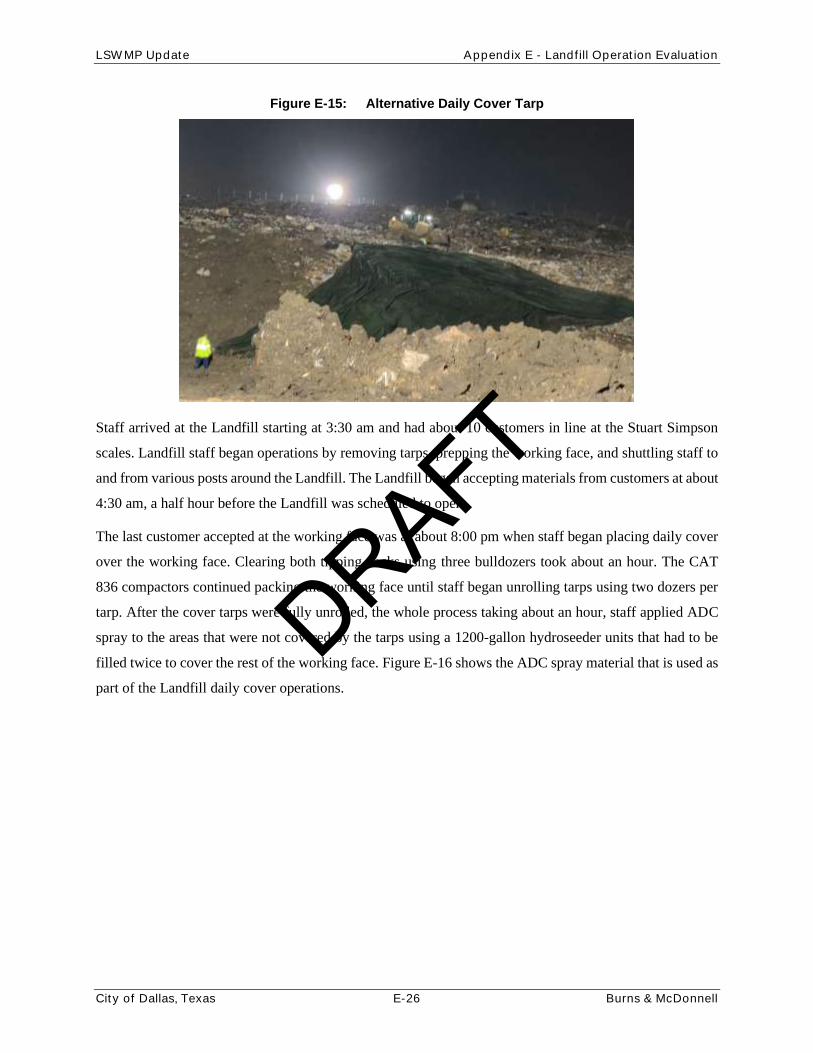
LSWMP Update Appendix E - Landfill Operation Evaluation
City of Dallas, Texas E-26 Burns & McDonnell
Figure E-15: Alternative Daily Cover Tarp
Staff arrived at the Landfill starting at 3:30 am and had about 10 customers in line at the Stuart Simpson
scales. Landfill staff began operations by removing tarps, prepping the working face, and shuttling staff to
and from various posts around the Landfill. The Landfill began accepting materials from customers at about
4:30 am, a half hour before the Landfill was scheduled to open.
The last customer accepted at the working face was at about 8:00 pm when staff began placing daily cover
over the working face. Clearing both tipping decks using three bulldozers took about an hour. The CAT
836 compactors continued packing the working face until staff began unrolling tarps using two dozers per
tarp. After the cover tarps were fully unrolled, the whole process taking about an hour, staff applied ADC
spray to the areas that were not covered by the tarps using a 1200-gallon hydroseeder units that had to be
filled twice to cover the rest of the working face. Figure E-16 shows the ADC spray material that is used as
part of the Landfill daily cover operations.
DRAFT
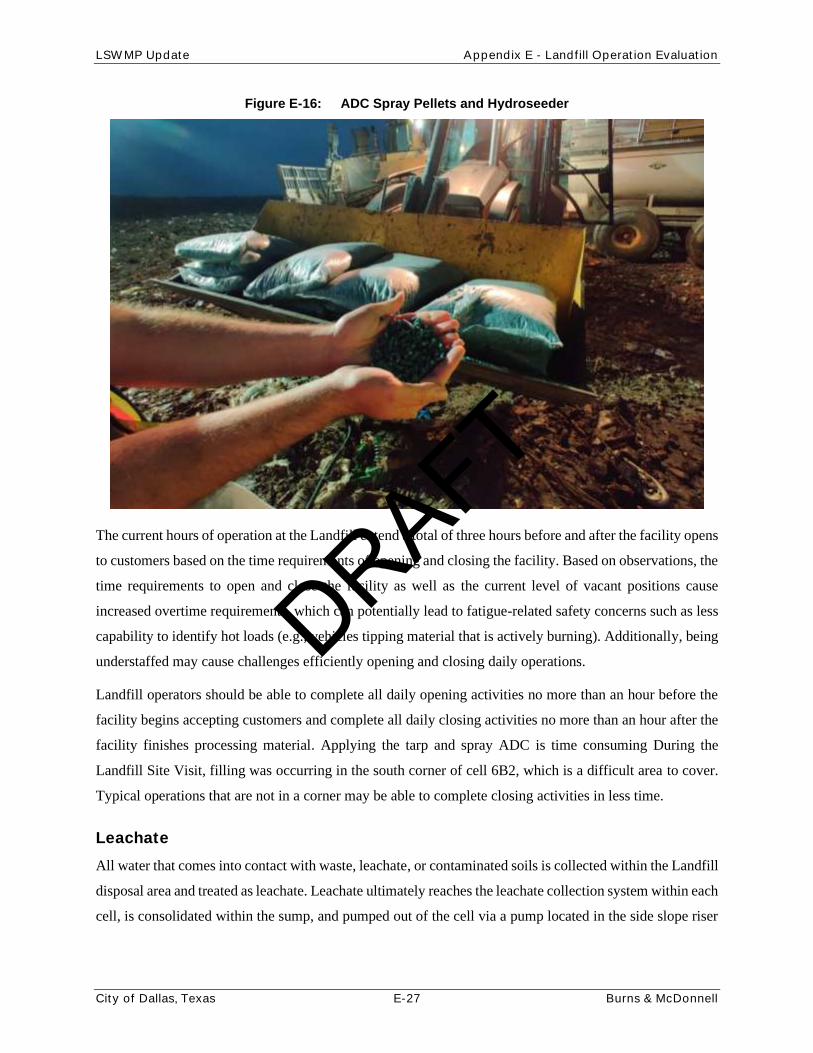
LSWMP Update Appendix E - Landfill Operation Evaluation
City of Dallas, Texas E-27 Burns & McDonnell
Figure E-16: ADC Spray Pellets and Hydroseeder
The current hours of operation at the Landfill extend a total of three hours before and after the facility opens
to customers based on the time requirements of opening and closing the facility. Based on observations, the
time requirements to open and close the facility as well as the current level of vacant positions cause
increased overtime requirements, which can potentially lead to fatigue-related safety concerns such as less
capability to identify hot loads (e.g., vehicles tipping material that is actively burning). Additionally, being
understaffed may cause challenges efficiently opening and closing daily operations.
Landfill operators should be able to complete all daily opening activities no more than an hour before the
facility begins accepting customers and complete all daily closing activities no more than an hour after the
facility finishes processing material. Applying the tarp and spray ADC is time consuming During the
Landfill Site Visit, filling was occurring in the south corner of cell 6B2, which is a difficult area to cover.
Typical operations that are not in a corner may be able to complete closing activities in less time.
Leachate
All water that comes into contact with waste, leachate, or contaminated soils is collected within the Landfill
disposal area and treated as leachate. Leachate ultimately reaches the leachate collection system within each
cell, is consolidated within the sump, and pumped out of the cell via a pump located in the side slope riser
DRAFT
LSWMP Update Appendix E - Landfill Operation Evaluation
City of Dallas, Texas E-28 Burns & McDonnell
pipe. Landfill staff monitor the depth of leachate on the liner using a pressure transducer located on each
submersible pump.
Previously the City had recirculated condensate and leachate, which provided operational benefits
including:
• Improving the initial compaction of the waste
• Accelerating settlement of waste improving the airspace utilization.
• Providing alternate mean of leachate management.
• Minimizing windblown litter by applying leachate application at the working face.
Although there are benefits to Enhanced Leachate Recirculation (ELR), the City experienced operational
challenges related to over-recirculation of leachate and landfill gas condensate in the past, causing increased
occurrence of seeps. Additionally, the landfill gas wells become watered causing costly redrills. The City
is currently able to recirculate leachate as part of its existing permit, but currently pumps the material to a
storage tank equipped with a pressure transducer to monitor remaining capacity and is then piped to the
Southside Wastewater Treatment Plant. Based on the most recently available data provided by the City,
about 8.6 million gallons of leachate was collected in 2019 from the Landfill and conveyed to the Southside
WWTP. DWU tests the leachate quality and there have been no challenges accepting this material.
Condensate is handled separately from leachate and in 2019 about 3.6 million gallons of condensate was
pumped from the Landfill Gas-to-Energy Plant, held in two vertical above ground tanks and discharged in
lined areas of the Landfill. The City recirculates this material by excavating holes in strategic locations in
the Landfill, discharging condensate, and then subsequently covering the holes up with soil material.
DCEMB will become responsible for condensate management in 2025. The City is unable to send
condensate to the Southside WWTP due to high total petroleum hydrocarbon (TPH) concentrations. The
City and Plant are investigating methods to reduce the TPH concentrations.
Figure E-17 shows the historical generation of leachate and condensate in gallons between 2017 and 2019.
DRAFT
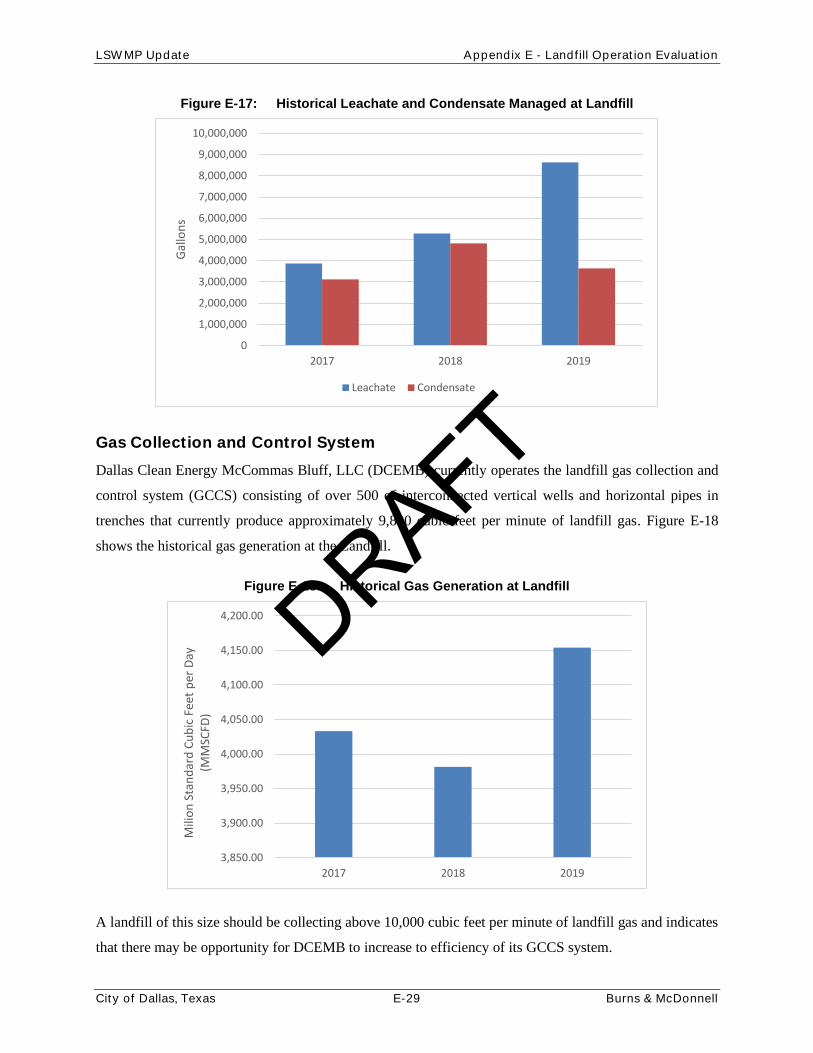
LSWMP Update Appendix E - Landfill Operation Evaluation
City of Dallas, Texas E-29 Burns & McDonnell
Figure E-17: Historical Leachate and Condensate Managed at Landfill
Gas Collection and Control System
Dallas Clean Energy McCommas Bluff, LLC (DCEMB) currently operates the landfill gas collection and
control system (GCCS) consisting of over 500 of interconnected vertical wells and horizontal pipes in
trenches that currently produce approximately 9,800 cubic feet per minute of landfill gas. Figure E-18
shows the historical gas generation at the Landfill.
Figure E-18: Historical Gas Generation at Landfill
A landfill of this size should be collecting above 10,000 cubic feet per minute of landfill gas and indicates
that there may be opportunity for DCEMB to increase to efficiency of its GCCS system.
0
1,000,000
2,000,000
3,000,000
4,000,000
5,000,000
6,000,000
7,000,000
8,000,000
9,000,000
10,000,000
2017 2018 2019
Gal
lon
s
Leachate Condensate
3,850.00
3,900.00
3,950.00
4,000.00
4,050.00
4,100.00
4,150.00
4,200.00
2017 2018 2019
Mili
on
Sta
nd
ard
Cu
bic
Fee
t p
er D
ay
(MM
SCFD
)
DRAFT
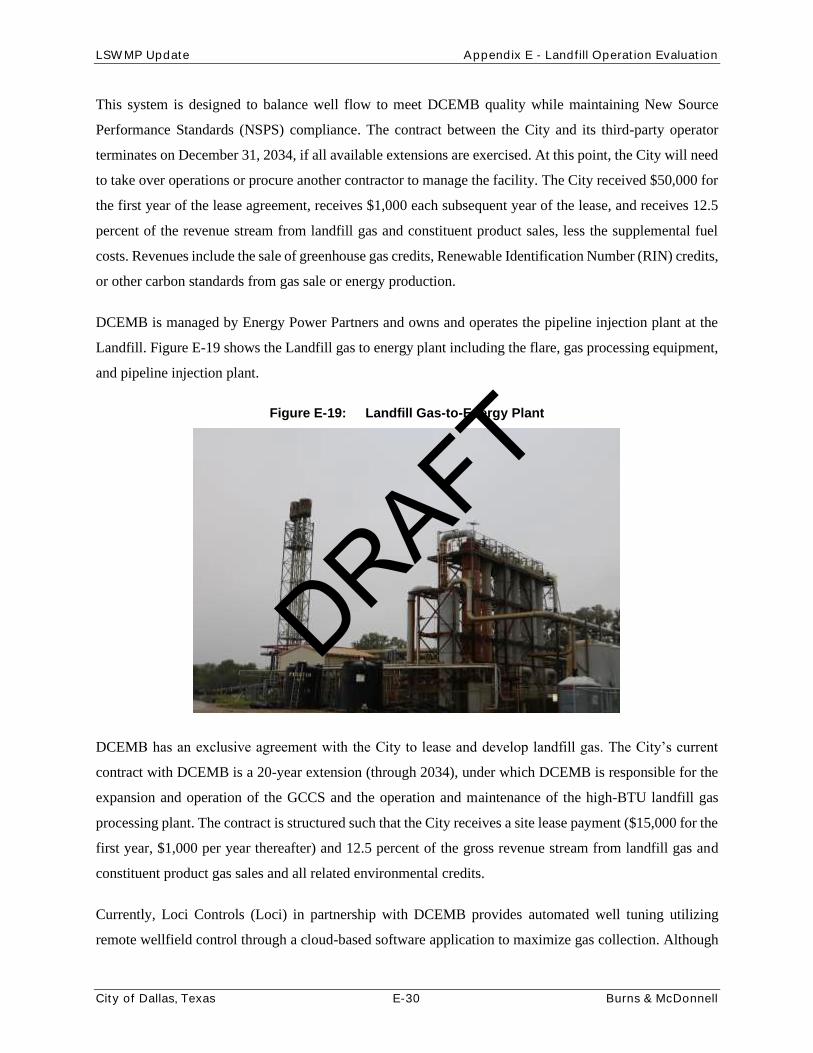
LSWMP Update Appendix E - Landfill Operation Evaluation
City of Dallas, Texas E-30 Burns & McDonnell
This system is designed to balance well flow to meet DCEMB quality while maintaining New Source
Performance Standards (NSPS) compliance. The contract between the City and its third-party operator
terminates on December 31, 2034, if all available extensions are exercised. At this point, the City will need
to take over operations or procure another contractor to manage the facility. The City received $50,000 for
the first year of the lease agreement, receives $1,000 each subsequent year of the lease, and receives 12.5
percent of the revenue stream from landfill gas and constituent product sales, less the supplemental fuel
costs. Revenues include the sale of greenhouse gas credits, Renewable Identification Number (RIN) credits,
or other carbon standards from gas sale or energy production.
DCEMB is managed by Energy Power Partners and owns and operates the pipeline injection plant at the
Landfill. Figure E-19 shows the Landfill gas to energy plant including the flare, gas processing equipment,
and pipeline injection plant.
Figure E-19: Landfill Gas-to-Energy Plant
DCEMB has an exclusive agreement with the City to lease and develop landfill gas. The City’s current
contract with DCEMB is a 20-year extension (through 2034), under which DCEMB is responsible for the
expansion and operation of the GCCS and the operation and maintenance of the high-BTU landfill gas
processing plant. The contract is structured such that the City receives a site lease payment ($15,000 for the
first year, $1,000 per year thereafter) and 12.5 percent of the gross revenue stream from landfill gas and
constituent product gas sales and all related environmental credits.
Currently, Loci Controls (Loci) in partnership with DCEMB provides automated well tuning utilizing
remote wellfield control through a cloud-based software application to maximize gas collection. Although
DRAFT
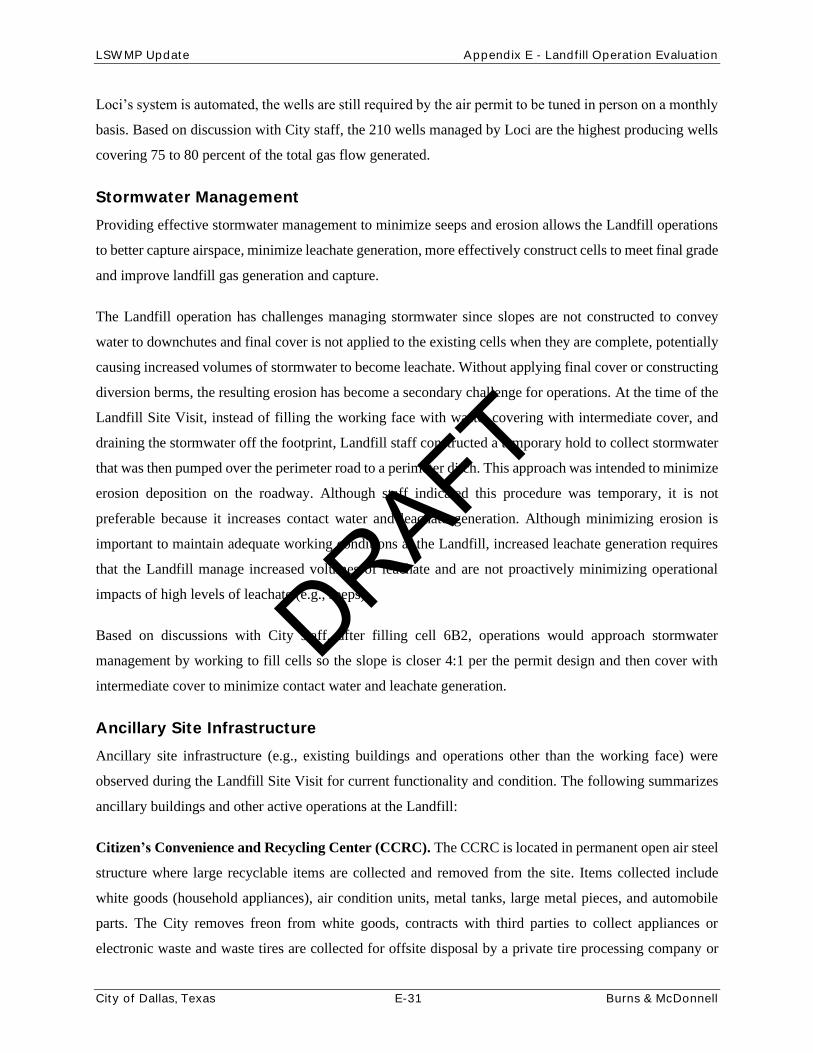
LSWMP Update Appendix E - Landfill Operation Evaluation
City of Dallas, Texas E-31 Burns & McDonnell
Loci’s system is automated, the wells are still required by the air permit to be tuned in person on a monthly
basis. Based on discussion with City staff, the 210 wells managed by Loci are the highest producing wells
covering 75 to 80 percent of the total gas flow generated.
Stormwater Management
Providing effective stormwater management to minimize seeps and erosion allows the Landfill operations
to better capture airspace, minimize leachate generation, more effectively construct cells to meet final grade
and improve landfill gas generation and capture.
The Landfill operation has challenges managing stormwater since slopes are not constructed to convey
water to downchutes and final cover is not applied to the existing cells when they are complete, potentially
causing increased volumes of stormwater to become leachate. Without applying final cover or constructing
diversion berms, the resulting erosion has become a secondary challenge for operations. At the time of the
Landfill Site Visit, instead of filling the working face with waste, covering with intermediate cover, and
draining the stormwater off the footprint, Landfill staff constructed a temporary hold to collect stormwater
that was then pumped over the perimeter road to a perimeter ditch. This approach was intended to minimize
erosion deposition on the roadway. Although staff indicated this procedure was temporary, it is not
preferable because it increases contact water and leachate generation. Although minimizing erosion is
important to maintain adequate working conditions at the Landfill, increased leachate generation requires
that the Landfill manage increased volumes of leachate and are not proactively minimizing operational
impacts of high levels of leachate (e.g., seeps)
Based on discussions with City staff, after filling cell 6B2, operations would approach stormwater
management by working to fill cells so the slope is closer 4:1 per the permit design and then cover with
intermediate cover to minimize contact water and leachate generation.
Ancillary Site Infrastructure
Ancillary site infrastructure (e.g., existing buildings and operations other than the working face) were
observed during the Landfill Site Visit for current functionality and condition. The following summarizes
ancillary buildings and other active operations at the Landfill:
Citizen’s Convenience and Recycling Center (CCRC). The CCRC is located in permanent open air steel
structure where large recyclable items are collected and removed from the site. Items collected include
white goods (household appliances), air condition units, metal tanks, large metal pieces, and automobile
parts. The City removes freon from white goods, contracts with third parties to collect appliances or
electronic waste and waste tires are collected for offsite disposal by a private tire processing company or
DRAFT
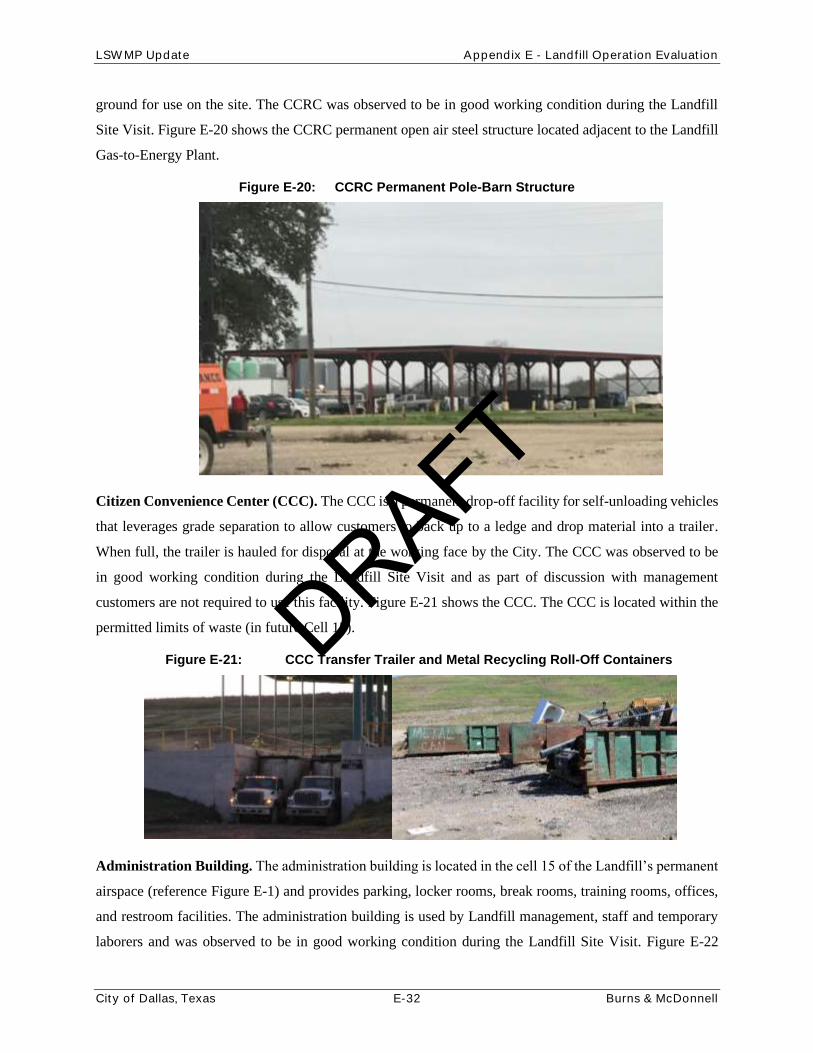
LSWMP Update Appendix E - Landfill Operation Evaluation
City of Dallas, Texas E-32 Burns & McDonnell
ground for use on the site. The CCRC was observed to be in good working condition during the Landfill
Site Visit. Figure E-20 shows the CCRC permanent open air steel structure located adjacent to the Landfill
Gas-to-Energy Plant.
Figure E-20: CCRC Permanent Pole-Barn Structure
Citizen Convenience Center (CCC). The CCC is a permanent drop-off facility for self-unloading vehicles
that leverages grade separation to allow customers to back up to a ledge and drop material into a trailer.
When full, the trailer is hauled for disposal at the working face by the City. The CCC was observed to be
in good working condition during the Landfill Site Visit and as part of discussion with management
customers are not required to use this facility. Figure E-21 shows the CCC. The CCC is located within the
permitted limits of waste (in future Cell 15).
Figure E-21: CCC Transfer Trailer and Metal Recycling Roll-Off Containers
Administration Building. The administration building is located in the cell 15 of the Landfill’s permanent
airspace (reference Figure E-1) and provides parking, locker rooms, break rooms, training rooms, offices,
and restroom facilities. The administration building is used by Landfill management, staff and temporary
laborers and was observed to be in good working condition during the Landfill Site Visit. Figure E-22
DRAFT
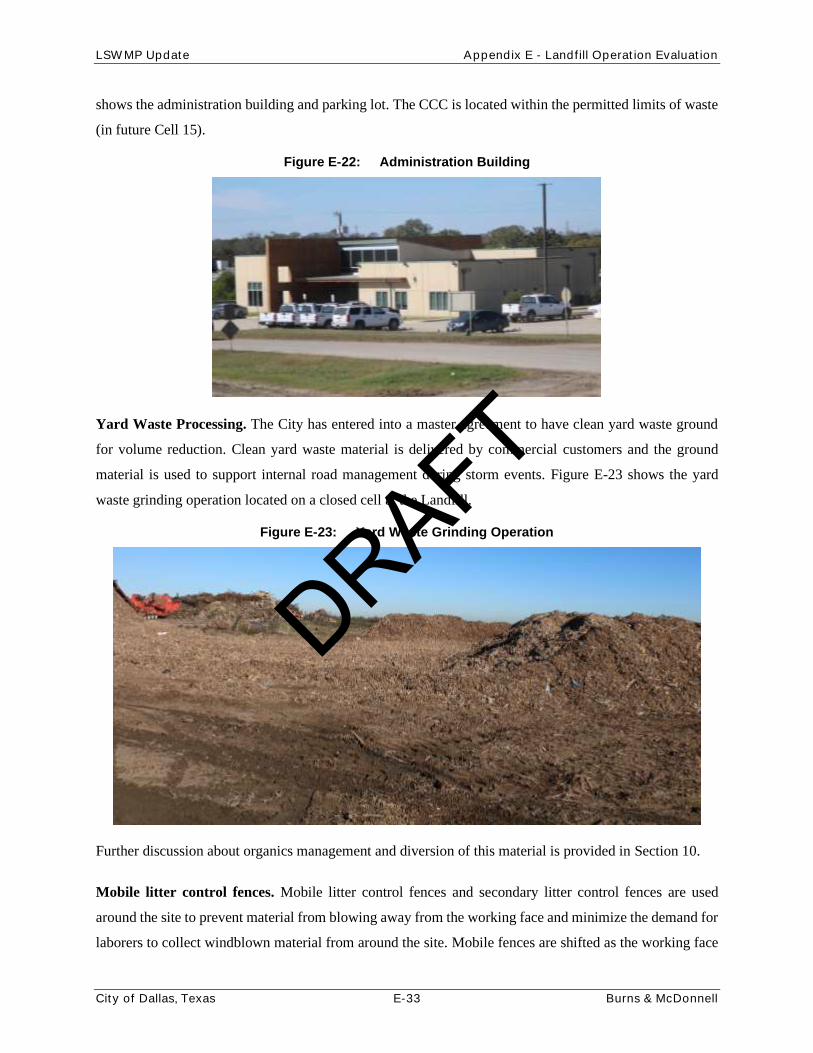
LSWMP Update Appendix E - Landfill Operation Evaluation
City of Dallas, Texas E-33 Burns & McDonnell
shows the administration building and parking lot. The CCC is located within the permitted limits of waste
(in future Cell 15).
Figure E-22: Administration Building
Yard Waste Processing. The City has entered into a master agreement to have clean yard waste ground
for volume reduction. Clean yard waste material is delivered by commercial customers and the ground
material is used to support internal road management during storm events. Figure E-23 shows the yard
waste grinding operation located on a closed cell at the Landfill.
Figure E-23: Yard Waste Grinding Operation
Further discussion about organics management and diversion of this material is provided in Section 10.
Mobile litter control fences. Mobile litter control fences and secondary litter control fences are used
around the site to prevent material from blowing away from the working face and minimize the demand for
laborers to collect windblown material from around the site. Mobile fences are shifted as the working face
DRAFT
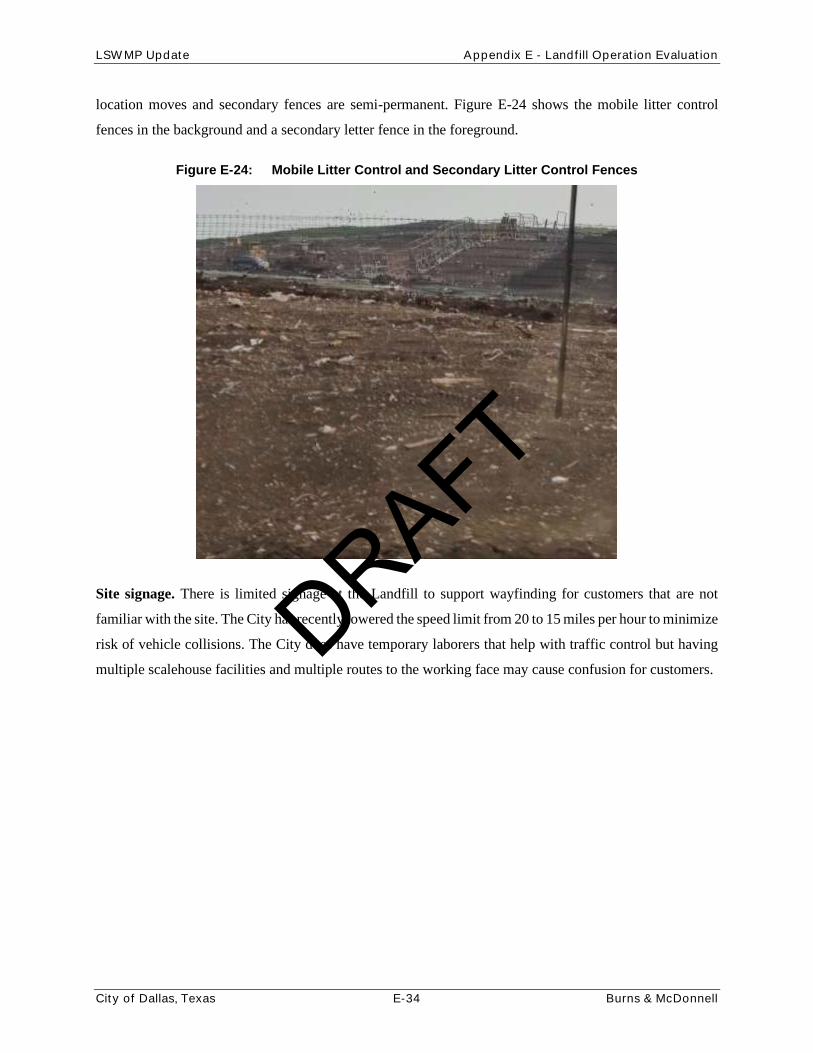
LSWMP Update Appendix E - Landfill Operation Evaluation
City of Dallas, Texas E-34 Burns & McDonnell
location moves and secondary fences are semi-permanent. Figure E-24 shows the mobile litter control
fences in the background and a secondary letter fence in the foreground.
Figure E-24: Mobile Litter Control and Secondary Litter Control Fences
Site signage. There is limited signage at the Landfill to support wayfinding for customers that are not
familiar with the site. The City has recently lowered the speed limit from 20 to 15 miles per hour to minimize
risk of vehicle collisions. The City does have temporary laborers that help with traffic control but having
multiple scalehouse facilities and multiple routes to the working face may cause confusion for customers.
DRAFT

LSWMP Update Appendix F Implementation & Funding Plan
City of Dallas, Texas Burns & McDonnell
APPENDIX F IMPLEMENTATION & FUNDING PLAN
(This page intentionally left blank)
DRAFT
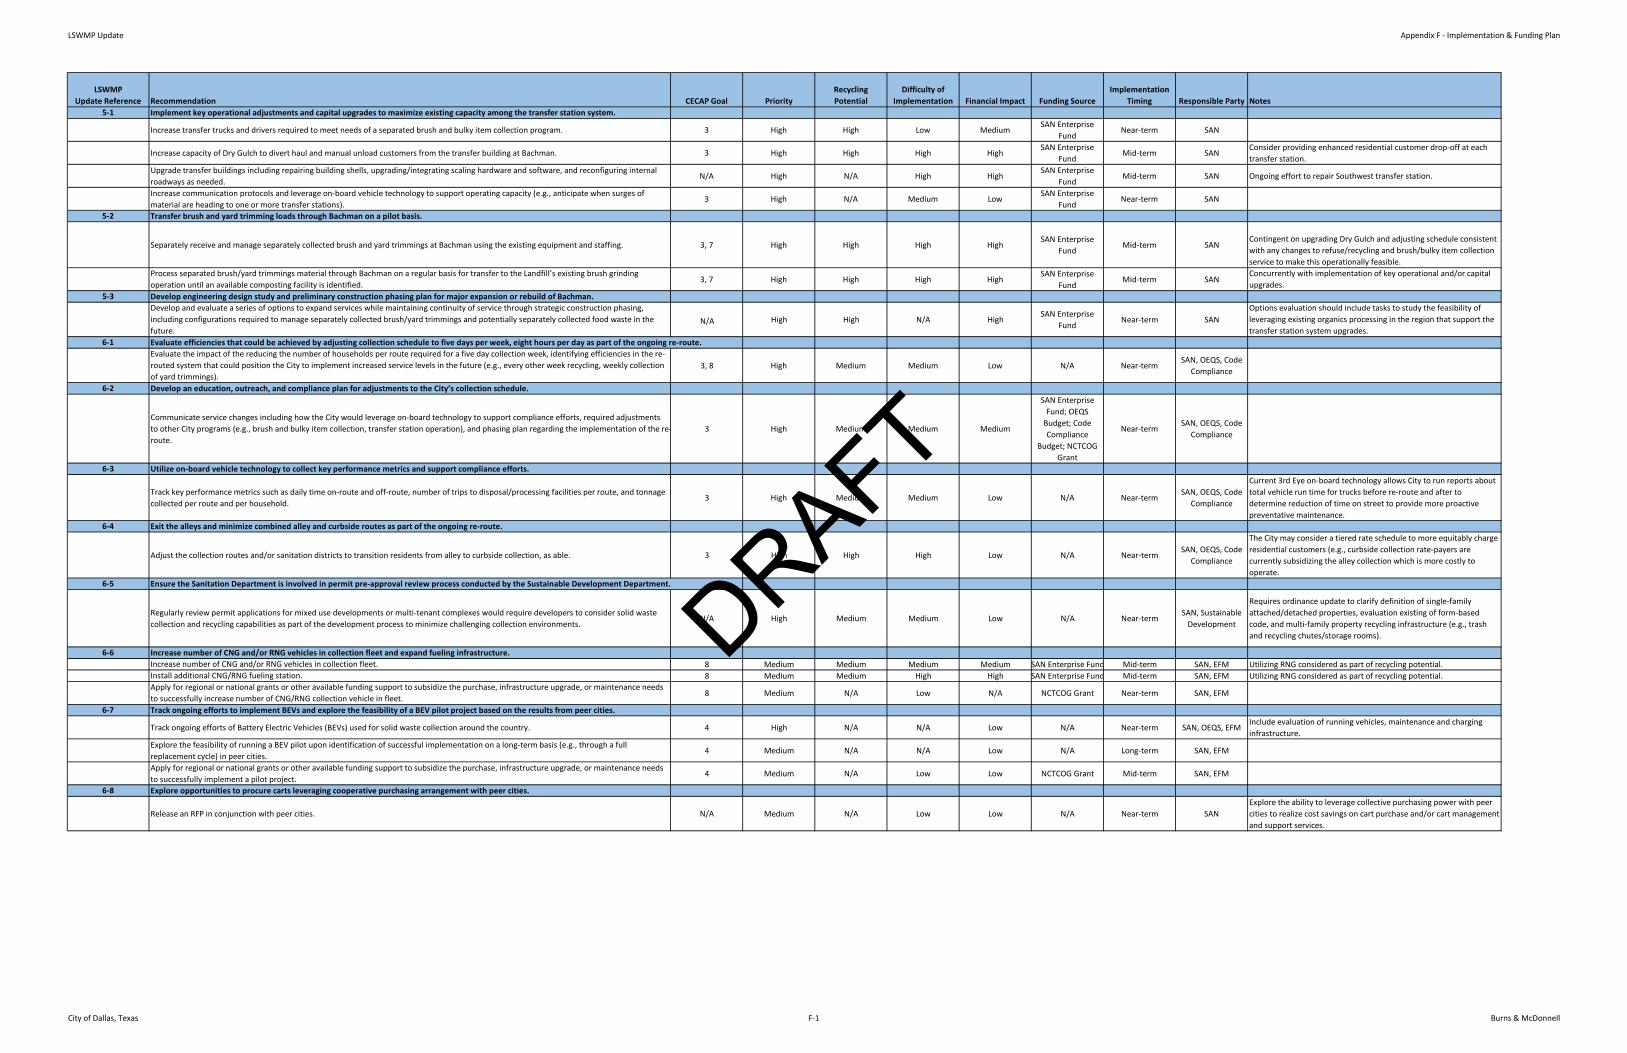
LSWMP Update Appendix F ‐ Implementation & Funding Plan
LSWMP
Update Reference Recommendation CECAP Goal Priority
Recycling
Potential
Difficulty of
Implementation Financial Impact Funding Source
Implementation
Timing Responsible Party Notes
5‐1 Implement key operational adjustments and capital upgrades to maximize existing capacity among the transfer station system.
Increase transfer trucks and drivers required to meet needs of a separated brush and bulky item collection program. 3 High High Low MediumSAN Enterprise
FundNear‐term SAN
Increase capacity of Dry Gulch to divert haul and manual unload customers from the transfer building at Bachman. 3 High High High HighSAN Enterprise
FundMid‐term SAN
Consider providing enhanced residential customer drop‐off at each
transfer station.
Upgrade transfer buildings including repairing building shells, upgrading/integrating scaling hardware and software, and reconfiguring internal
roadways as needed.N/A High N/A High High
SAN Enterprise
FundMid‐term SAN Ongoing effort to repair Southwest transfer station.
Increase communication protocols and leverage on‐board vehicle technology to support operating capacity (e.g., anticipate when surges of
material are heading to one or more transfer stations).3 High N/A Medium Low
SAN Enterprise
FundNear‐term SAN
5‐2 Transfer brush and yard trimming loads through Bachman on a pilot basis.
Separately receive and manage separately collected brush and yard trimmings at Bachman using the existing equipment and staffing. 3, 7 High High High HighSAN Enterprise
FundMid‐term SAN
Contingent on upgrading Dry Gulch and adjusting schedule consistent
with any changes to refuse/recycling and brush/bulky item collection
service to make this operationally feasible.
Process separated brush/yard trimmings material through Bachman on a regular basis for transfer to the Landfill’s existing brush grinding
operation until an available composting facility is identified. 3, 7 High High High High
SAN Enterprise
FundMid‐term SAN
Concurrently with implementation of key operational and/or capital
upgrades.
5‐3 Develop engineering design study and preliminary construction phasing plan for major expansion or rebuild of Bachman.
Develop and evaluate a series of options to expand services while maintaining continuity of service through strategic construction phasing,
including configurations required to manage separately collected brush/yard trimmings and potentially separately collected food waste in the
future.
High High N/A HighSAN Enterprise
FundNear‐term SAN
Options evaluation should include tasks to study the feasibility of
leveraging existing organics processing in the region that support the
transfer station system upgrades.
6‐1 Evaluate efficiencies that could be achieved by adjusting collection schedule to five days per week, eight hours per day as part of the ongoing re‐route.
Evaluate the impact of the reducing the number of households per route required for a five day collection week, identifying efficiencies in the re‐
routed system that could position the City to implement increased service levels in the future (e.g., every other week recycling, weekly collection
of yard trimmings).
3, 8 High Medium Medium Low N/A Near‐termSAN, OEQS, Code
Compliance
6‐2 Develop an education, outreach, and compliance plan for adjustments to the City’s collection schedule.
Communicate service changes including how the City would leverage on‐board technology to support compliance efforts, required adjustments
to other City programs (e.g., brush and bulky item collection, transfer station operation), and phasing plan regarding the implementation of the re‐
route.
3 High Medium Medium Medium
SAN Enterprise
Fund; OEQS
Budget; Code
Compliance
Budget; NCTCOG
Grant
Near‐termSAN, OEQS, Code
Compliance
6‐3 Utilize on‐board vehicle technology to collect key performance metrics and support compliance efforts.
Track key performance metrics such as daily time on‐route and off‐route, number of trips to disposal/processing facilities per route, and tonnage
collected per route and per household.3 High Medium Medium Low N/A Near‐term
SAN, OEQS, Code
Compliance
Current 3rd Eye on‐board technology allows City to run reports about
total vehicle run time for trucks before re‐route and after to
determine reduction of time on street to provide more proactive
preventative maintenance.
6‐4 Exit the alleys and minimize combined alley and curbside routes as part of the ongoing re‐route.
Adjust the collection routes and/or sanitation districts to transition residents from alley to curbside collection, as able. 3 High High High Low N/A Near‐termSAN, OEQS, Code
Compliance
The City may consider a tiered rate schedule to more equitably charge
residential customers (e.g., curbside collection rate‐payers are
currently subsidizing the alley collection which is more costly to
operate.
6‐5 Ensure the Sanitation Department is involved in permit pre‐approval review process conducted by the Sustainable Development Department.
Regularly review permit applications for mixed use developments or multi‐tenant complexes would require developers to consider solid waste
collection and recycling capabilities as part of the development process to minimize challenging collection environments.N/A High Medium Medium Low N/A Near‐term
SAN, Sustainable
Development
Requires ordinance update to clarify definition of single‐family
attached/detached properties, evaluation existing of form‐based
code, and multi‐family property recycling infrastructure (e.g., trash
and recycling chutes/storage rooms).
6‐6 Increase number of CNG and/or RNG vehicles in collection fleet and expand fueling infrastructure.
Increase number of CNG and/or RNG vehicles in collection fleet. 8 Medium Medium Medium Medium SAN Enterprise Fund Mid‐term SAN, EFM Utilizing RNG considered as part of recycling potential.
Install additional CNG/RNG fueling station. 8 Medium Medium High High SAN Enterprise Fund Mid‐term SAN, EFM Utilizing RNG considered as part of recycling potential.
Apply for regional or national grants or other available funding support to subsidize the purchase, infrastructure upgrade, or maintenance needs
to successfully increase number of CNG/RNG collection vehicle in fleet.8 Medium N/A Low N/A NCTCOG Grant Near‐term SAN, EFM
6‐7 Track ongoing efforts to implement BEVs and explore the feasibility of a BEV pilot project based on the results from peer cities.
Track ongoing efforts of Battery Electric Vehicles (BEVs) used for solid waste collection around the country. 4 High N/A N/A Low N/A Near‐term SAN, OEQS, EFMInclude evaluation of running vehicles, maintenance and charging
infrastructure.
Explore the feasibility of running a BEV pilot upon identification of successful implementation on a long‐term basis (e.g., through a full
replacement cycle) in peer cities. 4 Medium N/A N/A Low N/A Long‐term SAN, EFM
Apply for regional or national grants or other available funding support to subsidize the purchase, infrastructure upgrade, or maintenance needs
to successfully implement a pilot project.4 Medium N/A Low Low NCTCOG Grant Mid‐term SAN, EFM
6‐8 Explore opportunities to procure carts leveraging cooperative purchasing arrangement with peer cities.
Release an RFP in conjunction with peer cities. N/A Medium N/A Low Low N/A Near‐term SAN
Explore the ability to leverage collective purchasing power with peer
cities to realize cost savings on cart purchase and/or cart management
and support services.
City of Dallas, Texas F‐1 Burns & McDonnell
N/A
DRAFT
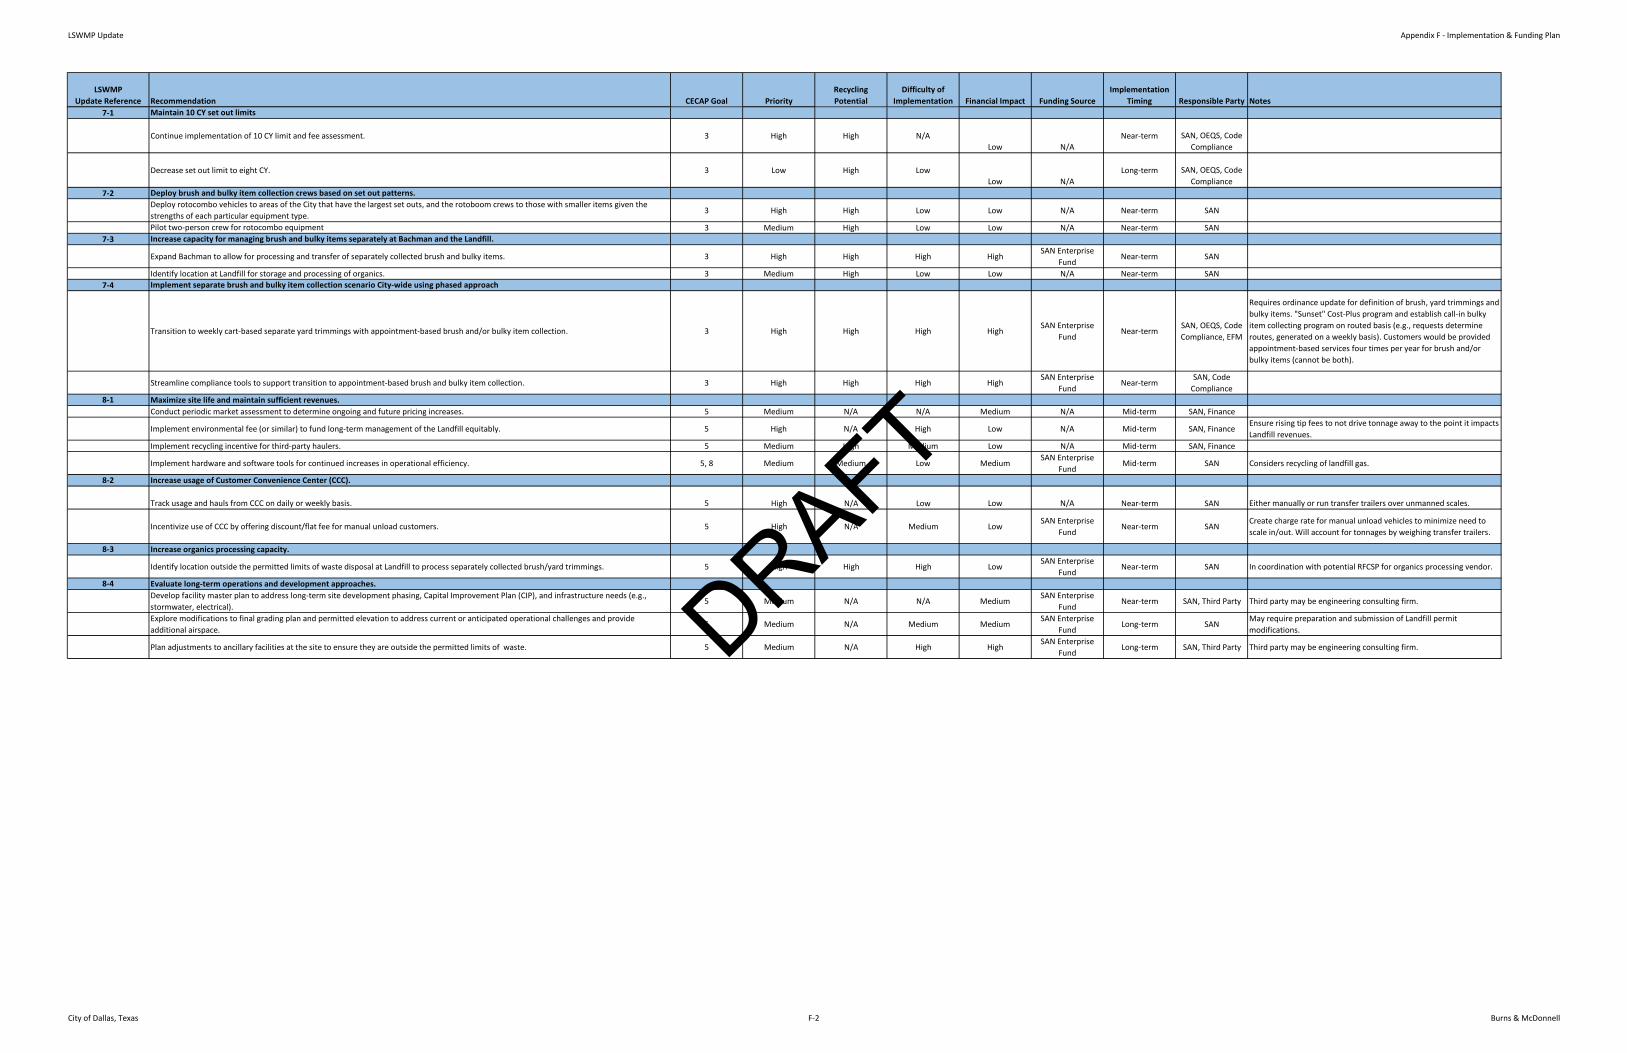
LSWMP Update Appendix F ‐ Implementation & Funding Plan
LSWMP
Update Reference Recommendation CECAP Goal Priority
Recycling
Potential
Difficulty of
Implementation Financial Impact Funding Source
Implementation
Timing Responsible Party Notes
7‐1 Maintain 10 CY set out limits
Continue implementation of 10 CY limit and fee assessment. 3 High High N/A
Low N/A
Near‐term SAN, OEQS, Code
Compliance
Decrease set out limit to eight CY. 3 Low High Low
Low N/A
Long‐term SAN, OEQS, Code
Compliance
7‐2 Deploy brush and bulky item collection crews based on set out patterns.
Deploy rotocombo vehicles to areas of the City that have the largest set outs, and the rotoboom crews to those with smaller items given the
strengths of each particular equipment type. 3 High High Low Low N/A Near‐term SAN
Pilot two‐person crew for rotocombo equipment 3 Medium High Low Low N/A Near‐term SAN
7‐3 Increase capacity for managing brush and bulky items separately at Bachman and the Landfill.
Expand Bachman to allow for processing and transfer of separately collected brush and bulky items. 3 High High High HighSAN Enterprise
FundNear‐term SAN
Identify location at Landfill for storage and processing of organics. 3 Medium High Low Low N/A Near‐term SAN
7‐4 Implement separate brush and bulky item collection scenario City‐wide using phased approach
Transition to weekly cart‐based separate yard trimmings with appointment‐based brush and/or bulky item collection. 3 High High High HighSAN Enterprise
FundNear‐term
SAN, OEQS, Code
Compliance, EFM
Requires ordinance update for definition of brush, yard trimmings and
bulky items. "Sunset" Cost‐Plus program and establish call‐in bulky
item collecting program on routed basis (e.g., requests determine
routes, generated on a weekly basis). Customers would be provided
appointment‐based services four times per year for brush and/or
bulky items (cannot be both).
Streamline compliance tools to support transition to appointment‐based brush and bulky item collection. 3 High High High HighSAN Enterprise
FundNear‐term
SAN, Code
Compliance
8‐1 Maximize site life and maintain sufficient revenues.
Conduct periodic market assessment to determine ongoing and future pricing increases. 5 Medium N/A N/A Medium N/A Mid‐term SAN, Finance
Implement environmental fee (or similar) to fund long‐term management of the Landfill equitably. 5 High N/A High Low N/A Mid‐term SAN, FinanceEnsure rising tip fees to not drive tonnage away to the point it impacts
Landfill revenues.
Implement recycling incentive for third‐party haulers. 5 Medium High Medium Low N/A Mid‐term SAN, Finance
Implement hardware and software tools for continued increases in operational efficiency. 5, 8 Medium Medium Low MediumSAN Enterprise
FundMid‐term SAN Considers recycling of landfill gas.
8‐2 Increase usage of Customer Convenience Center (CCC).
Track usage and hauls from CCC on daily or weekly basis. 5 High N/A Low Low N/A Near‐term SAN Either manually or run transfer trailers over unmanned scales.
Incentivize use of CCC by offering discount/flat fee for manual unload customers. 5 High N/A Medium LowSAN Enterprise
FundNear‐term SAN
Create charge rate for manual unload vehicles to minimize need to
scale in/out. Will account for tonnages by weighing transfer trailers.
8‐3 Increase organics processing capacity.
Identify location outside the permitted limits of waste disposal at Landfill to process separately collected brush/yard trimmings. 5 High High High LowSAN Enterprise
FundNear‐term SAN In coordination with potential RFCSP for organics processing vendor.
8‐4 Evaluate long‐term operations and development approaches.
Develop facility master plan to address long‐term site development phasing, Capital Improvement Plan (CIP), and infrastructure needs (e.g.,
stormwater, electrical).5 Medium N/A N/A Medium
SAN Enterprise
FundNear‐term SAN, Third Party Third party may be engineering consulting firm.
Explore modifications to final grading plan and permitted elevation to address current or anticipated operational challenges and provide
additional airspace.5 Medium N/A Medium Medium
SAN Enterprise
FundLong‐term SAN
May require preparation and submission of Landfill permit
modifications.
Plan adjustments to ancillary facilities at the site to ensure they are outside the permitted limits of waste. 5 Medium N/A High HighSAN Enterprise
FundLong‐term SAN, Third Party Third party may be engineering consulting firm.
City of Dallas, Texas F‐2 Burns & McDonnell
DRAFT
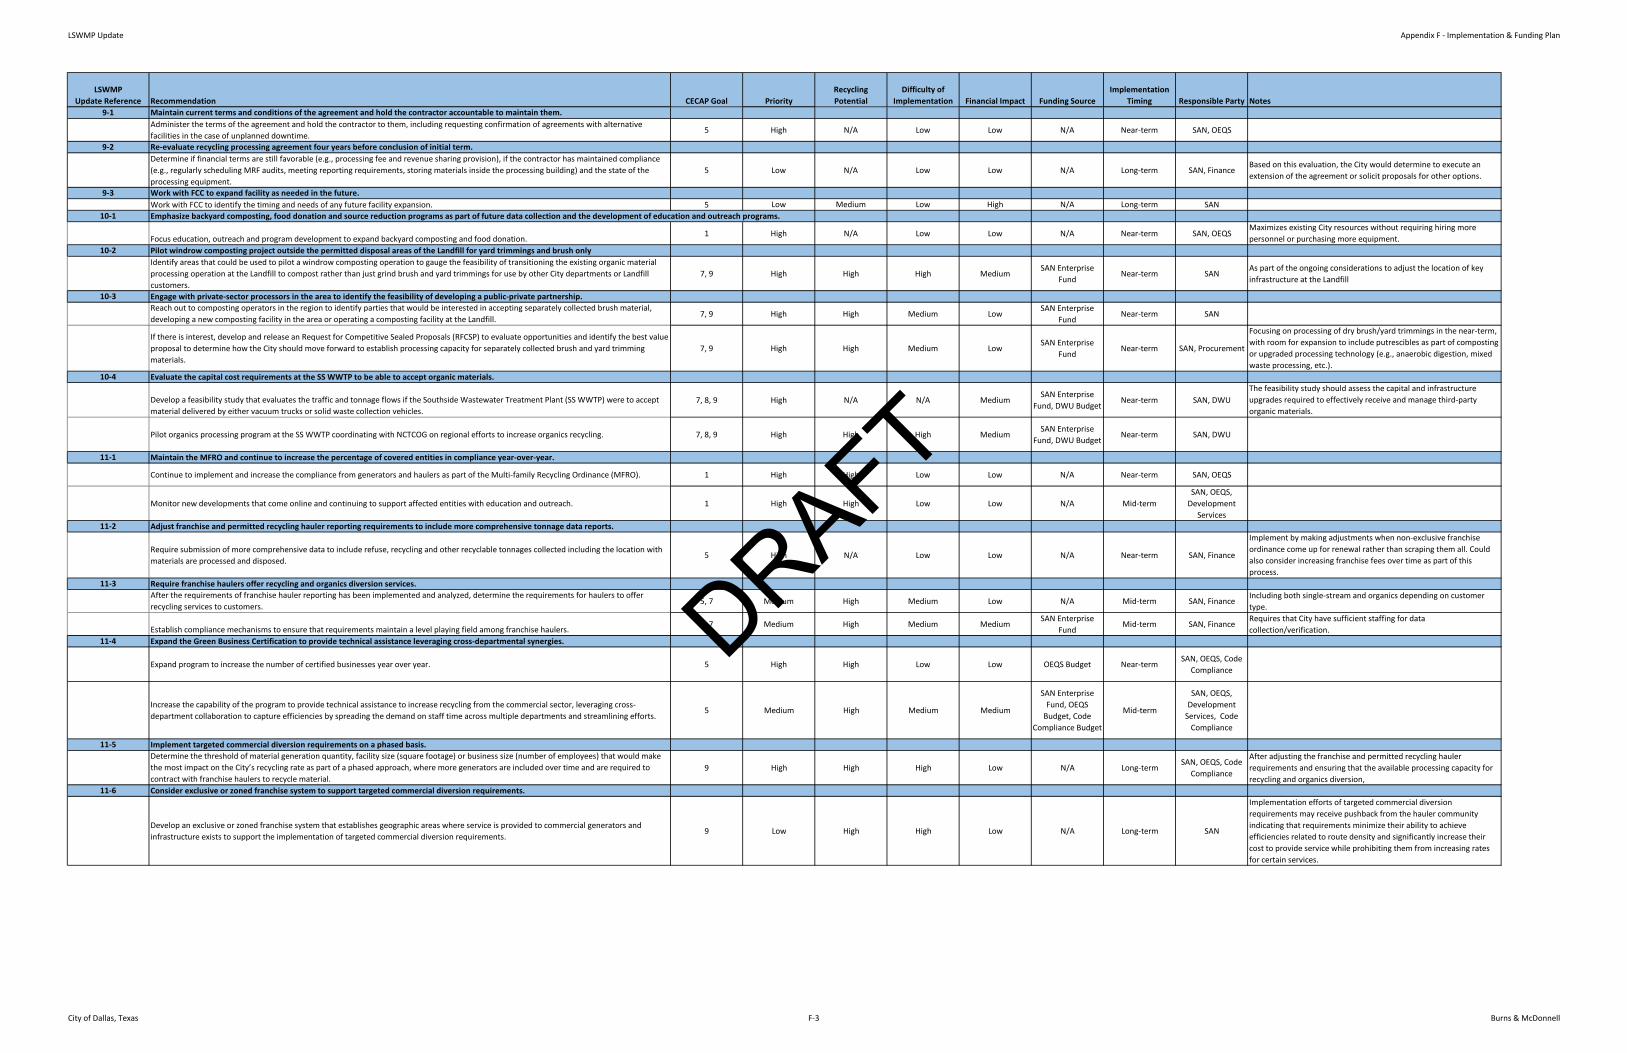
LSWMP Update Appendix F ‐ Implementation & Funding Plan
LSWMP
Update Reference Recommendation CECAP Goal Priority
Recycling
Potential
Difficulty of
Implementation Financial Impact Funding Source
Implementation
Timing Responsible Party Notes
9‐1 Maintain current terms and conditions of the agreement and hold the contractor accountable to maintain them.
Administer the terms of the agreement and hold the contractor to them, including requesting confirmation of agreements with alternative
facilities in the case of unplanned downtime.5 High N/A Low Low N/A Near‐term SAN, OEQS
9‐2 Re‐evaluate recycling processing agreement four years before conclusion of initial term.
Determine if financial terms are still favorable (e.g., processing fee and revenue sharing provision), if the contractor has maintained compliance
(e.g., regularly scheduling MRF audits, meeting reporting requirements, storing materials inside the processing building) and the state of the
processing equipment.
5 Low N/A Low Low N/A Long‐term SAN, FinanceBased on this evaluation, the City would determine to execute an
extension of the agreement or solicit proposals for other options.
9‐3 Work with FCC to expand facility as needed in the future.
Work with FCC to identify the timing and needs of any future facility expansion. 5 Low Medium Low High N/A Long‐term SAN
10‐1 Emphasize backyard composting, food donation and source reduction programs as part of future data collection and the development of education and outreach programs.
Focus education, outreach and program development to expand backyard composting and food donation. 1 High N/A Low Low N/A Near‐term SAN, OEQS
Maximizes existing City resources without requiring hiring more
personnel or purchasing more equipment.
10‐2 Pilot windrow composting project outside the permitted disposal areas of the Landfill for yard trimmings and brush only
Identify areas that could be used to pilot a windrow composting operation to gauge the feasibility of transitioning the existing organic material
processing operation at the Landfill to compost rather than just grind brush and yard trimmings for use by other City departments or Landfill
customers.
7, 9 High High High MediumSAN Enterprise
FundNear‐term SAN
As part of the ongoing considerations to adjust the location of key
infrastructure at the Landfill
10‐3 Engage with private‐sector processors in the area to identify the feasibility of developing a public‐private partnership.
Reach out to composting operators in the region to identify parties that would be interested in accepting separately collected brush material,
developing a new composting facility in the area or operating a composting facility at the Landfill. 7, 9 High High Medium Low
SAN Enterprise
FundNear‐term SAN
If there is interest, develop and release an Request for Competitive Sealed Proposals (RFCSP) to evaluate opportunities and identify the best value
proposal to determine how the City should move forward to establish processing capacity for separately collected brush and yard trimming
materials.
7, 9 High High Medium LowSAN Enterprise
FundNear‐term SAN, Procurement
Focusing on processing of dry brush/yard trimmings in the near‐term,
with room for expansion to include putrescibles as part of composting
or upgraded processing technology (e.g., anaerobic digestion, mixed
waste processing, etc.).
10‐4 Evaluate the capital cost requirements at the SS WWTP to be able to accept organic materials.
Develop a feasibility study that evaluates the traffic and tonnage flows if the Southside Wastewater Treatment Plant (SS WWTP) were to accept
material delivered by either vacuum trucks or solid waste collection vehicles.
7, 8, 9 High N/A N/A MediumSAN Enterprise
Fund, DWU BudgetNear‐term SAN, DWU
The feasibility study should assess the capital and infrastructure
upgrades required to effectively receive and manage third‐party
organic materials.
Pilot organics processing program at the SS WWTP coordinating with NCTCOG on regional efforts to increase organics recycling. 7, 8, 9 High High High MediumSAN Enterprise
Fund, DWU BudgetNear‐term SAN, DWU
11‐1 Maintain the MFRO and continue to increase the percentage of covered entities in compliance year‐over‐year.
Continue to implement and increase the compliance from generators and haulers as part of the Multi‐family Recycling Ordinance (MFRO). 1 High High Low Low N/A Near‐term SAN, OEQS
Monitor new developments that come online and continuing to support affected entities with education and outreach. 1 High High Low Low N/A Mid‐term
SAN, OEQS,
Development
Services
11‐2 Adjust franchise and permitted recycling hauler reporting requirements to include more comprehensive tonnage data reports.
Require submission of more comprehensive data to include refuse, recycling and other recyclable tonnages collected including the location with
materials are processed and disposed.5 High N/A Low Low N/A Near‐term SAN, Finance
Implement by making adjustments when non‐exclusive franchise
ordinance come up for renewal rather than scraping them all. Could
also consider increasing franchise fees over time as part of this
process.
11‐3 Require franchise haulers offer recycling and organics diversion services.
After the requirements of franchise hauler reporting has been implemented and analyzed, determine the requirements for haulers to offer
recycling services to customers. 5, 7 Medium High Medium Low N/A Mid‐term SAN, Finance
Including both single‐stream and organics depending on customer
type.
Establish compliance mechanisms to ensure that requirements maintain a level playing field among franchise haulers. 5, 7 Medium High Medium Medium
SAN Enterprise
FundMid‐term SAN, Finance
Requires that City have sufficient staffing for data
collection/verification.
11‐4 Expand the Green Business Certification to provide technical assistance leveraging cross‐departmental synergies.
Expand program to increase the number of certified businesses year over year. 5 High High Low Low OEQS Budget Near‐termSAN, OEQS, Code
Compliance
Increase the capability of the program to provide technical assistance to increase recycling from the commercial sector, leveraging cross‐
department collaboration to capture efficiencies by spreading the demand on staff time across multiple departments and streamlining efforts.5 Medium High Medium Medium
SAN Enterprise
Fund, OEQS
Budget, Code
Compliance Budget
Mid‐term
SAN, OEQS,
Development
Services, Code
Compliance
11‐5 Implement targeted commercial diversion requirements on a phased basis.
Determine the threshold of material generation quantity, facility size (square footage) or business size (number of employees) that would make
the most impact on the City’s recycling rate as part of a phased approach, where more generators are included over time and are required to
contract with franchise haulers to recycle material.
9 High High High Low N/A Long‐termSAN, OEQS, Code
Compliance
After adjusting the franchise and permitted recycling hauler
requirements and ensuring that the available processing capacity for
recycling and organics diversion,
11‐6 Consider exclusive or zoned franchise system to support targeted commercial diversion requirements.
Develop an exclusive or zoned franchise system that establishes geographic areas where service is provided to commercial generators and
infrastructure exists to support the implementation of targeted commercial diversion requirements.9 Low High High Low N/A Long‐term SAN
Implementation efforts of targeted commercial diversion
requirements may receive pushback from the hauler community
indicating that requirements minimize their ability to achieve
efficiencies related to route density and significantly increase their
cost to provide service while prohibiting them from increasing rates
for certain services.
City of Dallas, Texas F‐3 Burns & McDonnell
DRAFT
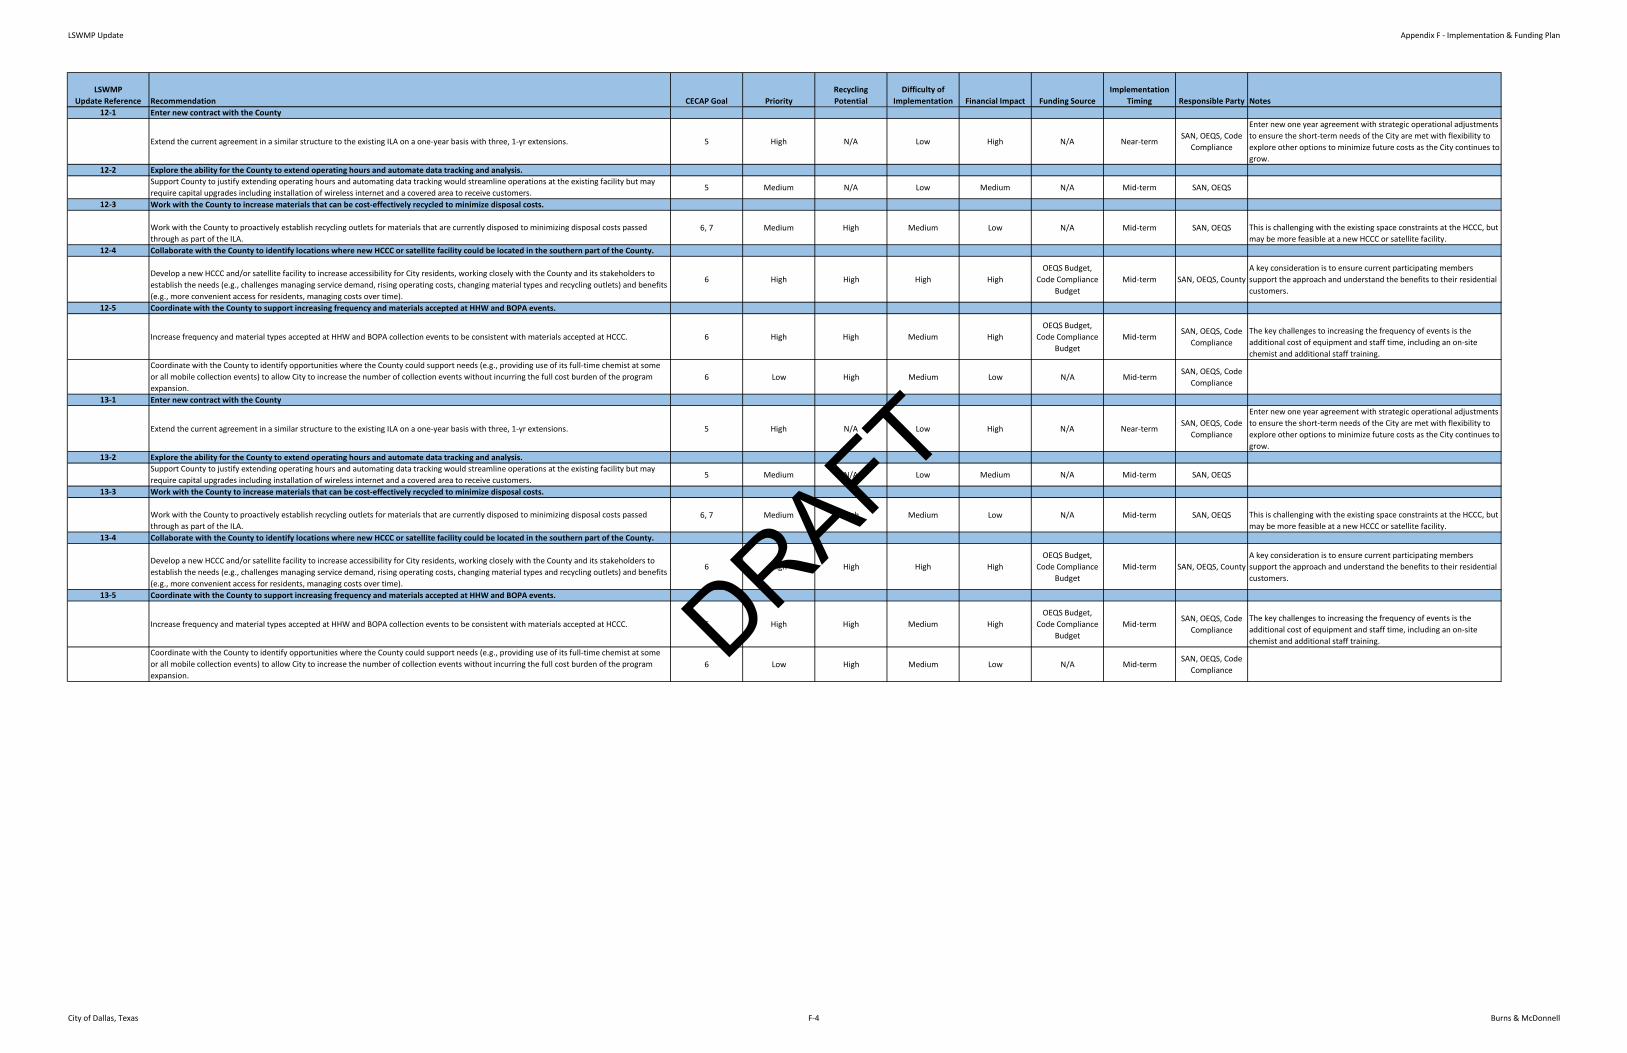
LSWMP Update Appendix F ‐ Implementation & Funding Plan
LSWMP
Update Reference Recommendation CECAP Goal Priority
Recycling
Potential
Difficulty of
Implementation Financial Impact Funding Source
Implementation
Timing Responsible Party Notes
12‐1 Enter new contract with the County
Extend the current agreement in a similar structure to the existing ILA on a one‐year basis with three, 1‐yr extensions. 5 High N/A Low High N/A Near‐termSAN, OEQS, Code
Compliance
Enter new one year agreement with strategic operational adjustments
to ensure the short‐term needs of the City are met with flexibility to
explore other options to minimize future costs as the City continues to
grow.
12‐2 Explore the ability for the County to extend operating hours and automate data tracking and analysis.
Support County to justify extending operating hours and automating data tracking would streamline operations at the existing facility but may
require capital upgrades including installation of wireless internet and a covered area to receive customers.5 Medium N/A Low Medium N/A Mid‐term SAN, OEQS
12‐3 Work with the County to increase materials that can be cost‐effectively recycled to minimize disposal costs.
Work with the County to proactively establish recycling outlets for materials that are currently disposed to minimizing disposal costs passed
through as part of the ILA.
6, 7 Medium High Medium Low N/A Mid‐term SAN, OEQS This is challenging with the existing space constraints at the HCCC, but
may be more feasible at a new HCCC or satellite facility.
12‐4 Collaborate with the County to identify locations where new HCCC or satellite facility could be located in the southern part of the County.
Develop a new HCCC and/or satellite facility to increase accessibility for City residents, working closely with the County and its stakeholders to
establish the needs (e.g., challenges managing service demand, rising operating costs, changing material types and recycling outlets) and benefits
(e.g., more convenient access for residents, managing costs over time).
6 High High High High
OEQS Budget,
Code Compliance
Budget
Mid‐term SAN, OEQS, County
A key consideration is to ensure current participating members
support the approach and understand the benefits to their residential
customers.
12‐5 Coordinate with the County to support increasing frequency and materials accepted at HHW and BOPA events.
Increase frequency and material types accepted at HHW and BOPA collection events to be consistent with materials accepted at HCCC. 6 High High Medium High
OEQS Budget,
Code Compliance
Budget
Mid‐termSAN, OEQS, Code
Compliance
The key challenges to increasing the frequency of events is the
additional cost of equipment and staff time, including an on‐site
chemist and additional staff training.
Coordinate with the County to identify opportunities where the County could support needs (e.g., providing use of its full‐time chemist at some
or all mobile collection events) to allow City to increase the number of collection events without incurring the full cost burden of the program
expansion.
6 Low High Medium Low N/A Mid‐termSAN, OEQS, Code
Compliance
13‐1 Enter new contract with the County
Extend the current agreement in a similar structure to the existing ILA on a one‐year basis with three, 1‐yr extensions. 5 High N/A Low High N/A Near‐termSAN, OEQS, Code
Compliance
Enter new one year agreement with strategic operational adjustments
to ensure the short‐term needs of the City are met with flexibility to
explore other options to minimize future costs as the City continues to
grow.
13‐2 Explore the ability for the County to extend operating hours and automate data tracking and analysis.
Support County to justify extending operating hours and automating data tracking would streamline operations at the existing facility but may
require capital upgrades including installation of wireless internet and a covered area to receive customers.5 Medium N/A Low Medium N/A Mid‐term SAN, OEQS
13‐3 Work with the County to increase materials that can be cost‐effectively recycled to minimize disposal costs.
Work with the County to proactively establish recycling outlets for materials that are currently disposed to minimizing disposal costs passed
through as part of the ILA.
6, 7 Medium High Medium Low N/A Mid‐term SAN, OEQS This is challenging with the existing space constraints at the HCCC, but
may be more feasible at a new HCCC or satellite facility.
13‐4 Collaborate with the County to identify locations where new HCCC or satellite facility could be located in the southern part of the County.
Develop a new HCCC and/or satellite facility to increase accessibility for City residents, working closely with the County and its stakeholders to
establish the needs (e.g., challenges managing service demand, rising operating costs, changing material types and recycling outlets) and benefits
(e.g., more convenient access for residents, managing costs over time).
6 High High High High
OEQS Budget,
Code Compliance
Budget
Mid‐term SAN, OEQS, County
A key consideration is to ensure current participating members
support the approach and understand the benefits to their residential
customers.
13‐5 Coordinate with the County to support increasing frequency and materials accepted at HHW and BOPA events.
Increase frequency and material types accepted at HHW and BOPA collection events to be consistent with materials accepted at HCCC. 6 High High Medium High
OEQS Budget,
Code Compliance
Budget
Mid‐termSAN, OEQS, Code
Compliance
The key challenges to increasing the frequency of events is the
additional cost of equipment and staff time, including an on‐site
chemist and additional staff training.
Coordinate with the County to identify opportunities where the County could support needs (e.g., providing use of its full‐time chemist at some
or all mobile collection events) to allow City to increase the number of collection events without incurring the full cost burden of the program
expansion.
6 Low High Medium Low N/A Mid‐termSAN, OEQS, Code
Compliance
City of Dallas, Texas F‐4 Burns & McDonnell
DRAFT
Related Documents