Introduction 2 Context 2 Extent of the Green Belt as at 31 March 2017 3 Net Changes 5 Longer term changes 6 Accompanying Annex Tables 6 Uses of the data 7 Revisions to 2015/16 estimates Annex – explanations of changes in 2016/17 7 8 Technical notes 10 Enquiries 13 Planning Statistical Release 7 September 2017 Responsible Statistician: Sophie Ferguson Statistical enquiries: office hours: 0303 444 2006 planning.statistics@communitie s.gsi.gov.uk Media Enquiries: 0303 444 2883 [email protected] Date of next publication: September/October 2018 Local Planning Authority Green Belt: England 2016/17 The extent of the designated Green Belt in England as at 31 March 2017 was estimated at 1,634,700 hectares, around 13% of the land area of England. Overall there was a decrease of 790 hectares (less than 0.05%) in the area of Green Belt between 31 March 2016 and 31 March 2017. In 2016/17, eight local planning authorities adopted new plans which resulted in a decrease in the overall area of Green Belt compared to 31 March 2016.

Welcome message from author
This document is posted to help you gain knowledge. Please leave a comment to let me know what you think about it! Share it to your friends and learn new things together.
Transcript

Introduction 2
Context 2
Extent of the Green Belt
as at 31 March 2017 3
Net Changes 5
Longer term changes 6
Accompanying Annex
Tables 6
Uses of the data 7
Revisions to 2015/16
estimates
Annex – explanations
of changes in 2016/17
7
8
Technical notes 10
Enquiries 13
Planning Statistical Release 7 September 2017
u
s
i
n
g
R
e
s
e
a
r
c
h
S
u
m
m
Responsible Statistician:
Sophie Ferguson
Statistical enquiries:
office hours:
0303 444 2006
planning.statistics@communitie
s.gsi.gov.uk
Media Enquiries:
0303 444 2883
Date of next publication:
September/October 2018
Local Planning Authority Green
Belt: England 2016/17
The extent of the designated Green Belt in England as at 31
March 2017 was estimated at 1,634,700 hectares, around
13% of the land area of England.
Overall there was a decrease of 790 hectares (less than
0.05%) in the area of Green Belt between 31 March 2016
and 31 March 2017. In 2016/17, eight local planning
authorities adopted new plans which resulted in a decrease
in the overall area of Green Belt compared to 31 March
2016.
2 Local Planning Authority Green Belt: England 2016/17 Statistical Release
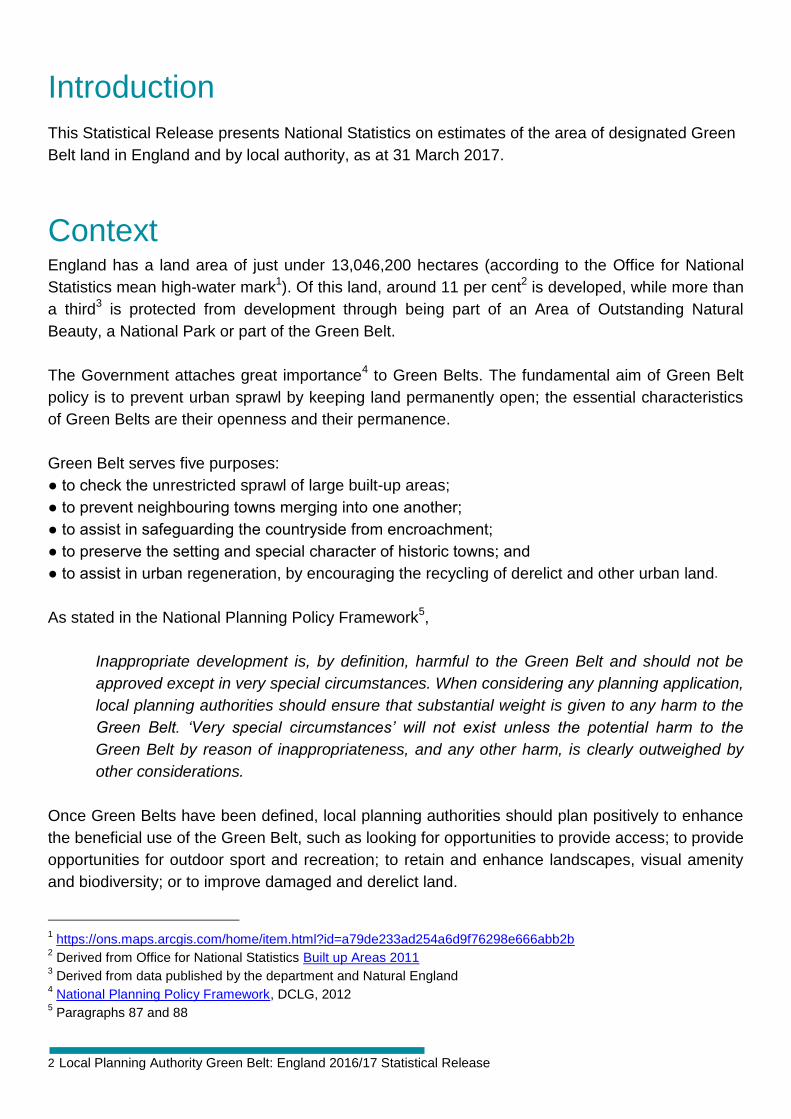
Introduction
This Statistical Release presents National Statistics on estimates of the area of designated Green
Belt land in England and by local authority, as at 31 March 2017.
Context England has a land area of just under 13,046,200 hectares (according to the Office for National
Statistics mean high-water mark1). Of this land, around 11 per cent
2 is developed, while more than
a third3 is protected from development through being part of an Area of Outstanding Natural
Beauty, a National Park or part of the Green Belt.
The Government attaches great importance4 to Green Belts. The fundamental aim of Green Belt
policy is to prevent urban sprawl by keeping land permanently open; the essential characteristics
of Green Belts are their openness and their permanence.
Green Belt serves five purposes:
● to check the unrestricted sprawl of large built-up areas;
● to prevent neighbouring towns merging into one another;
● to assist in safeguarding the countryside from encroachment;
● to preserve the setting and special character of historic towns; and
● to assist in urban regeneration, by encouraging the recycling of derelict and other urban land.
As stated in the National Planning Policy Framework5,
Inappropriate development is, by definition, harmful to the Green Belt and should not be
approved except in very special circumstances. When considering any planning application,
local planning authorities should ensure that substantial weight is given to any harm to the
Green Belt. ‘Very special circumstances’ will not exist unless the potential harm to the
Green Belt by reason of inappropriateness, and any other harm, is clearly outweighed by
other considerations.
Once Green Belts have been defined, local planning authorities should plan positively to enhance
the beneficial use of the Green Belt, such as looking for opportunities to provide access; to provide
opportunities for outdoor sport and recreation; to retain and enhance landscapes, visual amenity
and biodiversity; or to improve damaged and derelict land.
1 https://ons.maps.arcgis.com/home/item.html?id=a79de233ad254a6d9f76298e666abb2b
2 Derived from Office for National Statistics Built up Areas 2011
3 Derived from data published by the department and Natural England
4 National Planning Policy Framework, DCLG, 2012
5 Paragraphs 87 and 88
3 Local Planning Authority Green Belt: England 2016/17 Statistical Release
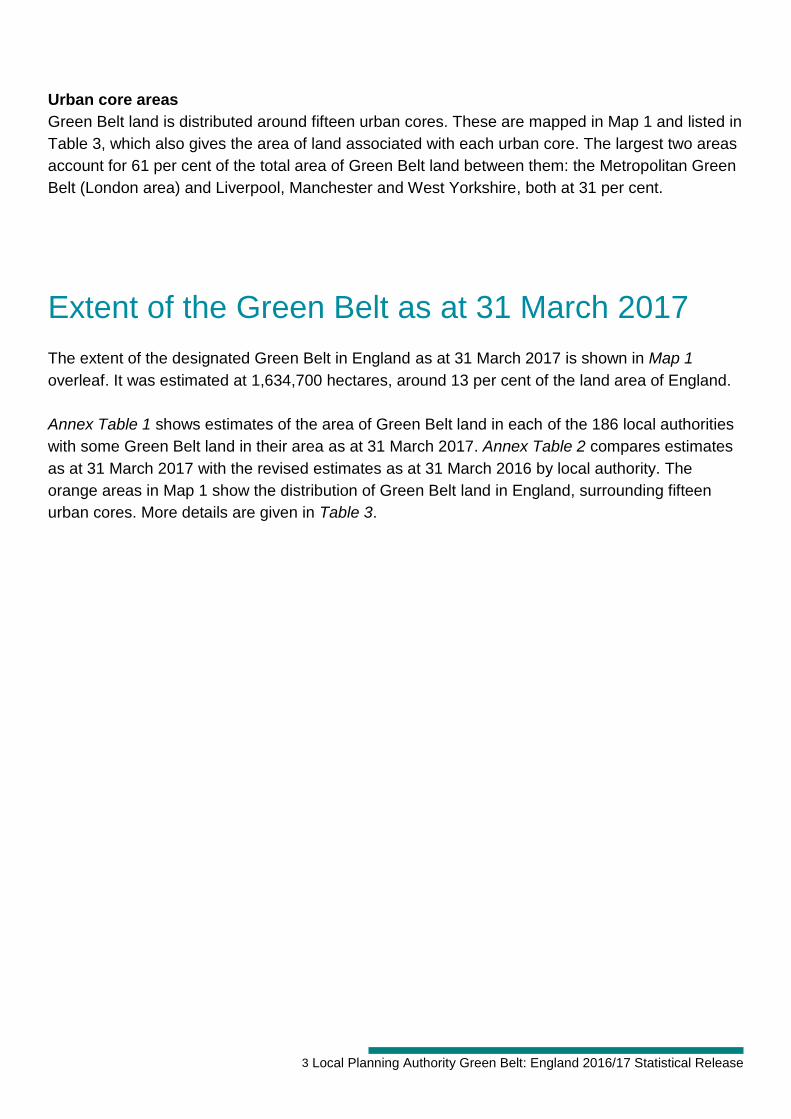
Urban core areas
Green Belt land is distributed around fifteen urban cores. These are mapped in Map 1 and listed in
Table 3, which also gives the area of land associated with each urban core. The largest two areas
account for 61 per cent of the total area of Green Belt land between them: the Metropolitan Green
Belt (London area) and Liverpool, Manchester and West Yorkshire, both at 31 per cent.
Extent of the Green Belt as at 31 March 2017
The extent of the designated Green Belt in England as at 31 March 2017 is shown in Map 1
overleaf. It was estimated at 1,634,700 hectares, around 13 per cent of the land area of England.
Annex Table 1 shows estimates of the area of Green Belt land in each of the 186 local authorities
with some Green Belt land in their area as at 31 March 2017. Annex Table 2 compares estimates
as at 31 March 2017 with the revised estimates as at 31 March 2016 by local authority. The
orange areas in Map 1 show the distribution of Green Belt land in England, surrounding fifteen
urban cores. More details are given in Table 3.

4 Local Planning Authority Green Belt: England 2016/17 Statistical Release
Map 1:

5 Local Planning Authority Green Belt: England 2016/17 Statistical Release
Net changes
Overall, there was a decrease of 790 hectares (less than 0.05 per cent) in the area of Green Belt
in England between 31 March 2016 and 31 March 2017.
In 2016/17, eight local authorities adopted new plans that involved a change in area of the
authority’s Green Belt, resulting in a decrease in the overall area of Green Belt compared to 31
March 2016. The changes are set out in Table 1. There may be discrepancies between individual
figures due to rounding, given that all figures have been rounded to the nearest ten hectares.
Table 1: Authorities which adopted new boundaries for the designated Green Belt 2016/17
Authority
Area of designated Green Belt land 31 March 2016
(hectares)
Area of designated Green Belt land 31 March 2017
(hectares)
Change from 31 March 2016
(hectares)
Birmingham 4,150 3,730 - 420 (-10%)
Bromsgrove 19,480 19,300 -180 (-1%)
Hertsmere 8,040 7,990 - 60 (-1%)
High Peak1 3,980 3,980 - (-0%)
Redditch 1,830 1,800 - 30 (-2%)
South Derbyshire2 2,390 2,390 - (0%)
Stratford-on-Avon 22,370 22,360 - 20 (-0%)
Vale of White Horse 8,310 8,230 -90 (-1%)
Note: figures are rounded to the nearest ten hectares. 1 Area decreased by less than five hectares.
2 South Derbyshire has also revised the Green Belt area for 2015/16, resulting in a net increase in area of one
hectare; see explanation in Annex A for details.
The reported decrease of 790 hectares of Green Belt during 2016/17 is smaller than the 1,020
hectares decrease reported in 2015/16. In the four years prior to 2014/15, not more than four local
authorities made amendments in any one year: see Table 2.
Table 2: Number of authorities making changes to Green belt boundaries
Year 2010/11 2011/12 2012/13 2013/14 2014/15 2015/16 2016/17
Number of authorities changing their Green Belt boundary 3 3 4 3 11 8 8
Net change in size of the Green Belt boundary (hectares) 0 -50 -320 -530 -2,130 -1,020 -790
Note: the area figures reflect any revisions made; they are rounded to the nearest ten hectares.
Local authorities making changes to their Green Belt boundaries were contacted to obtain expla-nations for the changes, which are detailed in Annex A.

6 Local Planning Authority Green Belt: England 2016/17 Statistical Release
Longer term changes Statistics on the area of Green Belt are available back to 1997 (Annex Table 3). Figures are,
however, available on a consistent basis only from 2006, following the designation of 47,300
hectares of Green Belt land as part of the New Forest National Park in 2005. Those from 31 March
2014 are set out in Table 3.
Table 3: Trend in the area of Green Belt land as at 31 March since 2014, England
2014 2015R 2016
R 2017
% change 2014-17
England 1,638,630 1,636,500 1,635,490 1,634,700 0
Urban core
Birmingham 231,350 231,250 231,230 230,580 0
Blackpool 2,600 2,600 2,600 2,600 0
Bournemouth 36,380 36,000 36,000 36,000 -1
Bristol and Bath 71,730 71,630 71,630 71,630 0
Burton upon Trent 730 730 720 720 -1
Cambridge 25,100 25,100 25,180 25,180 0
Derby and Nottingham 61,400 60,700 60,700 60,700 -1
Gloucester 7,500 7,500 7,500 7,500 0
Liverpool, Manchester and West Yorks. 504,570 504,400 503,410 503,410 0
London area 514,200 514,080 514,080 514,030 0
Morecombe 1,740 1,740 1,740 1,740 0
North East 73,060 72,490 72,430 72,430 -1
Oxford 34,990 34,990 34,990 34,910 0
Stoke 44,440 44,440 44,440 44,440 0
York 27,940 27,940 27,940 27,940 0 R Revised since the original estimate was published.
The total of urban core Green Belt areas will not therefore match the England total. The area figures reflect any
revisions made; they are rounded to the nearest ten hectares.
Local authorities may be mapped within the Green Belt of more than one urban core.
Accompanying annex tables Three additional annex tables are available to download alongside this release:
Table 1 Area of designated Green Belt land by local planning authority as at 31 March 2017
Table 2 Difference in Green Belt area between 31 March 2016 and 31 March 2017
Table 3 Historical trend in the area of Green Belt land since 1997
They are available at https://www.gov.uk/government/collections/green-belt-statistics.
In addition, a geographic boundary (shape) file setting out Green Belt area boundaries as at 31
March 2017 is available at https://data.gov.uk/dataset/english-local-authority-green-belt-dataset1.
7 Local Planning Authority Green Belt: England 2016/17 Statistical Release
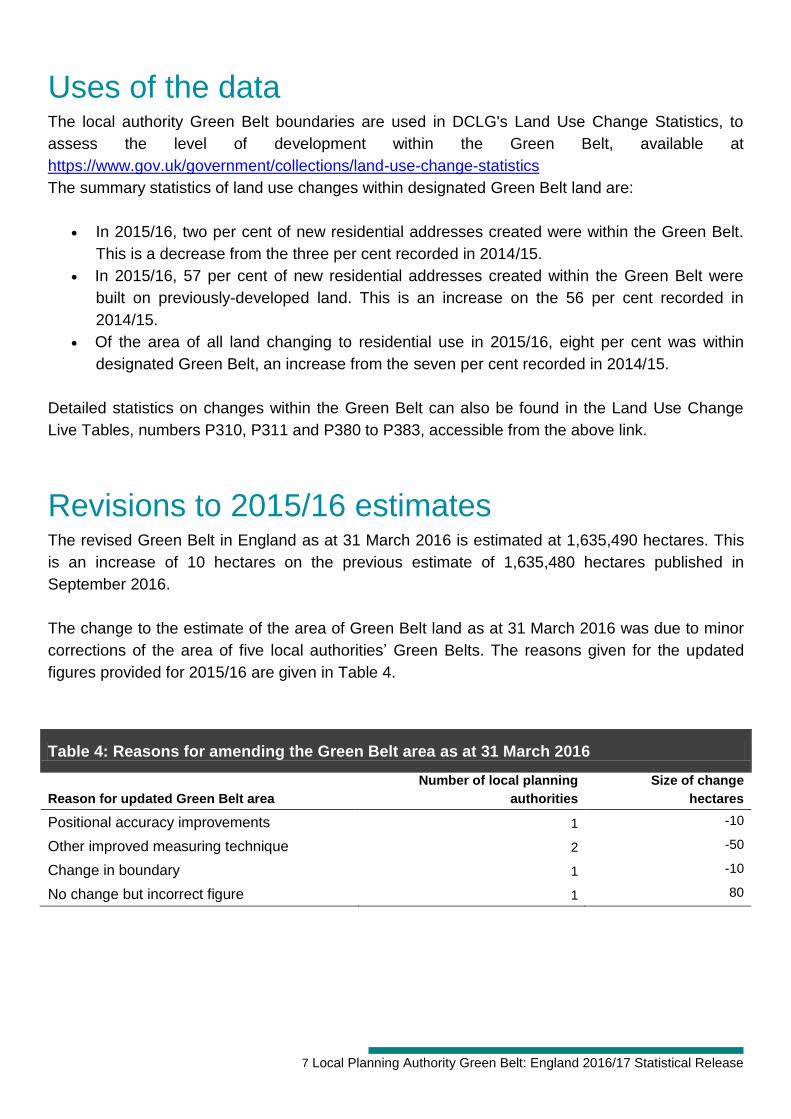
Uses of the data The local authority Green Belt boundaries are used in DCLG's Land Use Change Statistics, to
assess the level of development within the Green Belt, available at
https://www.gov.uk/government/collections/land-use-change-statistics
The summary statistics of land use changes within designated Green Belt land are:
In 2015/16, two per cent of new residential addresses created were within the Green Belt.
This is a decrease from the three per cent recorded in 2014/15.
In 2015/16, 57 per cent of new residential addresses created within the Green Belt were
built on previously-developed land. This is an increase on the 56 per cent recorded in
2014/15.
Of the area of all land changing to residential use in 2015/16, eight per cent was within
designated Green Belt, an increase from the seven per cent recorded in 2014/15.
Detailed statistics on changes within the Green Belt can also be found in the Land Use Change
Live Tables, numbers P310, P311 and P380 to P383, accessible from the above link.
Revisions to 2015/16 estimates The revised Green Belt in England as at 31 March 2016 is estimated at 1,635,490 hectares. This
is an increase of 10 hectares on the previous estimate of 1,635,480 hectares published in
September 2016.
The change to the estimate of the area of Green Belt land as at 31 March 2016 was due to minor
corrections of the area of five local authorities’ Green Belts. The reasons given for the updated
figures provided for 2015/16 are given in Table 4.
Table 4: Reasons for amending the Green Belt area as at 31 March 2016
Reason for updated Green Belt area
Number of local planning
authorities
Size of change
hectares
Positional accuracy improvements 1 -10
Other improved measuring technique 2 -50
Change in boundary 1 -10
No change but incorrect figure 1 80

8 Local Planning Authority Green Belt: England 2016/17 Statistical Release
Annex A – explanation of changes in 2016/17 Birmingham “We have revised the greenbelt area following the adoption of our Birmingham Development plan
in January 2017, which has policy to build on the greenbelt.”
Bromsgrove “The Green Belt in Bromsgrove was changed following adoption of the Bromsgrove District Plan
2011-2030 in January 2017. The Plan allocates two sites in Bromsgrove on the boundary with
Redditch Borough Council for the housing needs of Redditch up to 2030.”
Hertsmere “A limited number of amendments were made to the Green Belt boundary in Hertsmere through the adoption of the council’s Site Allocations and Development Management (SADM) Policies Plan in November 2016 and publication of a new policies map. These documents form part of the Hertsmere local Plan 2012-2027 along with the Core Strategy 2013 and Elstree Way Corridor Ar-ea Action Plan 2015. The main change was to remove a 63ha former hospital site from the Green Belt which was de-veloped in the 1990s for housing. This change was in accordance with a commitment made in the Core Strategy 2013 because the nature of the site had changed from an open, semi-rural site to a largely suburban housing estate. 14.6ha of land on the edge of Borehamwood has also been designated as safeguarded land for employment development beyond 2027 and was taken out of the Green Belt through the SADM Policies Plan, in line with the Core Strategy. A few minor adjustments have been made to define a more logical and defensible boundary around existing development. The largest of these is the removal of a 1.7ha private hospital site from the Green Belt in order to draw a continuous defensible boundary along the opposite side of a road. A further 0.3ha has been allocated for housing and removed from the Green Belt. Approximately 4ha of land safeguarded for housing in the 2003 Local Plan has been returned to the Green Belt through the SADM Plan 2016 following its designation as a Village Green in the in-tervening period.” High Peak “The Green Belt Boundary in Furness Vale was changed following the adoption of the High Peak Local Plan (LP) in April 2016. Studies concluded that this site did not meet Green Belt purposes. It is allocated for residential development with a capacity of around 39 dwellings. The following is quoted from the Inspector’s report: The LP proposes a single change, at Furness Vale where land on the edge of the village adjacent to the A6 would be removed from the Green Belt and allocated for 39 dwellings. The site is en-closed by a road, canal and existing built development. The Council’s Landscape Impact Assess-
9 Local Planning Authority Green Belt: England 2016/17 Statistical Release
ment (January 2014 with updates in July and August 2014) (LIA) undertaken by Wardell Arm-strong has demonstrated to my satisfaction that it does not contribute to the purposes of including land within the Green Belt. Furness Vale is identified as a larger village in the LP settlement hier-archy where a moderate scale of development is acceptable. Taking these factors together the exceptional circumstances test has been met and the exclusion of the land from the Green Belt has been justified. (Report into the Examination into High Peak Local Plan March 2016)” Redditch “The Green Belt boundary in Redditch has changed following adoption of Borough of Redditch Local Plan No.4 in January 2017 (2011-2013). Approximately 35 hectares of land has been removed from the Green Belt for residential development at the edge of Redditch.” South Derbyshire “In 2012 a technical assessment of the South East Derbyshire Green Belt was undertaken by South Derbyshire District Council, Amber Valley Borough Council, Derby City Council, Derbyshire County Council and Erewash Borough Council. It concluded that the A50 and A6 spur, completed since the Green Belt was first designated, formed a physical feature in the landscape. Consequently an area bounded by London Road and the A6, measuring 11.5ha, no longer contributed to the openness of the Green Belt and an area of land south west of Thulston, measuring 12.5ha, now appeared to perform a Green Belt role6. The Green Belt boundary has therefore been amended by deleting the area bounded by London Road and the A6 and adding the land to the south west of Thulston, resulting in a net increase in the Green Belt area. The change to the boundary has been made through the adoption of the South Derbyshire Local Plan Part 1, Policy S8.” Stratford-on-Avon “The area of Green Belt in Stratford-on-Avon District has changed to accommodate two sites for Employment uses. Approximately 20 hectares of land have been removed from the Green Belt. One site on the edge of the District has been allocated through co-operation with Redditch and Bromsgrove Councils to help meet the employment land needs of Redditch. The change to the designation has been made after the Core Strategy Examination Inspector found the Plan’s ap-proach to the Green Belt to be consistent with national policy and through the adoption of Strat-ford-on-Avon District Core Strategy by the Council on 11 July 2016.” Vale of White Horse “Vale of White Horse District Council proposed a change to the Oxford Green Belt through their local plan process (set out in Local Plan 2031: Part 1), which was subject to scrutiny by independ-ent Planning Inspector through an Examination in Public. The Inspector concluded that ‘excep-tional circumstances’ had been demonstrated and that the plan proposals were soundly based and in accordance with national policy, guidance and legislation. The plan was adopted on 14th De-cember 2016.”
6 Previous shapefiles and figures held by DCLG had the 12.5 ha west of Thulston mapped within the Green Belt
though South Derbyshire have advised us this change only occurred in 2016/17. A revision to the 2015/16 estimate
was therefore made to exclude the 12.5 ha west of Thulston from the 2015/16 estimate. The removal of 11.5 ha and
addition of 12.5 ha in 2016/17, has therefore resulted in a marginal increase of Green Belt area by less than 1 ha.

10 Local Planning Authority Green Belt: England 2016/17 Statistical Release
Technical notes
Data collection and methods Estimates of Green Belt land in individual local authorities in England are collected annually on the
‘Annual Green Belt’ (AGB1) return via Interform, the department’s housing and planning electronic
data collection system. Authorities were asked to confirm their published Green Belt estimates as
at 31 March 2016 and indicate whether they had changed the Green Belt boundary in 2016/17. If
the Green Belt boundary had changed, or if the estimated area as at 31 March 2016 had been
revised, authorities were contacted to obtain an explanation and to provide a revised geographic
boundary file (shape file).
Robust estimates of the area of Green Belt land in England by local planning authority were first
published in 1997. Between 1998 and 2002 there was no further publication on the area of Green
Belt, but from 2003, Green Belt estimates were collated on an annual basis to monitor the
department’s target on the area of Green Belt land in England. However, figures were not
published for 2005 due to the extensive quality assurance required in that year.
The analysis carried out by the department verifies the area of the shape files supplied by local
authorities, and aggregates them (together with previously provided boundaries for authorities who
have not amended the Green Belt boundaries) to provide a national estimate of the area of Green
Belt in England at a particular point in time. Any discrepancies are followed up with the authority
and a corrected shape file obtained.
If there has been an actual change in Green Belt, rather than an improved measurement of its
extent, this is followed up with the authority to determine the reason for the change. The statistics
produced allow a comparison of Green Belt area between authorities and between different years.
The data collected have been chosen to provide useful and relevant information on the level and
trends in the extent of the Green Belt to users while ensuring that the burden placed on local
authorities of completing the return is not excessive. Only authorities who have changed the
boundaries of their Green Belt, or who have corrected the boundaries, are asked to supply shape
files.
Data quality Since 2007, the department has built and maintained its Green Belt dataset from local authority
digital data supplied via the Interform return for local authorities. This requires authorities to mark
the boundary of the Green Belt in their area on a suitable digital map. Authorities are asked to
record which mapping product was used to create the Green Belt boundary. An indication on the
level of quality assurance undertaken by the local authority is also recorded as part of the final
sign-off for this return. All boundaries are checked to ensure that they match the area of the Green
Belt as recorded by the local authority on the Interform return.

11 Local Planning Authority Green Belt: England 2016/17 Statistical Release
An England level dataset is created from the individual local authority boundaries, making sure
that there is no overlap or duplication between different authorities. Trends in the area of Green
Belt can be reliably and easily assessed both nationally and at a local authority level. No
imputation is carried out as authorities who fail to respond are assumed to have had no change in
Green Belt. Authorities are given the chance to correct previously published estimates, whether
due to actual changes that were not submitted in time, or because of more accurate Green Belt
boundary information. All calculations are carried out using exact measurements, but published
information is rounded to the nearest ten hectares.
Authorities are supplied with comprehensive guidance to ensure that there is a common
understanding of what information is to be supplied. The main possible source of error in the
production of the statistics is a mismatch between the area estimate and the actual boundary
supplied by the authority. This can occur because of the different geographical software used to
define the boundaries. Any such discrepancies are rare and are investigated with the local
authority concerned to ensure that the calculated area of the Green Belt matches the boundary file
supplied.
There are also possible errors due to authorities not submitting information in time. These errors
are minimised by a high response rate (98 per cent in 2016/17). In 2016/17, two authorities did not
complete the return in time. It is assumed for these authorities that there has been no change in
the boundary area. They are:
Hounslow
Rochford
The use of digital boundary files is much more cost effective and more accurate than the previous
method of digitising paper maps. Given the increasing sophistication and accuracy of the software
used to define and measure the Green Belt, estimates of its area should be very accurate and
suitable for many different uses.
Revisions policy
This policy has been developed in accordance with the UK Statistics Authority Code of Practice for
Official statistics and the Department for Communities and Local Government Revisions Policy
(found at https://www.gov.uk/government/publications/statistical-notice-dclg-revisions-policy).
There are two types of revision that the policy covers:
Non-Scheduled Revisions
Where a substantial error has occurred as a result of the compilation, imputation or dissemination
process, the statistical release, live tables and other accompanying releases will be updated with a
correction notice as soon as is practical.
12 Local Planning Authority Green Belt: England 2016/17 Statistical Release
Scheduled Revisions
Local authorities are asked to confirm the previously published area of their Green Belt when
completing returns for each annual statistical release. If they do not agree with this figure, or they
have changed the digital boundaries to more accurately represent the actual Green Belt
boundaries, and the difference between the revised and previously published areas is more than
ten hectares, they are asked to submit a revised shape file to the Department.
Scale of Revisions
The last three scheduled revisions have resulted in minor changes to the overall area of the Green
Belt in England - the area at 31 March 2014 was revised from 1,638,610 hectares to 1,638,630
hectares, the area at 31 March 2015 was revised from 1,636,620 hectares to 1,636,500 hectares,
and the area at 31 March 2016 was revised from 1,635,480 hectares to 1,635,490 hectares.
However, individual local authority revisions can be more volatile.
User engagement
Users are encouraged to provide feedback on how these statistics are used and how well they
meet user needs. Comments on any issues relating to this statistical release are welcomed and
encouraged. Responses should be addressed to the "Public enquiries" contact given in the
"Enquiries" section below.
The department’s engagement strategy to meet the needs of statistics users is published here:
https://www.gov.uk/government/publications/engagement-strategy-to-meet-the-needs-of-statistics-
users
Notes 1. This Release is a web-only publication.
2. Details of officials who receive pre-release access to this statistical release 24 hours before
publication can be found at: https://www.gov.uk/government/organisations/department-for-
communities-and-local-government/about/statistics
3. National Statistics are produced to high professional standards set out in the Code of
Practice for Official Statistics. They undergo regular quality assurance reviews to ensure they
meet customer needs.
Devolved administration statistics Information and statistics on planning for the devolved administrations can be accessed at the
following links: Scotland: http://www.scotland.gov.uk/Topics/Statistics/Browse/Planning
Wales: http://wales.gov.uk/topics/planning/planningstats/?lang=en
Northern Ireland: http://www.planningni.gov.uk/index/tools/about-statistics.htm
https://www.gov.uk/government/publications/engagement-strategy-to-meet-the-needs-of-statistics-users

13 Local Planning Authority Green Belt: England 2016/17 Statistical Release
Enquiries
Media enquiries:
office hours: 0303 444 2883 out of hours: 0303 444 1201
Email: [email protected]
Public enquiries and Responsible Statistician:
Sophie Ferguson Email: [email protected]
Information on Official Statistics is available via the UK Statistics Authority website:
http://www.statisticsauthority.gov.uk/
Information about statistics at DCLG is available via the department’s website:
www.gov.uk/government/organisations/department-for-communities-and-local-
government/about/statistics
© Crown copyright, 2017
Copyright in the typographical arrangement rests with the Crown.
You may re-use this information (not including logos) free of charge in any format or medium, under the terms of the Open Government Licence. To view this licence, http://www.nationalarchives.gov.uk/doc/open-government-licence/ or write to the Information Policy Team, The National Archives, Kew, London TW9 4DU, or email: [email protected].
This document/publication is also available on our website at www.gov.uk/dclg
If you have any enquiries regarding this document/publication, email [email protected] or write to us at:
Department for Communities and Local Government Fry Building 2 Marsham Street London SW1P 4DF Telephone: 030 3444 0000 For all our latest news and updates follow us on Twitter: https://twitter.com/CommunitiesUK
ISBN: 978-1-4098-5100-4
Related Documents