Introduction 2 Local Authority Outturn Summary 4 Local Authority Expenditure 5 Revenue Expenditure Financing 11 Local Authority Financial Reserves 14 Definitions 15 Accompanying tables 18 Technical notes 18 Enquiries 21 Local Government Finance Statistical Release 25 August 2016 Would you like to be added to our mailing list? We can contact when we update these statistics and consult you if we are thinking of making changes? You can subscribe to updates by emailing: [email protected] with the subject ‘Subscribe’ Responsible Statistician: William Nye Statistical enquiries: 0303 444 2940 [email protected]. gov.uk Media Enquiries: 0303 444 1201 [email protected] Date of next publication: November 2016 (final figures) Local Authority Revenue Expenditure and Financing: 2015-16 Provisional Outturn, England Expenditure Local authority revenue expenditure totalled £94.5 billion in 2015-16 for England. This has decreased 1.5% from £95.4 billion in 2014-15. The largest components of local authorities’ net current expenditure are Education (30.6%), Housing Benefits (18.7%) and Adult Social Care (12.9%). Education services saw the largest decrease; this was £314 million (0.9%) less than spend in 2014-15. This is driven by the continued change in status from schools to centrally funded academies. Public Health services increased by £409 million (15.0%) compared to 2014-15. This was the largest increase in expenditure on services. From October 2015 onwards, authorities received additional responsibilities to provide Public Health services for children aged 0-5. Financing 26.2% of revenue expenditure will be funded through council tax 12.5% from rates used under the business rate retention scheme and 60.4% from central Government grants. The remaining 0.9% is funded by authorities using their reserves (0.4%) and other items (0.5%). These percentages were 25.0%, 11.8% and 63.9% respectively in 2014-15 and authorities added equivalent to 0.7% of revenue expenditure to their reserves. In 2015-16, local authorities used £0.4 billion of the money saved in reserves, equivalent to 1.6% of the total amount of held at on 1 April 2015. In 2014-15, local authorities added £0.9 billion to their reserves.

Welcome message from author
This document is posted to help you gain knowledge. Please leave a comment to let me know what you think about it! Share it to your friends and learn new things together.
Transcript
Introduction 2
Local Authority Outturn
Summary 4
Local Authority
Expenditure 5
Revenue Expenditure
Financing
11
Local Authority
Financial Reserves
14
Definitions 15
Accompanying tables 18
Technical notes 18
Enquiries 21
Local Government Finance Statistical Release 25 August 2016
Would you like to be added
to our mailing list? We can contact when we update
these statistics and consult you if
we are thinking of making
changes? You can subscribe to
updates by emailing:
with the subject ‘Subscribe’
Responsible Statistician:
William Nye
Statistical enquiries:
0303 444 2940
gov.uk
Media Enquiries:
0303 444 1201
Date of next publication:
November 2016 (final figures)
Local Authority Revenue
Expenditure and Financing:
2015-16 Provisional Outturn, England
Expenditure
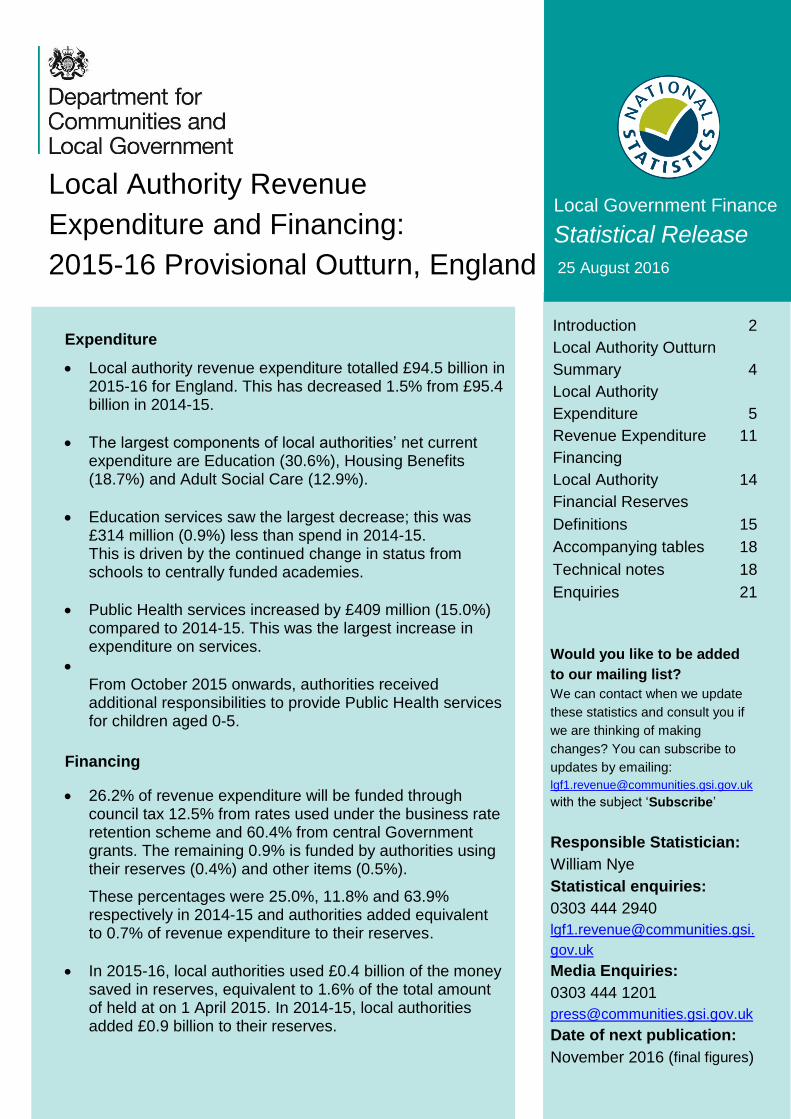
Local authority revenue expenditure totalled £94.5 billion in 2015-16 for England. This has decreased 1.5% from £95.4 billion in 2014-15.
The largest components of local authorities’ net current expenditure are Education (30.6%), Housing Benefits (18.7%) and Adult Social Care (12.9%).
Education services saw the largest decrease; this was £314 million (0.9%) less than spend in 2014-15. This is driven by the continued change in status from schools to centrally funded academies.
Public Health services increased by £409 million (15.0%) compared to 2014-15. This was the largest increase in expenditure on services.
From October 2015 onwards, authorities received additional responsibilities to provide Public Health services for children aged 0-5.
Financing
26.2% of revenue expenditure will be funded through council tax 12.5% from rates used under the business rate retention scheme and 60.4% from central Government grants. The remaining 0.9% is funded by authorities using their reserves (0.4%) and other items (0.5%).
These percentages were 25.0%, 11.8% and 63.9% respectively in 2014-15 and authorities added equivalent to 0.7% of revenue expenditure to their reserves.
In 2015-16, local authorities used £0.4 billion of the money saved in reserves, equivalent to 1.6% of the total amount of held at on 1 April 2015. In 2014-15, local authorities added £0.9 billion to their reserves.
2 Revenue Expenditure and Financing, 2015-16 Provisional Outturn, Statistical Release
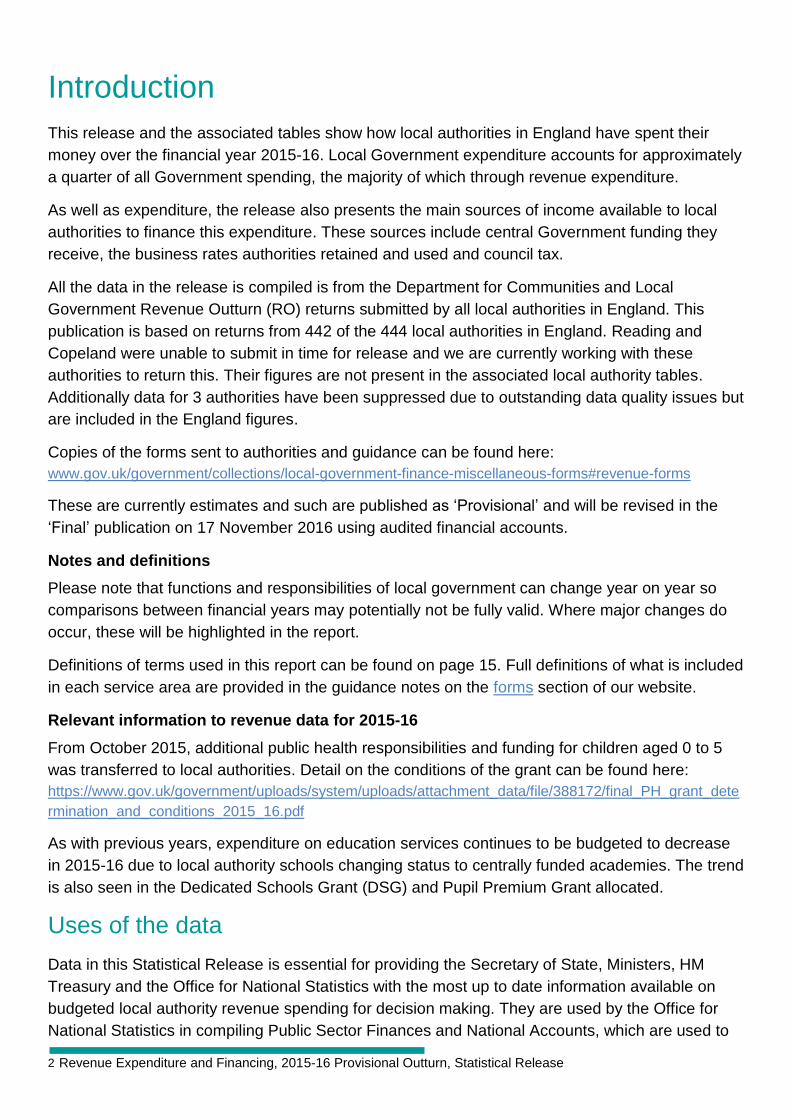
Introduction
This release and the associated tables show how local authorities in England have spent their
money over the financial year 2015-16. Local Government expenditure accounts for approximately
a quarter of all Government spending, the majority of which through revenue expenditure.
As well as expenditure, the release also presents the main sources of income available to local
authorities to finance this expenditure. These sources include central Government funding they
receive, the business rates authorities retained and used and council tax.
All the data in the release is compiled is from the Department for Communities and Local
Government Revenue Outturn (RO) returns submitted by all local authorities in England. This
publication is based on returns from 442 of the 444 local authorities in England. Reading and
Copeland were unable to submit in time for release and we are currently working with these
authorities to return this. Their figures are not present in the associated local authority tables.
Additionally data for 3 authorities have been suppressed due to outstanding data quality issues but
are included in the England figures.
Copies of the forms sent to authorities and guidance can be found here:
www.gov.uk/government/collections/local-government-finance-miscellaneous-forms#revenue-forms
These are currently estimates and such are published as ‘Provisional’ and will be revised in the
‘Final’ publication on 17 November 2016 using audited financial accounts.
Notes and definitions
Please note that functions and responsibilities of local government can change year on year so
comparisons between financial years may potentially not be fully valid. Where major changes do
occur, these will be highlighted in the report.
Definitions of terms used in this report can be found on page 15. Full definitions of what is included
in each service area are provided in the guidance notes on the forms section of our website.
Relevant information to revenue data for 2015-16
From October 2015, additional public health responsibilities and funding for children aged 0 to 5
was transferred to local authorities. Detail on the conditions of the grant can be found here:
https://www.gov.uk/government/uploads/system/uploads/attachment_data/file/388172/final_PH_grant_dete
rmination_and_conditions_2015_16.pdf
As with previous years, expenditure on education services continues to be budgeted to decrease
in 2015-16 due to local authority schools changing status to centrally funded academies. The trend
is also seen in the Dedicated Schools Grant (DSG) and Pupil Premium Grant allocated.
Uses of the data
Data in this Statistical Release is essential for providing the Secretary of State, Ministers, HM
Treasury and the Office for National Statistics with the most up to date information available on
budgeted local authority revenue spending for decision making. They are used by the Office for
National Statistics in compiling Public Sector Finances and National Accounts, which are used to
https://www.gov.uk/government/collections/local-government-finance-miscellaneous-forms#revenue-forms
3 Revenue Expenditure and Financing, 2015-16 Provisional Outturn, Statistical Release
set fiscal and monetary policy.
Data collected are an important source for the department to create evidence based policy, make
financial decisions and answer parliamentary questions. It is used by local authorities and their
associations, regional bodies, other government departments, members of the business
community and the general public.
The release allows for funding trends for different local authority services and types to be identified
over a period of years when compared with previous release. Local authorities can also compare
their own spending with the aggregated figures presented here or with the equivalent data for
individual local authorities.
This statistics can be read in conjunction with budgeted Revenue Account (RA) statistics
published at the beginning of the financial year to illustrate how budgeting plans at the start of the
year compare with actual spend and financing.
Accompanying dropdown tables presenting detailed budgeted revenue expenditure and financing
figures for 2015-16 for all local authorities are available to download alongside this release. See
Accompanying tables on page 18 for more details.
User Engagement Survey
We are currently running a survey to understand more about how local government finance
statistics and data are used. Please see the link to the short survey below:
https://www.surveymonkey.co.uk/r/LGFuserengagement
Symbols
… = not available
0 = zero or negligible
- = not relevant
|| = discontinuity
(R) = revised since the last statistical release
Rounding
Where figures have been rounded, there may be a slight discrepancy between the total and the
sum of constituent parts.
4 Revenue Expenditure and Financing, 2015-16 Provisional Outturn, Statistical Release
Local Authority Outturn Summary
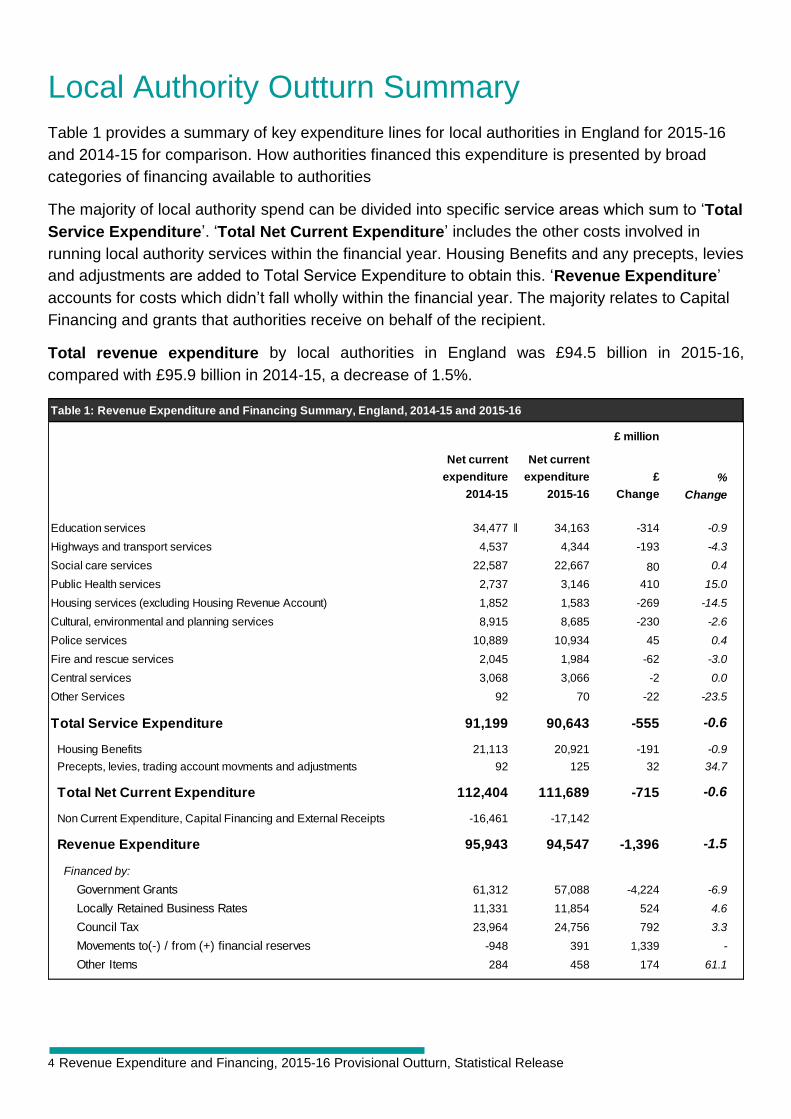
Table 1 provides a summary of key expenditure lines for local authorities in England for 2015-16
and 2014-15 for comparison. How authorities financed this expenditure is presented by broad
categories of financing available to authorities
The majority of local authority spend can be divided into specific service areas which sum to ‘Total
Service Expenditure’. ‘Total Net Current Expenditure’ includes the other costs involved in
running local authority services within the financial year. Housing Benefits and any precepts, levies
and adjustments are added to Total Service Expenditure to obtain this. ‘Revenue Expenditure’
accounts for costs which didn’t fall wholly within the financial year. The majority relates to Capital
Financing and grants that authorities receive on behalf of the recipient.
Total revenue expenditure by local authorities in England was £94.5 billion in 2015-16,
compared with £95.9 billion in 2014-15, a decrease of 1.5%.
£ million
Net current Net current
expenditure expenditure £ %
2014-15 2015-16 Change Change
Education services 34,477 ǁ 34,163 -314 -0.9
Highways and transport services 4,537 4,344 -193 -4.3
Social care services 22,587 22,667 80 0.4
Public Health services 2,737 3,146 410 15.0
Housing services (excluding Housing Revenue Account) 1,852 1,583 -269 -14.5
Cultural, environmental and planning services 8,915 8,685 -230 -2.6
Police services 10,889 10,934 45 0.4
Fire and rescue services 2,045 1,984 -62 -3.0
Central services 3,068 3,066 -2 0.0
Other Services 92 70 -22 -23.5
Total Service Expenditure 91,199 90,643 -555 -0.6
Housing Benefits 21,113 20,921 -191 -0.9
Precepts, levies, trading account movments and adjustments 92 125 32 34.7
Total Net Current Expenditure 112,404 111,689 -715 -0.6
Non Current Expenditure, Capital Financing and External Receipts -16,461 -17,142
Revenue Expenditure 95,943 94,547 -1,396 -1.5
Financed by:
Government Grants 61,312 57,088 -4,224 -6.9
Locally Retained Business Rates 11,331 11,854 524 4.6
Council Tax 23,964 24,756 792 3.3
Movements to(-) / from (+) financial reserves -948 391 1,339 -
Other Items 284 458 174 61.1
Table 1: Revenue Expenditure and Financing Summary, England, 2014-15 and 2015-16

5 Revenue Expenditure and Financing, 2015-16 Provisional Outturn, Statistical Release
Local Authority Expenditure
Total Service Expenditure
Service expenditure is made up of 12 distinct service areas (such as Education, Adult Social care
and Public health) and ‘Other services’ to include spend authorities are unable to allocate to
specific areas.
Table 2 shows the components ‘Total Service Expenditure’ for each of these service areas. Total
expenditure is the total of the amounts spent on the Running Expenses for the service and
Employees in that area. Total income comprises income from Sales, Fees and Charges and Other
Income (such as lottery funding, funding from joint arrangements and additional grants authorities
apply for that are not part of central government funding). The net total (Expenditure minus
Income) of these is Service Expenditure.
The majority of the expenditure on Adult Social Care is on Running Expenses rather than
on Employee Expenditure. Of the total expenditure of £20.1 bn, £16.7 bn or 83.1% goes
towards Running Expenses as services in this area generally contract out employment.
Conversely the majority (79.5%) of Police service and Fire and rescue service (74.9%)
spend is on Employee Expenditure. The majority of this spend is through the Police and
Crime Commissioner and Fire authorities providing this service directly.
The Adult Social Care, Highways and transport, Education, Environmental and Central
service areas all generate over £1 billion in Sales, Fees and Charges. This includes the
income generated through parking services.
Adult Social Care generated £2.6 bn in Sales, Fees and Charges and £3.1 bn in Other
Income in 2015-16 this is 28.5% of total expenditure in this service. This is largely due to
£ million
Employees
Expenditure
Running
Expenses
Total
Expenditure
Sales, Fees
and Charges
Other
Income (b)
Total
Income
Service
Expenditure
Education 22,121 16,313 38,434 1,545 2,726 4,271 34,163
Highways and transport 1,336 6,052 7,388 2,037 1,007 3,044 4,344
Childrens Social Care 3,247 5,723 8,970 155 542 697 8,273
Adult Social Care 3,392 16,728 20,120 2,633 3,093 5,726 14,394
Public Health 347 2,990 3,337 25 166 190 3,146
Housing (excluding HRA) (a) 594 2,265 2,859 726 550 1,276 1,583
Cultural 1,308 2,439 3,746 819 436 1,255 2,491
Environmental 1,504 5,279 6,782 1,149 664 1,813 4,970
Planning and development 995 1,458 2,452 779 449 1,229 1,224
Police 9,509 2,448 11,957 449 573 1,023 10,934
Fire and rescue 1,561 524 2,086 34 68 102 1,984
Central 5,815 6,267 12,083 1,089 7,928 9,017 3,066
Other 127 283 410 59 281 340 70
Total Service Expenditure 51,858 68,767 120,625 11,500 18,482 29,982 90,643
(a) Housing Revenue Account
(b) Other Income includes other grants, reimbursements and contributions, joint arrangements and recharges to internal users (excluding interest receipts)
Table 2: Expenditure, income and total service expenditure summary, England, 2015-16

6 Revenue Expenditure and Financing, 2015-16 Provisional Outturn, Statistical Release
the way the service area is financed, as Better Care Fund funding and interactions between
joint arrangements would be recorded against this Service line.
Although net expenditure for Central services accounts for £3.1 bn, total expenditure is
£12.1 bn. The majority of this (£9.0 bn) is financed by income generated within this service
area. The majority of this is from Management services ‘recharges’ which are the costs
charged between departments within the local authority.
Adult social care has the largest increase to total income; this income is £102 million more
than the increase in expenditure in the service area. Resulting in an overall decrease in the
net service area spend compared to the previous financial year. The majority of the income
associated with Adult social care includes the funding streams such as the Better Care
Fund.
The balance of net expenditure on Cultural services is decreasing, but this is largely due to
reductions to expenditure (£222 million) rather than in the income received which
decreased by £31 million.

7 Revenue Expenditure and Financing, 2015-16 Provisional Outturn, Statistical Release
Total Net Current Expenditure
Table 4 compares Net Current Expenditure for both this year and last and shows how the Service
Expenditure totals form the Total Net Current Expenditure. This details the Housing benefits
allowances and rebates paid by authorities, precepts paid to Parish Councils and the additional
levies and adjustments to obtain Net Current Expenditure.
Total net current expenditure decreased from £112.4 billion to £111.7 billion between 2014-15 and
2015-16, a decrease of 0.6%.
£ million
Net current Net current
expenditure expenditure £ %
2014-15 2015-16 Change Change
Education services 34,477 ǁ 34,163 -314 -0.9
Highways and transport services 4,537 4,344 -193 -4.3
Social care services 22,587 22,667 80 0.4
of which:
Children and Families Social Care services 8,091 8,273 182 2.3
Adult Social Care services 14,496 14,394 -102 -0.7
Public Health services 2,737 3,146 409 15.0
Housing services (excluding Housing Revenue Account) 1,852 1,583 -269 -14.5
Cultural, environmental and planning services 8,915 8,685 -230 -2.6
of which:
Cultural services 2,682 2,491 -191 -7.1
Environmental services 4,945 4,970 25 0.5
Planning and development services 1,288 1,224 -64 -5.0
Police services 10,889 10,934 45 0.4
Fire and rescue services 2,045 1,984 -61 -3.0
Central services 3,068 3,066 -2 -0.1
Other Services 92 70 -22 -23.5
Total Service Expenditure 91,199 90,643 -556 -0.6
plus precepts, levies, trading accounts and adjustments
Housing Benefits 21,113 20,921 -192 -0.9
of which:
Mandatory Housing Benefits 21,106 20,915 -191 -0.9
Rent Allowances 16,018 16,056 38 0.2
Rent Rebates to Non-HRA Tenants 689 634 -55 -8.0
Rent Rebates to HRA Tenants 4,399 4,225 -174 -4.0
Non-Mandatory Housing Benefits (a) 7 7 0 -6.2
Parish Precepts 389 409 20 5.2
Levies (b) 48 56 8 17.5
Trading Account Adjustments and Other Adjustments (c) -345 -341 4 -1.1
Total Net Current Expenditure 112,404 111,689 -715 -0.6
Table 3: Net current expenditure by service, England, 2014-15 and 2015-16
(a) Includes 'Housing benefits: subsidy limitation transfers from HRA' and 'Contribution to the HRA re items shared by the whole community'.
(b) Includes 'Integrated Transport Authority levy', 'Waste Disposal Authority levy', 'London Pensions Fund Authority levy' and 'Other levies'
(c) Includes 'External Trading Accounts', 'Internal Trading Accounts', 'Capital items accounted for in External Trading Accounts', 'Capital items
accounted for in Internal Trading Accounts', 'Adjustments to net current expenditure' and 'Appropriations to/from Accumulated Absences Account'
8 Revenue Expenditure and Financing, 2015-16 Provisional Outturn, Statistical Release
Net Current Expenditure by service
The largest reduction in spend to services is to Education services which continued to
reduce from £34.5 billion in 2014-15 to £34.2 billion in 2015-16. This 0.9% decrease
continues to be driven by local authority schools changing status to centrally funded
academies.
Adult Social Care services have decreased by £102 million compared to 2014-15 to £13.9
billion.
The largest increase in service spend is for Public Health services, increasing from £2.7
billion in 2014-15 to £3.1 billion in 2015-16. 2015-16 is the first year authorities have the
additional responsibility for children aged 0-5 which started in October 2015. The majority of
all Public Health spend is determined by the public health grant allocations received by 152
authorities in England.
Mandatory Housing Benefits
Although not included in the Service expenditure totals, Housing Benefits are a large component
of local authority spend. These are paid by local councils to help individuals currently on low
incomes help pay for rents for both private and social housing. These are largely financed by
subsidies from the Department for Work and Pensions (DWP), the authority passing this on to
individuals.
Mandatory Housing Benefits decreased by £191 million to £20.9 billion in 2015-16, an
decrease of 0.9%. Despite this decrease Housing benefits still make up a large proportion
of all local authority Net Current Expenditure. Chart A shows that Housing Benefits
accounted for 18.7% of all net current expenditure for 2015-16
The largest component of ‘Housing Benefits’ are the rent allowances (within Mandatory
Housing Benefits) which are paid to tenants of both private landlords and registered social
landlords. This increased by £38 million compared to 2014-15.
9 Revenue Expenditure and Financing, 2015-16 Provisional Outturn, Statistical Release
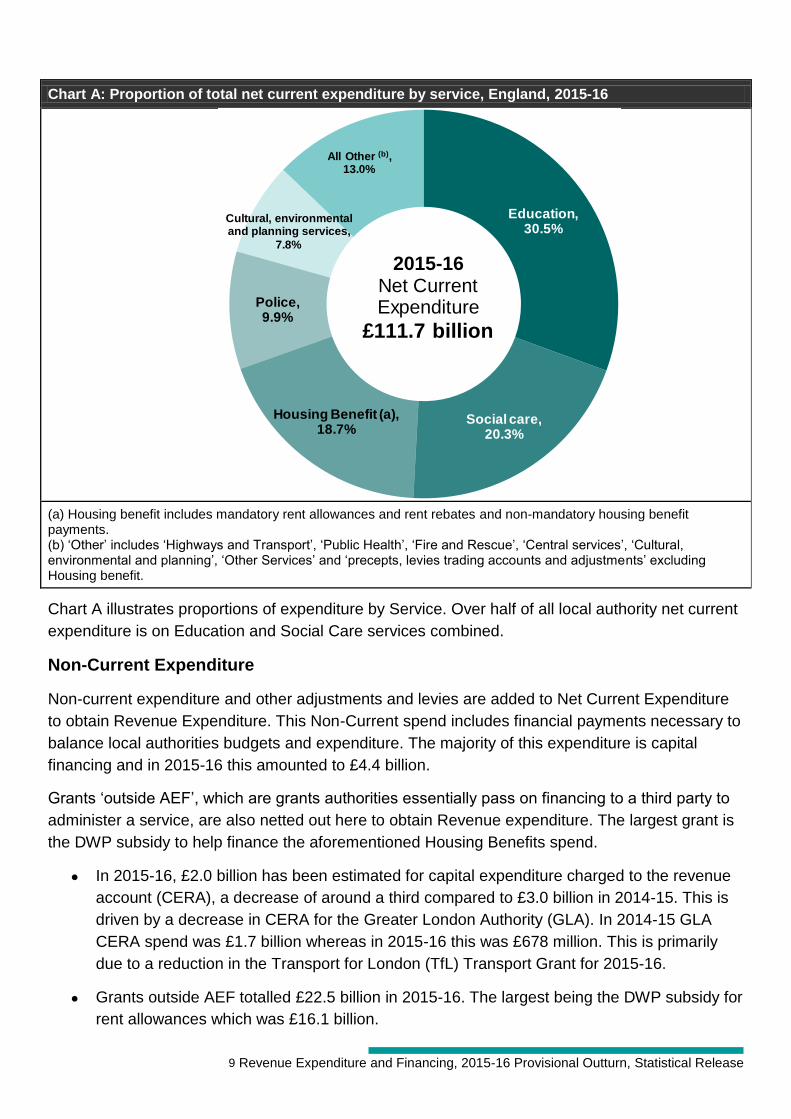
Chart A: Proportion of total net current expenditure by service, England, 2015-16
(a) Housing benefit includes mandatory rent allowances and rent rebates and non-mandatory housing benefit payments. (b) ‘Other’ includes ‘Highways and Transport’, ‘Public Health’, ‘Fire and Rescue’, ‘Central services’, ‘Cultural, environmental and planning’, ‘Other Services’ and ‘precepts, levies trading accounts and adjustments’ excluding Housing benefit.
Chart A illustrates proportions of expenditure by Service. Over half of all local authority net current
expenditure is on Education and Social Care services combined.
Non-Current Expenditure
Non-current expenditure and other adjustments and levies are added to Net Current Expenditure
to obtain Revenue Expenditure. This Non-Current spend includes financial payments necessary to
balance local authorities budgets and expenditure. The majority of this expenditure is capital
financing and in 2015-16 this amounted to £4.4 billion.
Grants ‘outside AEF’, which are grants authorities essentially pass on financing to a third party to
administer a service, are also netted out here to obtain Revenue expenditure. The largest grant is
the DWP subsidy to help finance the aforementioned Housing Benefits spend.
In 2015-16, £2.0 billion has been estimated for capital expenditure charged to the revenue
account (CERA), a decrease of around a third compared to £3.0 billion in 2014-15. This is
driven by a decrease in CERA for the Greater London Authority (GLA). In 2014-15 GLA
CERA spend was £1.7 billion whereas in 2015-16 this was £678 million. This is primarily
due to a reduction in the Transport for London (TfL) Transport Grant for 2015-16.
Grants outside AEF totalled £22.5 billion in 2015-16. The largest being the DWP subsidy for
rent allowances which was £16.1 billion.
Education, 30.5%
Social care,20.3%
Housing Benefit (a), 18.7%
Police, 9.9%
Cultural, environmental and planning services,
7.8%
All Other (b), 13.0%
2015-16Net Current Expenditure
£111.7 billion

10 Revenue Expenditure and Financing, 2015-16 Provisional Outturn, Statistical Release
Community Infrastructure Levy totalled £159 million in 2015-16, an increase of £36 million
compared to 2014-15. Over this time period there were also increases in the number of authorities
becoming charging authorities, however there is a delay between an authority becoming a
charging authority and them receiving money through the levy.
£ million
Net current Net current
expenditure expenditure
2014-15 2015-16
Total Net Current Expenditure 112,404 111,689
plus non-current expenditure
Capital financing (a) 4,528 4,419
Capital expenditure charged to Revenue Account (CERA) (b) 3,010 1,989
Bad debt provision 131 169
Flood defence payments to Environment Agency 34 35
Private Finance Initiative (PFI) schemes - difference from service charge 41 37
Appropriations to(+)/ from(-) financial instruments adjustment account (c) 3 19
Appropriations to(+)/ from(-) unequal pay back pay account (d) 33 52
less interest receipts 865 1,046
less specific grants outside AEF (e) 23,045 22,452
of which:
Mandatory Rent Allowances: subsidy 15,885 16,090
Rent Rebates Granted to HRA Tenants: subsidy 4,390 4,196
Mandatory Rent Rebates outside HRA: subsidy 651 645
Sixth Form Funding from the Education Funding Agency (EFA) 781 695
Adult and Community Learning from Skills Funding Agency 246 218
Other grants outside AEF 1,092 609
less Business Rates Supplement 221 222
less Community Infrastructure Levy (CIL) 123 159
less Carbon Reduction Commitment -13 -17
Revenue Expenditure 95,943 94,547
(b) Includes both Capital expenditure charged to the General Fund Revenue account and for Public Health
(c) Adjustments permitted by regulation to the revenue account charges for financial instruments
(e) Aggregate External Finance; see Definitions
Table 4: Revenue expenditure, England, 2014-15 and 2015-16
(d) The deferral of revenue account charges for unequal pay back pay as permitted by regulation and the reversal of the deferral in
the year that payment of the back pay is due
(a) Includes provision for repayment of principal, leasing payments, external interest payments and HRA item 8 interest payments
and receipts
11 Revenue Expenditure and Financing, 2015-16 Provisional Outturn, Statistical Release
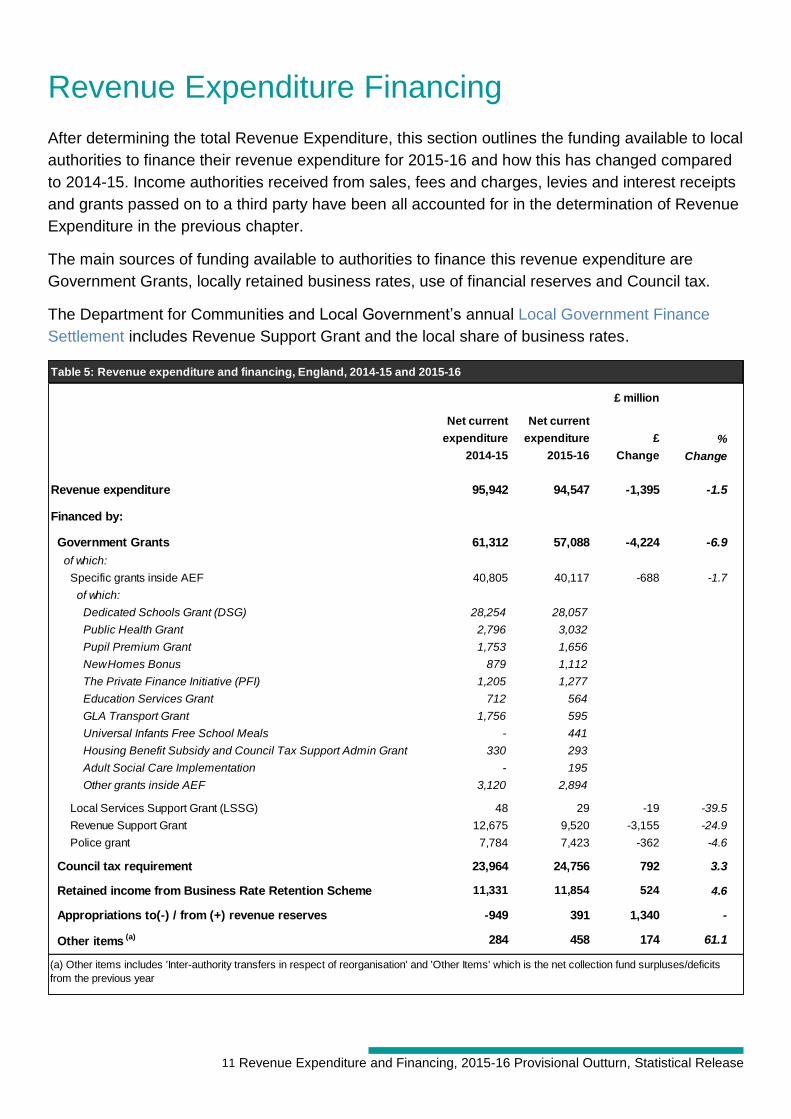
Revenue Expenditure Financing
After determining the total Revenue Expenditure, this section outlines the funding available to local
authorities to finance their revenue expenditure for 2015-16 and how this has changed compared
to 2014-15. Income authorities received from sales, fees and charges, levies and interest receipts
and grants passed on to a third party have been all accounted for in the determination of Revenue
Expenditure in the previous chapter.
The main sources of funding available to authorities to finance this revenue expenditure are
Government Grants, locally retained business rates, use of financial reserves and Council tax.
The Department for Communities and Local Government’s annual Local Government Finance
Settlement includes Revenue Support Grant and the local share of business rates.
£ million
Net current Net current
expenditure expenditure £ %
2014-15 2015-16 Change Change
Revenue expenditure 95,942 94,547 -1,395 -1.5
Financed by:
Government Grants 61,312 57,088 -4,224 -6.9
of which:
Specific grants inside AEF 40,805 40,117 -688 -1.7
of which:
Dedicated Schools Grant (DSG) 28,254 28,057
Public Health Grant 2,796 3,032
Pupil Premium Grant 1,753 1,656
New Homes Bonus 879 1,112
The Private Finance Initiative (PFI) 1,205 1,277
Education Services Grant 712 564
GLA Transport Grant 1,756 595
Universal Infants Free School Meals - 441
Housing Benefit Subsidy and Council Tax Support Admin Grant 330 293
Adult Social Care Implementation - 195
Other grants inside AEF 3,120 2,894
Local Services Support Grant (LSSG) 48 29 -19 -39.5
Revenue Support Grant 12,675 9,520 -3,155 -24.9
Police grant 7,784 7,423 -362 -4.6
Council tax requirement 23,964 24,756 792 3.3
Retained income from Business Rate Retention Scheme 11,331 11,854 524 4.6
Appropriations to(-) / from (+) revenue reserves -949 391 1,340 -
Other items (a) 284 458 174 61.1
Table 5: Revenue expenditure and financing, England, 2014-15 and 2015-16
(a) Other items includes 'Inter-authority transfers in respect of reorganisation' and 'Other Items' which is the net collection fund surpluses/deficits
from the previous year

12 Revenue Expenditure and Financing, 2015-16 Provisional Outturn, Statistical Release
Revenue Expenditure financing
The majority of financing is from central government grants, with around a quarter from council tax
and the remainder set to be financed through locally retained business rates and use of (or
appropriations) from the reserves.
Central government grants financed 60.4% of Revenue Expenditure in 2015-16. This totalled
£57.1 billion, a decrease from £61.3 billion in 2014-15. This total comprises Local Services
Support Grant (LSSG), Specific grants inside AEF, Revenue Support Grant and Police Grant
Specific grants inside Aggregate External Finance (AEF) decreased from £40.8 billion in
2014-15 to £40.1 billion in 2015-16.The downward trend is driven by the Dedicated Schools
Grant which decreased from £28.3 billion in 2014-15 to £28.1 billion in 2015-16.
Dedicated Schools Grant accounts for 69.9% of grants inside AEF and 49.1% of all central
government grants.
Local authorities with public health responsibilities received £3.0 billion in Public Health
Grant in 2015-2016. 2015-16 includes financing for services for children aged 0 to 5, which
transferred to LAs in October 2015.
GLA grant decreased from £1.8 billion in 2014-15 to £595 million in 2015-16. As this largely
affected TfL, which is involved in large capital projects such as Crossrail, this decrease
resulted in reduced capital expenditure from the revenue account.
Revenue Support Grant is set to decrease by £3.2 billion (24.9%) compared to 2014-15.
This large change is due to the changes outlined by the Department for Communities and
Local Government in the Local Government Finance Settlement.
Council tax requirement was £24.8 billion in 2015-16 which is an increase of 3.3% from £24.0
billion in 2014-15. As Chart B shows, Council Tax accounts for just over a quarter of all local
authority financing.
Retained income from Business Rate Retention Scheme totalled £11.9 billion in 2015-16. This
is an increase of 4.6%, or £524 million, from the equivalent figure for 2014-15.
This ‘retained income’ specifically relates to the amount of business rates authorities used within
the year and is not necessarily the same as rates collected.
Local authorities used £391 million of their financial Reserves in 2015-16. During the previous
year authorities added £949 million to their reserves. This is the first year where there has been a
net use of reserves across England reserves since 2008-09.

13 Revenue Expenditure and Financing, 2015-16 Provisional Outturn, Statistical Release
Chart B: Financing of revenue expenditure, England, 2014-15 and 2015-16
(a) ‘Government Grants’ includes ‘Local Services Support Grant (LSSG)’, ‘Specific grants inside AEF’, ‘Revenue Support Grant’ and ‘Police Grant’. Since 2013-14 this specific grants inside AEF have included public health grant, local council tax support grant and the central share of non-domestic rates.
Table 6 show funding of revenue expenditure in terms of government grants, redistributed non-
domestic rates, retained income from rate retention scheme and council tax since 2010-11.
The proportion of centrally distributed income fell from 75.9% in 2010-11 to 60.4% in 2015-16 and
there’s a corresponding increase in the income retained by local authorities from 25.2% in 2010-11
to 38.7% in 2015-16.
Since 2013-14 local authorities have been more reliant on locally retained income, although this is
largely due to changes to council tax and business rates policies.
Business rates moved from being a centrally redistributed function to one where authorities retain
a percentage of what they collect. As part of the 2015 Spending Review, this is set to increase to
100% rate retention by 2020.
Government Grants (a)
63.9%
Council Tax
Requirement 25.0%
Retained income from Business Rate
Retention Scheme 11.8%
2014-15Revenue
Expenditure
£95.9 billion Government Grants (a)
60.5%
CouncilTax
Requirement26.0%
Retained income from Business Rate
Retention Scheme 12.5%
Reserves and Other Items 0.8%
2015-16Revenue
Expenditure
£94.5 billion
£ million £ million £ million
Redistributed Centrally Retained income Locally Reserves
Revenue Government non-domestic distributed % of from Business Rate Council retained % of and Other % of
Expenditure Grants (a) rates income total Retention Scheme Tax
(b) income total Items (c) total
Outturn
2010-11 104,256 57,657 21,517 79,173 75.9 … 26,254 26,254 25.2 -1,172 -1.1
2011-12 99,278 56,237 19,017 75,254 75.8 … 26,451 26,451 26.6 -2,427 -2.4
2012-13 94,148 46,765 23,129 69,895 74.2 … 26,715 26,715 28.4 -2,461 -2.6
2013-14 96,419 64,578 … 64,578 67.0 10,719 23,371 34,090 35.4 -2,249 -2.3
2014-15 95,942 61,312 … 61,312 63.9 11,331 23,964 35,295 36.8 -665 -0.7
2015-16 94,547 57,088 … 57,088 60.4 11,854 24,756 36,611 38.7 849 0.9
(c) Reserves and Other items includes all appropriations to (-) and from (+) the reserves, any income from Inter-authority transfers and net collection fund surpluses (+)/deficits (-) from the
previous year. This figure is an adds to financning when reserves and surpluses are being used (+) and draws from financing when reserves are being added to and deficits are being financed (-).
Table 6: Financing of revenue expenditure, England, since 2010-11
Centrally distributed income Locally retained income
(a) Includes 'Local Services Support Grant (LSSG)', 'Specific grants inside AEF', 'Revenue Support Grant' and 'Police Grant'. Since 2013-14 the specific grants inside AEF have included 'public
health grant', 'local council tax support grant' and the 'central share of non-domestic rates'
(b) Since 2013-14 Council Tax has not included the 'local council tax support grant', this is now included in Government Grants
14 Revenue Expenditure and Financing, 2015-16 Provisional Outturn, Statistical Release
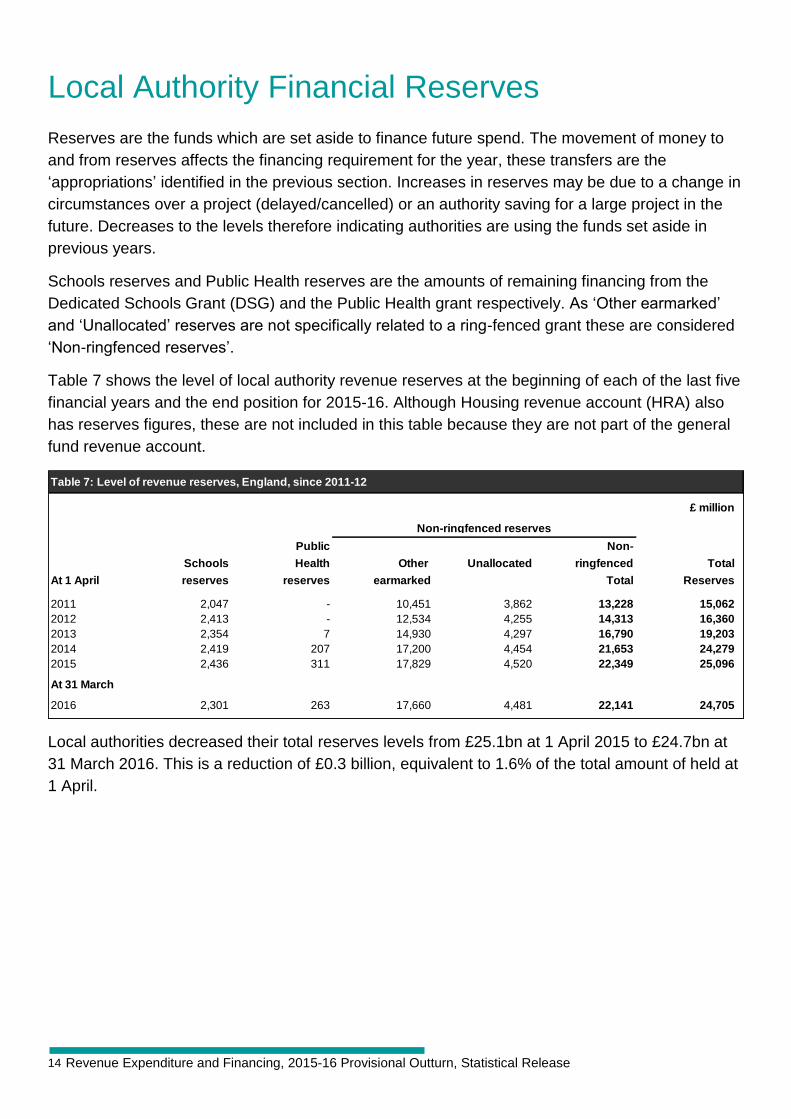
Local Authority Financial Reserves
Reserves are the funds which are set aside to finance future spend. The movement of money to
and from reserves affects the financing requirement for the year, these transfers are the
‘appropriations’ identified in the previous section. Increases in reserves may be due to a change in
circumstances over a project (delayed/cancelled) or an authority saving for a large project in the
future. Decreases to the levels therefore indicating authorities are using the funds set aside in
previous years.
Schools reserves and Public Health reserves are the amounts of remaining financing from the
Dedicated Schools Grant (DSG) and the Public Health grant respectively. As ‘Other earmarked’
and ‘Unallocated’ reserves are not specifically related to a ring-fenced grant these are considered
‘Non-ringfenced reserves’.
Table 7 shows the level of local authority revenue reserves at the beginning of each of the last five
financial years and the end position for 2015-16. Although Housing revenue account (HRA) also
has reserves figures, these are not included in this table because they are not part of the general
fund revenue account.
Local authorities decreased their total reserves levels from £25.1bn at 1 April 2015 to £24.7bn at
31 March 2016. This is a reduction of £0.3 billion, equivalent to 1.6% of the total amount of held at
1 April.
£ million
Public Non-
Schools Health Other Unallocated ringfenced Total
At 1 April reserves reserves earmarked Total Reserves
2011 2,047 - 10,451 3,862 13,228 15,062
2012 2,413 - 12,534 4,255 14,313 16,360
2013 2,354 7 14,930 4,297 16,790 19,203
2014 2,419 207 17,200 4,454 21,653 24,279
2015 2,436 311 17,829 4,520 22,349 25,096
At 31 March
2016 2,301 263 17,660 4,481 22,141 24,705
Table 7: Level of revenue reserves, England, since 2011-12
Non-ringfenced reserves
15 Revenue Expenditure and Financing, 2015-16 Provisional Outturn, Statistical Release
Definitions
A list of terms relating to local government finance is given in Local Government Finance Statistics
England (LGFS). The most recent edition is LGFS No. 25 2015. This is accessible at:
https://www.gov.uk/government/statistics/local-government-financial-statistics-england-2015 . The
most relevant terms for this release are explained below.
Aggregate External Finance
is the total amount of grant provided to finance all local government expenditure, excluding that
subject to separate arrangements under statutory schemes, rent allowances and rebates and
council tax benefit, which are funded by specific grants outside Aggregate External Finance.
Central Government Grants
the biggest source of funding that local authorities receive is from central government. This is
made up from ‘specific’ grants and a general grant (also called the Revenue Support Grant).
Central government grant money pays for capital projects, such as roads or school buildings, as
well as revenue spending, such as the cost of maintaining council housing and running services,
including employee wages.
Central Services
these are services organised on a corporate basis that support the delivery of services to the
public. Central services include building costs, administration and IT
Community Infrastructure Levy
a levy available to registered local authorities allowing them to choose to charge on new
developments in their area to pay for new infrastructure developments
Council Tax Requirement
The amount of revenue a local authority needs to raise through council tax, (its council tax
requirement) is calculated by deducting from its planned spending any funding from reserves,
income it expects to raise, and funding it will receive from the Government.
Current expenditure
is the cost of running local authority services within the financial year. This includes the costs of
staffing, heating, lighting and cleaning, together with expenditure on goods and services
consumed within the year. This expenditure is offset by income from sales, fees and charges and
other (non-grant) income, which gives total net current expenditure. Total net current
expenditure also includes payments made by local authorities on behalf of central government,
under statutory schemes and the payment of rent allowances and rebates. Such payments are
fully funded by central government through specific grants outside Aggregate External Finance.
Dedicated Schools Grant (DSG)
there was a change in the funding of specific and formula grants in 2006-07 largely due to
changes in the way that expenditure on schools is funded. From 2006-07, local authorities receive

16 Revenue Expenditure and Financing, 2015-16 Provisional Outturn, Statistical Release
school funding through specific grant rather than funding previously included in formula grant.
Funding through the Settlement Grant
the main channel of government funding. This includes Retained Income from the Rate
Retention Scheme, Revenue Support Grant, and Police grant. The distribution is determined by
the Formula spending shares formulae, also taking account of authorities’ relative ability to raise
council tax and the floor damping mechanism. There are no restrictions on what local government
can spend it on.
Greater London Authority (GLA) Group
this includes GLA and its constituent bodies, Metropolitan Police Authority, London Fire and
Emergency Planning Authority, Transport for London (TfL) and London Development Agency
(LDA). Transactions in their General Fund Revenue Account are reported by the GLA and the
four functional bodies as a group.
Housing Revenue Account
is a local authority statutory account, it contains all the spending and income related to the housing
stock owned by the council.
Local Services Support Grant
is an non-ringfenced grant paid under section 31 of the Local Government Act 2003 to support
local government functions.
Mandatory Housing Benefit
financial help given to local authority or private tenants whose income falls below prescribed
amounts as required by law. This usually consists of mandatory Rent Allowances and mandatory
Rent Rebates, to HRA and non-HRA tenants.
Net Current Expenditure
see Current Expenditure
Other items
are Council Tax and Business Rates collection fund surpluses / deficits from previous financial
years
Public Health Grant
is a ringfenced grant for providing public health services. The grant is provided to give local
authorities the funding needed to carry out their public heath responsibilities.
The conditions of the grant are funds are only spent on activities whose main or primary purpose
is to improve the public health of local populations.
Reserves
sums set aside to finance future spending for purposes falling outside the definition of a provision.
Reserves set aside for stated purposes are known as earmarked reserves.
17 Revenue Expenditure and Financing, 2015-16 Provisional Outturn, Statistical Release
Retained income from the Rate Retention Scheme
expected retained non-domestic rate income after payment of central share, major precepting
shares and any tariff, top up, levy or safety net payments.
Revenue expenditure
is equal to total net current expenditure (line 849), plus capital financing costs and a few minor
adjustments, but excludes expenditure financed by grants outside Aggregate External Finance.
Revenue expenditure is financed by grants inside Aggregate External Finance, council tax and
authorities' reserves.
Revenue Support Grant
a general grant now distributed as part of Funding through the Settlement Grant.
Ringfenced Grant
these grants have specific conditions on how they are spent. Financing received from the grant
must only be spent on the services it is provided for.
Specific Grants inside AEF
These are revenue grants which are paid to local authorities by individual government
departments, for which the local authority has sole responsibility for decisions on how the grant is
allocated. The main purpose for the provision of these grants is to deliver core local authority
services.
Specific Grants outside AEF
These are revenue grants, which are paid to local authorities by individual government
departments. However, the local authority usually only acts as the ‘middle person’, as the grants
are passed over to a third party who administers the service. The local authority does not normally
have any control over the service for which the grant was intended for. This responsibility rests
solely with the third party that receives the grant.
18 Revenue Expenditure and Financing, 2015-16 Provisional Outturn, Statistical Release
Accompanying tables
Accompanying dropdown tables, presenting detailed revenue expenditure and financing figures for
2015-16 for all local authorities are available to download alongside this release.
These tables present all revenue outturn information, by local authority, in the same format as it is
returned to Department for Communities and Local Government and forms the basis of the tables
in this release. These are available here:
https://www.gov.uk/government/statistics/local-authority-revenue-expenditure-and-financing-
england-2015-to-2016-individual-local-authority-data-outturn
Description Form
Revenue Outturn Summary RS
Service Expenditure Summary RSX
Specific and Special Revenue Grants RG
Technical notes
Data collection
Survey design for collecting Revenue Outturn data in 2015-16
From May until July 2016, all 444 local authorities in England were requested to complete the
Revenue Outturn (RO) suite of forms to show all transactions for the 2015-16 financial year related
to the general fund revenue account. This included net current expenditure, capital charges and
also elements that finance net current expenditure, which includes; levy payments, interest
receipts, central government grants, use of reserves, council tax and other non-current
expenditure items.
The estimates requested cover local authority revenue expenditure and financing for the financial
year 1 April 2015 to 31 March 2016. These estimates are on a non-International Accounting
Standard 19 (IAS19) and PFI “Off Balance Sheet” basis except where stated otherwise.
19 Revenue Expenditure and Financing, 2015-16 Provisional Outturn, Statistical Release
Data quality
This Statistical Release contains National Statistics and as such has been produced to the high
professional standards set out in the Code of Practice for Official Statistics. National Statistics
products undergo regular quality assurance reviews to ensure that they meet customer demands.
The information for 2015-16 in this release is derived from Department for Communities and Local
Government (DCLG) Revenue Account (RO) forms and is based on returns from 442 of the 444
local authorities in England. Reading and Copeland were unable to submit in time for release and
we are currently working with these authorities to return this. Additionally data for 3 authorities
have been removed from the by authority data due to outstanding data quality issues but are
included in the England figures.
Figures are subjected to rigorous pre-defined validation tests both within the form itself, while the
form is being completed by the authority and also by Department for Communities and Local
Government as the data are received and stored.
Revisions policy This policy has been developed in accordance with the UK Statistics Authority Code of Practice for
Official statistics and the Department for Communities and Local Government Revisions Policy
(found at https://www.gov.uk/government/publications/statistical-notice-dclg-revisions-policy).
There are two types of revisions that the policy covers:
Non-Scheduled Revisions
Where a substantial error has occurred as a result of the compilation, imputation or dissemination
process, the statistical release, live tables and other accompanying releases will be updated with a
correction notice as soon as is practical.
Scheduled Revisions
At time of publication there are no scheduled revisions for this series
User engagement
Users are encouraged to provide feedback on how these statistics are used and how well they
meet user needs. Comments on any issues relating to this statistical release are welcomed and
encouraged. Responses should be addressed to the "Public enquiries" contact given in the
"Enquiries" section below. The Department’s engagement strategy to meet the needs of statistics
users is published here: https://www.gov.uk/government/publications/engagement-strategy-to-
meet-the-needs-of-statistics-users
Comments and feedback from end users for further improvement or about your experiences with
this product will be welcomed. Please send all views to: [email protected]
We are currently running a survey to understand more about how local government finance
statistics and data are used. Please see the link to the short survey below:
https://www.surveymonkey.co.uk/r/LGFuserengagement
https://www.gov.uk/government/publications/engagement-strategy-to-meet-the-needs-of-statistics-users

20 Revenue Expenditure and Financing, 2015-16 Provisional Outturn, Statistical Release
Notes
Timings of future releases are regularly placed on the Department's website:
http://www.gov.uk/government/organisations/department-for-communities-and-local-
government/about/statistics#forthcoming-publications
and on the National Statistics website: https://www.gov.uk/government/statistics/announcements
The CIPFA Finance and General Statistics publication also contains detailed information on local
government finance.
CLIP Finance (CLIP-F) is a consultative group which considers the collection, presentation and
analysis of data on local government finance. To ensure users are made aware of significant
changes and adjustments to Local Government Finance forms papers are tabled, discussed and
published. Please visit the website for details of likely changes for future Revenue/Capital statisti-
cal releases.
https://knowledgehub.local.gov.uk/web/clip
Devolved administration statistics The Scottish, Welsh Assembly and Northern Ireland Government also collect revenue budget
data. Their information can be found at the following websites:
Scotland:
http://www.scotland.gov.uk/Topics/Statistics/Browse/Local-Government-Finance
Wales:
https://statswales.wales.gov.uk/Catalogue/Local-Government/Finance/Revenue
Northern Ireland:
http://www.doeni.gov.uk/index/local_government/local_government_funding.htm
21 Revenue Expenditure and Financing, 2015-16 Provisional Outturn, Statistical Release
Enquiries Media enquiries:
office hours: 0303 444 1157
0303 444 1159
out of hours: 0303 444 1201
Email: [email protected]
Public enquiries and Responsible Statistician:
William Nye
Email: [email protected]
Information on Official Statistics is available via the UK Statistics Authority website:
www.statisticsauthority.gov.uk/national-statistician/types-of-official-statistics/index.html
Timings of future releases are placed on the Department’s website at:
https://www.gov.uk/government/statistics/announcements
Information about statistics at DCLG is available via the Department’s website:
www.gov.uk/government/organisations/department-for-communities-and-local-
government/about/statistics
22 Revenue Expenditure and Financing, 2015-16 Provisional Outturn, Statistical Release
© Crown copyright, 2016
Copyright in the typographical arrangement rests with the Crown.
You may re-use this information (not including logos) free of charge in any format or medium, under the terms of the Open Government Licence. To view this licence, www.nationalarchives.gov.uk/doc/open-government-licence/ or write to the Information Policy Team, The National Archives, Kew, London TW9 4DU, or email: [email protected].
This document/publication is also available on our website at www.gov.uk/dclg
If you have any enquiries regarding this document/publication, email [email protected] or write to us at:
Department for Communities and Local Government Fry Building 2 Marsham Street London SW1P 4DF Telephone: 030 3444 0000
August 2016
For all our latest news and updates follow us on Twitter: https://twitter.com/CommunitiesUK
ISBN: 978-1-4098-4885-1
Related Documents