Local and reversible blood–brain barrier disruption by noninvasive focused ultrasound at frequencies suitable for trans-skull sonications Kullervo Hynynen, * Nathan McDannold, Nickolai A. Sheikov, Ferenc A. Jolesz, and Natalia Vykhodtseva Department of Radiology, Brigham and Women’s Hospital, and Harvard Medical School, Boston, MA 02115, USA Received 20 November 2003; revised 4 June 2004; accepted 11 June 2004 The purpose of this study was to test the hypothesis that burst ultrasound in the presence of an ultrasound contrast agent can disrupt the blood–brain barrier (BBB) with acoustic parameters suitable for completely noninvasive exposure through the skull. The 10-ms exposures were targeted in the brains of 22 rabbits with a frequency of 690 kHz, a repetition frequency of 1 Hz, and peak rarefactional pressure amplitudes up to 3.1 MPa. The total exposure (sonication) time was 20 s. Prior to each sonication, a bolus of ultrasound contrast agent was injected intravenously. Contrast-enhanced MR images were obtained after the sonications to detect localized BBB disruption via local enhancement in the brain. Brain sections were stained with H&E, TUNEL, and vanadium acid fuchsin (VAF)–toluidine blue staining. In addition, horseradish peroxidase (HRP) was injected into four rabbits prior to sonications and transmission electron microscopy was performed. The MRI contrast enhancement demonstrated BBB disruption at pressure amplitudes starting at 0.4 MPa with approx- imately 50%; at 0.8 MPa, 90%; and at 1.4 MPa, 100% of the sonicated locations showed enhancement. The histology findings following 4 h survival indicated that brain tissue necrosis was induced in approx- imately 70–80% of the sonicated locations at a pressure amplitude level of 2.3 MPa or higher. At lower pressure amplitudes, however, small areas of erythrocyte extravasation were seen. The electron microscopy findings demonstrated HRP passage through vessel walls via both transendothelial and paraendothelial routes. These results demonstrate that completely noninvasive focal disruption of the BBB is possible. D 2004 Elsevier Inc. All rights reserved. Keywords: Ultrasound; Bioeffects; Cavitation; Blood–brain barrier; Apop- tosis; Ischemia Introduction Advances in neuroscience have resulted in the development of new diagnostic and therapeutic agents and genes that may be used to study and treat many central nervous system (CNS) diseases (Pardridge, 2002a). However, the use of these agents is often limited by their access to the CNS via the blood supply because the blood–brain barrier (BBB) protects the brain from foreign molecules (Abbott and Romero, 1996; Kroll and Neuwelt, 1998; Nag, 2003b; Pardridge, 2002a). Several methods have been tested to circumvent the BBB including chemical modification of drugs to make them lipophilic or the use of carriers to aid propagation through the barrier (Pardridge, 2002a,b, 2003). Another option is to utilize an intraarterial infusion of hypertonic solution that initiates a BBB disruption lasting from a few minutes to a few hours (Doolittle et al., 2000). Each of the methods described above requires intra- arterial catheterization and produces diffuse, nonfocal BBB disruption within the entire tissue volume supplied by the injected artery branch (Abbott and Romero, 1996; Kroll and Neuwelt, 1998). The BBB disruption over a large volume, however, may prove a disadvantage for many applications since the agents may have undesired, often dose-limiting side-effects due to their spread within the CNS. To prevent this, a localized and reversible image- guided disruption of the BBB would provide anatomically or functionally targeted drug delivery while preserving an intact BBB to protect the nontargeted regions. Today, such localized drug delivery can only be accomplished by a direct injection of the agent into the targeted brain volume (Kroll and Neuwelt, 1998). Such direct injections are limited by the slow diffusion of molecules in the brain, the need to open the skull and penetrate nontargeted brain tissue, and the attendant risk of neurological damage, bleeding, and infection. There is experimental evidence that focused ultrasound can selectively disrupt the BBB locally in the brain (Mesiwala et al., 2002; Patrick et al., 1990; Vykhodtseva et al., 1995). However, the disruption is often associated with damage to the exposed brain tissue. Recently, a method has been developed wherein the ultrasound exposures are performed in the presence 1053-8119/$ - see front matter D 2004 Elsevier Inc. All rights reserved. doi:10.1016/j.neuroimage.2004.06.046 * Corresponding author. Department of Radiology, Brigham and Women’s Hospital, and Harvard Medical School, 75 Francis Street, Boston, MA 02115. Fax: +1 617 278 0610. E-mail address: [email protected] (K. Hynynen). Available online on ScienceDirect (www.sciencedirect.com.) www.elsevier.com/locate/ynimg NeuroImage 24 (2005) 12 – 20

Welcome message from author
This document is posted to help you gain knowledge. Please leave a comment to let me know what you think about it! Share it to your friends and learn new things together.
Transcript

www.elsevier.com/locate/ynimg
NeuroImage 24 (2005) 12–20
Local and reversible blood–brain barrier disruption by noninvasive
focused ultrasound at frequencies suitable for trans-skull sonications
Kullervo Hynynen,* Nathan McDannold, Nickolai A. Sheikov,
Ferenc A. Jolesz, and Natalia Vykhodtseva
Department of Radiology, Brigham and Women’s Hospital, and Harvard Medical School, Boston, MA 02115, USA
Received 20 November 2003; revised 4 June 2004; accepted 11 June 2004
The purpose of this study was to test the hypothesis that burst
ultrasound in the presence of an ultrasound contrast agent can disrupt
the blood–brain barrier (BBB) with acoustic parameters suitable for
completely noninvasive exposure through the skull. The 10-ms
exposures were targeted in the brains of 22 rabbits with a frequency
of 690 kHz, a repetition frequency of 1 Hz, and peak rarefactional
pressure amplitudes up to 3.1 MPa. The total exposure (sonication)
time was 20 s. Prior to each sonication, a bolus of ultrasound contrast
agent was injected intravenously. Contrast-enhanced MR images were
obtained after the sonications to detect localized BBB disruption via
local enhancement in the brain. Brain sections were stained with H&E,
TUNEL, and vanadium acid fuchsin (VAF)–toluidine blue staining. In
addition, horseradish peroxidase (HRP) was injected into four rabbits
prior to sonications and transmission electron microscopy was
performed. The MRI contrast enhancement demonstrated BBB
disruption at pressure amplitudes starting at 0.4 MPa with approx-
imately 50%; at 0.8 MPa, 90%; and at 1.4 MPa, 100% of the sonicated
locations showed enhancement. The histology findings following 4 h
survival indicated that brain tissue necrosis was induced in approx-
imately 70–80% of the sonicated locations at a pressure amplitude level
of 2.3 MPa or higher. At lower pressure amplitudes, however, small
areas of erythrocyte extravasation were seen. The electron microscopy
findings demonstrated HRP passage through vessel walls via both
transendothelial and paraendothelial routes. These results demonstrate
that completely noninvasive focal disruption of the BBB is possible.
D 2004 Elsevier Inc. All rights reserved.
Keywords: Ultrasound; Bioeffects; Cavitation; Blood–brain barrier; Apop-
tosis; Ischemia
1053-8119/$ - see front matter D 2004 Elsevier Inc. All rights reserved.
doi:10.1016/j.neuroimage.2004.06.046
* Corresponding author. Department of Radiology, Brigham and
Women’s Hospital, and Harvard Medical School, 75 Francis Street, Boston,
MA 02115. Fax: +1 617 278 0610.
E-mail address: [email protected] (K. Hynynen).
Available online on ScienceDirect (www.sciencedirect.com.)
Introduction
Advances in neuroscience have resulted in the development of
new diagnostic and therapeutic agents and genes that may be used
to study and treat many central nervous system (CNS) diseases
(Pardridge, 2002a). However, the use of these agents is often
limited by their access to the CNS via the blood supply because the
blood–brain barrier (BBB) protects the brain from foreign
molecules (Abbott and Romero, 1996; Kroll and Neuwelt, 1998;
Nag, 2003b; Pardridge, 2002a).
Several methods have been tested to circumvent the BBB
including chemical modification of drugs to make them lipophilic
or the use of carriers to aid propagation through the barrier
(Pardridge, 2002a,b, 2003). Another option is to utilize an
intraarterial infusion of hypertonic solution that initiates a BBB
disruption lasting from a few minutes to a few hours (Doolittle et
al., 2000). Each of the methods described above requires intra-
arterial catheterization and produces diffuse, nonfocal BBB
disruption within the entire tissue volume supplied by the injected
artery branch (Abbott and Romero, 1996; Kroll and Neuwelt,
1998). The BBB disruption over a large volume, however, may
prove a disadvantage for many applications since the agents may
have undesired, often dose-limiting side-effects due to their spread
within the CNS. To prevent this, a localized and reversible image-
guided disruption of the BBB would provide anatomically or
functionally targeted drug delivery while preserving an intact BBB
to protect the nontargeted regions. Today, such localized drug
delivery can only be accomplished by a direct injection of the agent
into the targeted brain volume (Kroll and Neuwelt, 1998). Such
direct injections are limited by the slow diffusion of molecules in
the brain, the need to open the skull and penetrate nontargeted
brain tissue, and the attendant risk of neurological damage,
bleeding, and infection.
There is experimental evidence that focused ultrasound can
selectively disrupt the BBB locally in the brain (Mesiwala et
al., 2002; Patrick et al., 1990; Vykhodtseva et al., 1995).
However, the disruption is often associated with damage to the
exposed brain tissue. Recently, a method has been developed
wherein the ultrasound exposures are performed in the presence
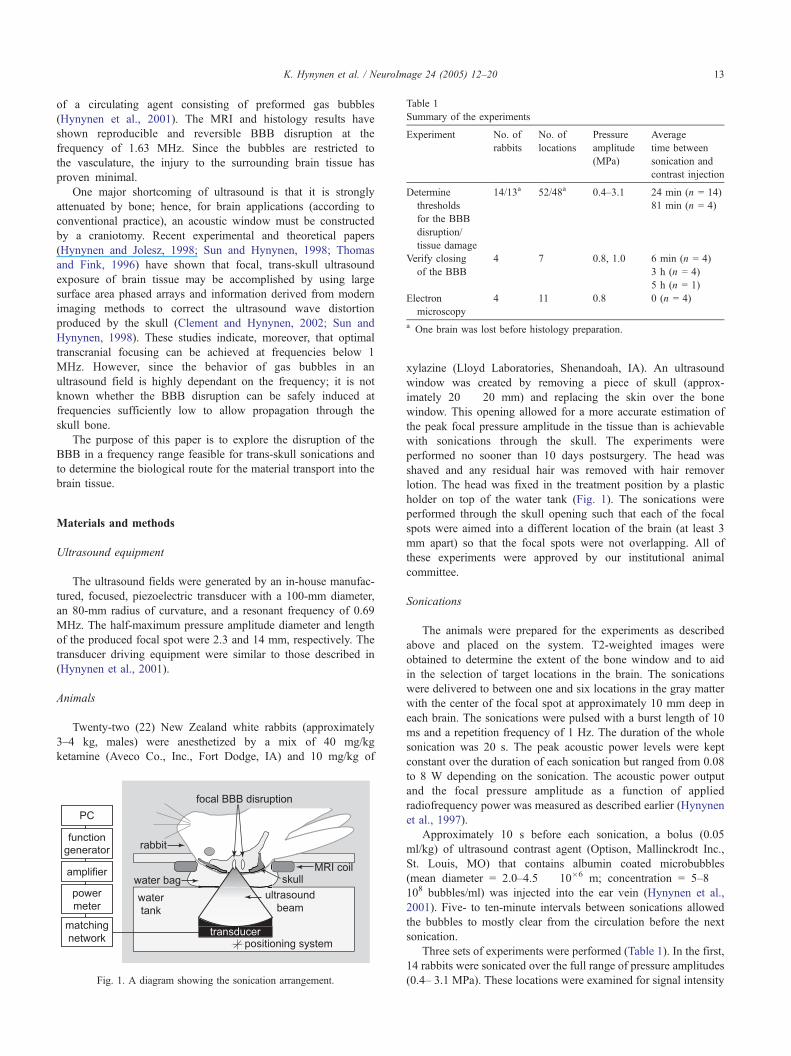
Table 1
Summary of the experiments
Experiment No. of
rabbits
No. of
locations
Pressure
amplitude
(MPa)
Average
time between
sonication and
contrast injection
Determine
thresholds
for the BBB
disruption/
tissue damage
14/13a 52/48a 0.4–3.1 24 min (n = 14)
81 min (n = 4)
Verify closing
of the BBB
4 7 0.8, 1.0 6 min (n = 4)
3 h (n = 4)
5 h (n = 1)
Electron
microscopy
4 11 0.8 0 (n = 4)
a One brain was lost before histology preparation.
K. Hynynen et al. / NeuroImage 24 (2005) 12–20 13
of a circulating agent consisting of preformed gas bubbles
(Hynynen et al., 2001). The MRI and histology results have
shown reproducible and reversible BBB disruption at the
frequency of 1.63 MHz. Since the bubbles are restricted to
the vasculature, the injury to the surrounding brain tissue has
proven minimal.
One major shortcoming of ultrasound is that it is strongly
attenuated by bone; hence, for brain applications (according to
conventional practice), an acoustic window must be constructed
by a craniotomy. Recent experimental and theoretical papers
(Hynynen and Jolesz, 1998; Sun and Hynynen, 1998; Thomas
and Fink, 1996) have shown that focal, trans-skull ultrasound
exposure of brain tissue may be accomplished by using large
surface area phased arrays and information derived from modern
imaging methods to correct the ultrasound wave distortion
produced by the skull (Clement and Hynynen, 2002; Sun and
Hynynen, 1998). These studies indicate, moreover, that optimal
transcranial focusing can be achieved at frequencies below 1
MHz. However, since the behavior of gas bubbles in an
ultrasound field is highly dependant on the frequency; it is not
known whether the BBB disruption can be safely induced at
frequencies sufficiently low to allow propagation through the
skull bone.
The purpose of this paper is to explore the disruption of the
BBB in a frequency range feasible for trans-skull sonications and
to determine the biological route for the material transport into the
brain tissue.
Materials and methods
Ultrasound equipment
The ultrasound fields were generated by an in-house manufac-
tured, focused, piezoelectric transducer with a 100-mm diameter,
an 80-mm radius of curvature, and a resonant frequency of 0.69
MHz. The half-maximum pressure amplitude diameter and length
of the produced focal spot were 2.3 and 14 mm, respectively. The
transducer driving equipment were similar to those described in
(Hynynen et al., 2001).
Animals
Twenty-two (22) New Zealand white rabbits (approximately
3–4 kg, males) were anesthetized by a mix of 40 mg/kg
ketamine (Aveco Co., Inc., Fort Dodge, IA) and 10 mg/kg of
Fig. 1. A diagram showing the sonication arrangement.
xylazine (Lloyd Laboratories, Shenandoah, IA). An ultrasound
window was created by removing a piece of skull (approx-
imately 20 � 20 mm) and replacing the skin over the bone
window. This opening allowed for a more accurate estimation of
the peak focal pressure amplitude in the tissue than is achievable
with sonications through the skull. The experiments were
performed no sooner than 10 days postsurgery. The head was
shaved and any residual hair was removed with hair remover
lotion. The head was fixed in the treatment position by a plastic
holder on top of the water tank (Fig. 1). The sonications were
performed through the skull opening such that each of the focal
spots were aimed into a different location of the brain (at least 3
mm apart) so that the focal spots were not overlapping. All of
these experiments were approved by our institutional animal
committee.
Sonications
The animals were prepared for the experiments as described
above and placed on the system. T2-weighted images were
obtained to determine the extent of the bone window and to aid
in the selection of target locations in the brain. The sonications
were delivered to between one and six locations in the gray matter
with the center of the focal spot at approximately 10 mm deep in
each brain. The sonications were pulsed with a burst length of 10
ms and a repetition frequency of 1 Hz. The duration of the whole
sonication was 20 s. The peak acoustic power levels were kept
constant over the duration of each sonication but ranged from 0.08
to 8 W depending on the sonication. The acoustic power output
and the focal pressure amplitude as a function of applied
radiofrequency power was measured as described earlier (Hynynen
et al., 1997).
Approximately 10 s before each sonication, a bolus (0.05
ml/kg) of ultrasound contrast agent (Optison, Mallinckrodt Inc.,
St. Louis, MO) that contains albumin coated microbubbles
(mean diameter = 2.0–4.5 � 10�6 m; concentration = 5–8 �108 bubbles/ml) was injected into the ear vein (Hynynen et al.,
2001). Five- to ten-minute intervals between sonications allowed
the bubbles to mostly clear from the circulation before the next
sonication.
Three sets of experiments were performed (Table 1). In the first,
14 rabbits were sonicated over the full range of pressure amplitudes
(0.4– 3.1 MPa). These locations were examined for signal intensity

Table 2
The MRI parameters used in the study
Sequence Purpose Repetition
time (ms)
Echo
time
(ms)
Matrix Flip
angle
(8)
Bandwidth
(kHz)
Number of
acquisitions
FSE T1-W Contrast Enhancement 500 15 256 � 256 90 16 4
FSE T2-W Tissue Anatomy Targeting 2000 75 256 � 256 90 16 2
FSE T1-W = fast spin echo T1-weighted sequence; FSE T2-W = fast spin echo T2-weighted sequence.
K. Hynynen et al. / NeuroImage 24 (2005) 12–2014
enhancement in MRI and with light microscopy to establish the
thresholds for BBB disruption and tissue damage. In these
experiments, sonications were performed at locations in both
hemispheres to maximize the number of locations.
In the second set of experiments, an additional four rabbits were
sonicated at pressure amplitudes of 0.8 and 1.0 MPa, which is
below the threshold for tissue damage established in the first set of
experiments (see below). In these animals, one to two locations
were sonicated in one hemisphere; the contralateral hemisphere
served as a control. These rabbits were followed with MR imaging
for several hours to establish the amount of time needed for repair
of the BBB disruption. The MR contrast agent injection was
repeated at desired time points after the sonication. These animals
were not part of the light microscopy study.
In the third set of experiments, another four rabbits were
sonicated at pressure amplitudes of 0.8 MPa and were used for the
electron microscopy study described below. These animals were
not examined in light microscopy.
MRI
The MRI scanner was a standard 1.5 T Signa system
(General Electric Medical Systems, Milwaukee, WI). A 7.5-cm
diameter surface coil was placed under the head. The sonications
were performed through the hole of the coil that was filled with
the bag containing degassed water (Fig. 1). A T2-weighted fast
spin echo (FSE) sequence was used to aim the beam at the
brain. Following the sonications, T1-weighted FSE images were
obtained and repeated after injection of an intravenous (iv) bolus
(0.125 mmol/kg) of gadopentetate dimeglumine MR contrast
agent (Magnevist, Berlex Laboratories Inc., Wayne, NJ) to detect
and evaluate the opening of the blood–brain barrier (BBB). The
parameters for the MRI scans are given in Table 2. The time
between the sonications and the contrast agent are listed in
Table 1.
Fig. 2. A contrast-enhanced FSE T1-weighted image of a rabbit brain. (A) Image p
and 1.4 MPa (subtraction: before � after injection) and (B) image oriented along
Signal analysis
The MRI contrast enhancement was evaluated at each target
location by averaging the signal intensity over a 3 � 3 voxel (1.2 �1.2 mm) region of interest (ROI). The signal was normalized to the
baseline value in the ROI before the contrast injection. ROIs of
nonsonicated brain tissue proximal to sonicated locations served as
controls. The average, normalized contrast enhancement observed
in these control locations was subtracted from that in the targeted
locations to estimate the impact of the sonications. In addition, a
larger 6 � 6 voxel control area was selected outside of the
sonicated regions, and the average standard deviation of the signal
intensities of the voxels in that area was calculated over the entire
time series of images. If the contrast enhancement at the focal area
was higher than the average standard deviation value in the control
area, then the sonication was judged to have induced disruption of
the BBB.
In the four rabbits sonicated in one hemisphere only, the
signal enhancement at the focal coordinate was compared to that
in the same structure in the contralateral hemisphere. This
method allowed for an internal control that reduced any
uncertainties that might be associated with selecting the control
regions in different structures when targets were sonicated in
both hemispheres.
Light microscopy
The animals were sacrificed approximately 4 h after the last
sonication (in one case, at 48 h). The brains were immediately
removed and fixed in 10% buffered neutral formalin. They were
embedded in paraffin and serially sectioned at 6 Am (across the
beam direction; parallel to the MRI slices). Every 50th section
(interval of 0.3 mm) was stained with hematoxylin and eosin
(H&E) for histologic examination. The sonication locations in the
MR images were correlated with the histology slides by measuring
lane across the focus after sonications at pressure amplitudes of 0.4, 0.5, 0.8,
the ultrasound beam of two of the locations.
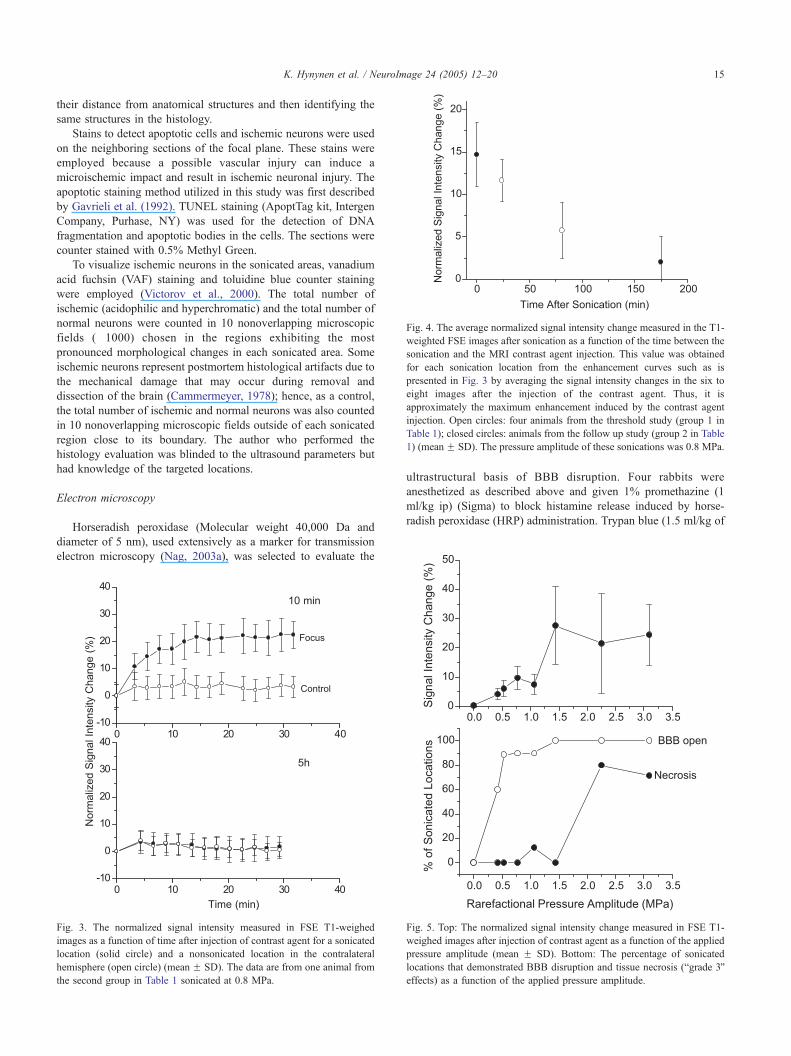
Fig. 4. The average normalized signal intensity change measured in the T1-
weighted FSE images after sonication as a function of the time between the
sonication and the MRI contrast agent injection. This value was obtained
for each sonication location from the enhancement curves such as is
presented in Fig. 3 by averaging the signal intensity changes in the six to
eight images after the injection of the contrast agent. Thus, it is
approximately the maximum enhancement induced by the contrast agent
injection. Open circles: four animals from the threshold study (group 1 in
Table 1); closed circles: animals from the follow up study (group 2 in Table
1) (mean F SD). The pressure amplitude of these sonications was 0.8 MPa.
K. Hynynen et al. / NeuroImage 24 (2005) 12–20 15
their distance from anatomical structures and then identifying the
same structures in the histology.
Stains to detect apoptotic cells and ischemic neurons were used
on the neighboring sections of the focal plane. These stains were
employed because a possible vascular injury can induce a
microischemic impact and result in ischemic neuronal injury. The
apoptotic staining method utilized in this study was first described
by Gavrieli et al. (1992). TUNEL staining (ApoptTag kit, Intergen
Company, Purhase, NY) was used for the detection of DNA
fragmentation and apoptotic bodies in the cells. The sections were
counter stained with 0.5% Methyl Green.
To visualize ischemic neurons in the sonicated areas, vanadium
acid fuchsin (VAF) staining and toluidine blue counter staining
were employed (Victorov et al., 2000). The total number of
ischemic (acidophilic and hyperchromatic) and the total number of
normal neurons were counted in 10 nonoverlapping microscopic
fields (�1000) chosen in the regions exhibiting the most
pronounced morphological changes in each sonicated area. Some
ischemic neurons represent postmortem histological artifacts due to
the mechanical damage that may occur during removal and
dissection of the brain (Cammermeyer, 1978); hence, as a control,
the total number of ischemic and normal neurons was also counted
in 10 nonoverlapping microscopic fields outside of each sonicated
region close to its boundary. The author who performed the
histology evaluation was blinded to the ultrasound parameters but
had knowledge of the targeted locations.
Electron microscopy
Horseradish peroxidase (Molecular weight 40,000 Da and
diameter of 5 nm), used extensively as a marker for transmission
electron microscopy (Nag, 2003a), was selected to evaluate the
Fig. 3. The normalized signal intensity measured in FSE T1-weighed
images as a function of time after injection of contrast agent for a sonicated
location (solid circle) and a nonsonicated location in the contralateral
hemisphere (open circle) (mean F SD). The data are from one animal from
the second group in Table 1 sonicated at 0.8 MPa.
ultrastructural basis of BBB disruption. Four rabbits were
anesthetized as described above and given 1% promethazine (1
ml/kg ip) (Sigma) to block histamine release induced by horse-
radish peroxidase (HRP) administration. Trypan blue (1.5 ml/kg of
Fig. 5. Top: The normalized signal intensity change measured in FSE T1-
weighed images after injection of contrast agent as a function of the applied
pressure amplitude (mean F SD). Bottom: The percentage of sonicated
locations that demonstrated BBB disruption and tissue necrosis (bgrade 3Qeffects) as a function of the applied pressure amplitude.

K. Hynynen et al. / NeuroImage 24 (2005) 12–2016
2% solution in saline) was administered (through the ear vein) to
macroscopically indicate the degree of BBB disruption (Nag,
2003a). HRP type VI (Sigma) dissolved in saline (300 mg/kg) was
injected immediately after the trypan blue through the same vein in
two rabbits. In the other two animals, HRP type II (Sigma) was
administered in the same doses. Two to three locations in each
brain were then sonicated; the animals were sacrificed at
deliberately selected intervals of approximately 1, 5, 20, and 60
min following each sonication. The animals were euthanized
(EuthasolR, Delmara Laboratories Inc., Midlothian, VA, 1 ml iv),
and the brains were fixed either by perfusion through the aorta (one
animal) or by immersion fixation using 2.5% paraformaldehyde +
1.5% glutaraldehyde in 0.1 M phosphate buffer (pH 7.2). The two
methods were used to eliminate potential problems associated with
each method. Pieces of about 0.5 mm3 from the sonicated areas
(blue spots) and from nonsonicated areas (controls) were fixed for
2 h in the same fixative. Distance measurements from the MR
Fig. 6. Examples of the histology observations in VAF–toluidine sections. (A) Gra
extravasated erythrocytes were seen within the focal region. (C) Grade 2: microsco
of them associated with evident damage to the brain parenchyma (insert magnifica
lesions (infarct).
images were used to correlate the sample locations and the MR
image analysis. They were then washed in 0.1 M TRIS buffer (pH
7.4) and transferred to an incubation medium containing 3,3V-diaminobenzidine and hydrogen peroxide for 45 min at room
temperature. After postfixation in 2% osmium tetraoxide in PBS
for 2 h, the pieces were dehydrated in ethanol, passed through
propylene oxide, and embedded in Epon-Araldite. Ultrathin
sections unstained or stained with uranyl acetate and lead citrate
were observed with a JEM-1200EX electron microscope at 80 kV.
Results
MRI observations
The BBB opening was observed in the sonicated locations in
the T1-weighted contrast-enhanced scans (Fig. 2). Fig. 3 shows
de 0: no damage was observed in the sonicated location. (B) Grade 1: a few
pic areas of perivascular extravasations over the whole sonicated area, some
tion of an ischemic cell). (D) Grade 3: extensive extravasation; hemorrhagic

Table 3
The histology grading of the sonicated tissues
Grade Description
0 No detected damage
1 One to a few tiny red blood cell extravasations
2 Petechial hemorrhages; mild damage to the brain parenchyma
3 Hemorrhagic or nonhemorrhagic local lesions
Table 4
The number of ischemic and apoptotic cells in the sonicated areas
Pressure
amplitude
(MPa)
Number of
apoptotic cells
Number of
apoptotic
cells in
vessels
Number
of ischemic
cells
Number of
sonicated
locations
0 0.5 F 0.7 0.1 F 0.5 1.9 F 3.3 45
0.4 0.5 F 0.6 0.2 F 0.5 0.7 F 0.5 4
0.5 0.6 F 1.1 0.4 F 0.5 0.6 F 0.8 7
0.8 1.4 F 1.2 1.1 F 1.1 5.3 F 5.2 10
1.1 1.8 F 2.3 1.4 F 1.8 3.6 F 6.5 9
1.4 3.0 F 1.8 2.5 F 1.0 6.7 F 6.4 4
2.3 Many Many 14 F 16 4
3.1 Many Many 12 F 7.2 7
The number of cells was counted in 10 nonoverlapping microscopic fields
chosen in each sonicated area. These counts were averaged for each
pressure amplitude value (mean F SD shown). The pressure amplitude
value 0 MPa represents the average value for all control areas in all of the
brains. When the sonicated areas were compared with the control areas (t
test), the number of apoptotic cells was statistically higher ( P b 0.05) at
pressure amplitude values at or above 0.8 MPa. The number of cells on the
vessel walls was statistically higher than in the control locations in all
sonicated areas at or above 0.5 MPa. The number of ischemic cells was
statistically higher than the control locations at or above 0.8 MPa.
K. Hynynen et al. / NeuroImage 24 (2005) 12–20 17
the signal intensity in T1-weighted imaging in one sonicated
location and likewise in the same anatomical location on the
opposite side of the brain. Following sonication, the signal
intensity at the targeted location increased by 15–20% compared
to the control location. BBB disruption was not detected after
an additional MRI contrast injection 5 h following the
sonication. The signal intensity change was greatest immediately
after the sonications and decreased as a function of time (Fig.
4). Three hours following the sonications, the signal intensity
increase was only approximately 10–20% of that measured
initially.
The signal intensity enhancement due to BBB disruption
increased as a function of the pressure amplitude and was evident
at the lowest value tested (0.4 MPa) (Fig. 5, top). Sixty percent of
the locations had focal contrast enhancement greater than the
standard deviation of the signal in the normal brain at 0.4 MPa.
By 1.4 MPa, all locations showed evidence of BBB disruption
(Fig. 5, bottom).
Histology
Forty-eight locations from among 13 brains were histolog-
ically evaluated in H&E-stained serial sections. In many cases,
the sonicated areas differed little from the nonsonicated regions.
The most noticeable effect observed in other cases was the
areas of extravasation (42/48 locations), ranging from a few
scattered erythrocytes in the mildest cases to extensive
extravasation at the highest pressure amplitude levels (Fig. 6).
These extravasations were limited to the focal volume of the
ultrasound beam. These histological observations were divided
into four grades ranging from no damage (grade 0) to tissue
necrosis (grade 3) (Table 3). The degree of these vascular
effects increased as a function of pressure amplitude when
necrosis was induced at or above 2.3 MPa (Fig. 5B). At
pressure amplitudes below 2.3 MPa, the extravasations were
observed in the absence of obvious parenchymal damage. In the
mildest cases (grade 1), the effects were limited to one or a few
small erythrocyte extravasations, which was the dominant effect
at pressure amplitudes up to approximately 0.5 MPa. In more
severe cases (grade 2), there were multiple areas of erythrocyte
extravasations, light vacuolation of the neuropil adjacent to
some of affected microvessels and alteration in the shape and
stainability of a few neurons and astrocytes. Mild neutrophil
infiltration was seen in the affected regions 48 h following
sonication. Grade 2 damage dominated at exposure levels of
between 0.5 and 1.4 MPa.
In the VAF–toluidine-blue-stained sections with the largest
apparent effect, the entire sonicated area contained on average
five or fewer injured neurons when the pressure amplitude was
below 1.4 MPa. Most of these neurons appeared dark stained
(hyperchromatic) and thus might represent reversibly injured
neurons. At a pressure amplitude of 2.3 MPa, the number of
ischemic neurons increased (Table 4). For tissue effects less than
grade 3, the only cells that were positive for ischemia were
neurons.
TUNEL-stained sections showed a few apoptotic cells in both
in the vessel walls and at the brain parenchyma at pressure
amplitude values lower than 2.3 MPa (Fig. 7). With TUNEL
technique, using counterstaining, some cell types could be clearly
identified according to their size, shape, and specific locations as
endothelial cells, intravascular erythrocytes, or leukocytes. Overall,
the TUNEL technique showed very few positive-stained cells, and
these cells were primarily located in blood vessels and glia.
However, it is possible that some individual cells were small
neurons and could not be easily distinguished from glial cells and
extravascular leukocytes by light microscopy. The average number
of apoptotic cells increased with pressure amplitude. At pressure
amplitudes of 2.3 MPa and higher, the tissue damage was always
associated with multiple apoptotic cells. A few scattered apoptotic
cells were also found outside the sonicated areas (Table 4).
Electron microscopy
In the samples obtained from the nonsonicated areas, HRP
filled the vessel’s lumina in brains fixed by immersion, while in the
cases of the perfusion fixation, the vessels appeared to be empty.
HRP did not penetrate the interendothelial clefts. Vesicles
containing HRP were present in only a few endothelial cells
(ECs). No HRP was seen in the subendothelial space: the basement
membrane, pericytes, or neuropil.
In all of the sonicated areas, passage of HRP through the vessel
walls could be seen. Capillaries, arterioles, and venules were
involved in this process, which showed a dependence on the
circulation time of the tracer. For animals sacrificed approximately
1 min after sonication, the HRP reaction product was seen in small
vacuoles and vesicles located at the luminal front of the ECs. Some
of the vesicles were in the process of formation and taking HRP
from the lumen (Fig. 8). This process was more apparent in the
samples obtained from the immersion-fixed brains. No HRP was
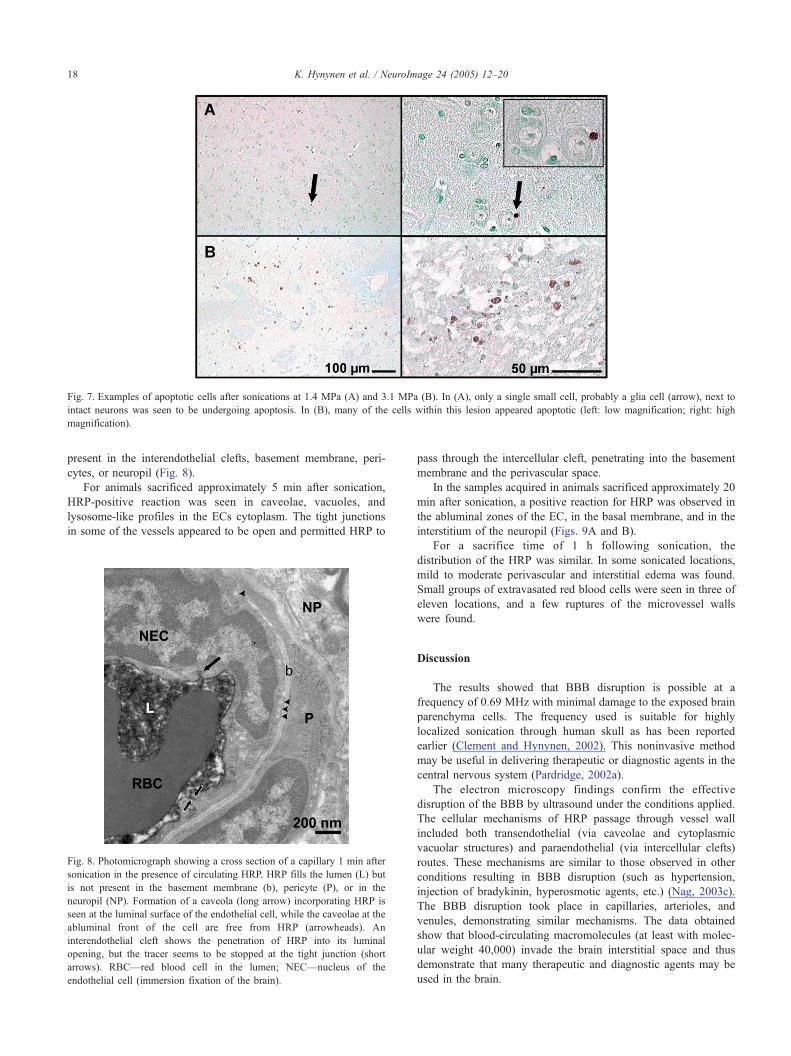
Fig. 7. Examples of apoptotic cells after sonications at 1.4 MPa (A) and 3.1 MPa (B). In (A), only a single small cell, probably a glia cell (arrow), next to
intact neurons was seen to be undergoing apoptosis. In (B), many of the cells within this lesion appeared apoptotic (left: low magnification; right: high
magnification).
K. Hynynen et al. / NeuroImage 24 (2005) 12–2018
present in the interendothelial clefts, basement membrane, peri-
cytes, or neuropil (Fig. 8).
For animals sacrificed approximately 5 min after sonication,
HRP-positive reaction was seen in caveolae, vacuoles, and
lysosome-like profiles in the ECs cytoplasm. The tight junctions
in some of the vessels appeared to be open and permitted HRP to
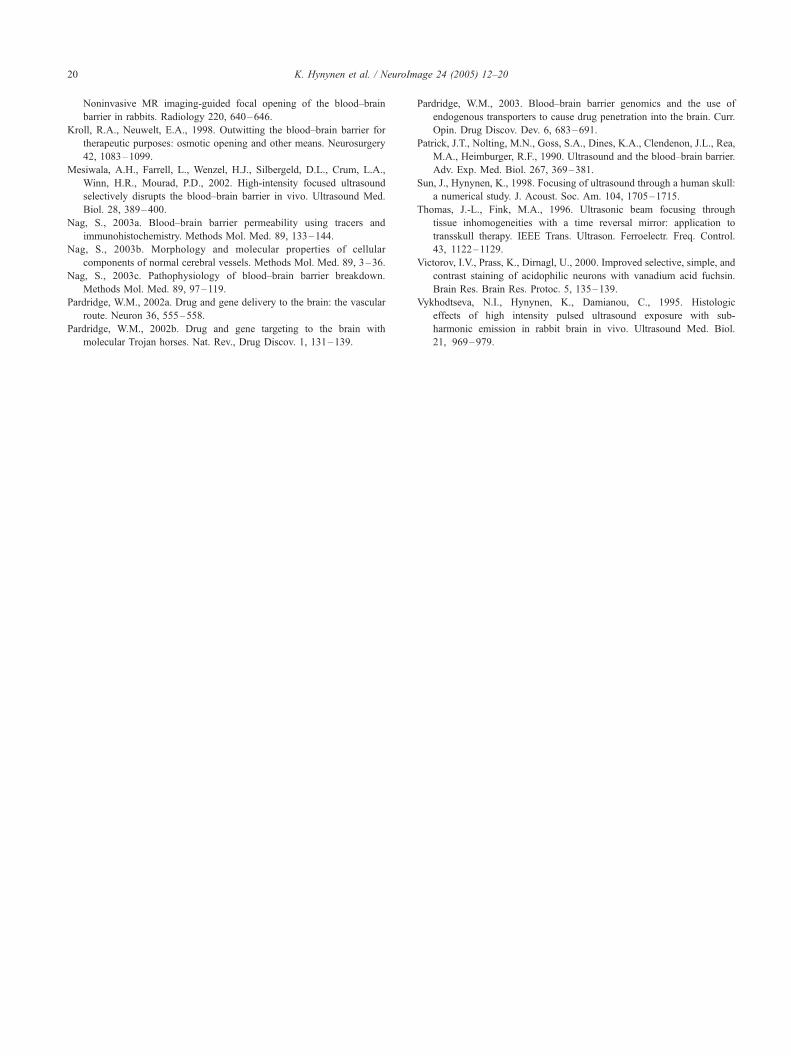
Fig. 8. Photomicrograph showing a cross section of a capillary 1 min after
sonication in the presence of circulating HRP. HRP fills the lumen (L) but
is not present in the basement membrane (b), pericyte (P), or in the
neuropil (NP). Formation of a caveola (long arrow) incorporating HRP is
seen at the luminal surface of the endothelial cell, while the caveolae at the
abluminal front of the cell are free from HRP (arrowheads). An
interendothelial cleft shows the penetration of HRP into its luminal
opening, but the tracer seems to be stopped at the tight junction (short
arrows). RBC—red blood cell in the lumen; NEC—nucleus of the
endothelial cell (immersion fixation of the brain).
pass through the intercellular cleft, penetrating into the basement
membrane and the perivascular space.
In the samples acquired in animals sacrificed approximately 20
min after sonication, a positive reaction for HRP was observed in
the abluminal zones of the EC, in the basal membrane, and in the
interstitium of the neuropil (Figs. 9A and B).
For a sacrifice time of 1 h following sonication, the
distribution of the HRP was similar. In some sonicated locations,
mild to moderate perivascular and interstitial edema was found.
Small groups of extravasated red blood cells were seen in three of
eleven locations, and a few ruptures of the microvessel walls
were found.
Discussion
The results showed that BBB disruption is possible at a
frequency of 0.69 MHz with minimal damage to the exposed brain
parenchyma cells. The frequency used is suitable for highly
localized sonication through human skull as has been reported
earlier (Clement and Hynynen, 2002). This noninvasive method
may be useful in delivering therapeutic or diagnostic agents in the
central nervous system (Pardridge, 2002a).
The electron microscopy findings confirm the effective
disruption of the BBB by ultrasound under the conditions applied.
The cellular mechanisms of HRP passage through vessel wall
included both transendothelial (via caveolae and cytoplasmic
vacuolar structures) and paraendothelial (via intercellular clefts)
routes. These mechanisms are similar to those observed in other
conditions resulting in BBB disruption (such as hypertension,
injection of bradykinin, hyperosmotic agents, etc.) (Nag, 2003c).
The BBB disruption took place in capillaries, arterioles, and
venules, demonstrating similar mechanisms. The data obtained
show that blood-circulating macromolecules (at least with molec-
ular weight 40,000) invade the brain interstitial space and thus
demonstrate that many therapeutic and diagnostic agents may be
used in the brain.

Fig. 9. (A and B) Vessel and perivascular neuropil 19 min after sonication
in the presence of HRP (perfusion fixation of the brain). (A) Numerous
caveolae containing peroxidase (arrowheads) have moved to abluminal
front of the endothelial cell (EC) and into the pericyte (P). The tracer has
infiltrated the basement membrane (b) and the interstitium of the neuropil
(arrows). (B) The passage of HRP through interendothelial clefts with
evidently opened tight junctions is shown with arrows. Peroxidase has
reached the middle and abluminal part of the cleft and has penetrated the
basement membrane (b). Staining for HRP also is seen outside the vessel’s
wall in the neuropil (asterisks). L—lumen; E—red blood cell in the lumen;
NP—neuropil.
K. Hynynen et al. / NeuroImage 24 (2005) 12–20 19
The BBB disruption occurred in this study at a lower pressure
amplitude (0.4 MPa) than was found in the earlier study using the
same animal model and the same ultrasound contrast agent (0.7
MPa in that case) (Hynynen et al., 2001). This is consistent with
the threshold of inertial cavitation that have been shown to occur at
a lower pressure amplitude level when the frequency is decreased
(Apfel and Holland, 1991).
In this study, we used more sensitive histological techniques
than in the earlier study (Hynynen et al., 2001) to investigate the
role of apoptosis or ischemia following ultrasound disruption of the
BBB. In addition, the focal spot size was larger and increased the
likelihood of detecting any adverse events associated with the
sonications. Thus, these results increase the confidence that
ultrasound can be used to disrupt the BBB for delivering agents
to the brain. Although found relatively rarely (3 of 11 cases), the
endothelial damage observed with electron microscopy suggests
the need for further investigations of endothelial and nerve cell
ultrastructure. More work is needed to verify that there are no long-
term effects and that the exposed brain tissue remains fully
functional. Similarly, additional experiments must demonstrate that
an adequate amount of a specific agent can be delivered through
the BBB to achieve the desired therapeutic or diagnostic goal. In
addition, there can be a difference in sensitivity of the cell to
ultrasound exposure between white and gray matter. We did not
investigate this matter in the present study; all locations were
targeted in gray matter.
The parameters used in this study are suitable for noninvasive
sonications through human skull. The maximum acoustic power
over the 20-s duration averaged 80 mW distributed over the focal
spot area, which however was not strong enough to induce
measurable temperature elevation in the tissue (Hynynen et al.,
1997) and should therefore be safe for trans-skull sonications. At
pressure amplitudes up to approximately 0.5 MPa, the BBB was
disrupted in most sonicated locations with only a few extravasated
erythrocytes and zero to two ischemic neurons or apoptotic cells in
the entire area. These results suggest that these exposures can be
used to deliver therapeutic or imaging agents with an acceptable
impact on the brain tissue. At higher pressure amplitudes up to 1.4
MPa, there were more extravasated erythrocytes, and the total
number of the ischemic and apoptotic cells was increased on
average to five to six in the section. The importance of these effects
is not clear, though they appear minimal and would most likely be
acceptable for therapeutic interventions such as the delivery of
genes or chemotherapy agents for tumor or other serious disease
treatments.
In conclusion, this study has demonstrated that for the first
time, focused ultrasound can produce focal BBB disruption deep
within the brain at a frequency that can be focused through human
skull bone while sustaining little damage to the brain tissue. This
finding may have considerable impact on future brain research,
diagnostics, and therapy.
Acknowledgments
This research was supported by NIH research grant no.
CA76550 and CA089017 and a grant from CIMIT.
References
Abbott, N.J., Romero, I.A., 1996. Transporting therapeutics across the
blood–brain barrier. Mol. Med. Today 2, 106–113.
Apfel, R.E., Holland, C.K., 1991. Gauging the likelihood of cavitation from
short-pulse, low duty cycle diagnostic ultrasound. Ultrasound Med.
Biol. 17, 179–185.
Cammermeyer, J., 1978. Is the solitary dark neuron a manifestation of
postmortem trauma to the brain inadequately fixed by perfusion?
Histochemistry 56, 97–115.
Clement, G.T., Hynynen, K., 2002. A noninvasive method for fo-
cusing ultrasound through the human skull. Phys. Med. Biol. 47,
1219–1236.
Doolittle, N.D., Miner, M.E., Hall, W.A., Siegal, T., Jerome, E., Osztie, E.,
McAllister, L.D., Bubalo, J.S., Kraemer, D.F., Fortin, D., Nixon, R.,
Muldoon, L.L., Neuwelt, E.A., 2000 (Feb. 1). Safety and efficacy of a
multicenter study using intraarterial chemotherapy in conjunction with
osmotic opening of the blood–brain barrier for the treatment of patients
with malignant brain tumors. Cancer 88 (3), 637–647.
Gavrieli, Y., Sherman, Y., Ben-Sasson, S.A., 1992. Identification of
programmed cell death in situ via specific labeling of nuclear DNA
fragmentation. J. Cell Biol. 119, 493–501.
Hynynen, K., Jolesz, F.A., 1998. Demonstration of potential noninvasive
ultrasound brain therapy through intact skull. Ultrasound Med. Biol. 24,
275–283.
Hynynen, K., Vykhodtseva, N.I., Chung, A., Sorrentino, V., Colucci, V.,
Jolesz, F.A., 1997. Thermal effects of focused ultrasound on the brain:
Determination with MR Imaging. Radiology 204, 247–253.
Hynynen, K., McDannold, N., Vykhodtseva, N., Jolesz, F.A., 2001.
K. Hynynen et al. / NeuroImage 24 (2005) 12–2020
Noninvasive MR imaging-guided focal opening of the blood–brain
barrier in rabbits. Radiology 220, 640–646.
Kroll, R.A., Neuwelt, E.A., 1998. Outwitting the blood–brain barrier for
therapeutic purposes: osmotic opening and other means. Neurosurgery
42, 1083–1099.
Mesiwala, A.H., Farrell, L., Wenzel, H.J., Silbergeld, D.L., Crum, L.A.,
Winn, H.R., Mourad, P.D., 2002. High-intensity focused ultrasound
selectively disrupts the blood–brain barrier in vivo. Ultrasound Med.
Biol. 28, 389–400.
Nag, S., 2003a. Blood–brain barrier permeability using tracers and
immunohistochemistry. Methods Mol. Med. 89, 133–144.
Nag, S., 2003b. Morphology and molecular properties of cellular
components of normal cerebral vessels. Methods Mol. Med. 89, 3–36.
Nag, S., 2003c. Pathophysiology of blood–brain barrier breakdown.
Methods Mol. Med. 89, 97–119.
Pardridge, W.M., 2002a. Drug and gene delivery to the brain: the vascular
route. Neuron 36, 555–558.
Pardridge, W.M., 2002b. Drug and gene targeting to the brain with
molecular Trojan horses. Nat. Rev., Drug Discov. 1, 131–139.
Pardridge, W.M., 2003. Blood–brain barrier genomics and the use of
endogenous transporters to cause drug penetration into the brain. Curr.
Opin. Drug Discov. Dev. 6, 683–691.
Patrick, J.T., Nolting, M.N., Goss, S.A., Dines, K.A., Clendenon, J.L., Rea,
M.A., Heimburger, R.F., 1990. Ultrasound and the blood–brain barrier.
Adv. Exp. Med. Biol. 267, 369–381.
Sun, J., Hynynen, K., 1998. Focusing of ultrasound through a human skull:
a numerical study. J. Acoust. Soc. Am. 104, 1705–1715.
Thomas, J.-L., Fink, M.A., 1996. Ultrasonic beam focusing through
tissue inhomogeneities with a time reversal mirror: application to
transskull therapy. IEEE Trans. Ultrason. Ferroelectr. Freq. Control.
43, 1122–1129.
Victorov, I.V., Prass, K., Dirnagl, U., 2000. Improved selective, simple, and
contrast staining of acidophilic neurons with vanadium acid fuchsin.
Brain Res. Brain Res. Protoc. 5, 135–139.
Vykhodtseva, N.I., Hynynen, K., Damianou, C., 1995. Histologic
effects of high intensity pulsed ultrasound exposure with sub-
harmonic emission in rabbit brain in vivo. Ultrasound Med. Biol.
21, 969–979.
Related Documents