Submission to the FMA 2006 Doctoral Student Seminar Loan Syndications: Structure, Loan Pricing, Covenants, and Bank Risk. Tram Vu ∗ Department of Accounting and Finance, Monash University, Australia August 23 2006 Abstract This study explores U.S. loan syndication structures in relation to various loan contract terms and bank risk. With a focus on three dimensions of syndicate structure (syndicate size, concentration, and lead bank’s retention), the study first examines how the values of different syndicate structures are reflected in loan pricing on both drawn and undrawn amounts. The study also investigates new ex ante determinants of syndicate structures, including different covenants and bank risk. A major methodological contribution is to address potential interdependencies between loan syndicate structures and nonprice contract terms. The findings from this study offer further light on the uniqueness of bank loans and provide insights into banks’ syndicated lending practice. ∗ Email: [email protected] The author is grateful to Professor Michael Skully and Dr. Roderick Lambert for their consistent supervision and valuable comments and to Dr. George Tanewski for his efforts in obtaining the database required for this study. All remaining errors and omissions are solely the responsibility of the author. 1

Welcome message from author
This document is posted to help you gain knowledge. Please leave a comment to let me know what you think about it! Share it to your friends and learn new things together.
Transcript

Submission to the FMA 2006 Doctoral Student Seminar
Loan Syndications: Structure, Loan Pricing,
Covenants, and Bank Risk.
Tram Vu ∗
Department of Accounting and Finance, Monash University, Australia
August 23 2006
Abstract
This study explores U.S. loan syndication structures in relation to various loan contract terms and bank risk. With a focus on three dimensions of syndicate structure (syndicate size, concentration, and lead bank’s retention), the study first examines how the values of different syndicate structures are reflected in loan pricing on both drawn and undrawn amounts. The study also investigates new ex ante determinants of syndicate structures, including different covenants and bank risk. A major methodological contribution is to address potential interdependencies between loan syndicate structures and nonprice contract terms. The findings from this study offer further light on the uniqueness of bank loans and provide insights into banks’ syndicated lending practice.
∗ Email: [email protected]
The author is grateful to Professor Michael Skully and Dr. Roderick Lambert for their consistent supervision and valuable comments and to Dr. George Tanewski for his efforts in obtaining the database required for this study. All remaining errors and omissions are solely the responsibility of the author.
1

1. Introduction
This study comprehensively examines the structure of U.S. loan syndications in
a number of new aspects. While previous syndicated loan studies have largely
concentrated on how syndicate structure is determined by different borrower
characteristics such as risk and informational opacity, this study explores the
relationship between syndicate structure and non-borrower effects. First, it focuses on
the relevance of syndicate structure to loan pricing, namely, yield spreads on drawn
amounts and commitment fees on undrawn amounts. Second, the use of debt
covenants in syndicated loan contracts will also be addressed with respect to syndicate
structure. Third, the study investigates whether and how banks of different risk classes
launch syndicated loans with different structures.
Loan syndications represent a unique setting where a finite number of
institutions jointly lend to a single borrower and therefore acquire the characteristics
of both private and public debt. Loan syndications may assume different structures
since the number of lenders as well as their proportional participation varies
significantly across loans. Extant evidence in syndicated loan research has commonly
suggested that different syndicate structures may carry more or less value in terms of
lenders’ monitoring and recontracting incentives. To provide direct evidence on the
value of different syndicate structures, this study regresses loan yield spreads drawn
on syndicate structures. Furthermore, loan commitment fees apply to lines of credit
which represent a highly flexible source of financing for corporate borrowers with
uncertain future investment opportunities, but have been under-researched in the
syndicated loan context. This study also examines how the benefits of different
syndicate structures may be reflected in loan commitment fees.
Second, the establishment of a syndicated loan requires both loan contract terms
and syndicate structure to be negotiated. To the extent that these decisions can be
simultaneous, the study investigates potential interdependence between the use of
loan covenants and syndicate structure. Given loan covenants and syndicate structure
can substitute each other in alleviating asymmetric information problems, they should
be modelled as endogenous variables rather than exogenous factors as assumed in
prior research. Using an improved framework, this study considers syndicate structure
and covenants in a simultaneous equations model. This helps overcome possible
biases that might have been introduced in previous single-equation estimations.
2

The third issue in this study addresses another non-borrower determinant of loan
syndication structure - bank risk. Extant evidence has largely shown that syndicate
structure does depend on borrowers’ risk and information, given bank characteristics.
Existing studies also suggest that syndicate structure depends on the lead lender’s
reputation and its relationships with other institutional lenders, given borrower
characteristics. This study resembles the latter approach, examining the effect of bank
risk on syndicate structure while controlling for borrower effects. Bank risk may be
attributable to capital, credit and liquidity risk. These aspects of risk represent the
bank’s cost of lending, exposure to default, and even certification ability, which may
in turn influence its lending policy, and hence make a worthwhile research topic. This
study is motivated by the paucity of research on the impact of bank risk on lending
behaviour, particularly in the loan syndication context. The third objective of the
study is hence to resolve whether bank risk has an impact on syndicate structure given
borrower effects.
In summary, the study raises three distinctive research questions: 1) whether
and how loan yields spreads drawn and commitment fees vary with loan syndication
structure ex ante; 2) whether and how the use of loan covenants and loan syndication
structure are related ex ante; and 3) whether and how loan syndication structure is
dependent on bank risk ex ante.
The remainder of the proposal is structured as follows. Section 2 briefly
describes a loan syndication background and reviews most critical arguments and
findings in syndicated loan, loan pricing, loan covenant and bank risk research.
Section 3 presents the most important methodological issues. Section 4 briefly
describes the major data sources and the sample which has been collected for a pilot
study. Section 5 presents some empirical evidence. Finally, Section 6 discusses the
contributions and implications of this study.
2. Background and Literature Review
2.1. Background on syndicated loans
A syndicated credit facility can be defined as “two or more institutions agreeing
to make a loan to a borrower” (Dennis and Mullineaux, 2000). Syndicated loans have
become a major source of corporate financing over the last two decades. According to
3
the U.S. Loan Pricing Corporation, new syndicated credit grew from US$241 million
in 1990 in 1999 to US$1.35 trillion in 2004, which is equivalent to around 13 percent
per annum growth. A lead bank (also called lead arranger or originator) typically
screens the loan and subsequently “underwrites” it to other lenders. The loan contract
formally defines a lending agreement between the borrower and each of the syndicate
participants. All syndicate members are responsible for monitoring the borrowing
firm and their consent is typically required before any contract term can be amended.
It is however common practice for lead arrangers to hold relatively large loan
proportions and therefore have greater monitoring incentives than other syndicate
members.
Hence, whether a syndicated loan is a more private or public form of lending
largely depends on the syndicate structure. Prior studies on private debt have
commonly argued that the values of private lending are diminished by the free-riding
problem in public debt. As numerous lenders are involved, debt holdings are diffuse
and no lender holds a sufficiently large stake to exert monitoring or recontracting
efforts (Diamond, 1984; Fama, 1985; Chemmanur and Fulghieri, 1994). Hence, loan
syndications represent a unique setting since they are private financing agreements
whose structures vary with respect to the number of lenders and proportional
participation. This study focuses on three different aspects of syndicate structures,
namely, the number of lenders (hereafter, syndicate size), concentration, and the
percentage of loan retained by the lead bank (hereafter, retention). The free-riding
problem is exacerbated when the syndicate involves more lenders and when their
participation is less concentrated, which reduces lenders’ potential monitoring and
recontracting incentives. Furthermore, lower retention may also imply that the lead
bank has less incentive to provide monitoring and renegotiation benefits. Several
studies on syndicated loans have mostly found that syndicates are formed to facilitate
the benefits of private lending to borrowers. For instance, syndicates with fewer
lenders and higher concentration are more likely to be formed when borrowers have
higher default risk and more severe information problems (Esty and Megginson,
2003; Lee and Mullineaux, 2004). Furthermore, Dennis and Mullineaux (2000) and
Panyagometh and Roberts (2002) found the lead bank tends to retain a greater loan
proportion for riskier and more information-opaque borrowers. Such evidence
suggests that customers who find banks’ monitoring and recontracting efforts more
4

valuable are more likely to borrow from syndicates with fewer lenders, higher
concentration, and larger retention.
2.2. Loan pricing
Given that monitoring and recontracting benefits vary across different syndicate
structures, differences in loan yields may also be explained by syndicate size,
concentration and retention, after controlling for borrower and loan characteristics.
The empirical research on loan yields has reached a consensus that loan yields reflect
the benefits of borrowing to the borrower, and equivalently, the costs of lending to the
lender. Indeed, riskier borrowers with more severe information asymmetries, who are
more likely to enjoy private lending benefits, are more willing to pay higher yields on
a given loan. This is supported by existing evidence that loan yield spreads decrease
with firm size and cash and increase with firm leverage (Strahan, 1999; Hao, 2003).
Syndicated loan yield spreads have also been found to vary with syndicate size and
retention but the evidence appears to be mixed (Coleman, Esho and Sharpe, 2002;
Hao, 2003). Those studies however have ignored the impact of syndicate
concentration on loan yields. This study argues that concentration among syndicate
participants affects the likelihood of free-riding and therefore the extent to which
these lenders will renegotiate with the borrower.1 It will examine the relationship
between yield spreads and all three characteristics of syndicate structure. The study
predicts that loan yields are higher for a syndicated loan with fewer lenders, higher
concentration and larger retention.
Another pricing component to be addressed in this study is the fee charged on
the undrawn portion of revolving credit facilities (“revolving credit” will be used
interchangeably with “line of credit” and “loan commitment”). These lines of credit
are commitments made by the bank to provide credit up to a predetermined limit for a
fixed interest rate or fixed risk premium above the base rate (floating rate). In addition
to interest rates, revolving credit contracts involve a complex fee structure: typically
an upfront fee (also called facility fee), an annual fee (charged annually on the entire
commitment amount) and a commitment fee (charged annually on the unused
1 This is parallel to the free-riding problem in public debt where there are more than one creditor and diffuse public debt holdings imply that no creditor holds a sufficiently large proportion of debt to exert either monitoring or recontracting efforts. In syndicated loans, it is common practice for the lead bank to monitor alone. Recontracting, however, requires agreement from each and every syndicate member. Therefore, free-riding in syndicated loans is most expressed in the renegotiation process.
5
portion). It has been argued that loan commitments can solve moral hazard problems
since their fee structure allows borrowers to self-select (Thakor and Udell, 1987;
Shockley and Thakor, 1997).2 These studies contend that riskier borrowers with more
severe information asymmetries are likely to pay higher commitment fees for unused
loan commitments. This is expected because such borrowers face more uncertainty
regarding their future funding, therefore place a greater value on the option of
borrowing under loan commitments at a fixed interest rate or fixed risk premium. To
prevent lending committed funds to borrowers whose performance have downgraded,
credit line lenders also maintain a close scrutiny over the borrowers. It follows that
borrowers may be willing to pay higher commitment fees for syndicate structures
where lenders have greater monitoring incentives, i.e. fewer lenders, higher
concentration and larger retention. This study examines whether and how
commitment fees charged on undrawn portions of revolving credit facilities are
associated with syndicate structure.
2.3. Nonprice contract terms in syndicated loans
Besides interest rates and fees, banks also establish nonprice terms, for instance,
facility size, maturity, collateral and other protective covenants, in a loan contract.
Research on the relationship between syndicate structure and nonprice contract terms
in syndicated loan contracts has been limited to loan maturity and secured status. The
impact of other loan covenants on syndicate structure however has been largely
ignored.
Existing studies on nonprice debt contract terms can be classified into two main
views. The first view is based on adverse selection. It assumes ex ante borrower risk
is not observable to lenders and hence concludes that nonprice contract terms can be
used as a signalling mechanism via which borrowers can self-select. For instance,
high-quality borrowers signal their quality by posting collateral. Due to adverse
selection, therefore, the presence of collateral is negatively related to borrower risk
(Bester, 1985; Chan and Kanatas, 1985; Besanko and Thakor, 1987). Advocates of
adverse selection also argue that low-risk borrowers signal their quality by taking
shorter-term loans (Flannery, 1986; Stohs and Mauer, 1996). Conversely, the moral
hazard view assumes that ex ante borrower risk is observable to lenders; however,
2 See Ergungor (2001) for a discussion on theories of bank loan commitments.
6
borrowers’ ex-post actions are unobservable and hence can reduce future project
payoffs at the lenders’ expense. Moral hazard therefore predicts that firms with higher
risk of shirking are more likely to borrow debt which is secured and has a shorter
maturity and more restrictive covenants. Some empirical evidence has shown that
riskier borrowers are more likely to post collateral (Berger and Udell, 1990; Angbazo,
Mei and Saunders, 1998; Chen, Yeo and Ho, 1998; Strahan, 1999; Jimenez and
Saurina, 2004). Barclay and Smith (1995) and Dennis, Nandy and Sharpe (2000) also
found that shorter-term loans are extended to firms with more severe agency costs of
debt, which suggests that maturity is used as a tool for controlling moral hazard.
Correia (2005) found strong evidence that both the choice of maturity and debt
covenants in UK Eurobonds are determined to alleviate agency costs.
This study therefore investigates whether and how the inclusion of different
covenants is related to loan syndication structure. While the relationship between
covenant use and syndicate structure may not be clear from the adverse selection
point of view, the moral hazard problem implies that borrowers are more temped to
shirk when lenders face higher agency costs among themselves. In other words,
higher agency costs reduce lenders’ incentives and therefore induce borrowers to
engage in value-decreasing behaviour. Incentive-reducing structures, which contain
more lenders, lower concentration, and lower retention, accentuate the moral hazard
problem, hence are more likely to involve collateral.
Following prior studies on debt covenants, this study takes into account the
interdependence among different types of covenants. For instance, the presence of
different loan covenants is modelled as a function of borrower characteristics, lender
characteristics, and other contract features (Bradley and Roberts, 2004). Coleman,
Esho and Sharpe (2002) consider both loan maturity and secured status as endogenous
variables which are explained by various borrower effects and other nonprice terms,
in their simultaneous equations system. Dennis, Nandy and Sharpe (2000) establish a
simultaneous equations model where the all-in-spread, commitment fee, maturity and
secured status are endogenous factors. This study also allows for the presence of other
covenants to be dependent on syndicate structure. Syndicate size, as a proxy for
borrower risk and a measure of lenders’ monitoring efforts, has been found to
influence both loan maturity (Coleman, Esho and Sharpe, 2002) and loan covenants
(Bradley and Roberts, 2004). Hence the methodology will address interdependencies
7

between loan covenants and syndicate structure including syndicate size,
concentration and retention.
2.4. Bank risk
Recent studies on private loans have emphasized the impact of lender
characteristics on loan contract terms. Bank risk is also considered among other
lender characteristics such as bank size and monitoring ability. As discussed by
Coleman, Esho and Sharpe (2002), bank risk can be reflected by capital risk, liquidity
risk and credit risk. Bank risk therefore represents the cost of funds that banks have to
incur on lending, which implies that high-risk banks charge higher yields on a given
loan (Coleman, Esho and Sharpe, 2002; Hubbard, Kuttner and Palia, 2002; Hao,
2003). In contrast, Cook, Schellhorn and Spellman (2003) argues that bank reputation
deteriorates with credit risk and therefore banks with better credit ratings are able to
charge higher loan yields. Credit risk can also reflect the bank’s probability of default
and hence its lending behaviour. Existing evidence suggests that high-risk banks limit
their risk exposure by requiring loan collateral and lending for shorter maturities
(Coleman, Esho and Sharpe, 2002; Bradley and Roberts, 2004).3
The impact of bank risk has also been examined, though not thoroughly, for
syndicated loans. Capital risk has been considered in several studies, but their results
are mixed. Capital constraints represent the cost of funds hence induce lead banks to
retain less of the syndicated loan (Jones, Lang and Nigro, 2005). Opposite evidence
however suggests that capital constraints may lower bank reputation and hence those
banks have to retain more of the syndicated loan (Dennis and Mullineaux, 2000).
Credit risk and liquidity risk is also examined by Dennis and Mullineaux (2000) who
find that liquidity risk has an insignificant impact while credit risk significantly results
in the lead bank retaining less of the syndicated loan. Such evidence suggests that the
lead bank attempts to limit its risk. Except for those findings on the lead bank’s
retention, the impact of bank risk on syndicate size and concentration has not been
addressed in prior studies.
This study hypothesizes the relationships between the lead bank’s riskiness and
syndicate size, concentration and retention, using various bank risk measures, in
3 Bradley and Roberts (2004) consider investment banks as a proxy for bank risk since investment banks are typically engaged in riskier businesses than commercial banks.
8
accordance with the cost of funds, risk exposure and reputation arguments. The cost
of funds argument predicts high-risk lead banks will form loan syndicates with
smaller retention. As they also have a greater incentive to limit their risk exposure
they tend to form loan syndicates with more lenders, lower concentration and smaller
retention to prevent firms from shirking. In contrast, poorer reputation implies that
high-risk lead banks have to form loan syndicates with fewer lenders, higher
concentration and larger retention in order to certify the loan quality.
3. Empirical Methods
3.1. Multivariate analysis of loan pricing
3.1.1. General equations
This study resembles recent studies on corporate debt contracts by focusing on
the relationships at the loan rather than the firm level.4 Past research on loan pricing
has typically regressed observed loan rates on borrower characteristics, bank
characteristics and nonprice contract terms.5 Given that loan pricing reflects the
benefits of borrowing for borrowers, or equivalently the cost of lending for the bank,
this study examines how loan pricing may be influenced by the various costs and
benefits implicit in different syndicate structures. The benefits of a loan agreement
vary with borrower risk and information problems. Besides, loans tend to be more
expensive when lending banks have a higher bargaining power and higher cost of
capital (Coleman, Esho and Sharpe, 2003; Hao, 2003). Loan pricing can also depend
on the benefits of nonprice contract terms. The first equation hence takes the
following form,
AISD i = α1 + Syndicate Structure i β1 + X i γ1 + ε i
(Eq. 1)
where
Syndicate Structure = [Ln(Syndicate Size), Ln(Concentration),
Retention]
4 See studies on loan syndications and loan contract terms. 5 See, for instance, Strahan (1999), Cook, Schellhorn and Spellman (2003) and Hubbard, Kuttner and Palia (2002).
9

X = [Duration, Secured, Ln(FacSize), Revolver, FacRatio,
Leverage, SD(Earnings), Rated, OpCash, Taxes, PPE,
Ln(Assets), MTB]
AISD is the all-in-spread which consists of both annual fees and interest rate charged
on the drawn amount of a facility, adjusted for the base rate and expressed in basis
points.6 Ln(Syndicate Size) is the natural logarithm of the total number of lenders
participating in a loan facility. Ln(Concentration) is the natural logarithm of
Concentration, where Concentration is measured using the Hirschman-Herfindahl
index. Retention in the percentage of facility amount held by the lead arranger.
Duration is the facility’s maturity in years. Secured is a dummy variable coded 1 if
the facility is secured and 0 otherwise. Ln(FacSize) is the natural logarithm of the
facility amount. Revolver is a dummy variable coded 1 if the facility is a revolver and
0 if it is a term loan. FacRatio is the borrower’s ratio of facility amount to the
borrower’s total liabilities as of the year-end preceding the loan year. Leverage is the
borrower’s ratio of total liabilities to total assets. SD(Earnings) is the borrower’s
standard deviation in the ratio of EBITDA to total assets over 5 consecutive years
preceding the loan year. Rated is the dummy variable coded 1 if the borrower has a
public debt rating when the loan is launched and 0 otherwise. OpCash is the
borrower’s ratio of net operating cash flows to total assets. Taxes is the borrower’s
ratio of total income taxes to total assets. PPE is the borrower’s ratio of plant,
property and equipment to total assets. Ln(Assets) is the natural logarithm of the
borrower’s total assets. MTB is the borrower’s market-to-book ratio, measured as
(Total Assets – Book Value of Common Equity + Market Value of Equity)/ Total
Assets.7,8
The second equation examines the commitment fees on the undrawn portion of
loan commitments and is estimated for a subsample of only revolving credit facilities.
As borrowers with higher risk and more severe information asymmetries tend to place
a higher value on unused portions of loan commitments, borrower risk and
6 The all-in-spread drawn has been widely used in loan pricing research, for instance, Angbazo, Mei and Saunders (1998), Dennis, Nandy and Sharpe (2000) and Hubbard, Kuttner and Palia (2002). 7 Due to space constraints, we do not provide lengthy discussion of expected signs on the control variables. The expected signs on explanatory variables are presented in the appendix. 8 All borrower variables are calculated as of the year-end preceding the loan facility year, unless stated otherwise.
10

information proxies are included as determinants of the commitment fee. Several
theoretical studies have contended that the multiple fee structure of loan commitments
helps resolve information asymmetries between the borrower and the lender (Thakor
and Udell, 1987; Shockley and Thakor, 1997). Given that nonprice contract terms
such as maturity and collateral may also function as mechanisms that control adverse
selection and moral hazard, it can be argued that commitment fees are influenced by
the use of these contract terms. Following Dennis, Nandy and Sharpe (2000), this
study also controls for the year 1992 when the U.S. capital adequacy guidelines
required a commercial bank to hold capital against undrawn loan commitments. This
represents a cost of capital to the bank which in turn should charge a higher loan
commitment fee after 1992, ceteris paribus. Different syndicate structures imply that
lenders may be more or less informed about the borrower’s potential demand for
funding, and so this may influence commitment fees. The equation on loan
commitment fees takes the following form,
Commitment Fee i = α2 + Syndicate Structure i β2 + X i γ2 + 1992
Dummy i δ2 + ε i
(Eq. 2)
where Commitment Fee is the fee charged on undrawn portions in percentage terms;
Syndicate Structure and X are specified as for Eq.1.
3.2. Multivariate analysis of syndicate structure
3.2.1 General equations
Following previous syndicated loan studies, syndicate structure variables are
modelled as functions of borrower risk, borrower information as well as nonprice
contract terms. These equations also include a proxy for bank reputation, as suggested
by prior evidence that better reputation allows the lead bank to form larger and less
concentrated syndicates with smaller retention (Dennis and Mullineaux, 2000;
Panyagometh and Robers, 2002; Lee and Mullineaux, 2004).9 In addition to facility
size, maturity and secured status, nonprice contract terms also include loan covenants
such as dividend restrictions, financial restrictions, and prepayment restrictions.
9 A lead arranger’s reputation for a given loan facility is proxied by either the number of syndicated loan deals led by this lead arranger in the previous year (Panyagometh and Roberts, 2002) or the lead arranger’s market share in the previous year (Sufi, 2005).
11

Bradley and Roberts (2004) investigate the use of covenants in loan contract terms
and classify them into four major categories, including financial, dividend,
prepayment, and secured.10 This study follows a similar approach by examining in
details the impact of individual covenants on syndicate structure. The general
equation is specified as follows,
Syndicate Structure i = α3 + X i β3 + ε i
(Eq. 3)
where Syndicate Structure and X are specified as for Eq. 1.
3.2.2. Simultaneous equations model
Previous syndicated lending research has widely considered contract terms such
as loan maturity and secured status as exogenous determinants of syndicate structure,
as these terms can proxy for borrower risk in a manner predicted by adverse selection
or moral hazard.11 Meanwhile, studies that focus on debt contract terms argue in
favour of the endogeneity of these nonprice terms. For instance, Coleman, Esho and
Sharpe (2002) contend that loan maturity is dependent on various borrower
characteristics, bank risk as well as syndicate size. Bradley and Roberts (2004) also
regress the presence of different loan covenants on borrower characteristics, lender
characteristics, and macroeconomic factors. These studies generally find support for
moral hazard which posits that loan maturity and covenants are established for
controlling agency costs of debt. Correia (2005), on the other hand, finds support for
both adverse selection and moral hazard in the choice of maturity and restrictive
covenants using a panel data approach. Using a simultaneous equations model, this
study allows for the endogeneity of different nonprice terms as well as the
interdependence between nonprice terms and syndicate structure.
The choice of maturity can be captured by a continuous variable, whereas the
decision to include collateral or a specific type of covenant represents a binary choice.
A simultaneous equations model can be established by specifying simultaneous 10 Financial covenants impose restrictive financial leverage ratios. Dividend covenants establish a ceiling on the dividend paid out as a proportion of net income or excess cash flows. Prepayment covenants (i.e. sweeps) establish a minimum percentage of loan that must be repaid from proceeds from excess asset sales, equity issues, debt issues, and excess cash flows. Secured loans are loans including borrowers’ assets as collateral. 11 For instance, Dennis and Mullineaux (2000), Panyagometh and Roberts (2002), and Lee and Mullineaux (2004).
12

equations of the use of individual covenants and loan duration, coupled with the
equations on Syndicate Structure. This study also adopts the approach used by
Bradley and Roberts (2004) by estimating a covenant index. This method effectively
counts the number of covenants specified in a loan contract as a covenant index. The
drawback of this method is that it implicitly assumes equality in the effectiveness of
different covenants. This study will rely on both methods, binary choice and covenant
count, to lend robustness to the results. The simultaneous equations model will now
consist of Syndicate Structure, Duration, and Covenant, as endogenous variables.
Their equations are in the following form,
Syndicate Structure i = α4 + Duration i β4 + Covenant i γ4 + X i δ 4
+ ε i
(Eq.4)
Duration i = α5 + Syndicate Structure i β5 + Covenant i γ5 + X i δ5
+ ε i
(Eq.5)
Covenant i = α6 + Syndicate Structure i β6 + Duration i γ6 + X i δ6
+ ε i
(Eq.6)
where Syndicate Structure and X are specified as for Eq.1; Duration is the facility’s
maturity (in years); Covenant represents a vector of various covenant dummies and
indexes.
3.2.3. Different measures of bank risk
This study will measure bank risk based on accounting figures. Following prior
bank risk studies, the focus is placed on capital, credit and liquidity risk (Dennis and
Mullineaux, 2000; Coleman, Esho and Sharpe, 2002). Capital risk is proxied by three
variables: the ratio of equity capital to total assets, the ratio of Tier 1 (core) capital to
risk-based assets, and the dummy variable which indicates undercapitalization
according to some industry-wide threshold. On the one hand, the inclusion of the
regulatory Tier 1 capital ratio suggests that shortages of regulatory capital may
impose significantly higher costs on the bank than conventional equity capital. On the
other hand, the undercapitalization dummy takes into account the industry’s capital
13
benchmark. Furthermore, proxies for credit risk include the ratio of noncurrent loans
to total loans and the ratio of loan charge-offs to total loans. Finally, liquidity risk
represents the risk of unexpected withdrawals of deposits or unexpected drawdowns
of loan commitments. One proxy for liquidity risk is therefore the ratio of deposits to
unused loan commitments. A bank’s cash holdings help limit liquidity risk, hence the
ratio of cash to total assets is also included.
4. Data Sources
4.1. The sample
This study relies on three sources of data (Dealscan, Compustat, and U.S.
banks’ call reports) to address the three research questions. Dealscan provides a
comprehensive coverage of individual loan deals,12 whereas the borrowing firms’
financial information is obtained from Compustat. The U.S. Federal Reserve’s Call
Reports provide banks’ balance sheet, income and loan portfolio figures.
The study examines potential relationships at the loan facility level, hence each
facility is matched with a corresponding borrower and a corresponding lead bank. To
isolate cross-country effects, the borrowing firm must be a U.S. non-financial firm
with a ticker so that financial information can be obtained from Compustat and the
lead bank must be a regulated U.S. bank whose financial statements are available
from Call Reports. The sample consists of all confirmed sole-lender and syndicated
loans and excludes non-private-loan facilities such as notes, bonds, and private
placements. These filters result in 21,172 facilities from 1987 until recently.
To be included in the final sample, loan facilities must also have a non-zero all-
in-spread drawn, borrower’s sales size at close, duration, available lead arrangers’
identity, total number of lenders and corresponding participation proportions (which
sum up to 100 percent). Loan facilities are excluded if the lead arranger is a holding
company or a saving bank due to possible differences in their lending spectrum in
comparison to commercial banks. Many observations have missing lead arrangers’ 12 Dealscan, a U.S. Loan Pricing Corporation product, has listed every loan deal since 1987. It provides several types of details on syndicate structure, including the identity of all lenders in the syndicate, their participation shares and roles, as well as other loan features such as type of facility, borrowing purpose, amount, maturity, fees, rates and covenants. It has facilitated many U.S. syndicated lending studies (Angbazo, Mei and Saunders, 1998; Altman and Suggitt, 2000; Dennis and Mullineaux, 2000; Dennis, Nandy and Sharpe, 2000; Lee and Mullineaux, 2004; Thomas and Wang, 2004).
14
identity and participation proportions, hence the final sample is considerably
narrowed to 3,623 facilities.
Syndicated loans can involve more than one lead arranger. For the current pilot
study, the sample is limited to facilities with only one lead arranger. This restriction
will allow us to focus on the incentive problem between the lead arranger and
syndicate participants and abstract from the moral hazard among various lead
arrangers themselves. The sample therefore consists of 2,936 facilities, each led by
one lead arranger whose participation share can be identified. This sample will
subsequently be used for constructing the proxy for lead arranger’s reputation.
The sample is further refined for regression purpose. The included observations
must have a matching borrower ticker on Compustat,13 and the loan borrowers must
have at least 5 years of Compustat data prior to the loan year. We need 5 years of data
to compute a proxy for borrower risk, the standard deviation in the ratio of EBITDA
to total assets over the previous 5 years. We also exclude borrowers which have
operated for less than 5 years since these relatively new firms may receive
subsidisation by way of lower loan spreads offered by the lending syndicate. The final
sample borrowers are U.S. non-farm, non-financial, and non-public-administration
firms with no missing information on main borrower characteristics. The final sample
consists of 928 loan facilities made between 1990 and 2000.
4.2. Descriptive statistics
Table 1 shows a statistics summary (mean, median, maximum, minimum, and
standard deviation) for syndicate structure and major loan and borrower variables for
the full sample. The sample is classified into sole-lender and syndicated loans.
Syndicated loans are further grouped into above-median and below-median sub-
groups based on the total number of lenders involved in the facility, syndicate
concentration, and the lead arranger’s retention percentage. Table 2 presents summary
statistics for each of these sub-samples. We conduct t-tests for mean differences
between sub-samples and observe that most of the loan and borrower characteristics
significantly differ between sole-lender and syndicated loans, between small and large
syndicates, between high and low concentration syndicates, and between high and low
13 The matching process is checked to ensure that the borrower names are identical on Dealscan and Compustat.
15

retention syndicates. In particular, the mean all-in-spread drawn is relatively higher
for sole lenders and syndicated loans with smaller size, higher concentration, or
higher retention, consistent with our hypothesis. The mean commitment fee on 413
revolvers does not significantly differ between sole and syndicated revolvers.
However, within syndicated revolvers, the mean commitment fee is significantly
larger for those with fewer lenders, higher concentration and larger retention.
Table 3 provides summary statistics on the use of covenants in our sample. The
current focus is on 5 covenant types (financial covenants, material restrictions, sweep
covenants, security requirements, and voting right covenants). Financial covenants
typically set a minimum or maximum limit on various financial ratios, for instance,
fixed charge coverage, interest coverage, leverage ratio, debt to cash flow, current
ratio, etc. Dealscan records covenant information of 13 financial ratios. We consider
facilities with restriction on at least two financial ratios as having a financial
covenant. Table 3 suggests a popular use of financial covenants in our sample; 84%
of our sample facilities include at least two financial covenants. A material restriction
is specified in a loan contract to limit dividend payments. While Dealscan also reports
specific limits on the percentage of excess cash flows and net income that can be paid
out as dividends, the information seems to be missing for most of our sample
observations.14 Therefore we focus on the material restriction and observe that 74% of
our sample facilities have a material restriction in their contracts. Sweep covenants
specify the percentage of loan that a borrower must repay from excess asset sales,
debt issues, equity issues, and excess cash flows. The dummy for sweep covenants is
coded 1 if a facility has at least one non-zero sweep, and 0 otherwise. Table 3 shows
that 47% of our sample facilities have at least one non-zero sweep. Sweep covenants
appear to be less common than financial and dividend covenants. Security covenants
specify whether and how a loan is secured by borrower assets. A binary variable is
coded 1 if a loan is secured and zero otherwise. 58% of our sample facilities are
secured loans. Voting rights covenants specify the percentage of lenders whose
consent is required for the amendment of contract terms. Typically lenders’ consent is
separately sought for loan tenor amendment, collateral release, and non-material
amendment. In fact, Dealscan records voting right information in terms of three
percentage figures to reflect these three contractual aspects. We code the voting right 14 Only 33 out of 928 observations have Dealscan information on the presence of dividend covenants.
16

dummy as 1 when a facility has at least two voting right percentages specified in the
contract, and 0 otherwise. 85% of our sample facilities have at least two voting rights
covenants. We also construct two covenant indexes using the counting method. The
first, Covenant Index All, is the count of all covenants included in a loan contract. As
we focus on 5 covenant types, the value for Covenant Index All is an integer between
0 and 5. We observe that all our sample facilities have at least one type of covenant
and on average have they have 3.77 types of covenants in their contracts. This is
unsurprising given that private loan contracts tend to be considerably restrictive in the
use of loan covenants. The second index, Covenant Index 4, focuses on non-collateral
covenants. This index hence takes an integer value between 0 and 4.
Table 4 presents the statistics for these covenant dummies and indexes in
different sub-samples. Our hypothesis predicts a difference in covenant usage across
different syndicate structures. However, we only observe significant differences for
Secured and Covenant Index All based on t-tests for population means.
5. Preliminary Results
5.1. Loan yield spreads
We apply Ordinary Least Squares to estimate Eq.1 (Table 5). Our dependent
variable is the facility’s all-in-spread drawn (AISD).
We account for a possible non-linear relationship between AISD and other size
variables by taking the natural logarithm of Syndicate Size, Concentration, Assets, and
FacSize. The output shows support for such non-linearity as the estimated coefficients
are more significant relative to a linear specification. In our regression we also add
dummy variables to control for year and industry effects. Due to space constraints the
estimated effects of these dummy variables are not reported. The estimated positive
coefficients on Ln(Concentration) and Retention support our hypothesis that
syndicates with higher concentration and greater retention by the lead bank help to
minimize agency costs among lenders, hence receive higher AISD paid by the
borrower. In contrast, the positive coefficient on Ln(Syndicate Size) suggests
otherwise. The positive sign on Ln(Syndicate Size) could be because our loan sample
is biased towards large and medium-sized borrowers. As these borrowers face
relatively less severe asymmetric information problem, there is less need for
17
monitoring. Consequently, the free-riding issue that arises when more lenders
participate in the syndicate may be proved less detrimental. Hence we may not
observe the negative relationship between syndicate size and yield spreads as
predicted by this delegated monitoring viewpoint. On the other hand, the observed
positive relationship suggests that syndicate size may signal higher loan risk and the
more lenders reflect risk sharing. The estimated positive relationship between loan
yield spreads and syndicate size confirms Hao (2003)’s findings but disagrees with
Coleman, Esho and Sharpe (2002). The former measures syndicate size as the number
of lead banks, while the latter controls for non-linearity using a reciprocal form of
syndicate size.15 A caveat in Coleman, Esho and Sharpe (2002)’s study, however, is
the omission of loan’s secured status from their yield spread regression due to lack of
coverage in the Securities Data Corporation database. This may induce some
regression biases given a strong link between yield spreads and collateral found in
previous studies (Berger and Udell, 1990; Angbazo, Mei and Saunders, 1998;
Strahan, 1999; Jimenez and Saurina, 2004). The estimated coefficients on most of the
control variables are significant and have the predicted signs, except that PPE,
Ln(FacSize), and FacRatio are insignificant and MTB has a significant incorrect sign.
A negative sign on MTB has also been observed in Coleman, Esho and Sharpe
(2002)’s study which they attributed to a high correlation between MTB and the
amount of leverage. Table 5 shows that the estimated coefficients tend to be more
significant for the sample with known secured status than for the full sample.
Our hypothesis also predicts that the value of delegated monitoring is relatively
greater for borrowers with higher risk of default and more severe information
problems. Hence the yield spread equation is re-estimated for various sub-samples
(Table 6). The sample is partitioned according to borrower z-score, leverage ratio, and
fixed asset ratio. The former two criteria capture the level of default risk, whereas the
last one is a proxy for borrower asset tangibility. Tangible assets represent a source of
verifiable information, hence mitigate the severity of informational asymmetry. For
each of these grouping criteria, the entire sample will be classified into quartiles. To
save space we only report the statistics for the highest and lowest quartiles. We also
re-estimate the equation separately for facilities whose borrowers have a public debt
15 When we replace Ln(Syndicate Size) in our equation with (Syndicate Size)-1, we still find a positive relationship between loan spreads and syndicate size.
18

rating at the time the deal is launched and facilities whose borrowers are unrated.
Unrated borrowers face more severe information problems, hence there should be
stronger support for our hypothesis within the unrated sub-group.
The coefficient on Retention is insignificant in many instances, while
Ln(Syndicate Size) and Ln(Concentration) appear to be relatively more significant
determinants of AISD for borrowers in the lowest z-score, highest leverage, lowest
tangibility quartiles, as well as the unrated sub-group. The only exception is the
estimated coefficients for the highest and lowest MTB quartiles. The coefficients on
Ln(Syndicate Size) and Ln(Concentration) are significant for the lowest MTB quartile,
i.e. firms with the lowest growth prospect, and insignificant for the highest MTB
quartile, i.e. firms with the highest growth prospect. This is somewhat predictable
given the significant incorrect sign estimated for MTB in Table 5. The positive sign on
Ln(Concentration) estimated for the lowest z-score, highest leverage, lowest
tangibility quartiles supports our hypothesis. Borrowers with these attributes seem to
place more value on syndicate structure that creates more incentives for lenders to
make monitoring efforts. The positive sign on Ln(Syndicate Size) again contradicts
our hypothesis and implies a correlation between syndicate size and loan risk.
The insignificance of Retention in the sub-group estimation output may result
from a high correlation of 0.96 between Retention and Ln(Concentration). In
particular, Retention is only significantly positive for sub-samples where borrowers
have a public debt rating or high asset tangibility. This result suggests that borrowers
with less opaque information pay relatively higher yields when the lead bank retains a
greater loan share. In other words, these borrowers do pay a premium for an
additional amount of loan retained by the lead bank as predicted by our hypothesis.
On the contrary, borrowers without a public debt rating and low tangibility may find
the lead bank’s reputation more important than its retention to the success of the
syndicated loan. Given that the lead bank’s reputation may substitute for the amount
of loan it has to hold, we plan to construct a proxy for the lead bank’s reputation. For
instance, this reputation proxy can be calculated as the amount of loans led by the lead
bank in the year preceding the facility year relative to the total sample amount of
loans in the year preceding the facility year. We may utilise the large sample
consisting of 2,936 facilities to construct this reputation variable. If the substitutability
19
between lead bank’s reputation and retention is valid, we should observe a negative
sign on the interaction term of these two variables.
5.2. Security as a covenant
For this pilot study, we choose to focus on the loan’s secured status as opposed
to other types of covenants. The reason for this is because our descriptive statistics in
Table 4 suggest a relationship between the presence of collateral and syndicate
structure. Our regression aims to show that the direction of this relationship provides
support for our covenant hypothesis. While previous studies mostly consider the
presence of collateral as an exogenous determinant of syndicate structure, our
methodology will reflect that the loan’s secured status and its syndicate structure can
simultaneously impact on each other. Hence, we initially examine how a collateral
decision may depend on different syndicate structures (Table 7). We estimate Eq.6
with secured status as the dependent variable. In the first specification, we apply a
probit estimation since the loan’s secured status is a binary variable. In the second
specification, we take into account the simultaneity between secured status and loan
spreads as argued by Bradley and Roberts (2004) and Booth and Booth (2005). The
second specification is estimated using two-stage-least squares. Comparing output for
two model specifications, we find a significantly positive rather than negative
relationship between AISD and Secured. This contradicts the findings from the two
studies above, but confirms that collateral is more often used in loans made to riskier
borrowers as concluded by Berger and Udell (1990) and Strahan (1999) among
others. By controlling for the endogeneity of loan spreads and secured status, notably,
we find a significant impact syndicate structures have on the collateral decision. The
direction of this impact strongly supports our covenant hypothesis, which predicts
collateral is more likely to be pledged in syndicates with more lenders, lower
concentration, and lower retention. This is reflected in the observed positive
coefficient on Ln(Syndicate Size), and negative coefficients on Ln(Concentration) and
Retention (Table 7 – Panel B). In other words, collateral serves to reduce the ex-post
moral hazard problem between the borrower and the lending syndicate. Failure to
account for the simultaneity problem results in the syndicate structure variables being
insignificant (Table 7 – Panel A).
20
5.3. Remarks on the preliminary results
The evidence suggests that some borrowers do pay more when the syndicate is
more concentrated and when the lead bank retains a greater amount. This supports our
argument that such syndicate structures benefit borrowing firms by reducing the
agency costs among syndicate lenders. The estimated relationship between syndicate
size and spreads however suggests that borrowers pay more for larger syndicates. This
result may imply that the lead arranger is inclined to form larger syndicates when
lending to riskier borrowers. A risk-averse lead arranger may be unwilling to reduce
syndicate size and hence bear a larger burden of risk in order to earn better yields. Our
next step is to utilise a panel of loan data which allows a better control over
unobserved borrower risk aspects.
Our regressions on loan secured status also suggest a significant link between
the collateral decision and syndicate structure. The estimated relationships support the
argument that syndicate structures affect the decision whether to secure a loan in the
presence of moral hazard. We find it is essential to control for the interdependence
between secured status and loan yield spreads. As a by-product of this specification,
we estimate that secured loans are associated with higher yields, which also suggests
the use of collateral for alleviating the moral hazard problem.
6. Contributions and Implications
By focusing on three dimensions of syndicate structure (the number of lenders,
syndicate concentration, and the lead arranger’s retention), this study makes a number
of academic contributions. First, it explicitly resolves the benefits of different
syndicate structures reflected in loan pricing. Second, the study is worthwhile because
it considers new ex ante determinants of syndicate structure including loan covenants
and bank risk. Third, the methodology is extended to address the potential
interdependence between nonprice contract terms and syndicate structure, which
should then be taken into consideration in future syndicated loan studies.
The study may also raise a number of implications for both corporate borrowers
and regulators. The interdependence between nonprice contract terms and syndicate
structure suggests that firms may be able to maximise their benefit from borrowing by
simultaneously contracting on loan terms and loan syndicate structure. Furthermore,
21

this study may unambiguously illustrate how changes in bank risk are associated with
changes in syndicated lending behaviour, thus help regulators to foresee consequences
of their regulatory guidelines.
(Dennis and Mullineaux, 2000) (Dennis, Nandy and Sharpe, 2000) (Diamond, 1984) (Fama, 1985) (Chemmanur and Fulghieri,
1994) (Esty and Megginson, 2003) (Lee and Mullineaux, 2004) (Panyagometh and Roberts, 2002) (Strahan, 1999) (Hao, 2003)
(Coleman, Esho and Sharpe, 2002) (Bester, 1985) (Chan and Kanatas, 1985) (Besanko and Thakor, 1987) (Flannery, 1986)
(Stohs and Mauer, 1996) (Berger and Udell, 1990) (Angbazo, Mei and Saunders, 1998) (Chen, Yeo and Ho, 1998) (Jimenez and
Saurina, 2004) (Barclay and Smith Jr, 1995) (Correia, 2005) (Bradley and Roberts, 2004) (Hubbard, Kuttner and Palia, 2002)
(Cook, Schellhorn and Spellman, 2002) (Jones, Lang and Nigro, 2000) (Thakor and Udell, 1987) (Shockley and Thakor, 1997)
(Ergungor, 2001) (Thomas and Wang, 2004) (Altman and Suggitt, 2000) (Dealscan, 2006) (Sufi, 2005) (Booth and Booth, 2005)
22

References Altman, E. and H. Suggitt (2000). "Default Rates in the Syndicated Bank Loan
Market: A Mortality Analysis." Journal of Banking and Finance 24(1-2): 229-253.
Angbazo, L., J. Mei and A. Saunders (1998). "Credit Spreads in the Market for Highly Leveraged Transaction Loans." Journal of Banking and Finance 22(10-11): 1249-1282.
Barclay, M. J. and C. W. Smith Jr (1995). "The Maturity Structure of Corporate Debt." Journal of Finance 50(2): 609-631.
Berger, A. and G. Udell (1990). "Collateral, Loan Quality and Bank Risk." Journal of Monetary Economics 25(1): 21-42.
Besanko, D. and A. Thakor (1987). "Competitive Equilibrium in the Credit Market under Asymmetric Information." Journal of Economic Theory 42(1): 167-182.
Bester, H. (1985). "Screening and Rationing in Credit Markets with Imperfect Information." American Economic Review 75(4): 850-855.
Booth, J. and L. Booth (2005). "Loan Collateral Decisions and Corporate Borrowing Costs." Journal of Money, Credit, and Banking 38(1): 67-90.
Bradley, M. and M. Roberts (2004). "The Structure and Pricing of Corporate Debt Covenants." Fuqua School of Business, Duke University. Working Paper (March 11, 2004). <http://ssrn.com/abstract=466240>.
Chan, Y. S. and G. Kanatas (1985). "Asymmetric Valuations and the Role of Collateral in Loan Agreements." Journal of Money, Credit, and Banking 17(1): 84-95.
Chemmanur, T. and P. Fulghieri (1994). "Reputation. Renegotiation, and the Choice between Bank Loans and Publicly Traded Debt." Review of Financial Studies 7(3): 475-506.
Chen, S. S., G. Yeo and K. W. Ho (1998). "Further Evidence on the Determinants of Secured Versus Unsecured Loans." Journal of Business Finance and Accounting 25(3-4): 0306-686X.
Coleman, A., N. Esho and I. Sharpe (2002). "Do Bank Characteristics Influence Loan Contract Terms?" Australian Prudential Regulatory Authority. Working Paper 2002-01 (February 2002).
Cook, D., C. Schellhorn and L. Spellman (2002). "Lender Certification Premiums." Journal of Banking and Finance 27(8): 1561-1579.
Correia, M. (2005). "The Determinants of the Choice of Maturity and Restrictive Covenants in Debt Contracts: A Panel Data Approach." Loughborough University. Economic Research Paper 05-03 (May 2005).
Dealscan (2006). Loan Pricing Corporation. Dennis, S. and D. Mullineaux (2000). "Syndicated Loans." Journal of Financial
Intermediation 9(4): 404-426. Dennis, S., D. Nandy and I. Sharpe (2000). "The Determinants of Contract Terms in
Bank Revolving Credit Agreements." Journal of Financial and Quantitative Analysis 35(1): 87-110.
Diamond, D. (1984). "Financial Intermediation and Delegated Monitoring." Review of Economic Studies 51(3): 393-414.
Ergungor, D. (2001). "Theory of Bank Loan Commitments." Federal Reserve Bank of Cleveland - Economic Review 37(3): 1-28.
Esty, B. and W. Megginson (2003). "Creditor Rights, Enforcement, and Debt Ownership Structure: Evidence from the Global Syndicated Loan Market." Journal of Financial and Quantitative Analysis 38(1): 37-59.
23

Fama, E. (1985). "What's Different About Banks?" Journal of Monetary Economics 15(1): 29-39.
Flannery, M. (1986). "Asymmetric Information and Risky Debt Maturity Choice." Journal of Finance 41(1): 19-37.
Hao, L. (2003). "Bank Effects and the Determinants of Loan Yield Spreads." Schulich School of Business. Working Paper (September 2003).
Hubbard, R., K. Kuttner and D. Palia (2002). "Are There Bank Effects in Borrowers' Cost of Funds? Evidence from a Matched Sample of Borrowers and Banks." Journal of Business 75(4): 559-581.
Jimenez, G. and J. Saurina (2004). "Collateral, Type of Lender and Relationship Banking as Determinants of Credit Risk." Journal of Banking & Finance 28(9): 2191-2212.
Jones, J., W. Lang and P. Nigro (2000). "Recent Trends in Bank Loan Syndications: Evidence for 1995 to 1999." Office of the Comptroller of the Currency. Economic and Policy Analysis Working Paper 2000-10 (December 2000).
Lee, S. and D. Mullineaux (2004). "Monitoring, Financial Distress and the Structure of Commercial Lending Syndicates." Financial Management 33(3): 107-130.
Panyagometh, K. and G. Roberts (2002). "Private Information, Agency Problems and Determinants of Loan Syndications: Evidence Form 1987-1999." Schulich School of Business, York University. Working Paper (April 25, 2002). <http://ssrn.com/abstract=310003>.
Shockley, R. and A. Thakor (1997). "Bank Loan Commitment Contracts: Data, Theory, and Tests." Journal of Money, Credit, and Banking 29(4): 517-534.
Stohs, M. and D. Mauer (1996). "The Determinants of Corporate Debt Maturity Structure." Journal of Business 69(3): 279-312.
Strahan, P. (1999). "Borrower Risk and the Price and Nonprice Terms of Bank Loans." Federal Reserve Bank of New York. Staff Report 90 (October 1999).
Sufi, A. (2005). "Agency and Renegotiation in Corporate Finance: Evidence from Syndicated Loans." Massachusetts Institute of Technology. Working Paper (January 26, 2005).
Thakor, A. and G. Udell (1987). "An Economic Rationale for the Pricing Structure of Bank Loan Commitments." Journal of Banking & Finance 11(2): 271-289.
Thomas, H. and Z. Wang (2004). "The Integration of Bank Syndicated Loan and Junk Bond Markets." Journal of Banking and Finance 28(2): 299-319.
24

Appendix
Predicted signs on explanatory variables
AISD regression Secured regression Syndicate Structure Syndicate Structure
Ln(Syndicate Size) - Ln(Syndicate Size) + Ln(Concentration) + Ln(Concentration) - Retention + Retention -
Loan Variables Loan Variables
Duration -/+ AISD -/+ Secured -/+ Duration -/+ Ln(FacSize) -/+ Ln(FacSize) -/+ Revolver - Revolver - FacRatio +
Borrower Variables Borrower Variables
Leverage + Leverage + SD(Earnings) + SD(Earnings) + Rated - PPE - OpCash - Ln(Assets) - Taxes + MTB + PPE - Ln(Assets) - MTB +
25

26
Table 1
Descriptive statistics: Full sample Table 1 presents the mean, median, maximum, minimum, and standard deviation of syndicate structure variables, loan and borrower characteristics, for the total loan sample.
Mean Median Maximum Minimum Std. Dev. N
Syndicate Structure
Syndicate Size 8.5463 6.0000 85.0000 1.0000 9.8657 928
Ln(Syndicate Size) 1.5296 1.7918 4.4427 0.0000 1.1838 928
Concentration 4222.2017 2000.0000 10000.0000 209.9919 3968.1256 928
Ln(Concentration) 7.8006 7.6009 9.2103 5.3471 1.1062 928
Retention (%) 46.2335 26.5350 100.0000 3.0700 37.6990 928
Loan Variables
AISD (b.p.) 134.6754 100.0000 1400.0000 15.0000 111.3483 928
ComFee 29.8632 25.0000 187.5000 2.5000 16.1161 413
Duration (years) 3.4749 3.0000 14.5000 0.0833 2.0402 928
Secured 0.5812 1.0000 1.0000 0.0000 0.4937 702
Ln(FacSize) 4.4871 4.6052 9.6158 -0.3919 1.6088 928
Revolver 0.8211 1.0000 1.0000 0.0000 0.3835 928
FacRatio 0.5665 0.3462 9.0021 0.0024 0.7760 928
Borrower Variables
Leverage 0.5751 0.5555 2.1498 0.0361 0.2446 928
SD(Earnings) 0.0474 0.0309 1.7864 0.0018 0.0811 928
Rated 0.4429 0.0000 1.0000 0.0000 0.4970 928
OpCash 0.0846 0.0892 0.4490 -1.4698 0.1167 928
Taxes 0.0287 0.0269 0.3174 -0.2082 0.0353 928
PPE 0.3439 0.2799 0.9478 0.0015 0.2362 928
Ln(Assets) 5.8238 5.8067 10.4974 0.7183 1.7598 928
MTB 1.9445 1.4974 37.4307 0.5248 1.9074 928

27
Table 2
Descriptive statistics: Sole lender versus syndicated loans
Panel A presents the mean and standard deviation of syndicate structure variables, loan and borrower characteristics, for sole-lender and syndicated loan sub-samples. Syndicated loans are further classified into above and below median based on syndicate size, concentration, and retention. Panel B presents statistics for each of these sub-groups. Differences in sub-sample means are tested using t-tests, between sole-lender and syndicated loans as well as between above and below median sub-groups. ***, **, * indicate significance at 1%, 5%, and 10% levels, respectively.
Panel A: Statistics for sole lender and syndicated loans Sole lender loans Syndicated loans Mean Std. Dev. N Mean Std. Dev. N Syndicate Structure Syndicate Size 1.0000 0.0000 280 11.8071 10.2058 648 Ln(Syndicate Size) 0.0000 0.0000 280 2.1906 0.7467 648 Concentration 10000.0000 0.0000 280 1725.6222 1367.7730 648 Ln(Concentration) 9.2103 0.0000 280 7.1914 0.7222 648 Retention (%) 100.0000 0.0000 280 23.0010 15.6405 648 Loan Variables AISD (b.p.) 193.4545*** 134.0084 280 109.2771 88.7627 648 ComFee 29.6160 14.1366 125 29.9705 16.9254 288 Duration (years) 2.9176*** 2.2505 280 3.7157 1.8941 648 Secured 0.7558*** 0.4306 217 0.5031 0.5005 485 Ln(FacSize) 3.0548*** 1.5532 280 5.1060 1.1817 648 Revolver 0.7179*** 0.4508 280 0.8657 0.3412 648 FacRatio 0.5641 0.8261 280 0.5676 0.7540 648 Borrower Variables Leverage 0.5132*** 0.2351 280 0.6018 0.2439 648 SD(Earnings) 0.0647*** 0.0774 280 0.0400 0.0815 648 Rated 0.1964*** 0.3980 280 0.5494 0.4979 648 OpCash 0.0551*** 0.1717 280 0.0973 0.0792 648 Taxes 0.0246** 0.0397 280 0.0305 0.0331 648 PPE 0.2965*** 0.2322 280 0.3643 0.2351 648 Ln(Assets) 4.5930*** 1.8075 280 6.3557 1.4454 648 MTB 2.0730 3.0138 280 1.8891 1.1339 648

28
Table 2 (Panel B)
Panel B: Statistics for syndicated loans, classified into above and below-median groups Small Syndicates Large Syndicates High Concentration Low Concentration High Retention Low Retention Mean Std. Dev. N Mean Std. Dev. N Mean Std. Dev. N Mean Std. Dev. N Mean Std. Dev. N Mean Std. Dev. N
Syndicate Structure
Syndicate Size 4.1019 1.4053 206 15.3982 10.5469 442 4.2378 3.5182 185 14.8315 10.4321 463 4.6033 3.8068 184 14.6638 10.5367 464
Ln(Syndicate Size) 1.3432 0.3862 206 2.5855 0.5069 442 1.3178 0.4475 185 2.5393 0.5236 463 1.3738 0.5044 184 2.5145 0.5553 464
Concentration 3221.6569 1338.2220 206 1028.3752 616.0278 442 3449.5691 1382.1570 185 1036.7881 439.8811 463 3374.8428 1428.4838 184 1071.6209 546.0599 464
Ln(Concentration) 8.0002 0.3867 206 6.8145 0.4977 442 8.0767 0.3635 185 6.8377 0.4884 463 8.0432 0.3986 184 6.8537 0.5132 464
Retention (%) 39.6955 14.9520 206 15.2203 8.0067 442 42.3365 15.0487 185 15.2751 6.5471 463 43.0776 14.2912 184 15.0396 6.1168 464
Loan Variables
AISD (b.p.) 146.5135*** 92.6324 206 91.9225 81.3685 442 154.2137*** 96.8621 185 91.3218 78.5201 463 150.1401*** 97.8267 184 93.0727 79.3766 464
ComFee 32.9682** 20.0421 118 27.8897 14.0629 170 33.2427** 21.0150 103 28.1486 13.8810 185 32.6445** 20.6126 109 28.3422 14.0376 179
Duration (years) 3.7743 1.7146 206 3.6883 1.9734 442 3.7856 1.7566 185 3.6877 1.9474 463 3.7649 1.7192 184 3.6961 1.9605 464
Secured 0.6585*** 0.4757 164 0.4237 0.4949 321 0.6779*** 0.4689 149 0.4256 0.4952 336 0.6897*** 0.4642 145 0.4235 0.4948 340
Ln(FacSize) 4.1576*** 0.8262 206 5.5480 1.0561 442 4.1160*** 0.8775 185 5.5015 1.0486 463 4.2059*** 0.9056 184 5.4629 1.0852 464
Revolver 0.8350 0.3721 206 0.8801 0.3252 442 0.8162** 0.3884 185 0.8855 0.3187 463 0.8424 0.3654 184 0.8750 0.3311 464
FacRatio 0.7572*** 0.9418 206 0.4792 0.6302 442 0.7593*** 0.9736 185 0.4910 0.6309 463 0.7827*** 0.9821 184 0.4823 0.6225 464
Borrower Variables
Leverage 0.5236*** 0.2142 206 0.6383 0.2485 442 0.5332*** 0.2180 185 0.6292 0.2485 463 0.5387*** 0.2192 184 0.6268 0.2489 464
SD(Earnings) 0.0550*** 0.1345 206 0.0330 0.0344 442 0.0574*** 0.1417 185 0.0330 0.0339 463 0.0564*** 0.1417 184 0.0335 0.0347 464
Rated 0.2476*** 0.4327 206 0.6900 0.4630 442 0.2541*** 0.4365 185 0.6674 0.4717 463 0.2554*** 0.4373 184 0.6659 0.4722 464
OpCash 0.1000 0.0943 206 0.0961 0.0712 442 0.0992 0.0957 185 0.0965 0.0717 463 0.1026 0.0925 184 0.0952 0.0732 464
Taxes 0.0332 0.0336 206 0.0292 0.0328 442 0.0329 0.0328 185 0.0295 0.0332 463 0.0330 0.0321 184 0.0295 0.0334 464
PPE 0.3532 0.2348 206 0.3695 0.2354 442 0.3514 0.2376 185 0.3695 0.2342 463 0.3462 0.2300 184 0.3715 0.2370 464
Ln(Assets) 5.2170*** 1.0872 206 6.8864 1.2758 442 5.2049*** 1.1676 185 6.8155 1.2808 463 5.2352*** 1.1571 184 6.8000 1.3013 464
MTB 1.8066 1.1997 206 1.9275 1.1012 442 1.7584* 1.1400 185 1.9412 1.1285 463 1.7929 1.1305 184 1.9272 1.1342 464
29
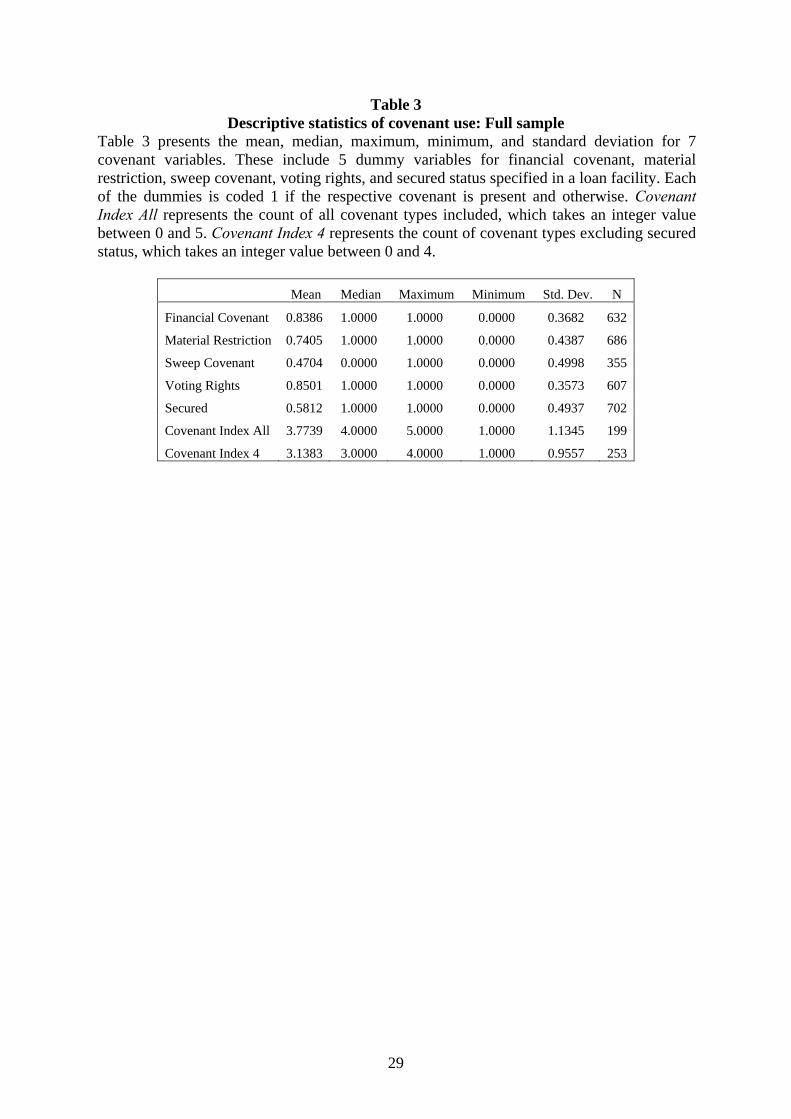
Table 3 Descriptive statistics of covenant use: Full sample
Table 3 presents the mean, median, maximum, minimum, and standard deviation for 7 covenant variables. These include 5 dummy variables for financial covenant, material restriction, sweep covenant, voting rights, and secured status specified in a loan facility. Each of the dummies is coded 1 if the respective covenant is present and otherwise. Covenant Index All represents the count of all covenant types included, which takes an integer value between 0 and 5. Covenant Index 4 represents the count of covenant types excluding secured status, which takes an integer value between 0 and 4.
Mean Median Maximum Minimum Std. Dev. N
Financial Covenant 0.8386 1.0000 1.0000 0.0000 0.3682 632
Material Restriction 0.7405 1.0000 1.0000 0.0000 0.4387 686
Sweep Covenant 0.4704 0.0000 1.0000 0.0000 0.4998 355
Voting Rights 0.8501 1.0000 1.0000 0.0000 0.3573 607
Secured 0.5812 1.0000 1.0000 0.0000 0.4937 702
Covenant Index All 3.7739 4.0000 5.0000 1.0000 1.1345 199
Covenant Index 4 3.1383 3.0000 4.0000 1.0000 0.9557 253

30
Table 4 Descriptive statistics of covenant use: Sub-samples
Table 4 presents the mean and standard deviation of 7 covenant variables for sub-samples. Panel A contains the statistics for the sole-lender and syndicated loan sub-samples. Panel B contains statistics for syndicated loans which are further classified into above- and below-median sub-groups based on syndicate size, concentration, and retention. Differences in sub-sample means are tested using t-tests. ***, **, * indicate significant differences at 1%, 5%, and 10% levels, respectively.
Panel A: Statistics for sole lender and syndicated loans
Sole lender loans Syndicated loans
Mean Std. Dev. N Mean Std. Dev. N
Financial Covenant 0.8238 0.3820 193 0.8451 0.3622 439
Material Restriction 0.7062 0.4566 211 0.7558 0.4301 475
Sweep Covenant 0.4608 0.5009 102 0.4743 0.5003 253
Voting Rights 0.8547 0.3533 179 0.8481 0.3593 428
Secured 0.7558*** 0.4306 217 0.5031 0.5005 485
Covenant Index All 4.0000* 1.0989 54 3.6897 1.1397 145
Covenant Index 4 3.1370 1.0317 73 3.1389 0.9261 180
Panel B: Statistics for syndicated loans, classified into above and below-median groups
Small Syndicates Large Syndicated High Concentration Low Concentration High Retention Low Retention
Mean Std. Dev. N Mean Std. Dev. N Mean Std. Dev. N Mean Std. Dev. N Mean Std. Dev. N Mean Std. Dev. N
Financial Covenant 0.8483 0.3600 145 0.8435 0.3639 294 0.8346 0.3730 127 0.8494 0.3583 312 0.8480 0.3605 125 0.8439 0.3635 314
Material Restriction 0.7290 0.4459 155 0.7688 0.4223 320 0.7391 0.4407 138 0.7626 0.4261 337 0.7721 0.4211 136 0.7493 0.4341 339
Sweep Covenant 0.5000 0.5032 78 0.4629 0.5000 175 0.5286 0.5028 70 0.4536 0.4992 183 0.5507 0.5011 69 0.4457 0.4984 184
Voting Rights 0.8671 0.3406 143 0.8386 0.3685 285 0.8605 0.3479 129 0.8428 0.3646 299 0.8525 0.3561 122 0.8464 0.3612 306
Secured 0.6585*** 0.4757 164 0.4237*** 0.4949 321 0.6779 0.4689 149 0.4256*** 0.4952 336 0.6897 0.4642 145 0.4235 0.4948 340
Covenant Index All 3.9643** 1.2205 56 3.5169*** 1.0565 89 4.0588 1.1029 51 3.4894*** 1.1144 94 4.0600 1.1141 50 3.4947 1.1097 95
Covenant Index 4 3.1935 0.9381 62 3.1102 0.9225 118 3.2909 0.8750 55 3.0720* 0.9434 125 3.3148 0.8865 54 3.0635 0.9359 126

31
Table 5 OLS Regression of all-in-spread drawn
Table 5 presents estimated coefficients, standard errors, t-statistics and probability from OLS regression of AISD on various independent variables. All regressions include year and industry dummies. The standard errors are White heteroskedasticity-consistent.
Ln(Syndicate Size) is the natural logarithm of the total number of lenders participating in a loan facility; Ln(Concentration) is the natural logarithm of Concentration, where Concentration is measured as the Hirschman-Herfindahl index; Retention in the percentage of facility amount held by the lead arranger; Duration is the facility’s maturity in years; Secured is a dummy variable coded 1 if the facility is secured and 0 otherwise; Ln(FacSize) is the natural logarithm of the facility amount; Revolver is a dummy variable coded 1 if the facility is a revolver and 0 if it is a term loan; FacRatio is the ratio of facility amount to the borrower’s total liabilities as of the year-end preceding the loan year; Leverage is the ratio of total liabilities to total assets; SD(Earnings) is the standard deviation in the ratio of EBITDA to total assets over 5 consecutive years preceding the loan year; Rated is the dummy variable coded 1 if the borrower has a public debt rating when the loan is signed and 0 otherwise; OpCash is the ratio of net operating cash flows to total assets; Taxes is the ratio of total income taxes to total assets; PPE is the ratio of plant, property and equipment to total assets; Ln(Assets) is the natural logarithm of the borrower’s total assets; MTB is the market-to-book ratio, measured as (Total Assets – Book Value of Common Equity + Market Value of Equity)/ Total Assets.
***, **, * indicate significance at 1%, 5%, and 10% levels, respectively.
Full Sample Observations with known secured status Variable Coefficient Std. Error t-Statistic Prob. Coefficient Std. Error t-Statistic Prob. Constant -135.6149 194.5262 -0.6972 0.4859 -365.9850** 146.3434 -2.5009 0.0126 Syndicate Structure Ln(Syndicate Size) 59.0153*** 20.2198 2.9187 0.0036 83.5229*** 14.7254 5.6720 0.0000 Ln(Concentration) 39.9760* 21.1461 1.8905 0.0590 62.3388*** 16.3949 3.8023 0.0002 Retention 0.7512*** 0.2163 3.4735 0.0005 0.7197*** 0.2349 3.0640 0.0023 Loan Variables Duration -4.0733*** 1.4332 -2.8421 0.0046 -3.1136** 1.5652 -1.9892 0.0471 Secured 59.5117*** 6.2818 9.4736 0.0000 72.3751*** 6.4275 11.2602 0.0000 Ln(FacSize) -2.4969 4.2981 -0.5809 0.5614 -5.0204 4.2542 -1.1801 0.2384 Revolver -40.9515*** 9.5207 -4.3013 0.0000 -31.0625*** 9.2565 -3.3557 0.0008 FacRatio -6.4079* 3.3500 -1.9128 0.0561 -5.8359 3.9208 -1.4885 0.1371 Borrower Variables Leverage 40.4556*** 14.5280 2.7847 0.0055 39.5910** 16.7797 2.3595 0.0186 SD(Earnings) 103.3987*** 36.4200 2.8391 0.0046 86.7335** 35.9830 2.4104 0.0162 Rated -8.2162 5.5535 -1.4795 0.1394 -8.1126 6.6844 -1.2137 0.2253 OpCash -46.7218* 26.9274 -1.7351 0.0831 -67.6260** 27.4456 -2.4640 0.0140 Taxes -203.0309*** 74.5786 -2.7224 0.0066 -169.1029** 74.5658 -2.2678 0.0237 PPE 6.1602 14.0713 0.4378 0.6616 -4.7204 13.4552 -0.3508 0.7258 Ln(Assets) -20.7624*** 3.7377 -5.5548 0.0000 -17.1030*** 4.2380 -4.0357 0.0001 MTB -3.5995** 1.5119 -2.3807 0.0175 -3.2892* 1.7318 -1.8993 0.0580 Adjusted R-squared 0.5193 0.5252 N 928 702

32
Table 6 OLS Regression of all-in-spread drawn for sub-samples
Table 6 presents estimated coefficients and standard errors from OLS regression of AISD on various independent variables for several sub-samples. The standard errors are White heteroskedasticity-consistent and reported below the coefficients. The sample is partitioned into quartiles according to borrower z-score, leverage ratio, and PPE ratio. The sample is also classified into rated and unrated borrowers. To save space we only report the output for the highest and lowest quartiles.
Ln(Syndicate Size) is the natural logarithm of the total number of lenders participating in a loan facility; Ln(Concentration) is the natural logarithm of Concentration, where Concentration is measured as the Hirschman-Herfindahl index; Retention in the percentage of facility amount held by the lead arranger; Duration is the facility’s maturity in years; Secured is a dummy variable coded 1 if the facility is secured and 0 otherwise; Ln(FacSize) is the natural logarithm of the facility amount; Revolver is a dummy variable coded 1 if the facility is a revolver and 0 if it is a term loan; FacRatio is the ratio of facility amount to the borrower’s total liabilities as of the year-end preceding the loan year; Leverage is the ratio of total liabilities to total assets; SD(Earnings) is the standard deviation in the ratio of EBITDA to total assets over 5 consecutive years preceding the loan year; Rated is the dummy variable coded 1 if the borrower has a public debt rating when the loan is signed and 0 otherwise; OpCash is the ratio of net operating cash flows to total assets; Taxes is the ratio of total income taxes to total assets; PPE is the ratio of plant, property and equipment to total assets; Ln(Assets) is the natural logarithm of the borrower’s total assets; MTB is the market-to-book ratio, measured as (Total Assets – Book Value of Common Equity + Market Value of Equity)/ Total Assets.
***, **, * indicate significance at 1%, 5%, and 10% levels, respectively.
Lowest z-score Highest z-score Highest MTB Lowest MTB Highest Leverage Lowest Leverage Unrated Rated Lowest PPE Highest PPE Constant -875.7179* 199.1151 637.4818* -616.0897* -542.3619 -288.4700 -1013.8997** -218.7418 -1461.2419*** 240.5151 461.1431 466.0902 372.9537 330.7674 408.6102 498.3624 429.7709 136.6870 464.3559 300.6142 Syndicate Structure Ln(Syndicate Size) 121.2983*** 9.5160 -9.1530 100.6551*** 114.9034*** 62.1831 130.2994*** 71.4164*** 181.5643*** 17.2415 45.3695 47.6819 34.7319 36.0370 27.8766 50.8745 44.8548 13.6220 49.3887 31.7303 Ln(Concentration) 125.0570** 11.2937 -41.2051 96.9383*** 90.8256** 61.1373 143.2415*** 37.3006** 193.7558*** -12.3550 50.0113 51.7266 41.5855 36.3356 40.6826 54.4124 46.6716 16.1709 49.3005 33.3588 Retention 0.2507 0.0793 0.7103 0.4454 0.8731 0.4069 0.0146 1.1266*** -0.1213 1.2885*** 0.5706 0.4692 0.5652 0.5625 1.0064 0.4465 0.2961 0.3954 0.4806 0.4143 Loan Variables Duration -9.2831* -2.7992 -8.4547* -5.0437 -10.6533* -2.3046 -7.3566*** -1.7288 -7.2547 -1.9914 5.2715 2.5323 4.5942 3.5856 5.5963 2.4410 2.5024 1.5671 4.6046 2.2597 Secured 86.9250*** 41.2124*** 29.8169 79.8482*** 61.5069*** 46.8968*** 63.7083 88.4092*** 54.5499*** 93.7102*** 20.8580 12.2712 18.0957 13.3765 15.4337 9.6819 7.3080 11.9992 12.7790 12.3226 Ln(FacSize) -1.3413 1.4323 -19.5170** -1.0444 -2.8406 -5.6066 3.5879 -23.1356*** -2.4727 -0.8115 11.9560 8.9009 9.1221 11.5659 10.9669 9.0974 7.2009 6.8858 9.2518 7.8817 Revolver -29.0304 -29.3029 -10.5506 -48.1435** -29.8943* -29.1089** -34.8785** -57.1798*** -26.4373 -46.4045*** 22.4520 17.9697 31.8095 21.4540 15.2458 14.9865 13.6351 10.9198 19.4593 14.4852 FacRatio -31.2806 -4.3915 -2.7487 9.7071 -50.7362 -3.8842 -7.6593 8.9055 -9.7134 2.0267 27.0548 5.2086 5.0309 10.8773 40.0716 6.0232 4.8486 12.6052 6.6158 6.5323
(continued on next page)

33
Table 6 (continued)
Lowest z-score Highest z-score Highest MTB Lowest MTB Highest Leverage Lowest Leverage Unrated Rated Lowest PPE Highest PPE Borrower Variables Leverage 45.3931* 3.0860 65.2547 131.5423** 34.4692** 8.2609 60.0890* 2.3781 84.1234* 56.6757* (26.6239) (20.1946) (45.9898) (54.7970) (16.7139) (59.8864) (34.1268) (14.5204) (48.0440) (30.7055) SD(Earnings) 338.7124* -81.7180 253.8355 95.9570** 93.9981** -94.1394 82.1137** 149.7298 67.6971* 117.7038 (199.4873) (86.5711) (239.2861) (41.5781) (37.3262) (97.5393) (36.6544) (119.3796) (39.4364) (144.7407) Rated 1.0172 -1.4916 -14.5021 -23.2743 -7.4513 0.7121 - - -15.5420 -7.7081 (18.1957) (11.0141) (14.0039) (17.9980) (21.9211) (11.0900) (19.5822) (13.4883) OpCash -114.4279 -10.4944 -11.5657 -82.5149 -111.2708 -55.6841 -54.0709* (1.4372) -8.0012 -221.0855** (86.5578) (33.9033) (41.4267) (115.8293) (82.6150) (41.4012) (32.4421) 58.4171 (33.3773) (84.6568) Taxes -45.4618 -258.2561* -344.3068*** -282.0119 -307.5523** -218.5463** -251.0095** -64.3479 -305.1103** -348.2431 (207.2495) (148.5556) (124.9086) (171.1312) (155.2756) (112.2219) (103.8966) (97.2044) (119.9176) (219.4512) PPE -8.3869 -15.4527 -28.3852 36.2231 -17.4900 -2.5156 -9.4697 -0.8353 165.4282 -13.2966 (40.4777) (23.1139) (25.8069) (28.5820) (26.5638) (25.0911) (19.7623) (14.6488) (360.4902) (52.9008) Ln(Assets) -18.0355 -30.2502*** -17.7128** -17.2202 -28.4637 -24.3117*** -30.5982*** 2.1882** -32.5829** -10.4619* (14.2209) (7.3260) (8.2865) (8.6237) (18.5568) (8.2654) (6.1890) (6.1638) (9.2721) (5.8664) MTB -32.9953* 1.6861 -4.4150 -120.6430** -7.6511* 0.9372 -3.0493 -5.8980 -3.0989* -18.4245* (19.2028) (1.3563) (5.2556) (48.1272) (4.3307) (1.8953) (2.0763) (2.7326) (1.8365) (9.3928) Adjusted R-squared 0.3512 0.5312 0.3639 0.4985 0.3458 0.5722 0.3901 0.6061 0.3492 0.6699 N 172 168 168 174 188 189 416 286 196 163
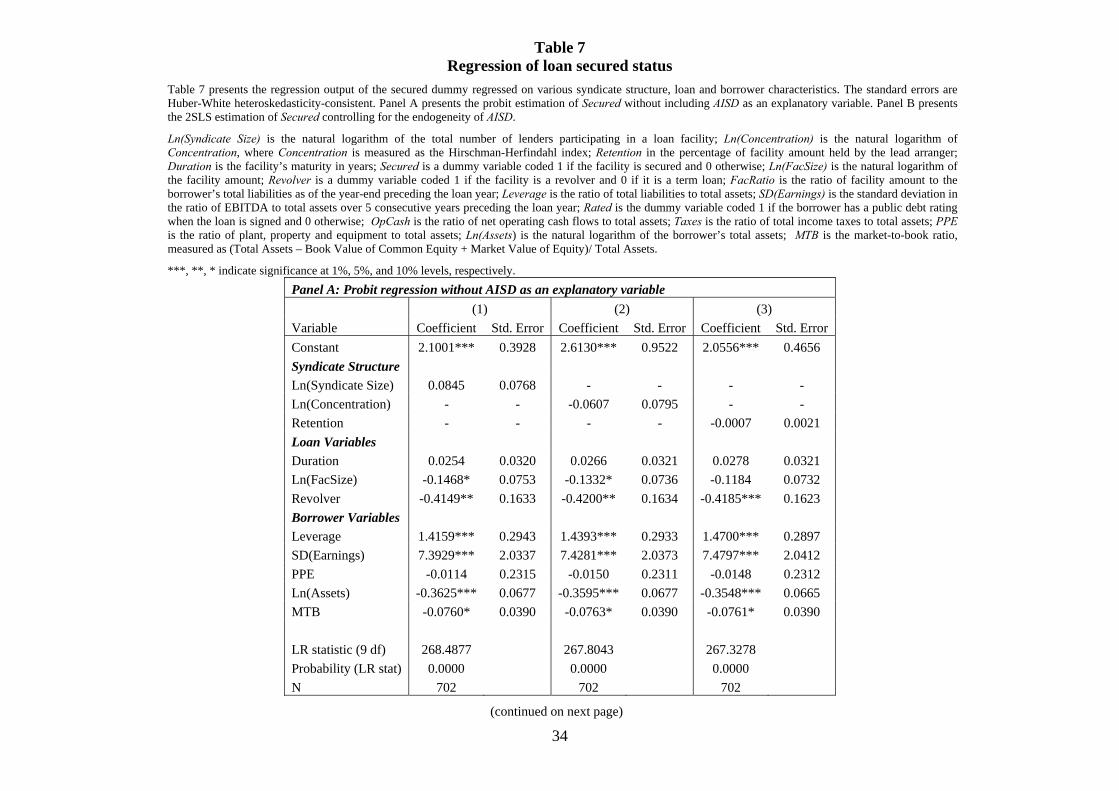
34
Table 7 Regression of loan secured status
Table 7 presents the regression output of the secured dummy regressed on various syndicate structure, loan and borrower characteristics. The standard errors are Huber-White heteroskedasticity-consistent. Panel A presents the probit estimation of Secured without including AISD as an explanatory variable. Panel B presents the 2SLS estimation of Secured controlling for the endogeneity of AISD.
Ln(Syndicate Size) is the natural logarithm of the total number of lenders participating in a loan facility; Ln(Concentration) is the natural logarithm of Concentration, where Concentration is measured as the Hirschman-Herfindahl index; Retention in the percentage of facility amount held by the lead arranger; Duration is the facility’s maturity in years; Secured is a dummy variable coded 1 if the facility is secured and 0 otherwise; Ln(FacSize) is the natural logarithm of the facility amount; Revolver is a dummy variable coded 1 if the facility is a revolver and 0 if it is a term loan; FacRatio is the ratio of facility amount to the borrower’s total liabilities as of the year-end preceding the loan year; Leverage is the ratio of total liabilities to total assets; SD(Earnings) is the standard deviation in the ratio of EBITDA to total assets over 5 consecutive years preceding the loan year; Rated is the dummy variable coded 1 if the borrower has a public debt rating when the loan is signed and 0 otherwise; OpCash is the ratio of net operating cash flows to total assets; Taxes is the ratio of total income taxes to total assets; PPE is the ratio of plant, property and equipment to total assets; Ln(Assets) is the natural logarithm of the borrower’s total assets; MTB is the market-to-book ratio, measured as (Total Assets – Book Value of Common Equity + Market Value of Equity)/ Total Assets.
***, **, * indicate significance at 1%, 5%, and 10% levels, respectively. Panel A: Probit regression without AISD as an explanatory variable (1) (2) (3) Variable Coefficient Std. Error Coefficient Std. Error Coefficient Std. Error Constant 2.1001*** 0.3928 2.6130*** 0.9522 2.0556*** 0.4656 Syndicate Structure Ln(Syndicate Size) 0.0845 0.0768 - - - - Ln(Concentration) - - -0.0607 0.0795 - - Retention - - - - -0.0007 0.0021 Loan Variables Duration 0.0254 0.0320 0.0266 0.0321 0.0278 0.0321 Ln(FacSize) -0.1468* 0.0753 -0.1332* 0.0736 -0.1184 0.0732 Revolver -0.4149** 0.1633 -0.4200** 0.1634 -0.4185*** 0.1623 Borrower Variables Leverage 1.4159*** 0.2943 1.4393*** 0.2933 1.4700*** 0.2897 SD(Earnings) 7.3929*** 2.0337 7.4281*** 2.0373 7.4797*** 2.0412 PPE -0.0114 0.2315 -0.0150 0.2311 -0.0148 0.2312 Ln(Assets) -0.3625*** 0.0677 -0.3595*** 0.0677 -0.3548*** 0.0665 MTB -0.0760* 0.0390 -0.0763* 0.0390 -0.0761* 0.0390 LR statistic (9 df) 268.4877 267.8043 267.3278 Probability (LR stat) 0.0000 0.0000 0.0000 N 702 702 702
(continued on next page)
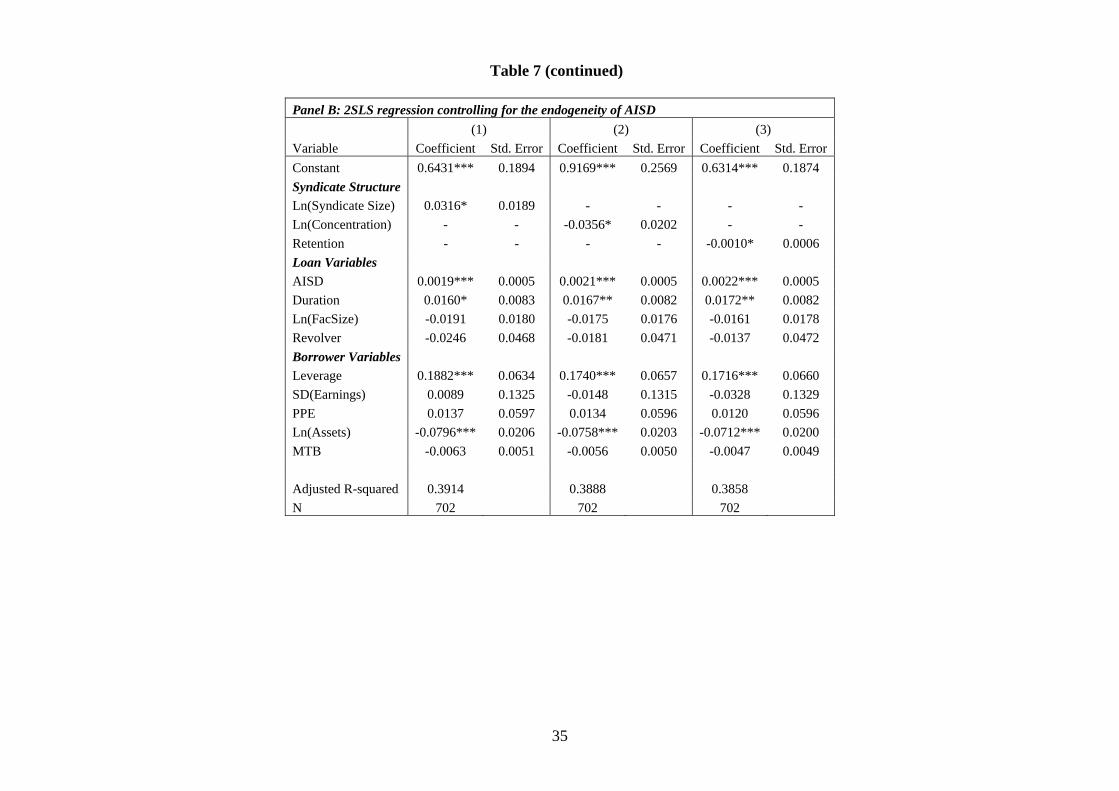
35
Table 7 (continued)
Panel B: 2SLS regression controlling for the endogeneity of AISD (1) (2) (3) Variable Coefficient Std. Error Coefficient Std. Error Coefficient Std. Error Constant 0.6431*** 0.1894 0.9169*** 0.2569 0.6314*** 0.1874 Syndicate Structure Ln(Syndicate Size) 0.0316* 0.0189 - - - - Ln(Concentration) - - -0.0356* 0.0202 - - Retention - - - - -0.0010* 0.0006 Loan Variables AISD 0.0019*** 0.0005 0.0021*** 0.0005 0.0022*** 0.0005 Duration 0.0160* 0.0083 0.0167** 0.0082 0.0172** 0.0082 Ln(FacSize) -0.0191 0.0180 -0.0175 0.0176 -0.0161 0.0178 Revolver -0.0246 0.0468 -0.0181 0.0471 -0.0137 0.0472 Borrower Variables Leverage 0.1882*** 0.0634 0.1740*** 0.0657 0.1716*** 0.0660 SD(Earnings) 0.0089 0.1325 -0.0148 0.1315 -0.0328 0.1329 PPE 0.0137 0.0597 0.0134 0.0596 0.0120 0.0596 Ln(Assets) -0.0796*** 0.0206 -0.0758*** 0.0203 -0.0712*** 0.0200 MTB -0.0063 0.0051 -0.0056 0.0050 -0.0047 0.0049 Adjusted R-squared 0.3914 0.3888 0.3858 N 702 702 702
Related Documents