©notice This material is copyright by visiongain. It is against the law to reproduce any of this material without the prior written agreement of visiongain. You cannot photocopy, fax, download to database or duplicate in any other way any of the material contained in this report. Each purchase and single copy is for personal use only. LNG YEARBOOK 2015: The Definitive Reference Guide to the Liquefied Natural Gas Infrastructure Market 2015-2025 Capex on Large-Scale Onshore Liquefaction & Regasification, Floating LNG (FLNG), Small-Scale LNG and LNG Carriers

LNG Yearbook 2015 - The Definitive Reference Guide to the Liquefied Natural Gas Infrastructure Market 2015-2025: Capex on Large-Scale Onshore Liquefaction & Regasification, Floating
Aug 13, 2015
Welcome message from author
This document is posted to help you gain knowledge. Please leave a comment to let me know what you think about it! Share it to your friends and learn new things together.
Transcript
©noticeThis material is copyright by visiongain. It is against the law to reproduce any of this material without the prior written agreement of visiongain. You cannot photocopy, fax, download to database or duplicate in any other way any of the material contained in this report. Each purchase and single copy is for personal use only.
LNG Yearbook 2015: The Definitive reference Guide to the Liquefied Natural
Gas Infrastructure Market 2015-2025Capex on Large-Scale Onshore Liquefaction & Regasification,
Floating LNG (FLNG), Small-Scale LNG and LNG Carriers
www.visiongain.com
Contents 1. Report Overview 1.1 LNG Yearbook 2015: The Definitive Reference Guide to Liquefied Natural Gas (LNG): Infrastructure and Market
Forecast 2015-2025: Capex on Large-Scale Onshore Liquefaction & Regasification, LNG Carriers, Small-Scale and
Floating LNG (FLNG) Vessels
1.2 Why You Should Read This Report
1.3 Benefits of This Report
1.4 Structure of This Report
1.5 Key Questions Answered by This Analytical Report Include:
1.6 Who is This Report For?
1.7 Market Definition
1.8 Methodology
1.9 Frequently Asked Questions (FAQ)
1.10 Associated Visiongain Reports
1.11 About Visiongain
2. Introduction to the LNG Infrastructure Market 2.1 The Role and Function of LNG Infrastructure
2.1.1 The LNG Supply Chain
2.1.2 What is Natural Gas Liquefaction?
2.1.3 What is LNG Regasification?
2.1.4 Brief History of LNG Infrastructure
2.2 The Role of LNG Carriers
2.2.1 Global LNG Carrier Market Segmentation
2.2.2 History of LNG Carriers
2.2.3 LNG Carrier Technologies
2.2.4 The LNG Carrier Market Structure
2.3 The Role of FLNG
2.3.1 FLNG Market Structure Overview
2.3.2 FLNG Vessels
2.3.2.1 Regasification Vessels
2.3.2.2 Liquefaction Vessels
2.3.3 FLNG Technology
2.3.3.1 Brief History of FLNG
2.3.3.2 Offshore Regasification
2.3.3.3 Offshore Liquefaction
www.visiongain.com
Contents 2.3.3.4 Conversions and New Builds
2.3.4 FLNG’s Increasing Preferability
2.4 The Role of Small-Scale LNG
2.4.1 Global Small Scale LNG Market Overview
2.4.2 Global Small Scale LNG Market Segmentation
2.4.3 Small Scale LNG Submarket Categories
2.5 Introduction to LNG Market Dynamics
3. The Global LNG Market 3.1 The Global LNG Submarket Forecasts
3.2 The Global LNG Market Analysis
3.2.1 What is Shaping the Expansion of the Global LNG Trade?
3.2.1.1 Demand Side Factors
3.2.1.2 Supply-Side Drivers
3.2.1.3 Global LNG Market: Where Are We Now; Where Will We Be in 5 Years; Where Will We
Be in 10 Years?
3.2.2 Increasing Demand for Natural Gas
3.2.3 The Economics of the LNG Trade versus Movement of Natural Gas via Pipelines
3.2.4 Arbitrage Opportunity
3.2.5 Desire to Increase Energy Security
3.2.6 Unconventional Gas Reserves
3.2.7 Environmental and Climate Dimensions
3.2.8 Impact of Travel Distances
3.2.9 Key Uncertainties in the Global LNG Market
3.2.10 Oil Price Collapse Analysis and Forecast
3.2.10.1 Supply- Side Factors: Tight Oil
3.2.10.2 Supply-Side Factors: Libya
3.2.10.3 Supply-Side Factors: OPEC
3.2.10.4 Demand-Side Factors: Chinese and Indian Growth
3.2.10.5 Known Unknowns and Major Variables that Impact the Oil Price
3.2.10.6 Visiongain’s Oil Price Assumptions and Forecast
3.2.11 Oil Price and LNG Price Relationship
3.2.12 No Universal Gas Pricing Index
3.2.13 Can a Global LNG Spot Market Emerge?
3.2.14 Japan’s Fukushima Crisis and Future Energy Mix
www.visiongain.com
Contents 3.2.14.1 Tsunami and History
3.2.14.2 Capital Expenditure Analysis
3.2.14.3 Will Nuclear Power Generation Restart?
3.2.14.4 The Future of Coal Power Generation
3.2.14.5 How Has, and Will, the Japanese Economy Affect LNG Infrastructure Spending?
3.2.14.6 Liquefaction Equity Investment Indicative of Future Imports
3.2.14.7 Future Electricity Demand
3.2.14.8 Japan’s Role in the Global FLNG Market
3.2.15 Towards an Oversupplied LNG Market
4. The Global Large-Scale Onshore LNG Market 4.1 Global Large-Scale Onshore LNG Liquefaction & Regasification Market
4.2 Global Large-Scale Onshore LNG Liquefaction & Regasification Analysis
4.2.1 What Challenge Does Floating Liquefied Natural Gas Pose Onshore LNG Liquefaction Terminals?
4.2.1.1 The Economics
4.2.1.2 Regulatory/Tax Benefits and Development Timeframes
4.2.1.3 Flexibility
4.2.1.4 Overall Assessment
4.3 The Global LNG Liquefaction Market (Large-Scale Onshore) 2015-2025
4.3.1 Large-Scale Onshore LNG Liquefaction Facilities in Operation, Under Construction or Planned
4.4 The Global LNG Regasification Market (Large-Scale Onshore) 2015-2025
4.4.1 Large-Scale Regasification Terminals in Operation, Under Construction and Planned
5. The Global LNG Carrier Market 5.1 The Global LNG Carrier Market Forecast 2015-2025
5.2 Dynamics of the LNG Carrier Market
5.3 Current LNG Carrier Fleet
5.4 The LNG Carrier Market Analysis
5.4.1 LNG Carrier Market Drivers & Restraints
5.4.2 Arbitrage Opportunities and the LNG Carrier Market
5.4.3 LNG Carriers Fleet and Historical Data.
5.4.4 Charter Rates, the LNG Spot Market and LNG Carrier Demand
5.4.5 No LNG Construction Capacity Constraint
5.4.6 The Dominant Role of Liquefaction Capacity in Determining the Global LNG Carrier Market
5.4.7 The Impact of Australian Liquefaction Uncertainty on the Global LNG Carrier Market
www.visiongain.com
Contents 5.4.8 East African LNG Exports and the LNG Carrier Market
5.4.9 The Impact of North American LNG Exports on the LNG Carrier Market
5.4.10 West African Natural Gas Supply, LNG Carrier Mileage and LNG Carrier Demand
5.4.11 Norway, Russia and Ice-Class LNG Carriers
5.4.12 LNG Carrier Mileage, Routes and Future Outlook
5.4.13 How an Increase in Interregional Activity Will Affect LNG Carrier Demand
5.4.14 LNG Demand Patterns, Regasification Terminals and the Triangulation of the LNG Carrier Fleet
5.4.15 How the Replacement of LNG Vessels Will Influence the LNG Carrier Market
5.4.16 The Impact on the LNG Carrier Market of Using LNG as a Transportation Fuel
5.4.17 Environmental Factors and the LNG Carrier Market
5.4.18 LNG versus Pipeline Economics and the LNG Carrier Market
5.4.19 LNG Carrier Market Restraints
5.4.20 Geographical Limitations on Liquefaction Capacity
5.4.21 Demand Uncertainty & Volatile Gas Spot Prices
5.4.22 Liquefaction Capacity Supply Constraint
5.4.23 Qatar North Field Moratorium
5.4.24 European and Asian LNG Demand Concerns
5.4.25 Concern Regarding Sustainability of Long Term Charter Rates
5.4.26 Current LNG Carrier Order Book
5.4.27 Expansion to LNG Carrier Fleet
5.4.28 Small-Scale LNG Carriers
5.5 Mark III (T-Mark III, Mark III Flex) Containment System Market Forecast 2015-2025
5.5.1 Mark III Containment System Drivers & Restraints
5.5.2 Mark III Containment System Drivers & Restraints
5.5.3 T-Mark III LNG Carrier Orders
5.6 GTT No. 96 Containment System Market Forecast 2015-2025
5.6.1 GTT No. 96 Drivers & Restraints
5.6.2 GTT No. 96 LNG Carrier Orders
5.7 Moss Rosenberg Containment System Market Forecast 2015-2025
5.7.1 Moss Rosenberg Containment System Drivers & Restraints
5.7.2 Moss Rosenberg LNG Carrier Orders
5.8 SPB Containment System Market Forecast 2015-2025
5.8.1 SPB Rosenberg LNG Carrier Orders
5.9 The Small-Scale LNG Carrier Market Forecast 2015-2025
5.9.1 Small-Scale LNG Carriers Represent a Logical Expansion of LNG Supply Chain
5.9.2 Expanding Use of Satellite Stations
www.visiongain.com
Contents 5.9.3 Development of River-Based LNG Carriers
5.9.4 Use of Small-Scale LNG for Island Distribution
5.9.5 Expansion of LNG Bunkering
5.9.6 Small-Scale LNG Containment Technology Advantage
5.9.7 Japanese Small-Scale LNG Prospects
5.9.8 Ship-to-Ship Transfers of LNG
5.9.9 Environmental Benefits and Small-Scale LNG Carriers
5.9.10 Small-Scale LNG Carrier Market Drivers & Restraints
6. The Global FLNG Market
6.1 Global FLNG Market Forecast
6.1.1 Regional FLNG Market Forecasts
6.2 Leading National FLNG Markets 2015-2025
6.2.1 Top 10 Countries in FLNG 2015-2025
6.2.2 FLNG Market Barriers to Entry Analysis
6.3 Summary of Global FLNG Market Determinants
6.3.1 Drivers in the FLNG Market
6.3.1.1 Favourable Economics Compared to Onshore
6.3.1.2Tax/ Regulatory Benefits and Development Timeframes
6.3.1.3 Avoid Security Challenges
6.3.1.4 Monetisation of Stranded and Unused Gas
6.3.1.5 LNG versus Pipeline Economics
6.3.1.6 Economic Flexibility of LNG
6.3.1.7 Mobility of FLNG
6.3.1.8 FLNG Deployment Speed and Cost
6.3.1.9 Improvements in Subsea Technologies
6.3.1.10 Deeper Water
6.3.2 Restraints in the FLNG Market
6.3.2.1 Securing Contracts, Insurance and Project Finance
6.3.2.2 High Capital Expenditure
6.3.2.3 Shipyard Capacity
6.3.2.4 FLNG Complexity
6.3.2.5 Logistics and Extreme Weather
6.3.3 Overall FLNG Market Drivers and Restraints
6.4 FLNG Submarket Comparison and Analysis
www.visiongain.com
Contents 6.4.1 LNG FPSO Submarket Forecast 2015-2025
6.4.1.1 Market Barriers
6.4.1.2 2015 Oil Price Update
6.4.1.3 LNG FPSO Market Drivers & Restraints
6.4.1.4 LNG FPSO Projects
6.4.1.5 LNG FPSO Production Capacity Forecast 2015-2020
6.4.2 FSRU Submarket Forecast 2015-2025
6.4.2.1 FSRU Market Drivers & Restraints
6.4.2.2 FSRU Projects – Operational and Potential
6.4.2.3 FSRU Regasification Capacity Forecast 2015-2020
7. The Global Small-Scale LNG Market 7.1 Global Small Scale LNG Market Forecast 2015-2025
7.2 Global Small Scale LNG Market Analysis
7.2.1 LNG Demand Forecasts
7.2.2 Small-Scale LNG Carriers as Part of the LNG Supply Chain
7.2.3 Oil Prices and the Small Scale LNG Market
7.2.4 Global Small Scale LNG Market Drivers & Restraints
7.3 Small Scale LNG Submarkets Forecast 2015-2025
7.3.1 Small Scale Regasification Market Forecast 2015-2025
7.3.1.1 Small Scale Regasification Analysis
7.3.2 Small Scale Liquefaction Market Forecast 2015-2025
7.3.2.1 Small Scale Liquefaction Analysis
7.3.3 LNG Satellite Stations 2015-2025
7.3.3.1 Small Scale LNG Satellite Stations Analysis
7.3.4 LNG Bunkering Facilities for Vessels 2015-2025
7.3.4.1 LNG Bunkering Facilities for Vessels Analysis
7.3.5 LNG Fuelling Stations for Road Vehicles 2015-2025
7.3.5.1 LNG Fuelling Stations for Road Vehicles Analysis
8. The Australasian LNG Market 2015-2025
8.1 The Australian LNG Market 2015-2025
8.1.1 Australian Large-Scale Onshore LNG Liquefaction Market 2015-2025
8.1.1.1 Overall Drivers & Restraints on Australian LNG Liquefaction Investment
8.1.1.2 Capital Expenditure Analysis
www.visiongain.com
Contents 8.1.1.3 What Are the Prospects for Brownfield Terminal Development?
8.1.1.4 Future Outlook for Australian LNG Infrastructure
8.1.1.5 Australian LNG Liquefaction Infrastructure in Operation, Under Construction and Planned
8.1.2 The Australian FLNG Market Forecast 2015-2025
8.1.2.1 Australian FLNG Market Analysis
8.1.2.2 Prelude and Australian LNG FPSO Project Analysis
8.1.2.3 Analysis of Australia-Timor Leste Offshore Gas Dispute
8.1.2.4 Australian FLNG Political Considerations
8.1.2.5 Australian FLNG Market Drivers & Restraints
8.1.2.6 Australian FLNG Projects
8.1.3 The Australian Small Scale LNG Market Outlook
8.1.3.1 Small Scale Liquefaction Plants in Australia
8.1.3.2 LNG Fuelling Stations in Australia
8.1.3.3 LNG Bunkering Facilities in Australia
8.2 The Papua New Guinea LNG Market 2015-2025
8.2.1 Papua New Guinea LNG Liquefaction Outlook
8.2.2 Papua New Guinea FLNG Market Forecast 2015-2025
8.2.2.1 Papua New Guinea FLNG Market Analysis
8.3 The New Zealand LNG Market
8.3.1 New Zealand FLNG Market
9. The North American and Caribbean LNG Market 2015-2025 9.1 The US LNG Market 2015-2025
9.1.1 US Large-Scale Onshore LNG Liquefaction Market 2015-2025
9.1.1.1 Overall Drivers & Restraints on US LNG Liquefaction Investment
9.1.1.2 Drivers for Capital Expenditure
9.1.1.3 Restraints on Capital Expenditure
9.1.1.4 US Large-Scale Onshore LNG Liquefaction Terminal Locations
9.1.1.5 US LNG Liquefaction Infrastructure in Operation, Under Construction and Planned
9.1.2 United States FLNG Market 2015-2025 Forecast
9.1.2.1 United States FLNG Market Analysis
9.1.2.2 US LNG FPSO Project Analysis
9.1.2.3 United States FLNG Projects
9.1.2.4 United States FLNG Market Drivers and Restraints
9.1.3 US Small Scale LNG Market Forecast 2015-2025

www.visiongain.com
Contents 9.1.3.1 US Small Scale LNG Submarkets Analysis
9.1.3.2 Small Scale LNG Regasification Terminals in US
9.1.3.3 Small Scale Liquefaction Plants in US
9.1.3.4 LNG Fuelling Stations in US
9.1.3.5 LNG Satellite Stations in US
9.1.3.6 LNG Bunkering facilities in US
9.1.3.7 How Does the US Shale Gas Market affect Small-Scale LNG?
9.2 Canadian LNG Market 2015-2025
9.2.1 Canadian Large-Scale Onshore LNG Liquefaction Market 2015-2025
9.2.1.1 Overall Drivers & Restraints on Canadian LNG Liquefaction Investment
9.2.1.2 Capital Expenditure Analysis
9.2.1.3 Canadian Onshore LNG Liquefaction Projects
9.2.1.4 Upstream Reserves
9.2.1.5 Pipeline Construction Costs
9.2.1.6 Greenfield Terminal Costs and Economics
9.2.1.7 Threats to LNG Liquefaction Terminal Investment
9.2.1.8 Canadian LNG Liquefaction Infrastructure in Operation, Under Construction and Planned
9.2.2 Canadian FLNG Market Outlook
9.3 Trinidad and Tobago FLNG Market Outlook
9.3.1 Trinidad & Tobago Onshore LNG Prospects
9.4 Guadeloupe and Martinique LNG Market Outlook
9.4.1 Guadeloupe and Martinique FLNG Market Outlook
9.5 Jamaican LNG Market Outlook
9.5.1 Jamaican FLNG Market Outlook
9.6 Puerto Rican LNG Market Outlook
9.6.1 Puerto Rican FLNG Market Outlook
9.7 Other North American LNG
9.7.1 Other North American and Caribbean FLNG Market
9.7.1.1 Other North American and Caribbean FLNG Market Drivers & Restraints
9.7.1.2 Other North American and Caribbean FLNG Projects
9.8 North American FLNG
9.8.1 The North American and Caribbean FLNG Market Forecast 2015-2025
9.8.1.1 The North American and Caribbean FLNG Market Analysis
9.8.2 North American LNG FPSO Production Capacity Forecast 2015-2025
www.visiongain.com
Contents 10. The Asian LNG Market 2015-2025
10.1 Asian FLNG Market
10.1.2 The Asian FLNG Market Forecast 2015-2025
10.1.3 Asian FLNG Market Analysis
10.1.4 Asian FLNG Market Drivers & Restraints
10.1.5 Asian FLNG Projects
10.1.6 East Asian FSRU Regasification Capacity Forecast
10.2 Small Scale LNG Regasification Terminals in Asia
10.3 The Chinese LNG Market 2015-2025
10.3.1 Chinese Large-Scale Onshore LNG Regasification Market 2015-2025
10.3.1.1 Overall Drivers and Restraints on the Chinese Onshore LNG Regasification Market
10.3.1.2 Drivers
10.3.1.3 Restraints
10.3.1.4 Chinese Onshore LNG Regasification Infrastructure in Operation, Under Construction
and Planned
10.3.2 The Chinese LNG Carrier Market Forecast 2015-2025
10.3.2.1 Chinese Demand for LNG Carriers
10.3.2.2 Are Expanding Natural Gas Pipeline Supplies to China a Threat to the Chinese LNG
Carrier Market?
10.3.2.3 Increasing Numbers of Chinese Shipyards Capable of Building LNG Carriers
10.3.2.4 LNG Carrier Construction and the Chinese Yuan
10.3.2.5 Labour Costs, Foreign Orders and Attractive Financing
10.3.2.6 Small Scale LNG Carrier Construction in China
10.3.2.7 Limitations on LNG Carrier Market in China
10.3.2.8 Chinese LNG Carrier Market Drivers & Restraints
10.3.2.9 Chinese LNG Carrier Orders
10.3.3 Chinese FLNG Market Forecast 2015-2025
10.3.3.1 Chinese FLNG Market Analysis
10.3.3.2 Chinese LNG, FLNG, and Gas Consumption
10.3.4 China Small Scale LNG Market Forecast 2015-2025
10.3.4.1 China Small Scale LNG Submarkets Analysis
10.3.4.2 Small Scale LNG Regasification Terminals in China
10.3.4.3 Small Scale Liquefaction Plants in China
10.3.4.4 LNG Fuelling Stations in China
10.3.4.5 LNG Bunkering Facilities in China
10.3.4.6 LNG Satellite Stations in China

www.visiongain.com
Contents 10.3.4.7 China’s Natural Gas Pipelines and the Small Scale LNG Market
10.3.4.8 The Effects of Shale Gas Development on Small-Scale LNG in China
10.3.4.9 The Effects of Coalbed Methane Development on Small-Scale
10.3.4.10 The Effects of Tight Gas Development on Small-Scale LNG in China
10.4 The Japanese LNG Market 2015-2025
10.4.1 Japanese Large-Scale Onshore LNG Regasification Market 2015-2025
10.4.1.1 Overall Drivers and Restraints on the Japanese Onshore LNG Regasification
Market
10.4.1.2 Capital Expenditure Analysis
10.4.1.3 Will Nuclear Power Generation Restart (and if so when)?
10.4.1.4 The Future of Coal Power Generation
10.4.1.5 How Has, and Will, the Japanese Economy Affect LNG Infrastructure Spending?
10.4.1.6 Future Investment
10.4.1.7 Future Electricity Demand
10.4.1.8 Japanese LNG Regasification Infrastructure in Operation, Under Construction and
Planned
10.4.2 The Japanese LNG Carrier Market Forecast 2015-2025
10.4.2.1 The Japanese Yen and LNG Carrier Orders
10.4.2.2 Are Wage Levels Affecting Japanese LNG Carrier Orders?
10.4.2.3 The Competitive Advantage of Japanese LNG Carriers
10.4.2.4 Shift Away From Long-Term Contracts Hurting Japanese LNG Carrier Construction
Industry
10.4.2.5 The Potential for More LNG Carrier Construction in Japan
10.4.2.6 The Challenge of China to Japanese LNG Carrier Builders
10.4.2.7 The Advantage of Moss Spherical Containment Systems (Only Used by Japanese
Shipbuilders)
10.4.2.8 The Small-Scale LNG Carrier Market in Japan
10.4.2.9 The Challenge to Japanese LNG Carrier Builders of South Korean Shipbuilders
10.4.2.10 Japanese LNG Carrier Market Drivers & Restraints
10.4.2.11 Japanese LNG Carrier Orders
10.4.3 Japan FLNG Outlook
10.4.4 Japan Small Scale LNG Market Forecast 2015-2025
10.4.4.1 Japan Small Scale LNG Submarkets Analysis
10.4.4.2 Small Scale LNG Regasification Terminals in Japan
10.4.4.3 Small Scale Liquefaction Plants in Japan
10.4.4.4 LNG Fuelling Stations in Japan
www.visiongain.com
Contents 10.4.4.5 LNG Satellite Stations in Japan
10.4.4.6 LNG Bunkering facilities in Japan
10.5 The South Korean LNG Market 2015-2025
10.5.1 South Korean Large-Scale Onshore LNG Regasification Market 2015-2025
10.5.1.1 Overall Drivers and Restraints on the South Korean Onshore LNG Regasification Market
10.5.1.2 Current LNG Demand Situation
10.5.1.3 What is the Future of Nuclear Power Generation in South Korea?
10.5.1.4 South Korean LNG Regasification Infrastructure in Operation, Under Construction and
Planned
10.5.2 The South Korean LNG Carrier Market Forecast 2015-2025
10.5.2.1 Bulk Orders Potential Provides Competitive Advantage
10.5.2.3 Q-Max and Q-Flex Vessel History
10.5.2.4 The Challenge to South Korea of Chinese Shipbuilders
10.5.2.5 South Korean LNG Carrier Propulsion Systems Provide Competitive Advantage
10.5.2.6 South Korean Shipbuilding Expertise Depth
10.5.2.7 South Korean LNG Carrier Market Drivers & Restraints
10.5.2.8 South Korean LNG Carrier Orders
10.5.3 South Korea FLNG Outlook
10.5.4 South Korean Small Scale LNG
10.5.4.1Small Scale LNG Regasification Terminals in South Korea
10.5.4.2 LNG Bunkering Facilities in South Korea
10.6 The Indian LNG Market 2015-2025
10.6.1 Indian LNG Infrastructure Outlook
10.6.1.1 Indian LNG Regasification Terminals in Operation and Under Construction
10.6.2 The Indian LNG Carrier Market Forecast 2015-2025
10.6.3 Indian FLNG Market Forecast 2015-2025
10.6.3.1 Indian FLNG Market Analysis
10.6.3.2 Planned Indian FLNG Projects
10.6.4 Small Scale LNG Regasification Terminals in India
10.7 Bangladesh LNG Outlook
10.7.1 Bangladesh FLNG Outlook
10.8 Pakistani LNG Outlook
10.8.1 Pakistani FLNG Outlook
10.9 Sri Lankan LNG Outlook
10.9.1 Sri Lankan FLNG Outlook
www.visiongain.com
Contents 11. The South East Asian LNG Market 2015-2025
11.1 South East Asian Large-Scale Onshore LNG Infrastructure
11.1.1 South East Asian Large-Scale Onshore LNG Liquefaction Market 2015-2025
11.1.1.1 Overall Drivers & Restraints on South East Asian LNG Liquefaction Investment
11.1.2 South East Asian Large-Scale Onshore LNG Gasification
11.1.3 South East Asian LNG Liquefaction Infrastructure in Operation, Under Construction and Planned
11.2 The Southeast Asian FLNG Market Forecast 2015-2025
11.2.1 Southeast Asian FLNG Market Analysis
11.2.2 Other Southeast Asian FLNG Projects
11.3 The Indonesian LNG Market 2015-2025
11.3.1 Indonesian LNG Liquefaction Outlook
11.3.1.1 A Domestic LNG Trade and the Shift Toward Natural Gas Consumption
11.3.1.2 The Indonesian Domestic Gas Trade
11.3.1.3 Coalbed Methane in Indonesia
11.3.2 The Indonesian FLNG Market Forecast 2015-2025
11.3.2.1 Indonesian FLNG Market Analysis
11.3.2.2 Future Indonesian Liquefaction
11.3.2.3 Indonesian FLNG Market Drivers & Restraints
11.3.2.4 Indonesian FLNG Projects
11.3.3 Indonesia Small Scale LNG Market & Submarket Forecasts 2015-2025
11.3.3.1 Indonesia Small Scale LNG Submarkets Analysis
11.3.3.2 Small Scale LNG Regasification Terminals in Indonesia
11.3.3.3 Small Scale Liquefaction Plants in Indonesia
11.3.3.4 LNG Fuelling Stations in Indonesia
11.3.3.5 LNG Satellite Stations in Indonesia
11.3.3.6 LNG Bunkering facilities in Indonesia
11.4 Malaysian LNG Market 2015-2025
11.4.1 Malaysian LNG Liquefaction Outlook
11.4.2 The Malaysian FLNG Outlook
11.5 Thai LNG Market 2015-2025
11.5.1 Thai FLNG Outlook
11.6 Vietnam LNG Market 2015-2025
11.6.1 Vietnamese FLNG Outlook
11.7 Philippines LNG Market 2015-2025
11.7.1 Filipino FLNG Outlook
11.8 Singapore LNG Outlook
www.visiongain.com
Contents 11.9 Brunei LNG Outlook
11.9.1 Brunei LNG Liquefaction Outlook
11.10 Timor Leste LNG Outlook
11.10.1 Timor Leste FLNG Outlook
12. The European LNG Market 2015-2025
12.1 European Large-Scale Onshore LNG Regasification Market 2015-2025
12.1.1 How Does the Ukraine Crisis Impact Future European LNG Demand?
12.1.2 The Impact of Gas Pipeline Developments on LNG Infrastructure Investment
12.1.3 The Economics of LNG Imports vs. Russian Gas
12.1.4 The FSRU Option – A Threat to Onshore Regasification in Europe?
12.1.5 What Will the Effect of UK North Sea Gas Declines be on Regasification Infrastructure?
12.1.6 Shale Gas Development Issues and their Relation to LNG Infrastructure Development
12.1.6.1 Shale Gas in Poland
12.1.6.2 Shale Gas in the UK
12.1.6.3 Shale Gas in Germany
12.1.7 Energy Security & Geo-Politics as a Driver of Regasification Infrastructure Development
12.1.8 A Shift to Natural Gas Power Generation?
12.1.9 Baltic States LNG Regasification Outlook
12.1.10 Overall Drivers and Restraints on the European Onshore LNG Regasification Market
12.1.11 European LNG Regasification Infrastructure in Operation, Under Construction and Planned
12.2 European FLNG Market Forecast 2015-2025
12.2.1 European FLNG Market Analysis
12.2.2 European FLNG Market Drivers & Restraints
12.2.3 European FLNG Projects
12.2.4 European FSRU Regasification Capacity Forecast 2015-2020
12.3 Europe Small Scale LNG Market Forecast 2015-2025
12.3.1 Europe Small Scale LNG Submarkets Analysis
12.3.2 Small Scale LNG Regasification Terminals in Europe
12.3.3 Small Scale Liquefaction Plants in Europe
12.3.4 LNG Fuelling Stations in Europe
12.3.5 LNG Satellite Stations in Europe
12.3.6 LNG Bunkering Facilities in Europe
12.3.6.1 Break Bulk Facilities in Europe
12.4 The Cypriot LNG Market 2015-2025
12.4.1 Cypriot FLNG Market Outlook
www.visiongain.com
Contents 12.5 The Greek LNG Market 2015-2025
12.5.1 Greek FLNG Outlook
12.6 The Italian LNG Market 2015-2025
12.6.1 Italian LNG Regasification Terminal Outlook
12.6.2 Italian FLNG Market Outlook
12.7 The Lithuanian LNG Market 2015-2025
12.7.1 Lithuanian FLNG Market Outlook
12.8 The Turkish LNG Market 2015-2025
12.8.1 Turkish FLNG Market Outlook
12.9 The UK LNG Market 2015-2025
12.9.1 UK FLNG Market Outlook
12.10 The Ukraine LNG Market 2015-2025
12.10.1 Ukraine FLNG Market Outlook
12.11 The Malta LNG Market 2015-2025
12.11.1 Malta FLNG Market Outlook
12.12 The Russian LNG Market 2015-2025
12.12.1 Russian Large-Scale Onshore LNG Liquefaction Market 2015-2025
12.12.1.1 Russia Onshore Liquefaction Facilities and Prospects
12.12.1.2 Overall Drivers & Restraints on Russian LNG Liquefaction Investment
12.12.1.3 Russian LNG Liquefaction Infrastructure in Operation, Under Construction and Planned
12.12.2 Prospects for the Russian FLNG Market
12.12.2.1 Golar and Rosneft
13. Middle Eastern LNG Market 2015-2025
13.1 The Middle Eastern FLNG Market Forecast 2015-2025
13.1.1 Middle East FLNG Market Analysis
13.1.2 Middle Eastern FLNG Market Drivers & Restraints
13.1.3 Other Middle Eastern FLNG Projects
13.1.4 Middle Eastern FSRU Regasification Capacity Forecast 2015-2020
13.1.5 Middle Eastern LNG FPSO Production Capacity Forecast 2015-2025
13.2 The Egyptian LNG Market 2015-2025
13.2.1 Egyptian Onshore LNG Liquefaction Prospects
13.2.2 Egyptian FLNG Market Outlook
13.3 The Israeli LNG Market 2015-2025
13.3.1 Israeli LNG Infrastructure Outlook
www.visiongain.com
Contents 13.3.2 Israeli FLNG Market Forecast 2015-2025
13.3.2.1 Israeli FLNG Market Analysis
13.3.2.2 Israeli FLNG Projects
13.4 The Jordanian LNG Market 2015-2025
13.4.1 Jordanian FLNG Market Outlook
13.5 The Kuwaiti LNG Market 2015-2025
13.5.1 Kuwaiti FLNG Market Outlook
13.6 The Lebanese LNG Market 2015-2025
13.6.1 Lebanese FLNG Market Outlook
13.7 The UAE LNG Market 2015-2025
13.7.1 UAE FLNG Market Outlook
13.8 The Qatari LNG Market 2015-2025
13.8.1 Qatari Onshore LNG Liquefaction Prospects
14. The African LNG Market 2015-2025
14.1 The African Large-Scale Onshore LNG Infrastructure
14.1.1 East Africa Large-Scale Onshore LNG Liquefaction Market 2015-2025
14.1.1.1 Overall Drivers & Restraints on East African LNG Liquefaction Investment
14.1.1.2 East African LNG Liquefaction Infrastructure in Operation, Under Construction and
Planned
14.2 The African LNG Carrier Market
14.2.1 East African LNG Exports and the LNG Carrier Market
14.3 The African FLNG Market Forecast 2015-2025
14.3.1 African FLNG Market Analysis
14.3.2 African FLNG Market Drivers & Restraints
14.3.3 African FLNG Projects
14.3.4 African LNG FPSO Production Capacity Forecast 2015-2025
14.3.5 West Africa FLNG Outlook
14.4 The Equatorial Guinea LNG Market 2015-2025
14.4.1 Equatorial Guinea Large-Scale LNG Infrastructure Outlook
14.4.2 Equatorial Guinean FLNG Market Forecast 2015-2025
14.4.2.1 Equatorial Guinean FLNG Market Analysis
14.5 The Mozambique LNG Market 2015-2025
14.5.1 Mozambique Large-Scale LNG Infrastructure Outlook
14.5.1.1 Mozambique LNG Liquefaction Outlook
www.visiongain.com
Contents 14.5.1.2 Anadarko’s LNG Plan: The Onshore Option
14.5.1.3 ENI’s FLNG Option
14.5.1.4 Overall Drivers & Restraints on Mozambique LNG Liquefaction Investment
14.5.1.5 Mozambique Development Context & Tax Regime
14.5.1.6 Most Likely Scenario for Mozambique LNG Development
14.5.2 Mozambique FLNG Market Forecast 2015-2025
14.5.2.1 Mozambique FLNG Market Analysis
14.6 The Tanzanian LNG Market 2015-2025
14.6.1 Tanzanian LNG Liquefaction Outlook
14.6.2 Tanzanian FLNG Outlook
14.7 The South African LNG Market 2015-2025
14.7.1 South African FLNG Outlook
14.8 The Algerian LNG Market 2015-2025
14.8.1 Algerian Liquefaction Outlook
14.9 The Angolan LNG Market 2015-2025
14.9.1 Angola Liquefaction Outlook
14.9.2 Angolan FLNG Outlook
14.10 The Nigerian LNG Market 2015-2025
14.10.1 Nigeria Liquefaction Outlook
15. The South American LNG Market 2015-2025
15.1 South American LNG Infrastructure Outlook
15.2 The South American FLNG Market Forecast 2015-2025
15.2.1 The South American FLNG Market Analysis
15.2.2 Other South American FLNG Market Drivers & Restraints
15.2.3 Other South American FLNG Market Projects
15.2.4 South American FSRU Regasification Capacity Forecast 2015-2025
15.3 The Brazilian LNG Market 2015-2025
15.3.1 Brazilian LNG Infrastructure Outlook
15.3.2 The Brazilian FLNG Market Forecast 2015-2025
15.3.2.1 Brazilian FLNG Market Analysis
15.3.2.2 Outlook for Brazilian FLNG Units
15.3.2.3 Brazilian FLNG Market Drivers & Restraints
15.3.2.4 Brazilian FLNG Projects
15.3.3 Brazilian Small-Scale LNG Market Outlook

www.visiongain.com
Contents 15.3.3.1 LNG Fuelling Stations in Brazil
15.4 The Argentine LNG Market 2015-2025
15.4.1 Argentine LNG Infrastructure Outlook
15.4.2 Argentine FLNG Market Outlook
15.5 The Chilean LNG Market 2015-2025
15.5.1 Chilean LNG Infrastructure Outlook
15.6 The Ecuadorian LNG Market 2015-2025
15.6.1 Ecuadorian FLNG Market Outlook
15.7 The Colombian LNG Market 2015-2025
15.7.1 Colombian FLNG Market Outlook
15.8 The Uruguay LNG Market 2015-2025
15.8.1 Uruguay FLNG Market Outlook
16. PEST Analyses of the LNG Infrastructure Market 16.1 PEST Analysis of the Large-Scale Onshore LNG Infrastructure Market
16.2 PEST Analysis of the LNG Carrier Market 2015-2025
16.3 PEST Analysis of the FLNG Market 2015-2025
16.4 PEST Analysis of the Small Scale LNG Market 2015-2025
17. Expert Opinion 17.1 Cheniere Energy
17.1.1 Cheniere Energy, Sabine Pass & Corpus Christi
17.1.2 Why US LNG Exports Make Sense
17.1.3 Who is Buying Future US LNG?
17.1.4 The Impact on US LNG Competitiveness of ~$80/bbl Oil
17.1.5 Cheniere LNG Competitive Advantage
17.1.6 Future US LNG Export Volumes & the FERC Approval Process
17.1.7 Panama Canal Risk?
17.1.8 The Future of the LNG Trade and East Asian Demand
17.1.9 US Floating Barge Proposals
17.2 Stena Bulk
17.2.1 Stena Bulk Position
17.2.2 LNG Carrier Market Drivers
17.2.3 The Yamal LNG Project
www.visiongain.com
Contents 17.2.4 Long-term Contracts and the Spot Market
17.2.5 LNG Carrier Market Restraints
17.2.6 LNG Carrier Capacity
17.2.7 The Widening of the Panama Canal
17.2.8 LNG Carrier Charter Rates
17.3 Matthew Blycha, HFW LLP Interview
17.3.1 About HFW LLP
17.3.2 Impact of Oil and LNG Price Fall
17.3.3 Impact of a Functioning LNG FPSO
17.3.4 Impact of Oil Price on Financing FLNG Projects
17.3.5 Australian Public Response to FLNG
17.3.6 Australian FLNG Regulatory Issues
17.4 Robert Shivers, Lonestar FLNG (Houston Tx) Interview
17.4.1 About Lonestar FLNG
17.4.2 Issues in LNG FPSO Design and Alternatives
17.4.3 Shipyard Size and Availability of LNG Carriers for Conversion
17.4.4 Impact of the Oil Price on the FLNG Market
17.4.5 Future of FLNG in the United States
17.4.6 Competition and Rising Fees in the Panama Canal
17.4.7 Competing New Designs for LNG FPSOs
17.4.8 Final Thoughts
17.5 Swedegas
17.5.1 Swedegas Operations
17.5.2 Port of Gothenburg LNG Facility
17.5.3 LNG Ship Bunkering
17.5.4 LNG Fuel for Road Vehicles
17.5.5 Northern Europe and Project Opportunities
17.6 GasEner SRL
17.6.1 GasEner SLR Operations
17.6.2 Small Scale Liquefaction and Regasification
17.6.3 The LNG Supply Chain
17.6.4 LNG Ship Bunkering
17.6.5 The Small and Large Scale LNG Markets Relationship
17.6.6 LNG Satellite Stations
17.6.7 Regions for Small-Scale LNG

www.visiongain.com
Contents 18. Leading Companies in the LNG Infrastructure Market 18.1 Leading Companies in Large-Scale LNG Infrastructure Market
18.1.1 Leading LNG Liquefaction Operators
18.1.1.1 BP
18.1.1.2 BG Group
18.1.1.3 Cheniere Energy
18.1.1.4 Chevron
18.1.1.5 ConocoPhillips
18.1.1.6 ExxonMobil
18.1.1.7 Petronas
18.1.1.8 Royal Dutch Shell
18.1.1.9 Total S.A.
18.1.2 Other Players of Importance within the Global LNG Infrastructure Industry (Operators, Investors,
Engineering Companies)
18.2 Leading Operators in the LNG Carrier Market
18.2.1 Royal Dutch Shell plc, (Shell) Overview
18.2.1.1 Analysis of Shell
18.2.1.2 Future Outlook for Shell in the LNG Carrier Market
18.2.2 Nippon Yusen Kabushiki Kaisha (NYK) Overview
18.2.2.1 Analysis of NYK
18.2.2.2 Future Outlook for NYK in the LNG Carrier Market
18.2.3 Mitsui O.S.K. Lines, Ltd. (MOL) Overview
18.2.3.1 Analysis of MOL
18.2.3.2 Future Outlook for MOL in the LNG Carrier Market
18.2.4 Misc Berhad (Misc) Overview
18.2.4.1 Analysis of Misc
18.2.4.2 Future Outlook for Misc in the LNG Carrier Market
18.2.5 Teekay Corporation Analysis
18.2.5.1 Analysis of Teekay
18.2.5.2 Future Outlook for Teekay in the LNG Carrier Market
18.2.6 Maran Gas Maritime Inc. (MGM) Overview
18.2.6.1 Analysis of MGM
18.2.6.2 Future Outlook for MGM in the LNG Carrier Market
18.2.7 Golar LNG Limited (Golar) Overview
18.2.7.1 Analysis of Golar
18.2.7.2 Future Outlook for Golar in the LNG Carrier Market
www.visiongain.com
Contents 18.2.8 BW Group Overview
18.2.8.1 Analysis of BW Group
18.2.8.2 Future Outlook for BW Group in the LNG Carrier Market
18.2.9 GasLog Ltd Overview
18.2.9.1 Analysis of GasLog
18.2.9.2 Future Outlook for GasLog in the LNG Carrier Market
18.2.10 Kawasaki Kisen Kaisha (K Line) Ltd Overview
18.2.10.1 Analysis of K Line
18.2.10.2 Future Outlook for K Line in the LNG Carrier Market
18.3 Leading Companies in the FLNG Market
18.3.1 Leading Companies in the FSRU Market
18.3.2 Excelerate Energy
18.3.2.1 Excelerate Products and Services
18.3.2.2 Analysis of Excelerate Energy within the FLNG Market
18.3.2.3 Excelerate M&A Activity
18.3.2.4 Future Outlook for Excelerate Energy
18.3.2.5 Excelerate LNG FPSO Projects
18.3.3 Golar LNG
18.3.3.1 Golar Products and Services
18.3.3.2 Analysis of Golar LNG within the FLNG Market
18.3.3.3 Future Outlook for Golar LNG
18.3.3.4 Golar and Rosneft
18.3.3.5 Golar Projects
18.3.4 Höegh LNG
18.3.4.1 Höegh Products and Services
18.3.4.2 Analysis of Höegh LNG within the FLNG Market
18.3.4.3 Höegh M&A Activity
18.3.4.4 Future Outlook for Höegh
18.3.4.5 Höegh Projects
18.3.5 Leading Companies in the LNG FPSO Market
18.3.6 Shell and Associates
18.3.6.1 Analysis of Shell and Associates in the FLNG Market
18.3.6.2 Future Outlook of Shell and Associates
18.3.6.3 Shell and Associates Projects
18.3.7 Petronas
18.3.7.1 Analysis of Petronas in the FLNG Market

www.visiongain.com
Contents 18.3.7.2 Future Outlook of Petronas
18.3.7.3 Petronas LNG FPSO Projects
18.3.8.1 Exmar
18.3.8.2 Noble Energy
18.3.8.3 Woodside Petroleum
18.3.9 Leading FLNG Constructors
18.3.10 DSME and Associates
18.3.10.1 Analysis of DSME in the FLNG Market
18.3.10.2 DSME and Associates Future Outlook
18.3.10.3 DSME and Associates Projects
18.3.11 Samsung Heavy Industries (SHI)
18.3.11.1 Samsung Heavy Industries Future Outlook
18.3.11.2 Samsung Heavy Industries Projects
18.3.12 Hyundai Heavy Industries (HHI)
18.3.12.1 Hyundai Heavy Industries Future Outlook
18.3.12.2 Hyundai Heavy Industries Projects
18.3.13 Leading Service Providers in the FLNG Market
18.3.14 Black & Veatch
18.3.15 JGC Corporation
18.3.16 KBR
18.3.17 Saipem
18.3.18 Technip
18.3.19 Wison Offshore & Marine
18.3.20 Other Companies in the FLNG Market
18.4 Leading Companies in the Small-Scale LNG Market
18.4.1 Small-Scale LNG Technology Providers
18.4.1.1 Air Products & Chemicals Inc, (APCI)
18.4.1.2 Black & Veatch
18.4.1.3 Chart Industries, Inc. (Chart)
18.4.1.4 Cryostar Group
18.4.1.5 Wartsila Hamworthy
18.4.2 Small Scale LNG Companies
18.4.3 Gasnor Shell Overview
18.4.3.1 Gasnor Shell Analysis
18.4.3.2 Gasnor Shell Future Outlook
18.4.4 Skangass AS Overview
www.visiongain.com
Contents 18.4.4.1 Skangass AS Analysis
18.4.4.2 Skangass AS Future Outlook
18.4.5 Gazprom Overview
18.4.5.1 Gazprom Analysis
18.4.5.2 Gazprom Future Outlook
18.4.6 Energy Holdings Limited (ENN) Overview
18.4.6.1 ENN Analysis
18.4.6.2 ENN Future Outlook
18.4.7 Kunlun Energy Limited Overview
18.4.7.1 Kunlun Energy Analysis
18.4.7.2 Kunlun Energy Future Outlook
18.4.8 Other Notable Companies in the Small Scale LNG Market
19. Conclusions & Recommendations
19.1 Large-Scale Onshore LNG Infrastructure Conclusions
19.1.2 Key Findings
19.2 The LNG Carrier Market Conclusions
19.2.1 The LNG Carrier Market Outlook
19.2.2 Key Findings in the LNG Carrier Market
19.2.3 Recommendations for the LNG Carrier Market
19.3 Global FLNG Market Conclusions
19.3.1 Global FLNG Market Outlook
19.3.2 Key Findings
19.3.2.1 LNG FPSO Submarket
19.3.2.2 FSRU Submarket
19.3.2.3 Regional and Leading National FLNG Markets
19.3.3 Recommendations
19.4 Small-Scale Onshore LNG Infrastructure Conclusions
19.4.1 Market Outlook
19.4.2 Key Findings
19.4.3 Recommendations
www.visiongain.com Page 490
LNG Yearbook 2015: The Definitive Reference Guide to the Liquefied Natural Gas Infrastructure Market 2015-2025: Capex on Large-Scale Onshore Liquefaction & Regasification, Floating LNG (FLNG), Small-Scale LNG and LNG Carriers
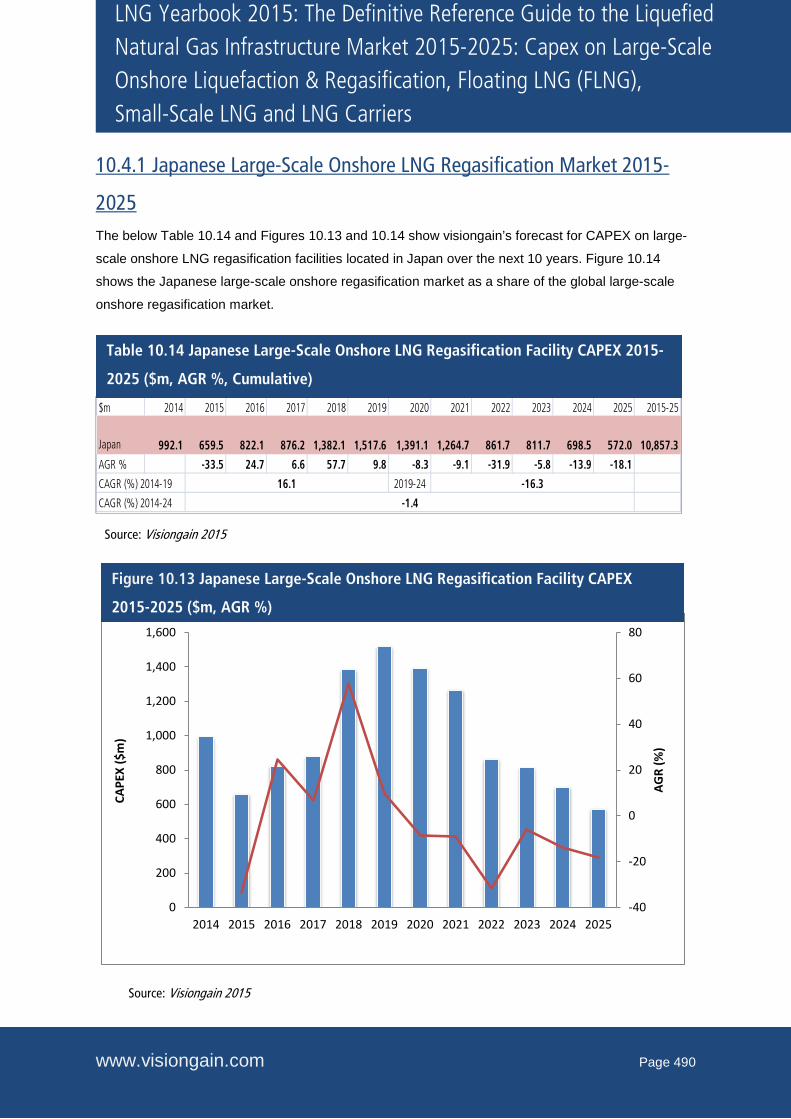
10.4.1 Japanese Large-Scale Onshore LNG Regasification Market 2015-
2025 The below Table 10.14 and Figures 10.13 and 10.14 show visiongain’s forecast for CAPEX on large-
scale onshore LNG regasification facilities located in Japan over the next 10 years. Figure 10.14
shows the Japanese large-scale onshore regasification market as a share of the global large-scale
onshore regasification market.
$m 2014 2015 2016 2017 2018 2019 2020 2021 2022 2023 2024 2025 2015-25
Japan 992.1 659.5 822.1 876.2 1,382.1 1,517.6 1,391.1 1,264.7 861.7 811.7 698.5 572.0 10,857.3
AGR % -33.5 24.7 6.6 57.7 9.8 -8.3 -9.1 -31.9 -5.8 -13.9 -18.1
2019-24 -16.3
-1.4
16.1CAGR (%) 2014-19
CAGR (%) 2014-24
-40
-20
0
20
40
60
80
0
200
400
600
800
1,000
1,200
1,400
1,600
2014 2015 2016 2017 2018 2019 2020 2021 2022 2023 2024 2025
AGR
(%)
CAPE
X ($
m)
Source: Visiongain 2015
Table 10.14 Japanese Large-Scale Onshore LNG Regasification Facility CAPEX 2015-
2025 ($m, AGR %, Cumulative)
Figure 10.13 Japanese Large-Scale Onshore LNG Regasification Facility CAPEX
2015-2025 ($m, AGR %)
Source: Visiongain 2015

www.visiongain.com Page 499
LNG Yearbook 2015: The Definitive Reference Guide to the Liquefied Natural Gas Infrastructure Market 2015-2025: Capex on Large-Scale Onshore Liquefaction & Regasification, Floating LNG (FLNG), Small-Scale LNG and LNG Carriers
2014 2015 2016 2017 2018 2019 2020 2021 2022 2023 2024 2025 2015-2025
CAPEX $m 408.3 751.1 670.1 715.8 687.0 648.8 513.2 572.6 483.9 478.0 558.0 478.0 6556.5
AGR (%) 10.3% 15.4% 8.8% -5.1% -7.8% -27.4% -4.9% -5.2% -1.8% 0.0% 0.0%
CAGR (%) 2015-20 2020-25-7.3% -1.4%
CAGR (%) 2015-25 -4.4%
-30.0%
-25.0%
-20.0%
-15.0%
-10.0%
-5.0%
0.0%
5.0%
10.0%
15.0%
20.0%
0
100
200
300
400
500
600
700
800
2014 2015 2016 2017 2018 2019 2020 2021 2022 2023 2024 2025
AGR
(%)
CAPE
X $m
Year
Source: Visiongain 2015
Table 10.16 Japanese LNG Carrier Market Forecast 2015-2025 ($m, AGR %, CAGR %,
Cumulative)
Source: Visiongain 2015
Figure 10.17 Japanese LNG Carrier Forecast 2015-2025 ($m, AGR%)

www.visiongain.com Page 676
LNG Yearbook 2015: The Definitive Reference Guide to the Liquefied Natural Gas Infrastructure Market 2015-2025: Capex on Large-Scale Onshore Liquefaction & Regasification, Floating LNG (FLNG), Small-Scale LNG and LNG Carriers
17. Expert Opinion
17.1 Cheniere Energy Katie Pipkin is Senior VP of Business Development and Communications at Cheniere Energy.
She has held this position since March 2014, and prior to that was the VP of Finance, during which
time she helped secure the financing for the Sabine Pass LNG liquefaction project. Her extensive
experience within the energy industry spans finance, business development and investor relations
functions. Between 2004 and 2007, she worked at Lehman Brothers as a sell-side analyst for the
natural gas sector. Prior to this she spent six years at Dynegy within their accounting/finance and
investor relations departments. Ms. Pipkin earned a B.B.A in Finance from the University of Texas.
Visiongain interviewed Ms. Pipkin in October 2014 and would like to thank her for her astute insights.
Cheniere Energy is a Houston-based energy company primarily engaged in LNG-related
businesses. Cheniere is developing nine liquefaction trains overall for 40.5 mmtpa- six LNG trains as
part of a liquefaction project adjacent to its existing Sabine Pass LNG regasification terminal in
Cameron Parish, Louisiana, with aggregate capacity of approximately 27 mmtpa, and another three
LNG trains at a soon to be developed LNG export terminal near Corpus Christi, Texas, with aggregate
capacity of up to 13.5 mmtpa.
17.1.1 Cheniere Energy, Sabine Pass & Corpus Christi Visiongain: Please describe the work of Cheniere Energy and your involvement in the LNG industry. Katie Pipkin: We are currently developing two liquefaction projects – the Sabine Pass Liquefaction
facility and the Corpus Christi liquefaction facility.
The Sabine Pass Liquefaction facility will be the first LNG export terminal to be built in over 40 years
in North America. Construction is well underway on the first four liquefaction trains and we expect first
LNG production by late 2015. An expansion with trains 5 & 6 is in the final stages of the regulatory
process and we expect to reach a final investment decision in 2015. When complete, the Sabine Pass
liquefaction facility will be capable of exporting approximately 27 mmtpa of LNG, equivalent to
approximately 3.8 bcf/d.
The Sabine Pass liquefaction project is a brownfield development and several of the existing assets at
the Sabine Pass regasification terminal will be used for exporting LNG, including the storage tanks
and marine berths. We are adding liquefaction trains at the site that have been designed using the
ConocoPhillips Optimized Cascade Process technology, a proven technology that has been used in

www.visiongain.com Page 703
LNG Yearbook 2015: The Definitive Reference Guide to the Liquefied Natural Gas Infrastructure Market 2015-2025: Capex on Large-Scale Onshore Liquefaction & Regasification, Floating LNG (FLNG), Small-Scale LNG and LNG Carriers
18.1.1.1 BP Table 18.2 provides a summary of BP’s large-scale LNG liquefaction portfolio in 2014 and 2015.
Headquarters: London, United Kingdom
Large-Scale Onshore LNG Liquefaction Equity
Capacity (mmtpa), 2014:
12.1
% of Total Large-Scale Onshore LNG Liquefaction
Capacity 2014:
4.05%
Large-Scale Onshore LNG Liquefaction Equity
Capacity (mmtpa), 2015:
12.1
% of Total Large-Scale Onshore LNG Liquefaction
Capacity 2015:
3.63%
2015 Rank, by capacity: 8th
BP has been placed under relentless pressure following the Deepwater Horizon incident in 2010,
which continues to harm the company’s ability to compete in a number of global oil and gas markets
versus its rivals. In order to pay reparations, damages and penalties resulting from the blowout, BP
has committed to raising $38bn from the sale of non-core assets. Very few companies in existence
could afford such a strategy, and even for BP it has challenged its viability going forward.
Its stake in the LNG industry has not gone unaffected, but rather than selling off assets, BP has
broadly stood still as its competitors Chevron, ExxonMobil and Shell continued to embark on sizeable
onshore investments. The BP portfolio is due to remain relatively flat for the foreseeable as the
company is currently involved in only one expansion project – the addition of a third train at its
Tangguh facility in Indonesia. The addition of this train is in FEED, with the very earliest that
operation can take place 2019; although the actual date is far more likely to be in the first half of the
next decade. The brownfield development is the lowest cost option for BP as its balance sheet
struggles to absorb the burden of further fines from Deepwater Horizon.
Indeed, BP’s gas portfolio upstream looks set to expand in a substantive way in only one location over
the next 5 years, and that is in Oman. Here the Khazzan tight gas project will cost in the region of
$15bn and will drill and hydraulic fracture approximately 330 wells – mostly horizontal with multiple
Table 18.2 BP Large-Scale Onshore LNG Liquefaction (LNG Liquefaction Equity
Capacity 2014 & 2015, % of Total LNG Liquefaction Capacity 2014 & 2015,
Market Share 2014 & 2015)
Source: Visiongain 2015
Related Documents