LNG Trade Prospects in the Atlantic Basin

LNG Trade Prospects in the Atlantic Basin. Punchlines Atlantic LNG -- volume and facilities Trade volume will triple by 2010 Supply – flood of new projects.
Dec 17, 2015
Welcome message from author
This document is posted to help you gain knowledge. Please leave a comment to let me know what you think about it! Share it to your friends and learn new things together.
Transcript

LNG Trade Prospectsin the Atlantic Basin

Punchlines
• Atlantic LNG -- volume and facilities
•Trade volume will triple by 2010
•Supply – flood of new projects
•Europe import capacity to triple
•Big question – No. American import capacity
• Trading and commerce – new markets, new models
• LNG significance – supply, liquidity, competition, arbitrage

Volumes and facilities

Atlantic LNG Imports Projected to 2010
0
20
40
60
80
100
1965 1980 1995 2010
BrazilMexicoCaribbeanUSATurkeyGreeceItalySpainPortugalFranceBelgium
New Markets
Source: Atlantic Basin LNG Outlook to 2010, Poten & Partners
UK
• Europe to 60 MMtpa
•Big growth in Iberia
•Coming growth in France and Italy
•Import facilities and supply mostly committed
•North America – 40+ MMtpa
•US/Caribbean existing terminals at 28MMtpa
•US, Canada, Mexico terminals big uncertainty
Atlantic LNG trade -- from 30 Mtpa (1.5 Tcf/y) today to 100+ Mtpa (5+ Tcf/y) by 2010

New supply• Nigeria (NLNG)and Trinidad
• new grassroots in 1999• expansions now• more coming
• Committed• Norway (Snohvit)• Egypt (Dammieta and Idku)• RasGas (to Italy), Qatargas (to UK)
• Developing• Algeria• Africa – Nigeria Brass, Angola LNG, Eq. Guinea• Venezuela – Mariscal/Sucre
Supply is not resource limited -- for inland market prices above$3-$3.50/MMBtu, long-run supply curve is flat for a long way

Flood of new European import projects and export projects
Qatar

Big question -- No. American import terminals
• Big pause – departure of “energy merchants” – Enron, EL Paso, CMS, Dynegy
• Big help – Deepwater Act, FERC relax open access/open season
• US existing, 4 terminals at 26 MMtpa• New Brunswick (Canada) Chevron/Irving,
4 MMtpa• Bahamas, 3 competing, Tractabel
probably ahead, 6+ MMtpa• Florida (BP) ?• LA (Hackberry), Sempra, 10 MMtpa• El Paso offshore “energy bridge”?• Offshore Gulf gravity-based,
ChevronTexaco 7-14 MMtpa• Texas coast (Cheniere),3 sites each 4 –
14 MMtpa• Altamira (Mexico) Shell, 4 MMtpa
Could be 70 MMtpa (3.5 Tcf/y) or more by 2010

Trading and commerce

Growing Short-term Supplies
• From 2 to 8 MMtpa in 4 years
• Asia/Pacific supply largely to Atlantic
• Growing Atlantic short-term supply, from new projects in Nigeria and Trinidad
LNG Short Term Export Volumes
0
2
4
6
8
1998 1999 2000 2001 2002M
Mtp
a
Atl. To Atl.
Pac. To Atl.
Pac. To Pac.
Source: Poten & Partners #15997

Growing short-term markets
• Growing US liquidity offers markets for global spare supply capacity
• Shift to Europe in 2002 reflects opportunistic exploitation of oil-based prices
• Asia import mostly Korea reflecting winter shortfall and stalled long-term contracting
LNG Short Term Import Volumes
0
2
4
6
8
1998 1999 2000 2001 2002
MM
tpa
Asia
Europe
USA
Source: Poten & Partners #15997

Aggressive expansion of the LNG Fleet…74,000m3 and above (end 2002)
0
5
10
15
20
25
1969
1970
1971
1972
1973
1974
1975
1976
1977
1978
1979
1980
1981
1982
1983
1984
1985
1986
1987
1988
1989
1990
1991
1992
1993
1994
1995
1996
1997
1998
1999
2000
2001
2002
2003
2004
2005
2006
Num
ber o
f Ves
sels
Ship Deliveries
Ships on OrderOf 58 orders (+ 22 options), at least 15 are not employed in
LT trades

Significance

Why now?• LNG supply business changed
• Project costs down by 50% due to scale and design efficiency• Since 1996, supply projects commit with part of capacity unsold• Flood of shipping with – with some for trading
• Deepening Atlantic gas markets• Transparent, liquid US market• Europe -- deregulation/open access, demand-side dash to gas
• Broadened scope of LNG market• Proliferations of supplies and uncommitted capacity• Proliferation of import markets
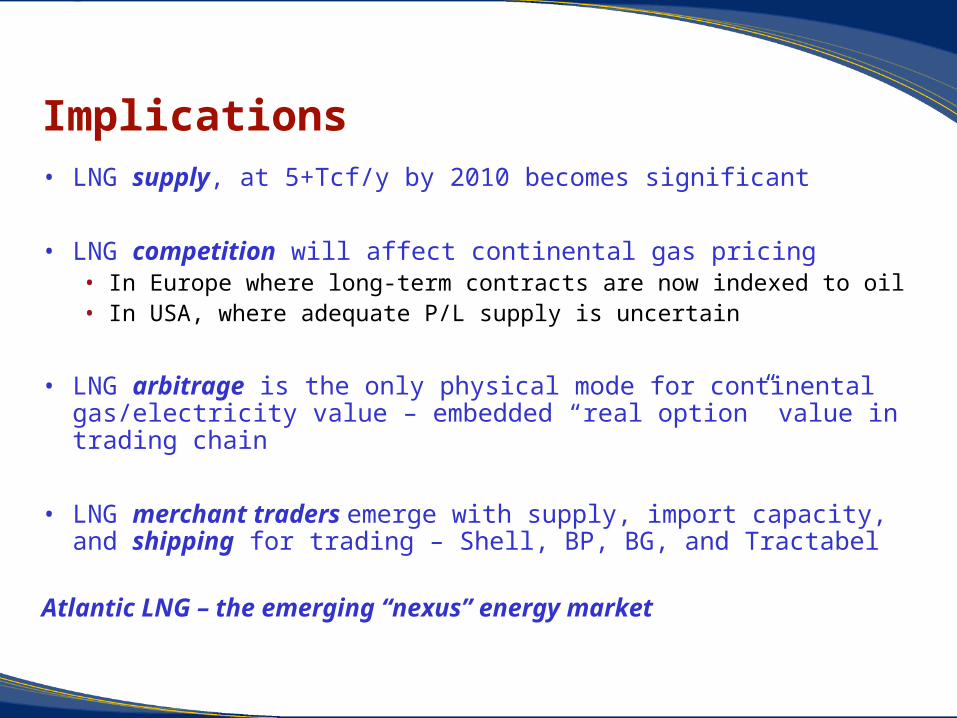
Implications• LNG supply, at 5+Tcf/y by 2010 becomes significant
• LNG competition will affect continental gas pricing• In Europe where long-term contracts are now indexed to oil• In USA, where adequate P/L supply is uncertain
• LNG arbitrage is the only physical mode for continental gas/electricity value – embedded “real option” value in trading chain
• LNG merchant traders emerge with supply, import capacity, and shipping for trading – Shell, BP, BG, and Tractabel
Atlantic LNG – the emerging “nexus” energy market
Related Documents