DOI: 10.1126/science.1177345 , 1362 (2009); 326 Science et al. James O. Lloyd-Smith, Epidemic Dynamics at the Human-Animal Interface This copy is for your personal, non-commercial use only. . clicking here colleagues, clients, or customers by , you can order high-quality copies for your If you wish to distribute this article to others . here following the guidelines can be obtained by Permission to republish or repurpose articles or portions of articles (this information is current as of June 27, 2010 ): The following resources related to this article are available online at www.sciencemag.org http://www.sciencemag.org/cgi/content/full/326/5958/1362 version of this article at: including high-resolution figures, can be found in the online Updated information and services, http://www.sciencemag.org/cgi/content/full/326/5958/1362/DC1 can be found at: Supporting Online Material http://www.sciencemag.org/cgi/content/full/326/5958/1362#otherarticles , 19 of which can be accessed for free: cites 46 articles This article http://www.sciencemag.org/cgi/content/full/326/5958/1362#otherarticles 1 articles hosted by HighWire Press; see: cited by This article has been http://www.sciencemag.org/cgi/collection/epidemiology Epidemiology : subject collections This article appears in the following registered trademark of AAAS. is a Science 2009 by the American Association for the Advancement of Science; all rights reserved. The title Copyright American Association for the Advancement of Science, 1200 New York Avenue NW, Washington, DC 20005. (print ISSN 0036-8075; online ISSN 1095-9203) is published weekly, except the last week in December, by the Science o n J u n e 2 7 , 2 0 1 0 w w w . s c i e n c e m a g . o r g D o w n l o a d e d f r o m

Welcome message from author
This document is posted to help you gain knowledge. Please leave a comment to let me know what you think about it! Share it to your friends and learn new things together.
Transcript

7/31/2019 Lloyd Smith+Et+Al.+2009
http://slidepdf.com/reader/full/lloyd-smithetal2009 1/7
DOI: 10.1126/science.1177345, 1362 (2009);326Science
et al.James O. Lloyd-Smith,Epidemic Dynamics at the Human-Animal Interface
This copy is for your personal, non-commercial use only.
. clicking herecolleagues, clients, or customers by, you can order high-quality copies for yourIf you wish to distribute this article to others
.herefollowing the guidelinescan be obtained byPermission to republish or repurpose articles or portions of articles
(this information is current as of June 27, 2010 ): The following resources related to this article are available online at www.sciencemag.org
http://www.sciencemag.org/cgi/content/full/326/5958/1362version of this article at:
including high-resolution figures, can be found in the onlineUpdated information and services,
http://www.sciencemag.org/cgi/content/full/326/5958/1362/DC1
can be found at:Supporting Online Material
http://www.sciencemag.org/cgi/content/full/326/5958/1362#otherarticles, 19 of which can be accessed for free:cites 46 articlesThis article
http://www.sciencemag.org/cgi/content/full/326/5958/1362#otherarticles1 articles hosted by HighWire Press; see: cited byThis article has been
http://www.sciencemag.org/cgi/collection/epidemiologyEpidemiology
:subject collectionsThis article appears in the following
registered trademark of AAAS.is aScience 2009 by the American Association for the Advancement of Science; all rights reserved. The title
CopyrighAmerican Association for the Advancement of Science, 1200 New York Avenue NW, Washington, DC 20005.(print ISSN 0036-8075; online ISSN 1095-9203) is published weekly, except the last week in December, by thScience

7/31/2019 Lloyd Smith+Et+Al.+2009
http://slidepdf.com/reader/full/lloyd-smithetal2009 2/7
Epidemic Dynamics at theHuman-Animal InterfaceJames O. Lloyd-Smith,1,2† Dylan George,2,3* Kim M. Pepin,4* Virginia E. Pitzer,2,4*Juliet R. C. Pulliam,2* Andrew P. Dobson,5 Peter J. Hudson,2,4 Bryan T. Grenfell2,4,5
Few infectious diseases are entirely human-specific: Most human pathogens also circulatein animals or else originated in nonhuman hosts. Influenza, plague, and trypanosomiasis areclassic examples of zoonotic infections that transmit from animals to humans. The multihostecology of zoonoses leads to complex dynamics, and analytical tools, such as mathematicalmodeling, are vital to the development of effective control policies and research agendas. Muchattention has focused on modeling pathogens with simpler life cycles and immediate globalurgency, such as influenza and severe acute respiratory syndrome. Meanwhile, vector-transmitted,chronic, and protozoan infections have been neglected, as have crucial processes such ascross-species transmission. Progress in understanding and combating zoonoses requires a newgeneration of models that addresses a broader set of pathogen life histories and integrates acrosshost species and scientific disciplines.
Arecent survey of all recognized human pathogens revealed that over half are
zoonotic (1, 2),and nearly all ofthe most
important human pathogens are either zoonotic
or originated as zoonoses before adapting to hu-
mans (3). The three most devastating pandemics
in human history, the Black Death, Spanish in-
fluenza, and HIV/AIDS, were caused by zoonoses
(4), as were 60 to 76% of recent emerging infec-
tious disease events (2, 5). Underlying these pat-
terns are specific public health challenges arising
from the complex multihost ecology of zoonotic
infections (6 , 7 ), as well as accelerating environ-
mental and anthropogenic changes that are alter-
ing the rates and nature of contact between humanand animal populations (8 – 10). Following a series
of recent outbreaks [e.g., avian and swine influ-
enza, West Nile virus, and severe acute respiratory
syndrome (SARS)], a rising sense of urgency has
stimulated a broad increase in research on zoonoses,
ranging from dissection of the molecular deter-
minants of host specificity (11) to viral prospecting
in African rain forests (12). Such endeavors have
produced important insights into underlying pat-
terns and basic mechanisms of disease, but in-
tegrating this new knowledge across scales and
applying the results to public health policy are dif-
ficult given the nonlinear and cross-species inter-
actions inherent to zoonotic infections (13). Thesecomplexities can be addressed by harnessing the
integrative power and mechanistic insights attain-
able from analysis of population dynamic models
of zoonotic transmission. Here, we review the role
of dynamical modeling in the study of zoonoses
through an analysis of the current status of the
field. Our specific goals are to detect gaps in
present knowledge and to identify the priorities
for future research that will unify, focus, and propel
the interdisciplinary push to combat zoonoses.
A Taxonomy for Zoonotic Dynamics
Wolfe et al . (3) proposed a useful classification
scheme for pathogens, delineating five stagesspan-ning the range from those exclusively infecting
animals (stage I) to those exclusively infecting hu-
mans (stage V). The zoonotic component of this
scheme (stages II to IV) can be divided into the
constituent phases of transmission and associated
epidemiological mechanisms (Fig. 1A). Stage II
pathogens are those, like West Nile virus or Bru-
cella abortus, that can transmit from animals to
humans to cause “ primary” infections but do not
exhibit human-to-human (“secondary”) transmis-
sion. Stage III pathogens, such as monkeypox virus
and Leishmania infantum, spill over into human
populations from animal reservoirs and can cause
limited cycles of human-to-human transmission
that stutter to extinction. Stage IV pathogens orig-
inate and persist in animal reservoirs but can cause
self-sustaining chains of transmission in human
populations; examples include Yersinia pestis
(plague) and pandemic influenza.
Our approach diverges from Wolfe et al . by
basing the distinction among stages II to IV on
the basic reproductive number, R0, from the per-
spective of the human hosts. This quantity, de-
fined as the expected number of secondary cases
produced by a typical infectious individual in a
wholly susceptible population, is a central con-
cept in epidemiological theory (14, 15). R0 enab
us to distinguish stages II to IV on dynam
grounds because it quantitatively demarcates pa
ogens capable of sustained transmission amo
humans (those with R0 > 1) from those doomed
stutter to local extinction ( R0 < 1) or those with
human-to-human transmission ( R0 = 0).
The dynamics of all zoonoses involve mu
ple phases, including transmission in the anim
reservoir, spillover transmission into humaand possibly stuttering or sustained transmiss
among humans. Cross-species spillover transm
sion is the defining characteristic of a zoonos
and examination of the factors influencing
force of infection from animals to humans
veals three distinct components (Fig. 1B):
prevalence of infection in the animal reserv
the rate at which humans come into contact w
these animals, and the probability that huma
become infected when contact occurs. These co
ponents are each influenced by diverse prop
ties of natural, agricultural, and human system
with important differences driven by the pa
ogen’s mode of transmission. Important quan
tative or qualitative differences may also ar
between zoonoses that use wildlife rather th
domesticated animals as reservoirs, owing to d
ferences in frequency, duration, and nature
cross-species contacts and in opportunities
human intervention.
Dynamical Models for Zoonoses
Mathematical models of the population dyna
ics of infectious diseases (14, 15) use a we
established (and ever-growing) body of theory
construct simplified representations of epidem
ological systems. Crucially, dynamical models
plicitly represent the key population groups acentral processes of epidemic spread. Infectio
diseases differ from chronic conditions such
cancer or heart disease, because the risk of inf
tion depends not only on personal risk factors
also upon the state of other individuals in t
population. This leads to nonlinear interacti
among subgroups in a population that can
sult in complex and sometimes counterintuit
epidemic behavior. In the fundamental susceptib
infected-recovered (SIR) model, groups of in
viduals within the host population are classif
as “susceptible” to infection,“infected” and able
transmit the pathogen, or “recovered” and immu
to reinfection (Fig. 2A). Transmission of infecti
to new cases is driven by contacts between susc
tible and infectious individuals. Although cru
this model reproduces the classical epidemic cu
(Fig. 2B) and has been remarkably successfu
elucidating fundamental principles, including
“tipping point ” threshold for epidemics to take
if is greater than 1, and the potential to achie
“herd immunity” through vaccination program
Because of the emphasis on mechanism, d
namical models can address questions outside
scope of statistical and geospatial analyses (F
2C). By adjusting parameter values or reformu
REVIEW
1Department of Ecology and Evolutionary Biology, Universityof California at Los Angeles, Los Angeles, CA 90095, USA.2Fogarty International Center, National Institutes of Health,Bethesda, MD 20892, USA. 3Department of Biology, ColoradoState University, Fort Collins, CO 80523, USA. 4Center forInfectious Disease Dynamics, Pennsylvania State Univer-sity, University Park, PA 16802, USA. 5Department of Ecol-ogy and Evolutionary Biology, and Woodrow Wilson School,Princeton University, Princeton, NJ 08544, USA
*These authors (listed alphabetically) contributed equallyto this work.†To whom correspondence should be addressed. E-mail:[email protected]
4 DECEMBER 2009 VOL 326 SCIENCE www.sciencemag.org62

7/31/2019 Lloyd Smith+Et+Al.+2009
http://slidepdf.com/reader/full/lloyd-smithetal2009 3/7
ing mechanisms, modelers can perform “what if ”
experiments to study problems that are ethically or
logistically unfeasible to study in the real world,
for example, by exploring the efficacy of different
control measures or extrapolating population-level
consequences of clinical or laboratory findings.
Such cross-scale synthesis also enables researchers
to extract key characteristics of epidemics, such as
changes in the value of the “effective” reproduc-
tive number ( Re) as control measures are imposed
or the supply of susceptible hosts is depleted.Models can also evaluate the potential influence of
unknown information, helping to set priorities for
data collection and to define the uncertainty as-
sociated with model outcomes. Finally, dynamical
models can be used to predict future trends of dis-
ease spread, although such projections must be
accompanied by a comprehensive uncertainty
analysis.
Population dynamic modeling has made ma-
jor contributions to our understanding of zoonotic
infections. During the bovine spongiform enceph-
alopathy (BSE) epidemic in Britain, models were
used to extract and synthesize basic knowledge
from clinical and epidemiological data, while alsoextrapolating trends from unfoldingevidence about
the mysterious pathogen (16 , 17 ). Models of rabies
transmission have provided biological insight,
guided vaccination policy, and predicted spa
spread (18 – 20). Following the emergence
SARS coronavirus (SARS-CoV), models w
applied to measure the virus’s transmissibility a
to refine plans for epidemic containment via
fection control and case isolation (21, 22). Mod
ing studies predicted that quarantine would b
relatively inefficient means of controlling SA
(23, 24), and this was confirmed in later analy
of outbreak data (25).
Comparative analyses have characterized edemiological phenomena, such as host hete
geneity, across suites of zoonotic pathogens a
have coupled the findings to models to study d
W e s t N i l e v i r u s ,
B r
u c e l l a a b o r t u s
P a n d e m i c i n f l u e n z a , Y
e r s i n i a p e s t i s
M o n k e y p o x ,
L e i s h m
a n i a i n f a n t u m
Reservoir dynamics –enzootic or epizootic
A BII III IV
Stages
• Reservoir species (1 or more)
• Host population dynamics
• Density dependence of transmission
• Transmission mechanism• Environmental influences
• Agricultural practices
• Re rv ir ecies (1 or more)
• Ho t ulation dyn mi s
• Den ity e en nce f tran mission
• Transmi sion mech nism• Envir nment l influence
• Agricul ural pr ctices
Spillover forceof infection
(R 0< 1)
(R 0> 1)
Stuttering transmissionamong humans
Spillover transmissionacross species
• Butchering• Food-safety practices• Cooking practices
• Duration and proximity of contact
• Vector competence
• Human immune defenses• Dose• Pathogen genotype (degree ofadaptation to humans)
Allzoonoses
Direct
Reservoir-human contact rate
• Reservoir population abundance• Spatial overlap• Human risk behaviors
• Harvest rate (agriculture or hunting)• Human consumption rate• Species preference
• Transmission mechanism
• Vector community
• Vector abundance• Biting rates & preferences
Food-borne
Direct
Direct andvector
Vector
Probability of infection
Food-borne
Vector
Allzoonoses
Prevalence in reservoir
Sustained transmission& human outbreaks
Fig. 1. (A) Schematic diagram of zoonotic transmission dynamics. Zoonosescan involve as many as four dynamical phases, including enzootic or epizooticcirculation in the animal reservoir, spillover transmission from animals tohumans, and sometimes self-limiting stuttering chains of human-to-humantransmission or sustained transmission leading to outbreaks. Adapting Wolfeet al. (6), we classify zoonotic pathogens into three stages (II, III, and IV)
according to their transmissibility among humans. (B) The spillover forceinfection is determined by the product of three major components. The foof infection is defined as theper capita rate of infectionof susceptible humaBeneath each major component is a list of contributing factors drawn frmany disciplines; these factors may pertain to all zoonoses or to particutransmission modes, as indicated.
www.sciencemag.org SCIENCE VOL 326 4 DECEMBER 2009
RE

7/31/2019 Lloyd Smith+Et+Al.+2009
http://slidepdf.com/reader/full/lloyd-smithetal2009 4/7
namical consequences (26 , 27 ). For instance, anal-
ysis of detailed outbreak data shows that highly
infectious “superspreaders” exist for all pathogens
(although to varying degrees), and modeling
shows that their existence makes outbreaks rarer
but more explosive (26 ). Theoretical studies have
illuminated central mechanisms relevant to zoonotic
dynamics: Analysis of the population dynamics
of multihost pathogens revealed the influence of
host species diversity on reservoir dynamics and
spillover risk (28), while a hybrid transmission-
evolution model showed the potential for stage
III zoonoses to adapt to humans before their stut-
tering chains of transmission die out (29). Zoonotic
dynamics have clear parallels with invasion biol-
ogy (as spillover, stuttering chains, and outbreaks
correspond roughly to the invasion phases of
introduction, establishment, and population ex-
pansion), raising the possibility of fruitful cross-
fertilization between theoretical frameworks for
these fields (30).
In contrast to the complete lack of application
of models during the last influenza pandemic in
1968, dynamical models now play a key role in
preparing for and responding to pandemic influ-
enza strains [e.g., (31)]. For example, school clo-
sure has been identified as an important control
measure duringthe early phase of pandemic spread
(32) and was implemented in cities across the
UnitedStates that were affectedby the novel H1N1
influenza (“swine flu”) in Spring 2009. Models of
bothinfluenza and SARS have exposed the futility
of imposing travel restrictions once a pathogen is
already spreading within a region [e.g., (24, 33)],
and such restrictions were largely avoided, follow-
ing the recognition that the 2009 H1N1 influenza
strain was already widespread when it was discov-
ered. Meanwhile, established methods for the esti-
mationof R0 have helpedto speed determination
this crucial parameter for the pandemic strain (3
Surveying the Field: Skews and Gaps
Where has modeling research concentrated acr
the gamut of zoonotic pathogens and epidem
logical challenges? Where are the major gaps
our knowledge, and how can dynamical mod
be used to integrate empirical findings, guide hea
policy, and drive innovative research?
We systematically surveyed 442 model
studies addressing 85 species of zoonotic path
gens, and found surprising gaps and tremendo
skews in coverage (for details, see support
online material). Viral diseases have domina
zoonotic modeling, led by pandemic influen
SARS, and rabies, which together account
almost half of all zoonotic models (Table 1 a
fig. S1). Bacterial and protozoan pathogens ha
Data
Model
95% confidence interval
x
E f f e c t i v e
r e p r o d u c t i v e n u m b e r
0
1
6
Time
Estimate
95% confidence interval
Susceptible
Infected
Recovered
Time
P r o p o r t i o n o f p o p u l a t i o n
eTim
A B
CEstimate key parameters
Link data across scales
Study control measures
Explain observed patterns
Predict future trends
C a s e s
C a s e s
Time
Time
Controlbegins
m o r e c a
s e s
Rainfall
H e r d s i z e
Fig. 2. Dynamical models for epidemics. (A) Schematic diagram of the basicSIR model, showing progression of hosts from susceptible to infected to recov-ered states. The dotted arrows represent transmission of infection to new casesresulting from contacts between susceptible and infected individuals. (B) Thesimple epidemic curve (red) predicted by the SIR model for a closed population(i.e., without renewal by immigration or birth of new hosts) and R0 > 1. Thecurves for the declining proportion of hosts that are susceptible to infection is
black and for the rising proportion that are recovered and immune is blue. Dynamical models provide unique insights and allow researchers to ask qutions that cannot be addressed by other methods. For example, these modenable estimation of epidemiological parameters linked to key mechanismintegration of data spanning multiple spatial scales, comparison of alternatcontrol strategies, prediction of future trends, and explanation of observpatterns based on mechanistic hypotheses.
4 DECEMBER 2009 VOL 326 SCIENCE www.sciencemag.org64
REVIEW

7/31/2019 Lloyd Smith+Et+Al.+2009
http://slidepdf.com/reader/full/lloyd-smithetal2009 5/7
received much less attention relative to their im-
portance. Vector-borne and food-borne zoonoses
also have been neglected by dynamical modelers
compared with infections transmitted by direct
contact. Consequently, many zoonotic diseases
of great public health concern, such as leptospi-
rosis and yellow fever, have rarely been modeled
(Table 1), and so we lack a formal framework to
understand the transmission dynamics of these
diseases or to respond to sudden changes in their
epidemiology.The current literature often fails to account for
the multihost ecology of zoonotic pathogens. The
great majority of modeling studies consider just a
single phase of the zoonotic process, typically fo-
cusing on dynamics in the reservoir or outbreaks
in the human population (fig. S2). Models incor-
porating spillover transmission — the defining pro-
cess of zoonotic dynamics — are dismayingly rare.
For directly transmitted zoonoses, we found only
six dynamical studies that include a mechanistic
model of animal-to-human spillover. For vector-
borne and food-borne infections, this number is
higher but still a clear minority. Rather than inte-
grating across host species and dynamical phasesto address questions aimed at the zoonotic nature
of these pathogens, too often we find zoonoses
being treated “ piece-wise” as a concatenation of
single-host processes (or worse, some phases are
ignored completely).
A similar gap is evident in the modeling of
stuttering chains of transmission(fig. S2), wherein
zoonotic pathogens transmit inefficiently among
humans so any minor outbreaks triggered by spill-
over events inevitably die out. Despite their lim-
ited epidemic potential, such pathogens present
epidemiologists with considerable challenges that
are often best addressed by using mathematical
models. For instance, monkeypox virus has long
been known to spread inefficiently among humans,
but its transmissibility appears to be rising as pop-
ulation immunity drops because fewer people have
been vaccinated against smallpox (35, 36 ). Surveil-
lance data for stage III zoonoses, such as monkey-
pox, Nipah virus, or H5N1 avian influenza, can be
analyzed to estimate human-to-human transmis-
sibility and to define signatures of possible viral
adaptation to humans (37 ). Given that pathogens
in this class are the best-identified threats for fu-ture pandemics in the human population, study of
their dynamics should be prioritized for attention.
Several patterns stand out among the existing
models (fig. S3). They have been primarily applied
to studying the efficacy of control measures, with
the secondary aims of estimating epidemiological
parameters of interest and explaining observed
patterns in field data. Prediction of future trends
is a major focus for models of pandemic influ-
enza and BSE, but this aim is rarely applied to
other pathogens. Equally notable are the ques-
tions missing from these studies. The dynamics
of pathogen populations within individual hosts
have rarely been included in models of zoonotictransmission dynamics, with the notable excep-
tion of food-borne pathogens, where the associ-
ation between pathogen titers in livestock (before
and during processing into meat) and infection
risk to humans has been studied. Evolutionary
issues are similarly neglected, despite the press-
ing concerns surrounding adaptation to humans
and pandemic emergence for several pathogens.
It is particularly striking that of the 62 models of
SARS dynamics we found, none deals with path-
ogen evolution, despite the accumulating evi-
dence that the virus was adapting rapidly as it
circulated among humans (38). This gap remains
because of the paucity of data linking pathog
genotypes to phenotypes (in particular, transm
sibility) at the population scale. This is an imp
tant andtractable topic forempiricaland theoreti
research, especially given the increasing avai
bility of genetic sequence data (39). Interactio
among pathogen species have also been larg
neglected, even though empirical data show t
coinfections are relatively common and that d
ferent pathogens can facilitate or hamper ea
other ’s spread through direct or immune-mediainteractions (40). Finally, there has been little
search that integrates transmission dynamics
zoonoses with economic considerations, desp
the clear relevance of this synthesis to control p
icy (e.g., 32).
Data and the Link to Reality
A crucial component of a robust and applicab
science of zoonotic dynamics is the use of data
estimate parameters andto validate model outp
and another is the thoughtful treatment of da
limited situations based on rigorous sensitiv
analysis. Although most studies use some data
parameterize or validate models, their use is higvariable (fig. S3B). At the simplest, many a
thors borrow data-derived parameter values fr
earlier studies or fit model projections to epidem
curves. More advanced studies use dynami
reasoning to arrive at new methods of gleani
insights from available data (e.g., 41). For stud
aimed at projecting epidemic trends, the gold st
dard is to validate model output by comparing
with independently gathered data that has n
been used for the construction of the model. N
table examples include the“ post-diction” of glo
spread of the 1968 influenza pandemic, based
air traffic data (42), and the validation of B
Table 1. Modeling effort for selected zoonotic pathogens, organized by pathogen stage (see Fig. 1A) and number of published dynamical modeAbbreviations: EV, encephalitis virus; HF, hemorrhagic fever; BSE, bovine spongiform encephalopathy.
Pathogen stageNumber of modeling studies
0 1 to 5 6 to 10 11 to 20 >20
II
(Spillover only)
Babesia microti
Bartonella henselae
Chlamydophila psittaci
Coxiella burnetii
Francisella tularensis
Hendra virus
Rickettsia prowazekii
Rickettsia typhi
Streptococcus suisVenezuelan equine EV
Bacillus anthracis
Campylobacter jejuni
Japanese EV
Leptospira interrogans
Puumala virus
Salmonella typhimurium
Tick-borne EV
Brucella abortus
Louping ill virus
Toxoplasma gondii
Trypanosoma brucei rhodesiense
West Nile virus
Borrelia burgdorferi
Sin Nombre virus
Trypanosoma cruzi
BSE
Rabies virus
III
(Spillover +
stuttering chains)
Andes virus
Lassa virus
Machupo virus
Nipah virus
Leishmania chagasi
Crimean-Congo HF virus
Monkeypox virus
Yersinia enterocolitica
Leishmania infantum E. coli O157:H7 Influenza A (avian
Mycobacterium bov
IV
(Spillover +
possible outbreaks)
Barmah forest virus
Dengue virus (sylvatic)
Leishmania donovani
Marburg virus
Mayaro virus
Chikungunya virus
Ebola virus
Ross River virus
Yellow fever virus
Yersinia pestis Influenza A (pandem
SARS-CoV
www.sciencemag.org SCIENCE VOL 326 4 DECEMBER 2009
RE
7/31/2019 Lloyd Smith+Et+Al.+2009
http://slidepdf.com/reader/full/lloyd-smithetal2009 6/7
models developed for England,
by using independentdata from
Northern Ireland (43). Models
canalsointeract powerfully with
population-level experiments
to confirm mechanisms under-
lying observed patterns (44).
Broad patterns of data usage
are, of course, determined by the
availability of relevant data sets.
The free availability of epidemiccurves led to two-thirds of SARS
modeling studies’ incorporating
population-level data, and early
analyses of SARS disease pro-
gression enabled widespread use
of data-driven parameters (45).
For influenza, the well-known
clinical course of infection has
enabled widespread use of data
in parameterizing models, but
model-fitting to epidemic curves
has been less common. Studies
focusing on zoonoses in their animal reservoirs
(e.g., rabies and bovine tuberculosis) have reliedlargely on individual-level parameters, owing to
the relative rarity of collated population data for
animal diseases. In contrast, however, all the BSE
models were fit to population data, which reflects
the intensive and cumulative study of the British
epidemic and later application of these methods
to BSE data from other countries.
Data-free modeling tends to be more common
for pathogens that have fewer models overall; this
likely reflects either the complete unavailability
of data or the lack of opportunity to borrow data-
informed parameter values from other studies.
However, a broad and vibrant literature has ap-
plied statistical methods to analyze the epidemi-ological and spatial patterns of zoonotic infections
[e.g., (46, 47 )], and opportunities to link these
findings with dynamical models too often go
unrealized.
Looking beyond the use of data, the best
modeling studies are those that engage substan-
tively, and realistically, with current thinking in
biology or public health. However, detail and model
complexity are not equivalent to realism, and a
simple model can yield more insight than a mas-
sive simulation thatis not fully understood. Detailed
simulation models are necessary to address some
important questions, but model complexity should
be increased cautiously and with an awareness of
the associated costs of reduced transparency, a
multiplicity of often unknown parameters, and
the resulting need for intensive investigation of
how model assumptions may influence conclusions
[e.g., (31)]. A hierarchical approach, comparing
the behavior of models with different degrees of
detail, can aid the design and interpretation of
complex models.
Response Dynamics andtheDeterminants of Effort
Given the prevailing focus of zoonotic models on
designing and assessing control measures, as well
as the unique potential of models to estimate im-
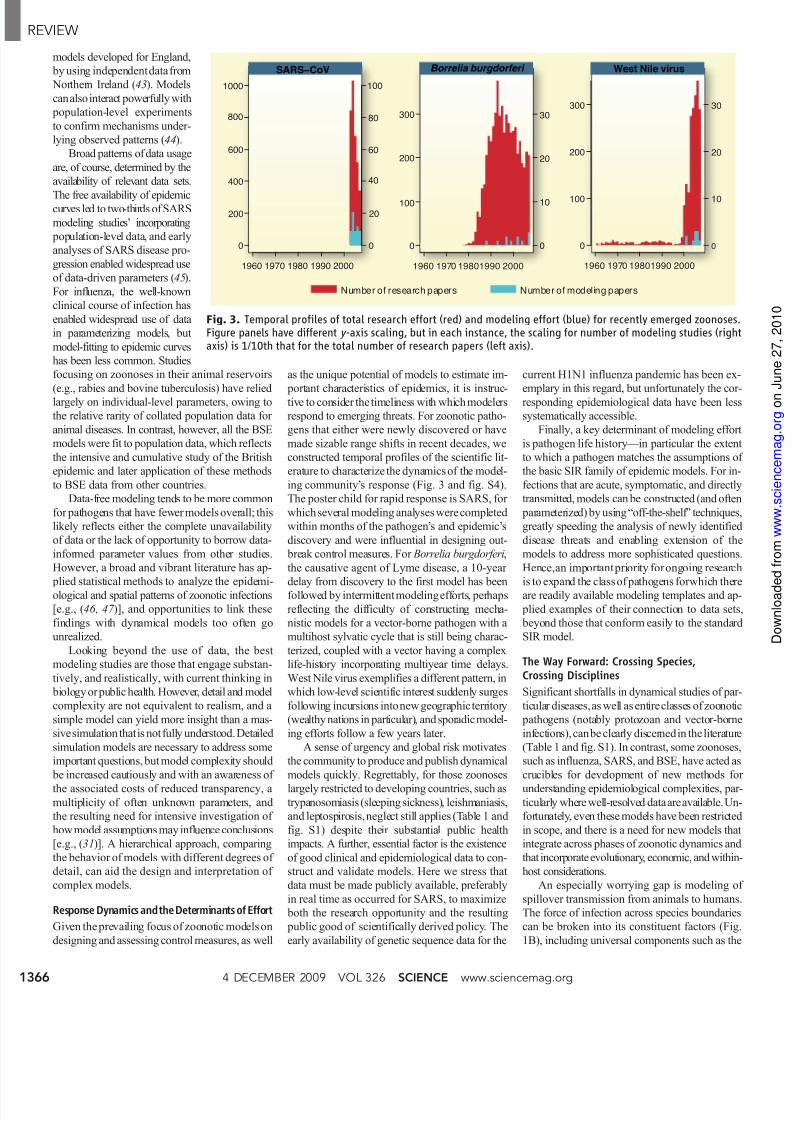
portant characteristics of epidemics, it is instruc-tive to consider the timeliness with which modelers
respond to emerging threats. For zoonotic patho-
gens that either were newly discovered or have
made sizable range shifts in recent decades, we
constructed temporal profiles of the scientific lit-
erature to characterize the dynamics of the model-
ing community’s response (Fig. 3 and fig. S4).
The poster child for rapid response is SARS, for
which several modeling analyses were completed
within months of the pathogen’s and epidemic’s
discovery and were influential in designing out-
break control measures. For Borrelia burgdorferi,
the causative agent of Lyme disease, a 10-year
delay from discovery to the first model has beenfollowed by intermittent modelingefforts, perhaps
reflecting the difficulty of constructing mecha-
nistic models for a vector-borne pathogen with a
multihost sylvatic cycle that is still being charac-
terized, coupled with a vector having a complex
life-history incorporating multiyear time delays.
West Nile virus exemplifies a different pattern, in
which low-level scientific interest suddenly surges
following incursions intonew geographic territory
(wealthy nations in particular), and sporadic model-
ing efforts follow a few years later.
A sense of urgency and global risk motivates
the community to produce and publish dynamical
models quickly. Regrettably, for those zoonoses
largely restricted to developing countries, such as
trypanosomiasis (sleeping sickness), leishmaniasis,
and leptospirosis, neglect still applies (Table 1 and
fig. S1) despite their substantial public health
impacts. A further, essential factor is the existence
of good clinical and epidemiological data to con-
struct and validate models. Here we stress that
data must be made publicly available, preferably
in real time as occurred for SARS, to maximize
both the research opportunity and the resulting
public good of scientifically derived policy. The
early availability of genetic sequence data for the
current H1N1 influenza pandemic has been e
emplary in this regard, but unfortunately the cresponding epidemiological data have been l
systematically accessible.
Finally, a key determinant of modeling eff
is pathogen life history — in particular the ext
to which a pathogen matches the assumptions
the basic SIR family of epidemic models. For
fections that are acute, symptomatic, and direc
transmitted, models can be constructed (and of
parameterized) by using“off-the-shelf ” techniqu
greatly speeding the analysis of newly identif
disease threats and enabling extension of
models to address more sophisticated questio
Hence,an important priority for ongoing resea
is to expand the class of pathogens forwhich thare readily available modeling templates and
plied examples of their connection to data s
beyond those that conform easily to the stand
SIR model.
The Way Forward: Crossing Species,
Crossing Disciplines
Significant shortfalls in dynamical studies of p
ticular diseases,as well as entire classes of zoono
pathogens (notably protozoan and vector-bo
infections), canbe clearly discernedin the literat
(Table 1 and fig. S1). In contrast, some zoonos
such as influenza, SARS, and BSE, have acted
crucibles for development of new methods
understanding epidemiological complexities, p
ticularly where well-resolved data are available.U
fortunately, even these models have been restric
in scope, and there is a need for new models th
integrate across phases of zoonotic dynamics a
that incorporate evolutionary, economic, and with
host considerations.
An especially worrying gap is modeling
spillover transmission from animals to huma
The force of infection across species boundar
can be broken into its constituent factors (F
1B), including universal components such as
1960 1970 1980 1990 2000
0 0
100
200
300
200100
200
300
0
400
600
800
1000
0
10
20
30
0 0
10
20
30
20
40
60
80
100
1960 1970 19801990 2000 1960 1970 19801990 2000
Number of research papers Number of modeling papers
SARS−CoV Borrelia burgdorferi West Nile virus
Fig. 3. Temporal profiles of total research effort (red) and modeling effort (blue) for recently emerged zoonosFigure panels have different y -axis scaling, but in each instance, the scaling for number of modeling studies (rigaxis) is 1/10th that for the total number of research papers (left axis).
4 DECEMBER 2009 VOL 326 SCIENCE www.sciencemag.org66
REVIEW

7/31/2019 Lloyd Smith+Et+Al.+2009
http://slidepdf.com/reader/full/lloyd-smithetal2009 7/7
role of human susceptibility, risk behaviors, and
infection prevalence in the reservoir, as well as
particular details related to transmission routes
and pathogen-specific biology. Spillover risk also
can be influenced by dynamical phenomena: One
innovative study posits that epizootic peaks of
hantavirusin rodent reservoirs, with accompanying
spikes in numbers of newly infected rodents ex-
creting large quantities of virus, lead to high con-
centrations of virus in the environment and hence
an increased risk of human infection (48). Further research will reveal whether such hypotheses may
hold true generally across zoonotic systems.
It is initially surprising that most of the best
models of spillover have been developed for the
more complex vector-borne and food-borne zoono-
ses, but this arises because the process of trans-
mission can often be observed directly in such
systems. Studies of vector-borne infections have
used quantitative frameworks to integrate data on
host competency, vector feeding preferences, and
environmental conditions to be able to estimate
spillover risk from different ecological pathways,
although without explicitly incorporating dynam-
ics (49). The food safety literature has treated therisk of pathogens crossing from animal hosts to
human exposures in vivid mechanistic detail (50),
setting a high standard to be matched by disease
ecologists. For directly transmitted zoonoses, it is
straightforward to construct a basic model with
cross-species transmission (20), but it is very chal-
lenging to delve into underlying mechanisms and
estimate key parameters, particularly the cross-
species contact rate and the resulting probability
of infection, which typically arise from multiple
and largely unobserved ecological, behavioral,
and physiological factors. Research in this area is
clearly limited by available data from multiple host
species, but the plummeting cost of genetic se-quencing brings exciting opportunities for mapping
cross-species transmission (51).
A second major gap lies in analysis of stutter-
ing chains of inefficient human-to-human transmis-
sion following spillover. Data from these settings
are dominated by stochastic effects and hetero-
geneities among hosts and environments, and anal-
ysis is complicated by the fundamental problem
of distinguishing between primary and secondary
cases. The central challenges in the study of stage
IIIzoonoses include quantifying the rate of human-
to-human transmission against a background of
spillover and monitoring for changes in pathogen
transmissibility that may represent steps toward
emergence of new stage IV pathogens (29).
The study of zoonotic dynamics offers a unique
window into fundamental questions of pathogen
ecology and evolution and provides vital insights
into public health issues. We need models to re-
veal the points of vulnerability where interven-
tion against zoonoses will be most effective and
to highlight the gaps in data collection. We need
to know when particular zoonotic phases, e.g.,
reservoir transmission, spillover from animals to
humans, stuttering transmission, or incipient out-
breaks among humans, can be targeted to optimize
epidemiological outcomes while reducing cost.
How should health policy be adapted to account
for environmental change or regional differencesin ecology and sociology? How might zoonotic
pathogens evolve in response to anthropogenic
forces or control strategies? Dynamical models,
rooted in data, provide an essential framework
for addressing these critical questions.
References and Notes1. M. E. J. Woolhouse, S. Gowtage-Sequeria, Emerg.
Infect. Dis. 11, 1842 (2005).
2. L. H. Taylor, S. M. Latham, M. E. J. Woolhouse, Philos.
Trans. R. Soc. London B Biol. Sci. 356, 983 (2001).
3. N. D. Wolfe, C. P. Dunavan, J. Diamond, Nature 447, 279
(2007).
4. D. M. Morens, G. K. Folkers, A. S. Fauci, Lancet Infect. Dis.
8, 710 (2008).
5. K. E. Jones et al., Nature 451, 990 (2008).
6. S. R. Palmer, E. J. L. Soulsby, D. I. H. Simpson, Zoonoses:
Biology, Clinical Practice, and Public Health Control
(Oxford Univ. Press, New York, 1998).
7. J. E. Childs, Curr. Top. Microbiol. Immunol. 315, 389
(2007).
8. R. A. Weiss, A. J. McMichael, Nat. Med. 10, S70 (2004).
9. M. S. Smolinksy, M. A. Hamburg, J. Lederburg,
Eds., Microbial Threats to Health: Emergence, Detection,
and Response (Institute of Medicine, National Academies
Press, Washington, DC, 2003).
10. R. Hassan, R. Scholes, N. Ash, Eds., Ecosystems and
Human Well-Being: Current State and Trends: Findings of
the Conditions and Trends Working Group Millennium
Ecosystem Assessment , vol. 1 (Island Press, Washington,
DC, 2005).
11. T. Kuiken et al., Science 312, 394 (2006).
12. N. D. Wolfe, P. Daszak, A. M. Kilpatrick, D. S. Burke,Emerg. Infect. Dis. 11, 1822 (2005).
13. P. Daszak et al., Curr. Top. Microbiol. Immunol. 315, 463
(2007).
14. R. M. Anderson, R. M. May, Infectious Diseases of
Humans: Dynamics and Control (Oxford Univ. Press,
Oxford, 1991).
15. M. J. Keeling, P. Rohani, Modeling Infectious Diseases in
Humans and Animals (Princeton Univ. Press, Princeton,
NJ, 2008).
16. R. M. Anderson et al., Nature 382, 779 (1996).
17. N. M. Ferguson, C. A. Donnelly, M. E. J. Woolhouse,
R. M. Anderson, Philos. Trans. R. Soc. London B Biol. Sci.
352, 803 (1997).
18. C. A. Russell, D. L. Smith, J. E. Childs, L. A. Real, PLoS Biol.
3, e88 (2005).
19. K. Hampson et al., PLoS Biol. 7, e1000053 (2009).
20. D. L. Smith, B. Lucey, L. A. Waller, J. E. Childs, L. A. Real,
Proc. Natl. Acad. Sci. U.S.A. 99, 3668 (2002).21. S. Riley et al., Science 300, 1961 (2003).
22. M. Lipsitch et al., Science 300, 1966 (2003).
23. J. O. Lloyd-Smith, A. P. Galvani, W. M. Getz, Proc. R. Soc.
London B. Biol. Sci. 270, 1979 (2003).
24. A. B. Gumel et al., Proc. R. Soc. London B. Biol. Sci. 2
2223 (2004).
25. Y. H. Hsieh et al., J. Theor. Biol. 244, 729 (2007).
26. J. O. Lloyd-Smith, S. J. Schreiber, P. E. Kopp, W. M. G
Nature 438, 355 (2005).
27. M. E. J. Woolhouse et al., Proc. Natl. Acad. Sci. U.S.A.
338 (1997).
28. A. Dobson, Am. Nat. 164, S64 (2004).
29. R. Antia, R. R. Regoes, J. C. Koella, C. T. Bergstrom,
Nature 426, 658 (2003).
30. J. E. Childs, J. A. Richt, J. S. Mackenzie, Curr. Top.
Microbiol. Immunol. 315, 1 (2007).
31. M. E. Halloran et al., Proc. Natl. Acad. Sci. U.S.A. 10
4639 (2008).
32. S. Cauchemez et al., Lancet Infect. Dis. 9, 473 (2009
33. B. S. Cooper, R. J. Pitman, W. J. Edmunds, N. J. Gay, P
Med. 3, e212 (2006).
34. C. Fraser et al., Science 324, 1557 (2009).
35. A. W. Rimoin et al., Emerg. Infect. Dis. 13, 934
(2007).
36. P. E. M. Fine, Z. Jezek, B. Grab, H. Dixon, Int. J.
Epidemiol. 17, 643 (1988).
37. N. M. Ferguson, C. Fraser, C. A. Donnelly, A. C. Ghan
R. M. Anderson, Science 304, 968 (2004).
38. T. Sheahan et al., J. Virol. 82, 2274 (2008).
39. B. T. Grenfell et al., Science 303, 327 (2004).
40. A. L. Graham, I. M. Cattadori, J. O. Lloyd-Smith,
M. J. Ferrari, O. N. Bjornstad, Trends Parasitol. 23, 2
(2007).
41. J. Wallinga, P. Teunis, Am. J. Epidemiol. 160, 509
(2004).42. L. A. Rvachev, I. M. Longini Jr., Math. Biosci. 75, 3
(1985).
43. N. M. Ferguson, A. C. Ghani, C. A. Donnelly, G. O. De
R. M. Anderson, Proc. R. Soc. London B. Biol. Sci. 2
545 (1998).
44. M. K. Laurenson, R. A. Norman, L. Gilbert, H. W. Rei
P. J. Hudson, J. Anim. Ecol. 72, 177 (2003).
45. C. A. Donnelly et al., Lancet 361, 1761 (2003).
46. R. J. King, D. H. Campbell-Lendrum, C. R. Davies,
Emerg. Infect. Dis. 10, 598 (2004).
47. R. S. Ostfeld, C. D. Canham, K. Oggenfuss, R. J. Winchcom
F. Keesing, PLoS Biol. 4, e145 (2006).
48. F. Sauvage, M. Langlais, D. Pontier, Epidemiol. Infec
135, 46 (2007).
49. A. M. Kilpatrick, P. Daszak, M. J. Jones, P. P. Marra,
L. D. Kramer, Proc. R. Soc. London B. Biol. Sci. 273
2327 (2006).
50. D. Jordan, S. A. McEwen, A. M. Lammerding, W. B. McN
J. B. Wilson, Prev. Vet. Med. 41, 55 (1999).
51. H. D. Song et al., Proc. Natl. Acad. Sci. U.S.A. 102, 2
(2005).
52. This work was supported by the Research and Policy
Infectious Disease Dynamics (RAPIDD) program of th
Science and Technology Directorate, U.S. Departmen
Homeland Security, and the Fogarty International Cen
NIH. We are grateful to O. Bjornstad, E. McKenzie,
M. Poss, A. Read, and L. Simonsen for valuable comm
and to B. Gee for assistance with figure preparation.
J.L.-S. is grateful for the support of the De Logi Chai
Biological Sciences.
Supporting Online Materialwww.sciencemag.org/cgi/content/full/326/5958/1362/DC1
Materials and Methods
SOM TextFigs. S1 to S4
Tables S1 to S3
References
10.1126/science.1177345
i SCIENCE VOL 326 4 DECEMBER 2009
RE
Related Documents