Llad Phillips 1 Review for the Final: I Concepts and Analytics Concepts and Analytics

Llad Phillips1 Review for the Final: I Concepts and Analytics.
Dec 21, 2015
Welcome message from author
This document is posted to help you gain knowledge. Please leave a comment to let me know what you think about it! Share it to your friends and learn new things together.
Transcript

Llad Phillips 1
Review for the Final: IReview for the Final: I
Concepts and AnalyticsConcepts and Analytics

Llad Phillips 2
Part ICoordinating the Components of
the Criminal Justice System
Part IIThe Serious Offender
Part ICoordinating the Components of
the Criminal Justice System
Part IIThe Serious Offender
Llad Phillips 3
Questions About CrimeQuestions About Crime
Can we explain trends in crime and trends Can we explain trends in crime and trends in expenditure on the criminal justice in expenditure on the criminal justice system?system?
What is the right mix of enforcement and What is the right mix of enforcement and corrections?corrections?

Llad Phillips 4
California Index Offenses and Criminal Justice System . Expenditures, both per capita, 1967-68:1992-93
1992-93
1980-81
1967-68
0
50
100
150
200
250
300
350
400
450
500
0 0.005 0.01 0.015 0.02 0.025 0.03 0.035 0.04
Index Offenses Per Capita .
19
92
$ P
er
Cap
ita

Crime Generation
Crime Control
OffenseRate PerCapita
ExpectedCost ofPunishment
Schematic of the Criminal Justice System
Causes ?!!
(detention,deterrence)
Expenditures
Weak Link
“The Driving Force”

Llad Phillips 6
ConclusionsConclusions
Causal conditions continue to get worseCausal conditions continue to get worse As a consequence we have to spend more As a consequence we have to spend more
real dollars per person to keep crime levels real dollars per person to keep crime levels from risingfrom rising
Crime acts like a taxCrime acts like a tax Californians spend $450 (1992$) per person on Californians spend $450 (1992$) per person on
criminal justice to keep things from getting criminal justice to keep things from getting worseworse

Llad Phillips 7
QuestionQuestion
What happened around 1980 to differentiate What happened around 1980 to differentiate the 50’s, 60’s, and 70’s from the 80’s and the 50’s, 60’s, and 70’s from the 80’s and 90’s?90’s? was there a change in behavior?was there a change in behavior? was there a change in policy?was there a change in policy?

Llad Phillips 8
State Department of Corrections as a Proportion of California Corrections .
0%
20%
40%
60%
80%
100%7
3-7
4
75
-76
77
-78
79
-80
81
-82
83
-84
85
-86
87
-88
89
-90
91
-92
Fiscal Year
Sh
are Cities and Counties, CYA
Dept. of Corrections
Llad Phillips 9
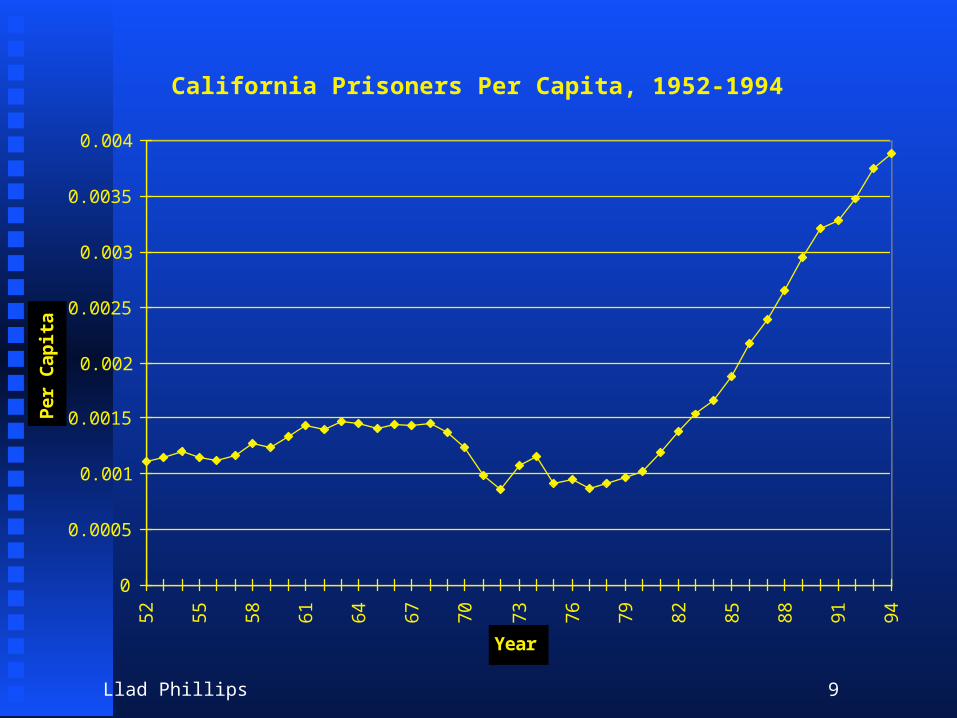
California Prisoners Per Capita, 1952-1994 .
0
0.0005
0.001
0.0015
0.002
0.0025
0.003
0.0035
0.0045
2
55
58
61
64
67
70
73
76
79
82
85
88
91
94
Year
Per
Cap
ita

Llad Phillips 10
Law Enforcement
Prosecution
Courts Public Defense
State Prisons Other Corrections
Llad Phillips 11
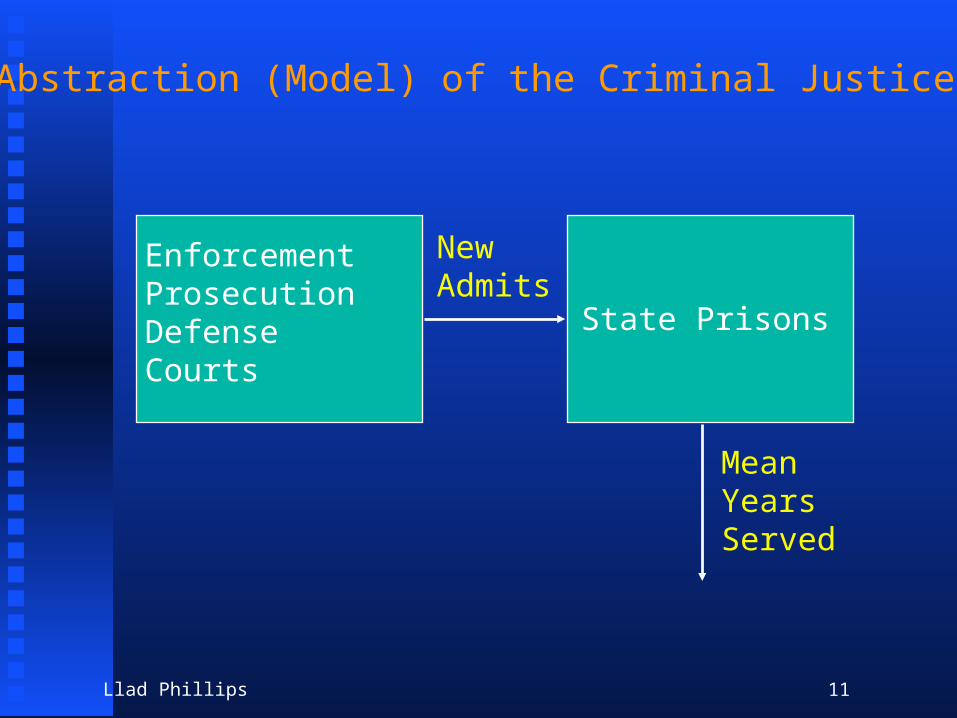
Abstraction (Model) of the Criminal Justice System
EnforcementProsecutionDefenseCourts
State Prisons
NewAdmits
Mean Years Served

Llad Phillips 12
Admitsper Yearper capita
average years served
Tradeoff Between Criminal Justice System Outputs
tan = admits per year per capita/average years served
Llad Phillips 13
Capital constraintCapital constraint
admits per capita per year * average years admits per capita per year * average years served = prisoners per capitaserved = prisoners per capita
Prisoners per capita is limited by prison Prisoners per capita is limited by prison capacitycapacity
If you increase admits per capita per year, If you increase admits per capita per year, then average years served decreases until then average years served decreases until prison capacity catches upprison capacity catches up
Llad Phillips 14
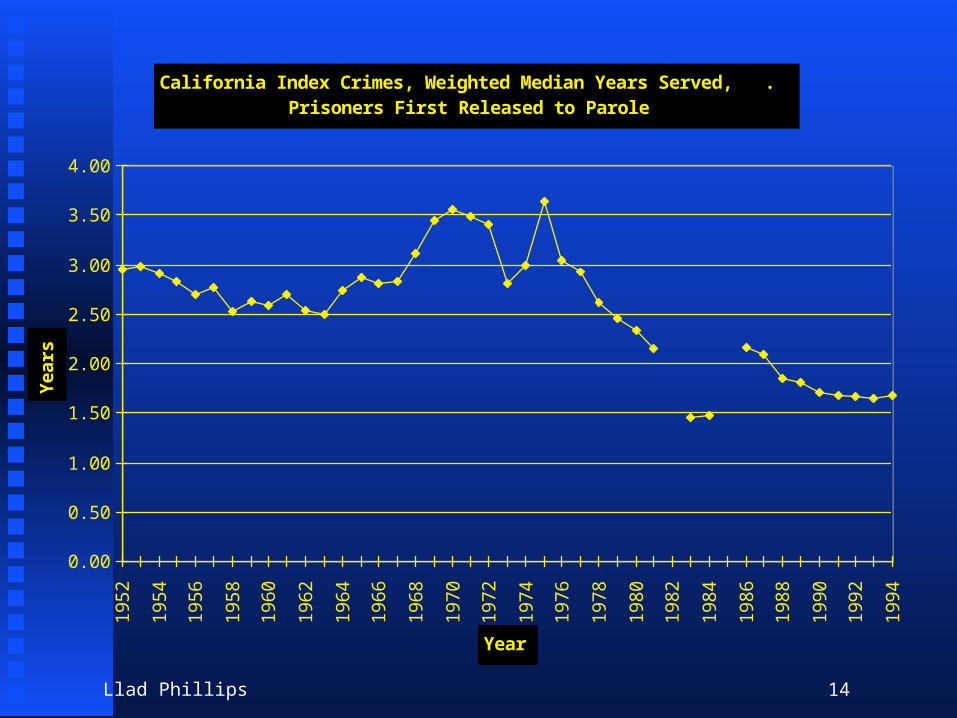
California Index Crimes, Weighted Median Years Served, . Prisoners First Released to Parole
0.00
0.50
1.00
1.50
2.00
2.50
3.00
3.50
4.00
19
52
19
54
19
56
19
58
19
60
19
62
19
64
19
66
19
68
19
70
19
72
19
74
19
76
19
78
19
80
19
82
19
84
19
86
19
88
19
90
19
92
19
94
Year
Years

Llad Phillips 15
45 degrees
Constraint: Admits per year*Average years served =Prisoners
Average Years Served
Admitsper Year
Coordinating CJS

Llad Phillips 16
Admitsper Yearper capita,AD
average years served, S
A Shifting Mix In Criminal Justice System Outputs
tan = admits per year per capita/average years served
Facts1. spend more2. Admit more3. shorter time served
Prison Capacity Constraint

California: New Admits per Capita Vs. Median Years Males .
0
0.0002
0.0004
0.0006
0.0008
0.001
0.0012
0.0014
0.00 0.50 1.00 1.50 2.00 2.50 3.00 3.50 4.00
Median Years Sered
New
Ad
mit
s P
er
Cap
ita
1952
1986
1994
1975
Llad Phillips 18
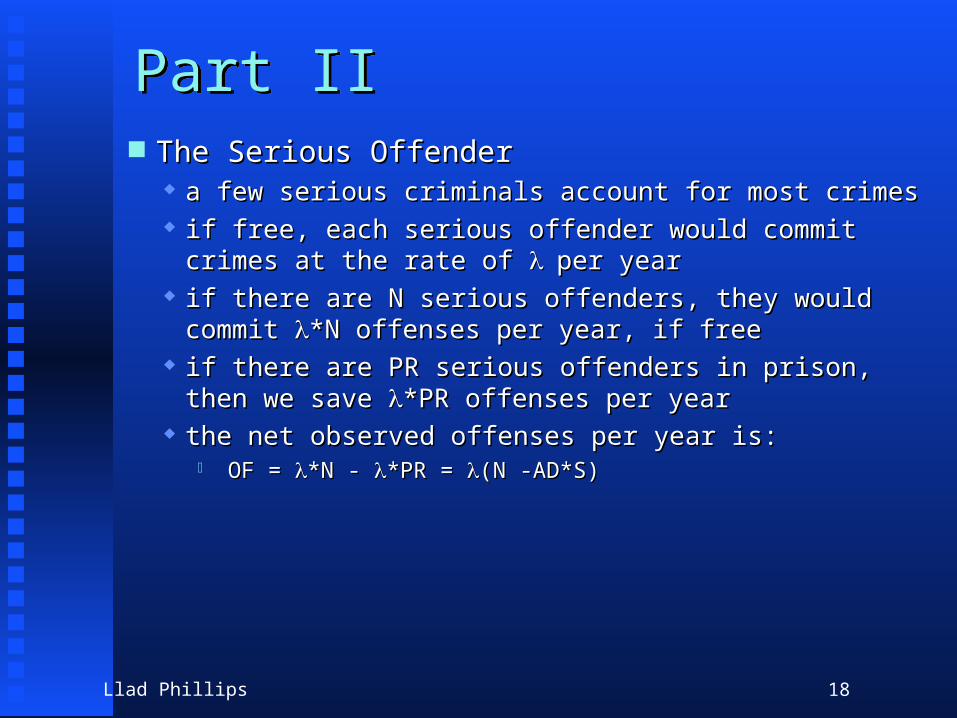
Part IIPart II The Serious OffenderThe Serious Offender
a few serious criminals account for most crimesa few serious criminals account for most crimes if free, each serious offender would commit crimes at the rate if free, each serious offender would commit crimes at the rate
of of per yearper year if there are N serious offenders, they would commit if there are N serious offenders, they would commit *N *N
offenses per year, if freeoffenses per year, if free if there are PR serious offenders in prison, then we save if there are PR serious offenders in prison, then we save *PR *PR
offenses per yearoffenses per year the net observed offenses per year is:the net observed offenses per year is:
OF = OF = *N - *N - *PR = *PR = (N -AD*S)(N -AD*S)

Llad Phillips 19
Population
Serious Offenders, N
Prisoners, PR
Llad Phillips 20
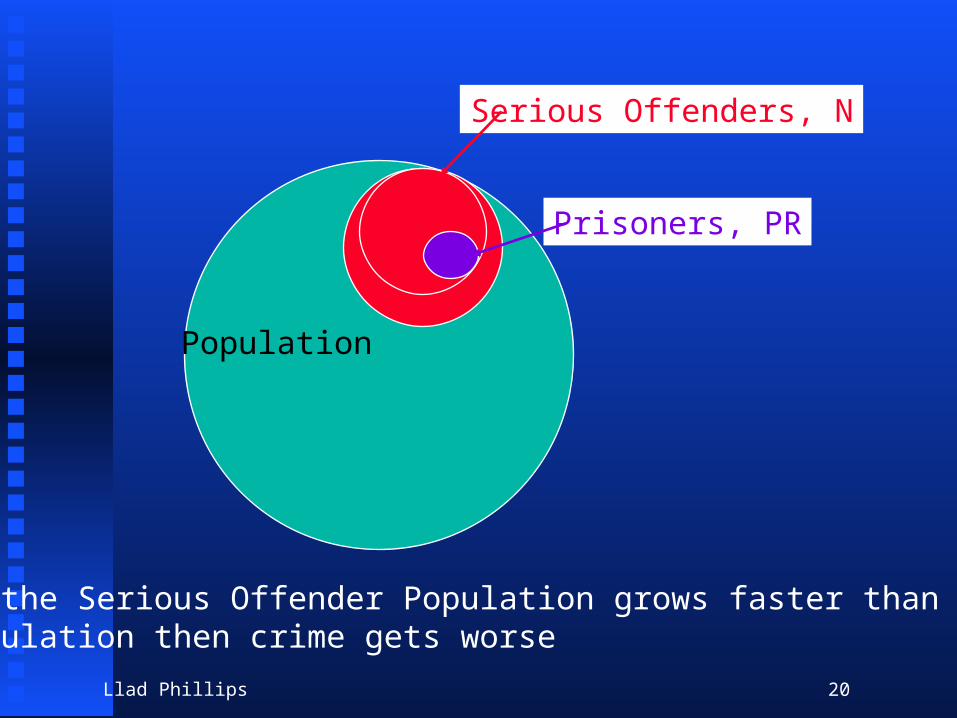
Population
Serious Offenders, N
Prisoners, PR
If the Serious Offender Population grows faster than the PrisonPopulation then crime gets worse

Llad Phillips 21
Likelihood of Going to Prison in a Lifetime
1/4
1/6
1/23
1/10
For
Newborn
Prevalence of Imprisonment in the U. S. Population, 1974-01Source:

Llad Phillips 22
Social Control
Population
Formerly In 10%
In

Llad Phillips 23

Llad Phillips 24
Social Control of CitizenrySocial Control of Citizenry
Civil law and authorityCivil law and authority First line of defense: moral compliance and good First line of defense: moral compliance and good
citizenshipcitizenship Second line of defense: deterrence (the threat of Second line of defense: deterrence (the threat of
punishment)punishment) Third line of defense: detentionThird line of defense: detention
Martial law and authorityMartial law and authority Fourth line of defense: National Guard and the ArmyFourth line of defense: National Guard and the Army

Llad Phillips 25
PercentControl
MoralCompliance
Deterrence Detention
Riot
Civil LawMartialLaw
National Guard

Llad Phillips 26
Is Criminal Justice Just?Is Criminal Justice Just?

Llad Phillips 27
Questions About CrimeQuestions About Crime
Are there Inequities by Income class?Are there Inequities by Income class? for victims?for victims?
Are there ethnic or racial injustices?Are there ethnic or racial injustices? for victims?for victims? for offenders?for offenders?


% Families % Income0 0
20 4.240 14.260 29.980 53.295 79.9100 100
US Family Income, 1994
Lorenz Curve: United States Families, 1994 .
0
10
20
30
40
50
60
70
80
90
100
0 20 40 60 80 100
% Families
% I
nco
me
Equal
Uniform
Family
Source: US Statistical Abstract
Llad Phillips 30
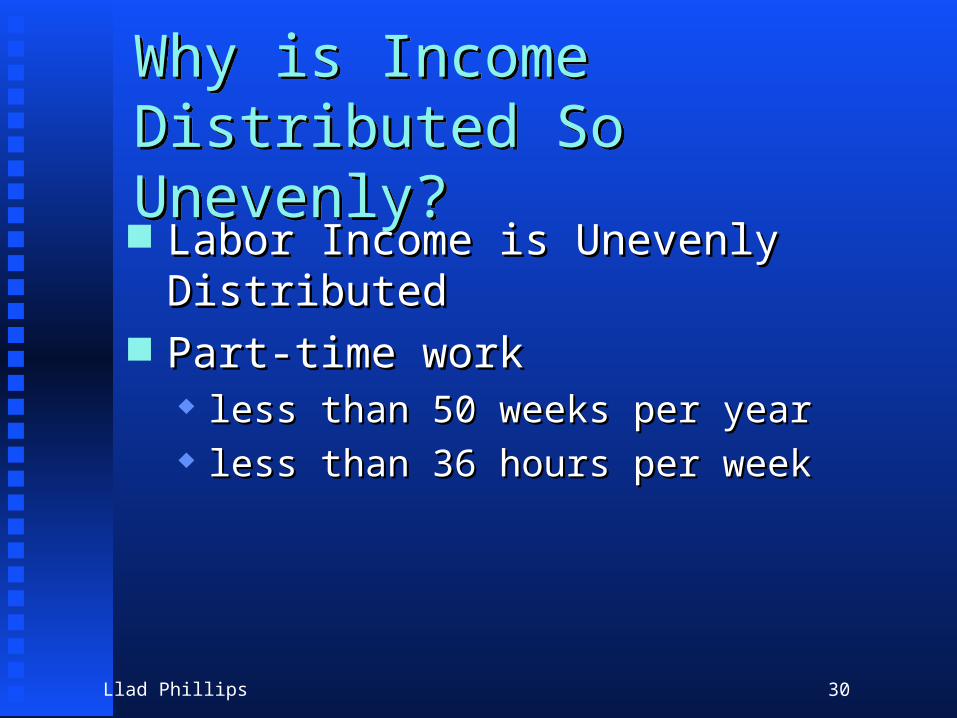
Why is Income Distributed So Unevenly?Why is Income Distributed So Unevenly? Labor Income is Unevenly DistributedLabor Income is Unevenly Distributed Part-time workPart-time work
less than 50 weeks per yearless than 50 weeks per year less than 36 hours per weekless than 36 hours per week

Trends In US Family Income Shares, . Top 5%, Top 20%, Bottom 40%
0
5
10
15
20
25
30
35
40
45
50
1970 1975 1980 1985 1990 1995
% Families
% I
nco
me
Top 5 %
Top 20 %
Bottom 40%
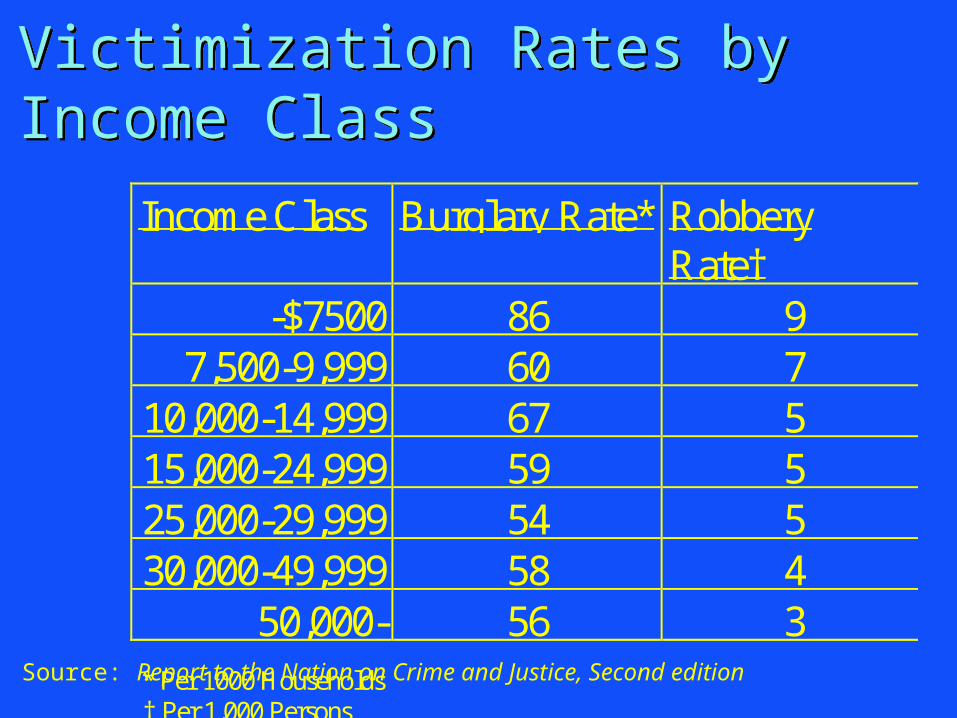
Victimization Rates by Income ClassVictimization Rates by Income Class
Income Class Burglary Rate* RobberyRate†
-$7500 86 97,500-9,999 60 7
10,000-14,999 67 515,000-24,999 59 525,000-29,999 54 530,000-49,999 58 4
50,000- 56 3 * Per 1000 Households † Per 1,000 Persons
Source: Report to the Nation on Crime and Justice, Second edition

Lorenz Curves For Robbery and Burglary Victims .
0
10
20
30
40
50
60
70
80
90
100
0 20 40 60 80 100
% Families
% V
icti
ms
Burglary
Robbery
Equal
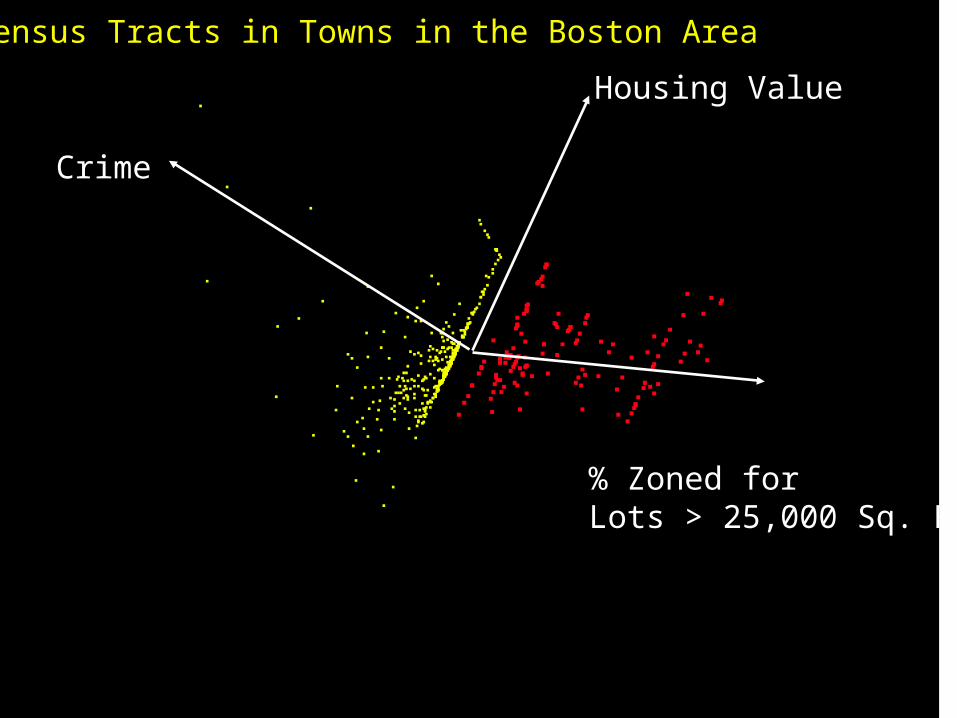
HValue
Crime
%Zoned
Crime
Housing Value
% Zoned forLots > 25,000 Sq. Ft.
Census Tracts in Towns in the Boston Area
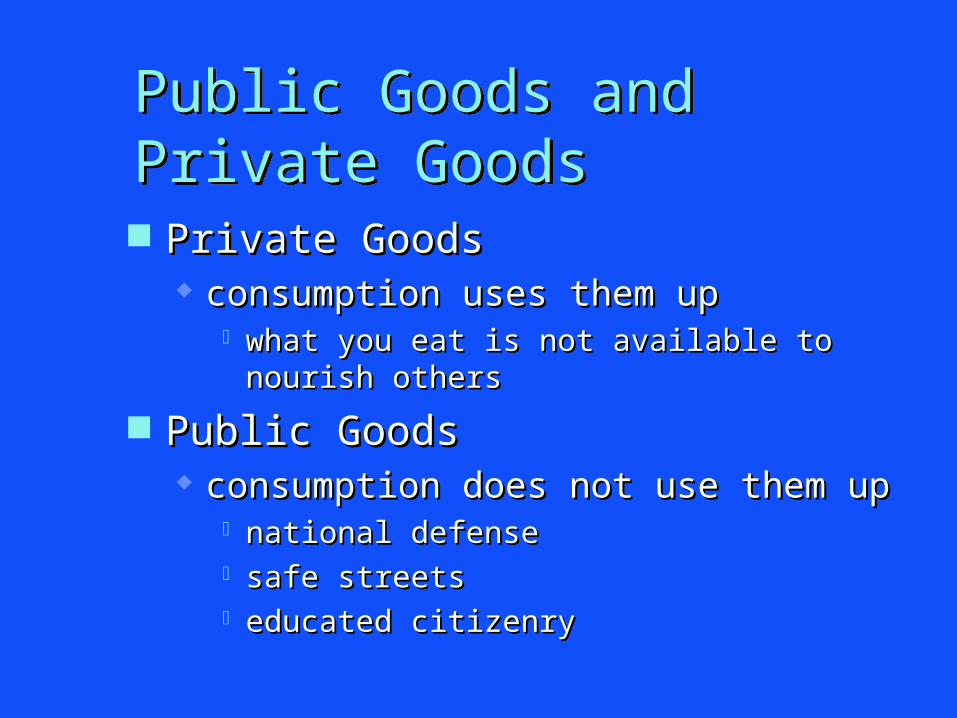
Public Goods and Private GoodsPublic Goods and Private Goods
Private GoodsPrivate Goods consumption uses them upconsumption uses them up
what you eat is not available to nourish otherswhat you eat is not available to nourish others
Public GoodsPublic Goods consumption does not use them upconsumption does not use them up
national defensenational defense safe streetssafe streets educated citizenryeducated citizenry
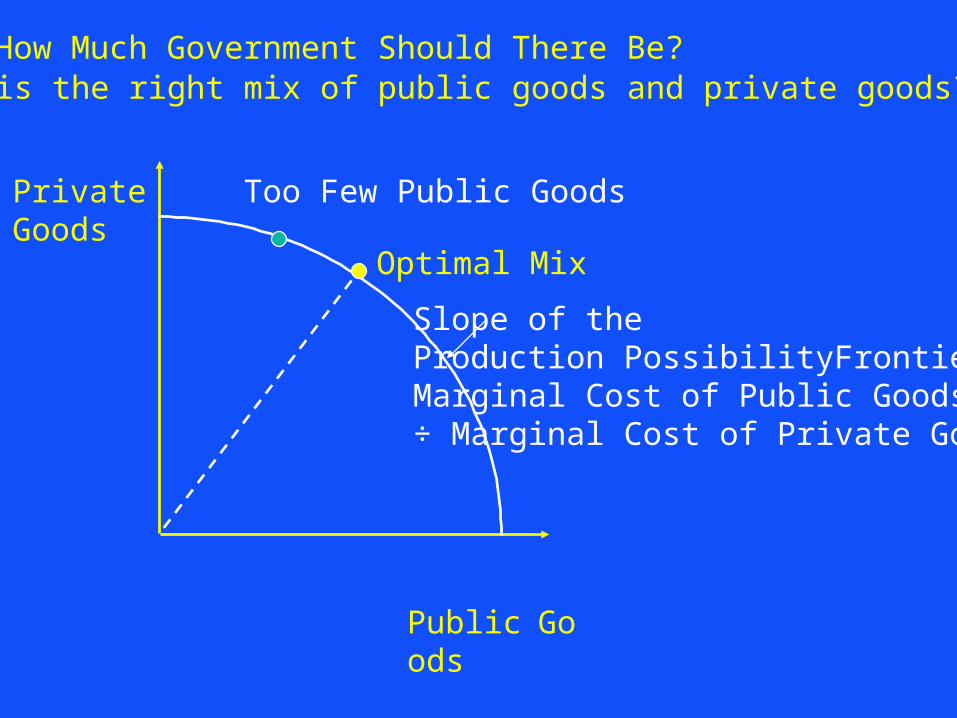
PublicGoods
Private Goods
Optimal Mix
Too Few Public Goods
Slope of the Production PossibilityFrontier:Marginal Cost of Public Goods÷ Marginal Cost of Private Goods
How Much Government Should There Be?What is the right mix of public goods and private goods?

Llad Phillips 37
The Family and DelinquencyThe Family and Delinquency

Llad Phillips 38
The Family and DelinquencyThe Family and Delinquency
What is the role of the family in causing or What is the role of the family in causing or preventing delinquency?preventing delinquency?
How important is the family in considering How important is the family in considering possible causes of delinquency?possible causes of delinquency?

US Families Headed By Women in Percent .
0
5
10
15
20
25
30
35
40
45
1940 1950 1960 1970 1983
Year
Perc
en
t
White
Black
Source: Glenn C. Loury, Ch 1 of Families, Schools, and Delinquency Prevention, eds. James Q. Wilson and Glenn C. Loury

Father’s Income
R
J
Daughter’sIncome
A
If the father is sufficientlyaltruistic, then the daughter’senlightened self-interest is to prefer point A, and she can be induced to behave in a cooperative way, allowing pointJ that leads to point A

Llad Phillips 41
Probability of Ever Being Charged Vs. Family Income .
0
0.05
0.1
0.15
0.2
0.25
0.3
0.35
0 10000 20000 30000 40000 50000 60000 70000 80000
Family Income
Pro
bab
ilit
y
Father Present
Father Absent

Llad Phillips 42
Where does Criminal Justice go from here?Where does Criminal Justice go from here? CaliforniaCalifornia
Strong economy leads to lower property crime Strong economy leads to lower property crime ratesrates
Higher imprisonment rates lead to lower rates Higher imprisonment rates lead to lower rates of violent crimeof violent crime
National PolicyNational Policy Drug treatment programsDrug treatment programs Eisenhower Report(1999): More PreventionEisenhower Report(1999): More Prevention

Llad Phillips 43
Rearrest rates for CA prisonInmates rise to 67% within3 years after release.
Related Documents