Molecular Ecology (2004) 13, 2169–2182 doi: 10.1111/j.1365-294X.2004.02229.x © 2004 Blackwell Publishing Ltd Blackwell Publishing, Ltd. Living with uncertainty: genetic imprints of climate shifts in East Pacific anchovy (Engraulis mordax) and sardine ( Sardinops sagax ) F. LECOMTE,* W. S. GRANT,† J. J. DODSON,* R. RODRÍGUEZ-SÁNCHEZ ‡ and B. W. BOWEN § *Québec-Océan, Département de Biologie, Université Laval, Ste Foy, Québec, Canada, †P.O.Box 240104, Anchorage, Alaska, USA, ‡CICIMAR, Apdo. Post 592, La Paz, Baja California Sur, Mexico, §Hawaii Institute of Marine Biology, University of Hawaii, PO Box 1346, Kaneohe Bay, Hawaii, HI 96744, USA Abstract In the upwelling zone of the northeastern Pacific, cold nutrient-rich conditions alternate with warm nutrient-poor intervals on timescales ranging from months to millennia. In this setting, the abundances of Pacific sardine (Sardinops sagax) and northern anchovy (Engraulis mordax) fluctuate by several orders of magnitude, with sardine dominating during warm conditions and anchovy dominating during cool conditions. Two population models can explain the response of these fishes to adverse conditions. Under the basin model, species distributions contract to a central (optimal) range during population crashes. Expectations of this model may include a single range-wide population with a decline in genetic diver- sity on both sides of a central refuge. In contrast, the self-recruitment model invokes a series of local oceanographic domains that maintain semi-isolated subpopulations. During adverse conditions, some subpopulations cannot complete the life cycle within the local environment and are extirpated. Expectations of this model include some degree of popu- lation genetic structure and no clear gradient in genetic diversity. We examined mitochon- drial DNA cytochrome b sequences to assess these competing models for anchovy (N = 196; 539 bp) and sardine (N = 107; 425 bp). The mitochondrial DNA gene genealogies are shallow but diverse for both species. Haplotype frequencies are homogeneous among subpopula- tions, but genetic diversities peak for both species along Baja California and adjacent southern California. Mismatch distributions and Tajima’s D-values reveal distinctive sig- natures of population bottlenecks and expansions. Sardine haplotypes coalesce at ~241 000 years BP, with an initial female effective population size N f0 = 0 followed by exponential growth to N f1 = 115 million. Anchovy haplotypes coalesce at ~282 000 years BP, with an initial population size of N f0 = 14 000, followed by exponential growth to N f1 = 2.3 million. These results indicate a founder event for sardine and a severe population decline for anchovy in the California Current during the late Pleistocene. Overall, these data support the basin model on decadal timescales, although local recruitment may dominate on shorter timescales. Keywords: basin model, climate change, coalescence, fish, mtDNA, recruitment Received 10 January 2004; revision received 7 April 2004; accepted 7 April 2004 Introduction In contemporary studies of biogeography and evolution, glaciation and other long-term climate changes are regarded as primary influences on genetic diversity and speciation (Hewitt 1996; Avise 2000). Such changes typically occur on a scale of 10 4 −10 6 years. Higher frequency oscillations, such as decadal variations in temperature or productivity, are principally studied under the domain of population dynamics (Cushing 1975). Beyond the description of extirpations and recolonizations, few studies have examined the impact of decadal-scale regime changes on the genetic architectures of species (Jansson & Dynesius 2002). In highly variable environments, fluctuations in abundance and distribution Correspondence: Brian Bowen. Tel.: +1 808-236-7426; Fax: +1 808- 236-7443; E-mail: [email protected]

Welcome message from author
This document is posted to help you gain knowledge. Please leave a comment to let me know what you think about it! Share it to your friends and learn new things together.
Transcript
Molecular Ecology (2004)
13
, 2169–2182 doi: 10.1111/j.1365-294X.2004.02229.x
© 2004 Blackwell Publishing Ltd
Blackwell Publishing, Ltd.
Living with uncertainty: genetic imprints of climate shifts in East Pacific anchovy (
Engraulis mordax
) and sardine (
Sardinops sagax
)
F . LECOMTE,
*
W. S . GRANT,
†
J . J . DODSON,
*
R . RODRÍGUEZ-SÁNCHEZ
‡
and B . W. BOWEN
§
*
Québec-Océan, Département de Biologie, Université Laval, Ste Foy, Québec, Canada,
†
P.O.Box 240104, Anchorage, Alaska, USA,
‡
CICIMAR, Apdo. Post 592, La Paz, Baja California Sur, Mexico,
§
Hawaii Institute of Marine Biology, University of Hawaii, PO Box 1346, Kaneohe Bay, Hawaii, HI 96744, USA
Abstract
In the upwelling zone of the northeastern Pacific, cold nutrient-rich conditions alternatewith warm nutrient-poor intervals on timescales ranging from months to millennia. In thissetting, the abundances of Pacific sardine (
Sardinops sagax
) and northern anchovy (
Engraulismordax
) fluctuate by several orders of magnitude, with sardine dominating during warmconditions and anchovy dominating during cool conditions. Two population models canexplain the response of these fishes to adverse conditions. Under the basin model, speciesdistributions contract to a central (optimal) range during population crashes. Expectationsof this model may include a single range-wide population with a decline in genetic diver-sity on both sides of a central refuge. In contrast, the self-recruitment model invokes a seriesof local oceanographic domains that maintain semi-isolated subpopulations. Duringadverse conditions, some subpopulations cannot complete the life cycle within the localenvironment and are extirpated. Expectations of this model include some degree of popu-lation genetic structure and no clear gradient in genetic diversity. We examined mitochon-drial DNA cytochrome
b
sequences to assess these competing models for anchovy (
N
= 196;539 bp) and sardine (
N
= 107; 425 bp). The mitochondrial DNA gene genealogies are shallowbut diverse for both species. Haplotype frequencies are homogeneous among subpopula-tions, but genetic diversities peak for both species along Baja California and adjacentsouthern California. Mismatch distributions and Tajima’s
D
-values reveal distinctive sig-natures of population bottlenecks and expansions. Sardine haplotypes coalesce at ~241 000years
BP
, with an initial female effective population size
N
f0
= 0 followed by exponentialgrowth to
N
f1
= 115 million. Anchovy haplotypes coalesce at ~282 000 years
BP
, with an initialpopulation size of
N
f0
= 14 000, followed by exponential growth to
N
f1
= 2.3 million. Theseresults indicate a founder event for sardine and a severe population decline for anchovy inthe California Current during the late Pleistocene. Overall, these data support the basinmodel on decadal timescales, although local recruitment may dominate on shorter timescales.
Keywords
: basin model, climate change, coalescence, fish, mtDNA, recruitment
Received 10 January 2004; revision received 7 April 2004; accepted 7 April 2004
Introduction
In contemporary studies of biogeography and evolution,glaciation and other long-term climate changes are regardedas primary influences on genetic diversity and speciation
(Hewitt 1996; Avise 2000). Such changes typically occur ona scale of 10
4
−
10
6
years. Higher frequency oscillations, suchas decadal variations in temperature or productivity, areprincipally studied under the domain of population dynamics(Cushing 1975). Beyond the description of extirpations andrecolonizations, few studies have examined the impact ofdecadal-scale regime changes on the genetic architecturesof species (Jansson & Dynesius 2002). In highly variableenvironments, fluctuations in abundance and distribution
Correspondence: Brian Bowen. Tel.: +1 808-236-7426; Fax: +1 808-236-7443; E-mail: [email protected]
2170
F . L E C O M T E
E T A L .
© 2004 Blackwell Publishing Ltd,
Molecular Ecology
, 13, 2169–2182
should impose distinctive genetic signatures (Slatkin &Hudson 1991; Rogers & Harpending 1992).
Coastal upwelling areas are among the most variableenvironments on earth. In the eastern Pacific, highly pro-ductive upwelling conditions can be reversed in a matter ofmonths by El Niño–Southern Oscillation (ENSO) events(Glynn 1988; McPhaden 1999). Somewhat longer climatecycles of ~50 years are also apparent (Chavez
et al
. 2003).Changes in upwelling intensity and corresponding cur-rents vary on several timescales (Kennett & Ingram 1995;Kiefer
et al
. 2001), as does the overall productivity of thecoastal zone (Webb & Bartlein 1992).
The impact of these regime shifts is exemplified by cyclesof abundances in anchovies (
Engraulis
spp.) and sardines(
Sardinops
spp.) in temperate boundary currents (Lluch-Belda
et al
. 1989; Parrish
et al
. 1989). Anchovies reach peakabundance during the colder, highly productive regime,whereas sardines peak during warm, less productiveconditions (Chavez
et al
. 2003). The changes in populationabundance are dramatic: spawning biomass of anchovy inthe California Current varied by three orders of magnitudein the latter half of the 20th century (Lo 1985). These fluc-tuations in species abundance drive coastal food webs(Chavez
et al
. 2003) and regional economies (Doucet &Einardsson 1966; Nevarez-Martinez
et al
. 2001). At peakabundances, sardines and anchovies account for about a
quarter of fish landings worldwide (Whitehead 1985). Thefishery for the Peruvian anchovy (
Engraulis ringens
) was oncethe largest harvest on the planet, but annual catches fellfrom over 12 million tons to < 2 million tons between 1976and 1986, subsequently disappearing as a commercial fishery(Klyashtorin 2001). During the ensuing warm conditions,sardine abundance rose sharply (Chavez
et al
. 2003). Hencethese fishes epitomize the uncertainty that unravels fisherymanagement plans (Harwood & Stokes 2003).
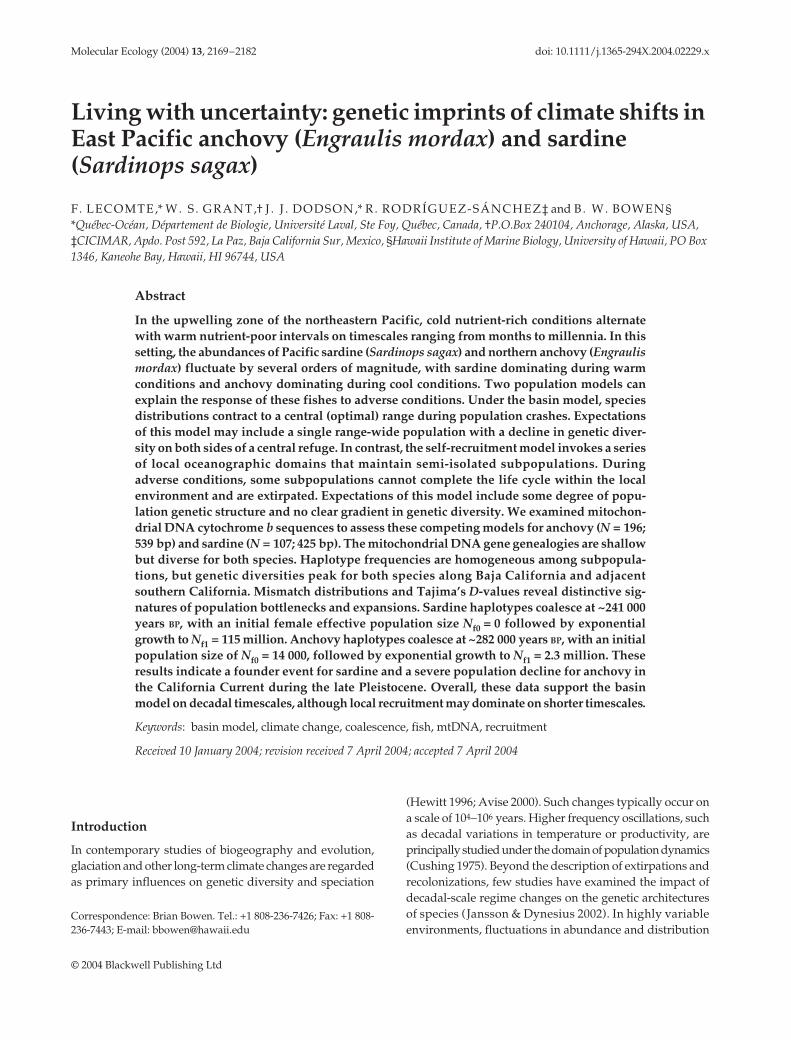
Changes in abundance are accompanied by changes indistribution. Pacific sardine disappeared from the northernhalf of their range (northern California to southern Alaska;Fig. 1) in the middle of the 20th century, following years oflow recruitment and intense harvesting (Murphy 1966),only to reappear in 1992 (McFarlane
et al
. 2000). Northernanchovy disappeared from the Gulf of California duringthis interval, reappearing in 1985 (Hammann & Cisneros-Mata 1989). A year later anchovy was an important localfishery with landings in excess of 2000 tons (Hammann &Cisneros-Mata 1989; Cisneros-Mata
et al
. 1995).Two contrasting models have been proposed to explain
changes in abundance and distribution as a function ofenvironmental variability (Sinclair 1988; MacCall 1990).Under the local self-recruitment model, multiple semi-isolated subpopulations occur along the coastline, andeach is adapted to proximal environmental conditions.
Fig. 1 Previously defined stock distributions (boxes), sampling locations, principal spawning areas and egg-larval stage distribution fornorthern anchovy (Engraulis mordax) and Pacific sardine (Sardinops sagax).
C L I M A T E V A R I A B I L I T Y I N M A R I N E F I S H E S
2171
© 2004 Blackwell Publishing Ltd,
Molecular Ecology
, 13, 2169–2182
Subpopulations persist and succeed where local oceano-graphic settings allow completion of the life cycle. Thismodel is consistent with the member–vagrant hypothesis(Iles & Sinclair 1982; Sinclair 1988). In this view, recent geo-graphical expansions of sardine and anchovy would havebeen seeded by remnant subpopulations that have goneundetected. Subpopulation-level genetic differentiation mayresult, in which the level of genetic diversity at each locationwill largely depend on the effective size of the local deme(Kimura & Ohta 1971). In other words, self-recruitmentpredicts a discernible pattern in subpopulation structure,but no discernible pattern in range-wide genetic diversity.
Under the basin model, when abiotic and biotic factorsreduce population size, a species’ geographical range con-tracts to locations where conditions are most favourable(MacCall 1990). Over longer (evolutionary) timescales andunder the most severe environmental conditions, ancho-vies may be reduced to a single core habitat. When morefavourable conditions return, the population expands intoperipheral areas. Therefore, basin-model dynamics shouldproduce little or no population structure. In contrast toself-recruitment, the basin model predicts a gradient ingenetic diversity descending from optimal (refuge) habitatto the periphery of the range. This model is consistent withthe source–sink hypothesis (Pulliam 1988).
To assess the genetic architectures of northern anchovyand Pacific sardine, sequences of mitochondrial DNA(mtDNA) cytochrome
b
were surveyed across the rangesof both species. If subpopulations are perpetuated by localrecruitment, we expect to observe a pattern of populationgenetic differentiation across the entire range (althoughthis pattern would not be detected with mtDNA undersome conditions such as moderate gene flow or recent col-onization). If a species experiences range-wide expansionsfrom a source population, we expect to find a peak in geneticdiversity at the putative source habitat. We used mtDNA
sequence diversity and the coalescence approach (Hudson1990) to evaluate postulated demographic factors such asbottlenecks, demographic explosions and effective popu-lation sizes before and after population growth (Tajima1989; Slatkin & Hudson 1991; Rogers & Harpending 1992).Of particular interest are fish in the Gulf of California, iso-lated from the Pacific coast by tropical conditions at the tipof Baja California Sur (BCS; Fig. 1). Results can illuminatehow sardines and anchovies cope with precipitous climatechanges. Such information may assist fishery managerswho are themselves operating in a regime of high uncer-tainty, and perhaps other conservation efforts during aperiod of rapid global warming.
Materials and methods
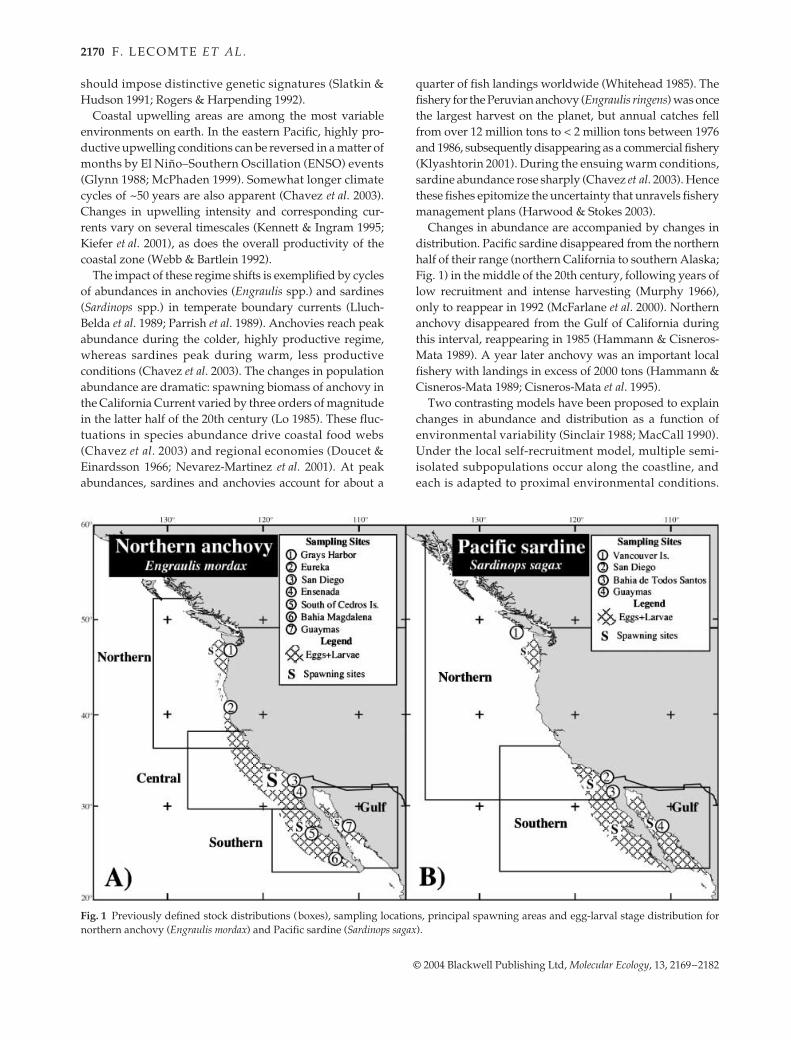
Northern anchovy and Pacific sardine were collectedbetween 1994 and 2001 throughout the geographical rangesof both species (Table 1, Fig. 1). Anchovy were sampledfrom the Washington coast (Grays Harbor), northernCalifornia (Eureka), southern California (San Diego in 1994and 2001), Baja California (Ensenada), Upper Baja CaliforniaSur (South of Cedros Is.), Lower Baja California Sur (BahiaMagdalena) and the Gulf of California (Bahia Guaymas).Sardine were obtained from Canada (Vancouver Is.), southernCalifornia (San Diego), Baja California (Ensenada) and theGulf of California (Bahia Guaymas). Tissues were preser-ved in saturated salt–DMSO buffer (Amos & Hoelzel 1991)or 95% ethanol prior to DNA extraction.
Total genomic DNA was extracted from 0.1 g of muscleor gonad tissue with a standard phenol–chloroform–isoamyl protocol (Hillis
et al
. 1996), precipitated with cold95% ethanol and re-suspended in 200
µ
L TE buffer (10 m
m
Tris–HCl, 1 m
m
EDTA).For anchovy, a 687 bp portion of cytochrome
b
(includ-ing 51 bp in the flanking tRNase) was amplified using the
Table 1 Sampling sites, sampling date, coordinates [exact sampling sites (s) or estimated from fishing area (f)], number of fishes sequencedfor northern anchovy (Engraulis mordax) and Pacific sardine (Sardinops sagax)
Region Sampling site Date Coordinates Latitude Longitude Sample size
Northern AnchovyWashington Grays Harborf 1995 46°59′07″-N 123°57′35″-W 17North California Eurekaf 1994 40°47′58″-N 124°08′35″-W 20South California San Diegof 1994 32°49′28″-N 117°05′59″-W 14South California San Diegof 2001 32°49′28″-N 117°05′59″-W 30Baja California Ensenadas 1995 31°52′00″-N 116°37′00″-W 23Upper Baja California Sur South of Cedros Is.s 1995 27°30′06″-N 114°59′55″-W 35Lower Baja California Sur Bahia Magdalenas 1995 24°34′59″-N 112°00′00″-W 37Gulf of California Guaymass 1995 27°55′59″-N 110°54′00″-W 20Pacific sardineCanada Vancouver Is.s 1999 48°55′30″-N 126°27′24″-W 32California San Diegof 2001 32°49′28″-N 117°05′59″-W 30Baja California Bahia de Todos Santoss 1995 31°47′59″-N 116°41′59″-W 25Gulf of California Guaymass 1995 27°55′59″-N 110°54′00″-W 20
2172 F . L E C O M T E E T A L .
© 2004 Blackwell Publishing Ltd, Molecular Ecology, 13, 2169–2182
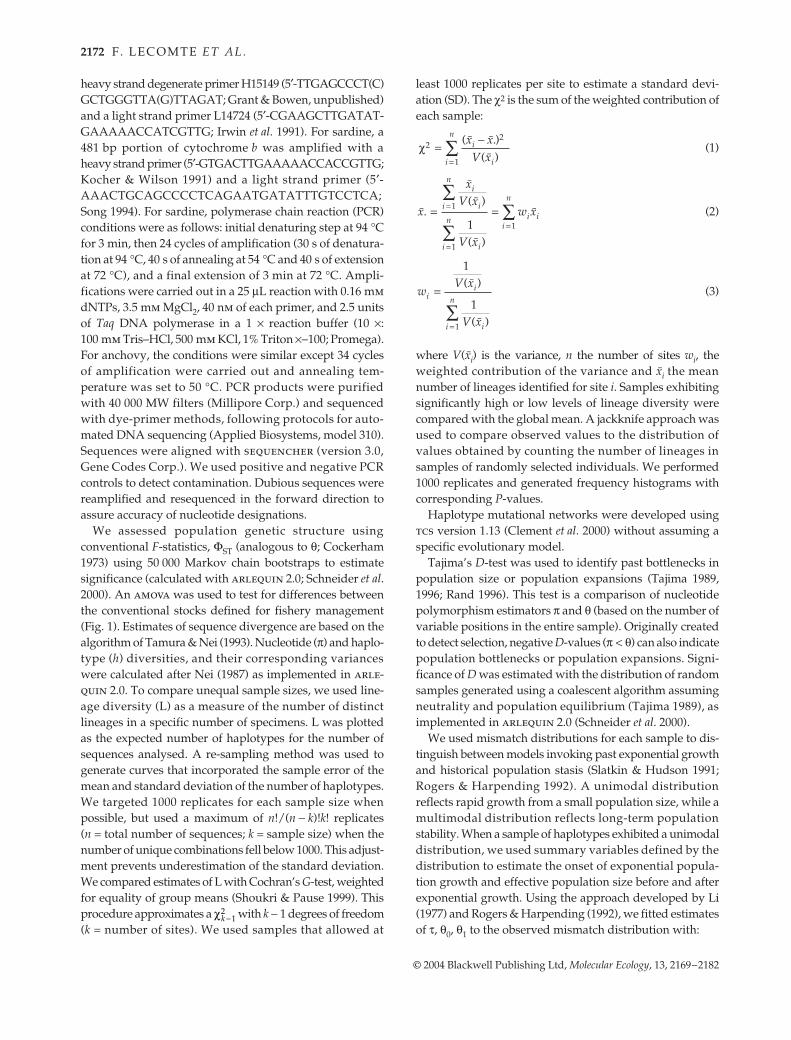
heavy strand degenerate primer H15149 (5′-TTGAGCCCT(C)GCTGGGTTA(G)TTAGAT; Grant & Bowen, unpublished)and a light strand primer L14724 (5′-CGAAGCTTGATAT-GAAAAACCATCGTTG; Irwin et al. 1991). For sardine, a481 bp portion of cytochrome b was amplified with aheavy strand primer (5′-GTGACTTGAAAAACCACCGTTG;Kocher & Wilson 1991) and a light strand primer (5′-AAACTGCAGCCCCTCAGAATGATATTTGTCCTCA;Song 1994). For sardine, polymerase chain reaction (PCR)conditions were as follows: initial denaturing step at 94 °Cfor 3 min, then 24 cycles of amplification (30 s of denatura-tion at 94 °C, 40 s of annealing at 54 °C and 40 s of extensionat 72 °C), and a final extension of 3 min at 72 °C. Ampli-fications were carried out in a 25 µL reaction with 0.16 mmdNTPs, 3.5 mm MgCl2, 40 nm of each primer, and 2.5 unitsof Taq DNA polymerase in a 1 × reaction buffer (10 ×:100 mm Tris–HCl, 500 mm KCl, 1% Triton ×−100; Promega).For anchovy, the conditions were similar except 34 cyclesof amplification were carried out and annealing tem-perature was set to 50 °C. PCR products were purifiedwith 40 000 MW filters (Millipore Corp.) and sequencedwith dye-primer methods, following protocols for auto-mated DNA sequencing (Applied Biosystems, model 310).Sequences were aligned with sequencher (version 3.0,Gene Codes Corp.). We used positive and negative PCRcontrols to detect contamination. Dubious sequences werereamplified and resequenced in the forward direction toassure accuracy of nucleotide designations.
We assessed population genetic structure usingconventional F-statistics, ΦST (analogous to θ; Cockerham1973) using 50 000 Markov chain bootstraps to estimatesignificance (calculated with arlequin 2.0; Schneider et al.2000). An amova was used to test for differences betweenthe conventional stocks defined for fishery management(Fig. 1). Estimates of sequence divergence are based on thealgorithm of Tamura & Nei (1993). Nucleotide (π) and haplo-type (h) diversities, and their corresponding varianceswere calculated after Nei (1987) as implemented in arle-quin 2.0. To compare unequal sample sizes, we used line-age diversity (L) as a measure of the number of distinctlineages in a specific number of specimens. L was plottedas the expected number of haplotypes for the number ofsequences analysed. A re-sampling method was used togenerate curves that incorporated the sample error of themean and standard deviation of the number of haplotypes.We targeted 1000 replicates for each sample size whenpossible, but used a maximum of n!/(n − k)!k! replicates(n = total number of sequences; k = sample size) when thenumber of unique combinations fell below 1000. This adjust-ment prevents underestimation of the standard deviation.We compared estimates of L with Cochran’s G-test, weightedfor equality of group means (Shoukri & Pause 1999). Thisprocedure approximates a with k − 1 degrees of freedom(k = number of sites). We used samples that allowed at
least 1000 replicates per site to estimate a standard devi-ation (SD). The χ2 is the sum of the weighted contribution ofeach sample:
(1)
(2)
(3)
where V(Xi) is the variance, n the number of sites wi, theweighted contribution of the variance and Xi the meannumber of lineages identified for site i. Samples exhibitingsignificantly high or low levels of lineage diversity werecompared with the global mean. A jackknife approach wasused to compare observed values to the distribution ofvalues obtained by counting the number of lineages insamples of randomly selected individuals. We performed1000 replicates and generated frequency histograms withcorresponding P-values.
Haplotype mutational networks were developed usingtcs version 1.13 (Clement et al. 2000) without assuming aspecific evolutionary model.
Tajima’s D-test was used to identify past bottlenecks inpopulation size or population expansions (Tajima 1989,1996; Rand 1996). This test is a comparison of nucleotidepolymorphism estimators π and θ (based on the number ofvariable positions in the entire sample). Originally createdto detect selection, negative D-values (π < θ) can also indicatepopulation bottlenecks or population expansions. Signi-ficance of D was estimated with the distribution of randomsamples generated using a coalescent algorithm assumingneutrality and population equilibrium (Tajima 1989), asimplemented in arlequin 2.0 (Schneider et al. 2000).
We used mismatch distributions for each sample to dis-tinguish between models invoking past exponential growthand historical population stasis (Slatkin & Hudson 1991;Rogers & Harpending 1992). A unimodal distributionreflects rapid growth from a small population size, while amultimodal distribution reflects long-term populationstability. When a sample of haplotypes exhibited a unimodaldistribution, we used summary variables defined by thedistribution to estimate the onset of exponential popula-tion growth and effective population size before and afterexponential growth. Using the approach developed by Li(1977) and Rogers & Harpending (1992), we fitted estimatesof τ, θ0, θ1 to the observed mismatch distribution with:
χk −12
χ2
2
1
( )
( )=
−
=∑ X X.
Xi
i
i
n
V
X.
XX
X
Xi
i
= ==
=
=
∑
∑∑
( )
( )
i
i
n
i
n ii
n
i
V
V
w1
1
11
wV
V
i
i
n
( )
( )
=
=∑
1
1
1
X
X
i
i
C L I M A T E V A R I A B I L I T Y I N M A R I N E F I S H E S 2173
© 2004 Blackwell Publishing Ltd, Molecular Ecology, 13, 2169–2182
(4)
(5)
where τ is the mutational timescale, θ0 and θ1 are theexpected pairwise differences before and after populationgrowth or contraction, respectively. τ is defined by τ = 2ut,where t is measured in generations and u is the mutationrate for the entire sequence (u = mTµ, mT = number of nucleo-tides and µ = mutation rate per nucleotide). θ is defined byθ = 2Nu where N is the effective female population size(Nf). fi − j(0) is calculated for the initial population usingθ = θ0 in Eqn 5, while fi and fi – j are calculated using θ = θ1in Eqn 5. Estimates of these parameters were evaluated bya generalized nonlinear least-squares approach (Schneider& Excoffier 1999) implemented in arlequin 2.0 (Schneideret al. 2000). This program also provides bootstrap confidenceintervals for τ, θ0, θ1 and a test of the observed distributionrelative to a sudden expansion model.
Results
A 539 bp segment of cytochrome b was aligned for 196specimens of anchovy, and a 425 bp segment was alignedfor 107 specimens of sardine. Sequences were aligned withcytochrome b fragments in GenBank (Benson et al. 2003)for Engraulis spp. (Accession nos AB040676/AF472579)and Sardinops spp. (Accession nos AF472585/AB032554/AF472586). In total, 66 haplotypes were identified in 196anchovy, including 51 haplotypes observed in single spe-cimens. Forty-six of 53 (86.8%) variable sites occurred inthird codon positions. In sardine, 41 haplotypes appearedin 107 fish, including 29 haplotypes observed in singlespecimens. Twenty-eight of 32 (87.5%) variable sitesoccurred in third positions.
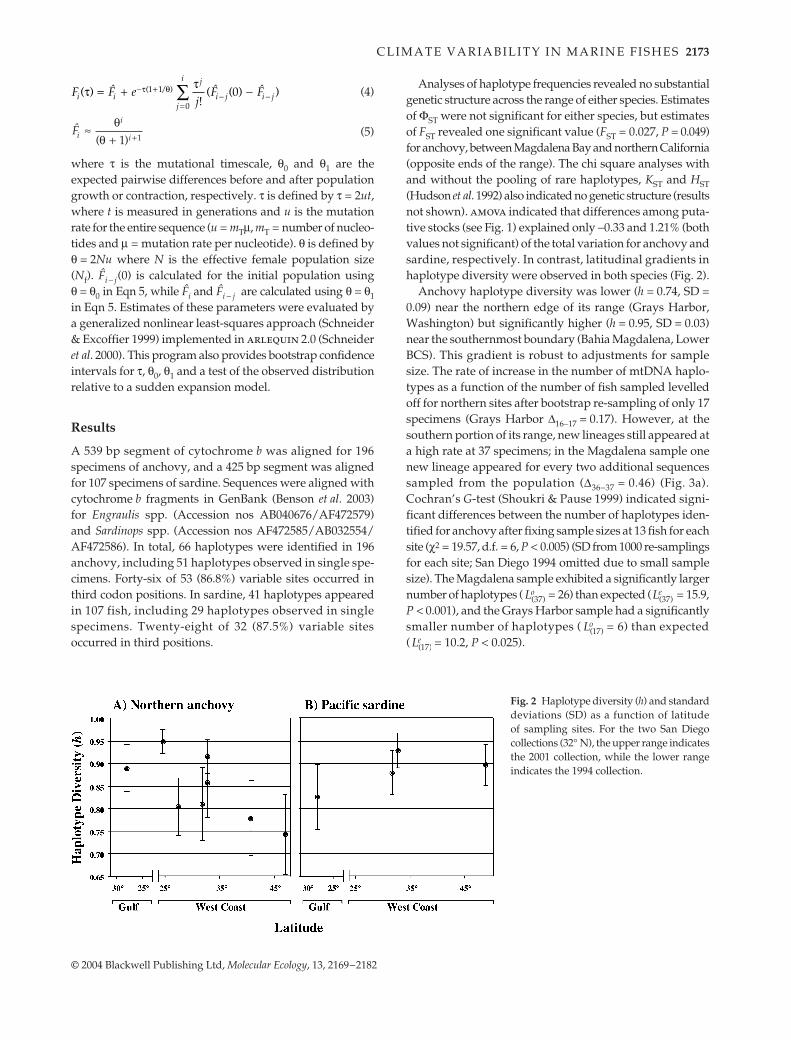
Analyses of haplotype frequencies revealed no substantialgenetic structure across the range of either species. Estimatesof ΦST were not significant for either species, but estimatesof FST revealed one significant value (FST = 0.027, P = 0.049)for anchovy, between Magdalena Bay and northern California(opposite ends of the range). The chi square analyses withand without the pooling of rare haplotypes, KST and HST(Hudson et al. 1992) also indicated no genetic structure (resultsnot shown). amova indicated that differences among puta-tive stocks (see Fig. 1) explained only −0.33 and 1.21% (bothvalues not significant) of the total variation for anchovy andsardine, respectively. In contrast, latitudinal gradients inhaplotype diversity were observed in both species (Fig. 2).
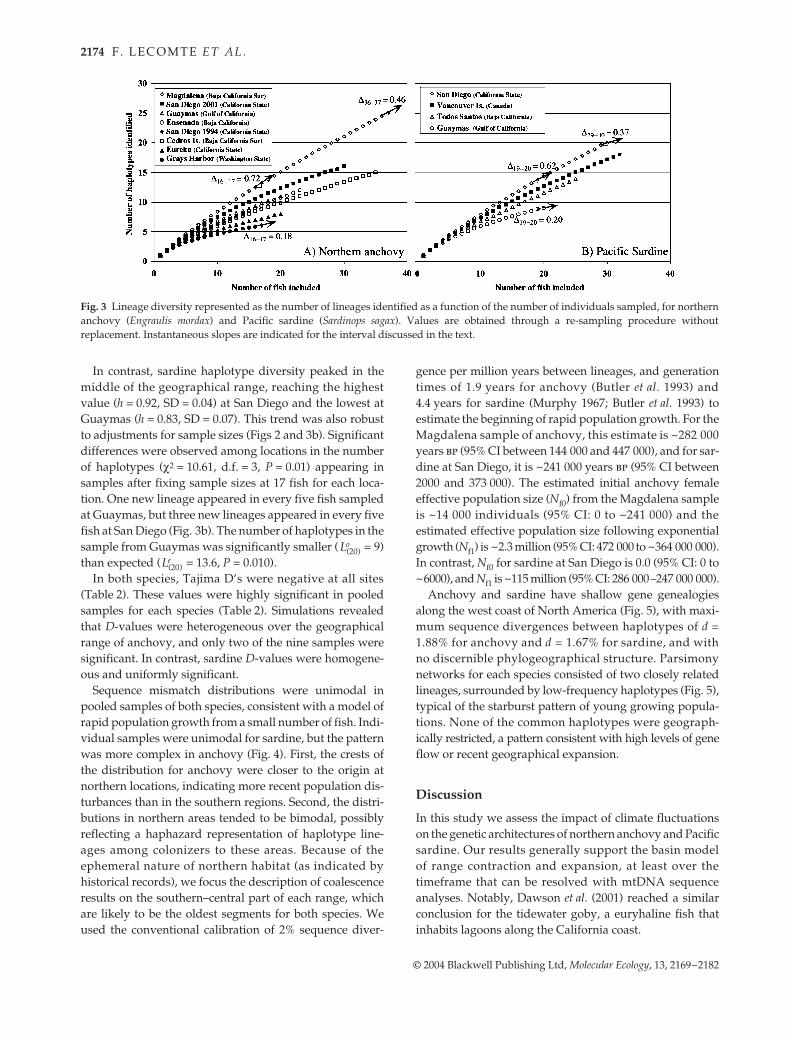
Anchovy haplotype diversity was lower (h = 0.74, SD =0.09) near the northern edge of its range (Grays Harbor,Washington) but significantly higher (h = 0.95, SD = 0.03)near the southernmost boundary (Bahia Magdalena, LowerBCS). This gradient is robust to adjustments for samplesize. The rate of increase in the number of mtDNA haplo-types as a function of the number of fish sampled levelledoff for northern sites after bootstrap re-sampling of only 17specimens (Grays Harbor ∆16−17 = 0.17). However, at thesouthern portion of its range, new lineages still appeared ata high rate at 37 specimens; in the Magdalena sample onenew lineage appeared for every two additional sequencessampled from the population (∆36−37 = 0.46) (Fig. 3a).Cochran’s G-test (Shoukri & Pause 1999) indicated signi-ficant differences between the number of haplotypes iden-tified for anchovy after fixing sample sizes at 13 fish for eachsite (χ2 = 19.57, d.f. = 6, P < 0.005) (SD from 1000 re-samplingsfor each site; San Diego 1994 omitted due to small samplesize). The Magdalena sample exhibited a significantly largernumber of haplotypes ( = 26) than expected ( = 15.9,P < 0.001), and the Grays Harbor sample had a significantlysmaller number of haplotypes ( = 6) than expected( = 10.2, P < 0.025).
F e
ji i
j
j
i
i j i j( ) !
( ( ) )( / )τττ θ= + −− +
=− −∑f f f1 1
0
0
fi
i
i
( )≈
+ +
θθ 1 1
Fig. 2 Haplotype diversity (h) and standarddeviations (SD) as a function of latitudeof sampling sites. For the two San Diegocollections (32° N), the upper range indicatesthe 2001 collection, while the lower rangeindicates the 1994 collection.
Lo( )37 L
e( )37
Lo( )17
Le( )17
2174 F . L E C O M T E E T A L .
© 2004 Blackwell Publishing Ltd, Molecular Ecology, 13, 2169–2182
In contrast, sardine haplotype diversity peaked in themiddle of the geographical range, reaching the highestvalue (h = 0.92, SD = 0.04) at San Diego and the lowest atGuaymas (h = 0.83, SD = 0.07). This trend was also robustto adjustments for sample sizes (Figs 2 and 3b). Significantdifferences were observed among locations in the numberof haplotypes (χ2 = 10.61, d.f. = 3, P = 0.01) appearing insamples after fixing sample sizes at 17 fish for each loca-tion. One new lineage appeared in every five fish sampledat Guaymas, but three new lineages appeared in every fivefish at San Diego (Fig. 3b). The number of haplotypes in thesample from Guaymas was significantly smaller ( = 9)than expected ( = 13.6, P = 0.010).
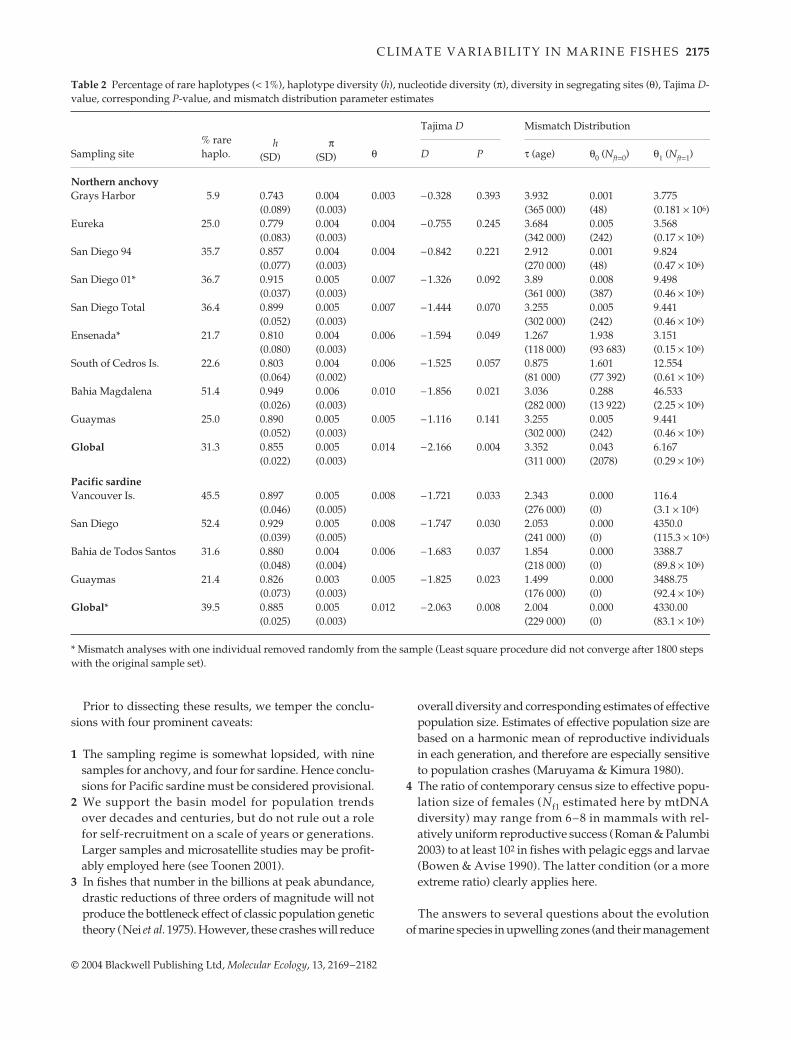
In both species, Tajima D’s were negative at all sites(Table 2). These values were highly significant in pooledsamples for each species (Table 2). Simulations revealedthat D-values were heterogeneous over the geographicalrange of anchovy, and only two of the nine samples weresignificant. In contrast, sardine D-values were homogene-ous and uniformly significant.
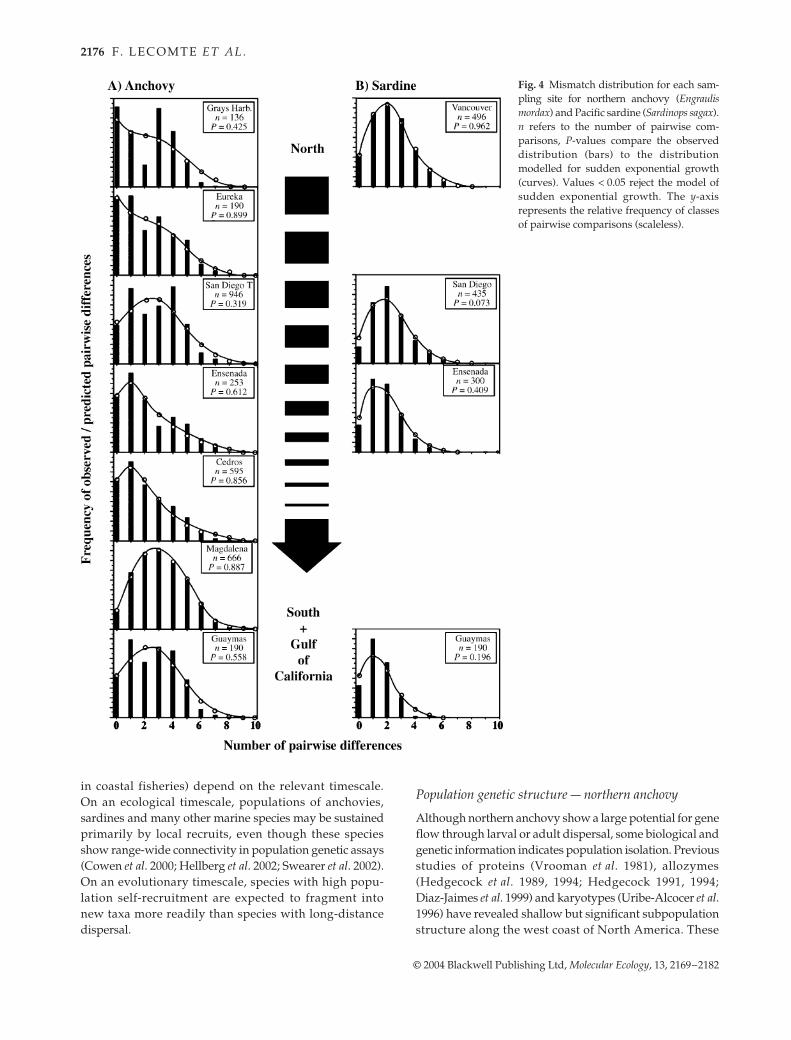
Sequence mismatch distributions were unimodal inpooled samples of both species, consistent with a model ofrapid population growth from a small number of fish. Indi-vidual samples were unimodal for sardine, but the patternwas more complex in anchovy (Fig. 4). First, the crests ofthe distribution for anchovy were closer to the origin atnorthern locations, indicating more recent population dis-turbances than in the southern regions. Second, the distri-butions in northern areas tended to be bimodal, possiblyreflecting a haphazard representation of haplotype line-ages among colonizers to these areas. Because of theephemeral nature of northern habitat (as indicated byhistorical records), we focus the description of coalescenceresults on the southern–central part of each range, whichare likely to be the oldest segments for both species. Weused the conventional calibration of 2% sequence diver-
gence per million years between lineages, and generationtimes of 1.9 years for anchovy (Butler et al. 1993) and4.4 years for sardine (Murphy 1967; Butler et al. 1993) toestimate the beginning of rapid population growth. For theMagdalena sample of anchovy, this estimate is ~282 000years bp (95% CI between 144 000 and 447 000), and for sar-dine at San Diego, it is ~241 000 years bp (95% CI between2000 and 373 000). The estimated initial anchovy femaleeffective population size (Nf0) from the Magdalena sampleis ~14 000 individuals (95% CI: 0 to ~241 000) and theestimated effective population size following exponentialgrowth (Nf1) is ~2.3 million (95% CI: 472 000 to ~364 000 000).In contrast, Nf0 for sardine at San Diego is 0.0 (95% CI: 0 to~6000), and Nf1 is ~115 million (95% CI: 286 000–247 000 000).
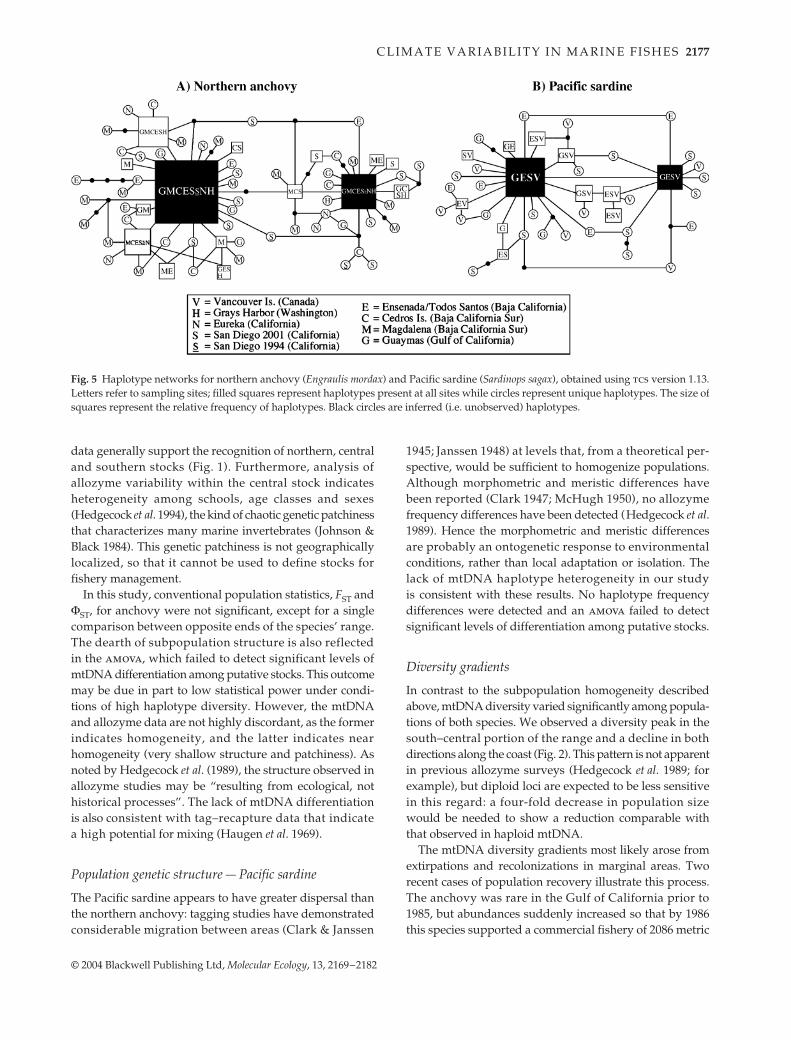
Anchovy and sardine have shallow gene genealogiesalong the west coast of North America (Fig. 5), with maxi-mum sequence divergences between haplotypes of d =1.88% for anchovy and d = 1.67% for sardine, and withno discernible phylogeographical structure. Parsimonynetworks for each species consisted of two closely relatedlineages, surrounded by low-frequency haplotypes (Fig. 5),typical of the starburst pattern of young growing popula-tions. None of the common haplotypes were geograph-ically restricted, a pattern consistent with high levels of geneflow or recent geographical expansion.
Discussion
In this study we assess the impact of climate fluctuationson the genetic architectures of northern anchovy and Pacificsardine. Our results generally support the basin modelof range contraction and expansion, at least over thetimeframe that can be resolved with mtDNA sequenceanalyses. Notably, Dawson et al. (2001) reached a similarconclusion for the tidewater goby, a euryhaline fish thatinhabits lagoons along the California coast.
Fig. 3 Lineage diversity represented as the number of lineages identified as a function of the number of individuals sampled, for northernanchovy (Engraulis mordax) and Pacific sardine (Sardinops sagax). Values are obtained through a re-sampling procedure withoutreplacement. Instantaneous slopes are indicated for the interval discussed in the text.
Lo( )20
Le( )20
C L I M A T E V A R I A B I L I T Y I N M A R I N E F I S H E S 2175
© 2004 Blackwell Publishing Ltd, Molecular Ecology, 13, 2169–2182
Prior to dissecting these results, we temper the conclu-sions with four prominent caveats:
1 The sampling regime is somewhat lopsided, with ninesamples for anchovy, and four for sardine. Hence conclu-sions for Pacific sardine must be considered provisional.
2 We support the basin model for population trendsover decades and centuries, but do not rule out a rolefor self-recruitment on a scale of years or generations.Larger samples and microsatellite studies may be profit-ably employed here (see Toonen 2001).
3 In fishes that number in the billions at peak abundance,drastic reductions of three orders of magnitude will notproduce the bottleneck effect of classic population genetictheory (Nei et al. 1975). However, these crashes will reduce
overall diversity and corresponding estimates of effectivepopulation size. Estimates of effective population size arebased on a harmonic mean of reproductive individualsin each generation, and therefore are especially sensitiveto population crashes (Maruyama & Kimura 1980).
4 The ratio of contemporary census size to effective popu-lation size of females (Nf1 estimated here by mtDNAdiversity) may range from 6–8 in mammals with rel-atively uniform reproductive success (Roman & Palumbi2003) to at least 102 in fishes with pelagic eggs and larvae(Bowen & Avise 1990). The latter condition (or a moreextreme ratio) clearly applies here.
The answers to several questions about the evolutionof marine species in upwelling zones (and their management
Table 2 Percentage of rare haplotypes (< 1%), haplotype diversity (h), nucleotide diversity (π), diversity in segregating sites (θ), Tajima D-value, corresponding P-value, and mismatch distribution parameter estimates
Sampling site% rare haplo.
h(SD)
π (SD) θ
Tajima D Mismatch Distribution
D P τ (age) θ0 (Nft=0) θ1 (Nft=1)
Northern anchovyGrays Harbor 5.9 0.743
(0.089)0.004 (0.003)
0.003 −0.328 0.393 3.932 (365 000)
0.001 (48)
3.775 (0.181 × 10⁶)
Eureka 25.0 0.779 (0.083)
0.004 (0.003)
0.004 −0.755 0.245 3.684 (342 000)
0.005 (242)
3.568 (0.17 × 10⁶)
San Diego 94 35.7 0.857 (0.077)
0.004 (0.003)
0.004 −0.842 0.221 2.912 (270 000)
0.001 (48)
9.824 (0.47 × 10⁶)
San Diego 01* 36.7 0.915 (0.037)
0.005 (0.003)
0.007 −1.326 0.092 3.89 (361 000)
0.008 (387)
9.498 (0.46 × 10⁶)
San Diego Total 36.4 0.899(0.052)
0.005 (0.003)
0.007 −1.444 0.070 3.255 (302 000)
0.005 (242)
9.441 (0.46 × 10⁶)
Ensenada* 21.7 0.810 (0.080)
0.004 (0.003)
0.006 −1.594 0.049 1.267 (118 000)
1.938 (93 683)
3.151 (0.15 × 10⁶)
South of Cedros Is. 22.6 0.803 (0.064)
0.004 (0.002)
0.006 −1.525 0.057 0.875 (81 000)
1.601 (77 392)
12.554 (0.61 × 10⁶)
Bahia Magdalena 51.4 0.949 (0.026)
0.006 (0.003)
0.010 −1.856 0.021 3.036 (282 000)
0.288 (13 922)
46.533 (2.25 × 10⁶)
Guaymas 25.0 0.890 (0.052)
0.005 (0.003)
0.005 −1.116 0.141 3.255 (302 000)
0.005 (242)
9.441 (0.46 × 10⁶)
Global 31.3 0.855 (0.022)
0.005 (0.003)
0.014 −2.166 0.004 3.352 (311 000)
0.043 (2078)
6.167 (0.29 × 10⁶)
Pacific sardineVancouver Is. 45.5 0.897
(0.046)0.005 (0.005)
0.008 −1.721 0.033 2.343 (276 000)
0.000 (0)
116.4 (3.1 × 10⁶)
San Diego 52.4 0.929 (0.039)
0.005 (0.005)
0.008 −1.747 0.030 2.053 (241 000)
0.000 (0)
4350.0 (115.3 × 10⁶)
Bahia de Todos Santos 31.6 0.880 (0.048)
0.004 (0.004)
0.006 −1.683 0.037 1.854 (218 000)
0.000 (0)
3388.7 (89.8 × 10⁶)
Guaymas 21.4 0.826 (0.073)
0.003 (0.003)
0.005 −1.825 0.023 1.499 (176 000)
0.000 (0)
3488.75 (92.4 × 10⁶)
Global* 39.5 0.885 (0.025)
0.005 (0.003)
0.012 −2.063 0.008 2.004 (229 000)
0.000 (0)
4330.00 (83.1 × 10⁶)
* Mismatch analyses with one individual removed randomly from the sample (Least square procedure did not converge after 1800 steps with the original sample set).
2176 F . L E C O M T E E T A L .
© 2004 Blackwell Publishing Ltd, Molecular Ecology, 13, 2169–2182
in coastal fisheries) depend on the relevant timescale.On an ecological timescale, populations of anchovies,sardines and many other marine species may be sustainedprimarily by local recruits, even though these speciesshow range-wide connectivity in population genetic assays(Cowen et al. 2000; Hellberg et al. 2002; Swearer et al. 2002).On an evolutionary timescale, species with high popu-lation self-recruitment are expected to fragment intonew taxa more readily than species with long-distancedispersal.
Population genetic structure — northern anchovy
Although northern anchovy show a large potential for geneflow through larval or adult dispersal, some biological andgenetic information indicates population isolation. Previousstudies of proteins (Vrooman et al. 1981), allozymes(Hedgecock et al. 1989, 1994; Hedgecock 1991, 1994;Diaz-Jaimes et al. 1999) and karyotypes (Uribe-Alcocer et al.1996) have revealed shallow but significant subpopulationstructure along the west coast of North America. These
Fig. 4 Mismatch distribution for each sam-pling site for northern anchovy (Engraulismordax) and Pacific sardine (Sardinops sagax).n refers to the number of pairwise com-parisons, P-values compare the observeddistribution (bars) to the distributionmodelled for sudden exponential growth(curves). Values < 0.05 reject the model ofsudden exponential growth. The y-axisrepresents the relative frequency of classesof pairwise comparisons (scaleless).
C L I M A T E V A R I A B I L I T Y I N M A R I N E F I S H E S 2177
© 2004 Blackwell Publishing Ltd, Molecular Ecology, 13, 2169–2182
data generally support the recognition of northern, centraland southern stocks (Fig. 1). Furthermore, analysis ofallozyme variability within the central stock indicatesheterogeneity among schools, age classes and sexes(Hedgecock et al. 1994), the kind of chaotic genetic patchinessthat characterizes many marine invertebrates (Johnson &Black 1984). This genetic patchiness is not geographicallylocalized, so that it cannot be used to define stocks forfishery management.
In this study, conventional population statistics, FST andΦST, for anchovy were not significant, except for a singlecomparison between opposite ends of the species’ range.The dearth of subpopulation structure is also reflectedin the amova, which failed to detect significant levels ofmtDNA differentiation among putative stocks. This outcomemay be due in part to low statistical power under condi-tions of high haplotype diversity. However, the mtDNAand allozyme data are not highly discordant, as the formerindicates homogeneity, and the latter indicates nearhomogeneity (very shallow structure and patchiness). Asnoted by Hedgecock et al. (1989), the structure observed inallozyme studies may be “resulting from ecological, nothistorical processes”. The lack of mtDNA differentiationis also consistent with tag–recapture data that indicatea high potential for mixing (Haugen et al. 1969).
Population genetic structure — Pacific sardine
The Pacific sardine appears to have greater dispersal thanthe northern anchovy: tagging studies have demonstratedconsiderable migration between areas (Clark & Janssen
1945; Janssen 1948) at levels that, from a theoretical per-spective, would be sufficient to homogenize populations.Although morphometric and meristic differences havebeen reported (Clark 1947; McHugh 1950), no allozymefrequency differences have been detected (Hedgecock et al.1989). Hence the morphometric and meristic differencesare probably an ontogenetic response to environmentalconditions, rather than local adaptation or isolation. Thelack of mtDNA haplotype heterogeneity in our studyis consistent with these results. No haplotype frequencydifferences were detected and an amova failed to detectsignificant levels of differentiation among putative stocks.
Diversity gradients
In contrast to the subpopulation homogeneity describedabove, mtDNA diversity varied significantly among popula-tions of both species. We observed a diversity peak in thesouth–central portion of the range and a decline in bothdirections along the coast (Fig. 2). This pattern is not apparentin previous allozyme surveys (Hedgecock et al. 1989; forexample), but diploid loci are expected to be less sensitivein this regard: a four-fold decrease in population sizewould be needed to show a reduction comparable withthat observed in haploid mtDNA.
The mtDNA diversity gradients most likely arose fromextirpations and recolonizations in marginal areas. Tworecent cases of population recovery illustrate this process.The anchovy was rare in the Gulf of California prior to1985, but abundances suddenly increased so that by 1986this species supported a commercial fishery of 2086 metric
Fig. 5 Haplotype networks for northern anchovy (Engraulis mordax) and Pacific sardine (Sardinops sagax), obtained using tcs version 1.13.Letters refer to sampling sites; filled squares represent haplotypes present at all sites while circles represent unique haplotypes. The size ofsquares represent the relative frequency of haplotypes. Black circles are inferred (i.e. unobserved) haplotypes.
2178 F . L E C O M T E E T A L .
© 2004 Blackwell Publishing Ltd, Molecular Ecology, 13, 2169–2182
tons (Cisneros-Mata et al. 1995). In a similar fashion, thesardine north of San Francisco disappeared in the late1940s (Murphy 1966; Schweigert 1988). Their reappearancein Canadian and Alaskan waters in the early 1990s wasfollowed by a rapid expansion to a stock size of ~89 000metric tons in 1997 (McFarlane & Beamish 2001). In both cases,mtDNA diversities in the newly abundant stock are expectedto be reduced compared with those in neighbouring regions.
The basin model is supported by mtDNA data, but thismodel is not sufficient to describe the long-term dynamicsof anchovy and sardine populations. For example, the basinmodel assumes a single stationary refuge during adverseconditions. Baumgartner et al. (1992) used this assumptionto infer historical population fluctuations from the abund-ance of scales in sediment cores from the Santa BarbaraBasin. If the location of the basin population moves inresponse to climate and oceanographic conditions, scaleabundance in sediment cores may reflect changes in geo-graphical range rather than historical abundance. In sup-port of a more complex basin model, Rodríguez-Sánchezet al. (2001, 2002) demonstrated that during periods ofocean cooling between the early 1940s and 1975, the centreof abundance for sardine shifted from California to BajaCalifornia. If basin populations shift along the coast inresponse to climate variability, historical inferences basedon sediment cores may have to be re-evaluated.
On decadal timescales, population expansions at theperiphery of the distribution may be the result of growthby depleted, but locally recruiting subpopulations. Alter-natively, marginal subpopulations may be extirpatedduring climate shifts, and then reseeded by fish fromneighbouring populations. Recent explosions of anchovyand sardine in the Gulf of California may help to distin-guish these alternatives. Rodríguez-Sánchez et al. (2001)postulated that a southerly shift in the centre of abundanceof sardine during the early 1940s to 1960s led to the invasionof sardine into the Gulf of California. However, Holmgrem-Urba & Baumgartner (1993) demonstrated that anchovyhave been present in the Gulf (at low densities) for at least250 years. If this small population recently expanded inisolation, we would expect the signatures of strong geneticdrift and corresponding haplotype frequency shifts, neitherof which are apparent in our data sets. Allozyme studies byHedgecock et al. (1989) likewise did not detect an isolatedpopulation. Therefore, we discount the self-recruitmentmodel for Gulf populations of sardine and anchovy, andsupport the hypothesis that the boom in Gulf populationsis coupled with connectivity to the Pacific coast subpopu-lations. The monotonic decline in mtDNA diversity fromthe central part of the ranges of both species offers furthersupport for colonizations, rather than local recruitment.
On longer timescales of the late Pleistocene, palaeo-climate data indicate progressively larger climatic swingswith massive continental glaciations (Crowley & North
1991), which lowered sea levels to the edge of the contin-ental shelf (Lambeck et al. 2002) and influenced currentpatterns and upwelling intensities (Rahmstorf 2002). Ouranalyses of mtDNA haplotypes indicate contraction andpopulation growth on the same timescale. Values of Tajima’sD were negative for all samples, but were significant (i.e.more negative) only in southern anchovy subpopulations.This finding may be due to lower levels of haplotype diver-sity, which contributed to lower values of θS, compared toπ, and thus produced D-values close to 0 (Table 2). Becausehaplotypes were only a few mutations apart, π is neces-sarily small, and D largely depends on the magnitude of θS(see Table 2). In view of the fluctuations recorded inanchovy and sardine fisheries, the negative D-values mostlikely reflect population crashes and recoveries, ratherthan selective sweeps (Tajima 1989; Rand 1996).
Population histories — crashes and colonizations
Conclusions about effective population size and exponen-tial growth depend on estimates of molecular clock ratesand generation times. How robust are these estimates? Thedivergence rate of 2%/Myr for cytochrome b is calibratedby a vicariant separation of anchovies Cetengraulis edentulusand C. mysticetus across the Isthmus of Panama (Lecomteet al. unpublished data) and for sardines by the separationof genera Sardinops and Sardina after the closure of TethysSea (Grant & Bowen 1998). Estimates of generation timeare difficult to calculate for short-lived fish that spawnrepetitively throughout the year (every 6.5–10.6 days fornorthern anchovy; Bindman 1985 from Butler et al. 1993).Anchovies and sardines both mature in less than 2 years,but anchovies seldom reach 4 years of age, whereas sardinescan exceed 8 years of age. The estimated generation time of4.4 years for Pacific sardine is probably appropriate forunexploited populations (Murphy 1966), but may be anupper bound for populations under stress from fishingpressure or environmental change. Reducing the sardinegeneration time from 4.4 to 2.2 years (for example) wouldnot alter the conclusions about the age of the demographicexpansion, but would diminish Nf estimates (based on θ0and θI) by half. With this caution, we feel that the estimatesof clock rate and generation time are sufficient to supportour qualitative conclusions.
Northern anchovy have persisted in the California Cur-rent for at least five million years, based on palaeontolo-gical data (Fitch 1969) and genetic comparisons to sister taxa(Grant & Bowen 1998). This provides an evolutionarybackdrop to interpret the coalescence analysis for ancho-vies. Estimates from the mtDNA data indicate a period ofrapid population growth 290 000 years bp, from an effec-tive population of Nf = 14 000. Although this indicates anextreme reduction in census size relative to periods of peakabundance, the reduction was not sufficient to deplete
C L I M A T E V A R I A B I L I T Y I N M A R I N E F I S H E S 2179
© 2004 Blackwell Publishing Ltd, Molecular Ecology, 13, 2169–2182
genetic diversity in contemporary anchovy. Allozymediversity and mtDNA diversity levels are similar to valuesreported for other anchovies, and to clupeoids in general(Grant 1985; Hedgecock et al. 1989; Grant & Bowen 1998;Lecomte et al. unpublished data).
The evolutionary backdrop to the sardines coalescence isquite different from that for anchovies. In a range-widesurvey of Sardinops, Bowen & Grant (1997) concluded thatPacific sardine populations (including lineages in Aus-tralia, Chile, California and Japan) share a common ances-tor at ~200 000 years bp. The coalescence in our studyestimates a founder (colonization) event for Pacific sardineat ~230 000 years bp. These dates are essentially concord-ant, and this shallow evolutionary history is consistentwith the absence of sardine fossils in early Pleistocenesediments (Fitch 1969). The hypothesized founder event issupported by allozyme data, which indicate reduced levelsof diversity relative to anchovies and other clupeoids(Hedgecock et al. 1989; Grant & Leslie 1996). Hence all linesof evidence indicate colonization of the California Currenton the scale of 200 000–250 000 years bp, followed by growthto Nf = 115 million, ~50 times larger than the correspond-ing estimate for anchovy.
Pacific sardine may be more susceptible to climate fluctu-ations than northern anchovy, because they spawn in anarrower range of upwelling conditions (Lluch-Belda et al.1991). Also supporting this view is a discontinuous recordof sardine scales in marine sediments, indicating thatsardine abundance has apparently fluctuated to a greaterextent than anchovy abundance (Soutar 1966; Soutar &Isaacs 1974; Baumgartner et al. 1992).
The coalescences for anchovy (at ~290 000 years bp) andsardine (at ~230 000 years bp) are probably linked toclimatic events bracketing the Kansan glacial epoch. Windintensity dropped ~330 000 years bp (Chuey et al. 1987) witha corresponding reduction in upwelling (Schramm 1985)and an extended period of low primary productivity (Paytanet al. 1996). At the ensuing glacial maximum (255 000 yearsbp), upwelling in the California Current may have ceasedaltogether (Herbert et al. 2001). During this interval, anchovyhad the most severe crash in their recent evolutionaryhistory, declining to an effective population size of 14 000.According to our coalescence analyses, the colonization ofsardine into the California Current occurred after this gla-cial interval, i.e. after the return of upwelling conditions.
Conclusion
The anchovy and sardine, living with uncertainty in theCalifornia Current, offer new perspectives at the crossroadsof evolution and wildlife management. The collapse andrecovery of regional populations, with corresponding gen-etic homogenization, indicates that macro-evolutionarypartitions are unlikely to arise within this region. The arena
for speciation is clearly among the isolated upwellingregions of Chile, Australia, South Africa, Japan and (Baja)California, all of which are occupied by members of thegenera Engraulis and Sardinops (Bowen & Grant 1997; Grant& Bowen 1998). Contemporary taxonomy of sardines andanchovies is consistent with this conclusion (Whitehead1985; Whitehead et al. 1988).
How do these pelagic fishes respond to climate variability?On decadal timescales, fishery data indicate contractions ofspecies ranges to a central refuge ‘basin’ (Rodríguez-Sánchezet al. 2002), while genetic data bear the imprints of subse-quent geographical expansions. This process yields theshallow genealogies observed with mtDNA sequences. Onmillennial timescales, global coolings and extreme climaticdeteriorations have led to the cessation of upwelling and tothe collapse of primary and secondary productivity. Thesedisturbances precipitate major population crashes that arerecorded in the genetic architectures of both anchovies andsardines. The sardines may be more prone to extinction, asindicated by their shallow history in the northeast Pacific(quarter million years) relative to the anchovy (five millionyears).
These fishes do not show phylogeographical partitionsin the northeastern Pacific, as observed in several inshorespecies (Burton 1998; Bernardi 2000; Dawson et al. 2001),yet significant differences exist in the distribution of theirgenetic diversity. Allozyme studies of anchovy reveal shal-low and transient genetic heterogeneity (Hedgecock et al.1994), while the mtDNA studies reveal diversity gradientsin both species. Neither observation can be explained in theframework of a single randomly mating population. Thisraises a subtle point: northern anchovy and Pacific sardineare not divided into geographically structured subpopula-tions, but neither do they form single panmictic popula-tions. While the genetic data support the basin model overa decadal scale of range contraction and expansion, localregimes may be largely self-seeding on a generation-to-generation timescale.
Wildlife management must consider the prosperity ofindividual species, as well as the ecosystems that supportthese species. While there is little chance of benignly alteringthe physical processes that create healthy upwelling ecosys-tems, the implementation of harvest limits can allow localsubpopulations to reseed themselves over the short-term.On longer timescales, the conservation of these pelagic speciesdepends on an understanding of micro-evolutionary proc-esses, specifically the role of the refuge basin that allowspersistence of a core population. Disruption of the corepopulation could be a recipe for collapse and extinction.
Acknowledgements
This study was funded by a National Science Foundation grant(DEB-9727048 to BWB) jointly awarded by the Population Biology
2180 F . L E C O M T E E T A L .
© 2004 Blackwell Publishing Ltd, Molecular Ecology, 13, 2169–2182
and Biological Oceanography Divisions, and by a sabbatical grant(to WSG) by the Foundation for Research Development, Pretoria,South Africa. FL was supported by a PhD Internship grant fromFonds pour la Formation des Chercheurs et l’Aide à la Recherche,Québec, Canada, and by a research grant from the NaturalSciences and Engineering Research Council of Canada to JJD. RRholds a fellowship from COFAA-IPN, Mexico. Special thanks tothose who provided samples, including G. A. MacFarlane, B.Andrew, J. Graves, P. E. Smith, R. Hensley, J. Shaklee, and thoseF. Allendorf who provided logistic support and helpful discus-sion, including A.L. Bass, D.E. Campton, M. Courtney, G. Daigle,M. Grant, S.A. Karl, S. Ortega, C. Rocha, L.A. Rocha, P. Taylor, R.J.Toonen, R. Waples, Graham Wallis and two anonymous reviewers.
ReferencesAmos B, Hoelzel AR (1991) Long-term preservation of whale skin
for DNA analysis. Report of the International Whaling CommissionSpecial Issue, 13, 99–103.
Avise JC (2000) Phylogeography. Harvard University Press,Cambridge, MA.
Baumgartner TR, Soutar A, Ferreira-Bartrina V (1992) Recon-struction of the history of Pacific sardine and northern anchovypopulations over the past two millennia from sediments of theSanta Barbara basin, California. Reports of California CooperativeOceanic Fisheries Investigations (CalCOFI), 33, 24–40.
Benson DA, Karsch-Mizrachi I, Lipman DJ, Ostell J, Wheeler DL(2003) Genbank. Nucleic Acids Research, 31, 23–27.
Bernardi G (2000) Barriers to gene flow in Embiotoca jacksoni, amarine fish lacking a pelagic larval stage. Evolution, 54, 226–237.
Bindman AG (1985) The 1985 Spawning Biomass of the NorthernAnchovy. NMFS-SWFC Reports, LJ-85-21. National Marine Fisher-ies Service, Southwest Fisheries Center, La Jolla, CA.
Bowen BW, Avise JC (1990) The genetic structure of Atlanticand Gulf of Mexico populations of sea bass, menhaden, andsturgeon: the influence of zoogeographic factors and life historypatterns. Marine Biology, 107, 371–381.
Bowen BW, Grant WS (1997) Phylogeography of the sardines(Sardinops spp.): assessing biogeographic models and popu-lation histories in temperate upwelling zones. Evolution, 51,1601–1610.
Burton R (1998) Intraspecific phylogeography across the PointConception biogeographic boundary. Evolution, 52, 734–745.
Butler JL, Smith PE, Lo NCH (1993) The effect of natural variabilityof life-history parameters on anchovy and sardine populationgrowth. Reports of California Cooperative Oceanic Fisheries Invest-igations (CalCOFI), 34, 104–111.
Chavez FP, Ryan J, Lluch-Cota SE, Niquen M (2003) From ancho-vies to sardines and back: multidecadal change in the Pacificocean. Science, 299, 217–221.
Chuey JM, Rea DK, Pisias NG (1987) Late Pleistocene paleoclima-tology of the central Equatorial Pacific: a quantitative record ofEolian and Carbonate deposition. Quaternary Research, 28, 323–339.
Cisneros-Mata MA, Nevarez-Martinez MO, Hammann MG (1995)The rise and fall of the Pacific sardine, Sardinops sagax caeruleusGirard, in the Gulf of California, Mexico. Reports of CaliforniaCooperative Oceanic Fisheries Investigations (CalCOFI), 36, 136–143.
Clark FN (1947) Analysis of populations of the Pacific sardine onthe basis of vertebral counts. California Department of Fish andGame, Fishery Bulletin, 65, 1–26.
Clark FN, Janssen JFJ (1945) Movements and abundance of thesardine as measured by tag returns. California Department ofFish and Game, Fishery Bulletin, 61, 7–42.
Clement M, Posada D, Crandall KA (2000) tcs: a computer pro-gram to estimate gene genealogies. Molecular Ecology, 9, 1657–1659.
Cockerham CC (1973) Analyses of gene frequencies. Genetics, 74,679–700.
Cowen RK, Lwiza KMM, Sponaugle S, Paris CB, Olson DB (2000)Connectivity of marine populations: open or closed? Science,287, 857–859.
Crowley TJ, North GR (1991) Paleoclimatology. Oxford UniversityPress, New York.
Cushing DH (1975) Marine Ecology and Fisheries. Cambridge Uni-versity Press, Cambridge.
Dawson M, Staton JL, Jacobs DK (2001) Phylogeography of thetidewater goby, Eucyclogobius newberryi (Teleostei, Gobiidae), incoastal California. Evolution, 55, 1167–1179.
Diaz-Jaimes P, Uribe Alcocer M, Ayala Duval E (1999) Electro-phoretic variation between the central and southern popula-tions of the northern anchovy Engraulis mordax Girard 1854(Engraulidae, Pisces) from Baja California, Mexico. CienciasMarinas, 25, 579–595.
Doucet WF, Einardsson H (1966) A brief description of Peruvianfisheries. Reports of California Cooperative Oceanic Fisheries Invest-igations (CalCOFI), 11, 82–87.
Fitch JE (1969) Fossil records of certain schooling fishes of the Cal-ifornia Current system. Reports of California Cooperative OceanicFisheries Investigations (CalCOFI), 13, 71–80.
Glynn PW (1988) El Niño–Southern oscillation 1982–83: nearshorepopulation, community, and ecosystems responses. AnnualReview of Ecology and Systematics, 19, 309–345.
Grant WS (1985) Biochemical genetic stock structure of the south-ern African anchovy, Engraulis capensis Gilchrist. Journal of FishBiology, 27, 23–29.
Grant WS, Bowen BW (1998) Shallow population histories in deepevolutionary lineages of marine fishes: insights from sardinesand anchovies and lessons for conservation. Journal of Heredity,89, 415–426.
Grant WS, Leslie RW (1996) Late Pleistocene dispersal of Indian–Pacific sardine populations in an ancient lineage of the genusSardinops. Marine Biology, 126, 133–142.
Hammann MG, Cisneros-Mata MA (1989) Range extension andcommercial capture of the northern anchovy, Engraulis mordaxGirard, in the Gulf of California, Mexico. California Fish andGame, 75, 49–53.
Harwood J, Stokes K (2003) Coping with uncertainty in ecologicaladvice: lessons from fisheries. Trends in Ecology and Evolution,18, 617–622.
Haugen CW, Messerschitt JD, Wickwire RH (1969) Progressreport on anchovy tagging off California and Baja California,March 1966 through May 1969. California Department of Fish andGame, Fishery Bulletin, 147, 75–89.
Hedgecock D (1991) Contrasting population genetic structures ofpelagic clupeoids in the California Current. In: Long-Term Variabilityof Pelagic Fish Populations and Their Environment (eds Kawasaki T,Tanaka S, Toba Y, Taniguchi A), pp. 199–207. Pergamon Press,Oxford.
Hedgecock D (1994) Temporal and spatial genetic structure ofmarine animal populations in the California current. Reports ofCalifornia Cooperative Oceanic Fisheries Investigations (CalCOFI),35, 73–81.
C L I M A T E V A R I A B I L I T Y I N M A R I N E F I S H E S 2181
© 2004 Blackwell Publishing Ltd, Molecular Ecology, 13, 2169–2182
Hedgecock D, Hutchinson ES, Li G, Sly FL, Nelson K (1989)Genetic and morphometric variation in the Pacific sardine,Sardinops sagax caerulea: comparisons and contrasts with histor-ical data and with variability in the northern anchovy, Engraulismordax. Fishery Bulletin, 87, 653–672.
Hedgecock D, Hutchinson ES, Li G, Sly FL, Nelson K (1994) Thecentral stock of northern anchovy (Engraulis mordax) is not arandomly mating population. Reports of California CooperativeOceanic Fisheries Investigations (CalCOFI), 35, 121–136.
Hellberg ME, Burton RS, Neigel JE, Palumbi SR (2002) Geneticassessment of connectivity among marine populations. Bulletinof Marine Science, 70, 273–290.
Herbert TD, Schuffert JD, Andreasen D et al. (2001) Collapse of theCalifornia current during glacial maxima linked to climatechange on land. Science, 293, 71–76.
Hewitt GM (1996) Some genetic consequences of ice ages, andtheir role in divergence and speciation. Biology Journal of theLinnean Society, 58, 247–276.
Hillis DM, Moritz C, Marble BK (1996) Molecular Systematics, 2ndedn. Sinauer Associates, Sunderland, MA.
Holmgrem-Urba D, Baumgartner TR (1993) A 250-years historyof pelagic fish abundances from the anaerobic sediments ofthe central Gulf of California. Reports of California CooperativeOceanic Fisheries Investigations (CalCOFI), 34, 60–68.
Hudson RH (1990) Gene genealogies and the coalescent process.In: Oxford Surveys in Evolutionary Biology (eds Futuyma DJ,Antonovics J), pp. 1–44. Oxford University Press, Oxford.
Hudson RR, Boos DD, Kaplan NL (1992) A statistical test fordetecting geographic subdivision. Molecular Biology and Evolu-tion, 9, 138–151.
Iles TD, Sinclair M (1982) Atlantic herring: stock discreteness andabundance. Science, 215, 627–633.
Irwin DM, Kocher TD, Wilson AC (1991) Evolution of the cyto-chrome b gene of mammals. Journal of Molecular Evolution, 32,128–144.
Janssen JFJ (1948) Summary of recovery of California sardine tagson the Pacific coast. California Fish and Game, 34, 3–10.
Jansson R, Dynesius M (2002) The fate of clades in a world ofrecurrent climate change: Milankovitch oscillations and evolu-tion. Annual Review of Ecology and Systematics, 33, 741–777.
Johnson MS, Black R (1984) Pattern beneath the chaos: the effectof recruitment on genetic patchiness in an intertidal limpet.Evolution, 38, 1371–1383.
Kennett JP, Ingram BL (1995) A 20,000-year record of ocean circu-lation and climate change from the Santa Barbara basin. Nature,377, 510–514.
Kiefer T, Sarnthein M, Erlenkeuser H, Grootes P, Roberts A (2001)North Pacific response to millennial-scale changes in ocean cir-culation over the last 60 kyr. Paleoceanography, 16, 179–189.
Kimura M, Ohta. T (1971) Protein polymorphism as a phase ofmolecular evolution. Nature, 229, 467–469.
Klyashtorin LB (2001) Climate Change and Long-Term Fluctuations ofCommercial Catches: The Possibility of Forecasting. FAO, Rome.
Kocher TD, Wilson AC (1991) Sequence evolution of mito-chondrial DNA in humans and chimpanzees: control region andprotein-coding region. In: Evolution of Life: Fossils, Molecules, andCulture (eds Osawa S, Honjo T), pp. 391–413. Springer, Hong Kong.
Lambeck K, Esat TM, Potter E-K (2002) Links between climate andsea levels for the past three million years. Nature, 419, 199–206.
Li WH (1977) Distribution of nucleotide differences between tworandomly chosen cistrons in a finite population. Genetics, 85,331–337.
Lluch-Belda D, Crawford RJM, Kawasaki T et al. (1989) World-wide fluctuations of sardine and anchovy stocks: the regimeproblem. South African Journal of Marine Sciences, 8, 195–205.
Lluch-Belda D, Lluch-Cota DB, Hernandez-Vazquez S, Salinas-Zavalas CA, Schwartzlose RA (1991) Sardine and anchovyspawning as related to temperature an upwelling in theCalifornia Current system. Reports of California CooperativeOceanic Fisheries Investigations (CalCOFI), 32, 105–111.
Lo NCH (1985) Egg production of the central stock of northernanchovy, Engraulis mordax, 1951–82. Fishery Bulletin, 83, 137–150.
MacCall AD (1990) Dynamic Geography of Marine Fish Populations.Washington Sea Grant Program, Seattle.
Maruyama T, Kimura M (1980) Genetic variability and effectivepopulation size when local extinction and recolonization of sub-populations are frequent. Proceedings of the National Academy ofSciences of the USA, 77, 6710–6714.
McFarlane G, Beamish R (2001) The re-occurrence of sardines offBritish Columbia characterizes the dynamic nature of regimes.Progress in Oceanography, 49, 151–165.
McFarlane GA, King JR, Beamish RJ (2000) Have there been recentchanges in climate? Ask the fish. Progress in Oceanography, 47,147–169.
McHugh JL (1950) Variations and populations in the clupeoidfishes of the North Pacific. PhD thesis, University of California,Los Angeles.
McPhaden MJ (1999) El Niño: The child prodigy of 1997–98.Nature, 398, 559–562.
Murphy GI (1966) Population biology of the Pacific sardine (Sardi-nops caerulea). Proceedings of the Californian Academy of Sciences,34, 1–84.
Murphy GI (1967) Vital statistics of the Pacific sardine (Sardinopscaeruea) and the population consequences. Ecology, 48, 731–736.
Nei M (1987) Molecular Evolutionary Genetics. Columbia UniversityPress, New York.
Nei M, Maruyama T, Chakraborty R (1975) The bottleneck effectand genetic variability in populations. Evolution, 29, 1–10.
Nevarez-Martinez MO, Lluch-Belda D, Cisneros-Mata MA,Santos-Molina JP, Martínez-Zavala DLA, Lluch-cota SE (2001)Distribution and abundance of the Pacific sardine (Sardinopssagax) in the Gulf of California and their relation with theenvironment. Progress in Oceanography, 49, 565–580.
Parrish RH, Serra R, Grant WS (1989) The monotypic sardines, Sar-dina and Sardinops: their taxonomy, distribution, stock structure,and zoogeography. Canadian Journal of Fisheries and AquaticSciences, 46, 2019–2036.
Paytan A, Kastner M, Chavez FP (1996) Glacial to interglacialfluctuations in productivity in the equatorial Pacific as indicatedby marine barite. Science, 274, 1355–1357.
Pulliam HR (1988) Sources, sinks, and population regulation.American Naturalist, 132, 652–661.
Rahmstorf S (2002) Ocean circulation and climate during the past120,000 years. Nature, 419, 207–214.
Rand DM (1996) Neutrality test of molecular markers and theconnection between DNA polymorphism, demography, andconservation biology. Conservation Biology, 10, 665–671.
Rodríguez-Sánchez R, Lluch-Belda D, Villalobos H, Ortega-GarciaS (2001) Large-scale long-term variability of small pelagic fish inthe California Current system. In: Spatial Processes and Manage-ment of Fish Populations (eds Kruse GH et al.), pp. 447–462. Uni-versity of Alaska Sea Grant AK-SG-01–02, Fairbanks.
Rodríguez-Sánchez R, Lluch-Belda D, Villalobos H, Ortega-Garcia S(2002) Dynamic geography of small pelagic fish populations in
2182 F . L E C O M T E E T A L .
© 2004 Blackwell Publishing Ltd, Molecular Ecology, 13, 2169–2182
the California Current system on the regime time scale (1931–97).Canadian Journal of Fisheries and Aquatic Sciences, 59, 1980–1988.
Rogers AR, Harpending H (1992) Population growth makeswaves in the distribution of pairwise genetic differences.Molecular Biology and Evolution, 9, 552–569.
Roman J, Palumbi SR (2003) Whales before whaling in the NorthAtlantic. Science, 301, 508–510.
Schneider S, Excoffier L (1999) Estimation of past demographicparameters from the distribution of pairwise differences whenthe mutation rates vary among sites: application to human mito-chondrial DNA. Genetics, 152, 1079–1089.
Schneider S, Roessli D, Excoffier L (2000) ARLEQUIN, Version 2.00: ASoftware for Population Genetics Data Analysis. Genetics andBiometry Laboratory, University of Geneva, Switzerland.
Schramm CT (1985) Implications of radiolarian assemblagesfor the Late Quaternary paleooceanography of the easternequatorial Pacific. Quaternary Research, 24, 204–218.
Schweigert JF (1988) Status of the Pacific sardine, Sardinops sagax,in Canada. Canadian Field-Naturalist, 102, 296–303.
Shoukri MM, Pause CA (1999) Statistical Methods for HealthSciences, 2nd edn. CRC Press, Boca Raton, FL.
Sinclair M (1988) Marine Populations, An Essay on Population Regu-lation and Speciation. University of Washington Press, Seattle.
Slatkin M, Hudson RH (1991) Pairwise comparisons of mito-chondrial DNA sequences in stable and exponentially growingpopulations. Genetics, 129, 555–562.
Song C (1994) Molecular evolution of the cytochrome b geneamong percid fishes. Unpublished dissertation, University ofIllinois, Urbana-Champaign.
Soutar A (1966) The accumulation of fish debris in certain Cali-fornia coastal sediments. California Cooperative Oceanic FisheriesInvestigations (CalCOFI), 11, 136–139.
Soutar A, Isaacs JD (1974) Abundance of pelagic fish during the19th and 20th centuries as recorded in anaerobic sediment offthe Californias. Fishery Bulletin, 72, 257–273.
Swearer S, Shima J, Hellberg M et al. (2002) Evidence of self-recruitment in demersal marine populations. Bulletin of MarineScience, 70, 251–271.
Tajima F (1989) Statistical method for testing the neutral mutationhypothesis by DNA polymorphism. Genetics, 123, 585–595.
Tajima F (1996) The amount of DNA polymorphism maintained ina finite population when the neutral mutation rate varies amongsites. Genetics, 143, 1457–1465.
Tamura K, Nei M (1993) Estimation of the number of nucleotidesubstitutions in the control region of mitochondrial DNA inhumans and chimpanzees. Molecular Biology and Evolution, 10,512–526.
Toonen RJ (2001) Genetic analysis of recruitment and dispersalpatterns in the porcelain shore crab, Petrolisthes cinctipes.Unpublished dissertation, University of California, Davis.
Uribe-Alcocer M, Valdes Morales N, Diaz Jaimes P, HornelasOrozco Y, Arenas V (1996) Comparison of the karyotypes ofthe central and southern populations of the northern anchovyEngraulis mordax, Girard 1854 (Engraulidae, Pisces). CienciasMarinas, 22, 361–376.
Vrooman AM, Paloma PA, Zweifel JR (1981) Electrophoretic,morphometric, and meristic studies of subpopulations ofnorthern anchovy, Engraulis mordax. California Fish and Game, 67,39–51.
Webb T III, Bartlein PJ (1992) Global changes during the last 3 mil-lions years: climatic control and biotic responses. Annual Reviewof Ecology and Systematics, 23, 141–173.
Whitehead PJP (1985) Clupeoid Fishes of the World (SuborderClupeoidei): An Annotated and Illustrated Catalogue of the Herrings,Sardines, Pilchards, Sprats, Shads, Anchovies, and Wolfherrings.Part 1 — Clupeididae. FAO Fisheries Synopsis, Rome.
Whitehead PJP, Nelson GJ, Wongratana T (1988) Clupeoid Fishesof the World (Suborder Clupeoidei): An Annotated and IllustratedCatalogue of the Herrings, Sardines, Pilchards, Sprats, Shads, Anchovies,and Wolfherrings. Part 2 — Engraulididae. FAO Fisheries Synopsis,Rome.
This study is part of a PhD internship project (by FL, super-vised by BWB) on the phylogeography and molecular ecologyof clupeoid fishes. Frederic Lecomte’s major interests are relatedto the molecular ecology and evolution of small pelagic fishes.Stewart Grant has a career-long interest in the evolution andzoogeography of marine organisms. Julian Dodson’s interestsinclude the evolutionary ecology of fishes, life history evolution,early life-history ecology and the conservation of aquaticresources. Rubén Rodríguez is interested in the ecology andmanagement of coastal marine fishes. Brian Bowen studies thephylogeography and conservation genetics of marine organismsat Hawaii Institute of Marine Biology.
Related Documents