Living Responsibility Interim Report to 30 September 2012

Welcome message from author
This document is posted to help you gain knowledge. Please leave a comment to let me know what you think about it! Share it to your friends and learn new things together.
Transcript
Living Responsibility
Interim Report to 30 September 2012
2
Overview of the BKS Bank Group _____________________________________________ 3
Preface by the Management Board ____________________________________________ 4
Group Management Report for theNine Months Ended 30 September 2012 _______________________________________ 5
The Economic Setting in which Banks are Operating _________________________________ 5Notes on the Scope of Consolidation _____________________________________________ 7Assets, Liabilities, Financial Position ______________________________________________ 7Own Funds _________________________________________________________________ 9Performance ________________________________________________________________ 10Ratios _____________________________________________________________________ 11Segmental Reports ___________________________________________________________ 11Risk Report _________________________________________________________________ 13Outlook for the Year as a Whole _________________________________________________ 15Overview of the 3 Banken Group ________________________________________________ 16
Consolidated Financial Statements as at and for theNine Months Ended 30 September 2012 _______________________________________ 17
Income Statement of the BKS Bank Group for the Period from1 January to 30 September 2012 _________________________________________________ 18
Balance Sheet of the BKS Bank Group as at 30 September 2012 _________________________ 19Statement of Changes in Equity _________________________________________________ 20Cash Flow Statement _________________________________________________________ 20Notes to the Consolidated Financial Statements of BKS Bank __________________________ 21
Statement by BKS Bank’s Management ________________________________________ 32
Remarks, Publication Details ____________________________________________________ 32
Contents
CONtENtS
3
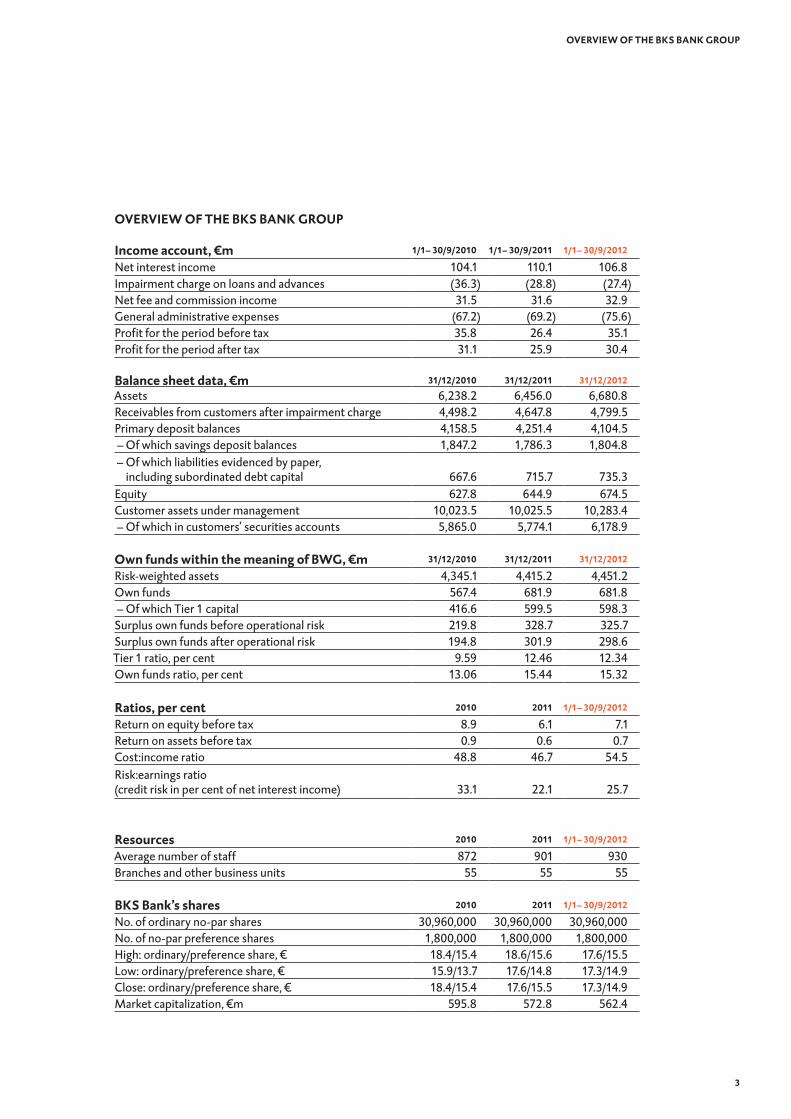
OVERVIEW OF tHE BKS BANK GROUP
Income account, €m 1/1– 30/9/2010 1/1– 30/9/2011 1/1– 30/9/2012
Net interest income 104.1 110.1 106.8Impairment charge on loans and advances (36.3) (28.8) (27.4)Net fee and commission income 31.5 31.6 32.9General administrative expenses (67.2) (69.2) (75.6)Profit for the period before tax 35.8 26.4 35.1Profit for the period after tax 31.1 25.9 30.4
Balance sheet data, €m 31/12/2010 31/12/2011 31/12/2012
Assets 6,238.2 6,456.0 6,680.8Receivables from customers after impairment charge 4,498.2 4,647.8 4,799.5Primary deposit balances 4,158.5 4,251.4 4,104.5 – Of which savings deposit balances 1,847.2 1,786.3 1,804.8 – Of which liabilities evidenced by paper, including subordinated debt capital 667.6 715.7 735.3Equity 627.8 644.9 674.5Customer assets under management 10,023.5 10,025.5 10,283.4 – Of which in customers’ securities accounts 5,865.0 5,774.1 6,178.9
Own funds within the meaning of BWG, €m 31/12/2010 31/12/2011 31/12/2012
Risk-weighted assets 4,345.1 4,415.2 4,451.2Own funds 567.4 681.9 681.8 – Of which Tier 1 capital 416.6 599.5 598.3Surplus own funds before operational risk 219.8 328.7 325.7Surplus own funds after operational risk 194.8 301.9 298.6Tier 1 ratio, per cent 9.59 12.46 12.34Own funds ratio, per cent 13.06 15.44 15.32
Ratios, per cent 2010 2011 1/1– 30/9/2012
Return on equity before tax 8.9 6.1 7.1Return on assets before tax 0.9 0.6 0.7Cost:income ratio 48.8 46.7 54.5Risk:earnings ratio(credit risk in per cent of net interest income) 33.1 22.1 25.7
Resources 2010 2011 1/1– 30/9/2012
Average number of staff 872 901 930Branches and other business units 55 55 55
BKS Bank’s shares 2010 2011 1/1– 30/9/2012
No. of ordinary no-par shares 30,960,000 30,960,000 30,960,000No. of no-par preference shares 1,800,000 1,800,000 1,800,000High: ordinary/preference share, € 18.4/15.4 18.6/15.6 17.6/15.5Low: ordinary/preference share, € 15.9/13.7 17.6/14.8 17.3/14.9Close: ordinary/preference share, € 18.4/15.4 17.6/15.5 17.3/14.9Market capitalization, €m 595.8 572.8 562.4
OVERVIEW OF tHE BKS BANK GROUP

4
Dear shareholder,Dear customer,Dear business associate of BKS Bank, We welcome you very warmly to our third Shareholders Letter in 2012. As you can see in these Interim Financial Statements, BKS Bank was able to return another solid profit despite the difficult conditions. However, the weak demand for loans and investment services, historically low interest rates and tougher regulatory standards combined with the associated increase in staff and other administrative costs had a massive impact on profits in the banking industry. A great deal of effort was needed in day-to-day operations to successfully counteract this effect. Nevertheless, the most important components of profitability — net interest income and net fee and commission income, and general administrative expenses on the other side of the account — developed satisfactorily. Profit before tax in the first three quarters of 2012 came to €35.1 million, which was roughly one third up on the same period of 2011. Profit for the period after tax was 17.7 per cent up on the same period of 2011 to €30.4 million. Despite the negative impact that the debt crises on both sides of the Atlantic had on the global financial markets and the real economy, our Group’s consolidated assets grew by 3.5 per cent to more than €6.68 billion during the first nine months of the year. The increase on the assets side of the Balance Sheet was due mainly to a steady increase in receivables from customers, which advanced by 3.4 per cent to roughly €4.96 billion. On the equity and liabilities side of the Balance Sheet, so-called primary funds provided by our customers decreased by 3.5 per cent to approximately €4.10 billion, but at the same time, payables to other banks increased by about a quarter to €1.73 billion. In view of the still difficult economic environment, we were uncompromising in the application of our prudent liquidity and risk management policies.
We are pleased to be able to report that the bank also has a comfortable capital position. BKS Bank’s own funds base was very solid at the end of the third quarter of 2012. Our Tier 1 ratio was 12.3 per cent, which was well above the requirements for the European banking industry, and we had a total capital ratio of 15.3 per cent. Thanks to surplus own funds of nearly €300 million, BKS Bank is excellently placed not just to deal with another prolonging of the obstinate European financial crisis but also to undertake carefully targeted expansion in the battle for customers and profits.
PREFACE BY tHE MANAGEMENt BOARD

5
Let me, Heimo Penker, briefly review the meeting of the Supervisory Board held on 26 September. The plenary ses-sion of the Supervisory Board respected my wish to retire after 28 years’ membership of the Management Board at the end of my current term of office, that is at the close of April 2014, and took a farsighted personnel decision ahead of that time. I am thus very pleased to report that Wolfgang Mandl, a long-standing employee of our bank, has now been newly appointed to the Management Board. Wolfgang Mandl began his career with us as a personal banking advi-sor at our Regional Head Office in Spittal before graduating in applied business administration as a mature student. He then held various positions in corporate and business cus-tomer care before becoming Head of our Klagenfurt Regional Head Office in 2003. Since then, he has been responsible for retail operations. Herta Stockbauer, Dieter Krassnitzer and I know him as a capable manager who is highly regarded by staff. Our new colleague on the Management Board will take up his post on 1 January 2013.
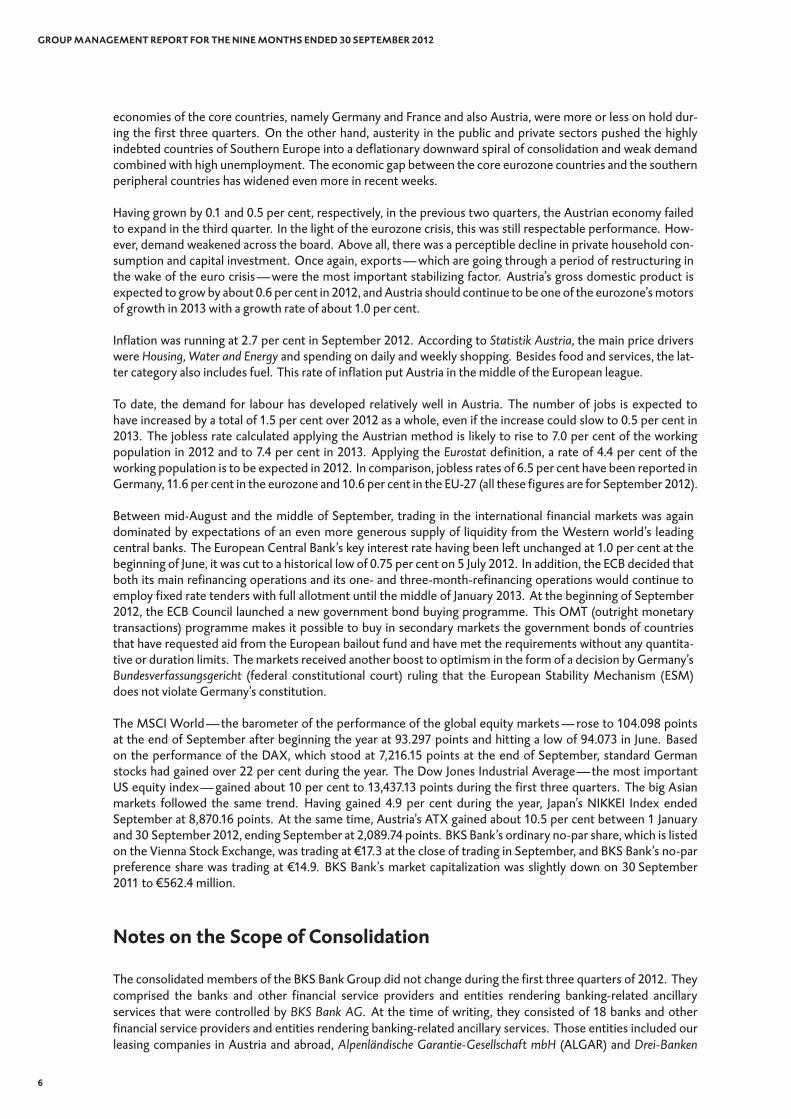
the Economic Setting in which Banks are Operating Global economic growth continued to lose momentum in the third quarter of 2012. This was due to a combina-tion of the diminishing effect of monetary policy action by the major central banks, the still difficult situation created by the European sovereign debt crisis and the weakening of the Asian and Latin American emerging market economies. In China, the government and the People’s Bank of China responded to the economy’s marked cool-down with fiscal and monetary policy measures. The IMF is predicting a soft landing for the Chinese economy with GDP growth of 8.0 per cent. Economic growth in Japan has also slowed perceptibly in recent quarters. One year after Fukushima, much of this has been due to the phasing out of subsidies for buying environmentally friendly cars and a reduction in Japan’s extremely high government debt ratio (about 220 per cent of GDP).
The US economy’s recovery went on losing steam during the first three quarters. Whereas the property sector has been sending out positive signals for several months, the turnaround in the labour market has yet to firm up. However, the September unemployment rate announced ahead of the presidential elections was a first small improvement, at 7.8 per cent. To date, domestic demand has been the economy’s principal motor, but the inevitable and necessary drastic fiscal consolidation could severely dent private consumption and invest-ment. Recently, the US Federal Reserve carried out another reduction in its economic growth forecast and is now estimating GDP growth in 2012 at between 1.9 and 2.4 per cent. The Fed funds rate has been between zero and 0.25 per cent since December 2008 and is to stay close to zero until at least 2015.
The economic climate in the eurozone has been becoming increasingly gloomy since the beginning of 2012. We have seen a significant drop in domestic demand in the face of increasing uncertainty and fiscal consolida-tion. Although foreign trade is still positively balanced, this is only because imports have been growing far less strongly than exports. Following a small drop in GDP in the third quarter, the available forecasts are predicting further slight negative growth in the fourth quarter of 2012. The loss of confidence among market participants has been stoked by doubts about the implementation of the austerity programmes agreed with Greece and growing problems with, above all, the budget in Spain. Because of their supra-regional orientation and the important role that government bonds play in their day-to-day operations, the eurozone’s major banks have been hurt by developments in the financial markets. In particular, they were hit by the temporary surge in risk premiums on Spanish and Italian government bonds. According to the indicators we have at the moment, the
GROUP MANAGEMENt REPORt FOR tHE NINE MONtHS ENDED 30 SEPtEMBER 2012
6
economies of the core countries, namely Germany and France and also Austria, were more or less on hold dur-ing the first three quarters. On the other hand, austerity in the public and private sectors pushed the highly indebted countries of Southern Europe into a deflationary downward spiral of consolidation and weak demand combined with high unemployment. The economic gap between the core eurozone countries and the southern peripheral countries has widened even more in recent weeks.
Having grown by 0.1 and 0.5 per cent, respectively, in the previous two quarters, the Austrian economy failed to expand in the third quarter. In the light of the eurozone crisis, this was still respectable performance. How-ever, demand weakened across the board. Above all, there was a perceptible decline in private household con-sumption and capital investment. Once again, exports — which are going through a period of restructuring in the wake of the euro crisis — were the most important stabilizing factor. Austria’s gross domestic product is expected to grow by about 0.6 per cent in 2012, and Austria should continue to be one of the eurozone’s motors of growth in 2013 with a growth rate of about 1.0 per cent. Inflation was running at 2.7 per cent in September 2012. According to Statistik Austria, the main price drivers were Housing, Water and Energy and spending on daily and weekly shopping. Besides food and services, the lat-ter category also includes fuel. This rate of inflation put Austria in the middle of the European league.
To date, the demand for labour has developed relatively well in Austria. The number of jobs is expected to have increased by a total of 1.5 per cent over 2012 as a whole, even if the increase could slow to 0.5 per cent in 2013. The jobless rate calculated applying the Austrian method is likely to rise to 7.0 per cent of the working population in 2012 and to 7.4 per cent in 2013. Applying the Eurostat definition, a rate of 4.4 per cent of the working population is to be expected in 2012. In comparison, jobless rates of 6.5 per cent have been reported in Germany, 11.6 per cent in the eurozone and 10.6 per cent in the EU-27 (all these figures are for September 2012).
Between mid-August and the middle of September, trading in the international financial markets was again dominated by expectations of an even more generous supply of liquidity from the Western world’s leading central banks. The European Central Bank’s key interest rate having been left unchanged at 1.0 per cent at the beginning of June, it was cut to a historical low of 0.75 per cent on 5 July 2012. In addition, the ECB decided that both its main refinancing operations and its one- and three-month-refinancing operations would continue to employ fixed rate tenders with full allotment until the middle of January 2013. At the beginning of September 2012, the ECB Council launched a new government bond buying programme. This OMT (outright monetary transactions) programme makes it possible to buy in secondary markets the government bonds of countries that have requested aid from the European bailout fund and have met the requirements without any quantita-tive or duration limits. The markets received another boost to optimism in the form of a decision by Germany’s Bundesverfassungsgericht (federal constitutional court) ruling that the European Stability Mechanism (ESM) does not violate Germany’s constitution.
The MSCI World — the barometer of the performance of the global equity markets — rose to 104.098 points at the end of September after beginning the year at 93.297 points and hitting a low of 94.073 in June. Based on the performance of the DAX, which stood at 7,216.15 points at the end of September, standard German stocks had gained over 22 per cent during the year. The Dow Jones Industrial Average — the most important US equity index — gained about 10 per cent to 13,437.13 points during the first three quarters. The big Asian markets followed the same trend. Having gained 4.9 per cent during the year, Japan’s NIKKEI Index ended September at 8,870.16 points. At the same time, Austria’s ATX gained about 10.5 per cent between 1 January and 30 September 2012, ending September at 2,089.74 points. BKS Bank’s ordinary no-par share, which is listed on the Vienna Stock Exchange, was trading at €17.3 at the close of trading in September, and BKS Bank’s no-par preference share was trading at €14.9. BKS Bank’s market capitalization was slightly down on 30 September 2011 to €562.4 million.
Notes on the Scope of Consolidation
The consolidated members of the BKS Bank Group did not change during the first three quarters of 2012. They comprised the banks and other financial service providers and entities rendering banking-related ancillary services that were controlled by BKS Bank AG. At the time of writing, they consisted of 18 banks and other financial service providers and entities rendering banking-related ancillary services. Those entities included our leasing companies in Austria and abroad, Alpenländische Garantie-Gesellschaft mbH (ALGAR) and Drei-Banken
GROUP MANAGEMENt REPORt FOR tHE NINE MONtHS ENDED 30 SEPtEMBER 2012

7
Versicherungs-Aktiengesellschaft. Minority interests in profit for the period were deducted when calculating consolidated net profit for the period. Our investments in our sister banks Oberbank AG and Bank für Tirol und Vorarlberg AG — which make up the 3 Banken Group together with BKS Bank AG — are also accounted for in the Consolidated Financial Statements, using the equity method. Although BKS Bank controls less than 20 per cent of the voting power in each of these banks, holding stakes of 18.51 per cent and 15.10 per cent, respectively, it exerts a significant influence as the result of long-term syndicate agreements. Consequently, consolidated net profit for the nine months ended 30 September 2012 includes BKS Bank’s interests in these banks’ profit for the period. The other consolidated entities, most of which are designated as real estate companies, render banking-related ancillary services.
Assets, Liabilities, Financial Position
Assets
The BKS Bank Group’s assets grew by €224.8 million to €6,680.8 million during the period under review to end September 3.5 per cent up on the end of 2011. On the assets side of the Balance Sheet, receivables from cus-tomers increased most, growing by €162.9 million or 3.4 per cent to €4.96 billion. IFRSs require an impairment allowance to be deducted from receivables from customers. In the period under review, the impairment allow-ance balance was increased by €11.2 million to €164.4 million. The line item Financial assets came to €1,508.4 million at 30 September 2012, compared with €1,463.3 million at 31 December 2011. This translates into an increase of €45.1 million during the period under review. Above all, an increase in Financial assets designated as at fair value through profit or loss coincided with redemptions of held to maturity securities. Receivables from other banks increased by 16.3 per cent to €0.14 billion during the first nine months of the year. This compared with payables to other banks of €1.73 billion at the end of September.
After the deduction of intragroup receivables, BKS Bank AG accounted for €4,538.3 million of lending by the Group, which increased to €155.1 million in the period under review. Although most of the increase in receiv-ables was generated by new business with corporate and business banking customers, there was also pleasing growth in new loans in the Austrian retail customers segment. Because of the increasingly difficult macroeco-nomic environment, we reduced the volume of our new business in the Slovenian market. Consequently, new business in the retail customers segment in Slovenia having still averaged about €4 million per month up to the end of July, it decreased to an average of roughly €2.5 million in August and September 2012. The effectiveness of our business model was demonstrated by the fact that we were virtually unaffected by the worrying wave of insolvencies in Slovenia. BKS Bank was also able to gain ground in Slovakia, where our branch generated €28.7 million of new business. New business in September made a particularly big contribution to this growth.
Banks and Other Financial Service Providers
BKS-leasing d.o.o., Ljubljana
BKS-Immobilienleasing Gesellschaft mbH, Klagenfurt
BKS-Leasing Gesellschaft mbH, Klagenfurt
BKS Bank AG, Klagenfurt
tHE MEMBERS OF tHE GROUP
Other Consolidated Entities
BKS Hybrid alpha GmbH, Klagenfurt
LVM Beteiligungs Gesellschaft mbH, Vienna
VBG-CH Verwaltungs- und Beteiligungs GmbH, Klagenfurt
Immobilien Errichtungs- u. Vermietungsgesellschaft mbH & Co. KG, Klagenfurt
IEV Immobilien GmbH, Klagenfurt
BKS Zentrale-Errichtungs- u. Vermietungsgesellschaft mbH, Klagenfurt
Consolidated Accounted for using the equity method
BKS Hybrid beta GmbH, Klagenfurt
Bank für Tirol und Vorarlberg AG, Innsbruck
Alpenländische Garantie-Gesellschaft mbH, Linz
Oberbank AG, Linz
Drei-Banken Versicherungs-Aktiengesellschaft, Linz
BKS-Leasing a.s.,Bratislava1
BKS-leasing Croatia d.o.o., Zagreb
BKS Bank d.d., Rijeka
1 BKS-Leasing a.s. makes up a subgroup with BKS Finance s.r.o.
GROUP MANAGEMENt REPORt FOR tHE NINE MONtHS ENDED 30 SEPtEMBER 2012

8
In the foreign currency loan segment, the steady decrease in Swiss franc receivables continued, reducing the portfolio by SFr 139.7 million during the period under review. This was a clear response to the challenges involved in managing this risk position.
Our Austrian lease portfolio shrank compared with 31 December 2011 to total €155.0 million. This was mainly due to a slowdown in new business. Our leasing subsidiaries abroad — BKS-Leasing a.s. in Bratislava, BKS-leasing d.o.o. in Ljubljana and BKS-leasing Croatia d.o.o. in Zagreb — were able to increase their receivables by €3.6 mil-lion to a total of €156.9 million during the first three quarters.
BKS Bank d.d. also developed very satisfactorily, increasing its receivables by €14.0 million to €113.7 million as at the end of September. An increase in share capital of €10.6 million is taking place to secure our Croatian banking subsidiary’s growth path.
The line item Financial assets consists of the sub-items financial assets designated as at fair value through profit or loss, available-for-sale financial assets, held-to-maturity financial assets and investments in entities accounted for using the equity method. This line item was €45.1 million up on the end of 2011 to €1.51 billion. During the period under review, the line item Financial assets designated as at fair value through profit or loss increased by €64.8 million to €184.4 million. On the other hand, since the beginning of 2012, we have been hedging fixed-interest loans totalling €29.1 million against interest rate risk using the fair value option, so those loans are assigned to this line item. The portfolio of held-to-maturity (HTM) financial assets totalled €702.8 million at the end of September, having shrunk by €35.9 million during the first three quarters. New investments totalled €98.0 million, while redemptions came to €129.9 million. Investments in entities accounted for using the equity method, most of which comprised our interests in the equity of Oberbank AG and BTV AG, increased to €331.1 million. This was €21.2 million more than at the end of December 2011.
Equity and liabilities
So-called primary funds — the supporting pillar of our sustainable liquidity management activities — accounted for roughly 61 per cent of our balance sheet total at the end of September. Savings, sight and time deposit bal-ances and liabilities evidenced by paper remained high at a total of €4.10 billion, reflecting the confidence placed in our crisis-resistant business model by our customers.
We had very mixed success in attracting savings deposits during the period under review. The uncertainty caused by the sovereign debt crisis prompted our customers to step up their search for alternative and sup-posedly more secure investments like gold and real estate. Nonetheless, savings deposit balances at the end of September were €18.4 million or 1.0 per cent up on the end of 2011 to €1.80 billion. We are of course still endeavouring with the help of our attractive products to generate new volumes of these deposits, which play such an important role in BKS Bank’s liquidity management activities. At the moment, we are offering custom-ers a ‘jubilee’ Kapitalsparbuch fixed-term, fixed-rate passbook account to celebrate our ninetieth anniversary. It has a duration of one year and pays an interest rate of 1.50 per cent. As the very promising start-up phase has shown, customers are taking a lively interest in this product.
However, sight and time deposit balances fell noticeably compared with 31 December 2011, decreasing by 10.6 per cent to €1.56 billion. In particular, the heightened level of investment by institutional clients was not sustained up to the end of September for profit reasons. This made the intensity of the competition for invest-ments very evident. We expect the pressure on terms and conditions to continue to grow in the last quarter.
Long-term loans can only be financed by funds that are available long-term on a matched maturity basis. This means that our own issuances are an essential part of our liquidity management activities. Our bond portfolio was €19.6 million up on the end of 2011 to €0.74 billion. Given the extremely low level of interest rates — with the yield on 10-year German bunds at just 1.44 per cent at the end of September — this was a very respectable increase.
The line item Equity increased by €29.6 million to €0.67 billion during the first three quarters. Most of the increase was due to the change in the balance of gains and losses recognized in equity and the improvement in profit for the period. We refer you to the table entitled Statement of Changes in Equity on page 20 for details of BKS Bank’s equity.
GROUP MANAGEMENt REPORt FOR tHE NINE MONtHS ENDED 30 SEPtEMBER 2012

9
Own funds
BKS Bank calculates its own funds ratio and basis of assessment in accordance with the solvency regime estab-lished by Basel II. BKS Bank uses the standardized approach to calculate its own funds requirement.
The basis of assessment for the banking book increased by €36.0 million to €4.45 billion between the beginning of 2012 and the end of the period under review. Eligible own funds were kept high at the same level as at the end of 2011, totalling €681.8 million at 30 September 2012. The new legislative requirements collected together under the heading of ‘Basel III’ will have a major impact on own funds. However, as things stand at the moment, there is likely to be a big delay in the enactment of these requirements, which had been planned for 1 January 2013. Nonetheless, we are making intensive preparations for the new regulations. We have been carrying out simulations and preparing own funds scenarios on the basis of the regulations that are currently in force and have performed a detailed gap analysis within the scope of a Basel III project.
Our ratios were outstanding at the end of September 2012. We had an own funds ratio of 15.3 per cent, our Tier 1 ratio had stabilized at 12.3 per cent and we had surplus own funds of €325.7 million. Own funds after tak-ing account of operational risk came to €298.6 million, providing an adequate basis for lending growth for which capital charges will be required.
Performance
Although the market environment was still unstable, BKS Bank returned a solid profit in the first three quarters of 2012. It was contributed to by every business segment in Austria and abroad. However, our performance during the year was overshadowed by historically low interest rates, severe pressure on deposit margins, delays in carrying out adjustments to fixed interest products and cuts in interest rates caused by the applicable sliding rate of interest clauses.
OWN FUNDS OF BKS BANK KREDItINStItUtSGRUPPE
€m 31/12/2010 31/12/2011 30/9/2012
Share capital 65.5 65.5 65.5Hybrid capital 40.0 40.0 40.0Reserves net of intangible assets 311.1 494.0 492.8tier 1 capital 416.6 599.5 598.3Tier 1 ratio 1 9.59% 12.46% 12.34%Hidden reserves within the meaning of § 57 BWG 10.3 5.6 5.6Eligible supplementary capital 155.8 134.6 124.6Balance of gains and losses taken to equity 65.2 19.9 37.2
Eligible subordinated liabilities 12.9 20.7 14.4
Supplementary own funds (tier 2) 244.2 180.8 181.8Deductions from Tier 1 and Tier 2 93.3 98.4 98.3Eligible own funds 567.4 681.9 681.8Own funds ratio 13.06% 15.44% 15.32%Basis of assessment for the banking book 4,345.1 4,415.2 4,451.2Own funds requirement 347.6 353.2 356.1Own funds requirement for the trading book 2.9 2.4 2.2– Of which arising from open currency positions 2.2 1.4 1.1Own funds requirement for operational risk 25.0 26.8 27.1Surplus own funds (disregarding operational risk) 219.8 328.7 325.7Surplus own funds (taking account of operational risk) 194.8 301.9 298.6
1 In 2011 und 2012, 50 per cent of the stakes held in other banks was deducted when calculating this ratio.
GROUP MANAGEMENt REPORt FOR tHE NINE MONtHS ENDED 30 SEPtEMBER 2012

10
That notwithstanding, profit for the period before tax was nearly one third up on the same period of 2011 to €35.1 million. Net interest income after the impairment charge on loans and advances was 2.5 per cent below the outstanding figure recorded in the same period of 2011, at €79.3 million. Although interest income was 0.8 per cent up on the first three quarters of 2011 to €164.1 million, interest expenses were not as expected, coming to €73.6 million. This was due to an increase in interest payments on savings and time deposits caused by extremely tough competition and further cuts in consumer loan interest rates caused by the applicable slid-ing rate of interest clauses.
The charge for impairment losses on loans and advances was near-static on the previous year at €27.4 mil-lion. After three quarters, our subsidiaries in Austria and abroad accounted for 7.3 per cent of the Group’s total risk allowances.
Net fee and commission income developed better during the period under review than in 2011, increasing by €1.3 million or 3.9 per cent to €32.9 million. This compared with a Group-wide total of €31.6 million in the first three quarters of 2011. As you can see from note (3) on page 25, this was mainly thanks to an increase in our fee and commission earnings from payment services, credit operations and foreign operations. Payments proved to be the strongest source of our earnings from services up to the end of September, delivering income of €13.2 million. Switches out of foreign currency loans are welcome, especially from a risk point of view, and they helped generate solid net fee and commission income of €2.1 million from foreign payments. Fee and com-mission earnings from credit operations were €0.8 million up on the same period of 2011. In contrast, fee and commission earnings from securities operations during the nine months ended 30 September 2012 were still €0.3 million down on the same period of 2011 to €7.9 million. This was, above all, because of the risk aversion that we were still feeling among our securities clients, especially in the second quarter.
Profit/(loss) from financial assets, which consists of the sub-items Profit/(loss) from financial assets designated as at fair value through profit or loss, Profit/(loss) from available-for-sale financial assets and Profit/(loss) from held-to-maturity financial assets, came to negative €0.6 million in the first three quarters of 2012. This compared with a difficult 2011, when it came to negative €20.6 million because, above all, of the requisite write-downs of Greek government bonds. Profit from financial assets designated as at fair value through profit or loss came to €2.2 million, so income from this line item was €4.6 million up on the nine months ended 30 September 2011. This was thanks to revaluation gains of €3.9 million resulting from use of the fair value option. As we have already said, our profit/(loss) from held-to-maturity financial assets had been affected by the dramatic developments in the Greek government bond market in 2011. Following a loss of €17.2 million in the nine months ended 30 September 2011, the loss in the period under review was just €2.6 million.
Join us now for a look at our expenses. As shown in note (5) on page 26, Staff costs were 9.8 per cent up on the first three quarters of 2011 to €51.1 million. This was the result of an increase in the Group’s average work-force to 930 staff years, or 29 more staff years than at the end of 2011, and at the same time, the allocation to provisions for old-age benefits had to be as high as possible because of the low level of interest rates. The cor-responding expense item was thus increased by €1.0 million as a precaution in the third quarter. On the other hand, the 3.5 per cent adjustment to salaries under collective agreements was exactly what we had budgeted for.
GROUP MANAGEMENt REPORt FOR tHE NINE MONtHS ENDED 30 SEPtEMBER 2012
0
-40
100
40
80
-20
20
60
-60
Components of the Income Statement
€m
Net interest income after impairment
charge
Profit/(loss) from financial assets
Net fee and commission income
Staff costs
Profit for the period after tax
Other administrative costs, incl. deprecia-
tion/amortization
67.781.4
31.631.5
(20.6)
1.6
(45.6)(24.4)(22.6)(21.6)
25.931.1
-80Q1 – Q3 2010 Q1 – Q3 2012Q1 – Q3 2011
(46.6)
79.3
32.9
(51.1)
30.4
(0.6)

11
Regular and rigorous monitoring kept Other administrative costs and Depreciation/amortization down to a still acceptable total of €24.4 million during the period under review. Individual savings such as a cut in Group market-ing costs were offset by extraordinary expenses like the consultancy costs connected with a number of forward-looking projects. Other operating income net of other operating expenses in the nine months ended 30 September 2012 came to negative €2.2 million. This was primarily due to a revaluation of the goodwill of our Croatian bank-ing subsidiary BKS Bank d.d.
As a result of the developments we have described, the BKS Bank Group posted a profit for the period before tax in the first nine months of the year of €30.4 million, compared with €25.9 million in the same period of 2011. The stability levy (bank tax) payable to the inland revenue in the first three quarters in respect of 2012 came to €1.5 million. It is included in the line item Other operating expenses.
RatiosLet us take look at a number of common operational ratios. With the banking environment still difficult, several ratios were slightly weakened, but overall, they still depict a stable enterprise. As we have already described in the section on our own funds, BKS Bank has a very solid own funds base and, as a consequence, correspondingly good ratios. The return on equity before tax was already better than in 2011, at 7.1 per cent, even if it did not yet match the rather good returns recorded in prior periods. Our cost:income ratio (the ratio of general administrative expenses to total earnings without deducting the charge for
impairment losses on loans and advances) in the first three quarters was up to 54.5 per cent, but it was still below our internal 55 per cent benchmark. The risk situation in the corporate and business banking segment remained tense, and this was mirrored by our risk:earnings ratio, which rose slightly from 22.1 per cent in 2011 to 25.7 per cent in the period under review. Our internal RER target for this year is 24.5 per cent, and our long-term target for the Group as a whole is a ratio of 20 per cent. The Group’s return on assets — the gauge of the total return on its assets — rose by 10 basis points compared with 2011 to 0.7 per cent.
Segmental ReportsBKS Bank’s segmental reporting is based on the organizational structure of the Group underlying its internal man-agement reporting system. BKS Bank focuses its activities on three large business divisions, namely Corporate and Business Banking, Retail Banking and Financial Markets. We measure the performance of each of those segments by its profit before tax, return on equity (ROE), cost:income ratio (CIR) and risk:earnings ratio (RER). It is on this basis that we assess the financial development of each segment and make decisions regarding the allocation of our enterprise’s resources.
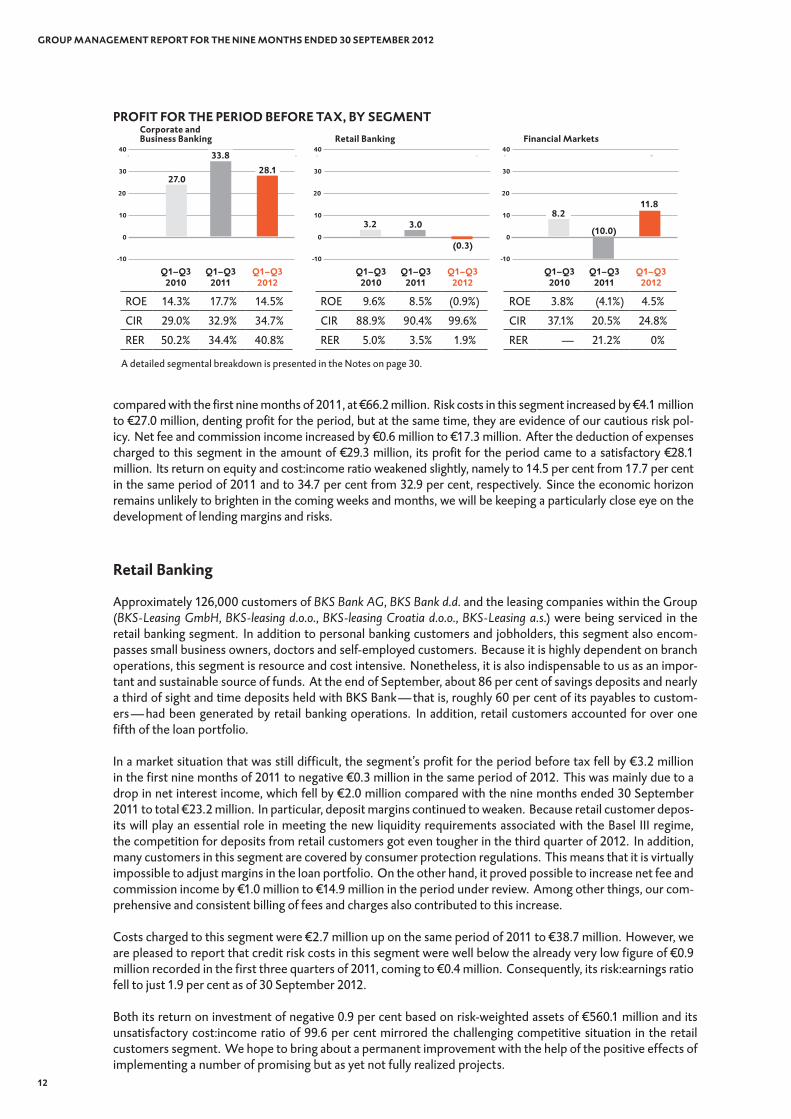
Corporate and Business Banking
Roughly 13,000 customers were being serviced in the corporate and business banking segment. Besides all the income and expenses of BKS Bank AG that arose from business done with corporate and business banking cus-tomers, this segment also encompassed the income and expenses of BKS Bank d.d. in Croatia and the Group’s leasing companies insofar as they arose from customer business done with corporates or businesses. The cor-porate and business banking segment is the most important operating business unit by far within the BKS Bank Group.
BKS Bank made a profit before tax of €28.1 million in the corporate and business banking segment during the first nine months, compared with €33.8 million in the same period of 2011. In this segment, our consistent terms and conditions policy enabled us to keep net interest income from both new and portfolio business nearly static
CORPORAtE PERFORMANCE RAtIOSPer cent 2010 2011 30/9/2012
Tier 1 ratio 9.6 12.5 12.3
Own funds ratio 13.1 15.4 15.3
ROE (before tax) 8.9 6.1 7.1
ROA (after tax) 0.9 0.6 0.7
Cost:income ratio 48.8 46.7 54.5
Risk:earnings ratio 33.1 22.1 25.7
GROUP MANAGEMENt REPORt FOR tHE NINE MONtHS ENDED 30 SEPtEMBER 2012
12
compared with the first nine months of 2011, at €66.2 million. Risk costs in this segment increased by €4.1 million to €27.0 million, denting profit for the period, but at the same time, they are evidence of our cautious risk pol-icy. Net fee and commission income increased by €0.6 million to €17.3 million. After the deduction of expenses charged to this segment in the amount of €29.3 million, its profit for the period came to a satisfactory €28.1 million. Its return on equity and cost:income ratio weakened slightly, namely to 14.5 per cent from 17.7 per cent in the same period of 2011 and to 34.7 per cent from 32.9 per cent, respectively. Since the economic horizon remains unlikely to brighten in the coming weeks and months, we will be keeping a particularly close eye on the development of lending margins and risks.
Retail Banking
Approximately 126,000 customers of BKS Bank AG, BKS Bank d.d. and the leasing companies within the Group (BKS-Leasing GmbH, BKS-leasing d.o.o., BKS-leasing Croatia d.o.o., BKS-Leasing a.s.) were being serviced in the retail banking segment. In addition to personal banking customers and jobholders, this segment also encom-passes small business owners, doctors and self-employed customers. Because it is highly dependent on branch operations, this segment is resource and cost intensive. Nonetheless, it is also indispensable to us as an impor-tant and sustainable source of funds. At the end of September, about 86 per cent of savings deposits and nearly a third of sight and time deposits held with BKS Bank — that is, roughly 60 per cent of its payables to custom-ers — had been generated by retail banking operations. In addition, retail customers accounted for over one fifth of the loan portfolio.
In a market situation that was still difficult, the segment’s profit for the period before tax fell by €3.2 million in the first nine months of 2011 to negative €0.3 million in the same period of 2012. This was mainly due to a drop in net interest income, which fell by €2.0 million compared with the nine months ended 30 September 2011 to total €23.2 million. In particular, deposit margins continued to weaken. Because retail customer depos-its will play an essential role in meeting the new liquidity requirements associated with the Basel III regime, the competition for deposits from retail customers got even tougher in the third quarter of 2012. In addition, many customers in this segment are covered by consumer protection regulations. This means that it is virtually impossible to adjust margins in the loan portfolio. On the other hand, it proved possible to increase net fee and commission income by €1.0 million to €14.9 million in the period under review. Among other things, our com-prehensive and consistent billing of fees and charges also contributed to this increase.
Costs charged to this segment were €2.7 million up on the same period of 2011 to €38.7 million. However, we are pleased to report that credit risk costs in this segment were well below the already very low figure of €0.9 million recorded in the first three quarters of 2011, coming to €0.4 million. Consequently, its risk:earnings ratio fell to just 1.9 per cent as of 30 September 2012.
Both its return on investment of negative 0.9 per cent based on risk-weighted assets of €560.1 million and its unsatisfactory cost:income ratio of 99.6 per cent mirrored the challenging competitive situation in the retail customers segment. We hope to bring about a permanent improvement with the help of the positive effects of implementing a number of promising but as yet not fully realized projects.
GROUP MANAGEMENt REPORt FOR tHE NINE MONtHS ENDED 30 SEPtEMBER 2012
A detailed segmental breakdown is presented in the Notes on page 30.
PROFIt FOR tHE PERIOD BEFORE tAX, BY SEGMENt
€m Q1–Q32010
Q1–Q32011
Q1–Q32012
ROE 14.3% 17.7% 14.5%
CIR 29.0% 32.9% 34.7%
RER 50.2% 34.4% 40.8%
Corporate and Business Banking
0
10
20
30 28.133.8
27.0
-10
40
€m Q1–Q32010
Q1–Q32011
Q1–Q32012
ROE 9.6% 8.5% (0.9%)
CIR 88.9% 90.4% 99.6%
RER 5.0% 3.5% 1.9%
Retail Banking
(0.3)0
10
20
30
3.03.2
-10
40
€m Q1–Q32010
Q1–Q32011
Q1–Q32012
ROE 3.8% (4.1%) 4.5%
CIR 37.1% 20.5% 24.8%
RER — 21.2% 0%
Financial Markets
11.8
0
10
20
30
(10.0)
8.2
-10
40

13
Financial Markets
The financial markets segment encompasses profits from equity investments, from securities held in our own portfolios and from receivables from and payables to other banks as well as earnings from our interest rate term structure management activities.
Having made a loss of €10.0 million in the first three quarters of 2011, the financial markets segment made a profit for the period before tax of €11.8 million in the nine months ended 30 September 2012. Profit in 2011 had mainly been dented by the requisite write-downs of Greek government bonds, which reduced Profit/(loss) from financial assets to negative €20.6 million, whereas in the nine months ended 30 September 2012, that loss came to a relatively small €0.6 million. The impairment allowance of €2.0 million on the goodwill of our Croatian banking subsidiary BKS Bank d.d. was charged to the financial markets segment in the line item Other operating income net of other operating expenses.
Looking at this segment’s ratios, the return on equity rose from negative 4.1 per cent to positive 4.5 per cent. Its very low cost:income ratio worsened marginally to 24.8 per cent. On the other hand, after difficulties in 2011, the risk:earnings ratio fell from 21.2 per cent, which was exceptionally high for this segment, to close to zero.
Risk Report
As an active participant in transactions in the financial and capital markets, BKS Bank is of course also directly exposed to the risks of those markets. Our bank’s risk management strategy is shaped by our conservative handling of all banking risks. They are analyzed, measured, controlled and managed by means of a comprehen-sive system of risk principles and risk measurement and monitoring procedures and appropriate organizational structures. In changing market conditions, our risk management activities are proactive so as to limit possible losses on business activities and to optimize our risk/earnings profile. When we accept risks, we continuously evaluate them to assess whether they are viable in the light of our risk bearing capacity and worthwhile from an opportunities and risk perspective. As a consequence of the risk strategy we apply, the areas of risk of most importance to BKS Bank are credit risk (which includes equity investment risk), market risk, liquidity risk and operational risk. The large loan risks incurred by BKS Bank and the 3 Banken Group are secured by Alpenländische Garantie-Gesellschaft mbH (ALGAR), which is accounted for in the Consolidated Financial Statements of the BKS Bank Group.
Credit risk
Credit risk (also called default risk) is one of the most important risks in banking. It is the risk of partial or total non-payment of contractually agreed payments arising from interest-bearing transactions. It may result from a counterparty’s poor credit standing or may arise indirectly from country risk as a con-sequence of a counterparty’s domicile. Throughout the BKS Bank Group, credit risk is monitored and analyzed at the single customer level, at the level of groups of related customers and at the portfolio level by sector or industry, exposure size, rating class and product. Our bank employs a 13-class rating sys-
tem based on the use of statistical methods. On the reporting date of 30 September, roughly 81 per cent of all corporate and business banking customers and roughly 89 per cent of all retail banking customers were in the classes AA – 3b, which means that they had a good credit standing along with a very low default risk.
The charge for impairment losses in the first nine months of 2012 came to €27.4 million, as against €28.8 million in the same period of 2011. This translates into a reduction of 4.8 per cent. Impairment allowances were reduced by €5.3 million or 14.8 per cent to €30.8 million. This figure includes impairment allowances recognized on an item-by-item basis, commission payments to ALGAR and collective assessments of impairments carried out in accordance with IAS 39 and of impairment of the portfolio for country risks. The requisite charge for the risks
GROUP MANAGEMENt REPORt FOR tHE NINE MONtHS ENDED 30 SEPtEMBER 2012
CHARGE FOR IMPAIRMENt LOSSES
€m 30/9/2011 30/9/2012
Direct write-offs 0.6 0.5
Impairment allowances 36.1 30.8
Impairment reversals (7.7) (3.5)
Subsequent recoveries (0.2) (0.4)
Charge for impairment losses 28.8 27.4
14
of our foreign subsidiaries increased by just under €0.6 million to a total of €1.9 million, with increases taking place at BKS-leasing Croatia d.o.o. and BKS Bank d.d. However, in this difficult economic environment, it is still an acceptable figure.
Market risk
In this risk category, we differentiate between interest rate risk, currency risk and equity price risk. Within the bank, we manage these risks using value at risk (VaR) limits, duration limits and volume limits. The VaR approach is used to measure the maximum possible loss that could be incurred with a previously defined confidence inter-val. Our Asset Liability Management (ALM) Committee reviews our market risk once a month on the basis of present value, duration and value at risk calculations. Our interest rate risks continued to fall during the year. By the end of the third quarter of 2012, the ratio of our interest rate risks to our eligible own funds assuming a rate shift of 200 basis points as reportable to OeNB (interest rate statistics) was just 1.88 per cent, compared with 3.92 per cent at the end of 2011. As a result, our bank stayed well below the critical 20 per cent mark in the period under review. Our duration risk was at the same level as in the second quarter, at €11.0 million. Our equity value at risk fell from €5.4 million to €1.0 million during the first three quarters. Our currency risk con-tinued to fall, dropping by €4.5 million to €13.6 million. Our foreign currency value at risk was again very low, at €1.0 million, compared with €2.3 million at the end of 2011.
Liquidity risk
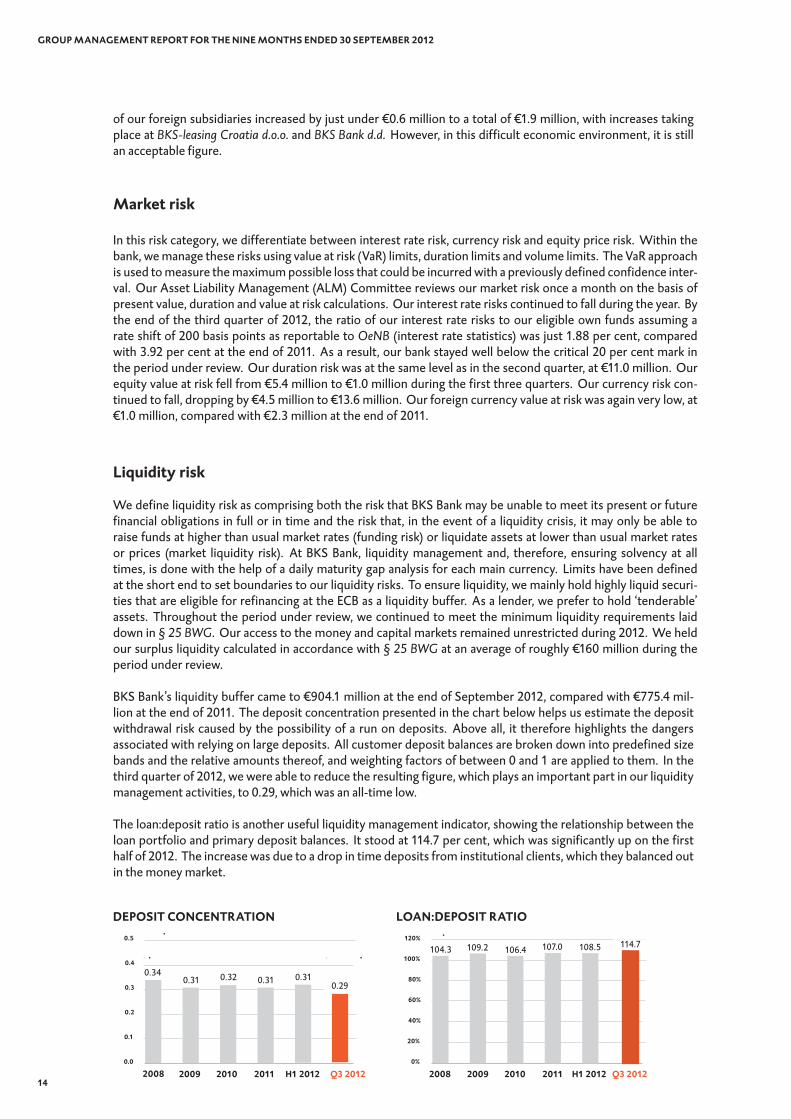
We define liquidity risk as comprising both the risk that BKS Bank may be unable to meet its present or future financial obligations in full or in time and the risk that, in the event of a liquidity crisis, it may only be able to raise funds at higher than usual market rates (funding risk) or liquidate assets at lower than usual market rates or prices (market liquidity risk). At BKS Bank, liquidity management and, therefore, ensuring solvency at all times, is done with the help of a daily maturity gap analysis for each main currency. Limits have been defined at the short end to set boundaries to our liquidity risks. To ensure liquidity, we mainly hold highly liquid securi-ties that are eligible for refinancing at the ECB as a liquidity buffer. As a lender, we prefer to hold ‘tenderable’ assets. Throughout the period under review, we continued to meet the minimum liquidity requirements laid down in § 25 BWG. Our access to the money and capital markets remained unrestricted during 2012. We held our surplus liquidity calculated in accordance with § 25 BWG at an average of roughly €160 million during the period under review.
BKS Bank’s liquidity buffer came to €904.1 million at the end of September 2012, compared with €775.4 mil-lion at the end of 2011. The deposit concentration presented in the chart below helps us estimate the deposit withdrawal risk caused by the possibility of a run on deposits. Above all, it therefore highlights the dangers associated with relying on large deposits. All customer deposit balances are broken down into predefined size bands and the relative amounts thereof, and weighting factors of between 0 and 1 are applied to them. In the third quarter of 2012, we were able to reduce the resulting figure, which plays an important part in our liquidity management activities, to 0.29, which was an all-time low.
The loan:deposit ratio is another useful liquidity management indicator, showing the relationship between the loan portfolio and primary deposit balances. It stood at 114.7 per cent, which was significantly up on the first half of 2012. The increase was due to a drop in time deposits from institutional clients, which they balanced out in the money market.
GROUP MANAGEMENt REPORt FOR tHE NINE MONtHS ENDED 30 SEPtEMBER 2012
LOAN:DEPOSIt RAtIO120%
20%
40%
60%
80%
100%
0%
104.3 106.4109.2 107.0 108.5
2008 2009 2010 H1 20122011
DEPOSIt CONCENtRAtION
0.1
0.2
0.3
0.4
0.5
0.0
0.340.31 0.32 0.31 0.31
2008 2009 2010 H1 20122011
0.29
Q3 2012 Q3 2012
114.7
15
Herta StockbauerMember of the Management Board
Heimo PenkerCEO
Dieter KrassnitzerMember of the Management Board
Operational risk
We define operational risk as the risk of losses resulting from inadequate or failed internal processes, people or systems or from external events. Such risks can unexpectedly increase costs or reduce profits. A total of 125 loss events were reported at BKS Bank in the nine months up to the end of September 2012. Allowing for reim-bursed losses, the resulting risk loss was comparatively small at €327.2 thousand. We point out that this figure does not include operational risk losses arising from credit operations.
Outlook for the Year as a WholeThe present state of the economy and, above all, the short-term economic outlook are still subject to big uncer-tainties. As BKS Bank’s Management Board, we do not anticipate for the time being any lasting improvement in the challenging conditions in the economy and the capital markets. Coping with the extra work caused by the new requirements imposed by the Capital Requirements Directive (CRD) 4 and the Capital Requirements Regulation (CRR) 1 will be a challenge. The final versions thereof have yet to be adopted at the European level, which means that the corresponding amendment to Austria’s Bankwesengesetz (BWG: banking act) has also been greatly delayed. Its entry into force at the beginning of 2013 is close to the limit of what would still be reasonable.
The Federal Reserve in the United States has extended quantitative easing with a bond purchasing pro-gramme. Now the presidential election is over, there are a number of reasons to believe that the mix of spend-ing cuts and tax hikes predestined to happen at the end of the year because of the country’s balancing act on the fiscal cliff can be averted in time.
The global economy’s biggest worry for now remains the eurozone, which is in economic difficulties again. We believe that the ECB’s willingness to buy government bonds of the European peripheral countries that are having financial problems will gradually calm the financial markets and that doubts about the monetary union’s survival will ebb.
Nonetheless, it is too early to sound the all-clear when it comes to the difficult environment in which banks are operating. Profits are likely to suffer from a number of negative factors during the rest of the year. Above all, these include low interest rates and the persistently aggressive, margin eroding competition for primary depos-its — the bedrock of funding without resorting to the interbank market — as well as the sluggishness of the capi-tal markets and customers’ evident caution regarding the securities segment and new borrowing. Moreover, the state of the economy could lead to a renewed increase in classical lending risks.
At this point, we can assure you that BKS Bank is excellently prepared to cope with the challenging market conditions and is in a position to react to unexpected one-off effects both promptly and in an appropriate man-ner. We will continue to refine our successful business model in the coming months, strengthen our earning power from core operations, consistently manage costs and optimize our capital base. Our liquidity position is comfortable. One of the main focuses of our attention will be on our retail customer business, which has been operationally and strategically reorientated. We intend to continue to reinforce BKS Bank’s reputation as a capable bank that serves only its customers’ needs, providing individual advice and offering them an attractive range of products and services. Consequently, we presently expect our profit for the year 2012 to enable us to go on increasing BKS Bank’s enterprise value by augmenting its reserves and, as in prior years, to distribute an appropriate dividend.
We remain,
Yours faithfully,
GROUP MANAGEMENt REPORt FOR tHE NINE MONtHS ENDED 30 SEPtEMBER 2012
16
BKS Bank Group Oberbank Group BtV Group
Income account, €m 1/1 – 30/9/2011 1/1 – 30/9/2012 1/1 – 30/9/2011 1/1 – 30/9/2012 1/1 – 30/9/2011 1/1 – 30/9/2012
Net interest income 110.1 106.8 256.7 230.1 122.2 124.5
Impairment charge on loans and advances (28.8) (27.4) (75.1) (43.9) (26.9) (28.0)Net fee and commission income 31.6 32.9 80.1 81.6 32.6 31.8General administrative expenses (69.2) (75.6) (170.0) (177.5) (69.4) (71.0)Profit for the period before tax 26.4 35.1 103.6 107.1 51.5 55.5Profit for the period after tax 25.9 30.4 91.6 89.0 41.9 44.6
Balance sheet data, €m 31/12/2011 30/9/2012 31/12/2011 30/9/2012 31/12/2011 30/9/2012
Assets 6,456.0 6,680.8 17,483.7 17,642.7 9,214.7 9,492.8Receivables from customers after impairmentcharge 4,647.8 4,799.5 10,563.9 10,825.9 6,030.1 6,249.7
Primary deposit balances 4,251.4 4,104.5 11,315.2 11,348.0 6,627.8 6,432.7– Of which savings deposit balances 1,786.3 1,804.8 3,407.6 3,371.7 1,260.0 1,275.6– Of which liabilities evidenced by paper 715.7 735.3 2,250.9 2,196.4 1,255.0 1,126.5Equity 644.9 674.5 1,222.0 1,325.5 767.4 823.3
Customer assets under management 10,025.5 10,283.4 19,764.5 21,014.3 10,970.6 11,048.3– Of which in customers’ securities accounts 5,774,1 6,178.9 8,449.3 9,666.3 4,342.8 4,615.6
Own funds within the meaning of BWG, €m 31/12/2011 30/9/2012 31/12/2011 30/9/2012 31/12/2011 30/9/2012
Risk-weighted assets 4,415.2 4,451.2 10,146.2 10,530.2 6,077.9 5,806.3Own funds 681.9 681.8 1,673.1 1,669.8 934.7 932.0– Of which Tier 1 capital 599.5 598.3 1,167.6 1,169.0 776.1 776.3Surplus own funds before operational risk 328.7 325.7 860.2 826.8 448.0 467.3Surplus own funds after operational risk 301.9 298.6 798.0 764.6 423.8 443.1Tier 1 ratio, % 12.46 12.34 11.51 11.10 12.77 13.37Own funds ratio, % 15.44 15.32 16.49 15.86 15.38 16.05
Performance, % 2011 1/1 – 30/9/2012 2011 1/1 – 30/9/2012 2011 1/1 – 30/9/2012
Return on equity before tax 6.1 7.1 10.6 11.2 9.0 9.3Return on equity after tax 5.7 6.6 9.3 9.3 7.4 7.5Cost:income ratio 46.7 54.5 50.6 54.0 45.7 44.6Risk:earnings ratio 22.1 25.7 28.6 19.1 22.5 22.5
Resources 2011 1/1 – 30/9/2012 2011 1/1 – 30/9/2012 2011 1/1 – 30/9/2012
Average number of staff 901 930 2,054 2,018 790 781Branches and other business units 55 55 150 149 40 38
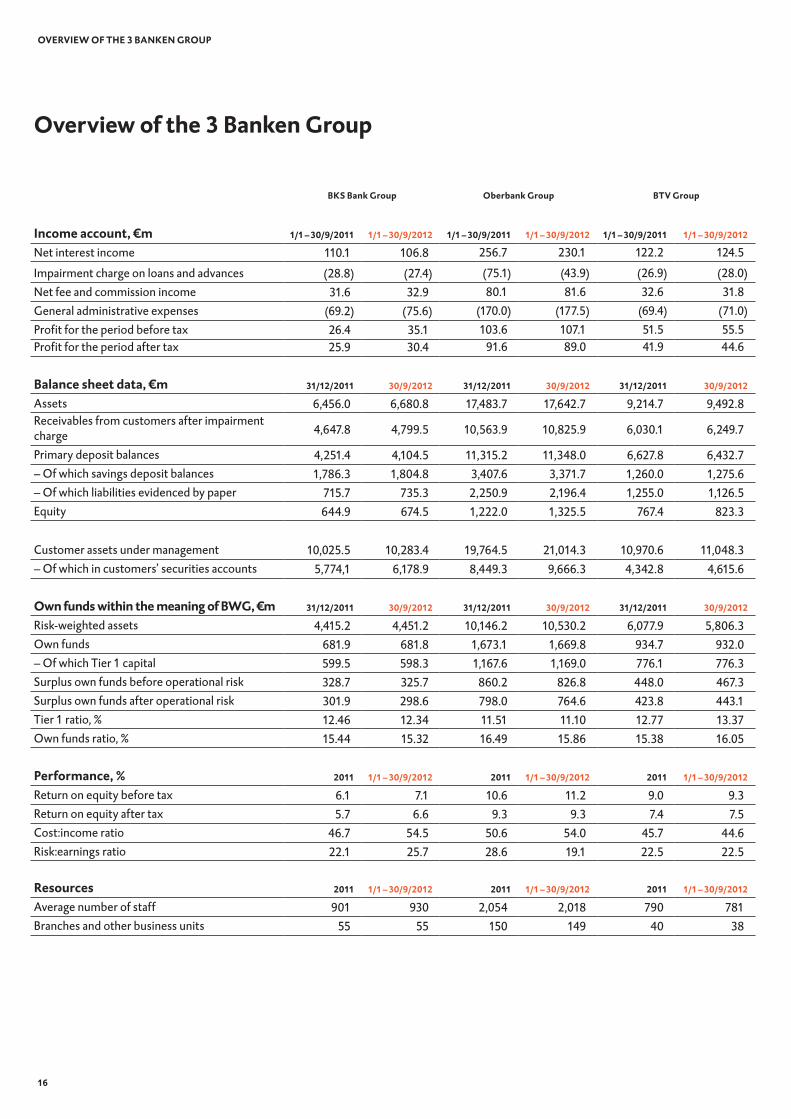
Overview of the 3 Banken Group
OVERVIEW OF tHE 3 BANKEN GROUP

Consolidated Financial Statements as at and for the Nine Months Ended 30 September 2012
PageDetails of the Income Statement __________________________________________________________________ 25(1) Net interest income _____________________________________________________________________________ 25(2) Impairment charge on loans and advances ___________________________________________________________ 25(3) Net fee and commission income ___________________________________________________________________ 26(4) Net trading income _____________________________________________________________________________ 26(5) General administrative expenses ___________________________________________________________________ 26(6) Other operating income net of other operating expenses _______________________________________________ 26(7) Profit/(loss) from financial assets designated as at fair value through profit or loss (FV) _________________________ 26(8) Profit/(loss) from available-for-sale financial assets (AFS) ________________________________________________ 26(9) Profit/(loss) from held-to-maturity financial assets (HTM) _______________________________________________ 26(10) Income tax expense _____________________________________________________________________________ 26
Details of the Balance Sheet ______________________________________________________________________ 27(11) Cash and balances with the central bank _____________________________________________________________ 27(12) Receivables from other banks _____________________________________________________________________ 27(13) Receivables from customers ______________________________________________________________________ 27(14) Impairment allowance balance ____________________________________________________________________ 27(15) Trading assets _________________________________________________________________________________ 27(16) Financial assets designated as at fair value through profit or loss __________________________________________ 27(17) Available-for-sale financial assets __________________________________________________________________ 27(18) Held-to-maturity financial assets ___________________________________________________________________ 28(19) Investments in entities accounted for using the equity method ___________________________________________ 28(20) Intangible assets _______________________________________________________________________________ 28(21) Property and equipment _________________________________________________________________________ 28(22) Investment property ____________________________________________________________________________ 28(23) Deferred tax assets _____________________________________________________________________________ 28(24) Other assets __________________________________________________________________________________ 28(25) Payables to other banks __________________________________________________________________________ 28(26) Payables to customers ___________________________________________________________________________ 29(27) Liabilities evidenced by paper _____________________________________________________________________ 29(28) Trading liabilities _______________________________________________________________________________ 29(29) Provisions ____________________________________________________________________________________ 29(30) Deferred tax liabilities ___________________________________________________________________________ 29(31) Other liabilities ________________________________________________________________________________ 29(32) Subordinated debt capital ________________________________________________________________________ 29
Additional disclosures required by IFRSs ___________________________________________________________ 29(33) Segmental reporting _____________________________________________________________________________29(34) Contingent liabilities and commitments _____________________________________________________________ 30(35) Related party disclosures ________________________________________________________________________ 30(36) Events after the interim reporting date ______________________________________________________________ 31(37) Balance of derivatives outstanding _________________________________________________________________ 31(38) Material transactions with related parties ____________________________________________________________ 31
IFRS-COMPLIANt CONSOLIDAtED FINANCIAL StAtEMENtSAS At AND FOR tHE NINE MONtHS ENDED 30 SEPtEMBER 2012
17
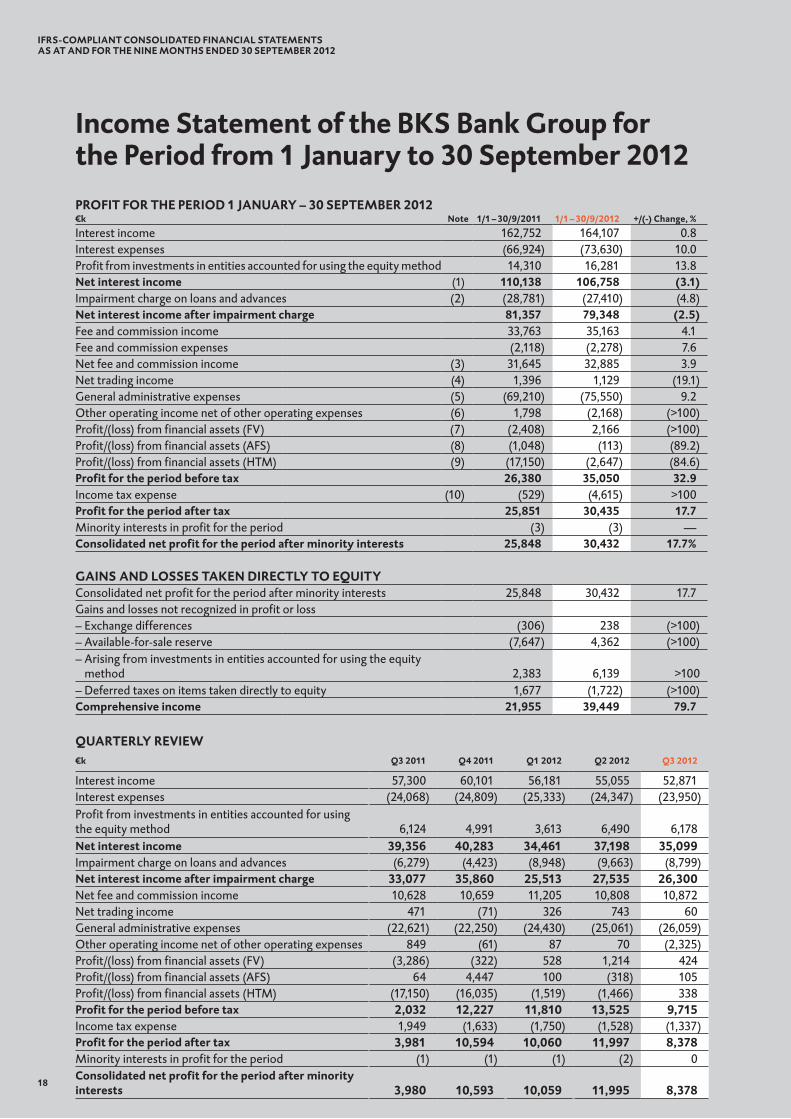
Income Statement of the BKS Bank Group for the Period from 1 January to 30 September 2012PROFIt FOR tHE PERIOD 1 JANUARY – 30 SEPtEMBER 2012€k Note 1/1 – 30/9/2011 1/1 – 30/9/2012 +/(-) Change, %
Interest income 162,752 164,107 0.8Interest expenses (66,924) (73,630) 10.0Profit from investments in entities accounted for using the equity method 14,310 16,281 13.8Net interest income (1) 110,138 106,758 (3.1)Impairment charge on loans and advances (2) (28,781) (27,410) (4.8)Net interest income after impairment charge 81,357 79,348 (2.5)Fee and commission income 33,763 35,163 4.1Fee and commission expenses (2,118) (2,278) 7.6Net fee and commission income (3) 31,645 32,885 3.9Net trading income (4) 1,396 1,129 (19.1)General administrative expenses (5) (69,210) (75,550) 9.2Other operating income net of other operating expenses (6) 1,798 (2,168) (>100)Profit/(loss) from financial assets (FV) (7) (2,408) 2,166 (>100)Profit/(loss) from financial assets (AFS) (8) (1,048) (113) (89.2)Profit/(loss) from financial assets (HTM) (9) (17,150) (2,647) (84.6)Profit for the period before tax 26,380 35,050 32.9Income tax expense (10) (529) (4,615) >100Profit for the period after tax 25,851 30,435 17.7Minority interests in profit for the period (3) (3) —Consolidated net profit for the period after minority interests 25,848 30,432 17.7%
GAINS AND LOSSES tAKEN DIRECtLY tO EQUItYConsolidated net profit for the period after minority interests 25,848 30,432 17.7Gains and losses not recognized in profit or loss– Exchange differences (306) 238 (>100)– Available-for-sale reserve (7,647) 4,362 (>100)– Arising from investments in entities accounted for using the equity
method 2,383 6,139 >100– Deferred taxes on items taken directly to equity 1,677 (1,722) (>100)Comprehensive income 21,955 39,449 79.7
QUARtERLY REVIEW€k Q3 2011 Q4 2011 Q1 2012 Q2 2012 Q3 2012
Interest income 57,300 60,101 56,181 55,055 52,871Interest expenses (24,068) (24,809) (25,333) (24,347) (23,950)Profit from investments in entities accounted for usingthe equity method 6,124 4,991 3,613 6,490 6,178Net interest income 39,356 40,283 34,461 37,198 35,099Impairment charge on loans and advances (6,279) (4,423) (8,948) (9,663) (8,799)Net interest income after impairment charge 33,077 35,860 25,513 27,535 26,300Net fee and commission income 10,628 10,659 11,205 10,808 10,872Net trading income 471 (71) 326 743 60General administrative expenses (22,621) (22,250) (24,430) (25,061) (26,059)Other operating income net of other operating expenses 849 (61) 87 70 (2,325)Profit/(loss) from financial assets (FV) (3,286) (322) 528 1,214 424Profit/(loss) from financial assets (AFS) 64 4,447 100 (318) 105Profit/(loss) from financial assets (HTM) (17,150) (16,035) (1,519) (1,466) 338Profit for the period before tax 2,032 12,227 11,810 13,525 9,715Income tax expense 1,949 (1,633) (1,750) (1,528) (1,337)Profit for the period after tax 3,981 10,594 10,060 11,997 8,378Minority interests in profit for the period (1) (1) (1) (2) 0Consolidated net profit for the period after minorityinterests 3,980 10,593 10,059 11,995 8,378
IFRS-COMPLIANt CONSOLIDAtED FINANCIAL StAtEMENtSAS At AND FOR tHE NINE MONtHS ENDED 30 SEPtEMBER 2012
18

ASSEtS€k Note 31/12/2011 30/9/2012 +/(-) Change, %
Cash and balances with the central bank (11) 85,819 95,316 11.1Receivables from other banks (12) 116,503 135,547 16.3Receivables from customers (13) 4,801,095 4,963,981 3.4– Impairment allowance balance (14) (153,246) (164,442) 7.3Trading assets (15) 344 746 >100Financial assets designated as at fair value through profit or loss (16) 119,614 184,381 54.1Available-for-sale financial assets (17) 295,115 290,151 (1.7)Held-to-maturity financial assets (18) 738,732 702,815 (4.9)Investments in entities accounted for using the equity method (19) 309,929 331,071 6.8Intangible assets (20) 12,022 9,659 (19.7)Property and equipment (21) 62,610 62,494 (0.2)Investment property (22) 16,978 16,605 (2.2)Deferred tax assets (23) 17,104 18,248 6.7Other assets (24) 33,374 34,184 2.4total assets 6,455,993 6,680,756 3.5
EQUItY AND LIABILItIES€k Note 31/12/2011 30/9/2012 +/(-) Change, %
Payables to other banks (25) 1,386,250 1,732,649 25.0Payables to customers (26) 3,535,614 3,369,216 (4.7)Liabilities evidenced by paper (27) 455,016 498,745 9.6Trading liabilities (28) 391 321 (17.9)Provisions (29) 77,444 79,440 2.6Deferred tax liabilities (30) 9,274 11,841 27.7Other liabilities (31) 86,349 77,487 (10.3)Subordinated debt capital (32) 260,730 236,514 (9.3)Equity 644,925 674,543 4.6Of which total minority interests and equity 644,922 674,537 4.6Of which minority interests in equity 3 6 100.0total equity and liabilities 6,455,993 6,680,756 3.5
EARNINGS AND DIVIDEND PER SHARE1/1 – 30/9/2011 1/1 – 30/9/2012
Average number of shares in issue 32,224,083 32,092,751Dividend per share, € 0.25 0.25Earnings per share, € (diluted and undiluted) 1.07 1.26
Earnings per share compares consolidated net profit for the period with the average number of no-par shares (Stückaktie) in issue. In the period under review, earnings per share and diluted earnings per share were the same because no financial instruments with a dilution effect on the shares were outstanding.
Balance Sheet of the BKS Bank Groupas at 30 September 2012
IFRS-COMPLIANt CONSOLIDAtED FINANCIAL StAtEMENtSAS At AND FOR tHE NINE MONtHS ENDED 30 SEPtEMBER 2012
19
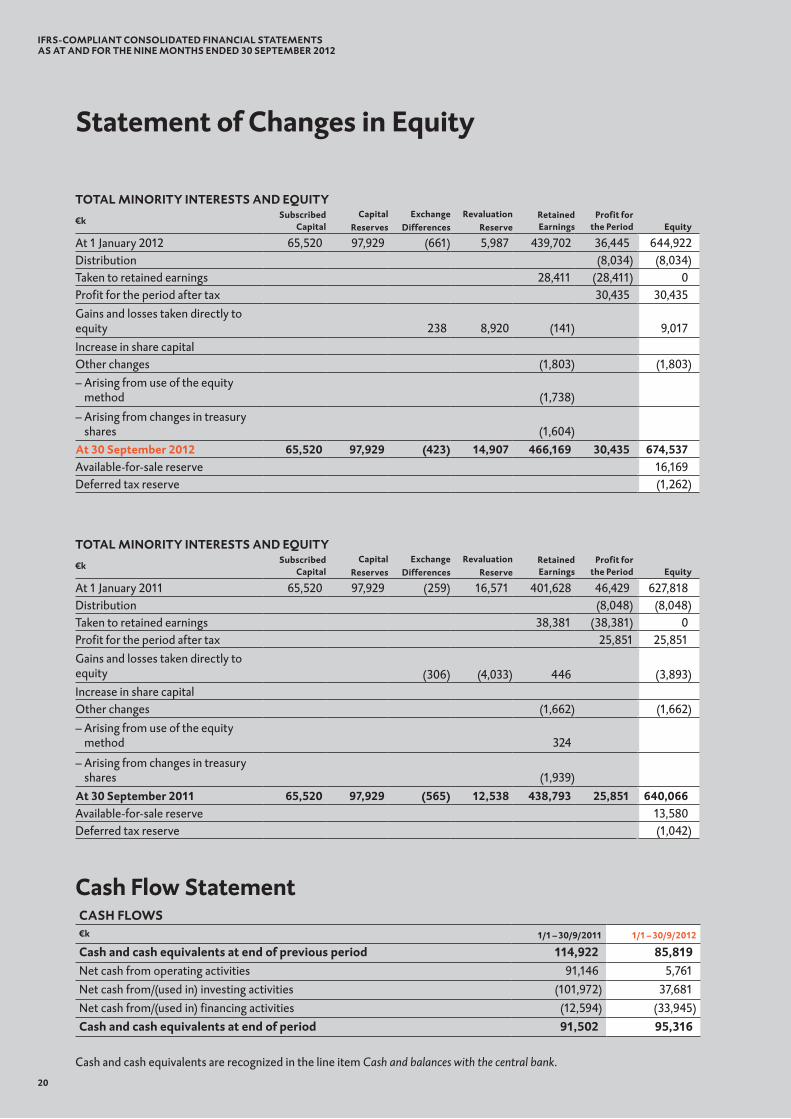
CASH FLOWS€k 1/1 – 30/9/2011 1/1 – 30/9/2012
Cash and cash equivalents at end of previous period 114,922 85,819Net cash from operating activities 91,146 5,761Net cash from/(used in) investing activities (101,972) 37,681Net cash from/(used in) financing activities (12,594) (33,945)Cash and cash equivalents at end of period 91,502 95,316
Cash and cash equivalents are recognized in the line item Cash and balances with the central bank.
Cash Flow Statement
Statement of Changes in Equity
20
tOtAL MINORItY INtEREStS AND EQUItY€k
SubscribedCapital
CapitalReserves
ExchangeDifferences
RevaluationReserve
RetainedEarnings
Profit forthe Period Equity
At 1 January 2012 65,520 97,929 (661) 5,987 439,702 36,445 644,922Distribution (8,034) (8,034)Taken to retained earnings 28,411 (28,411) 0Profit for the period after tax 30,435 30,435Gains and losses taken directly to equity 238 8,920 (141) 9,017Increase in share capitalOther changes (1,803) (1,803)– Arising from use of the equity
method (1,738)
– Arising from changes in treasury shares (1,604)
At 30 September 2012 65,520 97,929 (423) 14,907 466,169 30,435 674,537Available-for-sale reserve 16,169Deferred tax reserve (1,262)
tOtAL MINORItY INtEREStS AND EQUItY€k
SubscribedCapital
CapitalReserves
ExchangeDifferences
RevaluationReserve
RetainedEarnings
Profit forthe Period Equity
At 1 January 2011 65,520 97,929 (259) 16,571 401,628 46,429 627,818Distribution (8,048) (8,048)Taken to retained earnings 38,381 (38,381) 0Profit for the period after tax 25,851 25,851Gains and losses taken directly to equity (306) (4,033) 446 (3,893)Increase in share capitalOther changes (1,662) (1,662)– Arising from use of the equity
method 324
– Arising from changes in treasury shares (1,939)
At 30 September 2011 65,520 97,929 (565) 12,538 438,793 25,851 640,066Available-for-sale reserve 13,580Deferred tax reserve (1,042)
IFRS-COMPLIANt CONSOLIDAtED FINANCIAL StAtEMENtSAS At AND FOR tHE NINE MONtHS ENDED 30 SEPtEMBER 2012
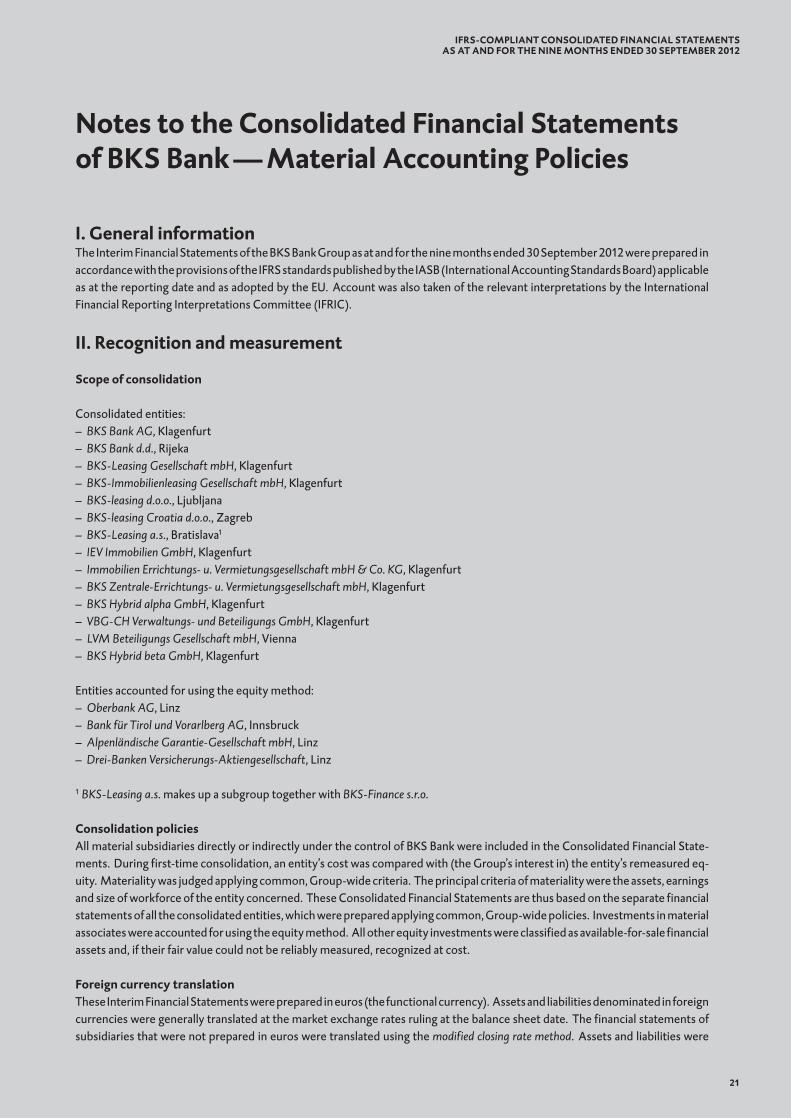
I. General informationThe Interim Financial Statements of the BKS Bank Group as at and for the nine months ended 30 September 2012 were prepared in accordance with the provisions of the IFRS standards published by the IASB (International Accounting Standards Board) applicable as at the reporting date and as adopted by the EU. Account was also taken of the relevant interpretations by the International Financial Reporting Interpretations Committee (IFRIC).
II. Recognition and measurement
Scope of consolidation
Consolidated entities:– BKS Bank AG, Klagenfurt– BKS Bank d.d., Rijeka– BKS-Leasing Gesellschaft mbH, Klagenfurt– BKS-Immobilienleasing Gesellschaft mbH, Klagenfurt– BKS-leasing d.o.o., Ljubljana– BKS-leasing Croatia d.o.o., Zagreb– BKS-Leasing a.s., Bratislava1
– IEV Immobilien GmbH, Klagenfurt – Immobilien Errichtungs- u. Vermietungsgesellschaft mbH & Co. KG, Klagenfurt – BKS Zentrale-Errichtungs- u. Vermietungsgesellschaft mbH, Klagenfurt– BKS Hybrid alpha GmbH, Klagenfurt– VBG-CH Verwaltungs- und Beteiligungs GmbH, Klagenfurt– LVM Beteiligungs Gesellschaft mbH, Vienna– BKS Hybrid beta GmbH, Klagenfurt
Entities accounted for using the equity method:– Oberbank AG, Linz– Bank für Tirol und Vorarlberg AG, Innsbruck– Alpenländische Garantie-Gesellschaft mbH, Linz– Drei-Banken Versicherungs-Aktiengesellschaft, Linz
1 BKS-Leasing a.s. makes up a subgroup together with BKS-Finance s.r.o.
Consolidation policiesAll material subsidiaries directly or indirectly under the control of BKS Bank were included in the Consolidated Financial State-ments. During first-time consolidation, an entity’s cost was compared with (the Group’s interest in) the entity’s remeasured eq-uity. Materiality was judged applying common, Group-wide criteria. The principal criteria of materiality were the assets, earnings and size of workforce of the entity concerned. These Consolidated Financial Statements are thus based on the separate financial statements of all the consolidated entities, which were prepared applying common, Group-wide policies. Investments in material associates were accounted for using the equity method. All other equity investments were classified as available-for-sale financial assets and, if their fair value could not be reliably measured, recognized at cost.
Foreign currency translationThese Interim Financial Statements were prepared in euros (the functional currency). Assets and liabilities denominated in foreign currencies were generally translated at the market exchange rates ruling at the balance sheet date. The financial statements of subsidiaries that were not prepared in euros were translated using the modified closing rate method. Assets and liabilities were
Notes to the Consolidated Financial Statementsof BKS Bank — Material Accounting Policies
21
IFRS-COMPLIANt CONSOLIDAtED FINANCIAL StAtEMENtSAS At AND FOR tHE NINE MONtHS ENDED 30 SEPtEMBER 2012

translated at closing exchange rates. Expenses and income were translated applying average rates of exchange in the respective financial year. Exchange differences were recognized as a component of equity.
Impairment allowance balanceAccount was taken of the risks identifiable at the time of the Balance Sheet’s preparation by recognizing impairment charges on an item-by-item basis and creating provisions. The total impairment allowance balance is disclosed as a deduction on the assets side of the Balance Sheet. We made allowances for individual risk positions on an item-by-item basis applying class-specific cri-teria. Provisions for contingent liabilities were recognized on the equity and liabilities side of the Balance Sheet in the line item Provisions. A collective assessment of impairment of the portfolio was likewise carried out in accordance with IAS 39 para. 64, a collective assessment of impairment of the portfolio for country risks being recognized as well for the first time in 2011. To calculate provisions for country risks, the exposures outstanding at the reporting date were broken down into risk classes and appropriate risk weights were applied.
trading assets and liabilitiesWithin the line item Trading assets, primary financial instruments were measured at fair value. Derivative financial instruments were measured at fair value. Financial instruments with negative fair values were recognized on the Balance Sheet in the line item Trading liabilities. Revaluation gains and losses on this line item were recognized in the Income Statement in the line item Net trading income. Interest expenses incurred in the financing of trading assets were reported in the line item Net interest income.
DerivativesDerivative financial instruments were measured at fair value. Changes in value were generally recognized through profit or loss in the Income Statement.
ReceivablesReceivables were recognized on the Balance Sheet at amortized cost before impairment charges.
Property, equipment and intangible assets (non-current) Property, equipment and intangible assets (non-current) were recognized at cost of acquisition or conversion less ordinary depreciation or amortization. Depreciation and amortization rates lay within the following bands:– immovable assets: 1.5 to 3.0 per cent;– office furniture and equipment: 10 to 25 per cent;– software: 25 per cent.
Ordinary depreciation and amortization are linear based on an asset’s estimated useful life. Impairments are allowed for by recognizing extraordinary depreciation or amortization. If an impairment no longer exists, a write-back is made up to the asset’s amortized cost. No extraordinary depreciation or amortization was recognized during the period under review.
Calculation of goodwillA goodwill impairment test is performed periodically. When goodwill on the Balance Sheet is tested for impairment, its carry-ing amount is compared with the present value of the company’s interest in all future cash flows (value in use). Present value is measured on the basis of a discounted cash flow model. A two-phase mathematical model is used.
Phase 1: In phase 1, cash flows in the ensuing five years are calculated and discounted on the basis of the company’s budgets.
Phase 2: In phase 2, a perpetual annuity is calculated on the basis of cash flow in the most recent plan year.The parameters used for discounting purposes are the yield on 10-year government bonds in the eurozone, a premium for equity risk and an extra premium for country risk.
LeasingThe leased assets within the Group required recognition as assets leased under finance leases (the risks and rewards being with the lessee for the purposes of IAS 17). Leased assets were recognized as receivables in the amount of the present values of the agreed payments taking into account any residual values.
22
IFRS-COMPLIANt CONSOLIDAtED FINANCIAL StAtEMENtSAS At AND FOR tHE NINE MONtHS ENDED 30 SEPtEMBER 2012

Financial assets and liabilities designated as at fair value through profit or lossThe measurement of certain positions took place under the collective designation as at fair value through profit or loss using the fair value option (FV). Their inclusion in this category was decided by the Asset Liability Management Committee. These positions (asset or liability and associated derivative) were thus measured at fair value through profit or loss and any revaluation gains or losses were recognized in the Income Statement in the line item Profit/(loss) from financial assets designated as at fair value through profit or loss.
Available-for-sale financial assetsAvailable-for-sale (AFS) securities are a separate category of financial instrument. They were generally measured apply-ing exchange prices. If these were not available, values of interest rate products were measured using present value tech-niques. Revaluation gains and losses were recognized in the AFS reserve and not through profit or loss. If such securities were sold, the corresponding part of the AFS reserve was released through profit or loss. In the event of impairment (e.g. a debtor in severe financial difficulties or a measurable decline in the expected future cash flows), a charge for the impairment was recognized in the Income Statement. If the reason for such a charge no longer existed, a write-back was recorded. In the case of equity capital instruments, it was made to equity through the AFS reserve. In the case of debt instruments, it was made to income. Investments in entities that were neither consolidated nor accounted for using the equity method were deemed to be part of the AFS portfolio.
Held-to-maturity financial assetsThis line item comprises financial instruments that are to be held to maturity (HTM). Premiums and discounts are spread over their term using the effective interest rate method. Impairment losses were recognized through profit or loss.
Investment propertyThis line item encompasses property intended for letting to third parties. It was measured at amortized cost (cost method). The fair value of our investment properties is disclosed in the Notes. It was mainly based on estimates (external expert reports). De-preciation rates lay between 1.5 per cent and 3.0 per cent.
Other assetsThe line item Other assets accounts for receivables not arising directly from banking business.
PayablesPayables — with the exception of payables valued at fair value through profit or loss — were mainly recognized at the amounts payable.
taxThe reporting and calculation of income tax expense took place in accordance with IAS 12. The calculation for each taxed entity was carried out applying the tax rates that, according to current tax legislation, were to be applied in the tax period in which a temporary difference was going to reverse. Deferred taxes were computed on the basis of differences between the tax base and the carrying amounts of assets or liabilities for the purposes of IFRSs. These were expected to cause additional tax burdens or reduce tax burdens in the future.
EquityEquity consists of paid-in capital and earned capital (retained earnings, gains and losses taken to equity in accordance with IAS 39 and profit for the period). BKS Bank strives to strengthen its capital base on a sustainable basis by ploughing back its profits.
ProvisionsProvisions were created if there was a reliably determinable legal or actual obligation to a third party arising from an event in the past likely to cause a drain of assets.
Provisions for so-called ‘social capital’ (Sozialkapitalrückstellung) were calculated in accordance with the requirements of IAS 19. The downtrend in interest rates was already taken into account when calculating provisions for post-employment, ter-mination and jubilee benefits and provisions were increased accordingly.
23
IFRS-COMPLIANt CONSOLIDAtED FINANCIAL StAtEMENtSAS At AND FOR tHE NINE MONtHS ENDED 30 SEPtEMBER 2012
Actuarial gains and losses were recognized immediately through profit or loss in the Income Statement. The provision for mor-tality benefits was also calculated in accordance with IFRS principles. In the first three quarters of 2012, the provisions for post-employment, termination, jubilee and mortality benefits were calculated applying IFRS principles in accordance with the AVÖ 2008 table using the projected unit credit method.
Net interest incomeInterest income and interest expenses were accounted for on an accrual basis. This line item also includes profit from equity investments. Profit from investments in entities accounted for using the equity method was disclosed in the line item Net interest income net of financing costs.
Impairment charge on loans and advancesThis line item captures impairment allowances, impairment reversals and direct write-offs (additions to and deductions fromthe impairment allowance balance). Recoveries on receivables previously written off were also accounted for in this line item.
Net fee and commission incomeThis line item comprises income from services rendered to third parties net of the expenses attributed to such services.
Net trading incomeThis line item comprises income and expenses arising from our proprietary trading activities. Positions in the trading book were marked to market. Net trading income also includes revaluation gains and losses.
Other notesForward-looking assumptions and estimates regarding yield curves and foreign exchange rates were made as required.
The Consolidated Financial Statements of BKS Bank AG for the 2011 financial year and for the first three quarters of 2012 were prepared in accordance with the applicable International Financial Reporting Standards (IFRSs) published by the International Accounting Standards Board as adopted by the EU. Standards, interpretations and revisions and amendments already published and adopted by the EU whose application was not yet mandatory (IFRS 9; IFRS 10 and IFRS 13) were not applied ahead of time.
The assumptions and estimates made for the purposes of the Consolidated Financial Statements were made on the basis of the knowledge and information available at the copy deadline date.
24
IFRS-COMPLIANt CONSOLIDAtED FINANCIAL StAtEMENtSAS At AND FOR tHE NINE MONtHS ENDED 30 SEPtEMBER 2012
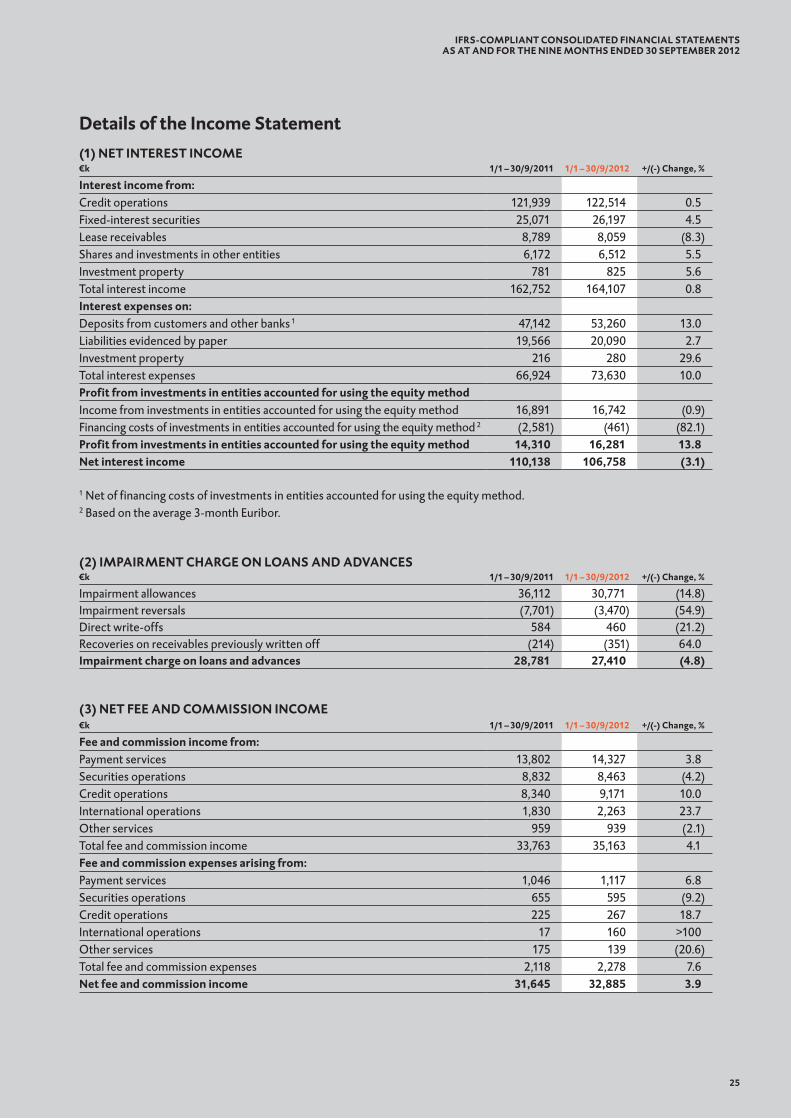
Details of the Income Statement(1) NEt INtERESt INCOME€k 1/1 – 30/9/2011 1/1 – 30/9/2012 +/(-) Change, %
Interest income from: Credit operations 121,939 122,514 0.5Fixed-interest securities 25,071 26,197 4.5Lease receivables 8,789 8,059 (8.3)Shares and investments in other entities 6,172 6,512 5.5Investment property 781 825 5.6Total interest income 162,752 164,107 0.8Interest expenses on:Deposits from customers and other banks 1 47,142 53,260 13.0Liabilities evidenced by paper 19,566 20,090 2.7Investment property 216 280 29.6Total interest expenses 66,924 73,630 10.0Profit from investments in entities accounted for using the equity methodIncome from investments in entities accounted for using the equity method 16,891 16,742 (0.9)Financing costs of investments in entities accounted for using the equity method 2 (2,581) (461) (82.1)Profit from investments in entities accounted for using the equity method 14,310 16,281 13.8Net interest income 110,138 106,758 (3.1)
1 Net of financing costs of investments in entities accounted for using the equity method.2 Based on the average 3-month Euribor.
(2) IMPAIRMENt CHARGE ON LOANS AND ADVANCES€k 1/1 – 30/9/2011 1/1 – 30/9/2012 +/(-) Change, %
Impairment allowances 36,112 30,771 (14.8)Impairment reversals (7,701) (3,470) (54.9)Direct write-offs 584 460 (21.2)Recoveries on receivables previously written off (214) (351) 64.0Impairment charge on loans and advances 28,781 27,410 (4.8)
(3) NEt FEE AND COMMISSION INCOME€k 1/1 – 30/9/2011 1/1 – 30/9/2012 +/(-) Change, %
Fee and commission income from:Payment services 13,802 14,327 3.8Securities operations 8,832 8,463 (4.2)Credit operations 8,340 9,171 10.0International operations 1,830 2,263 23.7Other services 959 939 (2.1)Total fee and commission income 33,763 35,163 4.1Fee and commission expenses arising from:Payment services 1,046 1,117 6.8Securities operations 655 595 (9.2)Credit operations 225 267 18.7International operations 17 160 >100Other services 175 139 (20.6)Total fee and commission expenses 2,118 2,278 7.6Net fee and commission income 31,645 32,885 3.9
25
IFRS-COMPLIANt CONSOLIDAtED FINANCIAL StAtEMENtSAS At AND FOR tHE NINE MONtHS ENDED 30 SEPtEMBER 2012
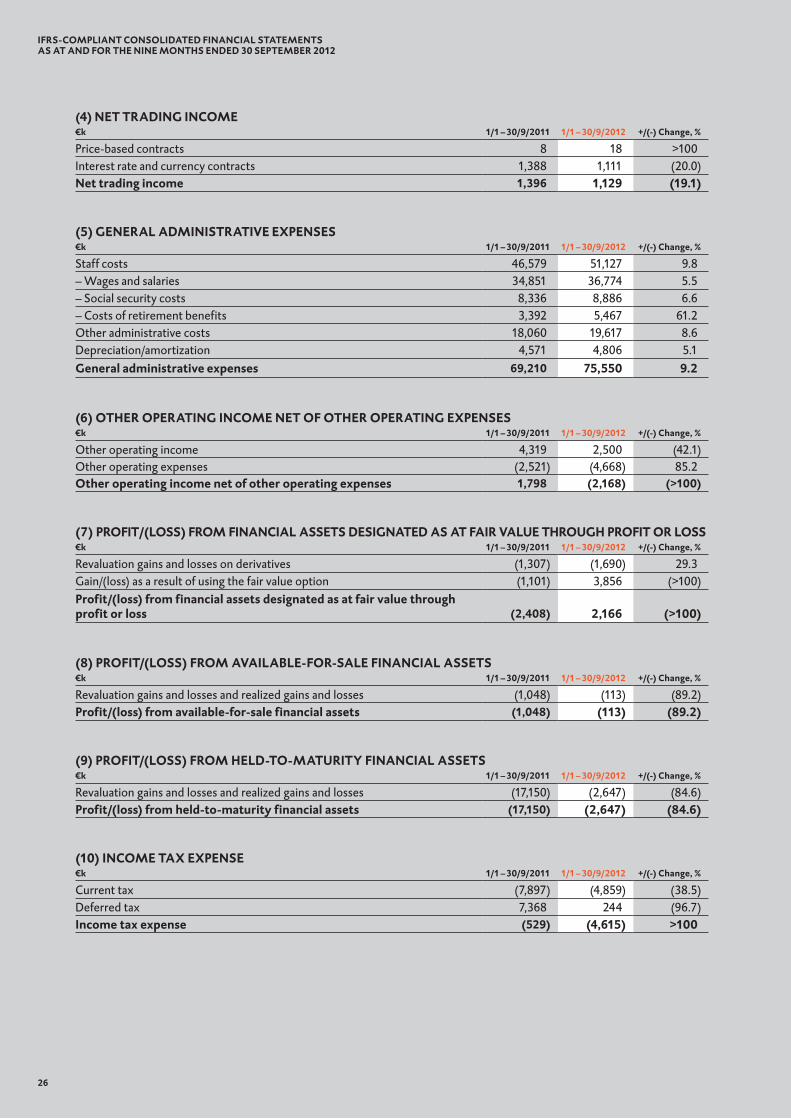
(4) NEt tRADING INCOME €k 1/1 – 30/9/2011 1/1 – 30/9/2012 +/(-) Change, %
Price-based contracts 8 18 >100Interest rate and currency contracts 1,388 1,111 (20.0)Net trading income 1,396 1,129 (19.1)
(5) GENERAL ADMINIStRAtIVE EXPENSES€k 1/1 – 30/9/2011 1/1 – 30/9/2012 +/(-) Change, %
Staff costs 46,579 51,127 9.8– Wages and salaries 34,851 36,774 5.5– Social security costs 8,336 8,886 6.6– Costs of retirement benefits 3,392 5,467 61.2Other administrative costs 18,060 19,617 8.6Depreciation/amortization 4,571 4,806 5.1General administrative expenses 69,210 75,550 9.2
(6) OtHER OPERAtING INCOME NEt OF OtHER OPERAtING EXPENSES€k 1/1 – 30/9/2011 1/1 – 30/9/2012 +/(-) Change, %
Other operating income 4,319 2,500 (42.1)Other operating expenses (2,521) (4,668) 85.2Other operating income net of other operating expenses 1,798 (2,168) (>100)
(7) PROFIt/(LOSS) FROM FINANCIAL ASSEtS DESIGNAtED AS At FAIR VALUE tHROUGH PROFIt OR LOSS€k 1/1 – 30/9/2011 1/1 – 30/9/2012 +/(-) Change, %
Revaluation gains and losses on derivatives (1,307) (1,690) 29.3Gain/(loss) as a result of using the fair value option (1,101) 3,856 (>100)Profit/(loss) from financial assets designated as at fair value throughprofit or loss (2,408) 2,166 (>100)
(8) PROFIt/(LOSS) FROM AVAILABLE-FOR-SALE FINANCIAL ASSEtS €k 1/1 – 30/9/2011 1/1 – 30/9/2012 +/(-) Change, %
Revaluation gains and losses and realized gains and losses (1,048) (113) (89.2)Profit/(loss) from available-for-sale financial assets (1,048) (113) (89.2)
(9) PROFIt/(LOSS) FROM HELD-tO-MAtURItY FINANCIAL ASSEtS€k 1/1 – 30/9/2011 1/1 – 30/9/2012 +/(-) Change, %
Revaluation gains and losses and realized gains and losses (17,150) (2,647) (84.6)Profit/(loss) from held-to-maturity financial assets (17,150) (2,647) (84.6)
(10) INCOME tAX EXPENSE€k 1/1 – 30/9/2011 1/1 – 30/9/2012 +/(-) Change, %
Current tax (7,897) (4,859) (38.5)Deferred tax 7,368 244 (96.7)Income tax expense (529) (4,615) >100
26
IFRS-COMPLIANt CONSOLIDAtED FINANCIAL StAtEMENtSAS At AND FOR tHE NINE MONtHS ENDED 30 SEPtEMBER 2012

Details of the Balance Sheet
(11) CASH AND BALANCES WItH tHE CENtRAL BANK€k 31/12/2011 30/9/2012 +/(-) Change, %
Cash in hand 31,453 30,948 (1.6)Credit balances with central banks of issue 54,366 64,368 18.4Cash and balances with the central bank 85,819 95,316 11.1
(12) RECEIVABLES FROM OtHER BANKS€k 31/12/2011 30/9/2012 +/(-) Change, %
Receivables from Austrian banks 22,505 53,754 >100Receivables from foreign banks 93,998 81,793 (13.0)Receivables from other banks 116,503 135,547 16.3
(13) RECEIVABLES FROM CUStOMERS€k 31/12/2011 30/9/2012 +/(-) Change, %
Corporate and business banking customers 3,726,078 3,874,678 4.0Retail banking customers 1,075,017 1,089,303 1.3Receivables from customers 4,801,095 4,963,981 3.4
(14) IMPAIRMENt ALLOWANCE BALANCE€k 31/12/2011 30/9/2012 +/(-) Change, %
At beginning of period under review 149,149 153,246 2.7+ Added 36,796 28,433 (22.7)– Reversed (6,893) (3,425) (50.3)– Used (25,664) (13,909) (45.8)+/(-) Exchange differences (142) 97 (>100)At end of period under review 153,246 164,442 7.3
(15) tRADING ASSEtS€k 31/12/2011 30/9/2012 +/(-) Change, %
Bonds and other fixed-interest securities 0 476 100.0Shares and other variable-yield securities 0 0 —Positive fair values of derivative financial instruments 344 270 (21.5)– Interest rate contracts 0 0 —trading assets 344 746 >100
(16) FINANCIAL ASSEtS DESIGNAtED AS At FAIR VALUE tHROUGH PROFIt OR LOSS €k 31/12/2011 30/9/2012 +/(-) Change, %
Bonds and other fixed-interest securities 58,722 92,068 56.8Loans 60,892 92,313 51.6Financial assets designated as at fair value through profit or loss 119,614 184,381 54.1
(17) AVAILABLE-FOR-SALE FINANCIAL ASSEtS €k 31/12/2011 30/9/2012 +/(-) Change, %
Bonds and other fixed-interest securities 158,765 168,349 6.0Shares and other variable-yield securities 88,096 75,395 (14.4)Investments in subsidiaries and associates 33,105 30,581 (7.6)Other equity investments 15,149 15,826 4.5Available-for-sale financial assets 295,115 290,151 (1.7)
27
IFRS-COMPLIANt CONSOLIDAtED FINANCIAL StAtEMENtSAS At AND FOR tHE NINE MONtHS ENDED 30 SEPtEMBER 2012
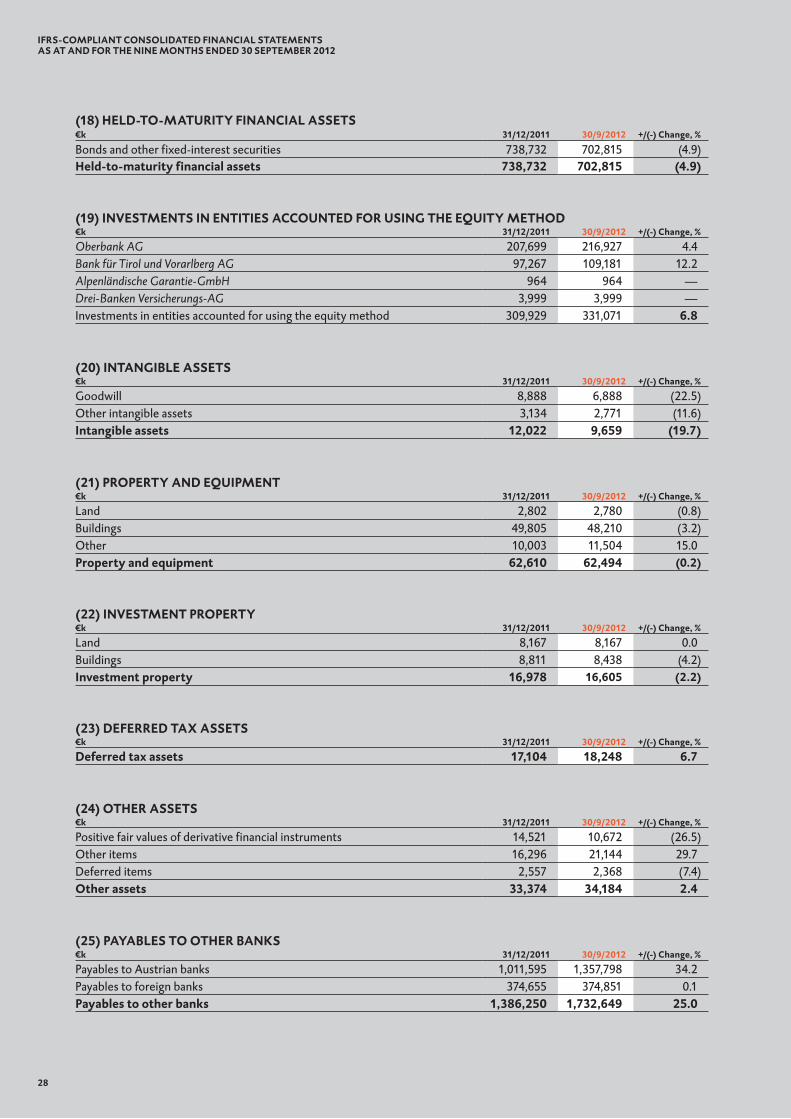
(18) HELD-tO-MAtURItY FINANCIAL ASSEtS€k 31/12/2011 30/9/2012 +/(-) Change, %
Bonds and other fixed-interest securities 738,732 702,815 (4.9)Held-to-maturity financial assets 738,732 702,815 (4.9)
(19) INVEStMENtS IN ENtItIES ACCOUNtED FOR USING tHE EQUItY MEtHOD€k 31/12/2011 30/9/2012 +/(-) Change, %
Oberbank AG 207,699 216,927 4.4Bank für Tirol und Vorarlberg AG 97,267 109,181 12.2Alpenländische Garantie-GmbH 964 964 —Drei-Banken Versicherungs-AG 3,999 3,999 —Investments in entities accounted for using the equity method 309,929 331,071 6.8
(20) INtANGIBLE ASSEtS€k 31/12/2011 30/9/2012 +/(-) Change, %
Goodwill 8,888 6,888 (22.5)Other intangible assets 3,134 2,771 (11.6)Intangible assets 12,022 9,659 (19.7)
(21) PROPERtY AND EQUIPMENt€k 31/12/2011 30/9/2012 +/(-) Change, %
Land 2,802 2,780 (0.8)Buildings 49,805 48,210 (3.2)Other 10,003 11,504 15.0Property and equipment 62,610 62,494 (0.2)
(22) INVEStMENt PROPERtY€k 31/12/2011 30/9/2012 +/(-) Change, %
Land 8,167 8,167 0.0Buildings 8,811 8,438 (4.2)Investment property 16,978 16,605 (2.2)
(23) DEFERRED tAX ASSEtS€k 31/12/2011 30/9/2012 +/(-) Change, %
Deferred tax assets 17,104 18,248 6.7
(24) OtHER ASSEtS €k 31/12/2011 30/9/2012 +/(-) Change, %
Positive fair values of derivative financial instruments 14,521 10,672 (26.5)Other items 16,296 21,144 29.7Deferred items 2,557 2,368 (7.4)Other assets 33,374 34,184 2.4
(25) PAYABLES tO OtHER BANKS€k 31/12/2011 30/9/2012 +/(-) Change, %
Payables to Austrian banks 1,011,595 1,357,798 34.2Payables to foreign banks 374,655 374,851 0.1Payables to other banks 1,386,250 1,732,649 25.0
28
IFRS-COMPLIANt CONSOLIDAtED FINANCIAL StAtEMENtSAS At AND FOR tHE NINE MONtHS ENDED 30 SEPtEMBER 2012
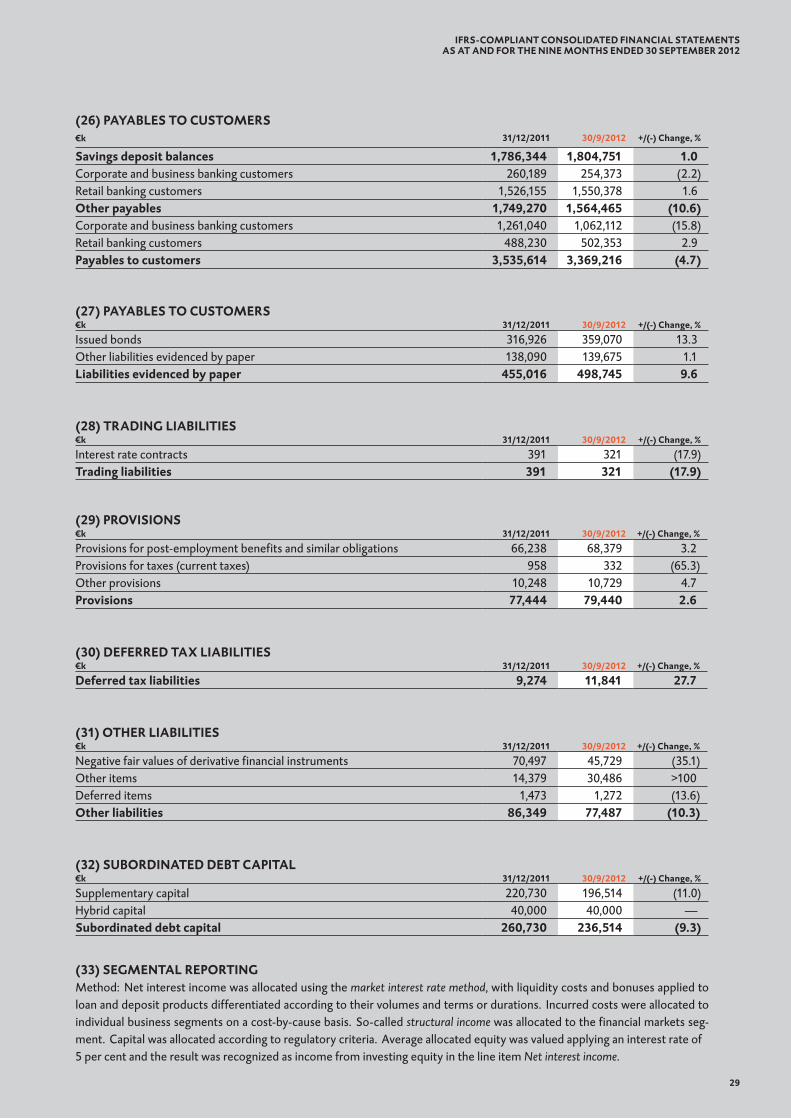
(26) PAYABLES tO CUStOMERS€k 31/12/2011 30/9/2012 +/(-) Change, %
Savings deposit balances 1,786,344 1,804,751 1.0Corporate and business banking customers 260,189 254,373 (2.2)Retail banking customers 1,526,155 1,550,378 1.6Other payables 1,749,270 1,564,465 (10.6)Corporate and business banking customers 1,261,040 1,062,112 (15.8)Retail banking customers 488,230 502,353 2.9Payables to customers 3,535,614 3,369,216 (4.7)
(27) PAYABLES tO CUStOMERS€k 31/12/2011 30/9/2012 +/(-) Change, %
Issued bonds 316,926 359,070 13.3Other liabilities evidenced by paper 138,090 139,675 1.1Liabilities evidenced by paper 455,016 498,745 9.6
(28) tRADING LIABILItIES€k 31/12/2011 30/9/2012 +/(-) Change, %
Interest rate contracts 391 321 (17.9)trading liabilities 391 321 (17.9)
(29) PROVISIONS€k 31/12/2011 30/9/2012 +/(-) Change, %
Provisions for post-employment benefits and similar obligations 66,238 68,379 3.2Provisions for taxes (current taxes) 958 332 (65.3)Other provisions 10,248 10,729 4.7Provisions 77,444 79,440 2.6
(30) DEFERRED tAX LIABILItIES €k 31/12/2011 30/9/2012 +/(-) Change, %
Deferred tax liabilities 9,274 11,841 27.7
(31) OtHER LIABILItIES €k 31/12/2011 30/9/2012 +/(-) Change, %
Negative fair values of derivative financial instruments 70,497 45,729 (35.1)Other items 14,379 30,486 >100Deferred items 1,473 1,272 (13.6)Other liabilities 86,349 77,487 (10.3)
(32) SUBORDINAtED DEBt CAPItAL€k 31/12/2011 30/9/2012 +/(-) Change, %
Supplementary capital 220,730 196,514 (11.0)Hybrid capital 40,000 40,000 —Subordinated debt capital 260,730 236,514 (9.3)
29
(33) SEGMENtAL REPORtINGMethod: Net interest income was allocated using the market interest rate method, with liquidity costs and bonuses applied to loan and deposit products differentiated according to their volumes and terms or durations. Incurred costs were allocated to individual business segments on a cost-by-cause basis. So-called structural income was allocated to the financial markets seg-ment. Capital was allocated according to regulatory criteria. Average allocated equity was valued applying an interest rate of5 per cent and the result was recognized as income from investing equity in the line item Net interest income.
IFRS-COMPLIANt CONSOLIDAtED FINANCIAL StAtEMENtSAS At AND FOR tHE NINE MONtHS ENDED 30 SEPtEMBER 2012
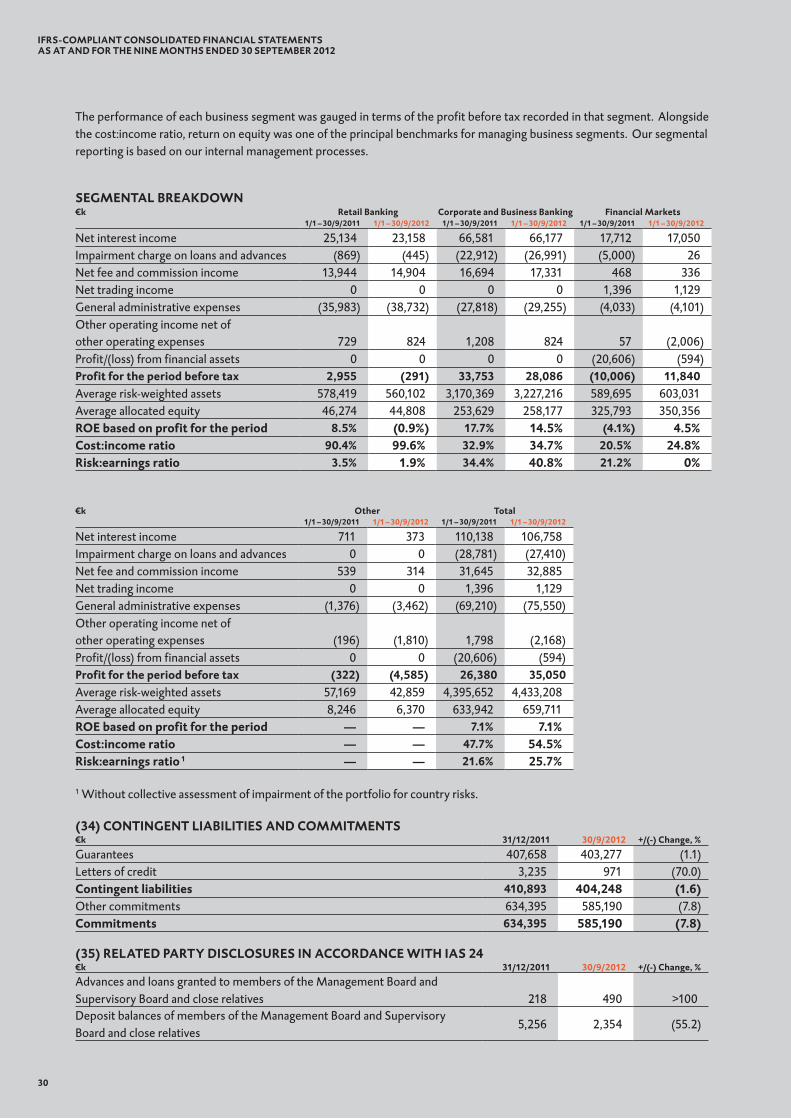
E.
The performance of each business segment was gauged in terms of the profit before tax recorded in that segment. Alongside the cost:income ratio, return on equity was one of the principal benchmarks for managing business segments. Our segmentalreporting is based on our internal management processes.
SEGMENtAL BREAKDOWN€k Retail Banking Corporate and Business Banking Financial Markets
1/1 – 30/9/2011 1/1 – 30/9/2012 1/1 – 30/9/2011 1/1 – 30/9/2012 1/1 – 30/9/2011 1/1 – 30/9/2012
Net interest income 25,134 23,158 66,581 66,177 17,712 17,050Impairment charge on loans and advances (869) (445) (22,912) (26,991) (5,000) 26Net fee and commission income 13,944 14,904 16,694 17,331 468 336Net trading income 0 0 0 0 1,396 1,129General administrative expenses (35,983) (38,732) (27,818) (29,255) (4,033) (4,101)Other operating income net ofother operating expenses 729 824 1,208 824 57 (2,006)Profit/(loss) from financial assets 0 0 0 0 (20,606) (594)Profit for the period before tax 2,955 (291) 33,753 28,086 (10,006) 11,840Average risk-weighted assets 578,419 560,102 3,170,369 3,227,216 589,695 603,031Average allocated equity 46,274 44,808 253,629 258,177 325,793 350,356ROE based on profit for the period 8.5% (0.9%) 17.7% 14.5% (4.1%) 4.5%Cost:income ratio 90.4% 99.6% 32.9% 34.7% 20.5% 24.8%Risk:earnings ratio 3.5% 1.9% 34.4% 40.8% 21.2% 0%
€k Other total1/1 – 30/9/2011 1/1 – 30/9/2012 1/1 – 30/9/2011 1/1 – 30/9/2012
Net interest income 711 373 110,138 106,758Impairment charge on loans and advances 0 0 (28,781) (27,410)Net fee and commission income 539 314 31,645 32,885Net trading income 0 0 1,396 1,129General administrative expenses (1,376) (3,462) (69,210) (75,550)Other operating income net ofother operating expenses (196) (1,810) 1,798 (2,168)Profit/(loss) from financial assets 0 0 (20,606) (594)Profit for the period before tax (322) (4,585) 26,380 35,050Average risk-weighted assets 57,169 42,859 4,395,652 4,433,208Average allocated equity 8,246 6,370 633,942 659,711ROE based on profit for the period — — 7.1% 7.1%Cost:income ratio — — 47.7% 54.5%Risk:earnings ratio 1 — — 21.6% 25.7%
1 Without collective assessment of impairment of the portfolio for country risks.
(34) CONtINGENt LIABILItIES AND COMMItMENtS€k 31/12/2011 30/9/2012 +/(-) Change, %
Guarantees 407,658 403,277 (1.1)Letters of credit 3,235 971 (70.0)Contingent liabilities 410,893 404,248 (1.6)Other commitments 634,395 585,190 (7.8)Commitments 634,395 585,190 (7.8)
30
(35) RELAtED PARtY DISCLOSURES IN ACCORDANCE WItH IAS 24€k 31/12/2011 30/9/2012 +/(-) Change, %
Advances and loans granted to members of the Management Board andSupervisory Board and close relatives 218 490 >100Deposit balances of members of the Management Board and Supervisory Board and close relatives
5,256 2,354 (55.2)
IFRS-COMPLIANt CONSOLIDAtED FINANCIAL StAtEMENtSAS At AND FOR tHE NINE MONtHS ENDED 30 SEPtEMBER 2012
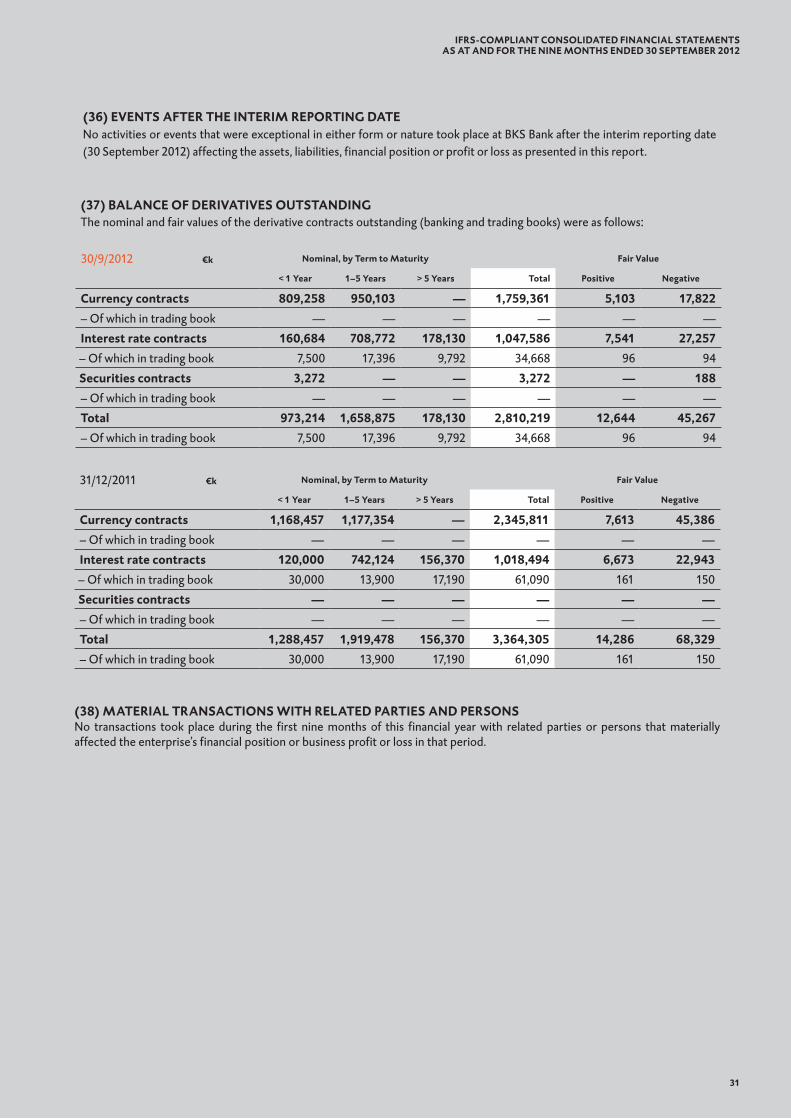
E.
(36) EVENtS AFtER tHE INtERIM REPORtING DAtENo activities or events that were exceptional in either form or nature took place at BKS Bank after the interim reporting date (30 September 2012) affecting the assets, liabilities, financial position or profit or loss as presented in this report.
31/12/2011 €k Nominal, by term to Maturity Fair Value
< 1 Year 1–5 Years > 5 Years total Positive Negative
Currency contracts 1,168,457 1,177,354 — 2,345,811 7,613 45,386– Of which in trading book — — — — — —
Interest rate contracts 120,000 742,124 156,370 1,018,494 6,673 22,943– Of which in trading book 30,000 13,900 17,190 61,090 161 150
Securities contracts — — — — — —– Of which in trading book — — — — — —
total 1,288,457 1,919,478 156,370 3,364,305 14,286 68,329– Of which in trading book 30,000 13,900 17,190 61,090 161 150
(38) MAtERIAL tRANSACtIONS WItH RELAtED PARtIES AND PERSONSNo transactions took place during the first nine months of this financial year with related parties or persons that materially affected the enterprise’s financial position or business profit or loss in that period.
(37) BALANCE OF DERIVAtIVES OUtStANDINGThe nominal and fair values of the derivative contracts outstanding (banking and trading books) were as follows:
30/9/2012 €k Nominal, by term to Maturity Fair Value
< 1 Year 1–5 Years > 5 Years total Positive Negative
Currency contracts 809,258 950,103 — 1,759,361 5,103 17,822– Of which in trading book — — — — — —
Interest rate contracts 160,684 708,772 178,130 1,047,586 7,541 27,257– Of which in trading book 7,500 17,396 9,792 34,668 96 94
Securities contracts 3,272 — — 3,272 — 188– Of which in trading book — — — — — —
total 973,214 1,658,875 178,130 2,810,219 12,644 45,267– Of which in trading book 7,500 17,396 9,792 34,668 96 94
31
IFRS-COMPLIANt CONSOLIDAtED FINANCIAL StAtEMENtSAS At AND FOR tHE NINE MONtHS ENDED 30 SEPtEMBER 2012
32
Statement by BKS Bank’s Management
“We confirm that, to the best of our knowledge, the Consolidated Interim Financial Statements as at and for the nine months ended 30 September 2012 prepared in accordance with the applicable financial reporting standards present fairly, in all material respects, the assets, liabilities, financial position and profit or loss of the BKS Bank Group and that the Group Management Report for the period from 1 January to 30 September 2012 presents fairly, in all material respects, the assets, liabilities, financial position and profit or loss of the BKS Bank Group with respect to the important events occurring during the first nine months of the financial year and their impact on the Consolidated Interim Financial Statements and with respect to the material risks and uncertainties for the remain-ing three months of the financial year.”
Klagenfurt am Wörthersee26 November 2012
StAtEMENt BY BKS BANK’S MANAGEMENt
The Management Board
Herta Stockbauer, Member of the Management Board
Heimo Penker, CEO Dieter Krassnitzer, Member of the Management Board
Publication details: Published by BKS Bank AG, St. Veiter Ring 43, A-9020 Klagenfurt am Wörthersee, Austria.Internet: www.bks.at; e-mail: [email protected] or [email protected] by the Management Board Office of BKS Bank AG. Copy deadline date: 26 November 2012.Translation and English typesetting by Adrian Weisweiller MA (Oxon), London.
Member of the Management Board re-sponsible for International Operations, Accounts and Sales Controlling, Trea-sury/Proprietary Trading, Capital Mar-kets Law, Construction, Subsidiaries and Equity Investments. Within Aus-tria, she is responsible for the Burgen-land and Vienna regions; abroad, she is responsible for the Slovenia, Croatia, Hungary and Slovakia regions.
Member of the Management Board responsible for the Corporate and Business Banking Segment and Retail Banking Segment, Human Resources, Public Relations, Marketing and Inves-tor Relations. Regional responsibility for the Carinthia and Styria regions and for Italy.
Member of the Management Board responsible for Risk Management, Risk Controlling, the Loan Back Office, Busi-ness Organization and IT and 3BEG.
RemarksThis Interim Report as at and for the nine months ended 30 September 2012 contains statements and forecasts concerning the future development of the BKS Bank Group. The forecasts are estimates made on the basis of all the information available to us on the copy deadline date, which was 26 November 2012. If the assumptions upon which these forecasts were based prove wrong or if risk events transpire in amounts that have not been calculated for, actual results may differ from those that are currently expected. This Interim Report does not constitute a recommendation to buy or sell shares of BKS Bank AG.
This Interim Report does not require auditing and, therefore, has not been audited or examined in full by an auditor. The German version of this report is the authentic version for all legal purposes. Interim reports in English are translations.
Financial Calendar for 201329 March 2013: Publication of the Annual Financial Statements and Consolidated Financial Statements for 2012 in the Internet and in the official Wiener Zeitung gazette 15 May 2013: 74th Ordinary General Meeting (AGM) 17 May 2013: Ex-dividend date 21 May 2013: Dividend payment date
BKS Bank’s Interim Reports24 May 2013: Interim Report as at and for the 3 months ended 31 March 2013 23 August 2013: Interim Report as at and for the 6 months ended 30 June 2013 29 November 2013: Interim Report as at and for the 9 months ended 30 September 2013
Related Documents