Living Income Report Rural Pakistan Khyber Pakhtunkhwa (KP), Pakistan Study date: April 2021 By: Kabeer Dawani, Syeda Haleema Hasan and Asad Sayeed RePEc No. 2021-01-28 November 2021 Photo credit: Visual News Associates / World Bank

Welcome message from author
This document is posted to help you gain knowledge. Please leave a comment to let me know what you think about it! Share it to your friends and learn new things together.
Transcript

Living Income Report Rural Pakistan Khyber Pakhtunkhwa (KP), Pakistan Study date: April 2021 By: Kabeer Dawani, Syeda Haleema Hasan and Asad Sayeed
RePEc No. 2021-01-28
November 2021
Photo credit: Visual News Associates / World Bank

Living Income Report: Charsadda, Mardan, and Swabi districts in Khyber Pakhtunkhwa (KP) Pakistan
Anker Living Wage and Living Income Research Institute © Global Living Wage Coalition 2
The Anker Living Wage and Income Research Institute was founded by Richard Anker and Martha Anker, the Global Living Wage Coalition, and Clif Bar & Company. Social Accountability International (SAI) is the institutional host.
Under the Aegis of Fairtrade International, Rainforest Alliance, Social Accountability International, in partnership with ISEAL Alliance and Richard Anker and Martha Anker.

Living Income Report: Charsadda, Mardan, and Swabi districts in Khyber Pakhtunkhwa (KP) Pakistan
Anker Living Wage and Living Income Research Institute © Global Living Wage Coalition 3
Living Income Report Rural Pakistan Charsadda, Mardan, and Swabi districts in Khyber Pakhtunkhwa (KP), Pakistan
CONTENTS Contents .............................................................................................................................................. 3 Acknowledgements ............................................................................................................................. 4 Section I: Introduction ......................................................................................................................... 5
1. Background .............................................................................................................................. 5 2. Context ..................................................................................................................................... 6 3. How Living Income is Estimated ................................................................................................ 7 4. Reference Family Size ............................................................................................................... 8
Section II: Cost of a basic but Decent Life for Worker and Family........................................................ 10 5. Food Costs .............................................................................................................................. 10
5.1 General Principles Used to Develop the Model Diet .................................................................... 10 5.2 Model Diet .................................................................................................................................... 10 5.3 Food Prices .................................................................................................................................... 14
6. Housing .................................................................................................................................. 16 6.1 Minimum Housing Standard ......................................................................................................... 16 6.2 Rental Equivalent Value for Basic Acceptable Housing ................................................................ 20 6.3 Utility Costs ................................................................................................................................... 21 6.4 Summary of Housing Costs ........................................................................................................... 22
7. Non-Food Non-Housing Costs ................................................................................................. 22 8. Rapid Post-Checks of Non-Food and Non-Housing Costs ......................................................... 25
8.1 Health Care Post-Check ................................................................................................................. 26 8.2 Education Post-Check ................................................................................................................... 27 8.3 Transport Post-Check .................................................................................................................... 28
9. Provision for Unexpected Events to Ensure Sustainability ....................................................... 29 Section III: The Living Income for Workers ......................................................................................... 30
10. Living Income in Context ..................................................................................................... 30 10.1. Poverty Line Wage Income ........................................................................................................ 30 10.2. Average Low Skilled Wage Income ............................................................................................ 30 10.3. Family Income Ladder: Comparing Incomes .............................................................................. 30
11. Living Income Summary ...................................................................................................... 31 References ......................................................................................................................................... 35 Appendix 1. Living Wage Estimate for Rural KP, Pakistan ................................................................... 36
A1.1 Number of workers per family ................................................................................................... 36 A1.2. Living wage estimate ................................................................................................................. 37
Living Income Report: Charsadda, Mardan, and Swabi districts in Khyber Pakhtunkhwa (KP) Pakistan
Anker Living Wage and Living Income Research Institute © Global Living Wage Coalition 4
ACKNOWLEDGEMENTS Carrying out this study was a challenging task amid a global pandemic and the associated risks that carried. It would not have been possible to complete it without the assistance and support of several individuals. We are grateful to Bilal Fareed, Momin Khan and Zaheer Gazdar for their help in conducting interviews remotely with farmers and workers. Maqsood Jan was an essential part of our team and did a fantastic job in collecting primary data in the three study districts.
We are also thankful to Asghar Khan, Muhammad Shahid and Yohanes Djunaedi for sharing information about workers and farmers in our study districts, which facilitated conducting interviews remotely.
Martha and Richard Anker have collaborated with us on this work and given excellent feedback at multiple stages of this study that have greatly improved the report. We thank them for their support and guidance. We would also like to thank Iftikar Ahmad for reviewing the final report.
Finally, thanks are also due to Social Accountability International for their institutional support and enabling us to conduct this work.
This report was commissioned and funded by Philip Morris International.
Living Income Report: Charsadda, Mardan, and Swabi districts in Khyber Pakhtunkhwa (KP) Pakistan
Anker Living Wage and Living Income Research Institute © Global Living Wage Coalition 5
SECTION I: INTRODUCTION 1. BACKGROUND
This report provides an estimate for the costs of living for a reference family for rural Khyber Pakhtunkhwa (KP), with a focus on Charsadda, Mardan and Swabi districts. There was a further focus on tobacco farmers as Pakistan is the one of the largest producers of tobacco in the world, and this is mainly grown in the Khyber Pakhtunkhwa (KP) province of Pakistan.
This study uses the Anker methodology (Anker and Anker 2017) to estimate the cost of living for a typical size family in rural KP for a basic but decent living standard, or the living income.
Living income, as defined by the Living Income Community of Practice, is:
“The net annual income required for a household in a particular place to afford a decent standard of living for all members of that household.
Elements of a decent standard of living include: food, water, housing, education, healthcare, transport, clothing, and other essential needs including provision for unexpected events”.1
This study also estimates a living wage for rural KP. The living wage for rural KP is estimated in Annex 1. Living wage is the living income for rural KP divided by the typical number of full-time workers per couple in rural KP. The Global Living Wage Coalition (GLWC) definition of a living wage is:
“The remuneration received for a standard workweek by a worker in a particular place sufficient to afford a decent standard of living for the worker and her or his family. Elements of a decent standard of living include food, water, housing, education, health care, transportation, clothing, and other essential needs including provision for unexpected events.”2
The Anker methodology arrives at the living income by estimating the costs for a basic but decent standard of living for a typical size family. Two characteristics of the Anker methodology, and part of what differentiates it from other methodologies, are that it: (i) uses a mix of primary and secondary data to arrive at the estimates, and (ii) uses normative standards for food, housing, education, and health care costs that it considers to be human rights.
It is important to note that in 2017, a study for urban and rural Sialkot in North-eastern Punjab (Sayeed and Dawani 2017) estimated living income and living wage for these areas using the Anker methodology. Precisely because the methodology considers local prices and context, the benchmarks estimated for Sialkot are unsuitable for Charsadda, Mardan and Swabi in the Khyber Pakhtunkhwa Province. This region of KP is starkly different to Sialkot in terms of its local economy, and it is also in a different province, therefore requires separate living income and living wage estimates. Rural KP has much lower population density and this increases living costs, because the relatively large distances and isolated nature of rural
1 https://www.living-income.com/the-concept 2 https://www.globallivingwage.org/about/what-is-a-living-wage/

Living Income Report: Charsadda, Mardan, and Swabi districts in Khyber Pakhtunkhwa (KP) Pakistan
Anker Living Wage and Living Income Research Institute © Global Living Wage Coalition 6
KP means, for decency for example that farmers and workers need a motorbike to get around and make greater use of private health facilities.
To arrive at our living income estimate for rural KP Province, field work was conducted in each of the three districts, namely Charsadda, Mardan and Swabi, over March and April 2021. This was a challenging exercise given the Covid-19 pandemic, which created a dynamic situation with frequently changing public health guidelines as well as restrictions on mobility. This required our qualitative interviews with key informants to be conducted remotely over the phone. However, we were able to collect primary data on food prices, housing costs, education costs, and health care costs – which is a necessary component of the Anker methodology. To do this, a local researcher based in KP was hired to assist us in primary data collection. This researcher was trained over video conference and was rigorously followed up with at the end of each day in the field. All data collected was scanned and shared with the primary research team to check for data quality checks and any issues. This primary data collected from our fieldwork, complemented by national surveys conducted by the Pakistan Bureau of Statistics, forms the foundation of our living income and living wage estimates.
The living income we estimate for Charsadda, Mardan and Swabi in Khyber Pakhtunkhwa is Rs. 52,771 (US$ 342) for March-April 2021 for our reference family of 6 people (2 adults and 4 children). The living wage we estimated is Rs. 35,656 (US$ 231).
The remainder of this report outlines the steps and components involved in estimating the living income and living wage for rural KP. Section 2 provides the local context, section 3 outlines the contours of how a living income is estimated and section 4 explains how we estimated the reference family size, while sections 5 to 9 indicate how we estimated the individual components of a living income. Finally, in section 10, we compare our living income estimate to other family income indicators such as the minimum wage and the World Bank poverty lines, and, in section 11, we conclude by providing the summary of our living income estimate. Annex 1 estimates a living wage.
2. CONTEXT
Pakistan is a lower middle-income country according to the World Bank’s classification. Using the $3.20 per day poverty line (in internationally comparable dollars in terms of purchasing power), the World Bank estimates that the poverty rate in Pakistan is 39.3% in 2020-21.3 Nearly 40% of the labor force is engaged in the agriculture sector, making it the largest sector in terms of the share of population engaged in it.
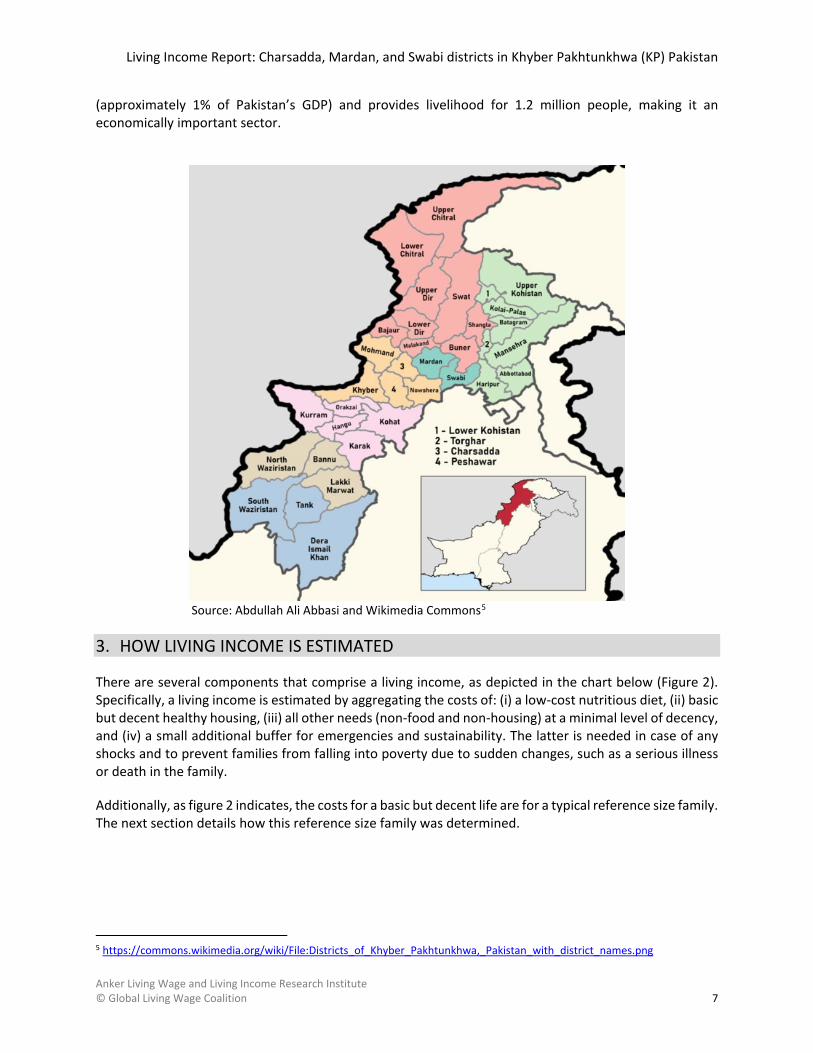
Khyber Pakhtunkhwa is a province in the north-west of Pakistan and is home to 30.5 million people according to the 2017 census, an overwhelming majority of whom live in rural areas. Figure 1 shows KP’s location within Pakistan (in the small box) as well as the various districts within it in detail. The three districts we focus on – Charsadda, Mardan and Swabi – are adjacent to each other in the center of the map and are typical districts for KP Province. The provincial capital, Peshawar, is also nearby and provides access to key infrastructure, such as an airport, and the provincial government.
Pakistan is one of the largest producers of tobacco in the world, most of which is grown in KP. According to a 2016 report4 , the tobacco sector generates an annual income of approximately Rs. 300 billion
3 https://www.thenews.com.pk/print/852321-poverty-in-pakistan-up-from-4-4pc-to-5-4pc-wb 4 https://www.dawn.com/news/1303060
Living Income Report: Charsadda, Mardan, and Swabi districts in Khyber Pakhtunkhwa (KP) Pakistan
Anker Living Wage and Living Income Research Institute © Global Living Wage Coalition 7
(approximately 1% of Pakistan’s GDP) and provides livelihood for 1.2 million people, making it an economically important sector.
Source: Abdullah Ali Abbasi and Wikimedia Commons5
3. HOW LIVING INCOME IS ESTIMATED
There are several components that comprise a living income, as depicted in the chart below (Figure 2). Specifically, a living income is estimated by aggregating the costs of: (i) a low-cost nutritious diet, (ii) basic but decent healthy housing, (iii) all other needs (non-food and non-housing) at a minimal level of decency, and (iv) a small additional buffer for emergencies and sustainability. The latter is needed in case of any shocks and to prevent families from falling into poverty due to sudden changes, such as a serious illness or death in the family.
Additionally, as figure 2 indicates, the costs for a basic but decent life are for a typical reference size family. The next section details how this reference size family was determined.
5 https://commons.wikimedia.org/wiki/File:Districts_of_Khyber_Pakhtunkhwa,_Pakistan_with_district_names.png

Living Income Report: Charsadda, Mardan, and Swabi districts in Khyber Pakhtunkhwa (KP) Pakistan
Anker Living Wage and Living Income Research Institute © Global Living Wage Coalition 8
Figure 2: Components of a basic but decent life for a family (or the living income)
4. REFERENCE FAMILY SIZE
Estimating a living income for a typical family first requires determining a reference family size. This is because living income and living wage are family concepts and the unit of analysis is the nuclear family. We determined the reference family size by using data from the Pakistan Demographic and Health Survey (PDHS) 2017-18 on fertility rates and mortality rates as well as on average household size.
The total fertility rate for rural KP is adjusted for under-five mortality rate to arrive at the expected total number of surviving children per family. This is then used to arrive at an implied reference family size considering a nuclear family with two parents.
For rural KP, the mortality adjusted total fertility rate is 3.9. We then calculate implied family size (which is adding 2 adults to the mortality adjusted total fertility rate) as 5.9 or approximately 6 – that is, 2 adults and 4 children. Table 1 below provides the information used to arrive at this reference family size. Since the Anker methodology considers family sizes to be expressed in one-half persons for simplicity, we round off this family size from 5.9 to 6.
Table 1: Reference family size calculation based on total fertility rate and child mortality rate Total Fertility
Rate (TFR) Under-five mortality Rate (U5MR)
Mortality-Adjusted Total Fertility Rate
(TFR x (1-U5MR/1000))
Family Size (2 adults + Adjusted TFR)
Rural Khyber Pakhtunkhwa
4.20 69 3.9 5.9
Source: Authors’ calculations based on PDHS 2017-18 data
We also looked at average household size for rural KP from the Household Integrated Economic Survey (HIES) 2015-16. Table 2 below shows the percentage distribution of household size in KP (rural, urban, and total). Average household size is 5.71 (excluding single-person households that do not have children and households with 9 or more people which are very likely extended families with more than 2 possible adult workers). Rural and urban values are similar at 5.72 and 5.66.

Living Income Report: Charsadda, Mardan, and Swabi districts in Khyber Pakhtunkhwa (KP) Pakistan
Anker Living Wage and Living Income Research Institute © Global Living Wage Coalition 9
The above estimates of family size (based on fertility and mortality rates as well as average household size) are all similar and close to 6 persons. For this reason, we use a reference family size of 6 in this report.
Table 2: Average Household Size in Khyber Pakhtunkhwa for 2015-16 Number of persons in
household % households
Rural Urban Total
1 0.74% 1.02% 0.79%
2 2.48% 2.73% 2.53%
3 4.80% 5.11% 4.86%
4 8.48% 10.18% 8.80%
5 13.37% 15.21% 13.71%
6 16% 15.91% 15.98%
7 14.04% 14.96% 14.21%
8 10.69% 10.86% 10.72%
9 9.50% 6.86% 9%
10+ 19.90% 17.17% 19.39%
Average HH size, 2+ members 6.9 6.65 6.85
Average HH size excluding 1 person households and
households with 9+ members
5.72 5.66 5.71
Source: Authors’ calculations based on HIES 2015-16 data.

Living Income Report: Charsadda, Mardan, and Swabi districts in Khyber Pakhtunkhwa (KP) Pakistan
Anker Living Wage and Living Income Research Institute © Global Living Wage Coalition 10
SECTION II: COST OF A BASIC BUT DECENT LIFE FOR WORKER AND
FAMILY 5. FOOD COSTS
This section describes how food costs were estimated for the reference family in rural KP. We first outline the general principles used to develop a model diet, then describe the model diet, and finally estimate the costs of this diet using local food prices from our fieldwork.
5.1 General Principles Used to Develop the Model Diet
To develop the model diet, certain general principles were followed as below:
Nutritious: the model diet needs to have a sufficient number of calories, as well as meet internationally accepted standards of the distribution of macronutrients (carbohydrates, fats, and proteins). It should also have enough fruits and vegetables to ensure sufficient micro-nutrients as well as have limited amounts of oil and sugar.
Relatively low cost: the specific food items included in the model diet were kept as low cost as possible within the constraints of being nutritious, of acceptable quality, and consistent with local food preferences.
Consistent with local preferences: the model diet is consistent with the preferences of locals, as ascertained through interviews. This is done so that items which are not consumed as a norm are not included in our model diet, and sufficient quantities of those that are consumed regularly are included.
5.2 Model Diet
Developing a model diet is a detailed and complex undertaking, the first step of which is to estimate the number of calories required for the average person in our reference family. This was done using Schofield equations, which are used to estimate calories requirements based on current adult attained height in Pakistan as well as age, sex, and activity level of family members. In calculating this, we assumed that one worker in the family, who works on a farm such as a tobacco farm, has vigorous activity levels while the second adult, who may work part-time, has moderate activity levels. Children are assumed to have moderate activity levels as well. Using this method, the total calories per person per day required was determined to be 2224 for our reference family of 6.6
The next step in developing the model diet is to start with secondary data on the distribution of food consumption by major food groups to determine how much is typically consumed across each food group. This provides the basic structure of the local diet. We used data from HIES 2015-16 for rural KP to determine food consumption across twelve major food groups.7 These quantities were then assigned to specific food items within each food group, with the specific food items having been identified based on interviews with farmers on local food preferences, and local food market visits which indicated local
6 Source for average Pakistani male adult height: http://www.averageheight.co/average-male-height-by-country; Source for average Pakistani female adult height: http://www.averageheight.co/average-female-height-by-country. Accessed on 15th July 2021. 7 These major food groups are: cereals and grains; roots and tubers; pulses, legumes and beans; milk and dairy; eggs; meat and fish; vegetables; fruits; oil; sugar; nonalcoholic beverages; and others.
Living Income Report: Charsadda, Mardan, and Swabi districts in Khyber Pakhtunkhwa (KP) Pakistan
Anker Living Wage and Living Income Research Institute © Global Living Wage Coalition 11
availability and local food prices. These quantities are then adjusted so that the overall model diet meets the target number of calories required for our reference family member. For example, since the overall quantities consumed according to 2015-16 HIES data resulted in only 1477 total calories for the diet, and our model diet requires 2224 calories, each items’ quantity in our model diet at this point was multiplied by 2224/1477.
Finally, a number of other adjustments were made to quantities of items in our model diet for various reasons. These include for proper nutrition: (i) adjusting the model diet so that there is nutritional balance between macro nutrients (proteins, fats, carbohydrates), (ii) sufficient quantities of dairy (milk and yoghurt), (iii) sufficient quantities of fruits and vegetables and pulses, and (iv) restricted amounts of oil and sugar as recommended by WHO. Finally, the distribution of food items was adjusted to account for relative food prices so that the model diet is low in cost while maintaining its nutrition and its consistency with local preferences.
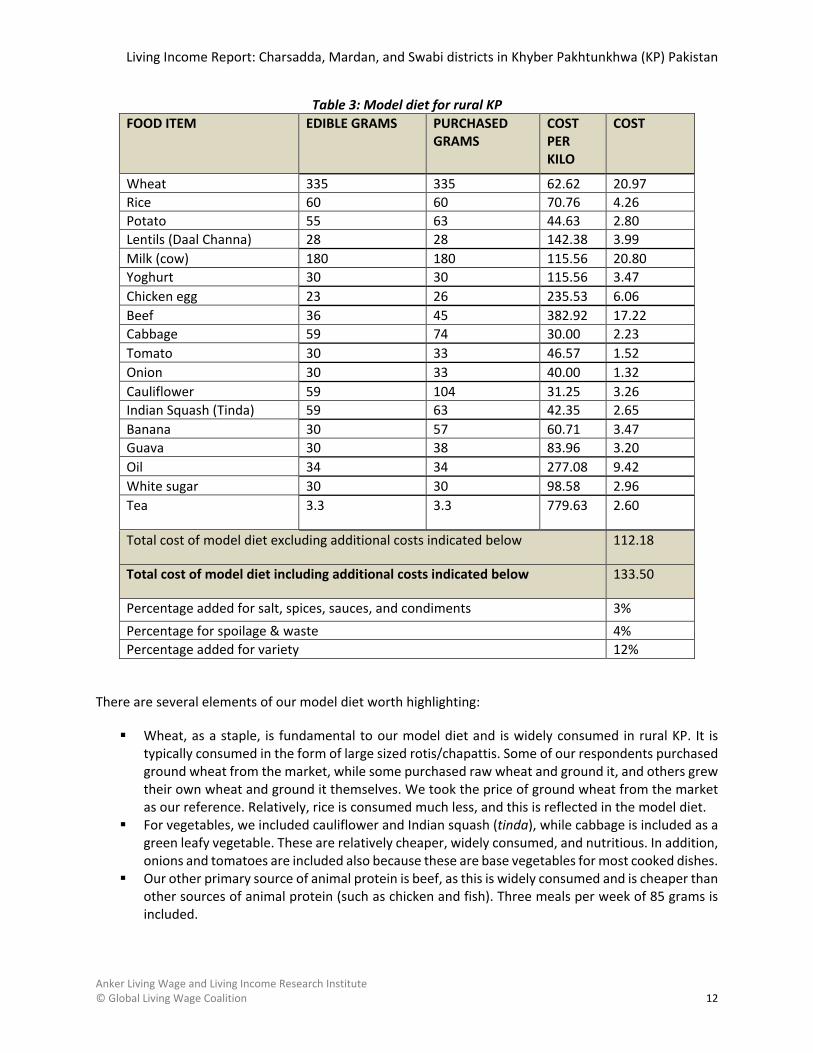
The model diet arrived at is shown in table 3 below. The nutritional content of each food item as well as their edible percentages is taken from the United States Department of Agriculture database.8 It should be pointed out that the quantities shown in table 3 are per day for each person in the reference family.
8 The two exceptions to percent edible are for potato and cauliflower, because the USDA’s values for edible proportion for these are much lower than what is typical for KP Pakistan. To determine proportion edible of potato and cauliflower, several items of each was weighed in its purchased form. Each item was then peeled and cut – the edible portion used for cooking – and weighed again. The edible weight after preparation was divided by the purchased weight to give us the proportion edible. The process was done separately for potato and cauliflower and repeated twice to ensure consistency. We used the average percent edible in our model diet.
Living Income Report: Charsadda, Mardan, and Swabi districts in Khyber Pakhtunkhwa (KP) Pakistan
Anker Living Wage and Living Income Research Institute © Global Living Wage Coalition 12
Table 3: Model diet for rural KP FOOD ITEM EDIBLE GRAMS PURCHASED
GRAMS COST PER KILO
COST
Wheat 335 335 62.62 20.97 Rice 60 60 70.76 4.26 Potato 55 63 44.63 2.80 Lentils (Daal Channa) 28 28 142.38 3.99 Milk (cow) 180 180 115.56 20.80 Yoghurt 30 30 115.56 3.47 Chicken egg 23 26 235.53 6.06 Beef 36 45 382.92 17.22 Cabbage 59 74 30.00 2.23 Tomato 30 33 46.57 1.52 Onion 30 33 40.00 1.32 Cauliflower 59 104 31.25 3.26 Indian Squash (Tinda) 59 63 42.35 2.65 Banana 30 57 60.71 3.47 Guava 30 38 83.96 3.20 Oil 34 34 277.08 9.42 White sugar 30 30 98.58 2.96 Tea 3.3 3.3 779.63 2.60
Total cost of model diet excluding additional costs indicated below 112.18
Total cost of model diet including additional costs indicated below 133.50
Percentage added for salt, spices, sauces, and condiments 3% Percentage for spoilage & waste 4% Percentage added for variety 12%
There are several elements of our model diet worth highlighting:
Wheat, as a staple, is fundamental to our model diet and is widely consumed in rural KP. It is typically consumed in the form of large sized rotis/chapattis. Some of our respondents purchased ground wheat from the market, while some purchased raw wheat and ground it, and others grew their own wheat and ground it themselves. We took the price of ground wheat from the market as our reference. Relatively, rice is consumed much less, and this is reflected in the model diet.
For vegetables, we included cauliflower and Indian squash (tinda), while cabbage is included as a green leafy vegetable. These are relatively cheaper, widely consumed, and nutritious. In addition, onions and tomatoes are included also because these are base vegetables for most cooked dishes.
Our other primary source of animal protein is beef, as this is widely consumed and is cheaper than other sources of animal protein (such as chicken and fish). Three meals per week of 85 grams is included.
Living Income Report: Charsadda, Mardan, and Swabi districts in Khyber Pakhtunkhwa (KP) Pakistan
Anker Living Wage and Living Income Research Institute © Global Living Wage Coalition 13
Dairy is included in the form of milk and yoghurt. Milk is widely consumed, particularly in tea, and is also included in our diet for consumption each day by children for its nutrients. Yoghurt is consumed often with meals – the model diet includes 30 grams, which is in line with secondary data.
We include eggs for consumption every alternate day as that is locally preferred. Banana and guava are included in our diets for fruits. These are rich in nutrients while also being
lower cost options. Tea is widely consumed in Pakistan, and we make a provision for 3 cups a day for adults and 1 cup
a day for children. We restrict sugar consumption at 30 grams per day, even though it is consumed in large quantities
locally (almost all our interviews reported high consumption). According to 2015/16 HIES data, the average consumption of sugar is 62 grams per person per day (around 15 teaspoons). This restriction is imposed because 30 grams per day is the maximum amount permissible for nutritional balance according to WHO.
To the total cost of our model diet, we have added 12% for variety, so as to enable consumption of other food items on occasion that may be slightly more expensive, and a minimal 4% for spoilage and waste. It should be noted that these are both conservative estimates. In addition, we also add 3% for salt, spices and condiments, as this is the percentage for in household expenditure data from HIES 2015-16.
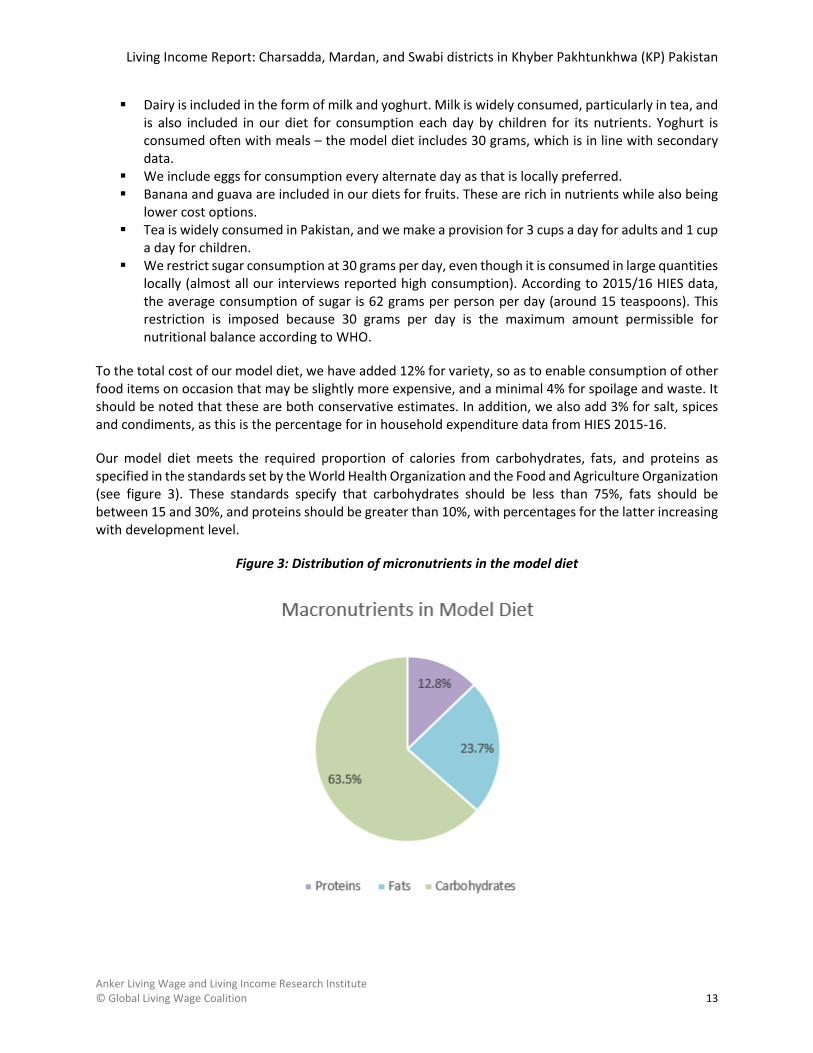
Our model diet meets the required proportion of calories from carbohydrates, fats, and proteins as specified in the standards set by the World Health Organization and the Food and Agriculture Organization (see figure 3). These standards specify that carbohydrates should be less than 75%, fats should be between 15 and 30%, and proteins should be greater than 10%, with percentages for the latter increasing with development level.
Figure 3: Distribution of micronutrients in the model diet
Living Income Report: Charsadda, Mardan, and Swabi districts in Khyber Pakhtunkhwa (KP) Pakistan
Anker Living Wage and Living Income Research Institute © Global Living Wage Coalition 14
5.3 Food Prices
The prices for our food items were estimated by conducting surveys of local markets in rural KP where farmers shop themselves. These markets were ascertained by interviewing them. Usually, these were small stalls and shops within easy commuting distance. As an example, see figures 4 and 5 which depict typical vendors in Charsadda and Mardan respectively.
In each of the three districts, at least 3 markets were visited. Further, within each market, prices from multiple shops were collected (at least 3 in each market for each food item). The average price from each market for each food item was then used to calculate the average price across the three districts. Note that along with prices, the average weights for each product were also collected using an electronic weighing scale when foods were not sold by the kilo. Although most foods were sold per kilogram, some were sold in other quantities (such as eggs per dozen). Thus, by collecting the weight (in grams), we were able to calculate the price per kilogram for those food items for use in our model diet.
In this way, we were able to estimate the prices of foods available in local markets – and to use these prices to cost our model diet. Furthermore, prices were collected in late March 2021, before the beginning of the Islamic month of Ramadan when food prices tend to rise.

Living Income Report: Charsadda, Mardan, and Swabi districts in Khyber Pakhtunkhwa (KP) Pakistan
Anker Living Wage and Living Income Research Institute © Global Living Wage Coalition 15
Figure 4: A vegetable vendor in Charsadda
Figure 5: A fruit seller in Mardan

Living Income Report: Charsadda, Mardan, and Swabi districts in Khyber Pakhtunkhwa (KP) Pakistan
Anker Living Wage and Living Income Research Institute © Global Living Wage Coalition 16
6. HOUSING
This section describes our minimum healthy housing standard for rural KP, which is a normative concept, and then estimates the costs for a house of this standard in rural KP.
6.1 Minimum Housing Standard
We estimate the cost for basic but acceptable housing by first setting minimum standards for housing for our typical family size of 6 persons (2 adults and 4 children). These are based on international standards which are adapted to the local context by using statistics on housing conditions in rural KP Pakistan (from the Demographic and Health Survey 2017-18 and the Pakistan Social and Living Standards Measurement Survey (PSLM) 2014-15). This housing standard, since it is a normative one, is also similar to that set for the Sialkot living wage study (Sayeed and Dawani 2017) for reasons of fairness.
The minimum housing standard we set includes the following:
Dwelling should have at least 60 sq. meters of covered area.9 Walls must be permanent and can be made of bricks with cement, only cement, or only brick.
Mud and stick walls are not acceptable. Roofs must be sturdy and made from reinforced cement concrete (RCC) or Tier-Girder to be of
acceptable quality. Roof without steel or cement is not acceptable. Floors should be made of cement or bricks, but not mud/earth or wood (latter is not commonly
used in Pakistan). Toilet facility can be pit with concrete slab or flush toilet connected to sewage or septic tank. One
bathroom with toilet and bathing facility is acceptable. Potable water (boring is acceptable if ground water is not contaminated). Gas is the acceptable cooking fuel. Wood is fine if there is proper ventilation. Electricity is necessary. The house should have adequate ventilation and natural light, with at least one window per room. Three bedrooms with one for adults and two for the 4 children. No specific separate living room
is required. One separate kitchen in addition to three bedrooms. Kitchen should have adequate ventilation and food storage area. Building should be in reasonable condition and made of permanent materials such that they are
durable. Building site cannot have a site hazard such as poor drainage or being subject to flooding.
To compare our housing standard with current living conditions, we use data from the PSLM 2014-15. The advantage of using PSLM is that it provides data at the district level, allowing us to compare our local healthy housing standard to local housing conditions for rural Pakistan, rural KP, and the rural areas of Charsadda, Mardan and Swabi as shown in table 4 below.
9 Rural homes are often large in KP. 60 sq. meters is the maximum recommended by the Anker methodology for lower-middle income countries and is sufficient for a basic but decent home. Please note that this is the living space, and the covered area, which includes walls, is bigger. Also, the actual compound with the outer wall can be much bigger to accommodate local cultural practices of chaar deewari (four walls) and have space for a courtyard.

Living Income Report: Charsadda, Mardan, and Swabi districts in Khyber Pakhtunkhwa (KP) Pakistan
Anker Living Wage and Living Income Research Institute © Global Living Wage Coalition 17
The data show that the current living conditions need to improve to match our housing standard above. For instance, more than 42% of the households in our target study districts use wood or bamboo for their roofs.
However, there are some optimistic results as well. This includes the fact that 77% of households in the three study districts use bricks or blocks for their wall, and 78% have a flush toilet. Both of these are higher than the figures for rural KP and rural Pakistan, suggesting that this region is slightly better off in some things (although for most other indicators, conditions are comparable).
Although it requires improvement from current living conditions, it should be noted that our housing standard is very basic. The bare minimum number of rooms is required given the family size and only necessities are included as part of the standard. This is evidenced by boring as an acceptable drinking water source (if ground water is not contaminated) and the reasonably small acceptable size of the dwelling. Thus, even on a living income, housing should be basic but decent and not extravagant.
Table 4: Current housing conditions in rural Pakistan, rural KP, and rural Charsadda, Mardan and Swabi based on data from PSLM 2014-15, and our local healthy housing standard
Housing characteristics Rural Pakistan %
Rural KP % Rural Charsadda, Mardan and Swabi (average) %
Comments and decisions on local acceptable healthy housing standard for each bolded characteristic
MATERIALS
Walls
Bricks with cement; cement; concrete block – Mud and mud brick not acceptable
Bricks/Blocks 69.2 54.7 77.3
Mud bricks/mud 23.3 17.6 20.4
Wood 2.2 0.7 0.0
Others 5.4 27.0 2.3
Roof
Pukka (i.e. Permanent), e.g. RCC (reinforced cement concrete), or Tier-Girder – without steel and/or cement is not acceptable
RCC 13.9 28.0 40.9
Wood/bamboo 37.0 46.6 42.3
Sheet/iron/cement 3.3 11.7 4.6
Tier iron/girder 44.7 13.1 12.3
Others 1.2 0.6 0.0
Floor N/A N/A N/A Cement or bricks – mud/earth and wood not acceptable
AMENITIES

Living Income Report: Charsadda, Mardan, and Swabi districts in Khyber Pakhtunkhwa (KP) Pakistan
Anker Living Wage and Living Income Research Institute © Global Living Wage Coalition 18
Housing characteristics Rural Pakistan %
Rural KP % Rural Charsadda, Mardan and Swabi (average) %
Comments and decisions on local acceptable healthy housing standard for each bolded characteristic
Toilet facility
Pit with slab or flush toilet connected to sewage or septic tank
Flush 60.0 71.0 78.3
Non-Flush 20.0 15.0 8.7
No Toilet 21.0 14.0 12.7
Water source
Potable water (boring is acceptable if ground water is not contaminated)
Tap Water 13.0 30.0 10.0
Hand pump 38.0 14.0 31.0
Motor pump 36.0 25.0 43.3
Dug Well 5.0 9.0 13.3
Others 9.0 22.0 2.0
VENTILATION & LIGHTING
Cooking fuel
Gas preferable, but wood is fine if there is proper ventilation.
Gas 15.8 13.5 18.4
Wood/sticks 73.4 84.9 79.6
Oil 0.1 0.1 0.1
Others 10.7 1.6 1.9
Lighting source
Electricity is necessary. But house should also be conducive to natural light, with at least one window per room.
Electricity 90.4 95.5 99.1
Gas/oil 5.8 1.2 0.7
Wood & Candle 1.1 0.3 0.1
Others 2.7 3.0 0.1
LIVING SPACE
Number of rooms

Living Income Report: Charsadda, Mardan, and Swabi districts in Khyber Pakhtunkhwa (KP) Pakistan
Anker Living Wage and Living Income Research Institute © Global Living Wage Coalition 19
Housing characteristics Rural Pakistan %
Rural KP % Rural Charsadda, Mardan and Swabi (average) %
Comments and decisions on local acceptable healthy housing standard for each bolded characteristic
1 29.7 16.7 18.6 In addition to 3 bedrooms, one separate kitchen. No separate living room necessary. 2-4 64.9 73.9 76.0
5+ 5.3 9.4 5.5
Number of bedrooms N/A N/A N/A 3 bedrooms – 1 for adults, and 2 for 4 children
Average number of square meters of living space
N/A N/A N/A 60 sq. meters living space (rural homes in KP are often larger than this, but 60 sq. meters is maximum recommended in the Anker methodology for lower-middle income countries)
Note: N/A indicates data are not available.
During visits to houses where tobacco farmers lived, there was variation in the size, structure, and condition of the houses that they lived in. Most houses did not have adequate ventilation, particularly in kitchens, or had too many people living together resulting in cramped spaces and overcrowding. For example, see figure 6 which shows a house in Charsadda with an indoor kitchen which is in the living room and is poorly ventilated. On the other hand, some houses were in relatively good condition and met most of the requirements. Figure 7 shows one farmer’s house in Swabi which had a permanent structure with adequate ventilation, as can be seen by the presence of several windows.

Living Income Report: Charsadda, Mardan, and Swabi districts in Khyber Pakhtunkhwa (KP) Pakistan
Anker Living Wage and Living Income Research Institute © Global Living Wage Coalition 20
Figure 6: A typical kitchen with poor ventilation in a farmer’s house in Charsadda
Figure 7: Acceptable farmer’s house in Swabi
6.2 Rental Equivalent Value for Basic Acceptable Housing
Housing costs for the living income benchmark were determined by summing the cost of (i) rental equivalent value, because rentals are not common and owner-occupied houses are common, and (ii) utility costs (gas, water, and electricity).
Typically, housing costs for a house that meets the local healthy housing standard defined in section 5a is typically determined by finding the cost to rent that house. However, this requires a well-established rental market. In rural areas of Pakistan, including in KP, rental markets do not exist or are not significant

Living Income Report: Charsadda, Mardan, and Swabi districts in Khyber Pakhtunkhwa (KP) Pakistan
Anker Living Wage and Living Income Research Institute © Global Living Wage Coalition 21
enough to rely on this method. This is also evidenced in household expenditure data – as PSLM 2014-15 data show that on average in rural Charsadda, Mardan and Swabi, 86% of the households own their house.
Therefore, to estimate the cost of housing in rural KP, similar to what was done in the earlier rural Sialkot living wage study (Sayeed and Dawani 2017), we use the user cost approach to estimating housing costs. This involves finding the cost of constructing a minimum acceptable house and making assumptions about the maintenances costs as well as the service lifetime of the house.
To estimate the cost of constructing a house of the standard specified earlier, we reached out to contractors and builders that operate in the rural areas of Charsadda, Mardan and Swabi. Each of the six builders selected (two in each district) had experience of construction in those areas. They were given our requirements and specifications and asked to provide a quotation for how much it would cost to build such a house. Their cost estimates included details on all of the costs associated with construction, including labour. This excluded the cost of land. We then computed the average across the six cost estimates obtained from the builders to arrive at an average cost of construction. This cost is Rs. 1,115,214 (approximately US$ 7,229). Estimates we gathered ranged from Rs. 745,000 to 1,466,286.
Assuming a life expectancy of 50 years, which is typical for developing countries, as well as 2% for annual maintenance (Anker and Anker, 2017), we can determine monthly user cost of housing. The formula used to estimate this is the following:
Annual Cost = (Cost of construction / 50 service year life expectancy) + (Cost of construction * 2% for maintenance)
Using this formula, we arrive at a ‘user cost’ of housing of Rs. 3,717 per month. This is the rental equivalent cost of housing we use in our living income estimate.
6.3 Utility Costs
Utilities – electricity, gas and water – are an important and significant component of housing costs and need to be accounted for as well. When interviewing farmers, we asked in detail how much they spend on each utility and their availability. Water was almost universally drawn from the ground and did not have any costs beyond those of the initial boring. Everyone interviewed had electricity connections, and some had even invested in solar panels for generating their own electricity. Thus, electricity costs varied among our interviewees, from Rs. 1,000 to Rs. 8,000 per month. Gas, on the other hand, had patchy coverage amongst our sample of farmers – some had access to it, but others did not and had to rely on firewood for cooking fuel. The firewood was sometimes sourced from the market and sometimes sourced from the farms they worked on.
Since we spoke to a limited number of farmers and there was large variation in utility costs reported by our respondents, as well as differences in source of the utilities, this created difficulties in comparing costs. For this reason, we decided to use secondary data to estimate the utility costs. This has the advantage of being a more reliable estimate, since it is based on a large sample of households.
We estimate these costs by calculating the share of household expenditures for utilities as a share of household expenditures for food. Multiplying this ratio by the costs of a living income model diet for our reference size family can then be used to compute the utility costs.

Living Income Report: Charsadda, Mardan, and Swabi districts in Khyber Pakhtunkhwa (KP) Pakistan
Anker Living Wage and Living Income Research Institute © Global Living Wage Coalition 22
According to HIES 2015-16, the ratio of expenditure on utilities to food for the 40th percentile in rural KP is 0.211. Multiplying this by the total costs of food based on our model diet in section 3, we arrive at utility costs of Rs. 5,141 per month.
6.4 Summary of Housing Costs
Our estimate of housing costs in rural KP is Rs. 8,858 US$ 57). Table 5 below summarizes these costs. The total housing cost is approximately 16% of total costs of living for the reference family, which is a couple of percentage points lower than the household expenditure on housing in secondary data (approximately 18% for rural KP in HIES 2015-16).
Table 5: Summary of Housing Costs (in Pakistani Rupees) User Cost Value 3,717
Utilities 5,141
Total Housing Cost 8,858
7. NON-FOOD NON-HOUSING COSTS
The third major component of a living income is the category described as non-food non-housing costs (NFNH), which includes expenses on a number of things, including education, health, transport, recreation, clothing and footwear, household contents and appliances, communication, and miscellaneous expenditures such as personal care.
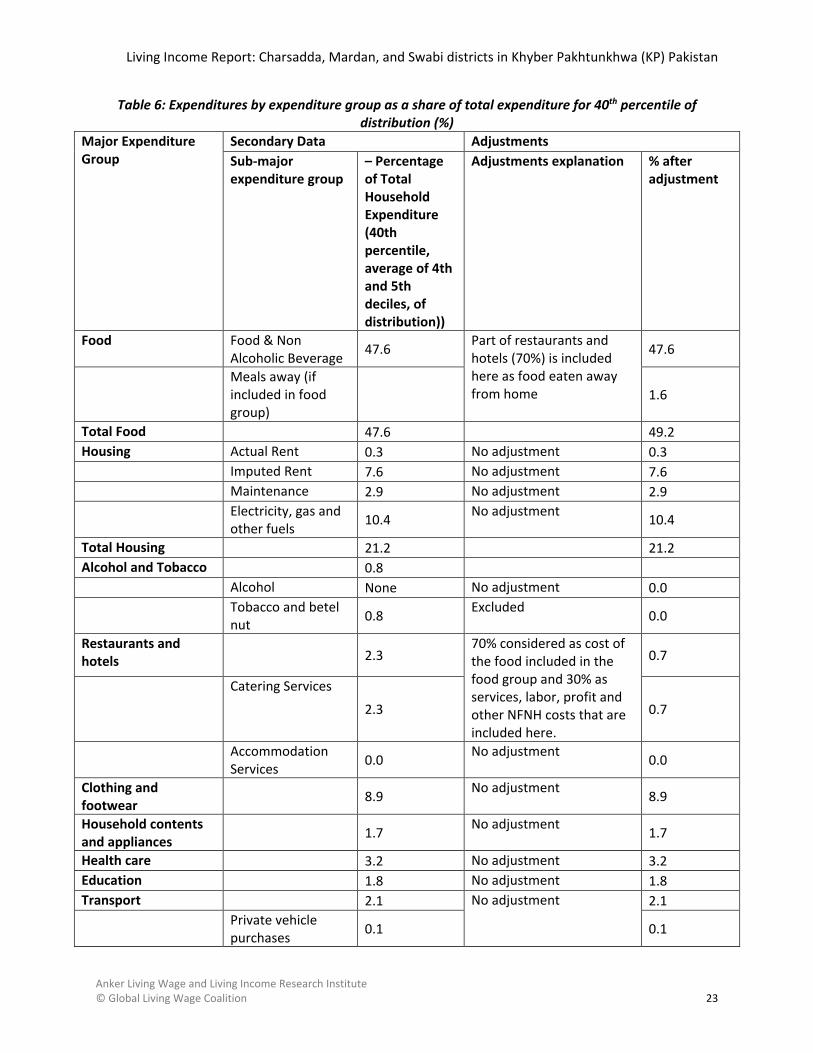
The first step is to obtain a preliminary estimate for NFNH expenditure by using secondary data. We use data from HIES 2015-16 to determine the ratio between expenditure on food and NFNH for households at the 40th percentile of the household income distribution (i.e., the average of the 4th and 5th deciles), which we feel is a reasonable place in the income distribution to use since it should be above poverty based on Pakistan’s income classification and development level. Table 6 shows the percentage share of total expenditure on major expenditure groups for the 40th percentile of rural KP households.
We make adjustments to this expenditure distribution by removing unnecessary expenditures from food and NFNH, such as expenses on tobacco and betel nut (approximately 0.8% in rural KP) as this expenditure is not considered essential for a basic but decent life. We also moved part of the cost of food purchased away from home (the cost of the food in such meals) to food expenditures. When doing this, we assumed that 70% of the value of meals purchased away from home is for the cost of the food in such meals and 30% is for services, profit and overhead. We did not make the usual adjustment of reducing transport by additional costs associated with private transport ownership and operation since this percentage in the target area is very low (0.5%) and, as discussed in the post check analysis (section 8), ownership of a motorbike in rural KP is common and the norm.
Living Income Report: Charsadda, Mardan, and Swabi districts in Khyber Pakhtunkhwa (KP) Pakistan
Anker Living Wage and Living Income Research Institute © Global Living Wage Coalition 23
Table 6: Expenditures by expenditure group as a share of total expenditure for 40th percentile of distribution (%)
Major Expenditure Group
Secondary Data Adjustments Sub-major expenditure group
– Percentage of Total Household Expenditure (40th percentile, average of 4th and 5th deciles, of distribution))
Adjustments explanation % after adjustment
Food Food & Non Alcoholic Beverage 47.6 Part of restaurants and
hotels (70%) is included here as food eaten away from home
47.6
Meals away (if included in food group)
1.6
Total Food 47.6 49.2 Housing Actual Rent 0.3 No adjustment 0.3 Imputed Rent 7.6 No adjustment 7.6 Maintenance 2.9 No adjustment 2.9 Electricity, gas and
other fuels 10.4 No adjustment 10.4
Total Housing 21.2 21.2 Alcohol and Tobacco 0.8 Alcohol None No adjustment 0.0 Tobacco and betel
nut 0.8 Excluded 0.0
Restaurants and hotels
2.3
70% considered as cost of the food included in the food group and 30% as services, labor, profit and other NFNH costs that are included here.
0.7
Catering Services
2.3 0.7
Accommodation Services 0.0 No adjustment 0.0
Clothing and footwear
8.9 No adjustment 8.9
Household contents and appliances
1.7 No adjustment 1.7
Health care 3.2 No adjustment 3.2 Education 1.8 No adjustment 1.8 Transport 2.1 No adjustment 2.1 Private vehicle
purchases 0.1 0.1

Living Income Report: Charsadda, Mardan, and Swabi districts in Khyber Pakhtunkhwa (KP) Pakistan
Anker Living Wage and Living Income Research Institute © Global Living Wage Coalition 24
Major Expenditure Group
Secondary Data Adjustments Sub-major expenditure group
– Percentage of Total Household Expenditure (40th percentile, average of 4th and 5th deciles, of distribution))
Adjustments explanation % after adjustment
Private vehicle operation 0.4 0.4
Public passenger transport 1.6 1.6
Communication 2.0 No adjustment 2.0 Recreation & Culture 0.8 No adjustment 0.8 Miscellaneous goods & services
7.6 No adjustment 7.6
Personal Effects 0.7 0.7 Personal Care 2.8 2.8 Others 4.1 4.1 TOTAL NFNH
28.8
TOTAL
99.2
The adjusted expenditure shares on food and NFNH and their ratio are presented in table 7A below. This compares very closely to the ratio we found for rural Sialkot in 2017 (0.583). This is also very similar to what is found for rural Pakistan as a whole (table 7B).
Table 7A: Share of non-food non-housing (NFNH) and food expenditures as percentage of total household expenditure using HIES 2015-16 data for Rural KP
Region NFNH (%) Food (%) NFNH/Food Ratio Rural KP 28.8 49.2 0.586
Table 7B: Share of non-food non-housing (NFNH) and food expenditures as percentage of total household expenditure using HIES 2011-12 data for Rural Pakistan
Region NFNH (%) Food (%) NFNH/Food Ratio
Rural 29.6 50.8 0.583
Source: Sayeed and Dawani 2017.
Living Income Report: Charsadda, Mardan, and Swabi districts in Khyber Pakhtunkhwa (KP) Pakistan
Anker Living Wage and Living Income Research Institute © Global Living Wage Coalition 25
Once this ratio has been determined, it is multiplied by the food costs estimated in section 3 to arrive at the preliminary NFNH estimate. This is Rs. 14,277 for rural KP.
The final step in computing the estimate for NFNH for our living income benchmark is to look carefully at expenditures for education, health care and transport based on primary data collected during our field research. This is because these are either human rights (education and health care) or vital expenses (transportation) and simply extrapolating from secondary data may reinforce and replicate existing poverty levels. Accordingly, this step (namely post-checks) involves ensuring that sufficient funds are allocated for these crucial expenses in NFNH. The next section explains how these post-checks were conducted and what adjustments were made to the preliminary NFNH estimate.
8. RAPID POST-CHECKS OF NON-FOOD AND NON-HOUSING COSTS
One way the Anker methodology ensures that a worker and their family can afford a decent standard of living is by checking the preliminary estimate of non-food non-housing (NFNH) costs, which is based on secondary data, against the information acquired from primary research. In this way, we ensure that our final estimate has sufficient funds for the universal human rights of health care and education.
Post-checks are carried out for health care, children’s education, and transport. Costs for these categories when extrapolated from secondary data could be underestimates because families may currently underspend on them due to not having sufficient income. In our living income estimate, we want to ensure that a basic but decent standard is met for these. The likelihood of the need for NFNH post check adjustments are especially relevant for Pakistan due to its poor education and health indicators.10 Therefore, we conducted post-checks using data from our field work for the cost of health care, education, and transport because they are necessary for decency.
To be sure, the preliminary estimate for NFNH also includes other expenditures (e.g., communication, furniture, recreation, and so on), but these are not considered to be as critical for decency. Hence, we assume for simplicity that the actual expenditure of rural KP households at the 40th percentile of the income distribution is reasonable for these categories.
The first step in conducting a post-check is to determine the share of health care, education and transport in the preliminary estimate of NFNH costs. For this, we calculated the ratio of the percentage expenditure on each category as a share of the adjusted NFNH percentage from the HIES 2105-16 data. Multiplying this ratio by our preliminary NFNH estimate for rural KP (Rs. 14,277) gave us the amount for each expenditure group included in our preliminary NFNH estimate. The calculations and results are presented in Table 8.
10 Pakistan has the world’s second highest number of out-of-school children with 20% of the children in KP (aged 5-16 years) having never attended school (PSLM 2018-19). Moreover, one in every 14 Pakistani children does not survive to their fifth birthday (PDHS 2017-18) and Pakistan is one of the last two countries in the world where polio is still endemic, indicating poor healthcare coverage.

Living Income Report: Charsadda, Mardan, and Swabi districts in Khyber Pakhtunkhwa (KP) Pakistan
Anker Living Wage and Living Income Research Institute © Global Living Wage Coalition 26
Table 8: Calculating amount implicitly included in preliminary NFNH estimate for health care, education, and transport for reference family (in Pakistani Rupees and USD)
Expenditure Group
% of expenditures for health care, education, and transport from
household income and expenditure
survey (1)
% of all expenditure for
NFNH after adjustments
(2)
Proportion of NFNH for health care, education, and transport in
NFNH
(1)/(2) = (3)
Amount per month implicitly included in
preliminary NFNH estimate for health care, education or transport (4) = (3) x Preliminary
NFNH Estimate
Health care 3.24 28.79
0.11 1,605 ($10.4) Education 1.78 0.06 881 ($5.7) Transport 2.14 0.07 1,063 ($6.9)
8.1 Health Care Post-Check
The public healthcare system in Pakistan has an extensive reach, including down to the sub-district level. State provided health care is free of charge but may include additional costs, such as those of medicines.
Since farmers reside in rural areas, distances to health care facilities are important factors in accessing adequate health care. Most of our key informants reported visiting a private doctor’s clinic, a pharmacy, or private medical practitioner in proximity to where they live, since almost all available secondary and hospital care facilities (private and public) are at a distance, usually in nearby urban centers. The government’s Basic Health Units (BHUs) – for primary care – are an exception, but these often suffer from poor quality and inadequate services. Thus, people usually pay for private sector health care, particularly for less serious or routine problems.
A recent development in the provision of state-sponsored health care has been the ‘Sehat Card Plus’ program, which is effectively a universal insurance scheme for residents of the KP province sponsored by the provincial government.11 This program provides free of cost health care – covering mostly in-patient services to all those who have a Computerized National Identity Card (CNIC) with their permanent address located in KP. However, very few of our key informants reported having access to this scheme and none had used it for various reasons. Some informed that services covered under the program were not the ones they required while others said the services were only available at designated facilities which were far away. Despite the lack of information or misinformation about this scheme, we decided to consider this in our post-check as providing universal provision for the more serious secondary and hospital care.
Most of the tobacco farmers we interviewed used both public and private health care facilities depending on their needs, but a majority of the farmers (21 out of 29) visited private facilities for out-patient services rather than public facilities. Our results are similar to that of the living wage study for Sialkot, where most of the workers we interviewed reported visiting public facilities for serious illnesses, emergencies or in-patient services such as surgery. On the other hand, workers and their household members visited nearby private clinics or pharmacies for more common illnesses and out-patient services.
11 https://sehatcardplus.gov.pk/faq/
Living Income Report: Charsadda, Mardan, and Swabi districts in Khyber Pakhtunkhwa (KP) Pakistan
Anker Living Wage and Living Income Research Institute © Global Living Wage Coalition 27
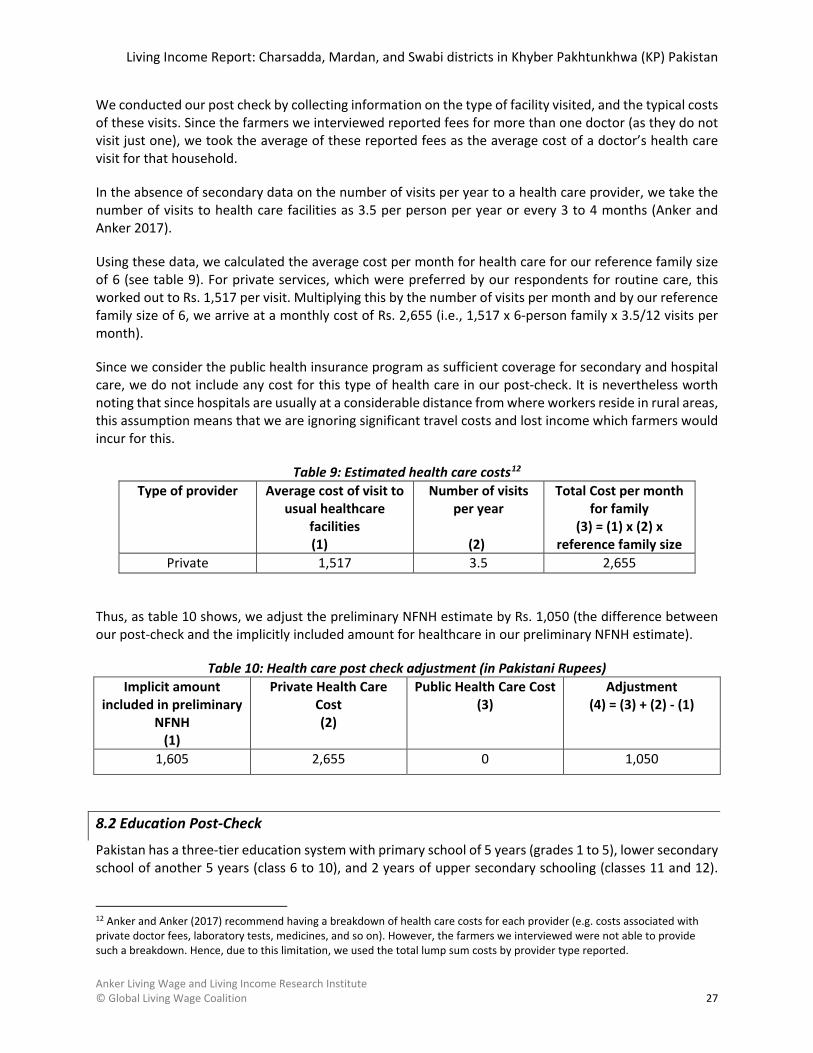
We conducted our post check by collecting information on the type of facility visited, and the typical costs of these visits. Since the farmers we interviewed reported fees for more than one doctor (as they do not visit just one), we took the average of these reported fees as the average cost of a doctor’s health care visit for that household.
In the absence of secondary data on the number of visits per year to a health care provider, we take the number of visits to health care facilities as 3.5 per person per year or every 3 to 4 months (Anker and Anker 2017).
Using these data, we calculated the average cost per month for health care for our reference family size of 6 (see table 9). For private services, which were preferred by our respondents for routine care, this worked out to Rs. 1,517 per visit. Multiplying this by the number of visits per month and by our reference family size of 6, we arrive at a monthly cost of Rs. 2,655 (i.e., 1,517 x 6-person family x 3.5/12 visits per month).
Since we consider the public health insurance program as sufficient coverage for secondary and hospital care, we do not include any cost for this type of health care in our post-check. It is nevertheless worth noting that since hospitals are usually at a considerable distance from where workers reside in rural areas, this assumption means that we are ignoring significant travel costs and lost income which farmers would incur for this.
Table 9: Estimated health care costs12 Type of provider Average cost of visit to
usual healthcare facilities (1)
Number of visits per year
(2)
Total Cost per month for family
(3) = (1) x (2) x reference family size
Private 1,517 3.5 2,655
Thus, as table 10 shows, we adjust the preliminary NFNH estimate by Rs. 1,050 (the difference between our post-check and the implicitly included amount for healthcare in our preliminary NFNH estimate).
Table 10: Health care post check adjustment (in Pakistani Rupees) Implicit amount
included in preliminary NFNH
(1)
Private Health Care Cost (2)
Public Health Care Cost (3)
Adjustment (4) = (3) + (2) - (1)
1,605 2,655 0 1,050
8.2 Education Post-Check
Pakistan has a three-tier education system with primary school of 5 years (grades 1 to 5), lower secondary school of another 5 years (class 6 to 10), and 2 years of upper secondary schooling (classes 11 and 12).
12 Anker and Anker (2017) recommend having a breakdown of health care costs for each provider (e.g. costs associated with private doctor fees, laboratory tests, medicines, and so on). However, the farmers we interviewed were not able to provide such a breakdown. Hence, due to this limitation, we used the total lump sum costs by provider type reported.

Living Income Report: Charsadda, Mardan, and Swabi districts in Khyber Pakhtunkhwa (KP) Pakistan
Anker Living Wage and Living Income Research Institute © Global Living Wage Coalition 28
Most schools do not have a tuition fee but may charge a small amount for registration and/or examination.
We interviewed tobacco farmers about expenditure on their children’s schooling, including on tuition, books, stationery, uniform, bags and so on. We excluded private sector schooling as state provided education is universal and we use that as our standard. We also excluded pocket/lunch money given to school going children since we have already included most of these food costs in our model diet. Finally, we also excluded costs for private tutoring as that was not the norm and we did not think it is required for decency.
To conduct the post-check calculation for education costs in our reference family, we estimated the average cost per month per school going child from our interview data. Ideally, this would be estimated by costing separately for each school level on the assumption that children attend school through secondary level. However, many of our respondents were not aware of the costs associated disaggregated by schooling level (primary and secondary) – in fact, in many instances they did not even know what grade their children were in. Further, most were also not able to provide costs disaggregated by different expenditure types (e.g., for uniforms, stationary, tuition, and so on). Due to this limitation, we use the aggregate cost of education incurred by them for their children and assume that our sample captures the spread over the schooling cycle sufficiently. After calculating the average cost per month per school going child, we then multiplied this per child cost by 4, which is the number of children in our reference family.
This calculation provides us with a total cost of Rs. 1,786 on education for our reference family. As table 11 shows, this is about two times the cost of education implicitly included in our preliminary NFNH estimate. Hence, we increased the NFNH costs by the difference of Rs. 904. This difference can be attributed in large part to the fact that many children in rural KP do not attend school whereas we consider children’s education through secondary school a human right.13
Table 11: Education post check adjustment (in Pakistani Rupees) Implicit amount included in
preliminary NFNH (1)
Rapid Post Check Estimate for Education
(2)
Adjustment (3) = (2) - (1)
881 1,786 904
8.3 Transport Post-Check
Transport is a vital expenditure for families, and it is important to include an adequate provision for it in our living income estimate for decency. We inquired about transport expenditure and usage in our fieldwork. Very few tobacco farmers we talked to reported using public transport, such as a coach (bus). In fact, almost all the farmers used household-owned motorcycles, along with the occasional use of public transport services for hire, such as chingchis (motorcycle rickshaws). In very few instances, tobacco farmers reported renting a car for long distances or emergencies. Monthly transport costs reported by tobacco farmers were therefore almost only for private transportation – primarily motorcycles – which is consistent with the fact that rural areas have minimal public transport coverage. It is also consistent with PDHS 2017-18 data on ownership of vehicles: 49.4% of households in rural Pakistan own a motorcycle/scooter and 6.4% own a car/truck (the majority thus have some form of private 13 The PDHS 2017-18 shows that the net attendance ratio at the primary level is 55.2 for rural KP, but this drops to 31.7 for the middle/secondary level. Thus, roughly half the children are out of school, while there is a continuous dropping out of school going children over time – the costs of schooling in secondary data are hence likely underestimated.

Living Income Report: Charsadda, Mardan, and Swabi districts in Khyber Pakhtunkhwa (KP) Pakistan
Anker Living Wage and Living Income Research Institute © Global Living Wage Coalition 29
transportation).14 With such ubiquitous usage of private transport, we feel that a motorcycle is thus required for decency.
We estimated the total cost of transport per month per person by summing the maintenance, fuel and repair costs per month as reported by farmers and dividing this total by the number of people in the household to get a per person cost. We then multiplied this estimate by our reference family size of 6, arriving at the final cost of Rs. 1,868, and compared this to the implicit amount for transport included in our preliminary NFNH cost estimate of Rs. 1,063. Therefore, we adjust this upward by the difference of Rs. 804 (table 12).
Table 12: Transport post check adjustment (in Pakistani Rupees) Implicit amount included in
preliminary NFNH (1)
Rapid Post Check Estimate for Transport
(2)
Adjustment (3) = (2) - (1)
1,063 1,868 804
9. PROVISION FOR UNEXPECTED EVENTS TO ENSURE SUSTAINABILITY
The final component of a living income is a provision for unexpected events. Workers can be thrown into poverty due to shocks, for instance from sudden illnesses, or poor harvest, or other unforeseen events. Hence, this provision is important to ensure sustainability and smooth consumption over time.
We include a 5 percent margin to the food, housing and NFNH costs estimated above, as recommended by Anker and Anker (2017: 230). This works out to Rs. 2,513 (US$ 16) per month for our reference family.
14 It is therefore likely that HIES data on expenditure on private transport is underestimated.

Living Income Report: Charsadda, Mardan, and Swabi districts in Khyber Pakhtunkhwa (KP) Pakistan
Anker Living Wage and Living Income Research Institute © Global Living Wage Coalition 30
SECTION III: THE LIVING INCOME FOR WORKERS 10. LIVING INCOME IN CONTEXT
This section indicates how our living income estimate compares with other important income and poverty benchmarks, such as the minimum wage in KP, the World Bank’s poverty lines, and some of the prevailing wages in Pakistan. Some of the benchmarks are for individuals (such as workers renumeration), therefore, to compare them to our living income estimate, we adjust them using our reference family size and number of full-time workers in reference family (see Annex 1).
10.1. Poverty Line Income
We calculated the income implied by the World Bank’s poverty line for lower-middle income country ($3.20 in internationally comparable dollars in purchasing power per day per person) for our reference family size. This works out to be Rs. 22,601 (i.e., 3.20 PPP x 38.7 PPP for Pakistan x 6-person family size x 365/12 days per month).
In addition, we also calculated the implied family income from Pakistan’s national poverty line, which was last determined in 2014 using HIES data. This uses a cost of basic needs approach and was determined to be Rs.3,030 per person in 2014.15 Updating for inflation, this is Rs. 4,545 in April 2021. We calculated the implied family income as Rs. 27,270 (i.e. 4,545 x 6-person family size).
10.2. Average Low Skilled Wage Income
For comparison, we also calculated the family income implied from several wage indicators. First, KP’s minimum wage in 2020-21 gives a family income of Rs. 25,900. This is calculated by multiplying the minimum wage per month (Rs.17,500) by the number of full-time equivalent workers per family (1.48).16
Second, the Economic Survey of Pakistan reports average daily wages for certain categories and certain cities. We use the only available value for a KP city – Peshawar – for our comparison, with the caveat that these are urban wages. The implied family income from the average daily wage for an unskilled worker in Peshawar in 2020-21 is Rs. 30,784 (i.e. Rs. 800 average daily wage x 26 working days per month x 1.48 number of full-time workers in our typical family).
Similarly, the family income derived from the average daily wage for a mason worker in Peshawar in 2020-21 is Rs. 54,972.
Finally, the family income implied by the average national wage for skilled agricultural, forestry and fishery workers, as reported in the LFS 2017-18 and updated to April 2021 for inflation, is Rs. 33,631.
10.3. Family Income Ladder: Comparing Incomes
Figure 8 provides a family income ladder that compares our living income to various family income estimates based on the above poverty line benchmarks and average wages. Our living income is 133% more than the World Bank $3.20 poverty line income, 94% more than the national poverty line income,
15 https://www.finance.gov.pk/survey/chapters_16/Annexure_III_Poverty.pdf 16 For details on the number of workers in our typical family, please see Annex 1.

Living Income Report: Charsadda, Mardan, and Swabi districts in Khyber Pakhtunkhwa (KP) Pakistan
Anker Living Wage and Living Income Research Institute © Global Living Wage Coalition 31
104% more than the income from KP’s minimum wage, and 57% more than the average national wage for skilled agricultural workers.
However, the implied monthly family income of the average daily wage for mason workers is actually slightly less than our living income. This should be taken with the caveat that we assume the workers are employed full-time (26 days per month), which is often not the case because they are daily wagers and do not always have work.
Furthermore, these differences do not imply our living income is extravagant. Rather, these differences are to be expected given the low levels of development in rural Pakistan and poor standards of living.
Figure 8: Family income ladder for living income per month for rural KP, in Pakistani Rupees
Source: Authors’ calculations
11. LIVING INCOME SUMMARY
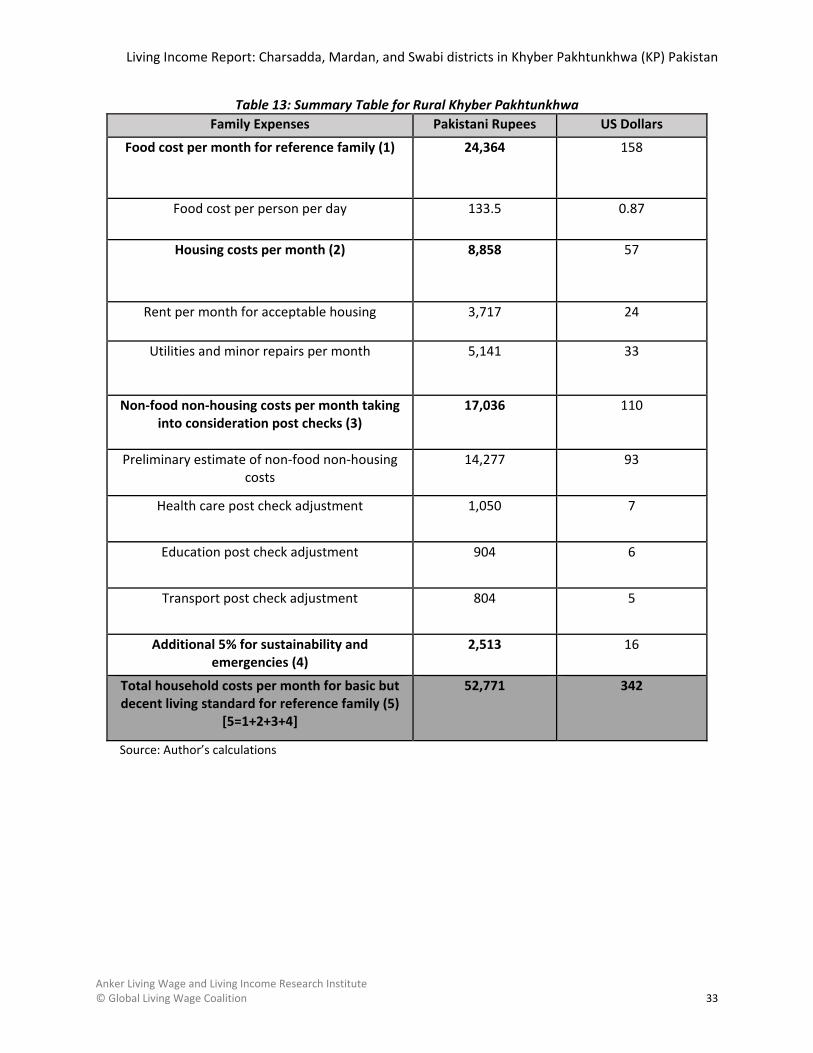
The living income we estimate is Rs. 52,771 (US$ 342) in March-April 2021 for our reference family size of 6 in rural KP. It is important to reiterate that this is the cost of living for a basic but decent standard for a typical size family in rural KP. In table 13 below, we present a summary of our results, including our estimated living income. The summary for our living wage estimate for rural KP is provided in Annex 1. It is worth noting that the living income and living wage for rural KP is higher than it would otherwise be because of the relatively large distances and isolated nature of rural areas in KP. This means, for example,
22,60127,270 25,900
33,63130,784
54,97252,771
0
10,000
20,000
30,000
40,000
50,000
60,000
Family Incomeat World Bank$3.20 Poverty
Line for Lower-Middle IncomeCountries such
as Pakistan
Family Incomeat National
Poverty Line
Family Incomeat Minimum
Wage KP
Family Incomeat Average
Monthly Wagefor Skilled
Agricultural,Forestry and
FisheryWorkers
Family Incomeat AverageWage forUnskilledWorker inPeshawer
Family Incomeat AverageWage for
Mason Workerin Peshawer
Living Incomefor rural KP
Family Income at PovertyLines
Family Income at Average Lower Skilled Wages Family LivingIncome
Paki
stan
i Rup
ees
Family Income Ladder
Living Income Report: Charsadda, Mardan, and Swabi districts in Khyber Pakhtunkhwa (KP) Pakistan
Anker Living Wage and Living Income Research Institute © Global Living Wage Coalition 32
that for decency that farmers and workers need a motorbike to get around and make greater use of private health facilities.
Conducting the research for this study during a pandemic was a challenging task and required adapting to public health guidelines along the way. We had to conduct interviews of farmers telephonically, and we had to rely on local researchers who we trained and monitored remotely to collect primary data on various components.
To estimate the food prices and other costs, we purposely made sure that we conducted our surveys of local markets before the Islamic month of Ramadan, when prices usually rise. Our model diet selected those food items in each food group that not only reflected local preferences and availability but were also among the lowest cost option and nutritious. Appropriate amounts of low-cost lentils along with eggs and dairy were included in the model diet, as well as the locally preferred beef for animal protein. A sufficient quantity of fruits and vegetables were also included to ensure that the diet fulfills nutritional requirements while also being affordable.
Typical current housing of tobacco farmers in Charsadda, Mardan, and Swabi is largely below the normative WHO, ILO and UN minimum standard for healthy housing required for decency. Issues include too many people living in one house or sharing a single room, poor ventilation especially for cooking, and structures that were in poor condition. The healthy housing standard we set out and estimated the cost for ensures that farmers can live in housing that is decent. It is important to note that our standard is not extravagant, but a basic minimum standard.
Finally, to avoid underestimating costs associated with healthcare and children’s education which we consider human rights, and transport which is vital, we conducted rapid post-checks of local costs for these to ensure a sufficient amount is included in our NFNH estimate for decent consumption of each of these. These post-checks were based on data collected during our fieldwork and led to an upward revision of the NFNH estimate, so that we do not replicate poverty levels by exclusively estimating costs from secondary survey data.
Despite conservative assumptions, our final living income is 133% more than the family income implied by the World Bank’s lower-middle income country $3.20 poverty line wage and 57% more than the income for our typical family size from the average national wage for agriculture, fishing and forestry workers. The living income is also 104% more than the minimum wage legislated in KP. These differences, however, are to be expected given the poverty levels in Pakistan and the poor standard of living. There is an urgent need for policymakers to implement policies and programs that can bridge this gap. As a starting point, the minimum wage could be rationalized based on our living income estimate (and accompanied living wage estimate in Annex 1). Furthermore, government policies could also include expanding social protection and delivering better public infrastructure which would be welfare-enhancing.
Some of the onus for bridging the gap to living income and living wage also lies on private businesses. As tobacco is exported, the international value chain should be responsible for ensuring that farmers and workers are fairly compensated so that they can have a basic but decent standard of living that ensures human dignity.
Finally, in closing it is also pertinent to point out that the living income is estimated for a particular point in time (March-April 2021 in our case). Hence, it will lose value over time and needs to be updated periodically and whenever it is being used as a benchmark by policymakers and businesses alike.
Living Income Report: Charsadda, Mardan, and Swabi districts in Khyber Pakhtunkhwa (KP) Pakistan
Anker Living Wage and Living Income Research Institute © Global Living Wage Coalition 33
Table 13: Summary Table for Rural Khyber Pakhtunkhwa Family Expenses Pakistani Rupees US Dollars
Food cost per month for reference family (1) 24,364 158
Food cost per person per day 133.5 0.87
Housing costs per month (2) 8,858 57
Rent per month for acceptable housing 3,717 24
Utilities and minor repairs per month 5,141 33
Non-food non-housing costs per month taking into consideration post checks (3)
17,036 110
Preliminary estimate of non-food non-housing costs
14,277 93
Health care post check adjustment 1,050 7
Education post check adjustment 904 6
Transport post check adjustment 804 5
Additional 5% for sustainability and emergencies (4)
2,513 16
Total household costs per month for basic but decent living standard for reference family (5)
[5=1+2+3+4]
52,771 342
Source: Author’s calculations

Living Income Report: Charsadda, Mardan, and Swabi districts in Khyber Pakhtunkhwa (KP) Pakistan
Anker Living Wage and Living Income Research Institute © Global Living Wage Coalition 34
Table 14: Key values and assumptions Exchange Rate of Pakistani Rupee to US Dollar17 154.3 Reference family size 6 Number of children in reference family 4 Number of full-time equivalent workers in reference family
1.48
Number of hours in normal week 48 Number of full-time workdays in a week 26
17 The exchange rate used is the three month average for March, April, and May 2021 from https://www.x-rates.com/average/?from=USD&to=PKR&amount=1&year=2021.

Living Income Report: Charsadda, Mardan, and Swabi districts in Khyber Pakhtunkhwa (KP) Pakistan
Anker Living Wage and Living Income Research Institute © Global Living Wage Coalition 35
REFERENCES Anker, Richard, and Martha Anker. 2017. Living Wages Around the World: Manual for Measurement.
Cheltenham, UK: Edward Elgar Publishing. https://www.e-elgar.com/shop/eep/preview/book/isbn/9781786431462/ (November 1, 2018).
Government of Pakistan. 2017. Household Integrated Economic Survey 2015-16. Islamabad. National Institute of Population Studies (NIPS) [Pakistan] and ICF. 2019. Pakistan Demographic and
Health Survey 2017-18. Islamabad, Pakistan, and Rockville, Maryland, USA: NIPS and ICF. Sayeed, Asad, and Kabeer Dawani. 2017. Living Wage Report: Urban and Rural North Eastern Pakistan.
London: Global Living Wage Coalition.

Living Income Report: Charsadda, Mardan, and Swabi districts in Khyber Pakhtunkhwa (KP) Pakistan
Anker Living Wage and Living Income Research Institute © Global Living Wage Coalition 36
APPENDIX 1. LIVING WAGE ESTIMATE FOR RURAL KP, PAKISTAN This report has focused on the living income required for a typical family in rural KP. In this annex, using the living income benchmark, we estimate the living wage required for decency for rural KP. A living wage has been defined by the Anker methodology and the Global Living Wage Coalition as follows:
“The remuneration received for a standard workweek by a worker in a particular place sufficient to afford a decent standard of living for the worker and her or his family. Elements of a decent standard of living include food, water, housing, education, health care, transportation, clothing, and other essential needs including provision for unexpected events.”18
The definition makes clear that this wage is not extravagant, but rather covers at a basic but decent level the needs of an individual and their family. We have already estimated the costs of a basic but decent life for a worker and their family – the living income – and can use this to estimate the living wage.
Since living wage is a family concept, it is reasonable to expect that more than one person in the family works and generates income. Whereas other methodologies have assumed that one person in the family works (the male breadwinner) or two workers are gainfully employed (both spouses work year-round), the Anker methodology adopts a different approach. It uses more than one worker but less than two full-time adult workers because of part-time work, unemployment, and voluntary inactivity. The next subsection explains how the number of workers per family is estimated.
A1.1 Number of workers per family
This section describes the method used to estimate the number of workers per family in rural KP.
We gathered data on labor force participation rates (LFPR), part-time employment rates, and unemployment rates from Pakistan’s Labour Force Surveys (2017-18 and 2014-15). The following formula was then used to determine the probability that a person in the prime working age is a full-time worker.
𝑃𝑃𝑃𝑃𝑃𝑃𝑃𝑃𝑃𝑃𝑃𝑃𝑃𝑃𝑃𝑃𝑃𝑃𝑃𝑃𝑃𝑃 𝑝𝑝𝑝𝑝𝑃𝑃𝑝𝑝𝑃𝑃𝑝𝑝 𝑃𝑃𝑎𝑎𝑝𝑝 25 − 59 𝑃𝑃𝑝𝑝 𝑃𝑃 𝑓𝑓𝑓𝑓𝑃𝑃𝑃𝑃 − 𝑃𝑃𝑃𝑃𝑡𝑡𝑝𝑝 𝑤𝑤𝑃𝑃𝑃𝑃𝑤𝑤𝑝𝑝𝑃𝑃 = 𝐿𝐿𝐿𝐿𝑃𝑃𝐿𝐿 𝑃𝑃𝑎𝑎𝑝𝑝𝑝𝑝 25 − 59 × (1 − 𝑈𝑈𝑝𝑝𝑝𝑝𝑡𝑡𝑝𝑝𝑃𝑃𝑃𝑃𝑃𝑃𝑡𝑡𝑝𝑝𝑝𝑝𝑃𝑃 𝑃𝑃𝑃𝑃𝑃𝑃𝑝𝑝 𝑃𝑃𝑎𝑎𝑝𝑝𝑝𝑝 25 − 59) × (1.0 − (𝑃𝑃𝑃𝑃𝑃𝑃𝑃𝑃 − 𝑃𝑃𝑃𝑃𝑡𝑡𝑝𝑝 𝑝𝑝𝑡𝑡𝑝𝑝𝑃𝑃𝑃𝑃𝑃𝑃𝑡𝑡𝑝𝑝𝑝𝑝𝑃𝑃 𝑃𝑃𝑃𝑃𝑃𝑃𝑝𝑝/2))
This is based on the idea that the higher the LFPR, the lower the unemployment rate, and the lower the part-time employment rate, the higher the probability that an adult family member is working full-time. We then add this probability to 1 (the full-time worker we assume) to arrive at the estimate for the number of full-time equivalent workers in our typical family.
18 https://www.globallivingwage.org/about/what-is-a-living-wage/

Living Income Report: Charsadda, Mardan, and Swabi districts in Khyber Pakhtunkhwa (KP) Pakistan
Anker Living Wage and Living Income Research Institute © Global Living Wage Coalition 37
Table A1: Data and computation for estimating number of full-time equivalent workers in our reference family
Males Females
Labour Force Participation Rate ages 25-59 95.5 16.8
Unemployment Rate ages 25-59 5.9 6.0
Part-time Employment Rate ages 25-59 19.1 18.3
Probability person is a full-time worker 0.81 0.14
Combined probability for males and females 0.48
Number of full-time equivalent workers for reference family
1.48
Source: Authors calculations based on Labour Force Survey (2014-15 and 2017-18) data.
As Table A1 shows, the probability of a person aged 25-59 (the working age) being a full-time worker is 0.48. When added to the full-time worker – who works in tobacco farming in our reference sector – the number of full-time equivalent workers in our typical family is 1.48.
A1.2. Living wage estimate
We estimate the net living wage by dividing the total family cost for a basic but decent living standard (the living income) by the number of full-time equivalent workers in our typical family.
Dividing our living income (Rs. 52,771) by the number of workers in our typical family (1.48), we arrive at a net living wage of Rs. 35,656 (US$ 231). This is shown in table A2. The net living wage is the required take-home pay for workers after all mandatory deductions and taxes have been collected. However, since workers have a mandatory deduction from pay equal to 1% of minimum wage, and the living wage falls below the minimum income tax threshold19, we increased the gross for rural KP to Rs. 35,831 (US$ 232).
19 The minimum personal income tax threshold for salaried individuals is Rs. 600,000 per annum.

Living Income Report: Charsadda, Mardan, and Swabi districts in Khyber Pakhtunkhwa (KP) Pakistan
Anker Living Wage and Living Income Research Institute © Global Living Wage Coalition 38
Table A2: Living wage estimate PKR USD
Costs of a basic but decent living standard for our typical family (1) 52,771 342
Number of full-time workers in our typical family (2) 1.48
Net Living Wage (required take-home pay for workers) [(3) = (1)/(2)] 35,656 231
Social security contribution (4) 175 1
Gross Living Wage (5) = (3)+(4) 35,831 232
Source: Author’s calculations.
Related Documents