To find more resources for your home, family or business, visit the College of Agriculture and Home Economics on the World Wide Web at www.cahe.nmsu.edu. New Mexico State University is an equal opportunity/affirmative action employer and educator. NMSU and the U.S. Department of Agriculture cooperating. August 2005 Las Cruces, NM Live Cattle Imports by Port of Entry from Mexico into the United States: Data and Models College of Agriculture and Home Economics Agricultural Experiment Station • Bulletin 788 Department of Agricultural Economics and Agricultural Business N E W M E X I C O S T A E U N I V E R S I T Y T ®

Welcome message from author
This document is posted to help you gain knowledge. Please leave a comment to let me know what you think about it! Share it to your friends and learn new things together.
Transcript

To find more resources for your home, family or business, visit the College of Agriculture and Home Economics on the World Wide Web at www.cahe.nmsu.edu.
New Mexico State University is an equal opportunity/affirmative action employer and educator. NMSU and the U.S. Department of Agriculture cooperating.
August 2005Las Cruces, NM
Live Cattle Imports by Port of Entry from Mexico into the United States: Data and Models
College ofAgriculture and Home Economics
Agricultural Experiment Station • Bulletin 788
Department of Agricultural Economics and Agricultural Business
NE
W
MEX ICO
STA
E
U
NIVE RSI T
Y
T
®

Table of ContentsIntroduction............................................................................1Cattle.Trade.and.NAFTA........................................................1Data,.Procedures.and.Results..................................................4High.Volume.Ports.of.Entry....................................................6Low.Volume.Ports.of.Entry.....................................................72003.Data.............................................................................12Updated.Regression.Models..................................................14Summary.and.Conclusion.....................................................20References.............................................................................21Appendix.A:.Import.Data.by.Port.of.Entry...........................23Appendix.B:.Independent.Variables.......................................31Appendix.C:.Charts.of.Independent.Variables.......................37

1
Live Cattle Imports by Port of Entry from Mexico into the United States: Data and Models1 Christie Guinn, Graduate Research AssistantRhonda Skaggs, Professor
INTRODUCTIONIn the late 1990s, the U.S. Department of Agriculture, Animal and Plant Health Inspection Service (USDA-APHIS), commissioned a study of the factors that infl uence feeder cattle movements from Mexico into the United States. This commission was the basis of master’s thesis research by Mitchell (2000). The goal of the study, using data from 1994 to 1998, was to provide the agency with information for each port of entry to aid them in addressing ques-tions related to allocation of inspection services, budget concerns and personnel needs (Mitchell 2000). Simple regression models were formulated and provided previously unavailable insight into U.S.-Mexico cattle trade. More recently, Mitchell’s work was revisited, additional data were obtained and the regression models were re-estimated using data for 1994 through 2003. The objec-tive of re-estimating the models was to further examine the factors infl uencing feeder cattle movements from Mexico to the United States. This report presents the results of the model re-estimation, and also presents all data used in the analysis.
CATTLE TRADE AND NAFTAImplementation of the North American Free Trade Agreement (NAFTA) in 1994 led to signifi cant increases in agricultural trade between the United States and Mexico; total agricultural trade was $13.74 billion in 2002, up from $7.48 billion in 1994 (USDA-FAS 2003). Much of this increase is a result of economic growth in the United States and Mexico and reductions in trade barriers
1 This report was prepared by Christie Guinn, B.S., in partial fulfi llments of requirements for the Master of Agriculture–Agribusiness degree. The report was prepared under the direction of Dr. Rhonda Skaggs, Professor, Department of Agricultural Economics and Agricultural Business, New Mexico State University. This publication was prepared with fi nancial support from a U.S. Department of Agriculture Economic Research Service cooperative agreement and the New Mexico Agricultural Experiment Station.
2 3
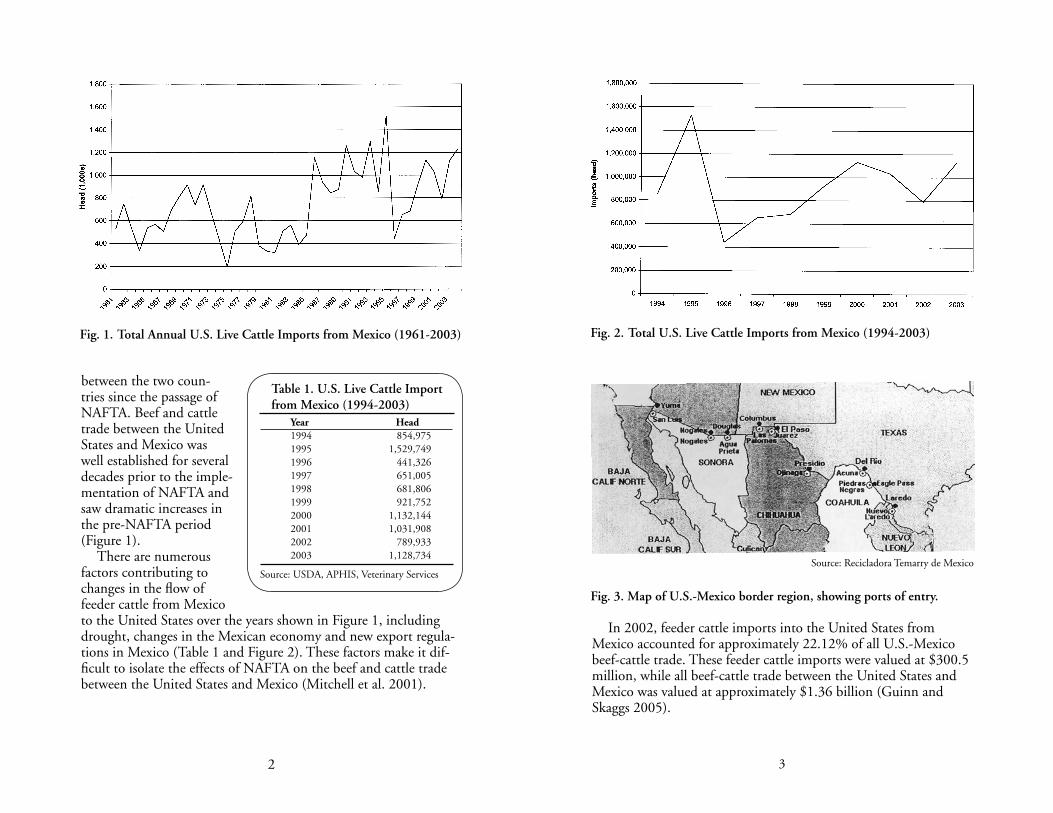
Fig. 1. Total Annual U.S. Live Cattle Imports from Mexico (1961-2003) Fig. 2. Total U.S. Live Cattle Imports from Mexico (1994-2003)
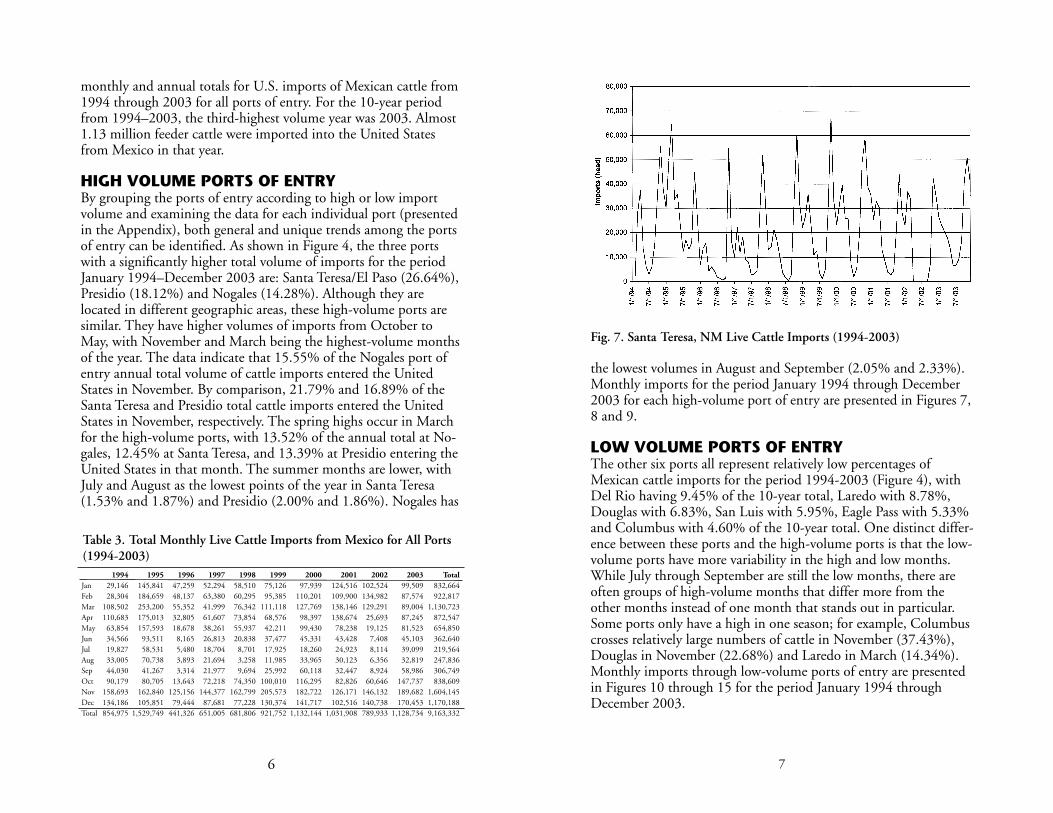
Fig. 3. Map of U.S.-Mexico border region, showing ports of entry.
between the two coun-tries since the passage of NAFTA. Beef and cattle trade between the United States and Mexico was well established for several decades prior to the imple-mentation of NAFTA and saw dramatic increases in the pre-NAFTA period (Figure 1).
There are numerous factors contributing to changes in the fl ow of feeder cattle from Mexico to the United States over the years shown in Figure 1, including drought, changes in the Mexican economy and new export regula-tions in Mexico (Table 1 and Figure 2). These factors make it dif-fi cult to isolate the effects of NAFTA on the beef and cattle trade between the United States and Mexico (Mitchell et al. 2001).
In 2002, feeder cattle imports into the United States from Mexico accounted for approximately 22.12% of all U.S.-Mexico beef-cattle trade. These feeder cattle imports were valued at $300.5 million, while all beef-cattle trade between the United States and Mexico was valued at approximately $1.36 billion (Guinn and Skaggs 2005).
Table 1. U.S. Live Cattle Import from Mexico (1994-2003)
Year Head1994 854,9751995 1,529,7491996 441,3261997 651,0051998 681,8061999 921,7522000 1,132,1442001 1,031,9082002 789,9332003 1,128,734
Source: USDA, APHIS, Veterinary ServicesSource: Recicladora Temarry de Mexico

4 5
DATA, PROCEDURES AND RESULTSThis updated study focused on the nine ports of entry with signifi -cant numbers of cattle imports. These ports are: Douglas, Nogales, and San Luis, Arizona; Columbus and Santa Teresa, New Mexico; Del Rio, Eagle Pass, Laredo, and Presidio, Texas. Figure 3 shows the location of these ports of entry.
As in the original study, data for live cattle imports were ob-tained from USDA-APHIS in the form of a monthly sum for each
Table 2. Percentage of Mexican CattleImports by U.S. Port of Entry (1994-2003)Port of Entry Head % TotalDouglas 626,004 6.83% Nogales 1,308,903 14.28% San Luis 545,629 5.95% Columbus 421,824 4.60% Santa Teresa 2,441,366 26.64% Del Rio 866,353 9.45% Eagle Pass 488,383 5.33% Laredo 804,546 8.78% Presidio 1,660,324 18.12% Total 9,163,332 100.00%
Source: USDA, APHIS, Veterinary Services
port of entry. The totals by port of entry for the period January 1994 through December 2003 are shown in Figure 4 and Table 2.
There is a marked seasonal pattern in U.S. cattle imports from Mexico. Generally, all nine ports of entry have higher numbers of cattle crossing into the United States between October and May and fewer imports from June to September. The seasonal pattern is visible in both Figure 5 (for the longer period of 1972-2003) and Figure 6 (January 1994–December 2003). Table 3 shows the
Fig. 4. Percentage of U.S. Cattle Imports from Mexico Among Nine Ports of Entry (1994-2003) (10 years total=9,163,332 head).
Douglas6.83%
Nogales14.28%
San Luis5.95%
Columbus4.60%
Santa Teresa
26.64%
Presidio18.12%
Laredo8.78%
Eagle Pass5.33%
Del Rio9.45%
Fig. 6. Total U.S. Live Cattle Imports from Mexico by Month (1994-2003).
Fig. 5. Total U.S. Live Cattle Imports from Mexico (1972-2003)
6 7
monthly and annual totals for U.S. imports of Mexican cattle from 1994 through 2003 for all ports of entry. For the 10-year period from 1994–2003, the third-highest volume year was 2003. Almost 1.13 million feeder cattle were imported into the United States from Mexico in that year.
HIGH VOLUME PORTS OF ENTRYBy grouping the ports of entry according to high or low import volume and examining the data for each individual port (presented in the Appendix), both general and unique trends among the ports of entry can be identifi ed. As shown in Figure 4, the three ports with a signifi cantly higher total volume of imports for the period January 1994–December 2003 are: Santa Teresa/El Paso (26.64%), Presidio (18.12%) and Nogales (14.28%). Although they are located in different geographic areas, these high-volume ports are similar. They have higher volumes of imports from October to May, with November and March being the highest-volume months of the year. The data indicate that 15.55% of the Nogales port of entry annual total volume of cattle imports entered the United States in November. By comparison, 21.79% and 16.89% of the Santa Teresa and Presidio total cattle imports entered the United States in November, respectively. The spring highs occur in March for the high-volume ports, with 13.52% of the annual total at No-gales, 12.45% at Santa Teresa, and 13.39% at Presidio entering the United States in that month. The summer months are lower, with July and August as the lowest points of the year in Santa Teresa (1.53% and 1.87%) and Presidio (2.00% and 1.86%). Nogales has
1994 1995 1996 1997 1998 1999 2000 2001 2002 2003 TotalJan 29,146 145,841 47,259 52,294 58,510 75,126 97,939 124,516 102,524 99,509 832,664Feb 28,304 184,659 48,137 63,380 60,295 95,385 110,201 109,900 134,982 87,574 922,817Mar 108,502 253,200 55,352 41,999 76,342 111,118 127,769 138,146 129,291 89,004 1,130,723Apr 110,683 175,013 32,805 61,607 73,854 68,576 98,397 138,674 25,693 87,245 872,547May 63,854 157,593 18,678 38,261 55,937 42,211 99,430 78,238 19,125 81,523 654,850Jun 34,566 93,511 8,165 26,813 20,838 37,477 45,331 43,428 7,408 45,103 362,640Jul 19,827 58,531 5,480 18,704 8,701 17,925 18,260 24,923 8,114 39,099 219,564Aug 33,005 70,738 3,893 21,694 3,258 11,985 33,965 30,123 6,356 32,819 247,836Sep 44,030 41,267 3,314 21,977 9,694 25,992 60,118 32,447 8,924 58,986 306,749Oct 90,179 80,705 13,643 72,218 74,350 100,010 116,295 82,826 60,646 147,737 838,609Nov 158,693 162,840 125,156 144,377 162,799 205,573 182,722 126,171 146,132 189,682 1,604,145Dec 134,186 105,851 79,444 87,681 77,228 130,374 141,717 102,516 140,738 170,453 1,170,188Total 854,975 1,529,749 441,326 651,005 681,806 921,752 1,132,144 1,031,908 789,933 1,128,734 9,163,332
Table 3. Total Monthly Live Cattle Imports from Mexico for All Ports (1994-2003)
Fig. 7. Santa Teresa, NM Live Cattle Imports (1994-2003)
the lowest volumes in August and September (2.05% and 2.33%). Monthly imports for the period January 1994 through December 2003 for each high-volume port of entry are presented in Figures 7, 8 and 9.
LOW VOLUME PORTS OF ENTRYThe other six ports all represent relatively low percentages of Mexican cattle imports for the period 1994-2003 (Figure 4), with Del Rio having 9.45% of the 10-year total, Laredo with 8.78%, Douglas with 6.83%, San Luis with 5.95%, Eagle Pass with 5.33% and Columbus with 4.60% of the 10-year total. One distinct differ-ence between these ports and the high-volume ports is that the low-volume ports have more variability in the high and low months. While July through September are still the low months, there are often groups of high-volume months that differ more from the other months instead of one month that stands out in particular. Some ports only have a high in one season; for example, Columbus crosses relatively large numbers of cattle in November (37.43%), Douglas in November (22.68%) and Laredo in March (14.34%). Monthly imports through low-volume ports of entry are presented in Figures 10 through 15 for the period January 1994 through December 2003.

8 9
Fig. 9. Nogales, AZ Live Cattle (1994-2003)
Fig. 10. Del Rio, TX Live Cattle Imports (1994-2003)
Fig. 11. Laredo, TX Live Cattle Imports (1994-2003)
Fig. 8. Presidio, TX Live Cattle (1994-2003)

10 11
Fig. 12. Douglas, AZ Live Cattle Imports (1994-2003)
Fig. 13. San Luis, AZ Live Cattle Imports (1994-2003)
Fig. 14. Eagle Pass, AZ Live Cattle Imports (1994-2003)
Fig. 15. Columbus, NM Live Cattle Imports (1994-2003)
12 13
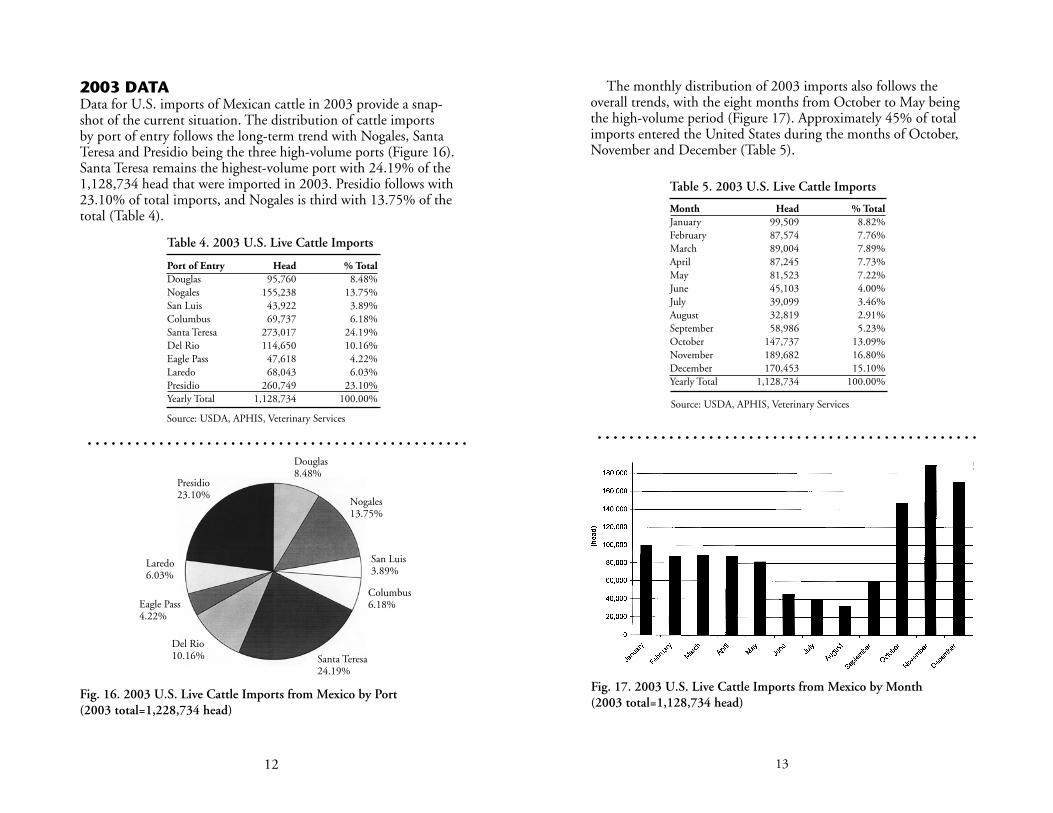
2003 DATAData for U.S. imports of Mexican cattle in 2003 provide a snap-shot of the current situation. The distribution of cattle imports by port of entry follows the long-term trend with Nogales, Santa Teresa and Presidio being the three high-volume ports (Figure 16). Santa Teresa remains the highest-volume port with 24.19% of the 1,128,734 head that were imported in 2003. Presidio follows with 23.10% of total imports, and Nogales is third with 13.75% of the total (Table 4).
Fig. 16. 2003 U.S. Live Cattle Imports from Mexico by Port (2003 total=1,228,734 head)
Presidio23.10%
Laredo6.03%
Santa Teresa24.19%
Douglas8.48%
Eagle Pass4.22%
Del Rio10.16%
Nogales13.75%
San Luis3.89%
Columbus6.18%
Month Head % TotalJanuary 99,509 8.82%February 87,574 7.76%March 89,004 7.89%April 87,245 7.73%May 81,523 7.22%June 45,103 4.00%July 39,099 3.46%August 32,819 2.91%September 58,986 5.23%October 147,737 13.09%November 189,682 16.80%December 170,453 15.10%Yearly Total 1,128,734 100.00%
Table 5. 2003 U.S. Live Cattle Imports
Source: USDA, APHIS, Veterinary Services
The monthly distribution of 2003 imports also follows the overall trends, with the eight months from October to May being the high-volume period (Figure 17). Approximately 45% of total imports entered the United States during the months of October, November and December (Table 5).
Fig. 17. 2003 U.S. Live Cattle Imports from Mexico by Month(2003 total=1,128,734 head)
Source: USDA, APHIS, Veterinary Services
Port of Entry Head % TotalDouglas 95,760 8.48%Nogales 155,238 13.75%San Luis 43,922 3.89%Columbus 69,737 6.18%Santa Teresa 273,017 24.19%Del Rio 114,650 10.16%Eagle Pass 47,618 4.22%Laredo 68,043 6.03%Presidio 260,749 23.10%Yearly Total 1,128,734 100.00%
Table 4. 2003 U.S. Live Cattle Imports

14 15
UPDATED REGRESSION MODELSMitchell (2000) estimated separate simple regression models for each of the nine live cattle ports of entry along the U.S.-Mexico border. The objective of the research was to provide insight into factors infl uencing cattle imports into the United States at each point of entry. Mitchell’s (2000) models were estimated using monthly data for the period January 1994–December 1998. The model equations were specifi ed with monthly numbers of live cattle imported at each port as the dependent variable, with different in-dependent variables selected for each model equation. The ratio of U.S. live cattle nominal price to Mexican live cattle nominal price (in U.S. dollars), a linear trend variable, and cumulative, lagged rainfall (over 12 months) in the Mexican states of cattle origin were used in the models when those variables showed signifi cance. The rainfall lags were set up such that the rainfall observation for January 1995 was the sum of rainfall from January 1994 through December 1994, while the rainfall reported for February 1995 was the sum of rainfall from February 1994 through January 1995, and so on. Data on Mexican pasture conditions are not available thus, measurements of accumulated rainfall serve as proxies for grazing conditions on the rangelands of northern Mexico.
Monthly dummy variables were used to account for seasonal fl uctuations in cattle shipments. The dummy variable values for high-volume shipping months were coded as “ones”, which had the effect of shifting the regression line up in months with signifi cantly higher numbers of cattle crossings. The U.S. nominal cattle price was for 500-pound feeder cattle marketed at Amarillo, Texas. The Mexican nominal cattle price was for equivalent cattle marketed in Mexico City. The linear trend variable with values from 0 to 120 accounted for obvious upward or downward trends in cattle cross-ings at some ports of entry.
The original explanatory models (Mitchell 2000) were re-esti-mated using monthly data for the period January 1994–December 2003. The fi rst re-estimations indicated that the Mitchell models needed to be reformulated due to reduced goodness of fi t. Step-wise regression procedures were applied to the full complement of monthly dummy variables in order to evaluate the explanatory power of the different monthly variables (with statistical signifi -cance set at α =.10). The nine updated regression models were se-lected using backward stepwise selections to identify the signifi cant
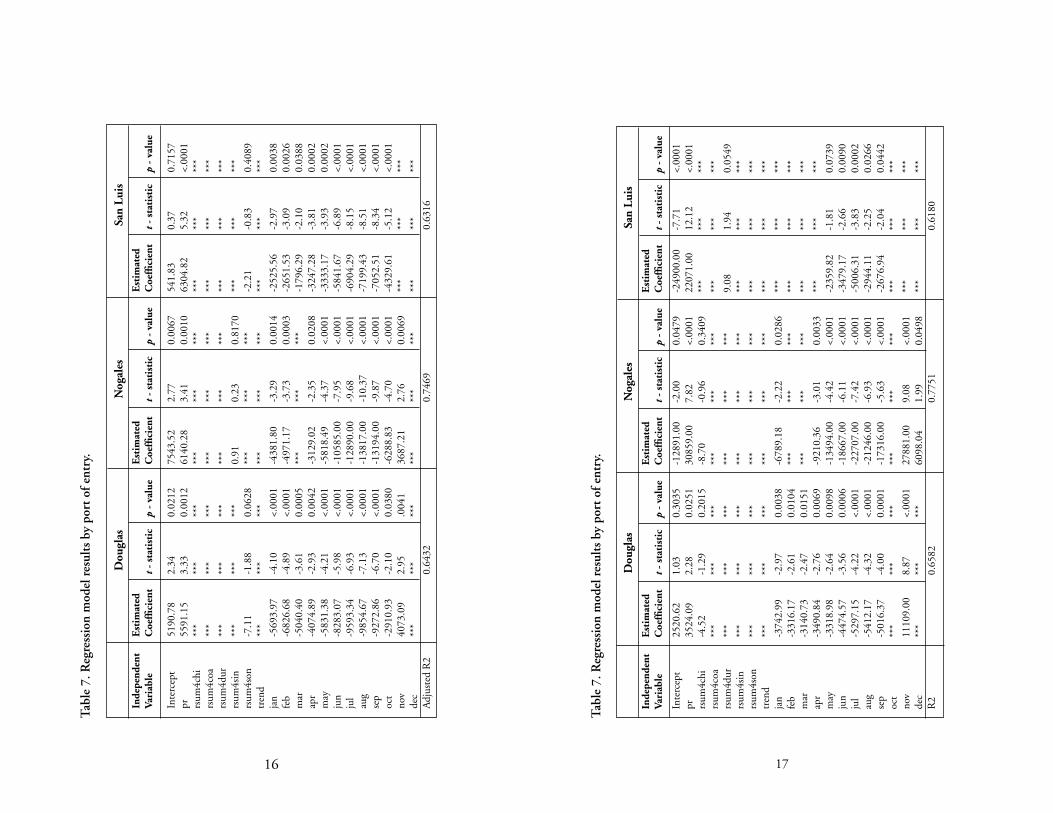
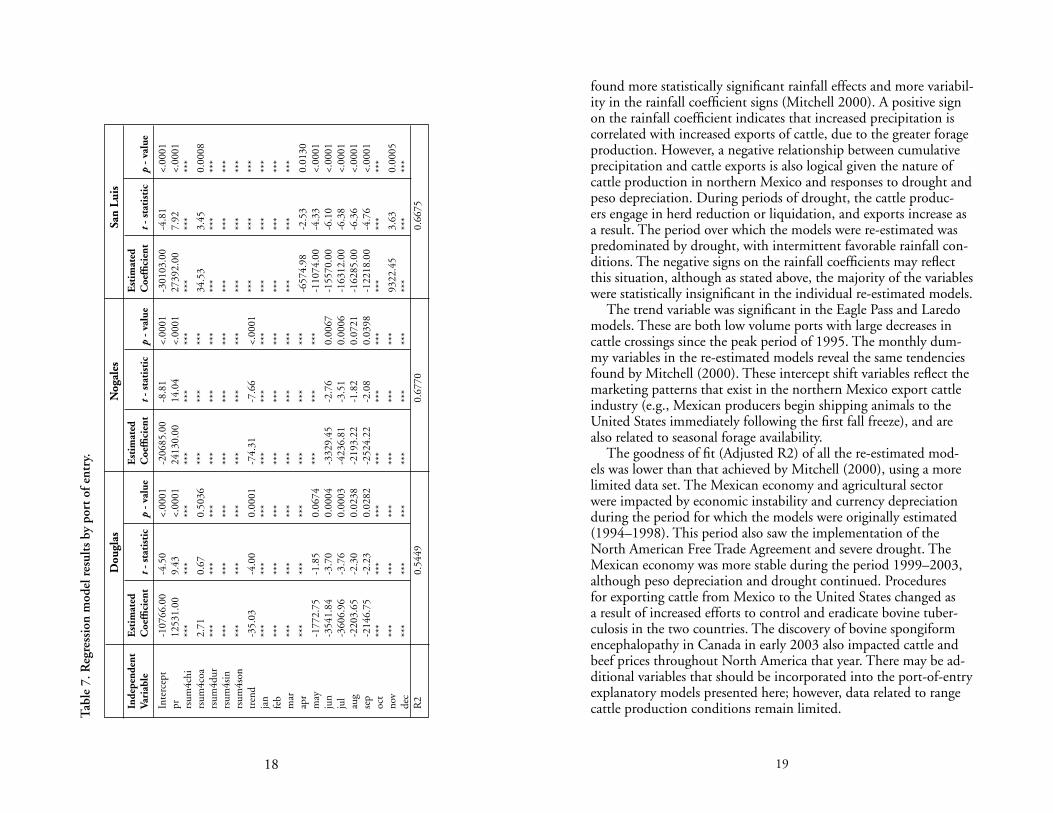
monthly dummy variables. This process began with all monthly dummy variables in the models and retained only the variables that were signifi cant at α = .10. For theoretical purposes, the price ratio and rainfall variables were present in all re-estimated models with the exception of the Laredo model. The stepwise regression procedure was also applied to the trend variable, which was found to be signifi cant in only two of the nine models, Eagle Pass and Laredo. Defi nitions of explanatory variables are presented in Table 6. Estimation results for the updated models are shown in Table 7. All estimation was conducted using SAS™ software. All data used in the models are presented in the Appendix.
The single equation regression models explained at least 54% of the variability in monthly cattle crossings at each port of entry. The relationship between the U.S.-Mexico live cattle price ratio and the independent variables (e.g., numbers of animals imported) was con-sistently positive, with a greater price ratio associated with increased movement of cattle into the United States.
The signs on the rainfall variables were mixed, and with the exception of the Presidio model, none of the rainfall variable coef-fi cients were signifi cantly different from zero. The earlier research
pr U.S. cattle prices/Mexican cattle pricesrsum4chi Cumulative and lagged rainfall for Chihuahua for the last 12 monthsrsum4coa Cumulative and lagged rainfall for Coahuila for the last 12 monthsrsum4dur Cumulative and lagged rainfall for Durango for the last 12 monthsrsum4sin Cumulative and lagged rainfall for Sinaloa for the last 12 monthsrsum4son Cumulative and lagged rainfall for Sonora for the last 12 monthstrend Linear variablejan Monthly dummy variable for the month of Januaryfeb Monthly dummy variable for the month of Februarymar Monthly dummy variable for the month of Marchapr Monthly dummy variable for the month of Aprilmay Monthly dummy variable for the month of Mayjun Monthly dummy variable for the month of Junejul Monthly dummy variable for the month of Julyaug Monthly dummy variable for the month of Augustsep Monthly dummy variable for the month of Septemberoct Monthly dummy variable for the month of Octobernov Monthly dummy variable for the month of Novemberdec Monthly dummy variable for the month of December
Table 6. Explanatory Variable Defi nitions
Variable Name Variable Defi nition
16 17
Inde
pend
ent
Est
imat
ed
Est
imat
ed
Est
imat
edVa
riab
le
Coe
ffi c
ient
t
- st
atis
tic
p -
valu
e C
oeffi
cie
nt
t -
stat
isti
c p
- va
lue
Coe
ffi c
ient
t
- st
atis
tic
p -
valu
e
Inte
rcep
t 51
90.7
8 2.
34
0.02
12
7543
.52
2.77
0.
0067
54
1.83
0.
37
0.71
57pr
55
91.1
5 3.
33
0.00
12
6140
.28
3.41
0.
0010
63
04.8
2 5.
32
<.00
01rs
um4c
hi
***
***
***
***
***
***
***
***
***
rsum
4coa
**
* **
* **
* **
* **
* **
* **
* **
* **
*rs
um4d
ur
***
***
***
***
***
***
***
***
***
rsum
4sin
**
* **
* **
* 0.
91
0.23
0.
8170
**
* **
* **
*rs
um4s
on
-7.1
1 -1
.88
0.06
28
***
***
***
-2.2
1 -0
.83
0.40
89tr
end
***
***
***
***
***
***
***
***
***
jan
-569
3.97
-4
.10
<.00
01
-438
1.80
-3
.29
0.00
14
-252
5.56
-2
.97
0.00
38fe
b -6
826.
68
-4.8
9 <.
0001
-4
971.
17
-3.7
3 0.
0003
-2
651.
53
-3.0
9 0.
0026
mar
-5
040.
40
-3.6
1 0.
0005
**
* **
* **
* -1
796.
29
-2.1
0 0.
0388
apr
-407
4.89
-2
.93
0.00
42
-312
9.02
-2
.35
0.02
08
-324
7.28
-3
.81
0.00
02m
ay
-583
1.38
-4
.21
<.00
01
-581
8.49
-4
.37
<.00
01
-333
3.17
-3
.93
0.00
02ju
n -8
283.
07
-5.9
8 <.
0001
-1
0585
.00
-7.9
5 <.
0001
-5
841.
67
-6.8
9 <.
0001
jul
-959
3.34
-6
.93
<.00
01
-128
90.0
0 -9
.68
<.00
01
-690
4.29
-8
.15
<.00
01au
g -9
854.
67
-7.1
3 <.
0001
-1
3817
.00
-10.
37
<.00
01
-719
9.43
-8
.51
<.00
01se
p -9
272.
86
-6.7
0 <.
0001
-1
3194
.00
-9.8
7 <.
0001
-7
052.
51
-8.3
4 <.
0001
oct
-291
0.93
-2
.10
0.03
80
-628
8.83
-4
.70
<.00
01
-432
9.61
-5
.12
<.00
01no
v 40
73.0
9 2.
95
.004
1 36
87.2
1 2.
76
0.00
69
***
***
***
dec
***
***
***
***
***
***
***
***
***
Adj
uste
d R
2
0.64
32
0.74
69
0.63
16
D
ougl
as
Nog
ales
Sa
n L
uis
Inde
pend
ent
Est
imat
ed
Est
imat
ed
Est
imat
edVa
riab
le
Coe
ffi c
ient
t
- st
atis
tic
p -
valu
e C
oeffi
cie
nt
t -
stat
isti
c p
- va
lue
Coe
ffi c
ient
t
- st
atis
tic
p -
valu
e
Tab
le 7
. Reg
ress
ion
mod
el r
esul
ts b
y po
rt o
f ent
ry.
Inte
rcep
t 25
20.6
2 1.
03
0.30
35
-128
91.0
0 -2
.00
0.04
79
-249
00.0
0 -7
.71
<.00
01pr
35
24.0
9 2.
28
0.02
51
3085
9.00
7.
82
<.00
01
2207
1.00
12
.12
<.00
01rs
um4c
hi
-4.5
2 -1
.29
0.20
15
-8.7
0 -0
.96
0.34
09
***
***
***
rsum
4coa
**
* **
* **
* **
* **
* **
* **
* **
* **
*rs
um4d
ur
***
***
***
***
***
***
9.08
1.
94
0.05
49rs
um4s
in
***
***
***
***
***
***
***
***
***
rsum
4son
**
* **
* **
* **
* **
* **
* **
* **
* **
*tr
end
***
***
***
***
***
***
***
***
***
jan
-374
2.99
-2
.97
0.00
38
-678
9.18
-2
.22
0.02
86
***
***
***
feb
-331
6.17
-2
.61
0.01
04
***
***
***
***
***
***
mar
-3
140.
73
-2.4
7 0.
0151
**
* **
* **
* **
* **
* **
*ap
r -3
490.
84
-2.7
6 0.
0069
-9
210.
36
-3.0
1 0.
0033
**
* **
* **
*m
ay
-331
8.98
-2
.64
0.00
98
-134
94.0
0 -4
.42
<.00
01
-235
9.82
-1
.81
0.07
39ju
n -4
474.
57
-3.5
6 0.
0006
-1
8667
.00
-6.1
1 <.
0001
-3
479.
17
-2.6
6 0.
0090
jul
-529
7.15
-4
.22
<.00
01
-227
07.0
0 -7
.42
<.00
01
-500
6.31
-3
.83
0.00
02au
g -5
412.
17
-4.3
2 <.
0001
-2
1246
.00
-6.9
3 <.
0001
-2
944.
11
-2.2
5 0.
0266
sep
-501
6.37
-4
.00
0.00
01
-173
16.0
0 -5
.63
<.00
01
-267
6.94
-2
.04
0.04
42oc
t **
* **
* **
* **
* **
* **
* **
* **
* **
*no
v 11
109.
00
8.87
<.
0001
27
881.
00
9.08
<.
0001
**
* **
* **
*de
c **
* **
* **
* 60
98.0
4 1.
99
0.04
98
***
***
***
R2
0.
6582
0.
7751
0.
6180
D
ougl
as
Nog
ales
Sa
n L
uis
Inde
pend
ent
Est
imat
ed
Est
imat
ed
Est
imat
edVa
riab
le
Coe
ffi c
ient
t
- st
atis
tic
p -
valu
e C
oeffi
cie
nt
t -
stat
isti
c p
- va
lue
Coe
ffi c
ient
t
- st
atis
tic
p -
valu
e
Tab
le 7
. Reg
ress
ion
mod
el r
esul
ts b
y po
rt o
f ent
ry.
18 19
D
ougl
as
Nog
ales
Sa
n L
uis
Inde
pend
ent
Est
imat
ed
Est
imat
ed
Est
imat
edVa
riab
le
Coe
ffi c
ient
t
- st
atis
tic
p -
valu
e C
oeffi
cie
nt
t -
stat
isti
c p
- va
lue
Coe
ffi c
ient
t
- st
atis
tic
p -
valu
e
Inte
rcep
t -1
0766
.00
-4.5
0 <.
0001
-2
0685
.00
-8.8
1 <.
0001
-3
0103
.00
-4.8
1 <.
0001
pr
1253
1.00
9.
43
<.00
01
2413
0.00
14
.04
<.00
01
2739
2.00
7.
92
<.00
01rs
um4c
hi
***
***
***
***
***
***
***
***
***
rsum
4coa
2.
71
0.67
0.
5036
**
* **
* **
* 34
.53
3.45
0.
0008
rsum
4dur
**
* **
* **
* **
* **
* **
* **
* **
* **
*rs
um4s
in
***
***
***
***
***
***
***
***
***
rsum
4son
**
* **
* **
* **
* **
* **
* **
* **
* **
*tr
end
-35.
03
-4.0
0 0.
0001
-7
4.31
-7
.66
<.00
01
***
***
***
jan
***
***
***
***
***
***
***
***
***
feb
***
***
***
***
***
***
***
***
***
mar
**
* **
* **
* **
* **
* **
* **
* **
* **
*ap
r **
* **
* **
* **
* **
* **
* -6
574.
98
-2.5
3 0.
0130
may
-1
772.
75
-1.8
5 0.
0674
**
* **
* **
* -1
1074
.00
-4.3
3 <.
0001
jun
-354
1.84
-3
.70
0.00
04
-332
9.45
-2
.76
0.00
67
-155
70.0
0 -6
.10
<.00
01ju
l -3
606.
96
-3.7
6 0.
0003
-4
236.
81
-3.5
1 0.
0006
-1
6312
.00
-6.3
8 <.
0001
aug
-220
3.65
-2
.30
0.02
38
-219
3.22
-1
.82
0.07
21
-162
85.0
0 -6
.36
<.00
01se
p -2
146.
75
-2.2
3 0.
0282
-2
524.
22
-2.0
8 0.
0398
-1
2218
.00
-4.7
6 <.
0001
oct
***
***
***
***
***
***
***
***
***
nov
***
***
***
***
***
***
9322
.45
3.63
0.
0005
dec
***
***
***
***
***
***
***
***
***
R2
0.
5449
0.
6770
0.
6675
Tab
le 7
. Reg
ress
ion
mod
el r
esul
ts b
y po
rt o
f ent
ry.
found more statistically signifi cant rainfall effects and more variabil-ity in the rainfall coeffi cient signs (Mitchell 2000). A positive sign on the rainfall coeffi cient indicates that increased precipitation is correlated with increased exports of cattle, due to the greater forage production. However, a negative relationship between cumulative precipitation and cattle exports is also logical given the nature of cattle production in northern Mexico and responses to drought and peso depreciation. During periods of drought, the cattle produc-ers engage in herd reduction or liquidation, and exports increase as a result. The period over which the models were re-estimated was predominated by drought, with intermittent favorable rainfall con-ditions. The negative signs on the rainfall coeffi cients may refl ect this situation, although as stated above, the majority of the variables were statistically insignifi cant in the individual re-estimated models.
The trend variable was signifi cant in the Eagle Pass and Laredo models. These are both low volume ports with large decreases in cattle crossings since the peak period of 1995. The monthly dum-my variables in the re-estimated models reveal the same tendencies found by Mitchell (2000). These intercept shift variables refl ect the marketing patterns that exist in the northern Mexico export cattle industry (e.g., Mexican producers begin shipping animals to the United States immediately following the fi rst fall freeze), and are also related to seasonal forage availability.
The goodness of fi t (Adjusted R2) of all the re-estimated mod-els was lower than that achieved by Mitchell (2000), using a more limited data set. The Mexican economy and agricultural sector were impacted by economic instability and currency depreciation during the period for which the models were originally estimated (1994–1998). This period also saw the implementation of the North American Free Trade Agreement and severe drought. The Mexican economy was more stable during the period 1999–2003, although peso depreciation and drought continued. Procedures for exporting cattle from Mexico to the United States changed as a result of increased efforts to control and eradicate bovine tuber-culosis in the two countries. The discovery of bovine spongiform encephalopathy in Canada in early 2003 also impacted cattle and beef prices throughout North America that year. There may be ad-ditional variables that should be incorporated into the port-of-entry explanatory models presented here; however, data related to range cattle production conditions remain limited.

20 21
SUMMARY AND CONCLUSIONThe objective of this research was to update and re-estimate simple regression models developed by Mitchell (2000), which were intended to give the USDA-APHIS information on each in-dividual port of entry to allow for better allocation of inspection services, budget concerns and personnel needs. Mitchell’s nine models were specifi ed with monthly imports of Mexican cattle at a specifi c port of entry as a function of relative U.S.-Mexico light cattle prices, cumulative precipitation (rolling, over the preceding year), and monthly dummy variables. The models were re-esti-mated with twice the amount of data that were available when they were fi rst estimated. The explanatory power of the new models was slightly weaker than the explanatory power of the earlier models (based on Adjusted R2 values). Another objective of this report was to compile all data used in the estimations, as these data are not readily accessible. All data used in the estima-tions are included in the report.
Improved econometric analysis of U.S. imports of Mexican cattle is limited by the amount and type of data available. Pasture conditions are a key factor in determining marketing patterns for Mexican cattle. Pasture conditions are represented by a proxy variable in this research, and some of the deterioration in models’ explanatory power may be due to the inadequacy of the proxy vari-able (e.g., precipitation). The models presented here captured the strong seasonal marketing patterns that exist in U.S.-Mexico live cattle trade. The fi gures and charts illustrate the spatial and tempo-ral distributions of U.S. imports of Mexican cattle over the last 10 years. This report provides a snapshot of U.S. imports of Mexican cattle as of early 2004. Future imports of Mexican cattle will likely be infl uenced by livestock market conditions in both the United States and Mexico, which in turn will be affected by economic conditions in the two countries. Additional econometric analysis should incorporate variables related to U.S. cattle market condi-tions, thus capturing the factors that pull Mexican cattle into the U.S. beef market.
REFERENCESBanco de Mexico (2003 August 18). Exchange Rate Monthly Aver-
age (pesos per dollar). Economic and Financial Indicators, Foreign Exchange Market. Available at: www.banxico.org.mx/siteBanxicoINGLES/eInfoFinanciera/FSinfoFinanciera.html
Comisión Nacional del Agua, Servicio Meteorológico Nacio-nal (2003 August 26). Lámina de Lluvia Mensual Estatal y Anomalía. Available at: smn.cna.gob.mx
Guinn, C. and R. Skaggs (2005). North American Beef and Cattle Trade: A Current Perspective. New Mexico Agricultural Experiment Station Technical Report 40.
Mitchell, D. (2000). Predicting Live Cattle Imports by Port of Entry from Mexico into the United States. Unpublished M.S. thesis. Department of Agricultural Economics and Agricultural Business, New Mexico State University, Las Cruces, NM.
Mitchell, D., R. Skaggs, W. Gorman, T, Crawford, and L. South-ard. (June-July 2001). Mexican Cattle Exports to U.S.: Cur-rent Perspectives, Agricultural Outlook. U.S. Department of Agriculture, Economic Research Service, pages 6-9.
Secretaría de Economia de México, National System of Infor-mation and Integration of Markets. (2003 September 30). National Livestock Markets. Available at: www.secofi _sniim.gob.mx/e_default.asp?
United States Department of Agriculture, Agricultural Marketing Service. Amarillo Livestock Market News. Available at: www.ams.usda.gov/lsmnpubs/
United States Department of Agriculture, Foreign Agricultural Service. (2003) FATUS Commodity Aggregation Reports. Available at: www.fas.usda.gov/ustrade

22 23
APPENDIX A–IMPORT DATA BY PORT OF ENTRYSource: United States Department of Agriculture, Animal Plant
and Health Inspection Service, Veterinary Services

24 25
8.66% 6,149 8.99% 7,864 11.53% 7,782 11.23% 7,411 16.87% 55,941 10.25% 13.12% 8,195 11.98% 6,583 9.65% 9,031 13.03% 4,977 11.33% 56,926 10.43% 15.28% 9,295 13.59% 9,924 14.55% 9,031 13.03% 3,910 8.90% 71,202 13.05% 5.37% 4,930 7.21% 9,859 14.45% 3,747 5.41% 3,172 7.22% 56,035 10.27% 3.53% 6,790 9.93% 8,825 12.94% 3,972 5.73% 4,684 10.66% 49,411 9.06% 2.74% 4,472 6.54% 3,416 5.01% 2,082 3.00% 2,535 5.77% 25,343 4.64% 3.08% 1,911 2.79% 2,429 3.56% 2,016 2.91% 1,466 3.34% 13,985 2.56% 1.60% 2,247 3.29% 903 1.32% 680 0.98% 1,003 2.28% 10,280 1.88% 2.39% 1,377 2.01% 1,192 1.75% 1,805 2.61% 951 2.17% 9,336 1.71% 7.44% 4,191 6.13% 2,614 3.83% 7,252 10.47% 2,406 5.48% 35,418 6.49% 17.87% 10,005 14.63% 5,908 8.66% 11,140 16.08% 5,524 12.58% 82,748 15.17% 18.93% 8,817 12.89% 8,706 12.76% 10,748 15.51% 5,883 13.39% 79,004 14.48% 100.00% 68,379 100.00% 68,223 100.00% 69,286 100.00% 43,922 100.00% 545,629 100.00%
Monthly Monthly Monthly Monthly Monthly Number % of the Number % of the Number % of the Number % of the Number % of the Number of Head Year of Head Year of Head Year of Head Year of Head Year of Head
Monthly Monthly Monthly Monthly Monthly % of the Number % of the Number % of the Number % of the Number % of the Number Monthly % Year of Head Year of Head Year of Head Year of Head Year of Head of the Year
1994 1995 1996 1997 1998 1999 1999 2000 2001 2002 2003 Total
Douglas, AZ Port of Entry Monthly Live Cattle Imports and Percentages (1994-2003)
Nogales, AZ Port of Entry Monthly Live Cattle Imports and Percentages (1994-2003)
1994 1995 1996 1997 1998 1999 Monthly Monthly Monthly Monthly Monthly Number % of the Number % of the Number % of the Number % of the Number % of the Number of Head Year of Head Year of Head Year of Head Year of Head Year of Head
1999 2000 2001 2002 2003 Total Monthly Monthly Monthly Monthly Monthly % of the Number % of the Number % of the Number % of the Number % of the Number Monthly % Year of Head Year of Head Year of Head Year of Head Year of Head of the Year
San Luis, AZ Port of Entry Monthly Live Cattle Imports and Percentages (1994-2003)
1994 1995 1996 1997 1998 1999 Monthly Monthly Monthly Monthly Monthly Number % of the Number % of the Number % of the Number % of the Number % of the Number of Head Year of Head Year of Head Year of Head Year of Head Year of Head
1999 2000 2001 2002 2003 Total Monthly Monthly Monthly Monthly Monthly % of the Number % of the Number % of the Number % of the Number % of the Number Monthly % Year of Head Year of Head Year of Head Year of Head Year of Head of the Year
Douglas, AZ (Continued)
Nogales, AZ (Continued)
San Luis, AZ (Continued)
Jan 0 0.00% 6,663 7.58% 4,548 9.15% 6,338 17.59% 2,037 5.71% 2,926Feb 976 1.48% 5,730 6.52% 5,990 12.05% 2,471 6.86% 1,467 4.11% 2,271Mar 12,077 18.34% 10,850 12.35% 7,310 14.70% 2,094 5.81% 2,302 6.45% 7,392Apr 14,263 21.66% 12,618 14.36% 6,978 14.03% 2,597 7.21% 3,824 10.72% 4,243May 5,950 9.04% 9,045 10.29% 1,745 3.51% 3,961 10.99% 3,119 8.75% 2,906Jun 3,377 5.13% 7,205 8.20% 331 0.67% 570 1.58% 373 1.05% 1,680Jul 0 0.00% 2,992 3.40% 169 0.34% 0 0.00% 177 0.50% 323Aug 160 0.24% 1,549 1.76% 0 0.00% 17 0.05% 40 0.11% 0Sep 253 0.38% 1,755 2.00% 113 0.23% 134 0.37% 402 1.13% 0Oct 2,017 3.06% 7,406 8.43% 88 0.18% 3,505 9.73% 5,788 16.23% 5,998Nov 13,732 20.86% 14,501 16.50% 10,939 22.00% 10,426 28.94% 9,943 27.88% 18,743Dec 13,030 19.79% 7,564 8.61% 11,518 23.16% 3,917 10.87% 6,192 17.36% 15,192Total 65,835 100.00% 87,878 100.00% 49,729 100.00% 36,030 100.00% 35,664 100.00% 61,674
4.74% 8,675 12.76% 2,386 4.37% 4,228 5.97% 7,140 7.46% 44,941 7.18% 3.68% 7,847 11.54% 2,979 5.45% 3,212 4.54% 4,660 4.87% 37,603 6.01% 11.99% 8,064 11.86% 5,139 9.40% 3,214 4.54% 6,133 6.40% 64,575 10.32% 6.88% 5,827 8.57% 8,748 16.00% 4,151 5.87% 10,753 11.23% 74,002 11.82% 4.71% 8,902 13.09% 3,867 7.07% 2,271 3.21% 6,770 7.07% 48,536 7.75% 2.72% 2,999 4.41% 2,016 3.69% 625 0.88% 3,876 4.05% 23,052 3.68% 0.52% 201 0.30% 318 0.58% 243 0.34% 2,992 3.12% 7,415 1.18% 0.00% 449 0.66% 0 0.00% 0 0.00% 1,680 1.75% 3,895 0.62% 0.00% 361 0.53% 3,166 5.79% 356 0.50% 1,207 1.26% 7,747 1.24% 9.73% 5,014 7.37% 9,016 16.49% 14,716 20.80% 13,138 13.72% 66,686 10.65% 30.39% 12,684 18.65% 10,077 18.44% 20,314 28.71% 20,650 21.56% 142,009 22.68% 24.63% 6,988 10.27% 6,947 12.71% 17,434 24.64% 16,761 17.50% 105,543 16.86%100.00% 68,011 100.00% 54,659 100.00% 70,764 100.00% 95,760 100.00% 626,004 100.00%
Jan 17,097 10.65% 18,078 10.37% 9,448 9.30% 13,989 11.44% 9,929 8.95% 7,160Feb 17,199 10.71% 15,214 8.73% 13,315 13.11% 11,421 9.34% 9,307 8.39% 11,736Mar 27,428 17.09% 27,167 15.58% 18,834 18.55% 15,085 12.34% 13,254 11.95% 18,381Apr 21,673 13.50% 20,431 11.72% 7,602 7.49% 15,813 12.93% 16,350 14.75% 12,117May 11,815 7.36% 21,829 12.52% 6,052 5.96% 8,703 7.12% 13,019 11.74% 5,902Jun 4,894 3.05% 13,425 7.70% 1,564 1.54% 5,722 4.68% 4,068 3.67% 6,110Jul 2,665 1.66% 6,277 3.60% 274 0.27% 4,536 3.71% 2,062 1.86% 2,884Aug 3,779 2.35% 4,349 2.49% 273 0.27% 2,986 2.44% 353 0.32% 2,301Sep 3,713 2.31% 3,141 1.80% 606 0.60% 3,838 3.14% 627 0.57% 2,962Oct 5,397 3.36% 7,926 4.55% 5,974 5.88% 7,145 5.84% 7,897 7.12% 13,584Nov 24,122 15.03% 22,737 13.04% 19,695 19.39% 18,705 15.30% 19,282 17.39% 21,813Dec 20,746 12.92% 13,766 7.90% 17,915 17.64% 14,351 11.73% 14,736 13.29% 19,852Total 160,528 100.00% 174,340 100.00% 101,552 100.00% 122,294 100.00% 110,884 100.00% 124,802
5.74% 13,079 10.30% 15,284 13.58% 10,340 8.63% 14,665 9.45% 129,069 9.86% 9.40% 15,835 12.47% 11,253 10.00% 8,626 7.20% 12,024 7.75% 125,930 9.62% 14.73% 16,121 12.70% 17,415 15.47% 11,243 9.39% 12,031 7.75% 176,959 13.52% 9.71% 13,394 10.55% 13,764 12.23% 6,795 5.67% 17,541 11.30% 145,480 11.11% 4.73% 9,775 7.70% 8,628 7.67% 9,689 8.09% 14,535 9.36% 109,947 8.40% 4.90% 7,323 5.77% 4,065 3.61% 3,417 2.85% 8,631 5.56% 59,219 4.52% 2.31% 1,613 1.27% 2,582 2.29% 3,393 2.83% 9,369 6.04% 35,655 2.72% 1.84% 2,002 1.58% 2,419 2.15% 3,723 3.11% 4,663 3.00% 26,848 2.05% 2.37% 3,306 2.60% 3,043 2.70% 3,692 3.08% 5,630 3.63% 30,558 2.33% 10.88% 6,439 5.07% 6,692 5.95% 19,506 16.29% 13,739 8.85% 94,299 7.20% 17.48% 19,607 15.44% 13,572 12.06% 21,094 17.62% 22,946 14.78% 203,573 15.55% 15.91% 18,482 14.56% 13,823 12.28% 18,231 15.22% 19,464 12.54% 171,366 13.09% 100.00% 126,976 100.00% 112,540 100.00% 119,749 100.00% 155,238 100.00% 1,308,903 100.00%
Jan 0 0.0% 5,948 7.47% 3,703 9.05% 6,209 18.48% 4,787 12.19% 6,088Feb 0 0.0% 6,933 8.71% 3,716 9.08% 4,916 14.64% 3,359 8.56% 9,216Mar 6,616 20.6% 10,804 13.58% 3,873 9.46% 3,740 11.13% 3,276 8.34% 10,733Apr 6,117 19.0% 12,556 15.78% 2,966 7.24% 2,723 8.11% 6,194 15.78% 3,771May 1,777 5.5% 11,796 14.82% 1,443 3.52% 1,845 5.49% 5,798 14.77% 2,481Jun 1,227 3.8% 5,746 7.22% 680 1.66% 286 0.85% 2,976 7.58% 1,923Jul 0 0.0% 2,442 3.07% 589 1.44% 307 0.91% 662 1.69% 2,163Aug 497 1.5% 2,531 3.18% 453 1.11% 842 2.51% 0 0.00% 1,124Sep 0 0.0% 1,188 1.49% 604 1.48% 541 1.61% 0 0.00% 1,678Oct 1,739 5.4% 5,984 7.52% 2,424 5.92% 1,546 4.60% 2,031 5.17% 5,231Nov 8,143 25.3% 8,595 10.80% 9,754 23.83% 4,594 13.68% 6,529 16.63% 12,556Dec 6,067 18.9% 5,062 6.36% 10,734 26.22% 6,041 17.98% 3,647 9.29% 13,299Total 32,183 100.00% 79,585 100.00% 40,939 100.00% 33,590 100.00% 39,259 100.00% 70,263

26 27
Columbus, NM Port of Entry Monthly Live Cattle Imports and Percentages (1994-2003)
Monthly Monthly Monthly Monthly Monthly Number % of the Number % of the Number % of the Number % of the Number % of the Number of Head Year of Head Year of Head Year of Head Year of Head Year of Head
1994 1995 1996 1997 1998 1999
Columbus, NM (Continued)
Monthly Monthly Monthly Monthly Monthly Monthly % of the Number % of the Number % of the Number % of the Number % of the Number % of the Year of Head Year of Head Year of Head Year of Head Year of Head Year
1999 2000 2001 2002 2003 Total
Santa Teresa, NM Port of Entry Monthly Live Cattle Imports and Percentages (1994-2003)
Monthly Monthly Monthly Monthly Monthly Number % of the Number % of the Number % of the Number % of the Number % of the Number of Head Year of Head Year of Head Year of Head Year of Head Year of Head
1994 1995 1996 1997 1998 1999
Del Rio, TX Port of Entry Monthly Live Cattle Imports and Percentages (1994-2003)
Monthly Monthly Monthly Monthly Monthly Number % of the Number % of the Number % of the Number % of the Number % of the Number of Head Year of Head Year of Head Year of Head Year of Head Year of Head
1994 1995 1996 1997 1998 1999
Santa Teresa, NM (Continued)
1999 2000 2001 2002 2003 Total Monthly Monthly Monthly Monthly Monthly % of the Number % of the Number % of the Number % of the Number % of the Number Monthly % Year of Head Year of Head Year of Head Year of Head Year of Head of the Year
Del Rio, TX (Continued) 1999 2000 2001 2002 2003 Total
Monthly Monthly Monthly Monthly Monthly % of the Number % of the Number % of the Number % of the Number % of the Number Monthly % Year of Head Year of Head Year of Head Year of Head Year of Head of the Year
Jan 0 0.00% 2,683 5.13% 400 2.40% 0 0.00% 914 2.42% 3,090Feb 0 0.00% 2,763 5.28% 241 1.45% 0 0.00% 0 0.00% 917Mar 401 1.29% 6,821 13.04% 0 0.00% 0 0.00% 1,155 3.06% 2,143Apr 1,254 4.05% 6,671 12.76% 267 1.60% 346 1.44% 655 1.74% 4,032May 906 2.92% 6,200 11.86% 0 0.00% 0 0.00% 1,840 4.88% 4,608Jun 196 0.63% 2,701 5.17% 0 0.00% 0 0.00% 439 1.16% 1,943Jul 948 3.06% 2,507 4.79% 341 2.05% 0 0.00% 0 0.00% 350Aug 112 0.36% 1,418 2.71% 0 0.00% 0 0.00% 0 0.00% 0Sep 2,151 6.94% 514 0.98% 0 0.00% 0 0.00% 0 0.00% 0Oct 12,005 38.74% 1,571 3.00% 794 4.77% 1,686 7.04% 3,622 9.60% 9,110Nov 7,421 23.94% 12,356 23.63% 13,112 78.69% 18,325 76.52% 23,443 62.12% 21,692Dec 5,598 18.06% 6,085 11.64% 1,508 9.05% 3,592 15.00% 5,672 15.03% 4,093Total 30,992 100.00% 52,290 100.00% 16,663 100.00% 23,949 100.00% 37,740 100.00% 51,978
5.94% 1,608 3.79% 1,620 4.24% 3,330 5.76% 6,075 8.71% 19,720 4.67% 1.76% 2,226 5.24% 3,189 8.35% 8,484 14.66% 6,900 9.89% 24,720 5.86% 4.12% 2,120 4.99% 8,065 21.13% 0 0.00% 5,890 8.45% 26,595 6.30% 7.76% 1,674 3.94% 3,330 8.72% 0 0.00% 5,195 7.45% 23,424 5.55% 8.87% 2,013 4.74% 6,235 16.33% 0 0.00% 1,980 2.84% 23,782 5.64% 3.74% 1,995 4.70% 3,029 7.93% 0 0.00% 1,912 2.74% 12,215 2.90% 0.67% 0 0.00% 0 0.00% 0 0.00% 965 1.38% 5,111 1.21% 0.00% 25 0.06% 705 1.85% 49 0.08% 147 0.21% 2,456 0.58% 0.00% 976 2.30% 663 1.74% 0 0.00% 2,890 4.14% 7,194 1.71% 17.53% 8,687 20.47% 4,146 10.86% 3,965 6.85% 13,033 18.69% 58,619 13.90% 41.73% 13,868 32.67% 4,190 10.98% 24,963 43.15% 18,522 26.56% 157,892 37.43% 7.87% 7,252 17.09% 3,003 7.87% 17,065 29.50% 6,228 8.93% 60,096 14.25% 100.00% 42,444 100.00% 38,175 100.00% 57,856 100.00% 69,737 100.00% 421,824 100.00%
Jan 0 0.00% 30,155 8.20% 6,833 5.37% 9,885 4.91% 12,939 6.18% 22,169Feb 0 0.00% 51,185 13.92% 13,636 10.71% 22,059 10.96% 14,342 6.85% 26,825Mar 28,279 11.92% 64,424 17.52% 15,613 12.26% 11,884 5.90% 21,218 10.14% 35,822Apr 37,261 15.70% 33,610 9.14% 4,322 3.40% 18,224 9.05% 17,004 8.13% 23,298May 13,181 5.56% 35,877 9.75% 6,043 4.75% 9,041 4.49% 10,733 5.13% 11,028Jun 6,059 2.55% 22,863 6.22% 4,312 3.39% 8,005 3.98% 3,647 1.74% 12,554Jul 2,989 1.26% 12,379 3.37% 1,868 1.47% 2,851 1.42% 1,622 0.78% 3,356Aug 5,760 2.43% 16,970 4.61% 1,275 1.00% 3,085 1.53% 421 0.20% 1,139Sep 15,093 6.36% 13,261 3.61% 535 0.42% 4,335 2.15% 2,728 1.30% 5,215Oct 35,437 14.93% 15,681 4.26% 1,539 1.21% 28,088 13.95% 32,050 15.32% 28,708Nov 55,491 23.39% 44,640 12.14% 54,914 43.14% 52,038 25.85% 61,061 29.18% 67,794Dec 37,728 15.90% 26,742 7.27% 16,414 12.89% 31,802 15.80% 31,493 15.05% 32,862Total 237,278 100.00% 367,787 100.00% 127,304 100.00% 201,297 100.00% 209,258 100.00% 270,770
8.19% 23,258 7.11% 35,582 14.30% 22,814 12.78% 26,372 9.66% 190,007 7.78% 9.91% 32,102 9.81% 25,412 10.21% 36,810 20.62% 22,849 8.37% 245,220 10.04% 13.23% 39,437 12.05% 32,841 13.20% 33,986 19.04% 20,414 7.48% 303,918 12.45% 8.60% 25,676 7.85% 30,395 12.21% 105 0.06% 18,050 6.61% 207,945 8.52% 4.07% 25,735 7.86% 12,588 5.06% 0 0.00% 13,702 5.02% 137,928 5.65% 4.64% 7,192 2.20% 8,265 3.32% 0 0.00% 6,711 2.46% 79,608 3.26% 1.24% 1,889 0.58% 3,806 1.53% 0 0.00% 6,506 2.38% 37,266 1.53% 0.42% 5,420 1.66% 2,781 1.12% 0 0.00% 8,854 3.24% 45,705 1.87% 1.93% 20,079 6.14% 4,187 1.68% 79 0.04% 16,329 5.98% 81,841 3.35% 10.60% 48,896 14.94% 20,978 8.43% 6,905 3.87% 40,968 15.01% 259,250 10.62% 25.04% 58,876 17.99% 43,927 17.65% 42,438 23.77% 50,801 18.61% 531,980 21.79% 12.14% 38,714 11.83% 28,082 11.28% 35,400 19.83% 41,461 15.19% 320,698 13.14% 100.00% 327,274 100.00% 248,844 100.00% 178,537 100.00% 273,017 100.00% 2,441,366 100.00%
Jan 0 0.00% 23,573 11.40% 6,723 25.46% 2,752 6.92% 3,420 7.39% 7,339Feb 0 0.00% 24,895 12.04% 1,797 6.81% 3,541 8.90% 4,557 9.85% 9,535Mar 0 0.00% 31,205 15.09% 3,194 12.10% 1,301 3.27% 5,378 11.63% 8,765Apr 0 0.00% 24,201 11.71% 4,245 16.08% 4,063 10.21% 3,722 8.05% 6,365May 12,872 16.64% 15,078 7.29% 1,463 5.54% 2,855 7.18% 5,314 11.49% 4,800Jun 8,472 10.95% 15,684 7.59% 881 3.34% 2,447 6.15% 2,226 4.81% 4,331Jul 5,673 7.33% 9,977 4.83% 559 2.12% 2,412 6.06% 2,488 5.38% 3,735Aug 8,449 10.92% 16,689 8.07% 1,464 5.54% 3,214 8.08% 506 1.09% 2,705Sep 7,154 9.25% 8,348 4.04% 763 2.89% 3,416 8.59% 2,210 4.78% 4,958Oct 7,733 10.00% 14,081 6.81% 1,114 4.22% 3,712 9.33% 2,374 5.13% 7,141Nov 11,210 14.49% 11,467 5.55% 1,626 6.16% 5,918 14.88% 4,936 10.67% 10,922Dec 15,779 20.40% 11,539 5.58% 2,577 9.76% 4,149 10.43% 9,119 19.72% 9,260Total 77,342 100.00% 206,737 100.00% 26,406 100.00% 39,780 100.00% 46,250 100.00% 79,856
9.19% 7,850 7.98% 14,732 12.10% 12,547 22.72% 4,210 3.67% 83,146 9.60% 11.94% 9,032 9.19% 11,609 9.53% 14,712 26.64% 6,878 6.00% 86,556 9.99% 10.98% 11,013 11.20% 13,839 11.37% 14,999 27.16% 6,119 5.34% 95,813 11.06% 7.97% 9,810 9.98% 15,621 12.83% 4,443 8.04% 4,146 3.62% 76,616 8.84% 6.01% 8,545 8.69% 11,107 9.12% 790 1.43% 10,912 9.52% 73,736 8.51% 5.42% 6,301 6.41% 6,932 5.69% 237 0.43% 8,553 7.46% 56,064 6.47% 4.68% 3,046 3.10% 4,859 3.99% 190 0.34% 4,701 4.10% 37,640 4.34% 3.39% 5,897 6.00% 8,382 6.88% 0 0.00% 6,396 5.58% 53,702 6.20% 6.21% 7,079 7.20% 6,087 5.00% 131 0.24% 8,076 7.04% 48,222 5.57% 8.94% 6,696 6.81% 7,732 6.35% 2,048 3.71% 17,109 14.92% 69,740 8.05% 13.68% 10,867 11.05% 11,949 9.81% 1,478 2.68% 18,081 15.77% 88,454 10.21% 11.60% 12,198 12.40% 8,915 7.32% 3,659 6.62% 19,469 16.98% 96,664 11.16% 100.00% 98,334 100.00% 121,764 100.00% 55,234 100.00% 114,650 100.00% 866,353 100.00%

28 29
Eagle Pass, TX Port of Entry Monthly Live Cattle Imports and Percentages (1994-2003)
Monthly Monthly Monthly Monthly Monthly Number % of the Number % of the Number % of the Number % of the Number % of the Number of Head Year of Head Year of Head Year of Head Year of Head Year of Head
1994 1995 1996 1997 1998 1999
Laredo, TX Port of Entry Monthly Live Cattle Imports and Percentages (1994-2003)
Monthly Monthly Monthly Monthly Monthly Number % of the Number % of the Number % of the Number % of the Number % of the Number of Head Year of Head Year of Head Year of Head Year of Head Year of Head
1994 1995 1996 1997 1998 1999
Presidio, TX Port of Entry Monthly Live Cattle Imports and Percentages (1994-2003)
Monthly Monthly Monthly Monthly Monthly Number % of the Number % of the Number % of the Number % of the Number % of the Number of Head Year of Head Year of Head Year of Head Year of Head Year of Head
1994 1995 1996 1997 1998 1999
Eagle Pass, TX (Continued)
Monthly Monthly Monthly Monthly Monthly % of the Number % of the Number % of the Number % of the Number % of the Number Monthly % Year of Head Year of Head Year of Head Year of Head Year of Head of the Year
1999 2000 2001 2002 2003 Total
Laredo, TX (Continued)
Monthly Monthly Monthly Monthly Monthly % of the Number % of the Number % of the Number % of the Number % of the Number Monthly % Year of Head Year of Head Year of Head Year of Head Year of Heads of the Year
1999 2000 2001 2002 2003 Total
Presidio, TX (Continued)
Monthly Monthly Monthly Monthly Monthly % of the Number % of the Number % of the Number % of the Number % of the Number Monthly % Year of Head Year of Head Year of Head Year of Head Year of Head of the Year
1999 2000 2001 2002 2003 Total
Jan 0 0.00% 12,977 9.35% 2,837 15.89% 2,339 9.84% 1,708 5.21% 3,288Feb 0 0.00% 20,937 15.09% 2,098 11.75% 2,074 8.73% 3,519 10.72% 5,561Mar 0 0.00% 25,393 18.30% 2,310 12.94% 1,595 6.71% 3,312 10.09% 4,085Apr 371 0.81% 19,556 14.09% 1,820 10.19% 2,619 11.02% 3,665 11.17% 2,935May 3,120 6.77% 14,893 10.73% 283 1.58% 1,646 6.93% 3,262 9.94% 2,398Jun 2,593 5.63% 6,106 4.40% 100 0.56% 723 3.04% 1,581 4.82% 1,506Jul 2,866 6.22% 3,317 2.39% 431 2.41% 1,122 4.72% 496 1.51% 695Aug 4,611 10.01% 7,900 5.69% 315 1.76% 2,194 9.23% 1,277 3.89% 1,499Sep 7,509 16.31% 3,369 2.43% 563 3.15% 660 2.78% 1,173 3.57% 2,634Oct 7,975 17.32% 6,755 4.87% 1,159 6.49% 2,343 9.86% 4,048 12.34% 4,462Nov 9,024 19.59% 11,049 7.96% 2,555 14.31% 3,062 12.88% 4,728 14.41% 7,359Dec 7,984 17.34% 6,527 4.70% 3,384 18.95% 3,389 14.26% 4,043 12.32% 8,680Total 46,053 100.00% 138,779 100.00% 17,855 100.00% 23,766 100.00% 32,812 100.00% 45,102
7.29% 4,750 9.23% 5,209 12.13% 5,417 12.89% 3,606 7.57% 42,131 8.63% 12.33% 4,808 9.35% 3,465 8.07% 3,586 8.54% 3,600 7.56% 49,648 10.17% 9.06% 5,994 11.65% 3,509 8.17% 5,082 12.10% 2,619 5.50% 53,899 11.04% 6.51% 5,260 10.23% 4,855 11.30% 3,296 7.85% 3,674 7.72% 48,051 9.84% 5.32% 3,838 7.46% 2,892 6.73% 2,208 5.26% 2,248 4.72% 36,788 7.53% 3.34% 1,562 3.04% 1,725 4.02% 1,031 2.45% 1,365 2.87% 18,292 3.75% 1.54% 1,465 2.85% 2,081 4.85% 2,272 5.41% 1,649 3.46% 16,394 3.36% 3.32% 3,090 6.01% 3,358 7.82% 1,904 4.53% 1,318 2.77% 27,466 5.62% 5.84% 2,686 5.22% 3,021 7.03% 2,547 6.06% 2,855 6.00% 27,017 5.53% 9.89% 7,219 14.03% 3,864 9.00% 4,155 9.89% 5,317 11.17% 47,297 9.68% 16.32% 5,136 9.99% 4,773 11.11% 5,625 13.39% 8,103 17.02% 61,414 12.57% 19.25% 5,629 10.94% 4,199 9.78% 4,887 11.63% 11,264 23.65% 59,986 12.28% 100.00% 51,437 100.00% 42,951 100.00% 42,010 100.00% 47,618 100.00% 488,383 100.00%
5.02% 7,050 7.20% 17,071 14.64% 7,914 20.01% 4,129 6.07% 82,056 10.20% 8.10% 8,838 9.03% 17,402 14.92% 11,478 29.02% 3,567 5.24% 94,187 11.71% 18.11% 11,249 11.50% 17,472 14.98% 9,854 24.91% 6,417 9.43% 115,380 14.34% 10.64% 9,663 9.87% 16,052 13.77% 2,543 6.43% 3,851 5.66% 96,470 11.99% 7.26% 12,554 12.83% 9,557 8.20% 195 0.49% 7,781 11.44% 87,513 10.88% 5.03% 5,128 5.24% 5,391 4.62% 16 0.04% 3,280 4.82% 45,162 5.61% 4.80% 5,087 5.20% 4,676 4.01% 0 0.00% 4,003 5.88% 32,867 4.09% 5.01% 8,757 8.95% 7,131 6.12% 0 0.00% 1,620 2.38% 46,661 5.80% 5.60% 5,529 5.65% 5,347 4.59% 314 0.79% 4,098 6.02% 34,444 4.28% 7.90% 6,902 7.05% 7,483 6.42% 1,073 2.71% 9,226 13.56% 51,027 6.34% 11.12% 8,681 8.87% 5,005 4.29% 801 2.03% 7,908 11.62% 55,715 6.93% 11.42% 8,420 8.60% 4,019 3.45% 5,366 13.57% 12,163 17.88% 63,064 7.84% 100.00% 97,858 100.00% 116,606 100.00% 39,554 100.00% 68,043 100.00% 804,546 100.00%
Jan 12,049 11.78% 19,184 8.31% 6,731 34.02% 2,078 5.22% 3,632 7.94% 2,218Feb 9,779 9.56% 27,008 11.71% 2,301 11.63% 5,518 13.87% 4,720 10.31% 3,576Mar 15,733 15.39% 36,184 15.68% 1,714 8.66% 1,268 3.19% 7,491 16.37% 7,998Apr 18,239 17.84% 23,991 10.40% 2,381 12.04% 6,226 15.65% 8,825 19.28% 4,699May 12,240 11.97% 26,752 11.59% 1,241 6.27% 4,500 11.31% 9,487 20.73% 3,206Jun 6,397 6.26% 15,586 6.76% 297 1.50% 2,866 7.20% 3,977 8.69% 2,224Jul 3,163 3.09% 10,038 4.35% 563 2.85% 2,531 6.36% 685 1.50% 2,121Aug 5,508 5.39% 16,888 7.32% 113 0.57% 3,770 9.47% 661 1.44% 2,213Sep 3,850 3.77% 8,506 3.69% 130 0.66% 3,466 8.71% 729 1.59% 2,475Oct 4,006 3.92% 13,600 5.89% 551 2.79% 3,071 7.72% 1,626 3.55% 3,489Nov 5,806 5.68% 18,928 8.20% 608 3.07% 1,262 3.17% 1,806 3.95% 4,910Dec 5,474 5.35% 14,060 6.09% 3,153 15.94% 3,234 8.13% 2,130 4.65% 5,045Total 102,244 100.00% 230,725 100.00% 19,783 100.00% 39,790 100.00% 45,769 100.00% 44,174
12.04% 25,520 10.15% 24,768 10.86% 28,152 17.94% 25,901 9.93% 185,653 11.18% 14.87% 21,318 8.48% 28,008 12.28% 39,043 24.88% 22,119 8.48% 202,027 12.17% 9.13% 24,476 9.73% 29,942 13.12% 41,882 26.69% 25,471 9.77% 222,382 13.39% 4.11% 22,163 8.81% 36,050 15.80% 613 0.39% 20,863 8.00% 144,524 8.70% 2.82% 21,278 8.46% 14,539 6.37% 0 0.00% 18,911 7.25% 87,209 5.25% 3.01% 8,359 3.32% 8,589 3.76% 0 0.00% 8,240 3.16% 43,685 2.63% 1.33% 3,048 1.21% 4,172 1.83% 0 0.00% 7,448 2.86% 33,231 2.00% 0.58% 6,078 2.42% 4,444 1.95% 0 0.00% 7,138 2.74% 30,823 1.86% 3.51% 18,725 7.45% 5,741 2.52% 0 0.00% 16,950 6.50% 60,390 3.64% 12.87% 22,251 8.85% 20,301 8.90% 1,026 0.65% 32,801 12.58% 156,273 9.41% 22.98% 42,998 17.10% 26,770 11.73% 18,279 11.65% 37,147 14.25% 280,360 16.89% 12.76% 35,217 14.01% 24,822 10.88% 27,948 17.81% 37,760 14.48% 213,767 12.88% 100.00% 251,431 100.00% 228,146 100.00% 156,943 100.00% 260,749 100.00% 1,660,324 100.00%
Jan 0 0.00% 26,580 13.87% 6,036 14.69% 8,704 6.67% 19,144 15.42% 20,848Feb 350 0.34% 29,994 15.65% 5,043 12.27% 11,380 8.72% 19,024 15.32% 25,748Mar 17,968 17.53% 40,352 21.06% 2,504 6.09% 5,032 3.86% 18,956 15.27% 15,799Apr 11,505 11.22% 21,379 11.16% 2,224 5.41% 8,996 6.89% 13,615 10.96% 7,116May 1,993 1.94% 16,123 8.41% 408 0.99% 5,710 4.38% 3,365 2.71% 4,882Jun 1,351 1.32% 4,195 2.19% 0 0.00% 6,194 4.75% 1,551 1.25% 5,206Jul 1,523 1.49% 8,602 4.49% 686 1.67% 4,945 3.79% 509 0.41% 2,298Aug 4,129 4.03% 2,444 1.28% 0 0.00% 5,586 4.28% 0 0.00% 1,004Sep 4,307 4.20% 1,185 0.62% 0 0.00% 5,587 4.28% 1,825 1.47% 6,070Oct 13,870 13.53% 7,701 4.02% 0 0.00% 21,122 16.18% 14,914 12.01% 22,287Nov 23,744 23.16% 18,567 9.69% 11,953 29.09% 30,047 23.02% 31,071 25.02% 39,784Dec 21,780 21.24% 14,506 7.57% 12,241 29.79% 17,206 13.18% 196 0.16% 22,091Total 102,520 100.00% 191,628 100.00% 41,095 100.00% 130,509 100.00% 124,170 100.00% 173,133

30 31
APPENDIX B–INDEPENDENT VARIABLES

32 33
Jan-
94
71.4
8 89
.88
1.26
1.
20
3.50
12
.90
1.00
0.
00Fe
b-94
71
.51
90.0
0 1.
26
1.00
0.
10
3.10
4.
00
0.00
Mar
-94
73.4
1 94
.10
1.28
5.
50
11.0
0 10
.20
1.90
4.
20A
pr-9
4 72
.05
93.5
0 1.
30
4.00
5.
20
2.60
1.
10
1.40
May
-94
72.1
9 88
.30
1.22
3.
70
1.80
8.
50
0.10
0.
00Ju
n-94
71
.28
84.0
0 1.
18
30.4
0 44
.00
86.8
0 16
.90
39.7
0Ju
l-94
72
.48
84.6
7 1.
17
114.
10
79.0
0 50
.70
77.8
0 18
4.40
Aug
-94
71.4
2 83
.70
1.17
10
6.50
92
.60
23.4
0 11
3.20
23
0.80
Sep-
94
71.3
0 79
.88
1.12
72
.20
61.0
0 56
.20
81.0
0 72
.10
Oct
-94
70.3
9 77
.63
1.10
32
.00
52.6
0 31
.90
24.4
0 60
.20
Nov
-94
70.5
3 78
.80
1.12
43
.30
7.50
12
.60
75.4
0 87
.70
Dec
-94
69.5
9 80
.33
1.15
63
.60
14.7
0 21
.90
116.
20
63.7
0Ja
n-95
41
.59
83.7
0 2.
01
5.30
1.
50
2.00
14
.10
2.20
Feb-
95
42.1
7 81
.38
1.93
29
.80
3.20
11
.20
43.2
0 7.
80M
ar-9
5 40
.70
79.7
5 1.
96
2.60
0.
00
16.2
0 4.
10
0.00
Apr
-95
45.3
7 78
.38
1.73
0.
20
0.00
4.
80
0.70
0.
00M
ay-9
5 44
.27
76.0
0 1.
72
1.70
1.
70
72.3
0 0.
00
0.00
Jun-
95
43.6
4 76
.38
1.75
29
.60
39.3
0 12
.70
1.30
10
.90
Jul-
95
45.3
6 71
.83
1.58
79
.40
67.9
0 42
.20
55.1
0 13
1.30
Aug
-95
45.4
3 67
.40
1.48
78
.50
97.6
0 48
.20
101.
90
185.
80Se
p-95
45
.63
65.0
0 1.
42
94.5
0 75
.80
80.9
0 76
.00
149.
50O
ct-9
5 42
.75
63.5
0 1.
49
7.00
2.
10
23.6
0 9.
40
0.70
Nov
-95
43.9
3 62
.50
1.42
9.
10
1.40
24
.50
17.6
0 1.
30D
ec-9
5 48
.25
61.5
0 1.
27
9.60
7.
10
12.8
0 3.
70
1.30
Jan-
96
53.8
2 57
.80
1.07
3.
50
1.80
1.
00
0.00
0.
70Fe
b-96
54
.12
62.6
5 1.
16
2.80
0.
90
1.60
2.
60
0.50
Mar
-96
54.9
5 57
.19
1.04
0.
00
0.00
0.
20
0.20
0.
00A
pr-9
6 55
.62
55.1
9 0.
99
0.90
4.
60
19.1
0 0.
20
1.10
May
-96
56.6
4 58
.22
1.03
0.
30
5.30
43
.30
0.30
0.
00Ju
n-96
54
.83
59.8
1 1.
09
75.9
0 67
.10
18.1
0 13
.20
29.5
0Ju
l-96
54
.67
63.0
3 1.
15
88.2
0 61
.50
33.1
0 14
2.10
20
6.10
Aug
-96
55.2
3 64
.62
1.17
15
3.50
15
3.40
10
6.10
89
.60
246.
00Se
p-96
57
.44
61.1
7 1.
06
76.8
0 95
.20
49.6
0 64
.10
131.
60O
ct-9
6 55
.79
59.0
2 1.
06
7.30
50
.90
42.3
0 8.
00
20.3
0
DAT
E
MX
CAT
PR
U
SCAT
PR
P
R
RA
INC
HIH
R
AIN
DU
R
RA
INC
OA
R
AIN
SON
O
RA
INSI
NA
Nov
-96
58.2
9 63
.57
1.09
30
.70
9.30
9.
40
6.70
40
.00
Dec
-96
60.9
7 64
.11
1.05
0.
00
2.30
2.
60
0.00
0.
10Ja
n-97
64
.15
71.8
0 1.
12
7.80
27
.10
7.70
3.
20
30.9
0Fe
b-97
63
.68
76.5
7 1.
20
7.80
6.
20
24.5
0 8.
20
1.00
Mar
-97
64.1
2 84
.06
1.31
12
.40
15.0
0 61
.30
3.20
3.
50A
pr-9
7 64
.91
88.5
6 1.
36
32.8
0 22
.50
31.5
0 11
.60
33.6
0M
ay-9
7 65
.94
86.6
5 1.
31
24.2
0 19
.20
66.2
0 11
.20
7.00
Jun-
97
65.7
8 86
.78
1.32
37
.90
50.6
0 77
.20
7.20
32
.40
Jul-
97
67.3
6 87
.13
1.29
97
.80
82.5
0 25
.90
59.9
0 11
6.90
Aug
-97
68.1
6 82
.84
1.22
11
0.10
56
.50
17.3
0 13
4.00
14
8.70
Sep-
97
68.9
4 84
.86
1.23
68
.30
65.9
0 43
.20
56.4
0 16
0.60
Oct
-97
63.5
2 79
.25
1.25
5.
90
12.6
0 35
.00
3.40
24
.60
Nov
-97
65.4
8 81
.39
1.24
20
.70
21.8
0 17
.80
37.5
0 64
.80
Dec
-97
67.8
6 82
.57
1.22
29
.70
13.3
0 9.
60
59.8
0 46
.60
Jan-
98
65.1
5 90
.67
1.39
0.
10
0.20
3.
20
0.00
0.
00Fe
b-98
64
.50
87.6
6 1.
36
11.8
0 5.
30
5.20
33
.00
18.0
0M
ar-9
8 65
.30
93.9
4 1.
44
6.80
0.
10
18.1
0 10
.30
2.80
Apr
-98
65.2
5 89
.86
1.38
0.
00
0.40
0.
20
0.30
0.
10M
ay-9
8 63
.30
85.1
0 1.
34
0.10
0.
00
0.60
0.
00
0.00
Jun-
98
61.2
7 79
.32
1.29
16
.20
25.0
0 32
.80
20.9
0 11
.30
Jul-
98
62.1
5 74
.71
1.20
80
.10
69.4
0 10
.30
104.
30
151.
00A
ug-9
8 56
.32
71.8
3 1.
28
80.9
0 10
0.00
14
4.30
97
.20
190.
10Se
p-98
54
.83
67.8
9 1.
24
36.4
0 37
.50
56.1
0 55
.50
211.
30O
ct-9
8 56
.35
71.3
3 1.
27
0.00
0.
00
0.00
16
.40
0.00
Nov
-98
58.1
4 72
.04
1.24
0.
00
0.00
0.
00
6.50
0.
00D
ec-9
8 59
.11
75.1
4 1.
27
0.00
0.
00
0.00
2.
30
0.00
Jan-
99
57.7
0 78
.69
1.36
0.
00
0.00
0.
10
0.00
0.
00Fe
b-99
60
.12
86.2
6 1.
43
0.02
0.
00
0.00
0.
14
0.00
Mar
-99
63.0
1 84
.76
1.35
3.
25
0.18
22
.95
1.27
1.
40A
pr-9
9 64
.33
86.5
0 1.
34
3.55
0.
21
17.8
4 2.
90
0.91
May
-99
61.6
6 83
.53
1.35
2.
93
4.69
39
.28
0.00
0.
00Ju
n-99
63
.83
81.3
8 1.
28
29.9
8 96
.33
121.
54
20.2
3 83
.11
Jul-
99
64.5
7 83
.63
1.30
73
.15
83.6
3 30
.86
103.
57
191.
59A
ug-9
9 64
.67
83.9
8 1.
30
76.8
3 46
.45
84.9
2 79
.52
157.
82
DAT
E
MX
CAT
PR
U
SCAT
PR
P
R
RA
INC
HIH
R
AIN
DU
R
RA
INC
OA
R
AIN
SON
O
RA
INSI
NA

34 35
Sep-
99
65.3
4 81
.95
1.25
44
.07
33.1
1 10
.02
45.1
2 91
.33
Oct
-99
64.0
3 81
.31
1.27
2.
08
1.89
13
.71
10.4
8 26
.98
Nov
-99
66.1
5 84
.45
1.28
1.
31
5.80
0.
24
0.00
0.
94D
ec-9
9 65
.44
90.9
9 1.
39
1.82
2.
94
2.64
2.
06
0.72
Jan-
00
60.5
9 95
.38
1.57
0.
30
0.04
0.
46
0.08
0.
00Fe
b-00
60
.62
96.7
5 1.
60
0.09
0.
45
15.8
0 0.
64
0.00
Mar
-00
59.7
4 98
.32
1.65
4.
17
0.07
18
.46
20.8
0 1.
41A
pr-0
0 60
.10
98.5
6 1.
64
0.56
2.
55
9.58
0.
00
0.00
May
-00
61.4
2 94
.88
1.54
6.
83
20.5
1 29
.20
2.46
0.
70Ju
n-00
65
.36
98.0
8 1.
50
75.2
2 80
.22
88.4
0 48
.30
113.
08Ju
l-00
61
.84
100.
00
1.62
67
.24
61.1
4 16
.85
75.3
7 15
8.83
Aug
-00
63.0
4 89
.12
1.41
39
.08
60.6
7 25
.93
60.2
2 15
1.01
Sep-
00
61.3
5 88
.48
1.44
24
.40
47.9
8 48
.13
39.5
8 10
4.63
Oct
-00
63.3
8 92
.12
1.45
61
.42
36.3
1 82
.94
87.9
6 11
7.18
Nov
-00
64.8
6 97
.93
1.51
26
.74
8.30
42
.87
16.7
2 43
.90
Dec
-00
64.5
8 10
4.49
1.
62
0.56
0.
98
9.41
0.
05
1.18
Jan-
01
66.2
1 98
.39
1.49
9.
40
1.60
15
.00
21.8
0 5.
00Fe
b-01
63
.83
104.
88
1.64
18
.00
0.40
10
.20
10.1
0 12
.10
Mar
-01
64.8
0 10
4.94
1.
62
5.50
11
.60
24.7
0 5.
00
24.0
0A
pr-0
1 64
.14
107.
99
1.68
5.
90
11.9
0 16
.50
8.30
0.
00M
ay-0
1 62
.87
100.
00
1.59
11
.40
8.80
22
.80
2.20
1.
10Ju
n-01
62
.48
107.
50
1.72
34
.70
27.6
0 26
.20
20.3
0 42
.00
Jul-
01
63.0
0 10
4.25
1.
65
110.
30
70.8
0 23
.40
97.0
0 15
5.40
Aug
-01
63.1
2 10
4.25
1.
65
79.1
0 61
.30
40.9
0 59
.30
148.
80Se
p-01
65
.49
95.0
0 1.
45
32.6
0 32
.60
81.9
0 10
7.00
10
8.80
Oct
-01
64.9
8 91
.43
1.41
7.
00
16.9
0 12
.70
10.4
0 20
.20
Nov
-01
64.2
6 96
.42
1.50
6.
10
2.80
17
.80
0.50
2.
40D
ec-0
1 64
.08
97.9
5 1.
53
2.90
4.
80
13.0
0 5.
50
8.80
Jan-
02
64.0
0 96
.53
1.51
9.
60
2.10
1.
10
7.30
6.
30Fe
b-02
63
.52
99.6
6 1.
57
18.7
0 13
.70
6.30
20
.20
18.3
0M
ar-0
2 63
.20
96.5
1 1.
53
2.80
0.
00
1.50
0.
80
0.00
Apr
-02
64.1
7 93
.43
1.46
1.
60
3.10
20
.70
0.00
0.
20M
ay-0
2 66
.80
90.9
1 1.
36
11.7
0 25
.30
49.0
0 0.
00
0.00
Jun-
02
68.7
9 85
.38
1.24
19
.70
31.7
0 35
.40
1.00
1.
80
DAT
E
MX
CAT
PR
U
SCAT
PR
P
R
RA
INC
HIH
R
AIN
DU
R
RA
INC
OA
R
AIN
SON
O
RA
INSI
NA
Jul-
02
69.3
9 86
.92
1.25
12
6.10
78
.10
97.4
0 56
.10
112.
90A
ug-0
2 68
.69
88.7
9 1.
29
85.9
0 94
.20
16.6
0 65
.70
136.
20Se
p-02
69
.90
92.8
6 1.
33
36.6
0 83
.00
70.2
0 41
.50
169.
20O
ct-0
2 69
.74
90.3
9 1.
30
22.3
0 34
.30
113.
80
1.90
25
.10
Nov
-02
70.3
5 92
.65
1.32
3.
00
27.0
0 19
.20
6.10
7.
90D
ec-0
2 70
.59
93.3
6 1.
32
18.9
0 0.
30
2.60
26
.20
11.7
0Ja
n-03
73
.22
92.4
7 1.
26
6.80
7.
00
8.80
0.
70
0.60
Feb-
03
75.7
1 93
.64
1.24
28
.80
11.7
0 17
.00
37.5
0 23
.40
Mar
-03
75.5
3 94
.20
1.25
0.
80
0.10
9.
70
6.10
1.
30A
pr-0
3 73
.75
95.5
0 1.
29
3.40
2.
00
7.30
2.
00
1.30
May
-03
71.5
1 99
.25
1.39
11
.00
10.8
0 56
.40
2.20
0.
30Ju
n-03
73
.81
96.0
0 1.
30
36.4
0 61
.50
45.7
0 10
.00
16.8
0Ju
l-03
73
.24
98.7
8 1.
35
94.1
0 10
1.20
95
.30
69.5
0 12
9.80
Aug
-03
74.9
2 10
1.23
1.
35
73.8
0 64
.20
42.1
0 95
.40
147.
90Se
p-03
76
.13
108.
98
1.43
47
.70
129.
40
117.
80
68.9
0 18
0.40
Oct
-03
78.7
7 10
6.51
1.
35
67.6
0 46
.90
84.5
0 20
.50
26.7
0N
ov-0
3 80
.38
109.
79
1.37
4.
00
107.
00
5.20
5.
30
2.40
Dec
-03
83.9
8 11
4.39
1.
36
0.00
0.
00
1.90
1.
30
0.00
DAT
E
MX
CAT
PR
U
SCAT
PR
P
R
RA
INC
HIH
R
AIN
DU
R
RA
INC
OA
R
AIN
SON
O
RA
INSI
NA
Vari
able
Nam
e Va
riab
le D
efi n
itio
n
MX
CAT
PR
Mex
ican
cat
tle p
rice
($/
cwt)
U
SCAT
PR
U.S
. cat
tle p
rice
($/
cwt)
PR
U.S
. cat
tle p
rice
/Mex
ican
cat
tle p
rice
R
AIN
CH
IH
Rai
nfal
l for
Chi
huah
ua (
mm
)R
AIN
DU
R
Rai
nfal
l for
Dur
ango
(m
m)
RA
INC
OA
R
ainf
all f
or C
oahu
ila (
mm
)R
AIN
SON
O
Rai
nfal
l for
Son
ora
(mm
)R
AIN
SIN
A
Rai
nfal
l for
Sin
aloa
(m
m)

36 37
APPENDIX C–CHARTS OF INDEPENDENT VARIABLES
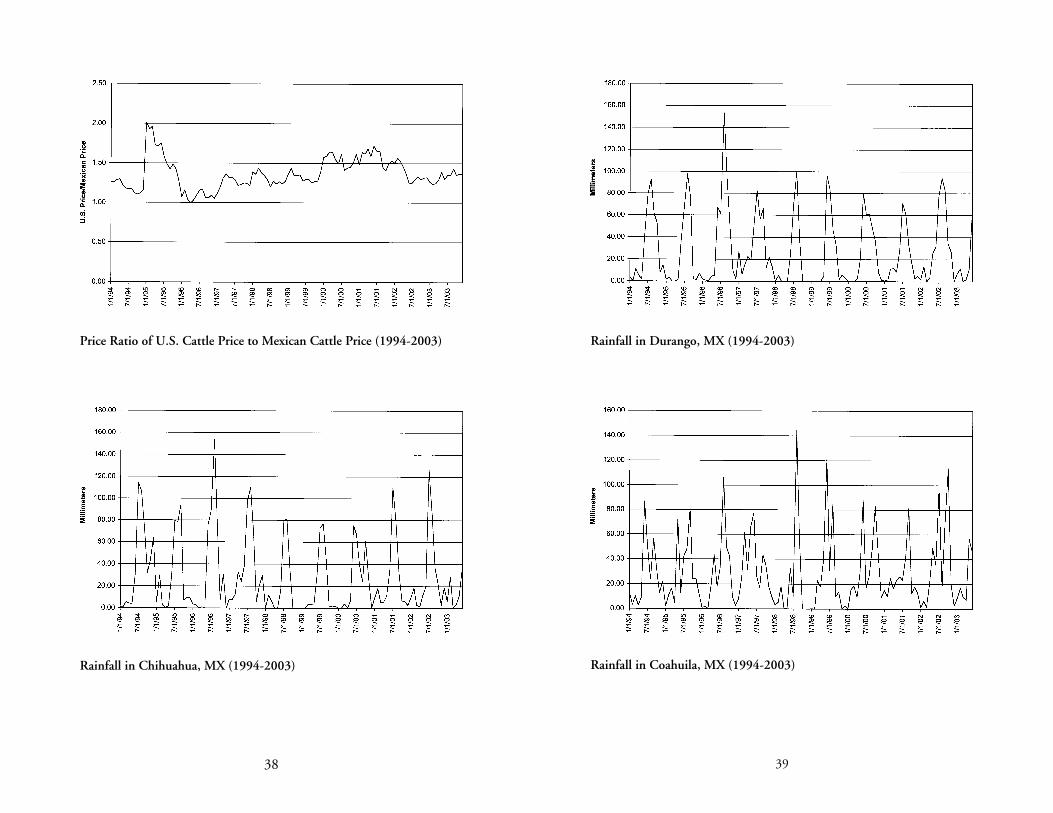
38 39
Price Ratio of U.S. Cattle Price to Mexican Cattle Price (1994-2003)
Rainfall in Chihuahua, MX (1994-2003)
Rainfall in Durango, MX (1994-2003)
Rainfall in Coahuila, MX (1994-2003)
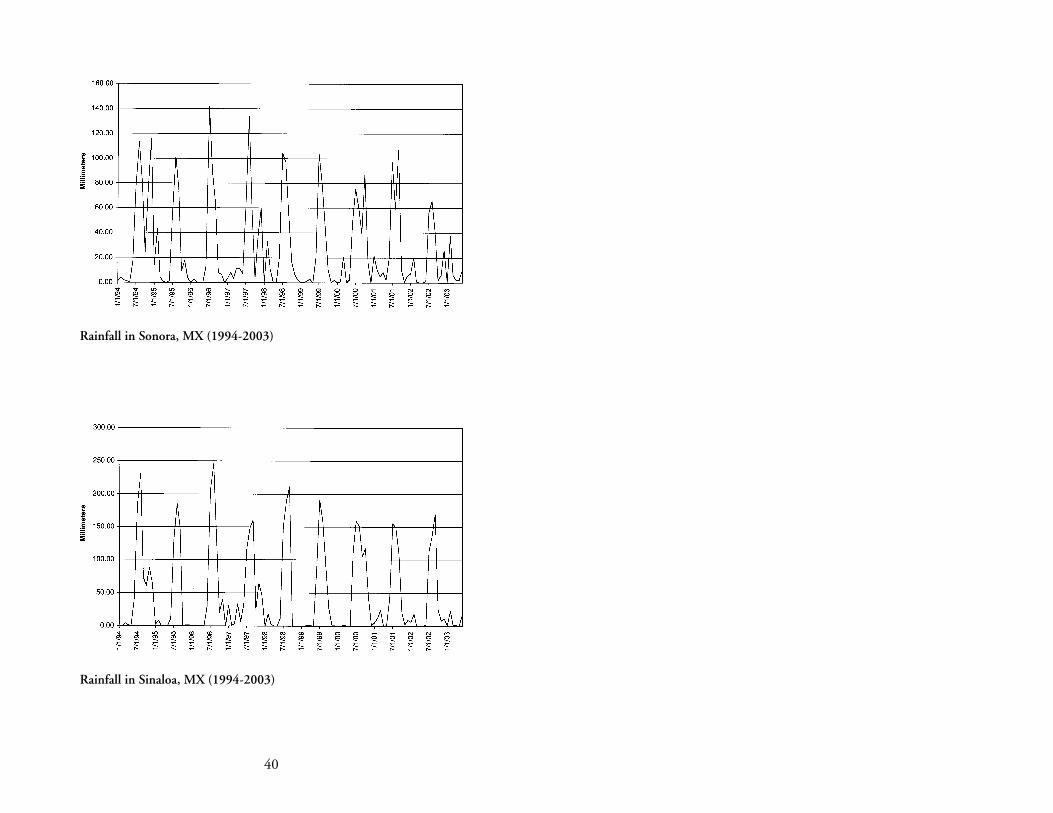
40
Rainfall in Sonora, MX (1994-2003)
Rainfall in Sinaloa, MX (1994-2003)
Related Documents