This thesis has been submitted in fulfilment of the requirements for a postgraduate degree (e.g. PhD, MPhil, DClinPsychol) at the University of Edinburgh. Please note the following terms and conditions of use: This work is protected by copyright and other intellectual property rights, which are retained by the thesis author, unless otherwise stated. A copy can be downloaded for personal non-commercial research or study, without prior permission or charge. This thesis cannot be reproduced or quoted extensively from without first obtaining permission in writing from the author. The content must not be changed in any way or sold commercially in any format or medium without the formal permission of the author. When referring to this work, full bibliographic details including the author, title, awarding institution and date of the thesis must be given.

Welcome message from author
This document is posted to help you gain knowledge. Please leave a comment to let me know what you think about it! Share it to your friends and learn new things together.
Transcript

This thesis has been submitted in fulfilment of the requirements for a postgraduate degree
(e.g. PhD, MPhil, DClinPsychol) at the University of Edinburgh. Please note the following
terms and conditions of use:
This work is protected by copyright and other intellectual property rights, which are
retained by the thesis author, unless otherwise stated.
A copy can be downloaded for personal non-commercial research or study, without
prior permission or charge.
This thesis cannot be reproduced or quoted extensively from without first obtaining
permission in writing from the author.
The content must not be changed in any way or sold commercially in any format or
medium without the formal permission of the author.
When referring to this work, full bibliographic details including the author, title,
awarding institution and date of the thesis must be given.

PhD Psychology – The University of Edinburgh – 2015
Understanding Optimism Caimei Liu

Contents
Acknowledgements ..................................................................................................... 6
Declaration .................................................................................................................. 7
Published works ......................................................................................................... 8
Abstract ....................................................................................................................... 9
Chapter 1: What is optimism? .................................................................................. 1
1.1 Origins and concepts of optimism................................................................ 1
1.2 Explanatory Style ......................................................................................... 4
1.2.1 Historical Development of models of explanatory Style ......................... 4
1.2.2 Measures of explanatory style .................................................................. 7
1.2.3 Stability and heritability of explanatory style ........................................ 11
1.2.4 Self-serving attributional bias and optimistic explanatory style ............ 12
1.2.5 Explanatory style, hopelessness, and depression ................................... 15
1.3 Dispositional Optimism ............................................................................. 16
1.3.1 Historical development of models of dispositional optimism ............... 16
1.3.2 Measures of dispositional optimism ...................................................... 19
1.3.3 Stability and heritability of dispositional optimism ............................... 20
1.4 Benefits of Optimism ................................................................................. 23
1.4.1 Optimism and physical well-being ........................................................ 24
1.4.2 Optimism and psychological well-being ................................................ 25
1.4.3 Optimism, resources, and success .......................................................... 29
1.4.4 Optimism interventions included in positive psychology interventions 31
1.4.5 Underlying mechanism: optimism and coping ...................................... 33
1.5 Outline of the current research ................................................................... 36
1.5.1 Optimism in positive psychology .......................................................... 36
1.5.2 Part I measurement and concepts of optimism ...................................... 38
1.5.3 Part II optimism interventions ................................................................ 40
1.5.4 Measures ................................................................................................ 41
1.5.5 Participants ............................................................................................. 47
Chapter 2: The psychometric construct of optimism ........................................... 50
2.1 The psychometric construct of the ASQ .................................................... 50
2.1.1 Myths about attributional style .............................................................. 50

2.1.2 Samples and instruments ........................................................................ 58
2.1.3 Testing models of causal attributions for positive and negative events . 59
2.1.4 Structural equation modeling ................................................................. 60
2.1.5 Replication final ASQ model ................................................................. 64
2.1.6 Schematic model of attributional style ................................................... 67
2.2 Separating optimism and pessimism .......................................................... 70
2.2.1 Previous understanding of dispositional optimism ................................ 70
2.2.2 Two-factor structure of the LOT ............................................................ 75
2.2.3 What we should know about dispositional optimism ............................ 80
Chapter 3: Optimism and personality ................................................................... 82
3.1 Is optimism a personality thing? ................................................................ 82
3.2 Methods ...................................................................................................... 91
3.3 Results ........................................................................................................ 92
3.4 Optimism and the Five-Factor Model of personality ............................... 112
Chapter 4: Optimism and psychological well-being ........................................... 117
4.1 Optimism and two approaches of well-being ........................................... 117
4.2 Samples and instruments .......................................................................... 123
4.3 Results ...................................................................................................... 125
4.4 Positive relationship between optimism and psychological well-being .. 133
Chapter 5: Cultural influence on optimism ......................................................... 136
5.1 Cultural issues: from the West to the East ............................................... 136
5.2 Prior studies investigating cultural differences in optimism .................... 137
5.3 The present study ..................................................................................... 141
5.3.1 Method ................................................................................................. 143
5.3.2 Results .................................................................................................. 144
5.3.3 Are Chinese people more optimistic than British people? ................... 155
Chapter 6: Extending thoughts on attributional bias ......................................... 158
6.1 What we know and what we don’t know about attributional bias ........... 158
6.2 Attributional evaluation system and possible attributional models ......... 162
6.3 Psychometric structure of the ASQ-Other ............................................... 166
6.4 Study 1: testing attributional models using ASQ and ASQ-Other ........... 172
6.5 Study 2: testing event-focused attibutional style using ASQ-General ..... 178
6.6 Attributional biases in reality ................................................................... 181

Chapter 7: Depression, positive psychology and optimism interventions ........ 184
7.1 Traditional treatments for depression ....................................................... 185
7.2 Rising of positive psychology interventions ............................................ 187
7.3 Optimism and depression ......................................................................... 188
7.3.1 Attributional style in depression .......................................................... 189
7.3.2 Dispositional optimism and depression ............................................... 195
7.4 How to manipulate optimism? ................................................................. 197
7.5 Empirical studies of optimism interventions ............................................ 200
7.5.1 Optimism interventions in nonclinical samples ................................... 201
7.5.2 Optimism intervention in clinical settings ........................................... 204
7.5.3 Optimism interventions in children and adolescents ........................... 206
7.6 Research questions ................................................................................... 207
Chapter 8: Optimism interventions for depression in first-year college students
.................................................................................................................................. 211
8.1 Study 1: individual optimism interventions with depression ................... 211
8.1.1 Intervention designs ............................................................................. 211
8.1.2 Method ................................................................................................. 213
8.1.3 Results .................................................................................................. 216
8.1.4 Discussion ............................................................................................ 223
8.2 Study 2: group optimism interventions with depression .......................... 225
8.2.1 Intervention designs ............................................................................. 225
8.2.2 Method ................................................................................................. 226
8.2.3 Results and analysis ............................................................................. 228
8.2.4 Discussion ............................................................................................ 235
8.3 General discussion ................................................................................... 235
Chapter 9: Understanding optimism .................................................................... 237
9.1 Summary of main findings ....................................................................... 238
9.2 Does culture make a difference ................................................................ 243
9.3 Do people exhibit bias in attributing causes to events happening to others?
246
9.4 Effective optimism interventions for depression ..................................... 248
9.5 Deeper understanding of optimism: theoretical contributions to optimism
literature and future directions ............................................................................. 250

9.6 Is optimism always good? Is pessimism always bad? The evolutionary
explanations for optimism and pessimism ........................................................... 253
Reference ................................................................................................................. 258

6
Acknowledgements
This thesis took a long time, and I have accumulated a debt of gratitude to many
people. I am grateful beyond measure to my supervisors, Timothy Bates and
Alexander Weiss for their support – a constant source of inspiration and
encouragement.
I would like to thank Timothy Bates and Tom Booth for helpful advice on modelling
and Shaoxian Zhou, Jimei Dong, Honejie Tian and Jianjian Teng for their support in
data collection. I am grateful to Dr. Martin Seligman and Dr. Carol Ryff who
authorized me to use their scales in my research.
Thanks to members of the wonderful Differential Club. The weekly meeting made it
possible for me to share updated information and new trends in differential
psychology with them.
I also had amazing support from my family. They provided wonderful emotional
support and good advice. And most of all, thanks to Lily, who shared every moment
in the last three and half years and gave me the confidence to keep going.

7
Declaration
I hereby declare that I am the author of this thesis and that the work presented herein
is my own. This work has not been submitted for any other degree or professional
qualification.

8
Published works
Liu, C., & Bates, T. C. (2014). The structure of attributional style: Cognitive styles
and optimism–pessimism bias in the Attributional Style Questionnaire.
Personality and Individual Differences, 66, 79-85.

9
Abstract
I present seven empirical studies that investigate two main themes regarding two
main approaches of optimism: explanatory style and dispositional optimism. The first
theme incorporates measurement issues and conceptual ideas of optimism and the
second involves optimism interventions on depressive symptoms. In Study 1 I
explored the potential psychometric structure of causal attributions and dispositional
optimism. Attributions may be best viewed as reflecting large differences in
cognitive style, and smaller independent positive- and negative-event biases. For
dispositional optimism, a two-factor model was supported. Study 2 examined
correlations between optimism and the Five-Factor Model of personality.
Dispositional optimism and explanatory style had similar association patterns with
personality, although there were some differences. Study 3 tested and supported a
model in which dispositional optimism mediates the link between explanatory style
and psychological well-being. Study 4 compared the levels of optimism expression
in two ethnic groups, finding that Mainland Chinese participants were more
optimistic and less pessimistic than White British. Study 5 examined attributional
biases and found that individuals show more optimistic biased style for themselves
than for other people. Studies 6 and 7 tested effectiveness of optimism interventions
on depressive symptoms. It demonstrated that self-monitored optimism interventions
on a daily basis could effectively reduce depressive symptoms and increase
optimistic explanatory style. Taken together, the studies replicated some previous
investigations regarding measurement issues and conceptual ideas of optimism, and
explored novel approaches to examining the essence of attributional bias and
effectiveness of optimism interventions in depression treatment. My investigation of
attributional bias is the first to test this idea using new and comparable measures of
attributions. Practicing self-administered optimism interventions is, to my knowledge,
also the first time these interventions have been applied in a sample with mild-to-
moderate depressive symptoms. This may provide an easily monitored and low-cost
alternative to traditional treatments of depression.

Understanding Optimism
Chapter 1: What is optimism 1
Chapter 1: What is optimism?
The optimist sees the rose and not its thorns; the pessimist stares at the thorns,
oblivious to the rose. – Kahlil Gibran (1951, p. 45)
1.1 Origins and concepts of optimism
Optimism from a philosophically historical view
As originally forwarded by Aristotle and as long noted by philosophers afterwards,
human beings are not merely what they are (actuality), but more essentially are what
they are not yet but can be (potentiality) (Chang, 2001a). This idea has been
prominently reflected in the subsequent literature of important philosophers. It was
believed that it is the power of potentiality that determines who and what we are and
how we exist in the world. Here the potentiality means that the range of possibilities
between the two opposite expectations of good or bad things happening, are
outstanding.
Though the roots of psychological accounts of optimism are believed to have
originated from the attempts of leading philosophers of the modern period (Domino
& Conway, 2001), the development of philosophical understanding of optimism can
be traced back to the articulations of the French philosopher Descartes (1596-1650),
who claimed “there is no soul so weak that it cannot, if well-directed, acquire an
absolute power over its passions” (Descartes, 1985).
The original sense of optimism comes from the Latin word optimum,
meaning ‘the best possible’, and technically has its roots in the writings of Gottfried
Leibniz (1646-1716). Leibniz (2010) believed it was God who created the universe
and described it as “the best of all possible worlds.” The term optimism was used to
name the unique maximum or minimum instance of an infinite class of possibilities
in his description. Later, several famous philosophers, including David Hume (1711-

Understanding Optimism
Chapter 1: What is optimism 2
1776), Georg Wilhelm Friedrich Hegel (1770-1831), and Friedrich Nietzsche (1844-
1900), all contributed to the development of psychological accounts of optimism
(Domino & Conway, 2001).
Psychologists have begun to pay attention to optimism from a philosophical
perspective as well. Though Sigmund Freud (1856-1939) was best known for his
pioneering and fundamental work in psychoanalysis, in later life he dedicated his
career to communicating a better social and anthropological understanding of his
essential psychoanalysis principles, which included the philosophical and
psychological status of optimism and pessimism. Freud (1961) claimed that striving
for happiness is in the nature of humans. This process is completed in two
simultaneous-existing forms: an individual wishes to feel extreme joy in life
experience and to avoid distress at the same time. Influenced by the political success
of Hitler’s Nazi party in the 1930s in Germany, Freud shifted from his originally
sceptical view for the future to being deeply pessimistic about the future of humans
(Domino & Conway, 2001). Another pioneering psychologist, William James (1842-
1910), felt similarly pessimistic towards the happiness of humans. However, James
put more emphasis on the individual level, claiming that only each individual has the
ultimate choice between optimism and pessimism (James, 1985).
The philosophical explanation of the origins and development of optimism
are still in progress. All the ideas illuminated above have contributed to our current
understanding of the nature of optimism theoretically. Many theorists have discussed
optimism in human nature in positive terms. One of the useful definitions of
optimism was contributed by anthropologist Tiger (1979, p. 18): “a mood or attitude
associated with an expectation about the social or material future – one which the
evaluator regards as socially desirable, to his [or her] advantage, or for his [or her]
pleasure”. Partly based on this definition, Peterson (2000a) regarded optimism as a
three-factor construct with cognitive, emotional and motivational aspects.
As stated above, optimism has long been discussed in positive terms as
generalized human nature by philosophers and theorists like Descartes, Leibniz,
Hume, and Hegel (Domino & Conway, 2001). At the same time, differential

Understanding Optimism
Chapter 1: What is optimism 3
psychologists began to address optimism as an individual difference, a trait people
possess to varying degrees. Though these two approaches of optimism, human nature
and individual difference, are basically consistent; the differential perspective
focuses more on the influence of an individual’s experience to the characteristic
optimism. Treating optimism as an individual difference means that it is a person’s
experience that influences whether one is optimistic or pessimistic (Peterson, 2000a).
Dictionary definitions of optimism
The Oxford Dictionary provides two related definitions of optimism. The first is
“hopefulness and confidence about the future or the success of something”. The
second conception seems a little bit broader, referring to the belief that “this world is
the best of all possible worlds”. Along the lines of the first definition, Scheier and
Carver (1987) identified optimism as dispositional optimism. Dispositional optimism
refers to positive expectations in a given situation (Scheier & Carver, 1987) and
recently has been conceptualized as broad and general expectancies (Scheier &
Carver, 1992, 1993). Following the second definition, the term optimism has been
applied to the habitual way that people explain their life events, and was identified as
an explanatory style (Seligman, 1991) or attributional style (Abramson, Seligman, &
Teasdale, 1978; Peterson et al., 1982).
While many other competitive models of optimism have been proposed, such
as the Hope construct (Snyder, 1989, 2002; Snyder et al., 1991), the leading
approaches of optimism are explanatory style and dispositional optimism (Carver,
Scheier, & Segerstrom, 2010; Forgeard & Seligman, 2012). These two concepts and
theoretical themes are my main concerns in this research. I will now turn to explicitly
describe these two models.

Understanding Optimism
Chapter 1: What is optimism 4
1.2 Explanatory Style
It has been claimed that individuals are naive psychologists who try to explain the
causes of their own behaviours and those of others (Heider, 1958). One of the
prevailing ideas in psychology is, then, that individuals inherently tend to come up
with explanations for behaviours and outcomes in their lives (Peterson, 2000a).
These views form the foundation of attributional theory. Attributions are taken as the
thoughts and beliefs people hold about the relationships between various
observations and life events, especially those thoughts and beliefs that seek to
explain causal relationships (Poropat, 2002).
1.2.1 Historical Development of models of explanatory Style
The development of attributional theory has a considerable history.
Three dimensions of attributional style
Research on attributional style is widely considered (Abramson et al., 1978) to have
begun with Heider (1958). Heider differentiated internality and externality as
perceived determinants of outcomes. Internality involves explanations “within the
person”, which occur when an individual blames him- or herself for a problem. By
contrast, external explanations turn for causal influences to factors “within the
environment”. These are exemplified in cases when one blames something outside of
oneself.
The next major enlargement of theories of explanatory style came with
Weiner (1974), who added stability as a second attributional component. According
to Weiner, stability refers to attributions about the consistent causes, for instance,
whether the cause is enduring or fleeting. The final enlargement, forming
attributional style theory as it exists today, was initiated by Abramson et al. (1978).
They proposed a three-dimensional model, which incorporated dimensions of
internality-externality, stability-instability, and globality. In this theory, internal and
external attributions resemble the framework of Heider (1958). Stable and instable
attributions are parallel with and the theory of Weiner (1974). Globality, the novel
attributional factor in this theory, is linked to predictions about how likely a causal
Understanding Optimism
Chapter 1: What is optimism 5
factor is to operate across a broad range of additional situations. These three
dimensions, internal versus external, stable versus unstable, and global versus
specific, have been combined to form the three-dimensional model of explanatory
style (Abramson et al., 1978).
During the 1980s, attributional style became a widely-accepted way of
defining and measuring optimism as an individual difference, and much of the
current research on attributions has been inspired by work on this three-dimensional
model of attributional style.
Development of the theory of explanatory style
During the early studies of Maier and Seligman (1976) with animals, it was found
that after being exposed to uncontrollable aversive stressors, animals give up and
become helpless, and later continue to act helpless even when the uncontrollable
negative situations are now under control. This similar phenomenon was tested and
supported on humans as well in later studies (Hiroto & Seligman, 1975; Klein,
Fencil-Morse, & Seligman, 1976), and was called “learned helplessness”. It was
presumed that after experiencing uncontrollable negative events, animals and people
become helpless because they have “learned” that there is no difference in responses
and their subsequent consequences (Maier & Seligman, 1976). Furthermore, this
learning is developed into a generalized expectation that it is futile to attempt a
different future by any action. Helplessness then occurs later following this
pessimistic generalized expectancy of action-outcome independence.
It has been found that certain individuals respond pessimistically after being
exposed to uncontrollable aversive events, while other individuals never give up and
become helpless in similar situations. To account for the different responses of
human helplessness following uncontrollable adversities, the three-dimensional
model of explanatory style was added to the original learned helplessness model.
(Abramson et al., 1978; Peterson et al., 1982). Theory of explanatory style assumes
that causal explanations for a negative event definitively determine whether a person
will develop general helplessness or not. If an individual attributes adversity to an

Understanding Optimism
Chapter 1: What is optimism 6
internal cause, self-esteem is thought to suffer. If they attribute adversity to long-
lasting (stable) causes, helplessness is thought to be enduring. If they attribute a
negative event to a global cause, helplessness is regarded as pervasive (Abramson et
al., 1978; Peterson et al., 1982).
Based on ideas of explanatory style, the reformulated learned helplessness
theory (Abramson et al., 1978) was developed. According to this theory, people
usually search for an explanation for events, especially negative ones occurring in
their lives. Explanation for negative events can vary along three dimensions: internal
versus external, stable versus unstable, and global versus specific (Abramson et al.,
1978). Later on, Seligman (1991) developed research of learned helplessness into
learned optimism by reframing the theory of explanatory style. Thoughts of
helplessness were transformed into optimistic explanatory style, or simply optimism.
Individuals may view negative events as having causes which are unstable, specific,
and external (an “optimistic explanatory style”) or as stable, global, and internal – a
pessimistic explanatory style (Buchanan & Seligman, 1995; C. Peterson & Steen,
2009). People who hold an pessimistic explanatory style will feel pessimistic and be
more prone to depression as a consequence (Peterson & Seligman, 1984). By
contrast, An individual who is characterized with an optimistic explanatory style
appears to be protective for depression (Seligman, 1991).
Generally speaking, explanatory style refers to habitual explanations people
provide for the causes of positive and negative events in terms of their stability,
globality, and internality (Peterson et al., 1982). As these explanations are predicted
to influence behaviour and mood – in particular depression – they are of clinical as
well as theoretical importance (Buchanan & Seligman, 1995; C. Peterson & Steen,
2009).

Understanding Optimism
Chapter 1: What is optimism 7
1.2.2 Measures of explanatory style
Explanatory style or attributional style is mainly reflected in the Attributional Style
Questionnaire (the ASQ; Peterson et al., 1982), which is the associated self-report
measure of attributional style. As Peterson et al. (1982, p. 288) said, ASQ ‘yields
scores for individual differences in the tendencies to attribute the causes of bad and
good events to internal (versus external), stable (versus unstable), and global (versus
specific) factors.’ Accordingly, this self-report questionnaire was developed to assess
the habitual explanation of life events in terms of the stability, globality, and
internality of the causes of positive and negative events (Peterson et al., 1982; 2011).
This questionnaire includes six positive events (e.g., “You do a project that is
highly appraised”) and six negative events (e.g., “You have been looking for a job
unsuccessfully for some time”). Each of these 12 different hypothetical events is
followed by a series of 4 questions which are arranged in the same order.
Respondents are asked to generate an explanation for each event (the first question),
and then to rate this explanation along three dimensions (the remaining three
questions): internal versus external, stable versus unstable, and global versus specific.
These three dimensions, internality, stability, and globality, are defined respectively
as “factors within the person or within the environment” (Heider, 1958), “the degree
of temporal consistency of the cause” (Scheier & Carver, 1987), and “the extent to
which the cause is perceived to recur in other situations” (Abramson et al., 1978).
Basically, the ASQ yields composite scores for explanatory style for positive
events (CoPos, CP, or ASQ Positive) and negative events (CoNeg, CN, or ASQ
Negative); as well as scores for six subscales (Internal Positive, Stable Positive and
Global Positive; Internal Negative, Stable Negative, and Global Negative). To
calculate an overall composite score (CPCN or ASQ Total) of explanatory style, the
negative-event composite is subtracted from the positive-event composite.
Based on responses to these three dimensions for each ASQ event, the subject
is assigned an optimistic or a pessimistic explanatory style. An optimistic
explanatory style consists of explaining positive events as enduring, global and
internally generated, while also explaining negative events as unstable, specific, and

Understanding Optimism
Chapter 1: What is optimism 8
externally caused (Forgeard & Seligman, 2012). Reflected in the measuring and
scoring of the ASQ, a positive score of CPCN represents an optimistic explanatory
style and a negative score of CPCN represents a pessimistic explanatory style.
Optimistic explanatory style scores have been linked to protection from depression
(Peterson & Seligman, 1984) and physical illness (Wise & Rosqvist, 2006) as well as
higher academic achievement, subjective and physical well-being, and career
achievement (Forgeard & Seligman, 2012).
Psychometric properties of the ASQ
Within attributional models of depression, the attributions are seen as causing
distinct behavioural consequences. For example, low self-esteem is predicted to
result from internal attributions regarding negative events, while chronic depression
is suggested to result from stable attributions for negative events (Peterson et al.,
1982). In this model of learned helplessness, depression emerges as a consequence of
experience with uncontrollable negative events (Abramson et al., 1978). The concept
of attributional style, however, predicts that the three types of explanation (internality,
stability, and globality) are correlated with each other within at least each event
valence.
However, more recent research based on this model has resulted in findings that
are somewhat counterintuitive. One of the earliest studies dealing with this question
was conducted by Peterson et al. (1982). They reported that attributions for positive
events and attributions for negative events were uncorrelated (r = .02). This lack of
correlation between explanatory styles for positive and negative events has been
found in other work as well. For example, P.J. Corr and J.A. Gray (1996) examined
the factor structure of the ASQ in two independent samples using Varimax rotated
principal components analysis. They found that positive and negative explanatory
styles were independent. Additionally, whereas for negative events, internality
ratings were largely independent of stability and globality ratings, for positive events
these three dimensions formed a single factor, suggesting that explanations for
positive and negative events might have different structures.

Understanding Optimism
Chapter 1: What is optimism 9
Succeeding studies have used larger samples, and incorporated confirmatory
structural equation modelling (SEM), allowing a better understanding of the structure
of attributions by contrasting competing theoretical models. For instance, Higgins,
Zumbo, and Hay (1999) reported a confirmatory factor analysis of the ASQ
identifying three correlated factors in a sample consisting of more than 1,000
subjects. This model was a good fit for attributions of both negative events and
positive events. Consistent with several other studies, the stability and globality
factors correlated strongly, with internality-externality being more independent of the
globality in this study.
Multi-method analytic strategies were incorporated later in attributional style
SEM analysis since it was realized that subjects are generating multiple responses to
each ASQ event. This is an important innovation, as misleading results can arise in
analyses of data generated from multiple correlated responses based on each item,
and it is true in the ASQ where all three attributions are samples for each event.
Based on this multi-method analysis strategy, it was confirmed that the three-
dimension structure of explanatory style still provided a good account of responses to
negative events in terms of correlated latent factors of internality-externality,
stability-instability, and globality-locality (Hewitt, Foxcroft, & MacDonald, 2004).
However, this model indicated higher correlations between internality and the other
two factors for negative events.
Other measures of explanatory style
In addition to the most widely-used tool, the ASQ, several other measures have been
developed to assess explanatory style. Most of these measurements are designed on
the basis of similar criteria and scoring method with the ASQ, though they consist of
different events or are adapted to suit subjects with diverse backgrounds. The
Expanded Attributional Style Questionnaire (EASQ;Peterson & Villanova, 1988) is
one such tool. The EASQ yields the same composite and subscale scores as the ASQ,
but contains only 24 negative events, each of which subjects indicate a cause of the
event and rate the three dimensions of internality, stability, and globality of the cause
on 7- point Likert scales. The EASQ is claimed to be a better measure in

Understanding Optimism
Chapter 1: What is optimism 10
investigations of the reformulated learned helplessness theory than the ASQ, since it
is believed that people’s explanatory style for negative events connects highly with
helplessness and depression (Metalsky, Joiner, Hardin, & Abramson, 1993) .
Based on the reformulated helplessness theory of depression (Abramson et al.,
1978), Abramson and Metalsky (1989) developed the self-report Cognitive Style
Questionnaire (CSQ) as another modified and expanded version of the ASQ. The
CSQ made two modifications to the ASQ. First, ratings of the probable consequences
and self-worth implications were added to each hypothetical event, which make it
possible to measure all three components of the cognitive vulnerability factor implied
in the reformulated learned helplessness theory. Second, the hypothetical events were
extended to include 12 positive and 12 negative events in the CSQ. In a review with
30 studies, Haeffel et al. (2008) reported the psychometric and validity properties of
the CSQ.
In addition to generally widely-accepted measures of explanatory style listed
above, there are some other explanatory style measures developed in specific
domains of different backgrounds (for a review, see Smith, Caputi, & Crittenden,
2013), such as the Academic Attributional Style Questionnaire (AASQ; Peterson &
Barrett, 1987), the Sport Attributional Style Scale (SASS; Hanrahan, Grove, & Hattie,
1989), the Team Attributional Style Questionnaire (TASQ; Shapcott & Carron,
2010), and the Workplace Explanations Survey (WES; Smith et al., 2013). The most
widely used measure for assessing children’s explanatory style is the Children’s
Attributional Style Questionnaire (CASQ; Kaslow, Tannenbau, & Seligman, 1978).
The CASQ consists of 24 positive and 24 negative hypothetical events. This
instrument has the same construction and format as the original ASQ.
The ASQ, the EASQ, the CSQ, the AASQ, the SASS, the TASQ, the WES,
and the CASQ are all self-report measures, among which the ASQ has been most-
widely used in application. The second popular way of assessing explanatory style is
the Content Analysis of Verbatim Explanations (CAVE; Peterson, Berres, &
Seligman, 1985) technique. This instrument was developed to assess explanatory
style by analysing statements, journal entries, speeches, and other written materials

Understanding Optimism
Chapter 1: What is optimism 11
which are believed to contain causal explanations. The CAVE has been frequently
used in studies of explanatory style and physical well-being considering its
advantage in longitudinal research (Peterson, 1988).
1.2.3 Stability and heritability of explanatory style
Is explanatory style a relatively stable personality trait? Are attributions stable
enough across time and situations to guarantee the existence of the designated
explanatory style? To answer these questions, the consistency of explanatory style
has been explored by several studies, which suggest that there is at least some
stability in attributional style over time and circumstances. For example, in a study
conducted by Tiggemann, Winefield, Winefield, and Goldney (1991), explanatory
style was measured in young adults across a period of three years. The results
showed that explanatory style tested in the first time period was moderately
correlated to explanatory style measured in the second (r = .44).
In another longitudinal study, Burns and Seligman (1989) reported that
explanatory style for negative events during early adulthood was positively related to
explanatory style for negative events 52 years later (r = .54), and the dimension of
stability accounted for most of the observed correlations of explanatory style for
negative events. Explanatory style for positive events, however, was not as stable as
that for negative events. The composite positive score at baseline was not
significantly correlated with the same test at 52 years later (r = .13).
The stability of explanatory style can be partly explained by its heritability or
the influence of biological factors on this trait. So far as I know, not many genetic
studies have been done to explore the heritability of explanatory style. In one
exception, Schulman, Keith, and Seligman (1993) conducted a pioneering twin study
with a sample of 115 pairs of identical twins and 27 pairs of dizygotic twins.
Participants were directed to complete the ASQ. The composite score summing up
responses to both positive and negative events (CPCN), the scores for the sub-scale
of negative events (CN), and reactions to the positive events (CP) were analysed
separately. For CPCN, the correlations were .48 for identical twins and 0.00 for
dizygotic twins, which suggests a substantial hereditary effect of explanatory style.

Understanding Optimism
Chapter 1: What is optimism 12
For CN, the correlations were .43 for identical twins and -.03 for dizygotic twins,
showing the same pattern as CPCN. In contrast, the scale for positive events (CP)
also showed a moderate correlation of .50 for identical twins. Comparatively,
however, the correlation for dizygotic twins was nearly as high (.41), which might
demonstrate a substantial effect of shared environment. The different patterns
suggest that heritability of explanatory style may be indirect.
1.2.4 Self-serving attributional bias and optimistic explanatory style
People have a need to view themselves positively. This is easily the most common
and consensually endorsed assumption in research on the self. – Heine, Lehman,
Markus, and Kitayama (1999, p. 766).
As one of the most important psychosocial systems of optimism, explanatory style or
attributional style has been the subject of a large body of research, which provides
consistent evidence for the linkage between this trait and many other psychological
traits. Such attributions can be functional and adaptive and may serve psychological
and social purposes when attributional bias applies (Mezulis, Abramson, Hyde, &
Hankin, 2004; Sanjuan & Magallares, 2014). This comes along with the proposal of
positive cognitive bias of human nature (Heider, 1958) and much prior research
concerning individuals’ biased attributions to happenings in their lives (Cadinu,
Arcuri, & Kodilja, 1993). Though attributional bias and explanatory style basically
share similar measures and scoring methods currently, they have been proposed and
studied mostly separately.
Attributional bias was argued to be manifested in two related and different
modes. One is self-serving attributional bias, which refers to the tendency of
individuals to explain negative events or outcomes with more external or contextual
causes, while attributing positive events or outcomes to more internal or controllable
causes (Mezulis et al., 2004). The other form of attributional bias is self-other bias,

Understanding Optimism
Chapter 1: What is optimism 13
assuming that individuals tend to promote a favourable perception in attribution of
the self in comparison to others (D. T. Miller & Ross, 1975). This tendency of self-
serving attributional bias is pervasive in the general population across age, ethics,
and psychopathology (Mezulis et al., 2004).
The theoretical basis of self-serving bias in attribution derived from the
interaction between motivation and cognition certainty, suggesting that people tend
to “accept responsibility for positive behavioural outcomes and to deny responsibility
for negative behavioural outcomes” (Bradley, 1978, p. 59). Prior studies addressing
self-serving attributional bias are quite varied in the measures and thus in the
operational definitions of this bias. This self-serving bias used to focus on the
attributional dimension of internality by assuming that individuals exhibit more
internal attributions for positive events than for negative events (Greenberg,
Pyszczynski, & Solomon, 1982; Nurmi, 1992).
With the development of the most widely-used measure of attributions, the ASQ,
it has been debated that it is insufficient to establish a self-serving attributional
pattern only using the internality dimension. Accordingly, this self-serving bias has
been extended to also include the other two dimensions of attributions, namely
stability and globality. Self-serving attributional bias is consequently conceptualized
as the tendency of people to attribute positive situations to more internal, stable, and
global causes than for negative situations (Mezulis et al., 2004).
Though self-serving attributional bias and optimistic explanatory style have been
reported separately in most of previous studies, these two concepts have similar
definitions since self-serving bias has been conceptualized within the three-
dimensional model of attributions. While an optimistic explanatory style consists of
explaining positive events as enduring, global and internally generated, while also
explaining negative events as unstable, specific, and externally caused (Forgeard &
Seligman, 2012); self-serving attributional bias is defined as the tendency of people
to attribute positive situations to more internal, stable, and global causes than for
negative situations (Mezulis et al., 2004). Accordingly, an optimistic explanatory
style is a positive pattern consistent with self-serving attributional bias defined above,

Understanding Optimism
Chapter 1: What is optimism 14
or, in other words, self-serving attributional bias is the universal positive bias in
explanatory style.
Evidence of interchangeability between these two concepts is found in the
similarity of measuring and scoring as well. Basically, the ASQ and the adaptation
versions of the ASQ were among the most commonly used self-report measures in
prior studies of self-serving attributional bias (for review, see Mezulis et al., 2004).
While a more “optimistic” attributional style for a domain means higher scores for
positive events and a lower score for negative events for that domain (Forgeard &
Seligman, 2012), a self-serving attributional bias represents a positive score when
attributions for negative outcomes are subtracted from attributions for positive
outcomes (Sanjuan & Magallares, 2014). Specifically, on one hand, if the subtraction
score of the ASQ Negative from the ASQ Positive is positive, it represents a self-
serving attributional bias or an optimistic explanatory style, reflecting stronger
attributions along internal, stable and global causes for positive than for negative
events. On the other hand, if the subtraction score of the ASQ Negative from the
ASQ Positive is negative, it then stands for lack of a self-serving attributional bias or
an optimistic explanatory style, reflecting weaker attributions for positive than for
negative events (Sanjuan & Magallares, 2014).
Moreover, prior research along both lines of optimistic explanatory style and
self-serving attributional bias is consistent in their findings of beneficial influences
on well-being (Forgeard & Seligman, 2012; Mezulis et al., 2004). For reasons of
consistency, in my research of positive bias in attributions, the tendency of holding
an optimistic explanatory style and the tendency of expressing a self-serving
attributional bias will be referred to as equal to each other, both referring to the
tendency of individuals to explain positive situations through internal, stable and
global causes, and negative situations to external, unstable and specific causes. That
is, self-serving attributional bias is taken as the tendency of holding an optimistic
explanatory style in explanation of positive and negative events normally specified in
the ASQ.

Understanding Optimism
Chapter 1: What is optimism 15
1.2.5 Explanatory style, hopelessness, and depression
Hopelessness is an important concept in establishment and development of the
hopelessness theory of depression (Abramson, Metalsky, & Alloy, 1989), in which
depression is conceptualized as an overabundance of negative moods and negative
cognition. According to the hopelessness theory of depression, hopelessness is
conceptualized as the expectancy that future outcomes will be stable, global, and will
negatively influence many aspects of an individual’s life regardless of his or her
efforts (Abramson et al., 1989). As a result, hopelessness about the future constitutes
a sufficient and proximal cause of a subtype of depression, called hopelessness
depression (Abramson et al., 1989). ‘The hopelessness theory represents a theory-
based approach to the classification of a subset of the depressive disorders and
postulates the existence in nature of hopelessness depression…’ (Abramson et al.,
1989, p. 359).
Abramson et al. (1989) pointed out that hopeless depression are more likely
to occur when negative events are attributed to stable and global causes.
Comparatively, the influence of internality dimension is deemphasized when
symptoms of hopelessness depression are discussed. Separation between the
internality dimension and the other two attributional dimensions (stability and
globality) was supported by empirical studies. For instance, Higgins et al. (1999)
reported a confirmatory factor analysis of the ASQ identifying three-correlated
factors in over 1,000 subjects. It indicated that the stability and globality factors
correlated strongly (r = .61 for negative events, r = .67 for positive events), with
internality-externality being more independent of the globality (r = .35 for negative
events, r = .28 for positive events). Thus, in ASQ, Hopelessness (stability + globality
of negative events) is produced as a composite score separately from other composite
scores.
This attributional model of depression has accumulated substantial evidence
from empirical studies (e.g. Vazquez, Jimenez, Saura, & Avia, 2001). For instance,
295 secondary school students were instructed to complete measures of attributional
style, self-esteem, and depression (Kurtovic, 2012). This study indicated that
hopelessness correlated significantly with depression (r = .58). Similarly, Ahrens and
Haaga (1993) reported that hopelessness is significantly correlated with depressive

Understanding Optimism
Chapter 1: What is optimism 16
symptoms (r = .20) (Peterson & Vaidya, 2001). Cross-sectional studies propose that a
pessimistic attributional style is correlated with hopelessness and thus depression. On
the other hand, an optimistic explanatory style has been linked to protection from
depression. A pessimistic explanatory style predicts increases in depression over time
in different populations, such as lower-class women, children, and depressed patients
(Peterson & Seligman, 1984). Peterson and Vaidya (2001) reported that hopelessness
positively correlated with depression in their study with a group of college students (r
= .20).
1.3 Dispositional Optimism
As mentioned in the beginning of this chapter, one of the two related concepts of
optimism provided theoretically by the Oxford Dictionary is “hopefulness and
confidence about the future or the success of something”. Consistent with this
dictionary definition and following traditional folk wisdom about optimism, Scheier
and Carver (1987) have studied a personality trait identified as dispositional
optimism. Based on theoretical studies on the expectancy-value model and self-
regulatory model, dispositional optimism originally referred to positive expectations
in a given situation and later was conceptualized as broad and general expectancies
(Scheier & Carver, 1992, 1993).
Framed within the definition of dispositional optimism, being optimistic
means simply that people expect good things to happen to them in the future, and
being pessimistic means that people expect bad experience in the future (Carver et al.,
2010; Scheier & Carver, 1987). It has long been believed that the level of generalized
favourable expectancies for the future is related prospectively with many, perhaps all,
facets of life (Carver & Scheier, 2014). This belief has been supported by a good deal
of systematic studies in the past 25 years or so (Carver et al., 2010; Scheier & Carver,
1987, 1992).
1.3.1 Historical development of models of dispositional optimism

Understanding Optimism
Chapter 1: What is optimism 17
The perspective of “dispositional optimism” originated theoretically from the
expectancy-value model and has been developed from research conducted by Scheier
and Carver (2001). There is a long history of theoretical research on motivation of
behaviour, and two facets have been identified in the proposed expectancy-value
model. On one hand, it is assumed that people act around the pursuit of goals (Austin
& Vancouver, 1996). Goals are states or actions that people take as desirable or
undesirable. The more important a given goal is to an individual, the greater is the
element of value in the person’s motivation to pursue this goal. People have no
motivation to act without having a goal that is valued to some extent. That is, people
are inclined to fit their actions to values they regard as desirable.
On the other hand, expectancy was proposed to be the other conceptual
element of the motivation model (Carver & Scheier, 2001). The assumption of
expectancy is linked to a sense of confidence and doubt about a given goal’s
attainability or avoidability. A person has no desire to take action if he or she lacks
confidence. Only if people have adequate confidence will they move into effort.
Confidence and doubt are also important for a person to continue or quit an action.
Based on this model of motivation, dispositional optimism was proposed and
is seen as a broad and generalized version of confidence and persistence in pursuit of
desirable goals (Scheier & Carver, 1992). It is assumed that optimism should be
continuous even when progress is difficult or slow in the face of adversity (Carver et
al., 2010). According to Carver and Scheier (2001), virtually all fields of human
activity can be defined in term of goal pursuit, and people’s thoughts and actions
imply the identification and adoption of goals and the adjustment of behaviour
toward these goals. As a result, Carver and Scheier (2001) refer to their perspective
in dispositional optimism as a self-regulatory approach. To be specific, optimism
enters into a self-regulatory loop when people ask themselves about the obstacles to
pursuing the goals they have adopted. Do people still believe they can achieve their
desirable goals in the face of impediments? Optimists and pessimists are
differentiated depending on their belief. If people are confident in achieving the goals
even in face of difficulties, they are seen as being optimistic; if not, they are
pessimistic individuals.

Understanding Optimism
Chapter 1: What is optimism 18
Carver et al. (Carver et al., 2010; Scheier & Carver, 1992) stated that
“optimism and pessimism are confidence and doubt […] pertaining to life, rather
than to just a specific context”. Here we can see that optimism and pessimism are
broad, generalized versions of expectations to future life, rather than to just a specific
narrow context. And this generalized confidence or doubt will continue during actual
behaviour even in the face of difficulties.

Understanding Optimism
Chapter 1: What is optimism 19
1.3.2 Measures of dispositional optimism
To assess dispositional optimism, researchers ask people directly whether they
expect outcomes in their future lives to be beneficial or unbeneficial (Scheier &
Carver, 1992). This way of assessing dispositional optimism is acquired by using
self-report questionnaires such as the Life Orientation Test (LOT; Scheier & Carver,
1985) or its successor the Life Orientation Test-Revised (LOT - R; Scheier, Carver,
& Bridges, 1994).
The LOT consists of 12 items (four filler items included), in which four are
described in a positive direction (e.g., “I always look on the bright side of things”),
and four in a negative direction (e.g., “I rarely count on good things happening to
me”). Respondents are directed to assess the extent to which they agree with each of
the 12 items on a 5-point scale (4 = strongly agree, 3 = agree, 2 - neutral, 1 =
disagree, and 0 = strongly disagree).
The LOT was revised later to resolve indistinguishable problems among
dispositional optimism and other personality traits, such as Neuroticism (Scheier et al.
(1994). Two originally problematic (positively worded) items were eliminated. To
keep the scoring balance between positively worded and negatively worded items,
one new positively worded item was added and one negatively worded item was
removed. As a result, the LOT-R consists of 10 items (four filler items included), in
which three items are keyed in a positive perspective and three in a negative
direction. For each item, respondents assess their levels of agreement or
disagreement on a 5-point scale.
Scheier and Carver (1985) originally proposed the LOT to measure a one-
dimensional bipolar construct of dispositional optimism. For LOT-R, (Scheier et al.,
1994) also proposed that “confirmatory factor analysis further indicated that the
single-factor solution was superior to a two-factor one.” However, evidence
indicated that the two-factor model, which declared that optimism and pessimism
represent two distinct traits, was proposed and replicated in many studies later
(Chang, Maydeu-Olivares, & D'Zurilla, 1997; L. Chang & McBrideChang, 1996;
Creed, Patton, & Bartrum, 2002; Roysamb & Strype, 2002). The applicability of this

Understanding Optimism
Chapter 1: What is optimism 20
two-factor model was also supported in studies with Eastern subjects (Cheng &
Hamid, 1997; Li, 2012; Sumi, 2004).
1.3.3 Stability and heritability of dispositional optimism
Stability of dispositional optimism
Is dispositional optimism a relatively stable personality trait across time and
situations? How consistent is an individual’s level of dispositional optimism? As
with most personality traits, test-retest reliabilities are relatively high in several
longitudinal studies (although it is not always the case). For instance, within a group
of 182 middle-generation women, Atienza, Stephens, and Townsend (2004) found
the LOT test-retest correlation of .73 across a one-year period.
Lucas, Diener, and Suh (1996) conducted one study across a period of four
weeks, during which 212 college students were required to assess their dispositional
optimism twice using the LOT. The test-retest correlation of dispositional optimism
between the two periods was .76. Also, with a group of 82 college students,
Billingsley, Waehler, and Hardin (1993) reported a test-retest correlation of .78 for
the LOT across a period of four weeks. In the pioneering study of LOT formation,
Scheier and Carver (1985) found an even higher test-retest correlation of .79., based
on assessments of 142 participants within a four-week interval. Studies conducted in
Eastern societies have also reported the stability of the LOT and the LOT-R. For
instance, in a Hong Kong Chinese sample, test-retest reliability coefficients across a
period of five months were reported as .68 for the LOT and .66 for the LOT-R (Lai,
Cheung, Lee, & Yu, 1998).
However, research results on consistency of dispositional optimism over
longer time periods are controversial. For example, in a study across a 10.4 year
period in a group of 209 middle-aged women, Matthews, Räikkönen, Sutton-Tyrrell,
and Kuller (2004) found a test-retest correlation of .71, similarly to other traits.
However, in another 10-year-period study conducted by Suzanne C. Segerstrom
(2007), the LOT test-retest correlation of dispositional optimism was only .35.

Understanding Optimism
Chapter 1: What is optimism 21
Though there were less than 100 participants, the result nevertheless indicated that
change in dispositional optimism is possible at least for some people.
Heritability of dispositional optimism
The definition of dispositional optimism as a general tendency to have positive or
negative expectancies (Scheier & Carver, 1987) is compatible with ideas of
evolutionary psychology addressing the general characteristics of a species.
To test the heritability of dispositional optimism, Plomin et al. (1992)
conducted the pioneering study in a sample of more than 500 same-sex pairs of
middle-aged identical and fraternal twins, half of whom were reared together (126
pairs of identical and 146 pairs of fraternal twins) and half raised apart (72 pairs of
identical and 178 pairs of fraternal twins). Participants took the LOT twice over a
period of three years. For identical twins reared apart, the correlations indicated
heritabilities of 23% for LOT optimism and 27% for LOT pessimism. As expected,
the correlations for identical twins raised together were lower, 39% for LOT
optimism and 20% for LOT pessimism. Generally speaking, a heritability of 25% for
optimism was reported in this study. Similarly, in a sample consisted of 428 Italian
twin pairs (aged 23-24 years), Caprara et al. (2009) reported a heritability of 28% for
dispositional optimism.
Research on the heritability power of dispositional optimism has also
conducted in much larger samples. For instance, Mosing, Zietsch, Shekar, Wright,
and Martin (2009) measured dispositional optimism in 3,053 Australian twins
(ranging in age from 50 to 94 years) using the LOT over 50 years. The sample
included 501 identical female twins, 153 identical male twins, 274 dizygotic female
twins, 77 dizygotic male twins, 242 dizygotic opposite-sex twin pairs, and 561 single
twins (without participation of the co-twin). This study revealed that additive genetic
factors explained 36% of the variation in dispositional optimism. This sample was
combined with 406 pairs of Swedish twins later to analyse the relationship between
dispositional optimism and mental health (Mosing, Pedersen, Martin, & Wright,
2010). A heritability estimate of 34% for dispositional optimism was reported in this

Understanding Optimism
Chapter 1: What is optimism 22
combined sample. Another twin study conducted by Mosing et al. (2012) explored
the relationship between dispositional optimism and longevity, and it indicated that
the association between dispositional optimism and longevity may have genetic
involvement as well.
In addition to genetic behavioural studies that directly investigate the
heritability power of dispositional optimism, some other studies offered evidence
using different approaches. For example, in a study with two separate population-
based cohorts, Rius-Ottenheim et al. (2012) reported that parental longevity was
positively associated with dispositional optimism in adult offspring, indicating some
sort of genetic underpinning in this personality trait. Later, J. J. Yu and Ko (2013)
investigated the link between father’s and child’s dispositional optimism in a sample
of 422 father-child dyads in South Korea. It found that father’s dispositional
optimism was positively correlated with child’s dispositional optimism (r = .55).
These kinds of studies support the heredity of dispositional optimism from the aspect
of generation transmission.
Previous research based on twin studies suggests that heritabilities of
dispositional optimism (.25-.36) are not that high (compared with typical personality
traits) but statistically significant, indicating that there is stability in dispositional
optimism and an influence of genetic factors on this trait. Attempts to identify
specific genomic elements underlying variations of optimism have shown mixed
results (see review of Carver & Scheier, 2014). It also should be kept in mind that,
like all other personality traits, optimism is still affected by non-shared
environmental effects, or the experiences people have in life.

Understanding Optimism
Chapter 1: What is optimism 23
1.4 Benefits of Optimism
Optimism has had a constantly favourable reputation over the years. A variety of
poets, writers, philosophers, psychologists, and social workers, have described
optimism as greatly beneficial to both individuals and the general world around us
(Chang, 2001b). On the other hand, pessimism is considered as at least contributing
to depression, passivity, morbidity, and failure. It is believed that optimism has had
an adaptive value in dealing with environmental risks and life challenges over the
million or so years of evolution (Tiger, 1979). And, this adaptive advantage of being
optimistic still works for people to achieve more in current life (Seligman, 2011).
Optimism is a cognitive construct intertwined with emotional, motivational,
and behavioural processes, and research of optimism has extended to diverse
directions in psychological studies (Carver & Scheier, 2014). Research over the past
three decades has documented beneficial effects of optimism on enhancing well-
being. A large and growing literature indicates that, no matter how optimism is
conceptualized and measured, it is linked to positive emotions and behaviours; to
prominent physical well-being; to persistence and active coping strategies; to
outstanding academic and occupational performance; and even to resilient and
adaptive social relationships (for reviews, see Andersson, 1996; Carver & Scheier,
2014; Carver et al., 2010; Forgeard & Seligman, 2012; Scheier & Carver, 1992).
Regarding the two optimism models, optimistic explanatory style scores have
been linked to protection from depression (Peterson & Seligman, 1984) and physical
illness (Wise & Rosqvist, 2006) as well as higher academic achievement, subjective
and physical well-being, and career achievement (Forgeard & Seligman, 2012).
Similarly, self-serving attributional bias has also long been positively associated with
mental and physical health (for review, see Mezulis et al., 2004). Not surprisingly,
the studies of dispositional optimism have shown that higher levels of optimism are
correlated with positive life outcomes in various contexts (Carver et al., 2010;
Scheier & Carver, 1987, 1992, 1993). Generally speaking, no matter how optimism
is conceptualized and measured, research is uniform in indicating that optimism is

Understanding Optimism
Chapter 1: What is optimism 24
bonded with beneficial characteristics: happiness, achievement, health, and
persistence.
1.4.1 Optimism and physical well-being
Based on the widely accepted perspective that optimism is generally beneficial in life
of human being, increasing number of physicians has acknowledged the benefits of
thoughts and emotions characterized by optimism on physical well-being (Peterson
& Bossio, 2001; Rasmussen, Scheier, & Greenhouse, 2009).
Explanatory style examines the habitual explanations people provide for
events, and is seen as a distal influence on helplessness and failures of adaption that
involve helplessness (Peterson & Seligman, 1984; Seligman, 1991, 2011). This
expectation of helplessness is theoretically linked to outcomes such as physical well-
being. Empirical studies concerning this issue have been facilitated by development
of widely accepted measures of attributional style, such as the ASQ and CAVE.
Having a higher level of dispositional optimism has also been consistently
involved with better physical health. The potential mechanism underlying this
correlation is that thinking positively about the future may result in a more active
attitude towards the stressors of life than thinking pessimistically, and lower stressor
responses may lead to less physical detriments on the body, and may result in better
physical health as a final result (Carver et al., 2010).
Numerous studies have been conducted to examine the positive link between
optimism (including both explanatory style and dispositional optimism) and physical
health based on both general settings (see reviews by Forgeard & Seligman, 2012;
Kamen & Seligman, 1987; Norvell, 1992; Peterson, 1988, 2000b; Rasmussen et al.,
2009; Scheier & Carver, 1987, 1992; Seligman, 1989; Snyder, 2002) and many
different specific contexts, including the immune system (Suzanne C. Segerstrom &
Sephton, 2010), chronic pain (Goodin & Bulls, 2013), cancer, AIDS (Tomakowsky,
Lumley, Markowitz, & Frank, 2001), cardiovascular health (Bennett & Elliott, 2005;
Giltay, Geleijnse, Zitman, Hoekstra, & Schouten, 2004), carotid atherosclerosis
(Matthews et al., 2004), ambulatory blood pressure (Räikkönen & Matthews, 2008),

Understanding Optimism
Chapter 1: What is optimism 25
coronary heart disease (Tindle et al., 2009), and bone marrow transplantation
(Hochhausen et al., 2007). There is also evidence that optimists show more adaptive
sleep patterns both for children (Lemola et al., 2011) and adults (Lemola, Raikkonen,
Gomez, & Allemand, 2013).
Rasmussen et al. (2009) conducted a meta–analysis using 108 studies
exploring the relationship between optimism (including dispositional optimism and
explanatory style) and physical health, and reported an overall correlation of .18 (p
< .001) between optimism and physical health outcomes, and this correlation
remained significance even after adjusting for Neuroticism and psychosocial factors.
Taken together, optimism is characterized by its health-promoting properties, though
it is still not quite clear what the possible mechanisms are linking optimism and
health.
1.4.2 Optimism and psychological well-being
Well-being has been measured largely in two distinct traditions, hedonic and
eudemonic well-being, or of subjective well-being and psychological well-being,
with the former normally measured with the Satisfaction with Life Scale (SWLS;
Diener, Emmons, Larsen, & Griffin, 1985) and the Positive and Negative Affect
Schedule (PANAS; Watson, Clark, & Tellegen, 1988), and the latter being most
widely implemented using the Ryff scales of psychological well-being (RSPW; Ryff,
1989; Ryff & Keyes, 1995).
While subjective well-being focuses on happiness and pleasure (Diener, Suh,
Lucas, & Smith, 1999), psychological well-being, which stems from the tradition of
eudemonic well-being and was further developed in the field of positive psychology,
emphasizes the fulfilment of human potential (Ryff, 1995). According to Ryff (1989),
psychological well-being is defined by six related dimensions, including autonomy,
environmental mastery, personal growth, positive relations with others, purpose in
life, and self-acceptance.

Understanding Optimism
Chapter 1: What is optimism 26
Explanatory style and subjective well-being
Explanatory style is a distal influence on helplessness and failures of adaption that
involve helplessness. As Wise and Rosqvist (2006, p. 293) said, “Explanatory style
can have a significant and prolonged impact on well-being. Whereas pessimistic
explanatory style can negatively impact several facets of well-being, …, optimistic
explanatory style may serve as a protective factor”.
It seems that individuals with an optimistic explanatory style tend to have
promising expectations for the future, believing that good will prevail and whatever
events are being experienced will all be worthwhile in the end. Moreover, individuals
with an optimistic explanatory style tend to accept stressful experiences because of
this viewpoint. These beliefs and acceptance help individuals who have an optimistic
explanatory style to cope effectively with challenging and demanding situations.
Effective and positive coping then finally facilitates well-being.
The argument that explanatory style predicts well-being arises from many
studies associating depressive symptoms with a pessimistic explanatory style,
measured with the ASQ or the CAVE. For example, Peterson and Seligman (1984)
reviewed a variety of evidence showing that a pessimistic explanatory style predicts
increases in depression over time in different populations, such as lower-class
women, children and depressed patients. Similarly, Ahrens and Haaga (1993)
reported that attributional style for positive events was associated with positive
affectivity (r = .47), and attributional style for negative events was associated with
negative affectivity (r = .21), depression (r = .31), and anxiety (r = .38). In addition,
hopelessness (stability and globality of the ASQ) is significantly correlated with
depressive symptoms (r = .20) (Peterson & Vaidya, 2001).
Additionally, one study conducted on a sample of 280 adults who were
divided into three age groups reported that a pessimistic explanatory style in negative
affiliation domains correlated significantly with depressive symptoms in older adults
(Isaacowitz, 2005). The positive relationship between explanatory style for negative
events and depression was also supported by an SEM-approach study, in which the

Understanding Optimism
Chapter 1: What is optimism 27
correlation between these two variables was reported as .30 (Ledrich & Gana, 2013).
Further, in a recent study, Sanjuan and Magallares (2014) reported the positive
correlations between self-serving attributional bias and higher scores of life
satisfaction (r = .31) and affect balance (r = .46). Longitudinal studies also give
support to the beneficial effect of an optimistic explanatory style on mental health.
For example, in a four-week follow-up study with a group of 167 college students,
Kleiman, Liu, and Riskind (2013) found that an optimistic attributional style
predicted decreased levels of stressful events over the following four weeks, even
when symptoms of depression were controlled for.
The links between explanatory style and subjective well-being have also been
investigated in a wide range of contexts including different stressful situations, such
as heart transplant patients (Jowsey et al., 2012), breast cancer patients (Colby &
Shifren, 2013), and patients with advanced cancer (Applebaum, Stein, Rosenfeld, &
Breitbart, 2012). Results of these studies indicated significant positive association
between an optimistic explanatory style and overall subjective well-being.
Dispositional optimism and subjective well-being
People with a high level of dispositional optimism tend to expect good things to
happen to them in the future, even when confronting difficulties. This general
tendency yields a relatively positive mix of feelings and adaptive coping strategies,
which enhancing subjective well-being and good health (Wrosch & Scheier, 2003).
The relationship between dispositional optimism and subjective well-being
has been investigated in numerous studies, which mainly used the LOT or LOT-R. In
a review of 56 studies (Andersson, 1996), it was reported that the average weighted
correlation between dispositional optimism and depressive symptoms was -.45.
Peterson and Vaidya (2001) also reported that expectations were significantly
correlated with depressive symptoms (r = -.55).
Studies conducted in people in different life stages revealed that being
optimistic is a beneficial property for both young and old people. For example, with
a group of 504 high school students, Creed et al. (2002) found that students with high

Understanding Optimism
Chapter 1: What is optimism 28
level of dispositional optimism scored low on psychological distress. Isaacowitz
(2005) addressed this issue in a wider range with three age groups (young, middle-
aged, and older adults). The study reported that dispositional optimism correlated
with greater life satisfaction and lower levels of depressive symptoms across all three
age groups. It also found that dispositional optimism was correlated with positive
affect (r = .44) in one study with 225 adults aged from 65 to 94 years (Ferguson &
Goodwin, 2010).
Evidence from twin studies provides further support for the positive aspects
of being optimistic. Plomin et al. (1992) reported (n = 500) that dispositional
optimism was significantly associated with depression and life satisfaction (.54 on
average). These associations remain significant even after Neuroticism is controlled
for. This result is further supported by another twin study with a larger sample (n =
1,304). It indicated that dispositional optimism predicts high levels of mental health
(Mosing et al., 2010; Mosing et al., 2009).
Studies conducted on people in stressful situations may better explain the
significant correlations tween optimism and subjective well-being. Those situation-
specific studies involved different groups of participants including gay men with
AIDS (Taylor et al., 1992), skin cancer patients (Luo & Isaacowitz, 2007), patients
with breast cancer (Colby & Shifren, 2013), muscle disease patients (Graham et al.,
2014), freshmen in college (Brissette, Scheier, & Carver, 2002; Chemers, Hu, &
Garcia, 2001; Rand, Martin, & Shea, 2011), ethnic minority adolescents in urban
areas (Vacek, Coyle, & Vera, 2010), women after childbirth (Carver & Gaines, 1987),
and older widows in their first single year (Minton, Hertzog, Barron, French, &
Reiter-Palmon, 2009). In summary, previous research indicates that individuals
scoring high on optimism tests are more likely to perform adaptive, health-promoting
behaviors even when they confronted with challenging situations.
Is this positive correlation between dispositional optimism and subjective
well-being consistent across time? This issue has been addressed in at least one
longitudinal study. This study investigated the effects of optimism on subjective
well-being at two time points over a six-year interval, and reported that being

Understanding Optimism
Chapter 1: What is optimism 29
optimistic was correlated with higher levels of positive affect and life satisfaction
(Daukantaite & Zukauskiene, 2012).
Optimism and psychological well-being
Several studies have reported the positive relationship between dispositional
optimism and psychological well-being. For example, Augusto-Landa, Pulido-
Martos, and Lopez-Zafra (2011) reported in a sample of 217 undergraduates that
dispositional optimism showed significant positive associations with all six
dimensions of psychological well-being (r ranged from .38 to .59).
Similarly, in a study conducted within a group of 225 older adults, Ferguson
and Goodwin (2010) found that dispositional optimism was positively correlated
with Purpose in Life (one of the six dimensions of psychological well-being). The
positive correlation between dispositional optimism and psychological well-being
was reported in an adolescent sample as well. It revealed that LOT-R scores were
positively correlated with all six dimensions of the RPWB (r ranged from .32 to .56)
(Monzani, Steca, & Greco, 2014).
The relationship between explanatory style and psychological well-being has
not been reported in previous literature as to my knowledge.
1.4.3 Optimism, resources, and success
Optimists normally have more positive feelings and feel happier than pessimists in
various contexts. Due to the better coping strategies and better psychological
adjustments optimists have, and the resulting better health than pessimists, it is
plausible to infer that being optimistic can transform short-term optimistic tendencies
to a long-term approach of persistent goal pursuit and active coping strategies, which
endows optimists with more advantageous socio-economic resources and superior
opportunities for being successful than pessimists. Gould, Dieffenbach, and Moffett
(2002) interviewed 10 Olympic champions about their psychological characteristics.
They found that extraordinary athletic performance was characterized by higher than
average level of dispositional optimism and hope. Here next I will review some

Understanding Optimism
Chapter 1: What is optimism 30
related empirical studies in the literature illustrating the positive relationship between
optimism, resources, and success.
Previous studies demonstrate that students with higher levels of optimism
deal more easily with their first-year transition both socially and academically than
students scored lower in optimism. For example, a group of freshmen took a battery
of measures (including dispositional optimism, self-esteem, coping, depression,
perceived stress, and perceived social support) both at the beginning and at the end of
the starting semester (n = 89). Students with higher levels of dispositional optimism
experienced fewer increases in stress and depression, and greater increases in access
to social networks than pessimistic students over the first semester of college
(Brissette et al., 2002). Similarly, in a much larger sample of college freshmen (n =
2,189), L. S. Nes, Evans, and Segerstrom (2009) also found that optimistic students
had better psychological adjustment and motivation than pessimists in the period of
college transition. Students with a higher level of dispositional optimism were more
likely to return to school for the second year, with increased motivation and
decreased distress.
Similar results were found in studies involving attributional style in academic
backgrounds. For example, Peterson and Barrett (1987) reported that first-year
students with a positive explanatory style were more likely to have specific academic
goals and to utilize academic advising systems more efficiently, resulting in higher
grades on exams than students with a negative explanatory style. Benefits of an
optimistic explanatory style was expanded to athletic performance as well (Gordon,
2008).
Other studies have shown that optimists may also have better job
performance and higher income than pessimists. For instance, in a study conducted
within groups of insurance agents, Seligman and Schulman (1986) found that people
with a more positive explanatory style were more likely to keep their jobs after the
internship period, and tended to get a higher level of assessment on job performance.
Suzanne C. Segerstrom (2007) investigated the association between dispositional
optimism and several social resources in a group of law students. The 10-year

Understanding Optimism
Chapter 1: What is optimism 31
follow-up study found that students with higher levels of optimism before starting
school predicted higher income 10 years later. Further, both self-serving attributional
bias and dispositional optimism were found to be positively correlated with self-
confidence and forecast of future performance in a study with a group of MBA
students (Libby & Rennekamp, 2012).
One reason for the positive link between optimism and job performance may
be due to higher levels of career planning in optimists. Creed et al. (2002) found that
dispositional optimism was positively correlated with career exploration and career
planning. People who scored highly on the LOT-R produced more career-related
goals, and expressed more confidence about their career planning.
In addition, the benefits of being optimistic on social domain may also partly
account for optimists’ success in academic and career performance. MacLeod and
Conway (2005) reported that people with more positive expectations for the future
tended to have broader social networks. The longitudinal study described earlier also
demonstrated that increases in optimism were linked to developing larger social
networks across a 10-year period, indicating that optimism and social networks may
reinforce each other (Suzanne C. Segerstrom, 2007). Basically, optimists are
assumed to hold a better management in social relationships than pessimists (for a
review, see Carver & Scheier, 2014).
1.4.4 Optimism interventions included in positive psychology interventions
Psychologists and therapists have traditionally equated mental health with the
absence of mental illness. When a patient improved, he or she was taken to be
psychologically well. This view was fundamentally changed when positive
psychology was merged into mental health research and practice (Seligman, Steen,
Park, & Peterson, 2005). Previous research has shown that well-being can be
promoted by engaging in diverse positive activities, such as savouring (Bryant &
Veroff, 2007), practicing forgiveness (Reed & Enright, 2006), using signature
strengths (Linley, Nielsen, Wood, Gillett, & Biswas-Diener, 2010), and expressing
optimism and gratitude (Lyubomirsky, Dickerhoof, Boehm, & Sheldon, 2011). These

Understanding Optimism
Chapter 1: What is optimism 32
activities, so-called positive psychology interventions (PPI), aim to boost positive
emotions, thoughts, and behaviours, and other desirable consequences. Empirical
studies have indicated that these positive activities are effective for promoting well-
being and decreasing negative symptoms (for a review, see Sin, Della Porta, &
Lyubomirsky, 2011).
Even before the promotion of positive psychology by the American
Psychology Association, many different kinds of positive intervention methods had
been developed, though it is true that this trend has been greatly enhanced since
positive psychology has emerged. With the development of positive psychology
interventions, more and more controlled PPI designs began to explore their clinical
practice on people with mental illness, especially depression. A growing number of
positive psychology interventions have been tested on people with depressive
symptoms and those clinically diagnosed with depressive disorders.
The efficacy of specific positive perspectives has been proved in promoting
well-being and decreasing depressive disorders. A meta-analysis of 51 positive
psychology interventions (including optimism interventions) revealed that this form
of treatment is effective for improving well-being (r=0.29) and ameliorating
depressive symptoms (r=0.31). Findings suggested that clinicians should be
encouraged to incorporate positive psychology techniques into their clinical work,
particularly for treating depression. Also, delivering positive psychology
interventions as individual and group therapy and for relatively longer periods of
time is strongly suggested (Sin & Lyubomirsky, 2009).
Another review paper on positive psychology intervention research proposed
neural models for how such treatment might relieve depression, based on theory and
outcomes of research in social psychology, affective neuroscience and
psychopharmacology (Layous, Chancellor, Lyubomirsky, Wang, & Doraiswamy,
2011). For clinical depression treatments, some pioneering positive psychology
interventions, which consist of multiple positive-psychology based exercises, have
also been developed. For example, Seligman and colleagues (2006) proposed
positive psychotherapy (PPT) based on his new conceptualization of happiness and
previous positive psychology interventions in clinical practice.

Understanding Optimism
Chapter 1: What is optimism 33
Seligman and colleagues (2006) carried out a pilot study for testing the
efficacy of individual PPT. Thirty-two participants diagnosed with MDD (scores
more than 50 on the ASRS) were assigned to three groups: individual PPT group,
treatment as usual group (TAU), and TAU and antidepressant medications group
(TAUMED). For this study, PPT, which consisted of 14 sessions (including
optimism and hope interventions) during a period of 12 weeks, was administered to
address both positive and negative aspects of the clients. It showed that clients in the
PPT group reported greater well-being, more improvement in depressive symptoms,
and higher rates of remission, compared with clients in the other two groups. By
identifying and using the client’s character strengths, PPT established a balance
between promoting positive emotions and reducing negative depression. It was a
remarkable benefit for the clients to be taught positive social techniques, which
greatly promoted their consciousness of being kind, having gratitude and savouring
life.
Optimism interventions have been integrated with other positive activities in
most of previous practices, and have been tested singularly as well in some multi-
intervention studies. Research shows that optimism interventions are effective in
enhancing well-being and deducing negative emotions (Austenfeld, Paolo, & Stanton,
2006; Burton & King, 2004; Fosnaugh, Geers, & Wellman, 2009; Littman-Ovadia &
Nir, 2014; Meevissen, Peters, & Alberts, 2011).
1.4.5 Underlying mechanism: optimism and coping
It has long been believed that optimism may confer positive effects on psychological
and physical well-being (Carver et al., 2010; Nes & Segerstrom, 2006). The potential
mechanism underlying these benefits has been explored in numerous studies, the
majority of which proposed the importance of coping strategies. Coping is regarded
as a straightforward influence of optimism and pessimism regarding how people feel
when they encounter problems (Carver et al., 2010).
Theoretically, coping has been defined as “the cognitive and behavioural
efforts made to master, tolerate, or reduce external and internal demands and
conflicts among them” (Folkman & Lazarus, 1980). By this definition and the

Understanding Optimism
Chapter 1: What is optimism 34
differential nature of people, it is plausible to expect people are different in coping
with problems or stressful situations within their own environments. Additionally,
the widely accepted distinction in conceptualizing coping is between problem-
focused coping and emotion-focused coping (Folkman & Lazarus, 1980; Folkman &
Moskowitz, 2004), in which the former addresses external demands of stressors and
the latter addresses internal demands of problems. Another distinction conceptualizes
coping as approach coping (dealing with the demands of the stressors) and avoidance
coping (escaping from the demands of the stressors or emotions related to the
stressors) (Suls & Fletcher, 1985).
Theoretically, the construct of dispositional optimism stemmed from an
expectancy-value model in which behaviour embodies the pursuit of desired goals,
and a general self-regulatory model in which positive expectations arouse increased
effort to achieve desired goals (Carver & Scheier, 2001; Scheier & Carver, 1985).
This assumption is supported in empirical studies and shows that positive
expectancies lead to involvement and continued effort to attain desired goals,
whereas pessimistic expectancies lead to disengagement and reduced effort from
goal pursuit (L. S. Nes, Segerstrom, & Sephton, 2005). As a personality trait,
optimism could affect particular ways of thinking and behaving. It is reasonable to
expect that there is a potential mediating role of coping between optimism and
adjustment to specific situations.
Scheier and Carver (1985) reported their findings about the beneficial effects
of dispositional optimism on physical well-being, and proposed that these benefits
could be attributed to the increased likelihood of successful coping held by optimists
who normally take actions early when being confronted with problems. This claim
was supported by a study within a group of college students (Scheier, Weintraub, &
Carver, 1986). The authors found that optimists and pessimists differ in the strategies
they use to cope with stressful episodes. Compared with pessimistic participants,
optimistic subjects prefer problem-focused coping when they confront stressful
situations. The optimists seek social support and focus on positive aspects of the
stressful episodes. Comparatively, pessimists tend to use emotional-focused coping
and emphasize stressful feelings.

Understanding Optimism
Chapter 1: What is optimism 35
A number of studies further support the potential role of coping strategy for
mediating optimism and stress. In one study, undergraduates were asked to recall the
most stressful event they had experienced in the last month and complete a survey of
coping strategies relating to that event (Carver, Scheier, & Weintraub, 1989). The
authors found that dispositional optimism was positively correlated with active
problem-focused coping (r = .32). Billingsley et al. (1993) reported similar results in
their study, which was conducted with 82 college students over a period of four
weeks (r = .38 for Time 1 and r = .29 for Time 2). In another study with a larger
sample (420 undergraduates), dispositional optimism was also found to be positively
correlated with active coping strategy (r = .23) (Fontaine, Manstead, & Wagner,
1993). A meta-analysis of 56 studies revealed that the average weighted correlation
between dispositional optimism and coping strategies was .20 (Andersson, 1996).
Differences in coping strategies between optimists and pessimists have been
investigated in some studies with specific contexts. For instance, in one pioneering
study conducted within a group of cancer patients (Carver et al., 1993), 59 patients
who were diagnosed with early-stage breast cancer were interviewed to assess their
levels of optimism and coping strategies before and after their surgeries. It revealed
that optimistic patients initiated coping efforts before surgery and used different
coping strategies to deal with the crisis. Another study with a larger sample of 165
breast cancer patients reported similar results (Schou, Ekeberg, & Ruland, 2005).
High levels of dispositional optimism have been linked to positive coping styles in
some specific groups, such as women executives (Fry, 1995), cancer patients
(Horney et al., 2011; Llewellyn et al., 2013), HIV-infected patients (Rogers, Hansen,
Levy, Tate, & Sikkema, 2005), postnatal women (Rauch, Defever, Oetting, Graham-
Bermann, & Seng, 2013), and athletes (Chirivella, Checa, & Budzynska, 2013;
Nicholls, Polman, Levy, & Backhouse, 2008; Thompson, Gaudreau, Hoar, Hadd, &
Lelievre, 2008), and with particular backgrounds, including the work environment
(Strutton & Lumpkin, 1992) and posttraumatic situations (Prati & Pietrantoni, 2009).
Nes and Segerstrom (2006) investigated the relationship between
dispositional optimism and coping strategy in one meta-analysis (K = 50, N =
11.629). Both categories of coping distinctions (problem-focus versus emotion-focus,

Understanding Optimism
Chapter 1: What is optimism 36
and approach versus avoidance) were included. Analysis results showed that
dispositional optimism correlated positively with problem-focused coping (r = .13)
and approach coping (r = .17), and correlated negatively with emotion-focused
coping (r = -.08) and avoidance coping (r = -.21). It revealed that optimists are
inclined to eliminate, reduce, or handle stressors or related emotions when
confronting stressful situations, while pessimists seek to ignore, avoid, or escape
from stressors or emotions emerged. This stable coping tendency is especially
apparent for the distinction between approach and avoidance coping strategies.
The potential mediating role of coping between optimism and beneficial
results has been mainly restricted to dispositional optimism in previous literature to
my knowledge. There are few studies examining the potential mechanism
underpinning the benefits of explanatory style in the literature so far. Some
researchers, however, began to address this issue recently. For example, in a study
conducted with 205 adults, Sanjuan and Magallares (2014) found that attributional
style was positively correlated with active coping (r = .35) and negatively correlated
with avoidant coping (r = -.35). Structure model analysis indicated that coping
strategies mediated the relationship between attributional style and subjective well-
being.
1.5 Outline of the current research
1.5.1 Optimism in positive psychology
Though optimism has long been a focus of interest in the field of psychology, it has
been expanded exponentially since the initiating and rising of positive psychology.
The underlying assumption of positive psychology is that positive states or
traits are not necessarily the obverse of negative experiences and traits; and positive
emotions and behaviours are described by a completely separate psychological
process that functions via an isolated neural mechanism (Duckworth, Steen, &
Seligman, 2005). Positive psychology was proposed as ‘the scientific study of
positive experience and positive individual traits, ..., a field concerned with well-

Understanding Optimism
Chapter 1: What is optimism 37
being and optimal functioning…’ (Duckworth et al., 2005). On the basic level,
positive subjective experience in the past (e.g. life satisfaction), the present (e.g.
sensual pleasure), and in the future (e.g. optimism) are taken as important individual
levels in positive psychology (Seligman, 2002).
One reason I have focused on optimism emerges from the basic findings of
this trait in positive psychology. Positive psychology often focuses on well-being as
an outcome (Duckworth et al., 2005). It also focuses on resources for resilience, or
character strengths (Park, Peterson, & Seligman, 2004). Park et al. (2004) reported
that of 24 character strengths that he identified one, optimism, had the strongest link
to life satisfaction – one of three significant marks of well-being. Over the last 35
years, hundreds of cross-sectional and longitudinal studies have revealed that
optimism is positively associated with a host of psychological variables, such as self-
esteem, academic achievement, coping strategy, positive emotions, and perhaps most
importantly, predicts psychological and physical well-being both in the presence and
absence of stressors (Carver & Scheier, 2014; Carver et al., 2010; Forgeard &
Seligman, 2012; Scheier & Carver, 1992). Optimism seems to be a desirable
personality trait and individual variable, attracting more and more attention in the
field of positive psychology.
Another reason to focus on optimism came from some promising findings for
optimism interventions. Based on the widely-accepted correlations between
optimism and many other positive outcomes across individuals and contexts, positive
interventions in optimism have been designed to improve psychological well-being
by enhancing an individual’s optimistic expectations. Some optimism interventions
have been practiced in longitudinal experimental studies (Duckworth et al., 2005;
Seligman et al., 2006). In some of these studies, optimism interventions were
combined into the whole framework of positive psychotherapy (e.g. Seligman et al.,
2006; Seligman et al., 2005). In some other studies, optimism interventions were
taken as main therapy methods (e.g. Johnstone, Rooney, Hassan, & Kane, 2014;
Littman-Ovadia & Nir, 2014; Meevissen et al., 2011). Results of these studies
supported that optimism interventions were effective in increasing psychological
well-being and reducing negative emotions.

Understanding Optimism
Chapter 1: What is optimism 38
As described earlier, optimism has been conceptualized and measured in
different ways, among which dispositional optimism and optimistic explanatory
style are regarded as two main contrasting approaches (Carver et al., 2010; Forgeard
& Seligman, 2012). Though there are other psychological constructs proposed as
explanations for the optimistic thinking process, such as the cognitive model of hope
(Snyder et al., 1991), here in my research, optimism, if not specified, refers to the
two main approaches, dispositional optimism and explanatory style.
There are many promising aspects of optimism to be investigated and
explored. Over the last three and half years, my work focused mainly on two themes,
of which the first is to understand what optimism is and how we measure it, and the
second is to explore the possibility of optimism interventions on depressive
symptoms. The research described in the thesis consists of two main parts. Part I
incorporates measurement issues and conceptual ideas of optimism (from Chapter 2
to Chapter 6). Part II involves optimism interventions on depressive symptoms
(Chapter 7 and Chapter 8).
1.5.2 Part I measurement and concepts of optimism
In the first part of my study, I focus on some basic and important aspects of optimism,
including five points that concern measurement and concepts of explanatory style
and dispositional optimism.
First, I investigated the potential psychometric structure of the ASQ and the
LOT-R. As the most widely-accepted measure for explanatory style and for
dispositional optimism respectively, the ASQ and the LOT-R have been applied in
numerous studies. As mentioned earlier, the ASQ assigns subjects an optimistic or a
pessimistic explanatory style. An optimistic explanatory style consists of explaining
positive events as enduring, global and internally generated, while also explaining
negative events as unstable, specific, and externally caused (Forgeard & Seligman,
2012). If we are to understand the mechanism by which clinical and life outcomes
are influenced by explanatory style, it is important that we understand the structure
of the ASQ, decomposing the complex admixture of attributions, valences and events.

Understanding Optimism
Chapter 1: What is optimism 39
These components may have effects that are not apparent in a simple summing up of
positive and negative scores.
Similarly, though the LOT-R was originally supposed to measure a one-
dimensional bipolar construct of dispositional optimism (Scheier et al., 1994),
evidence from some studies indicates that the positively and negatively phrased items
in the measure split into two factors – dispositional optimism and dispositional
pessimism (e.g. Chang et al., 1997). It is important to address this issue before we
apply the LOT-R in our other studies.
Second, both explanatory style and dispositional optimism have been
assessed in their linkage to traditional personality traits, and most studies found that
optimism was positively correlated with Extraversion, and negatively correlated with
Neuroticism (e.g. Boland & Cappeliez, 1997). However, inconsistent results were
found in other studies. For example, Musgrave-Marquart, Bromley, and Dalley (1997)
reported that optimistic explanatory style was modestly correlated with
Conscientiousness but none of the other dimensions of the personality scale. Since
optimism is taken as relatively stable individual personality trait, it is important to
use traditional and well-established personality constructs as external criteria,
investigating the relationship between optimism and personality traits. So, I
examined correlations between two main approaches of optimism, explanatory style
and dispositional optimism, and the Five-Factor Model of personality (FFM; McCrae
& Costa, 1987).
Third, though optimism has been linked to well-being in previous studies and
both optimistic explanatory style and dispositional optimism have been identified as
positive factors in promoting well-being, few investigations have tested both
dispositional optimism and explanatory style in the research of psychological well-
being. Additionally, studies in which both explanatory style and dispositional
optimism are measured in the same sample have yielded inconsistent results on the
relationship between these two constructs. My study aimed to test a mediating model
in which dispositional optimism mediates the link between explanatory style and
psychological well-being.

Understanding Optimism
Chapter 1: What is optimism 40
Next, optimism-related research in recent years has been mainly conducted in
Westerners or English-speaking countries particularly, and it therefore may be less
valid for understanding the behaviours in population of other cultures. Since
examination of optimism across different cultural and ethnic groups is a crucial but
often neglected concern, the potential cultural differences between certain Easterners
(Mainland Chinese) and Westerners (White British) were investigated. I compared
the levels of optimism expression in these two ethnic groups, and explored cultural
indications of the results.
Finally, after examination of basic and fundamental issues in psychometric
structure and associations with personality and psychological well-being, I conducted
a pilot study on the basis of core concepts and measurement of attributional style.
Previous research has confirmed that people often give optimistically biased
attributions regarding themselves. However, it remains unclear what individuals
would do when they are explaining the same events for other people. I examined
attributional biases using new measures that are adapted from the standard ASQ.
1.5.3 Part II optimism interventions
Because of all the direct or indirect associations between optimism and personal and
social benefits, it is not surprising that optimism is reported to be relevant to clinical
psychology. Though positive psychology interventions have been applied in some
pioneering studies, very little systematic work has been done to investigate potential
advantageous effects of optimism interventions on psychotherapy applications in
concrete settings. How to convert the benefits of optimism to systematic and
effective interventions assisting pessimists to cope more actively with adversities in
their lives is still underexplored.
Optimism interventions applied in previous studies consisted of different
manipulation techniques, in which the Best Possible Self (BPS; Lyubomirsky et al.,
2011), and the self-administered optimism training (SOT; Fresco, Moore, Walt, &
Craighead, 2009) have been developed on the theoretic basis of dispositional
optimism and explanatory style respectively. Applications of these two optimism
manipulations in empirical studies have yielded results confirming the positive

Understanding Optimism
Chapter 1: What is optimism 41
effects of optimism interventions on enhancing well-being. However, no research
including both these optimism interventions has been conducted so far to my
knowledge.
On the basis of previous findings that both these optimism techniques are
effective in promoting psychological well-being and reducing depressive symptoms,
in the second part of my research, I designed and conducted two studies to test the
advantages of optimism interventions in reducing dysphoria. Two different optimism
manipulations were adapted from the BPS and SOT respectively. These two
optimism intervention strategies were applied in two experiments in two
undergraduate samples, aiming to investigate the beneficial effect of optimism
interventions on depressive symptoms.
1.5.4 Measures
Eight measures in total were involved in my research.
1.5.4.1 The Attibutional Style Questionnaire (ASQ)
The original English version of the ASQ (Peterson et al., 1982) was used to measure
explanatory style of the British students. Attributional Style of Mainland Chinese
participants was measured using a Mainland Chinese version of the ASQ (Zhang,
2006). The original English version of the ASQ was obtained from Dr Seligman,
who granted permission to use this test for research purposes.
Just as the original English version of ASQ, the Chinese ASQ is composed of
12 different hypothetical situations, consisting of 6 positive events (e.g., “You do a
project that is highly appraised”) and 6 negative events (e.g., “You have been
looking for a job unsuccessfully for some time”). Each of these 12 different
hypothetical situations is followed by a series of 4 questions which are arranged in
the same order. The first question following each situation asks for the one major
cause of the situation. This question is not used in scoring and simply serves as an
aid to better answer the remaining questions. The remaining three questions are
arranged in the same order for each situation and measure three different dimensions.
The second question following each situation measures whether the subject’s

Understanding Optimism
Chapter 1: What is optimism 42
response is internal or external (e.g. “is the cause of your unsuccessful job search due
to something about you or to something about other people or circumstances”). The
third question following each situation measures whether the subject’s response is
stable or unstable (e.g. “in the future when looking for a job, will this cause again be
present”). The fourth question following each situation measures whether the
subject’s response is global or specific (e.g. “is the cause something that just
influences looking for a job or does it also influences other areas of your life”).
For each response, subjects marked an answer in the range of 1 to 7. (for
internality vs. externality dimension, from ‘Totally due to other people or
circumstance’ to ‘Totally due to me’; for stability vs. instability dimension, from
‘Will never again be present’ to ‘Will always be present’; for globality vs. specificity
dimension, from ‘Influence just this particular situation’ to ‘Influence all situations
in my life’). For positive events, a score of 1 is the lowest or worst possible score,
whereas a score of 7 is the highest or best possible score. Conversely, for negative
events, a score of 1 is the highest or best possible score, and a score of 7 is the lowest,
or worst possible score. Reliabilities for the original English version of the ASQ
were reported as = .50 for Internal Positive, = .58 for Stable Positive, = .44 for
Global Positive, = .46 for Internal Negative, = .59 for Stable Negative, and
= .69 for Global Negative (Peterson et al., 1982). Reliabilities for the original
Mainland Chinese version of the ASQ were reported as > .77 (apart from
internality, where = .49) (Zhang, 2006).
Traditionally, the scale produces scores for the explanation along the theme
of positive and negative events (Peterson et al., 1982). As a result, composite
attributional styles were calculated separately for positive and negative events.
Higher scores for positive events and lower scores for negative events on any area
demonstrate a more “optimistic” attributional style for that domain, i.e., more
external, temporary and specific for bad events, and more internal, stable and global
for good events. Generally, the ASQ scoring produces three composite scores and six
scores of the individual dimension measures based on participants’ responses to the
scale items. The three composite scores are Composite Negative (CoNeg, CN, or

Understanding Optimism
Chapter 1: What is optimism 43
ASQ Negative), Composite Positive (CoPos, CP, or ASQ Positive), and Composite
Positive minus Composite Negative (CPCN or ASQ Total). Here the CPCN scoring
is theoretically based on the belief that an optimistic explanatory style is explicit
when people make attributions for both positive and negative events they encounter
in life.
In some cases, two other composite scores, Hopelessness and Hopefulness,
are also produced separately for negative and positive events, based on some
research results that the stability and globality factors correlated strongly, with
internality-externality being more independent (Higgins et al., 1999). The six
individual dimension scores are Internal Negative, Stable Negative, Global Negative,
Internal Positive, Stable Positive, and Global Positive. This scoring method was
applied in almost all previous studies dealing with explanatory style in the literature.
1.5.4.2 The Attributional Style Questionnaire – Other (ASQ – Other)
Attributional Style for others was measured using an adapted Chinese version of the
ASQ, differing in that subjects are asked to imagine the event occurring to a fictional
character “Wang Chen”, described as being a healthy undergraduate of normal
intelligence. The same events, instructions to generate causes, and ratings scales
were used as in the ASQ.
As in the standard ASQ, 12 events, 6 positive and 6 negative, were divided
across the domains of achievement and affiliation in the ASQ-Other. Respondents
were asked to generate a likely cause for such an event, and, subsequently, to rate
these causes on the following three characteristics: Internal versus external causation
(e.g. “is the cause of Wang’s unsuccessful job search due to something about Wang
Chen or to something about other people or circumstance”), stability versus
instability (e.g. “in the future when looking for a job, will this cause again be present
for Wang Chen”), and specificity versus global applicability (e.g. “is the cause
something that just influences looking for a job or does it also influence other areas
of Wang Chen’s life”).
All responses are on the same 7-point scale (for internality vs. externality
dimension, from ‘Totally due to other people or circumstance’ to ‘Totally due to

Understanding Optimism
Chapter 1: What is optimism 44
Wang Chen’; for stability vs. instability dimension, from ‘Will never again be
present for Wang Chen’ to ‘Will always be present for Wang Chen’; for globality vs.
specificity dimension, from ‘Influence just this particular situation in Wang Chen’s
life’ to ‘Influence all situations in Wang Chen’s life’).
1.5.4.3 The Attributional Style Questionnaire – General (ASQ – General)
Attributional Style for general situations was measured using an adapted Chinese
version of the ASQ, differing in that subjects are asked to imagine the event
occurring for all people on average, not just the participants themselves. The same
events, instructions to generate causes, and ratings scales were used as in the ASQ.
As in the original, 12 events, 6 positive and 6 negative were included.
Respondents were asked to generate a likely cause for such an event, and,
subsequently, to rate these causes on the same three characteristics as above: Internal
versus external causation, stability versus instability, and specificity versus global
applicability. All responses were rated on the same 7-point scale.
1.5.4.4 The Life Orientation Test-Revised (LOT-R)
The original English version of the Life Orientation Test-Revised (LOT - R; Scheier
et al., 1994) was used to measure dispositional optimism in the British sample. A
Mainland Chinese version of Life Orientation Test-Revised (CLOT-R; Lai et al.,
1998) was used to measure dispositional optimism of the Mainland Chinese students.
The LOT-R is a brief modified version of the original Life Orientation Test
(LOT; Scheier & Carver, 1985) and has been found to correlate 0.95 with the LOT
(see Scheier et al., 1994). Support for the construct validity of the LOT-R has been
reported in Scheier et al. (1994). Just as in the original English version of LOT-R,
the CLOT-R comprises three positively phrased items (e.g. “In uncertain times, I
usually expect the best”), three negatively phrased items (e.g. “I hardly ever expect
things to go my way”), and four filler items. The psychometric properties of the
Mainland Chinese LOT-R were reported by Lai et al. (1998) as = .70. For all items
of both the English and Chinese versions, see the Appendix. Respondents are
directed to assess the extent to which they agree with each of the 10 items on a 5-

Understanding Optimism
Chapter 1: What is optimism 45
point scale (4 = strongly agree, 3 = agree, 2 - neutral, 1 = disagree, and 0 = strongly
disagree).
1.5.4.5 The Ryff Scales of Psychological Well-being (RSPW)
Psychological well-being was measured with a Chinese version of the Ryff Scales of
Psychological Well-being (Chen, 2010). The original English version of the RSPW
and this Chinese version of the RSPW were obtained from Dr Ryff, who granted
permission to use these tests for research purposes.
The Chinese version of the RSPW consisted of nine items for each of the six
dimensions: Self-Acceptance (e.g. “I made some mistakes in the past, but I feel that
all in all everything has worked out for the best”), Positive Relationships With
Others (e.g. “Maintaining close relationships has been difficult and frustrating for
me”), Personal Growth (e.g. “When I think about it, I haven't really improved much
as a person over the years”), Environmental Mastery (e.g. “The demands of everyday
life often get me down”), Autonomy (e.g. “I am not afraid to voice my opinions, even
when they are in opposition to the opinions of most people”), and Purpose in Life
(e.g. “I enjoy making plans for the future and working to make them a reality”).
Items were rated on a 6-point Likert scale (1 = strongly disagree; 6 = strongly agree).
1.5.4.6 The Revised NEO Personality Inventory (NEO-PI-R)
Personality was measured with a Chinese version of the Revised NEO Personality
Inventory (Yang et al., 1999).
Just as in the original English version of the NEO-PI-R (Costa & McCrae,
1992), the Chinese version contains the same 240 items with five domain scales
assessing the five broad personality traits of the Five-Factor Model of personality
(FFM; McCrae & Costa, 1987): Neuroticism (e.g. “I often get angry at the way
people treat me”), Extraversion (e.g. “I don’t get much pleasure form chatting with
people”), Openness to Experience (e.g. “I don't like to waste my time daydreaming”),
Agreeableness (e.g. “I believe that most people will take advantage of you if you let
them”), and Conscientiousness (e.g. “Over the years I’ve done some pretty stupid
things”). Items were rated on a 5-point Likert scale (1 = strongly disagree; 5 =

Understanding Optimism
Chapter 1: What is optimism 46
strongly agree). Reliabilities for the Chinese version of NEO-PI-R scale were
reported ranging from .77 to .91 (Yang et al., 1999).
1.5.4.7 The Beck Depression Inventory (BDI)
A Chinese version of the Beck Depression Inventory (BDI; Chan & Tsoi, 1984),
which was translated from the original version of the BDI (Shek, 1990) was used to
measure depression. Chan and Tsoi (1984) reported the split-half reliability
coefficient between odd and even items was .62 (p < .05), and test-retest reliability
was .72 (p < .05).
The BDI is a 21-item, self-report measure that broadly assesse the symptoms
of depression including affective (e.g. “I feel quite guilty most of the time”),
cognitive (e.g. “I feel my future is hopeless and will only get worse”), somatic (e.g. “I
have lost more than ten pounds”), and motivational components (e.g. “I blame myself
for everything bad that happens”), as well as suicidal wishes (e.g. “I would like to
kill myself”). Each item in the BDI describes a specific behavioural manifestation of
depression (such as loss of appetite or somatic problem), and each symptom item
consists of several statements that range from neutral to severe forms of symptoms.
Assignment of a consistent weighted score of 0, 1, 2, and 3 was used for each item.
Admittedly, it seems that there are some overlap between BDI and LOT-R,
since they both ask about bad expectations about the future. However, as the
perspective of “dispositional optimism” originated theoretically from the expectancy-
value model and put much emphasis on confidence or doubt pertaining to
life, optimism and pessimism are broad, generalized versions of expectations to
future life, rather than to just a specific narrow context.
1.5.4.8 The Satisfaction with Life Scale (SWLS)
Subjective well-being was measured with an on-line based Chinese version of the
Satisfaction with Life Scale (SWLS; Chen & Zhang, 2004), which was translated
from the original English version (Diener et al., 1985).

Understanding Optimism
Chapter 1: What is optimism 47
The SWLS is a five-item scale that measures general life satisfaction. It
includes items such as ‘If I could live my life over, I would change almost nothing.’
Responses are on a 7-point scale (1: strongly disagree to 7: strongly agree).
1.5.5 Participants
Sample 1
A total of 452 participants were included in sample 1, of which 267 undergraduates
were recruited from Jinan University (JU), and 185 undergraduates were recruited
from China Youth University for Political Science (CYUPS). Both these universities
are located in Mainland China. All participants were native Chinese speakers.
Participants in sample 1 completed the ASQ, the ASQ-Other, the LOT-R, the RPWB,
and the NEO-PI-R.
In sample 1, there were 133 males (mean age = 20.70, SD = 1.30) and 319
females (mean age = 20.46, SD = 1.24). All participants took part in the present
study on a voluntary and anonymous basis.
Sample 2
A total sample of 232 participants was recruited from the CYUPS (different subjects
from sample 1). The participants were aged 17-21 years (mean age=18.76 years,
SD=0.89); 97 males, 135 females. All participants in sample 2 took part in the
present study on a voluntary and anonymous basis. All participants were native
Chinese speakers. Participants in sample 2 completed two measures, the ASQ and
the LOT-R. All participants took part in the present study on a voluntary and
anonymous basis.
Sample 3
A total sample of 205 White British participants were recruited among students
enrolled in a social science course in Edinburgh Napier University; 46 males and 159
females (mean age=20.10 years, SD=0.87). All participants were native English
speakers. All participants in sample 3 took part in the present study on a voluntary
and anonymous basis. Participants in sample 3 completed two measures, the ASQ

Understanding Optimism
Chapter 1: What is optimism 48
and the LOT-R. All participants took part in the present study on a voluntary and
anonymous basis.
Sample 4
A total sample of 117 participants was recruited from Jinan University (different
subjects from sample 1). The participants were aged 18-23 years (mean age=19.79
years, SD=1.11); 25 males, 92 females. All participants in sample 4 took part in the
present study on a voluntary and anonymous basis. All participants were native
Chinese speakers. Participants in sample 4 completed the ASQ-General. All
participants took part in the present study on a voluntary and anonymous basis.
Sample 5
Fifty-two freshmen (22 males and 30 females) with depressive symptoms were
recruited from the CYUPS. All participants were native Chinese speakers with ages
ranging from 17 to 21. All participants in sample 5 took part in the present study on a
voluntary basis. The 52 participants were randomly divided into one of the two
conditions: an experimental group (n = 26) and a no-treatment control group (n = 26).
Not all participants completed the whole procedure. Three participants dropped out
of the intervention group and two dropped out of the control group. As a result, there
were 23 participants in intervention group and 24 participants in the control group
available for the final data analysis (Mage = 18.83, SD = 0.84) (19 males and 28
females).
Participants in sample 5 completed four measures, the BDI, the ASQ, the
LOT-R, and the SWLS. All participants took part in the present study on a voluntary
and anonymous basis.
Sample 6
Sixty-eight first-year university students (30 males and 38 females) were recruited
from the CYUPS (different subjects from sample 5). All participants were native
Chinese speakers with ages ranging from 17 to 21. All participants in sample 6 took
part in the present study on a voluntary basis.

Understanding Optimism
Chapter 1: What is optimism 49
The 68 participants were randomly divided into one of the two conditions: an
experimental group (n = 34) and a ‘placebo’-treatment control group (n = 34). Not all
participants completed the whole procedure. Four participants dropped out of the
intervention group and five dropped out of the control group. As a result, there were
30 participants in intervention group and 29 participants in the control group
available for the final data analysis (Mage = 19.03, SD = 0.74) (27 males and 32
females).
Participants in sample 6 completed four measures, the BDI, the ASQ, the
LOT-R, and the SWLS.
Data collected from sample 1 and sample 2 was used in the study
investigating psychometric constructs of the ASQ and the LOT-R, relationship
between optimism and psychological well-being, relationship between optimism and
personality, and exploration of attributional bias. Data collected from participants in
sample 2 and sample 3 were applied in the cross-cultural study of attributional style
and dispositional optimism. The study of attributional bias involved part of data
collected from sample 1 and data collected from sample 4. Participants in sample 5
and sample 6 were recruited to examine intervention effects of optimism
manipulations.

Understanding Optimism
Chapter 2: The psychometric construct of optimism 50
Chapter 2: The psychometric construct of optimism
As the most widely-applied measures for explanatory style and dispositional
optimism respectively, the ASQ and the LOT-R have been psychometrically
analysed in a number of studies since they were originally developed. In addition to
controversial results and conclusions, previous studies in examining the
psychometric constructs of these two measures have mostly been conducted in
industrial countries. Investigating basic constructs of the ASQ and the LOT-R in
Eastern cultural backgrounds has theoretical and empirical importance.
2.1 The psychometric construct of the ASQ
Regarding the psychometric construct of the ASQ, I set out to accomplish two main
goals. First I wished to examine the structure of the ASQ using structural equation
modelling of attributions for positive and negative events simultaneously. Second, I
wished to test the role of cognitive style (such as global versus local explanations)
that might play a role over and above explanatory bias. For instance, attributions of
instability may apply to both positive and negative events. The literature motivating
these aims is reviewed below.
2.1.1 Myths about attributional style
Attributional style has been developed from the original two-factor structure to the
current widely accepted construct of three dimensions. Originally, two basic factors
of casual explanations for actions – internality, a factor “with the person”, which
occurs when an individual blames him or herself for a problem, and externality, a
factor “within the environment”, when one blames something outside of oneself,
were differentiated by Heider (1958). This notion of internality and externality was
supported by Weiner (1974), who developed stability – the consistency of the cause
– as another attributional component. Differentiation between stability and
instability depends on whether the cause is taken as everlasting or as fleeting.
Later on, globality, which is linked to the prediction of recurrence of the same
cause in other situations, was developed as a newly-applied notion of attributional

Understanding Optimism
Chapter 2: The psychometric construct of optimism 51
factor (Abramson et al., 1978). As a result, a three-dimensional model, which
incorporated dimensions of internality, stability, and globality, was put forward by
Abramson et al. (1978). Here in their opinion, internality and stability have basically
the same meaning as the two components identified above by Heider (1958) and
Weiner (1974). Thus far, these three dimensions, internal versus external, stable
versus unstable, and global versus specific, have been combined to form the three-
dimensional model of explanatory style. And the Attributional Style Questionnaire
(ASQ; Peterson et al., 1982) was developed on the basis of these three-dimensional
model of casual explanations.
As mentioned earlier, the ASQ assigns subjects an optimistic or a pessimistic
explanatory style. An optimistic explanatory style consists of explaining positive
events as enduring, global and internally generated, while also explaining negative
events as unstable, specific, and externally caused (Forgeard & Seligman, 2012). If
we are to understand the mechanism by which clinical and life outcomes are
influenced by explanatory style, it is important that we understand the structure of
the ASQ, decomposing the complex admixture of attributions, valences and events.
These components may have effects that are not apparent in a simple summing up of
positive and negative scores.
Within attributional models of depression, the attributions are seen to cause
heavy distinct behavioural consequences. For instance, low self-esteem is agreed to
be linked with internal attributions regarding negative events, while chronic
depression is suggested to result from stable attributions for negative events (Haugen
& Lund, 1998; Peterson et al., 1982). In this learned helplessness model, depression
emerges as a consequence of experience with uncontrollable negative events
(Abramson et al., 1978). Concept of attributional style however also predicts that the
three types of explanation are correlated each other within at least within each
valence. This is shown in graphically in Figure 2.1.

Understanding Optimism
Chapter 2: The psychometric construct of optimism 52
Figure 2.1: Proposed Model of attributional style based on learned helplessness
theory of responses to experience of negative events.
Research based on this model has resolved in findings that are somewhat
counterintuitive. The earliest data on this question was collected by Peterson et al.
(1982). They reported that attributions for positive events and attributions for
negative events were essentially uncorrelated (r = .02). This lack of correlation
between explanatory styles for positive and negative events has been found in other
work. For instance, P.J. Corr and J.A. Gray (1996) investigated the factor structure of
the ASQ in two independent samples using Varimax rotated principal components
analysis. They found that positive and negative explanatory styles were independent.
In addition, whereas for negative events, internality ratings were largely independent
of stability and globality ratings, for positive events these three dimensions formed a
single factor, suggesting that explanations for positive and negative events might
have different structures. The study of Bunce and Peterson (1997) also revealed that
there is no correlation between explanations for positive and negative events. This
independence was reported for ASQ composite score and the internality dimension
as well.
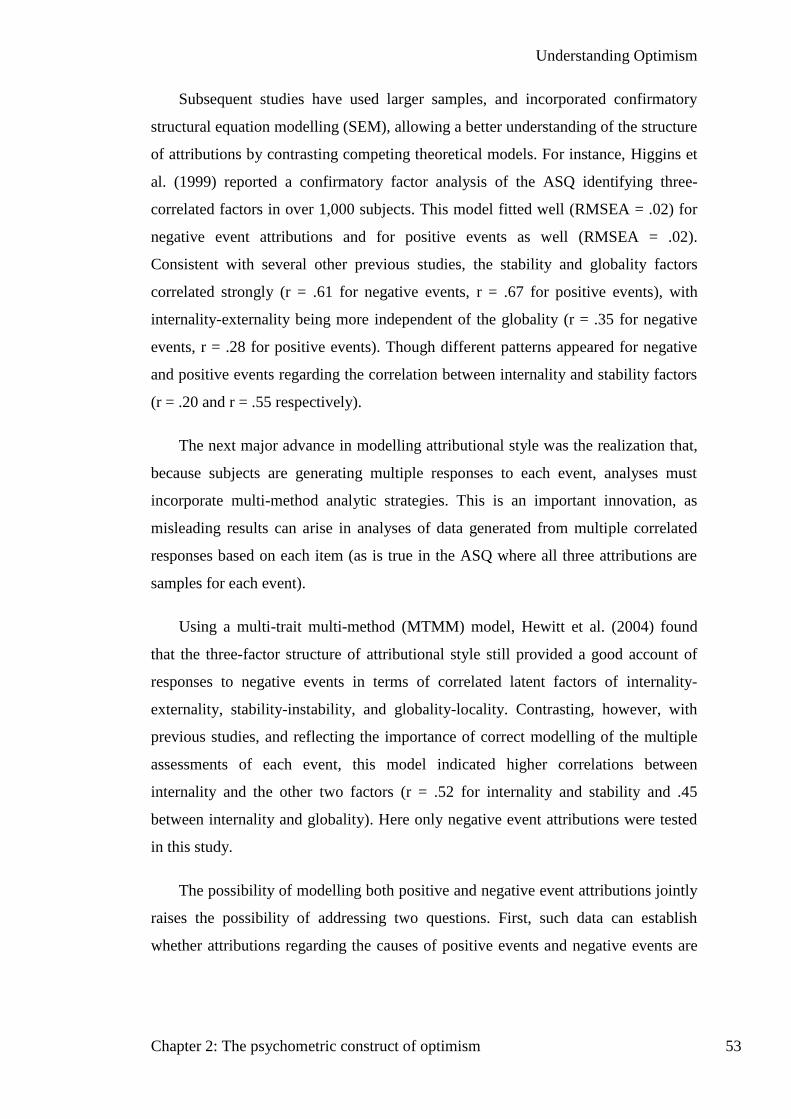
Understanding Optimism
Chapter 2: The psychometric construct of optimism 53
Subsequent studies have used larger samples, and incorporated confirmatory
structural equation modelling (SEM), allowing a better understanding of the structure
of attributions by contrasting competing theoretical models. For instance, Higgins et
al. (1999) reported a confirmatory factor analysis of the ASQ identifying three-
correlated factors in over 1,000 subjects. This model fitted well (RMSEA = .02) for
negative event attributions and for positive events as well (RMSEA = .02).
Consistent with several other previous studies, the stability and globality factors
correlated strongly (r = .61 for negative events, r = .67 for positive events), with
internality-externality being more independent of the globality (r = .35 for negative
events, r = .28 for positive events). Though different patterns appeared for negative
and positive events regarding the correlation between internality and stability factors
(r = .20 and r = .55 respectively).
The next major advance in modelling attributional style was the realization that,
because subjects are generating multiple responses to each event, analyses must
incorporate multi-method analytic strategies. This is an important innovation, as
misleading results can arise in analyses of data generated from multiple correlated
responses based on each item (as is true in the ASQ where all three attributions are
samples for each event).
Using a multi-trait multi-method (MTMM) model, Hewitt et al. (2004) found
that the three-factor structure of attributional style still provided a good account of
responses to negative events in terms of correlated latent factors of internality-
externality, stability-instability, and globality-locality. Contrasting, however, with
previous studies, and reflecting the importance of correct modelling of the multiple
assessments of each event, this model indicated higher correlations between
internality and the other two factors (r = .52 for internality and stability and .45
between internality and globality). Here only negative event attributions were tested
in this study.
The possibility of modelling both positive and negative event attributions jointly
raises the possibility of addressing two questions. First, such data can establish
whether attributions regarding the causes of positive events and negative events are

Understanding Optimism
Chapter 2: The psychometric construct of optimism 54
negatively correlated i.e., do individuals giving optimistic explanations for positive
events tend to give optimistic explanations for negative events?
Secondly, a very different model of the ASQ and of attributions can be posed
and tested. Rather than clustering around event valences to create an attributional
style in which good and bad events are attributed to different types of causes, instead,
subjects may have cognitive styles which apply independent of event valence, and
these style factors may account for a preponderance of variance in the ASQ. This is
shown graphically in Figure 2.2.
Figure 2.2: Proposed Model of Attributions in terms of valence-independent
cognitive styles, rather than valenced biases.
As shown in Figure 2.2, a cognitive style model predicts that the tendency to
apply global-local, internal-external and stable-unstable explanations to events may
be independent of event valence: The same person who tends to ascribe, say, an
internal cause to negative events may apply a similar internal explanation to positive
events in their lives. It is, therefore, important to distinguish between cognitive style
models, which would apply to events independent of valence, versus affect-linked
attributional style models.

Understanding Optimism
Chapter 2: The psychometric construct of optimism 55
To summarize the findings to date, it is clear that adequate analyses of the
structure of the ASQ require use of structural equation modelling and, in particular,
of multi-trait multi-method modelling to account for the repeated entry of events into
explanations (Campbell & Fiske, 1959; Hewitt et al., 2004). For negative events,
research confirms a three-correlated factor structure. However no study in which
both positive and negative events examined jointly have been conducted within
models controlling for correlated event structure. This leaves the structure of the full
ASQ unclear. In addition, a majority of studies to date have been conducted in
Western samples, and it is not known whether the structure of explanatory style is
invariant across culture.
After having examined relevant findings in current literature, I next outline in
detail the two major research questions explored in the present study.
The first analyses sought to replicate the three correlated factor structure for
negative events reported by Hewitt et al. (2004) using the MTMM model and the
similar factor structures for positive events revealed by Higgins et al. (1999). These
analyses can confirm (or disconfirm) that correlated factors of globality, stability,
and internality emerge for both kinds of event. However, analyses of the different
event valences in separate models miss the opportunity to test competing models
incorporating attributions for the causes of both positive and negative events. Full
data from positive and negative sections of the ASQ also allow testing a second
important question; that of disentangling cognitive styles from optimistic and
pessimistic attributions. It is to resolve these two questions that we turn next.
Data on attributions about both positive and negative events offer the
opportunity to test whether the three attribution factors emerging for each event type
are the same across events: That is whether globality for positive events is identical
to the factor influencing globality ratings for negative events, and likewise for
locality and internality as shown in Figure 2.2. To the extent that cognitive styles
have important influences on responses, people’s explanations of events will reveal
coherent attributional styles for events independent of event-valence (Rotter, 1966),
rather than explanations driven by experience with valence-specific outcomes

Understanding Optimism
Chapter 2: The psychometric construct of optimism 56
(Peterson et al., 1982). Of course both cognitive styles and valence-specific
optimistic explanatory style factors may exist. This combined model is shown in
Figure 2.3.3.
Figure 2.3: Combined framework for testing contrasting models of attributional Style.
Note: Explanatory style Models predict strong effects of valenced explanatory styles
(negative event explanations & positive event explanations). By contrast, cognitive
style Models predict large influences of internal –external, global – local & stable –
unstable processing, biases independent of event valence.
Figure 2.3.3 lays out the full complexity of analytic outcomes tested here. As can
be seen, six types of item response emerge from the ASQ: three attributions for each

Understanding Optimism
Chapter 2: The psychometric construct of optimism 57
of two event valences. These six response types are potentially accounted for by
three cognitive styles (upper portion of Figure 2.3.3), and/or by two valence bias
factors (lower portion of Figure 2.3.3). In addition, the three cognitive style factors
may correlate or be independent of one another, likewise, negative event
explanations may be negatively correlated with positive event explanations, or be
uncorrelated.
Importantly, if explanatory biases for positive events and for negative events are
uncorrelated, then the description of individuals as having either an optimistic or
pessimistic explanatory style will be based on a composite of causes, and most
individuals will have mixed biases. Alongside this, most people, if the cognitive style
factors are influential on attributions, will tend to generate the same kinds of
explanation for both positive and for negative events. And, the personal cognitive
style which is predicted to be depressogenic (Abramson et al., 1978), will,
paradoxically, be associated with a self-enhancing explanatory style for positive
events. To this extent, a notion of positive or negative attributional style would not
be applicable to most individuals.
Analyses and analysis techniques
We first replicated the model for negative events, and then extend this work to model
positive events. Finally, in the second section of the analyses, we model both positive
events and negative events simultaneously, testing the attributional style model, in
which attributions regarding positive and negative events are clustered. We tested
also if these clusters are correlated or not. These are contrasted with models in which
attributions are driven instead by differences in cognitive style, independent of event
valence, i.e., a tendency to ascribe events to local or stable causes, independent of
whether they are positive or negative. Following this work, a second study is
reported, replicating the proposed and confirmed joint model from study one in an
independent sample.
All data were analysed at the item level. All variables were approximately
normal. Given the 1-7 response scale for each item, data were analysed as continuous

Understanding Optimism
Chapter 2: The psychometric construct of optimism 58
(Rhemtulla, Brosseau-Liard, & Savalei, 2012). Models using polychromic input
rendered highly similar solutions and fits. Correlations among item responses were
used to estimate parameters in a confirmatory factor analysis framework, comparing
proposed theoretical models, as described above. Final models were permitted to
include explicit exploratory modifications where necessary (all modifications are
noted explicitly). Modelling was undertaken using OpenMx (Boker et al., 2011;
Boker et al., 2013) under R (R Core Team, 2012). All analyses took advantage or
raw data supporting estimation of models using full information maximum likelihood
estimation.
The adequacy of model fit was assessed using the comparative fit index (CFI),
Tucker-Lewis index (TLI) and the Root Mean Square Error of Approximation
(RMSEA). For CFI and TLI, values > 0.95 were taken as indicating acceptable fit
(Hu & Bentler, 1999). For the RMSEA, values of < .05 indicated acceptable fit (C. Y.
Yu, 2002). Akaike Information Criterion (AIC) and Bayesian Information Criterion
(BIC) are reported to aid model comparison.
2.1.2 Samples and instruments
Samples
There are two independent samples were included in this study (for detail of the two
samples, see 1.5.4 of Chapter 1). Sample 1 was involved in constructing and testing
the proposed model. Sample 2 was used to replicate the model. No subjects from the
replication study participated in the initial modelling analysis.
Instruments
Attributional style was assessed using the Chinese ASQ (Zhang, 2006). Composite
attributional styles were calculated separately for positive and negative events
separately. Higher scores for positive events and a lower score for negative events on
any area demonstrates a more “optimistic” attributional style for that domain, i.e.,
more external, temporary and specific for bad events, and more internal, stable and
global for good events.

Understanding Optimism
Chapter 2: The psychometric construct of optimism 59
Reliabilities (Cronbach’s α) were acceptable 0.84 for the total and, for
positive events 0.84; for negative events .77; for internality, .65; for stability, .76;
and .80 for globality.
Procedure
Participants were tested in groups of 30 to 50 by their lecturer. Each lecturer was
trained on the administration of the task. After detailed instructions were provided,
participants completed the paper-and-pencil questionnaires.
2.1.3 Testing models of causal attributions for positive and negative events
A total of 452 participants in sample 1 were involved in this testing.
Table 2.1 shows the descriptive statistics. Reliabilities were acceptable. No
significant gender differences emerged and the data were pooled across sex in
subsequent analyses.
Measures Means SD Cronbach’s Alpha
Negative Events 12.9 1.78 0.84
Internal Negative 4.45 0.67 0.49
Stable Negative 4.33 0.85 0.73
Global Negative 4.12 0.9 0.73
Positive Events 15.28 1.91 0.77
Internal Positive 5.03 0.7 0.65
Stable Positive 5.36 0.78 0.75
Global Positive 4.9 0.85 0.71
ASQ Total 2.38 2.17 0.84
Table 2.1: Means, SDs and Cronbach’s Alpha for the ASQ scales.
Note: Means for ASQ dimensions are on a scale ranging from 1 to 7. (n = 452)

Understanding Optimism
Chapter 2: The psychometric construct of optimism 60
2.1.4 Structural equation modeling
I first tested the hypothesis that the structure of explanations for the causes of
negative events reflects three factors of internality, stability and globality which are
correlated. As in Hewitt et al. (2004), method (event) variance was accommodated
using an MTMM structure. Hewitt et al. (2004) fit correlated factor models. Here I fit
both this and the (statistically similar but theoretically distinct) higher-order model in
keeping with the modelling to be undertaken below. Fit for both types of model is
identical, and the correlated factor correlations are reported. This model is shown in
Figure 2.4. For clarity, this correlated method variance is not shown on the figure.
Figure 2.4: Well-fitting 3-factor model of attributional style for negative events.
The base model without modifications fitted reasonably well (χ² (96) = 212.32, p
< .001; CFI = 0.94; TLI = 0.92; RMSEA = 0.044). Three modifications improved fit
(χ² (3) = 47.1, p<.001) by all criteria (χ² (93) = 165.25, p <.001; CFI = 0.97; TLI =
0.95; RMSEA = 0.033). The new paths all had loadings of.27 or below suggesting

Understanding Optimism
Chapter 2: The psychometric construct of optimism 61
the deviation of reality from the theoretical model is minor (see Figure 2.4). In a
correlated factor model, stability and globality correlated .47, internality and
globality had an r of .39, and internality and stability factors correlated = .20.
Thus, as previously reported by Hewitt et al. (2004), a model of causal
attributions for negative events in terms of three correlated factors of globality,
stability, and internality adequately accounted for responses to these negative events
in the ASQ. We next turned to see if this model would fit well for positive events.
A model for positive events was constructed in the same fashion as the baseline
model for negative events (see Figure 2.5). Fit measures for this model indicated
excellent fit between model and data (χ2
(96) = 152.48, p < 0.001; CFI = 0.98, TLI =
0.98, RMSEA = .027). No modifications were needed from base model. In the
correlated factor model stability and globality correlated .57, internality and
globality .48 and internality and stability .62: Considerably higher than was the case
for negative events.
Figure 2.5: Well-fitting 3-factor model of attributional style for positive events.

Understanding Optimism
Chapter 2: The psychometric construct of optimism 62
As a result, as previously reported by Higgins et al. (1999), a model of causal
attributions for positive events in terms of three correlated factors of globality,
stability, and internality adequately accounted for responses to these positive events
in the ASQ.
Analyses of separate ASQ positive events and ASQ negative events, then,
indicated that these scales were well accounted for by three correlated factors of
internality, stability, and globality. As can be seen in Figures 2.4 and 2.5, correlations
between the three dimensions were high and significant, especially for negative
events, where globality effectively defined the common factor.
I next moved on to construct models of both positive and negative ASQ events,
jointly testing the competing models outlined in the introduction and shown in Figure
2.3.
Joint modelling of attributions of causality for positive and negative events
The sequence and fit statistics of all joint models tested are laid out in Table 2.2.
I first tested a model accounting for positive and negative event attribution in
terms of just two negatively correlated factors of negative and positive event
attributions (See Figure 2.1 and Figure 2.3 lower section Figure 2.3). This fitted
poorly (χ² (521) = 1972.74, p < .001; CFI = 0.68; TLI = 0.64; RMSEA = 0.075; AIC
= 2190.74; BIC = 2639.13) (see Table 2.2). I next modified this model setting the
latent factors for positive and negative event attributions to be uncorrelated. This
model fitted better than the first, but remained less than adequate (χ² (515) = 1058.89,
p < .001; CFI = 0.67; TLI = 0.63; RMSEA = 0.076; AIC = 2232.34; BIC = 2676.72)
(see Table 2.2).
I next tested a model accounting for the data in terms of three cognitive styles,
i.e., in terms of tendencies to attribute global or local or stable causes to events,
irrespective of their valence. This model was constructed by creating three
uncorrelated latent variables: An Internal Style factor, with loadings from internality
attributions for both positive and negative events, and similar Stability-Style and

Understanding Optimism
Chapter 2: The psychometric construct of optimism 63
Globality-Style factors, also loading from their respective attributes across the two
event valences. This model fitted poorly (χ² (522) = 1509.05, p < .001; CFI = 0.79;
TLI = 0.76; RMSEA = 0.061; AIC = 1725.05; BIC = 2169.33) (see Table 3.2). We
therefore moved to a correlated cognitive styles model. This improved fit but was
still not adequate (χ² (519) = 1375.91, p < .001; CFI = 0.82; TLI = 0.79; RMSEA =
0.057; AIC = 1597.91; BIC = 2054.53) (see Table 2.2). Next the preferred model
containing both cognitive and explanatory style factors was tested.
Joint Models χ² /df CFI TLI RMSEA AIC BIC
Model 1 - correlated negative and
positive event explanations 3.79 0.68 0.64 0.075 2190.74 2639.13
Model 2 - uncorrelated negative
and positive event explanations 3.86 0.67 0.63 0.076 2232.34 2676.72
Model 3 - uncorrelated cognitive
styles 2.89 0.79 0.76 0.061 1725.05 2169.33
Model 4 - correlated cognitive
styles 2.65 0.82 0.79 0.057 1597.91 2054.53
Model 5 - “3-cognitive styles + 2-
explanatory styles” in study 1 (see
Figure 3.6)
1.39 0.97 0.96 0.025 982.74 1690.29
Model 6 – Replication of Model 5
in independent data 1.38 0.97 0.96 0.025 984.61 1695.13
Model 7 – Replication in the
combined data set (see Figure 3.7) 1.52 0.97 0.96 0.024 1044.19 1822.99
Table 2.2: Fit statistics for Attributional Style.
Note: CFI = the comparative fit index; TLI = Tucker-Lewis index; RMSEA = Root
Mean Square Error of Approximation. AIC = Akaike Information Criterion. BIC =
Bayesian Information Criterion. Preferred model (Model 5) in Bold.
Results supported the predicted model (χ² (483) = 845.42, p <.001; CFI = 0.93;
TLI = 0.91; RMSEA = 0.037). Modifications were suggested yielding good model fit

Understanding Optimism
Chapter 2: The psychometric construct of optimism 64
(χ² (458) = 634.34, p <.001; CFI = 0.97; TLI = 0.96; RMSEA = 0.025; AIC = 982.74;
BIC = 1690.29) (see Table 2.2 and Figure 2.6). The new paths all had loadings of .23
or below suggesting the deviation of reality from the theoretical model is minor (see
Figure 2.4), but see the discussion for elaboration on these modifications.
Joint modelling of attributions for positive and negative events thus supported
three correlated cognitive style factors of internality, stability and globality, and two
uncorrelated affective biases on judgments of positive and negative events.
2.1.5 Replication final ASQ model
In order to test the replicability of the final model, an independent sample was next
collected. 232 undergraduates aged 17 – 21 years were recruited from a Chinese
university (97 male, 135 female) as participants in the replication study. All testing
procedures were identical, and no subjects from the replication study participated in
the previous study.
Replicability was tested by running the exact model constructed for Study one,
including the modifications required to raise that model to adequate fit. This model
showed an excellent fit between model and data (χ² (458) = 633.43, p <.001; CFI =
0.97; TLI = 0.96; RMSEA = 0.025; AIC = 984.61; BIC = 1695.13) (see Table 3.2).
The independent replication supported the structure found in previous study.
As the model fit well in both samples, we combined them in a final analysis to
maximize the precision of all estimated parameters. This also fit well (χ² (458) =
696.42, p <.001; CFI = 0.97; TLI = 0.96; RMSEA = 0.024; AIC = 1044.19; BIC
=1822.99) (see Figure 2.7, Table 2.2).

Understanding Optimism
Chapter 2: The psychometric construct of optimism 65
Figure 2.6: Well-fitting “3-cognitive styles + 2- explanatory styles” model of causal attributions for both positive and negative events.

Understanding Optimism
Chapter 2: The psychometric construct of optimism 66
Figure 2.7: Well-fitting joint model in the combined data set.

Understanding Optimism
Chapter 2: The psychometric construct of optimism 67
2.1.6 Schematic model of attributional style
Explanatory style models of optimism focus on three aspects of attributions about the
causes of positive and negative events: stability, pervasiveness, and internal-external
control. Within positive and negative event valences, these three aspects are
predicted to cluster forming explanatory style factors for each type of event, and
these in turn are predicted to correlate negatively, in line with attributional accounts
of depression. This structure was tested first in two studies including both positive
and negative events simultaneously, as well as controlling for non-independence of
responses within events.
Study one consisted of ASQ responses collected in 452 Chinese subjects. For
models containing only positive or only negative events, the proposed three
correlated-factor structure of explanatory style fit well. However, in joint models of
both positive and negative events, three strong correlated cognitive style factors
emerged, which applied to all events independent of valence. That is subjects who
described events as local or as stable in nature, tended to do so for both positive and
for negative events. In addition, two uncorrelated factors of attributions to positive
and to negative events emerged.
To validate this model, an independent sample of 232 subjects was collected
and the exact model from study one was confirmed as well fitting in this second
sample. The ASQ captures two major structures: A set of cognitive styles: tendencies
to process events as, for instance, internal or external in causation, and uncorrelated
factors of bias regarding positive and negative event bias.
Simply, here in two studies I tested the structure of attributions made
regarding the causes of positive and negative events (Abramson et al., 1978). Figure
2.8 shows in a schematic but quantitative form, the final conclusions emerging from
the joint analysis of the first study one and the replication study.

Understanding Optimism
Chapter 2: The psychometric construct of optimism 68
Figure 2.8: Final model reflecting results from combined data in two studies.
Analyses of single event valences revealed correlated globality, stability, and
internality factors as reported by Hewitt et al. (2004) and Higgins et al. (1999)
replicating in a non-Western sample the prior pattern and supporting the validity of
the scale in China. However the joint analyses revealed a very different outcome.
Attributional biases to positive events and to negative events emerged as
uncorrelated. Importantly, three valence-independent cognitive styles were required
to account for responding: global-local, stable-unstable, and internal-external. The
implications of these findings are discussed below.

Understanding Optimism
Chapter 2: The psychometric construct of optimism 69
Cognitive styles emerged as an important influence on responding: valence-
independent cognitive styles accounted for 85 percent of variance in the latent-factor
model. This suggests that subjects apply consistent cognitive styles independent of
event-valence, with personal tendencies to explain events as, for instance, global or
local independent of event valence: Subjects rating positive events as global tended
also to describe negative events in terms of global attributions, and likewise for the
other two styles. The cognitive styles correlated modestly, with coherent tendencies
to global-stable-internal vs local–unstable-external attributions.
It should be noted that several minor modifications were required to achieve
accepted levels of fit for this model. These mostly involved small item-item
correlations: this redundancy might allow a revised scale to be shortened. Eleven
changes were theoretically significant paths from cognitive style to attributions
outside the style: for instance from stability to globality of event 3. These indicate
that revision or deletion of some items may improve the diagnostic coherence and
utility of scales derived from well-fitting models of the ASQ.
Optimistic and pessimistic explanatory styles also emerged, with a pessimistic
explanatory style associated with beliefs that the causes of negative events are stable,
persuasive, and internal, and a positive bias for events being brief, affecting only one
aspect of life, and be externally caused (Forgeard & Seligman, 2012). Supporting
several empirical studies, optimistic and negative event were uncorrelated in the
present data (P.J. Corr & J.A. Gray, 1996; Peterson et al., 1982).
Based on these findings, attributions may be best viewed as reflecting large
differences in cognitive style (independent of event valence), and smaller
independent positive– and negative-event biases. Scoring and interpretation of the
ASQ should reflect this. Responses should be scored for cognitive style in addition to
optimistic or pessimistic explanatory bias. For most individuals, mixed attributional
styles should be expected: such as optimistic explanations for negative events and
pessimistic attributions for positive events.

Understanding Optimism
Chapter 2: The psychometric construct of optimism 70
2.2 Separating optimism and pessimism
2.2.1 Previous understanding of dispositional optimism
Psychometric structure of the LOT
As the most frequently used measure of dispositional optimism, the LOT or its
revised version, the LOT-R, has been applied widely in numerous studies. One
critical issue concerning the dimensionality of this instrument, is whether it measures
one dimension (optimism) or two dimensions (optimism and pessimism), is still not
quite clear. This dispute has been examined by a number of empirical studies with
controversial results demanding further investigation.
Theoretically, the basic conceptualization of dispositional optimism is formed
on the behavioural self-regulation model, addressing both goals approach and goals
avoidance (Carver & Scheier, 2001). Accordingly, expectancies should be involved
in both goal approach and gaol avoidance processes. Based on this framework,
dispositional optimism was originally assumed to be a bipolar dimension. Scheier
and Carver (1985) suggested that the LOT measured a one-dimensional bipolar
construct of dispositional optimism (n = 624). For the LOT-R, (Scheier et al., 1994)
proposed that “confirmatory factor analysis further indicated that the single-factor
solution was superior to a two-factor one” (n = 4,309).
At the same time, however, in a study with a sample of 889 male sailors in
the Navy (Marshall, Wortman, Kusulas, Hervig, & Vickers Jr, 1992), evidence
indicated that the positively and negatively phrased items in the measure split into
two factors. The factor of positively phrased items was named as “optimism”, and
the factor of negatively worded items was named as “pessimism”. This two-factor
model, which declared that optimism and pessimism represent two distinct traits, was
replicated in several later studies (Chang et al., 1997; L. Chang & McBrideChang,
1996; Creed et al., 2002; Roysamb & Strype, 2002). For example, in a sample of 347
undergraduates, Steed (2002) reported that the two-factor model was superior to the
one-factor model using a confirmatory factor analysis (CFA) approach. This two-
dimensional structure was replicated in an adolescent sample recently (Monzani et al.,
2014).

Understanding Optimism
Chapter 2: The psychometric construct of optimism 71
Though most studies support the two-factor theory, it is not clear whether this
two-dimensional model occurs through methodological bias or just reflects
substantive differences among items. To deal with this issue, Kubzansky, Kubzansky,
and Maselko (2004) reversed the framing of half of the items on each subscale, and
compared the method artefact model with the two-factor model. Their results
indicated that the bidimensional factor structure is consistent across all LOT versions
no matter how each item is framed. In addition, McPherson and Mohr (2005) tested
the potential effect of extremity of item wording on the LOT, and demonstrated that
item extremity had no influence on the bidimensional structure at all.
Though the dimensional dispute of dispositional optimism has been mainly
examined theoretically, there is at least one example in which the psychometric
structure of dispositional optimism was investigated by linking it to physical index.
Räikkönen and Matthews (2008) reported that while high pessimism predicted high
ambulatory blood pressure, low optimism had no effects on this physical index. It
indicated that dispositional optimism measured by the LOT may be not a bipolar
construct as originally assumed.
To summarize the findings to date, a two-factor structure is psychometrically
preferable to a one-dimension structure of total dispositional score (Suzanne C.
Segerstrom, Evans, & Eisenlohr-Moul, 2011). This bidimensional structure of
dispositional optimism was further supported in a large, age-heterogeneous sample
(46,133 participants aged from 18 to 103 years). Results indicated that the LOT-R is
bidimensional, consisting of an optimism factor and a pessimism factor. This two-
dimensional construct model was found to be stable across gender and age groups
(Herzberg, Glaesmer, & Hoyer, 2006).
Although different versions of the LOT or the LOT-R have been applied in a
variety of research on optimism during the past two decades, a majority of these
studies were conducted in Western samples. Consequently, it remains unclear for the
applicability of the concept and structure of dispositional optimism in Eastern
cultures. Sumi (2004) tested a measure of the Japanese translation of the LOT-R in
223 Japanese undergraduates. The original English version of the LOT or a Chinese

Understanding Optimism
Chapter 2: The psychometric construct of optimism 72
adaptation of the test has been conducted among Hong Kong Chinese (n = 620) and
Taiwanese (n = 1,119) (Cheng & Hamid, 1997; Li, 2012). Results of these studies
generally support the two-factor model that was found in most English-speaking
samples.
However, even in the few studies of optimism in non-English speaking
countries, controversy still exists. For instance, in a study of dispositional optimism
with Hong Kong Chinese (Lai, 1997), a modified Chinese version of the Life
Orientation Test was administered to one college student sample (n = 230) and an
adult sample (n = 173). The results indicated that the predictive power of the LOT
was owed to the optimism subscale. That is, the findings supported the
unidimensional view of the LOT. This evidence for the one-factor model was
replicated when the original English version of the LOT-R was applied in 248 Hong
Kong Chinese (Lai et al., 1998).
Until recently, studies of dispositional optimism have been rarely conducted
on Eastern cultures; and even fewer studies have been done with Mainland Chinese.
One of the exceptions was a study conducted by Lai (2000) in 404 Hong Kong
students and 328 Mainland Chinese students. A mixed scale of the LOT-R adaptation
and the Chinese version of the original LOT were completed by the participants.
CFA analysis indicated that while the bidimensional interpretation applied to the data
of the Mainland Chinese students, the Hong Kong sample showed a one-factor model.
To further apply the widespread measure of dispositional optimism in
Mainland China, it is necessary to examine the factor structure of the LOT-R in
Mainland Chinese samples. A proper examination of the applicability of
dispositional optimism to Chinese samples should apply translation of the LOT-R,
which is currently the most prevalent measure. By using the translated version of the
LOT-R, we attempted to provide results that are more generalizable to the scientific
literature and to Eastern samples.

Understanding Optimism
Chapter 2: The psychometric construct of optimism 73
Linking dispositional optimism to explanatory style
As two main approaches to conceptualizing and measuring optimism, dispositional
optimism and explanatory style have long been linked together and both have a wide
range of applicability in research with parallel findings with depression, well-being
and other related psychological constructs (Carver et al., 2010; Forgeard & Seligman,
2012).
Explanations for past events influence expectations for the future (Peterson &
Seligman, 1984). That is, if a person attributes past failures to causes that are stable,
he or she will expect more failures in the future, because the cause is likely to remain
for a long time. If the cause of a negative event is attributed to global factors, the
expectations tend to be that actions will not be under control even in many other
situations. In parallel, if the explanation for a negative event is explained by internal
factor, lower self-esteem tends to be displayed and passive expectation will be
produced. Scheier and Carver (1992) also pointed out that explanatory style and
dispositional optimism simultaneously rely on at least partly the same assumption,
which claims that differences in people’s expectations result in optimistic versus
pessimistic consequences.
In a study conducted by Metalsky et al. (1993), 114 college students subjects
were instructed to write down their expectations for their future performance on an
exam, after they completed the EASQ. The results indicated that among
undergraduates who received a low score, those who ascribed undesirable academic
performance to stable and global factors expected themselves to not achieve well in
the future. This result can be seen as evidence of potential influence of attributions
on expectations.
Though dispositional optimism and explanatory style are taken as
theoretically linked to each other, the results from empirical research exploring the
relationship between these two variables is inconsistent. Measures of generalized
expectancies (by the LOT) are only low or modestly associated with explanations for

Understanding Optimism
Chapter 2: The psychometric construct of optimism 74
negative events (by the ASQ) (Ahrens & Haaga, 1993; J. E. Gillham, Shatté, Reivich,
& Seligman, 2001; Peterson & Vaidya, 2001).
Generally speaking, correlations between the two constructs were positive but
varying between low and high across studies. Scheier and Carver (1992) reported
that correlations between the ASQ and the LOT are not very strong. Peterson and
Vaidya (2001) found a correlation of .20 between the ASQ and the LOT among a
sample of 155 college students. In one study conducted by Ahrens and Haaga (1993),
94 undergraduates completed several measures included the LOT and the ASQ, and
the correlation was reported as .30. In contrast, Hjelle, Belongia, and Nesser (1996)
reported a correlation of .41 between the LOT and the ASQ composite in a subject of
436 college students. J. E. Gillham, Tassoni, Engel, DeRubeis, and Seligman (1998)
reported a correlation of .63 and .41 between the LOT and the ASQ at two
assessment points. These correlations went up to .77 and .49 after being corrected for
attenuation respectively. Thus, correlations between the LOT and the ASQ ranged
from .20 to .77 across these studies.
Aims and hypothesis
Given the inconsistency in previous research, the current study examined two issues
regarding the nature of dispositional optimism. First, I wished to examine the utility
of a Chinese version of the LOT-R to measure dispositional optimism with a
Mainland Chinese sample. It is important to reach a resolution regarding the
psychometric structure of this popular measure of dispositional optimism before its
widespread application in Mainland China.
Based on previous findings mostly reporting a two-factor model of the LOT-
R, it is hypothesized that the two-factor model is superior to the one-factor model in
my study. Second, I set out to investigate the relationship of dispositional optimism
and explanatory style through correlational analysis. Based on previous findings, I
hypothesized that ASQ dimensions and LOT-R Optimism and LOT-R Pessimism
would be weakly correlated.

Understanding Optimism
Chapter 2: The psychometric construct of optimism 75
2.2.2 Two-factor structure of the LOT
A total of 684 participants, 452 from sample 1 and 232 of which from sample 2, were
included in this study (for detail of these two samples, see 1.5.4 of Chapter 1). There
were 230 males and 454 females. The mean age of the total sample was 19.93 years
(SD = 1.42).
Dispositional optimism was measured using the Chinese LOT-R (Lai & Yue,
2000).
Attributional style was assessed using the Chinese ASQ (Zhang, 2006).
Analysis Strategy
Structural equation modelling (SEM) was used to test potential mediating models
comprising the LOT-R using Amos 17.0 (Arbuckle, 2008). All analyses took
advantage of raw data supporting estimation of models using full information
maximum likelihood estimation. Descriptive statistics and correlational analyses
were obtained.
The adequacy of model fit was assessed using the comparative fit index (CFI),
Tucker-Lewis index (TLI) and the Root Mean Square Error of Approximation
(RMSEA). For CFI and TLI, values > 0.95 were taken as indicating acceptable fit
(Hu & Bentler, 1999). For the RMSEA, values of < .05 indicated acceptable fit (C. Y.
Yu, 2002). Akaike Information Criterion (AIC) and Bayesian Information Criterion
(BIC) are reported to aid model comparison.

Understanding Optimism
Chapter 2: The psychometric construct of optimism 76
Modelling
I first tested the one-factor model; all six items were specified as indicators of a
single factor. The unidimensional model fit poorly with the data, with χ² (10, N = 684)
= 405.19, p < .001; CFI = .358; TFI = .306; RMSEA = .241; AIC = 427.193; BIC =
477.000.
I next turned to the two-factor model. Here the three positively worded items
were specified as indicators of the Dispositional Optimism factor (LOT-R Optimism),
and the three negatively worded items were specified as indicators of the
Dispositional Pessimism factor (LOT-R Pessimism). Compared with the one-factor
model, the two-factor model fit better with χ² (8, N = 684) = 26.525, p < .001; CFI
= .970; TFI = .944; RMSEA = .058; AIC = 52.525; BIC = 111.388 (See Figure 2.9).
The correlation between the Dispositional Optimism factor and the Dispositional
Pessimism factor was -.20 (p<.01). The factor loading ranged from .30 to .81 (See
Figure 2.9).
Thus, as previously reported by many studies conducted in the Westerners, a
two-factor model of dispositional optimism was supported in this Mainland Chinese
sample. That is, the LOT-R measures two negatively correlated and independent
constructs.

Understanding Optimism
Chapter 2: The psychometric construct of optimism 77
Figure 2.9: Standardized estimations for the two-factor model.
Descriptive statistics
The means, standard deviations and Cronbach’s alpha of the total samples on LOT-R
and ASQ are summarized in Table 2.3.
Correlational analysis
I next turned to examine correlations between dispositional optimism and
explanatory style. I hypothesized that LOT-R Optimism and LOT-R Pessimism and
ASQ dimensions would be weakly correlated. Table 2.4 shows the inter-correlations
among the variables of interest. Consistent with previous studies, the LOT-R
Optimism was positively correlated with the ASQ Total (r = .12, p < .01), but lower
than correlations between these two variables reported by earlier studies (r ranged
from .20 to .77). For individual dimensions, LOT-R Optimism was positively
correlated with ASQ Positive (r = .08, p < .05) and Stable Positive (r = .09, p < .05),
Dispositional
Optimism
LOT-R 10
.74
LOT-R 4 .69
LOT-R 1 .44
Dispositional
Pessimism
LOT-R 9
.81
LOT-R 7 .67
LOT-R 3 .30
-.20

Understanding Optimism
Chapter 2: The psychometric construct of optimism 78
and negatively correlated with Stable Negative (r = -.10, p < .05), but had no
significant correlation either with ASQ Negative or with any three dimensions of
negative events. No significant correlation was found between ASQ Pessimism and
any ASQ dimensions.
Measures Means SD Cronbach’s Alpha
LOT-R Optimism 6.37 2.33 0.64
LOT-R Pessimism 4.89 2.04 0.61
ASQ Positive 15.22 1.88 0.83
Internal Positive 4.97 0.70 0.65
Stable Positive 5.33 0.78 0.74
Global Positive 4.91 0.83 0.69
ASQ Negative 12.93 1.83 0.78
Internal Negative 4.46 0.65 0.46
Stable Negative 4.33 0.87 0.72
Global Negative 4.14 0.92 0.73
ASQ Total 2.29 2.19 0.84
Table 2.3: Means, SDs and Cronbach’s Alpha for the ASQ and the LOT scales.
Note: Means for ASQ dimensions are on a scale ranging from 1 to 7; Means for the
LOT are on a scale ranging from 0 to 4 (n = 684).

Understanding Optimism
Chapter 2: The psychometric construct of optimism 79
Measures 1 2 3 4 5 6 7 8 9 10
1. LOT-R Optimism
2. LOT-R Pessimism -0.13**
3. ASQ Positive 0.08* 0.03
4. Internal Positive 0.05 0.05 0.77**
5. Stable Positive 0.09* 0.04 0.85** 0.54**
6. Global Positive 0.06 -0.02 0.81** 0.39** 0.52**
7. ASQ Negative -0.06 -0.05 0.30** 0.09* 0.25** 0.37**
8, Internal Negative 0.04 0.01 0.26** 0.27** 0.19** 0.17** 0.59**
9. Stable Negative -0.10* -0.04 0.16** -0.04 0.26** 0.16** 0.78** 0.20**
10.Global Negative -0.05 -0.07 0.26** 0.03 0.11** 0.46** 0.83** 0.28** 0.47**
11.ASQ Total 0.12** 0.07 0.61** 0.58** 0.52** 0.39** -0.58** -0.27** -0.52** -0.47**
Table 2.4: Correlations between measures.
* p < 0.05
** p < 0.01

Understanding Optimism
Chapter 2: The psychometric construct of optimism 80
2.2.3 What we should know about dispositional optimism
The primary goal of the current study was to address whether dispositional optimism
measured by LOT-R was compatible with a one-factor or two-factor model in a
Mainland Chinese sample. I found that the LOT-R was better interpreted as a
bidimensional construct, which includes dispositional optimism and dispositional
pessimism, than a unidimensional structure.
Originally, dispositional optimism was theoretically constructed on self-
regulation theory, which involves approaching and avoiding goals of behaviour, and
was then proposed to reflect a bipolar construct (Scheier & Carver, 1985). However,
many studies demonstrated that the two-factor structure may better explain the
psychometric structure of dispositional optimism (L. Chang & McBrideChang, 1996;
Kubzansky et al., 2004; Marshall et al., 1992; McPherson & Mohr, 2005; Roysamb &
Strype, 2002). The present study conducted in a Mainland Chinese sample supported
the proposal of a bidimensional construct. Though prior studies concerning the
psychometric structure of the LOT and LOT-R mainly support a two-factor model, it
does not mean that individuals should be distinctively categorized as optimists and
pessimists by a cut-off score. As noted in the study of Eichner, Kwon, and Marcus
(2014), optimism is a continuous variable.
The second aim of the present study was to examine the correlations between
dispositional optimism and explanatory style. Results indicated that dispositional
optimism was positively correlated with the composite attributional style, which is
consistent with most previous studies exploring the relationship between these two
constructs, although the correlation was lower than earlier studies. New findings were
reported for correlations between the LOT Optimism and individual dimensions of the
ASQ. Specifically, the results demonstrated that LOT-R optimism was positively
correlated with the stability dimension of positive events, and negatively correlated

Understanding Optimism
Chapter 2: The psychometric construct of optimism 81
with the stability dimension of negative events. This may reveal some interesting
points in understanding the relationship between dispositional optimism and
explanatory style. Regarding the fact that only a general correlation between the LOT
or LOT-R and the ASQ composite has been reported in most previous studies, results
in this study provide at least some further information to better understand the
relationship between dispositional optimism and explanatory style.
Furthermore, my study provided empirical evidence of the correlational patterns
between explanatory style and dispositional optimism in a non-Western sample. The
results were generally consistent with findings of previous research in Western
samples, in which explanatory style and dispositional optimism were reported to be
weakly correlated (Forgeard & Seligman, 2012).

Understanding Optimism
Chapter 3: Optimism and personality 82
Chapter 3: Optimism and personality
A pessimist sees the difficulty in every opportunity. An optimist sees the opportunity in
every difficulty. – Winston Churchill
3.1 Is optimism a personality thing?
Personality, as one of the most traditional and widely developed psychological models,
has long been the focus of theorists and practitioners. There are at least three different
well-established personality systems – Eysenck’s three factor approach (Eysenck,
1965), the 16 personality factor system (Cattell, 1943), and the Five-Factor Model of
personality (FFM; McCrae & Costa, 1987) – that have been proposed and studied in
the last several decades. Among these three approaches, the FFM appears to have
attained a dominant position in both research and application.
The FFM proposes that there are five fundamental dimensions of personality that
are stable and consistent over time and across culture, namely Extraversion,
Agreeableness, Neuroticism (Emotional Stability), Conscientiousness, and Openness
to Experience (McCrae & Costa, 1987). The FFM is measured with the Revised NEO
Personality Inventory (NEO-PI-R; Costa & McCrae, 1992). Each of the five domains
of the NEO-PI-R is represented by six specific scales that measure facets of each
domain. For example, Neuroticism consists of Anxiety, Angry Hostility, Depression,
Self-Consciousness, Impulsiveness, and Vulnerability; Extraversion consists of
Warmth, Gregariousness, Assertiveness, Activity, Excitement-Seeking, and Positive
Emotions (Costa & McCrae, 1995).

Understanding Optimism
Chapter 3: Optimism and personality 83
Explanatory style and personality
Explanatory style has been proposed as a cognitive variable designed to investigate
the habitual causal explanations people provide for life events (Peterson & Seligman,
1984). Attributions are identified as thoughts and beliefs people hold for explaining
various life events, and this individual difference has been assessed largely through its
linkage to traditional personality traits, including almost all the main approaches in
personality. Previous studies have indicated that attributions for life events, especially
for negative events, provides understanding of the potential mechanism underlying
the nature of other personality dispositions (e.g. Haugen & Lund, 1998).
Though both explanatory style and FFM have been taken as important to
understanding personality, very few studies have been done to explore the relationship
between these two constructs. In those studies, attributional style for negative events
has been found to be negatively correlated with Conscientiousness. For example, in a
study which investigated substance use in college students, Musgrave-Marquart et al.
(1997) reported that attributions for academic failure was modestly correlated with
Conscientiousness (r = -.18) but none of the other FFM dimensions. Similarly,
Poropat (2002) reported that ASQ Negative was negatively correlated with
Conscientiousness (r = -.16). Correlations between ASQ Positive, ASQ Total, and
FFM dimensions have also been reported in this study. ASQ Positive was found to be
positively correlated with Emotional Stability (r = .18) but not significantly associated
with other FFM dimensions. By contrast, ASQ Total has been reported to correlate
significantly with four FFM dimensions (Extraversion, r = .22; Agreeableness, r = .16;
Conscientiousness, r = .20; Emotion Stability, r = .22).
In addition to FFM, correlations between ASQ dimensions and other personality
frameworks have been investigated. For example, Haugen and Lund (1998) reported
that attributions for positive and negative events correlated differently with self-

Understanding Optimism
Chapter 3: Optimism and personality 84
esteem, motive, self-efficacy, and defensiveness. In a group of Chinese college
students, Wang and Zhang (2005) reported correlations between the ASQ and the
Sixteen Personality Factor Questionnaire (16-PF). It revealed that individuals with a
pessimistic explanatory style were also characterized by high sensitivity, high
insecurity, high tension, and high anxiety.
In their study of ASQ validation, P.J. Corr and J.A. Gray (1996) examined ASQ
correlations with several personality traits from the Eysenck Personality
Questionnaire (EPQ) and the State-Trait Anxiety Inventory (STAI). Attributions for
positive events correlated positively with Extraversion within the occupational sample
of salespersons but did not correlate with any of the EPQ variables among a group of
volunteers. Attributions for negative events was correlated with all EPQ variables,
suggesting a trend of general dysphoria, e.g. high Neuroticism, high psychoticism,
and low Extraversion, which was consistent with a general understanding of the
relationship between negative attributional style and the FFM. On the other hand,
anxiety measured using the STAI correlated positively with ASQ negative events
scores and negatively with the ASQ positive events scores.
Studies examining the relationship between explanatory style and personality
have often been intertwined with the investigation of potential gender differences in
attributional style. For instance, Rim (1991) reported that for the dimension of
stability, men scoring low on Neuroticism rated higher on positive than negative
events, while for the global factor, those scoring high on Neuroticism rated higher on
positive than on negative events. Women have different patterns. For all attributional
styles, women who scored low on Neuroticism had higher scores on positive events
than on negative events. Regarding Extraversion, both men and women with low
scores got higher rates on positive than on negative events for the internal factor only.

Understanding Optimism
Chapter 3: Optimism and personality 85
Gender differences were also reported in a later study. Poropat (2002)
investigated the relationship between explanatory style and the FFM in a group of
college students, and discovered that the correlational patterns were different for men
and women. Specifically, optimistic explanatory style was positively related to
Agreeableness for both men and women, but was positively related to Extraversion
only for men, and was negatively related to Neuroticism only for women.
Gender differences have also been reported in studies examining the link between
explanatory style and other basic personality variables in addition to the FFM. For
example, using the California Psychological Inventory (CPI) as a personality
measurement, Bunce and Peterson (1997) reported that women’s optimistic
explanatory style negatively correlated with well-being and good impression. For men,
different patterns emerged. Sociability negatively correlated with optimistic
explanatory style. Though the mechanism underlying the gender differences in the
attributional style-personality relationship is still not quite clear, these studies indicate
that they are manifested differently between men and women.
Based on the prior studies mentioned above, it appears that there are no consistent
pattered correlations between explanatory style and FFM variables and other
personality frameworks. This lack of research called for the necessity of studies
comparing these two important variables.
Dispositional optimism and FFM
Dispositional optimism is regarded as a relatively stable individual personality trait
(Carver et al., 2010). Associations between dispositional optimism and the FFM have
been found in many studies. Dispositional optimism is mainly manifested in
Neuroticism and Extraversion, especially the former. For example, Williams (1992)
reported that the LOT correlates positively with Extraversion (r = .25), and is also
correlated negatively, but more strongly, with Neuroticism (r = -.58). This study was

Understanding Optimism
Chapter 3: Optimism and personality 86
conducted with 223 university students. Also, in a sample of 113 older women,
Boland and Cappeliez (1997) linked optimism to low Neuroticism (r = -.66).
Significant correlations between dispositional optimism and other FFM
dimensions have been reported. For example, Suzanne C Segerstrom, Castañeda, and
Spencer (2003) reported strong positive correlations between LOT-R scores and
Conscientiousness (r = .31), in addition to typical correlations of dispositional
optimism with Extraversion (r = .60) and Emotional Stability (r = -.46). Furthermore,
Agreeableness was found to be positively correlated with dispositional optimism in
Ebert, Tucker, and Roth (2002)’s study (r = .35). The relationship between
dispositional optimism and the FFM was expanded to Openness as well. Lounsbury,
Saudargas, and Gibson (2004) reported positive correlations between dispositional
optimism and all five FFM dimensions: Extraversion (r = .27), Conscientiousness (r
= .23), Agreeableness (r = .29), Emotional Stability (r = .60), and Openness (r = .30).
Similarly, in a larger-sample study (N = 4,332), Sharpe, Martin, and Roth (2011)
reported that dispositional optimism (measured by three different questionnaires) was
significantly correlated with all five FFM factors (assessed by five different measures).
For Extraversion, raverage = .44; for Neuroticism, raverage = -.56; for Openness, raverage
= .21; for Agreeableness, raverage =.39; for Conscientiousness, raverage = .38.
One of the unresolved debates about dispositional optimism is whether it is a
continuous bipolar variable or a two-dimensional variable. Implied in measurement,
there has long been an ambiguity in confirming the psychometric structure of the LOT.
A few studies have tried to resolve this debate by linking dispositional optimism to
some traditional and well-established personality constructs, such as the FFM. In
these studies, the FFM or other fundamental personality traits have been used as
external criteria to examine the psychometric structure and personality essence of
dispositional optimism. For instance, a two-dimension structure of the LOT was

Understanding Optimism
Chapter 3: Optimism and personality 87
supported in Marshall et al. (1992)’s study in a sample of 889 male navy interns. This
study discovered that LOT Optimism correlated more strongly with Extraversion than
did LOT Pessimism, and LOT Pessimism correlated more strongly with Neuroticism
than did LOT Optimism, showing that the LOT is related to both these domains of
personality. However, the patterns revealed in Marshall et al.’s research were greatly
reduced after item valence was controlled for in a recent study with a larger sample
size (n = 1,016) (Kam & Meyer, 2012).
Aims of the current study
The present study set out to accomplish four main goals.
First, correlational analysis of ASQ measures, LOT-R variables and FFM factors
were calculated and these analyses were expanded to specific facets of FFM
dimensions in order to get a better understanding of the relationship between
explanatory style and dispositional optimism, and to provide extra information
concerning the relationship between optimism and the FFM. Based on previous
research findings already discussed, LOT-R Optimism was hypothesized to be
negatively related to Neuroticism, and positively correlated with Extraversion,
Agreeableness, Openness, and Conscientiousness. Conversely, LOT-R Pessimism
was hypothesized to be positively related to Neuroticism, and negatively correlated
with the other four FFM factors.
For the ASQ measures, ASQ Positive was hypothesized to be negatively related
to Neuroticism and positively correlated to Extraversion. ASQ Negative was
hypothesized to be negatively related to Conscientiousness. Other potential
correlations between ASQ variables and FFM factors, such as correlations between
ASQ Negative and Extraversion, have not been reported previously. Based on past
correlational analysis between FFM factors, ASQ Positive was hypothesized to be

Understanding Optimism
Chapter 3: Optimism and personality 88
positively related to Openness, Agreeableness, and Conscientiousness. ASQ Negative
was hypothesized to be positive correlated with Neuroticism, and negatively related to
Extraversion, Openness, and Agreeableness.
For specific facets of FFM factors, Depression (one of the six facets of
Neuroticism) was hypothesized to be positively related to ASQ Negative and LOT-R
Pessimism, and to be negatively correlated with ASQ Positive and LOT-R Optimism.
Other potential correlations between ASQ, LOT-R variables, and FFM facets are
unpredictable since no findings have been reported as to my knowledge.
Second we wished to explore gender difference in levels of explanatory style
within the background of FFM as suggested by Poropat (2002). Examination of
gender differences was extended to the relationship of dispositional optimism and
FFM variables. This study set out to compare the ASQ, the LOT, and the FFM among
men and women collectively as well as among men and women separately.
Third, since previous studies have suggested the FFM is a reliable external
criterion for examining the psychometric structure of dispositional optimism, the next
aim of this study was to test the associations between the FFM and dispositional
optimism/pessimism. In addition to correlational analyses, a model using SEM was
examined (see Figure 3.1). For this model, we hypothesized that all FFM dimensions
are correlated with each other; LOT-R Optimism and LOT-R Pessimism will be
predicted by FFM factors, especially Neuroticism and Extraversion; and LOT-R
Optimism and LOT-R Pessimism are distinctive but negatively correlated factors.

Understanding Optimism
Chapter 3: Optimism and personality 89
Figure 3.6: Proposal for an initial model with hypothesized relationship between
LOT-R and FFM.
Finally, I set out to examine the relationship between attributional style and FFM
with a SEM model (see Figure 3.2). In my earlier MTMM analysis of the ASQ, joint
modelling of attributions supported three correlated cognitive style factors of
internality, stability and globality, and two uncorrelated affective biases on judgments
of positive and negative events. Accordingly, in this model, it was hypothesized that
Internal Positive and Internal Negative are positively correlated, as are the other two
cognitive style factors (Stability and Globality). All FFM dimensions are correlated
LOT-R Optimism
LOT-R 10 LOT-R 4 LOT-R 1
LOT-R Pessimism
LOT-R 9 LOT-R 7 LOT-R 3
Neuroticism Extraversion Openness Agreeableness Conscientiousness

Understanding Optimism
Chapter 3: Optimism and personality 90
with each other. ASQ Positive and ASQ Negative will be predicted by FFM
dimensions. Specifically, Neuroticism and Extraversion were expected to be
predictors of attributional style.
Figure 3.2: Proposal for an initial model with hypothesized relationship between ASQ
and FFM.
Neuroticism Extraversio
n
Openness Agreeableness Conscientiousnes
s
ASQ Positive ASQ Negative
Global Stable Internal Global Stable Internal

Understanding Optimism
Chapter 3: Optimism and personality 91
3.2 Methods
Participants
A total of 452 participants (sample 1) were included in the current study (for detail of
this sample, see 1.5.4 of Chapter 1).
Materials
Dispositional optimism was measured using a Chinese version of the Life Orientation
Test-Revised (Lai & Yue, 2000). Subjects were scored for LOT-R Optimism and
LOT-R Pessimism scores. Cronbach’sαfor LOT-R Optimism, .76; and, for LOT-R
Pessimism, .82.
Attributional style was assessed using the Chinese ASQ (Zhang, 2006).
Composite attributional styles were calculated separately for positive and negative
events separately. Reliabilities (Cronbach’s α) were acceptable .84 for the total and,
for positive events, .84; for negative events, .77.
Though the NEO-PI-R is a well-established, psychometrically sound instrument
that covers a full range of the Big Five personality traits, it has rarely been used in
prior research partly due to its time-consuming length. The FFM was measured, in the
present study, by a Chinese version of the NEO-PI-R (Yang et al., 1999). The internal
consistency of the personality total from the NEO-PI-R was .83 in this sample.
Reliabilities (Cronbach’s α) were acceptable for five individual sub-scales (.89 for
Neuroticism; .83 for Extraversion; .76 for Openness; .75 for Agreeableness; and .88
for Conscientiousness).

Understanding Optimism
Chapter 3: Optimism and personality 92
Analysis Strategy
Structural equation modelling (SEM) was used to test potential models constructing
LOT-R and NEO-PI-R using Amos 17.0 (Arbuckle, 2008). All analyses took
advantage of raw data supporting the estimation of models using full information
maximum likelihood estimation. Descriptive statistics and correlational analyses were
obtained.
The adequacy of model fit was assessed using the comparative fit index (CFI),
Tucker-Lewis index (TLI), and the Root Mean Square Error of Approximation
(RMSEA). For CFI and TLI, values > 0.95 were taken as indicating acceptable fit (Hu
& Bentler, 1999). For the RMSEA, values of < .05 indicated acceptable fit (C. Y. Yu,
2002). Akaike Information Criterion (AIC) and Bayesian Information Criterion (BIC)
are reported to aid model comparison.
3.3 Results
Descriptive statistics
Table 3.1 demonstrates descriptive statistics andαreliability coefficients for the ASQ
and the LOT-R scales. The ASQ reliabilities reported in Table 3.1 are similar to those
reported by Peterson et al. (1982) and Poropat (2002).

Understanding Optimism
Chapter 3: Optimism and personality 93
Measures Means SD Cronbach’s Alpha
LOT-R optimism 8.27 1.84 0.76
LOT-R pessimism 3.85 1.99 0.82
ASQ Negative 12.90 1.78 0.84
Internal Negative 4.45 0.67 0.49
Stable Negative 4.33 0.85 0.73
Global Negative 4.12 0.90 0.73
ASQ Positive 15.28 1.91 0.77
Internal Positive 5.03 0.70 0.65
Stable Positive 5.36 0.78 0.75
Global Positive 4.90 0.85 0.71
ASQ Total 2.38 2.17 0.84
Table 3.1: Means, standard deviations and Cronbach’s alpha for ASQ and LOT-R
scales.
Descriptive statistics and Cronbach’s alpha for NEO-PI-R scales are reported in Table
3.2.

Understanding Optimism
Chapter 3: Optimism and personality 94
Measures Means SD Cronbach’s Alpha
Neuroticism 94.10 18.81 0.89
Anxiety 16.87 4.32 0.66
Angry Hostility 13.58 4.13 0.62
Depression 15.29 4.40 0.68
Self-consciousness 17.68 4.17 0.63
Impulsiveness 15.58 3.57 0.50
Vulnerability 15.08 3.98 0.69
Extraversion 106.15 15.39 0.83
Warmth 20.90 4.25 0.72
Gregariousness 17.16 4.24 0.65
Assertiveness 15.08 3.64 0.60
Activity 16.01 3.33 0.42
Excitement-seeking 15.81 3.49 0.34
Positive Emotions 21.19 4.60 0.75
Openness 109.44 13.47 0.76
Fantasy 17.74 3.99 0.61
Aesthetics 20.01 4.13 0.62
Feelings 20.46 3.62 0.57
Actions 14.97 3.19 0.41
Ideas 17.31 4.71 0.74
Value 18.95 2.89 0.23
Agreeableness 112.52 12.31 0.75
Trust 20.05 3.65 0.63
Straightforwardness 17.73 3.83 0.54
Altruism 21.32 3.66 0.64
Compliance 18.10 3.34 0.37
Modesty 15.22 2.99 0.42
Tender-Mindedness 20.09 3.46 0.46
Conscientiousness 111.14 17.15 0.88
Competence 18.62 3.42 0.53
Order 16.97 3.90 0.56
Dutifulness 21.08 3.68 0.58
Achievement Striving 18.18 4.23 0.68
Self-Discipline 17.55 3.66 0.62
Deliberation 18.74 4.10 0.67
Table 3.2: Means, standard deviations and Cronbach’s alpha for NEO-PI-R scales.
Correlational analyses
I first tested correlations between the ASQ, the LOT-R and the five NEO-PI-R scales
for the entire sample (see Table 3.3). Both LOT-R Optimism and ASQ Total have

Understanding Optimism
Chapter 3: Optimism and personality 95
significantly negative correlations with Neuroticism, and significantly positive
correlations with Extraversion, which is consistent with prior studies (e.g. Poropat,
2002; Sharpe et al., 2011). Both LOT-R Optimism and ASQ Total are significantly
correlated with Openness, Agreeableness, and Conscientiousness for the entire sample.
LOT-R Pessimism is positively correlated with Neuroticism and negatively correlated
with Extraversion, Openness, and Conscientiousness, but not significantly correlated
with Agreeableness.
As expected, ASQ Positive and ASQ Negative have different correlational
patterns with the FFM. ASQ Negative is positively correlated with Neuroticism, and
is negatively correlated with Extraversion and Conscientiousness, while ASQ Positive
is positively related to four of the five NEO-PI-R dimensions (see Table 3.2).
Measures Neuroticism Extraversion Openness Agreeableness Conscientiousness
LOT-R Optimism -0.32** 0.40** 0.21** 0.22** 0.27**
LOT-R Pessimism 0.23** -0.26** -0.14** -0.09 -0.25**
ASQ Negative 0.31** -0.20** -0.04 -0.09 -0.23**
ASQ Positive -0.07 0.15** 0.22** 0.11* 0.19**
ASQ total -0.32** 0.30** 0.23** 0.17** 0.36**
Table 3.3: Correlations of LOT, ASQ and NEO-PI-R for the entire sample.
*P<0.05. **P<0.01.

Understanding Optimism
Chapter 3: Optimism and personality 96
To compare potential gender differences between the relationships of the LOT-R,
ASQ, and FFM, these correlations are demonstrated separately for men and women in
Table 3.4 and Table 3.5.
I first compared patterns of associations between men and the entire group. As
shown in Table 3.4, correlational patterns between the LOT-R, ASQ and NEO-PI-R
are quite similar for men and for the entire sample but still show differences. The
significant correlation between LOT-R Optimism and Openness for the entire sample
is absent for men. Similar patterns emerge for correlations between LOT-R Pessimism
and Openness. However, LOT-R Pessimism is negatively correlated with
Agreeableness for men while this correlation is absent for the entire sample.
Measures Neuroticism Extraversion Openness Agreeableness Conscientiousness
LOT-R Optimism -0.30** 0.35** 0.14 0.28** 0.41**
LOT-R Pessimism 0.18* -0.26** -0.13 -0.22* -0.23**
ASQ Negative 0.38** -0.21* 0.01 -0.04 -0.18*
ASQ Positive -0.01 0.17* 0.23** 0.19* 0.18*
ASQ Total -0.35** 0.34** 0.20* 0.20** 0.32**
Table 3.4: Correlations of LOT-R, ASQ and NEO-PI-R scales for men.
*P<0.05. **P<0.01.
Then correlational patterns of these variables between men and women were
compared. Slight differences emerge (see Table 3.5). There is a positive correlation
between LOT-R Optimism and Openness for women, which is absent among men.
This is also the case for the negative correlation between LOT-R Pessimism and
Openness. However, the negative correlation between ASQ Negative and
Agreeableness for men is absent for women. Also, while ASQ Positive is positively
correlated with Agreeableness for men, it is absent among women.

Understanding Optimism
Chapter 3: Optimism and personality 97
In addition to the correlational analysis between the ASQ, LOT-R, and the five
main domains measured by the NEO-PI-R, correlations between the ASQ, LOT-R,
and all NEO-PI-R facets for each domain for the entire sample were also calculated
(see Table 3.6 to Table 3.10). These correlational analyses were aimed to examine the
relationships among dispositional optimism, explanatory style, and specific
personality facets described by the NEO-PI-R.
Measures Neuroticism Extraversion Openness Agreeableness Conscientiousness
LOT-R Optimism -0.34** 0.42** 0.23** 0.19** 0.20**
LOT-R Pessimism 0.26** -0.26** -0.14* -0.02 -0.27**
ASQ Negative 0.28** -0.20** -0.06 -0.11* -0.26**
ASQ Positive -0.10 0.14** 0.22** 0.08 0.20**
ASQ Total -0.31** 0.28** 0.24** 0.16** 0.38**
Table 3.5: Correlations of LOT-R, ASQ and NEO-PI-R scales for women.
*P<0.05. **P<0.01.
As shown in Table 3.6, LOT-R Optimism is negatively correlated with all six
facets of Neuroticism, and LOT-R Pessimism is positively correlated with all
Neuroticism facets. For attributional style, Hopelessness (stability + globality of
negative events) was significantly positively associated with all six facets of
Neuroticism, including Depression, which is consistent with the hopelessness theory
of depression (Abramson et al., 1989) and findings reported by Peterson and Vaidya
(2001). Here ASQ Negative is significantly associated with all six facets in addition to
Neuroticism but ASQ Positive is not, which supports the lack of a correlation between
ASQ Positive and ASQ Negative (Peterson et al., 1982).

Understanding Optimism
Chapter 3: Optimism and personality 98
Table 3.7 displays the correlations among LOT-R, ASQ, and Extraversion and its
six facets, namely Warmth, Gregariousness, Assertiveness, Activity, Excitement-
seeking, and Positive emotions. Prior research found significant correlations between
optimism and positive affect (Ahrens & Haaga, 1993; Daukantaite & Zukauskiene,
2012; Scheier & Carver, 1992), which was supported here (see Table 3.7).
Specifically, LOT-R Optimism and ASQ Positive are positively correlated with
Positive emotions, while LOT-R Pessimism and ASQ Negative are negatively related
to Positive emotions.
Table 3.8 provides results of correlational analyses of the LOT-R, the ASQ scales,
and all facets of the Openness factor. As shown in Table 3.8, both LOT-R Optimism
and ASQ Positive are positively correlated with four of the six facets of Openness,
including Aesthetics, Feelings, Ideas, and Value. On the other hand, while LOT-R
Pessimism is negatively associated with Feelings and Value, ASQ Negative shows no
significant correlations with these two facets but is negatively correlated with Actions
and is positively correlated with Fantasy.
Correlations between dispositional optimism, explanatory style, and six facets of
Agreeableness are reported in Table 3.9. Here LOT-R Pessimism and ASQ Negative
demonstrate similar patterns of correlation. Though these two scales are not
significantly associated with Agreeableness as a whole, both are negatively correlated
with Trust, Altruism, and Modesty. For LOT-R Optimism and ASQ Positive, similar
correlational patterns appear. Both scales are significantly associated with Trust,
Altruism, Modesty, and Tender-Mindedness in addition to their positive correlation
with Agreeableness.
Table 3.10 presents correlations among the LOT-R, ASQ scales, and six facets of
Conscientiousness. Here the correlational patterns are quite similar. Specifically, both
LOT-R Optimism and ASQ Positive are positively correlated with Conscientiousness
as a whole and all six facets of Conscientiousness. On the other hand, LOT-R

Understanding Optimism
Chapter 3: Optimism and personality 99
Pessimism and ASQ Negative demonstrate negative correlations with both
Conscientiousness and all the six facets.

Understanding Optimism
Chapter 3: Optimism and personality 100
Measures Neuroticism Anxiety Angry Hostility Depression Self-consciousness Impulsiveness Vulnerability
LOT-R Optimism -0.32** -0.24** -0.20** -0.32** -0.26** -0.14** -0.29**
LOT-R Pessimism 0.23** 0.18** 0.17** 0.27** 0.14** 0.15** 0.12*
ASQ Negative 0.31** 0.21** 0.24** 0.28** 0.25** 0.17** 0.29**
Internal Negative 0.12** 0.05 0.09 0.10* 0.11** 0.08 0.14**
Stable Negative 0.26** 0.17** 0.21** 0.24** 0.21** 0.15** 0.23**
Global Negative 0.28** 0.22** 0.20** 0.25** 0.21** 0.14** 0.25**
Hopelessness 0.32** 0.23** 0.24** 0.28** 0.25** 0.17** 0.29**
ASQ Positive -0.07 -0.06 -0.10* -0.07 0.02 -0.05 -0.07
Internal Positive -0.17** -0.16** -0.13** -0.15** -0.06 -0.11* -0.16**
Stable Positive -0.07 -0.07 -0.09 -0.05 0.01 -0.04 -0.08
Global Positive 0.04 0.07 -0.03 0.02 0.08 0.02 0.04
Hopefulness -0.01 0.00 -0.07 -0.02 0.05 -0.01 -0.02
ASQ Total -0.32** -0.22** -0.28** -0.29** -0.19** -0.18** -0.30**
Table 3.6: Correlations of LOT-R, ASQ and Neuroticism and its six facets for the entire sample.
*P<0.05. **P<0.01.
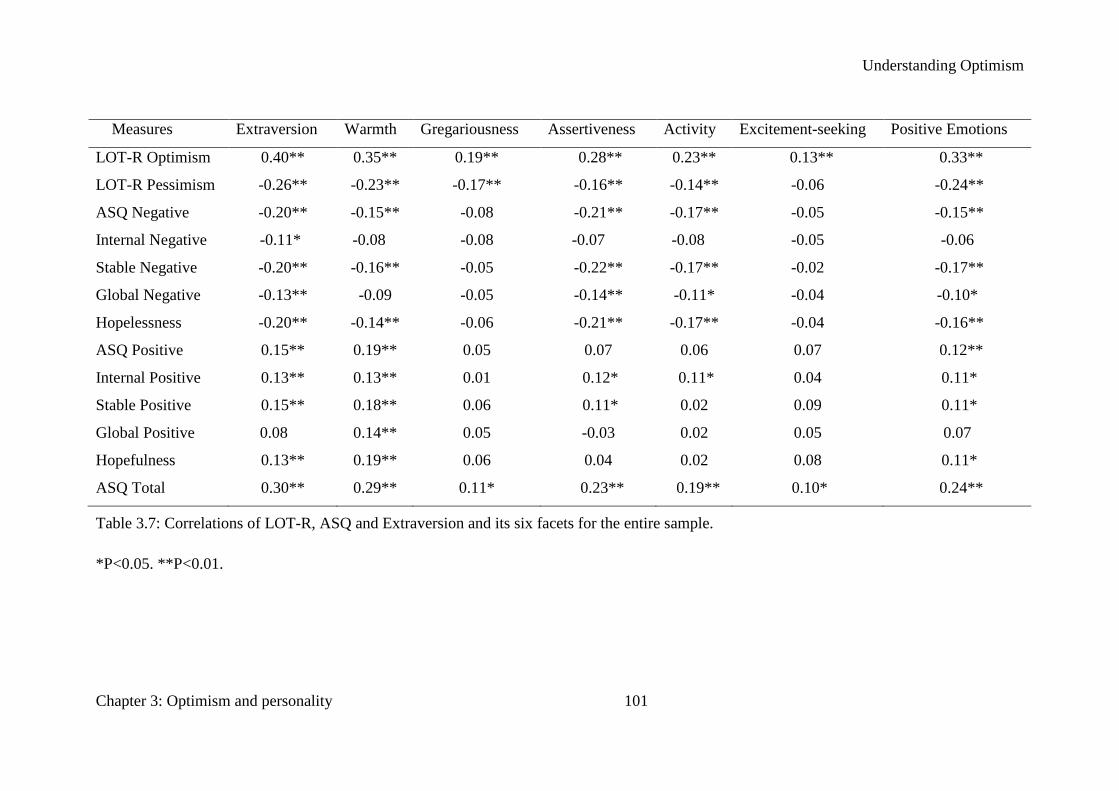
Understanding Optimism
Chapter 3: Optimism and personality 101
Measures Extraversion Warmth Gregariousness Assertiveness Activity Excitement-seeking Positive Emotions
LOT-R Optimism 0.40** 0.35** 0.19** 0.28** 0.23** 0.13** 0.33**
LOT-R Pessimism -0.26** -0.23** -0.17** -0.16** -0.14** -0.06 -0.24**
ASQ Negative -0.20** -0.15** -0.08 -0.21** -0.17** -0.05 -0.15**
Internal Negative -0.11* -0.08 -0.08 -0.07 -0.08 -0.05 -0.06
Stable Negative -0.20** -0.16** -0.05 -0.22** -0.17** -0.02 -0.17**
Global Negative -0.13** -0.09 -0.05 -0.14** -0.11* -0.04 -0.10*
Hopelessness -0.20** -0.14** -0.06 -0.21** -0.17** -0.04 -0.16**
ASQ Positive 0.15** 0.19** 0.05 0.07 0.06 0.07 0.12**
Internal Positive 0.13** 0.13** 0.01 0.12* 0.11* 0.04 0.11*
Stable Positive 0.15** 0.18** 0.06 0.11* 0.02 0.09 0.11*
Global Positive 0.08 0.14** 0.05 -0.03 0.02 0.05 0.07
Hopefulness 0.13** 0.19** 0.06 0.04 0.02 0.08 0.11*
ASQ Total 0.30** 0.29** 0.11* 0.23** 0.19** 0.10* 0.24**
Table 3.7: Correlations of LOT-R, ASQ and Extraversion and its six facets for the entire sample.
*P<0.05. **P<0.01.

Understanding Optimism
Chapter 3: Optimism and personality 102
Measures Openness Fantasy Aesthetics Feelings Actions Ideas Value
LOT-R Optimism 0.21** 0.05 0.13** 0.17** 0.04 0.19** 0.13**
LOT-R Pessimism -0.14** -0.01 -0.08 -0.15** -0.08 -0.08 -0.14**
ASQ Negative -0.04 0.12* -0.08 -0.02 -0.09* -0.06 -0.01
Internal Negative -0.06 0.06 -0.06 -0.06 -0.11* -0.03 -0.04
Stable Negative -0.05 0.09 -0.10* -0.05 -0.02 -0.10* 0.04
Global Negative 0.02 0.10* -0.02 0.05 -0.08 0.01 -0.02
Hopelessness -0.02 0.11* -0.07 0.01 -0.06 -0.06 0.01
ASQ Positive 0.22** 0.08 0.17** 0.24** 0.03 0.13** 0.15**
Internal Positive 0.17** 0.04 0.11* 0.16** 0.07 0.14** 0.07
Stable Positive 0.18** 0.05 0.11* 0.18** 0.06 0.09* 0.17**
Global Positive 0.19** 0.11* 0.18** 0.24** -0.04 0.08 0.12*
Hopefulness 0.22** 0.09 0.17** 0.24** 0.01 0.10* 0.16**
ASQ Total 0.23** -0.02 0.21** 0.23** 0.11* 0.16** 0.15**
Table 3.8: Correlations of LOT-R, ASQ and Openness and its six facets for the entire sample.
*P<0.05. **P<0.01.

Understanding Optimism
Chapter 3: Optimism and personality 103
Measures Agreeableness Trust Straightforwardness Altruism Compliance Modesty Tender-Mindedness
LOT-R Optimism 0.22** 0.37** 0.05 0.32** 0.05 -0.29** 0.21**
LOT-R Pessimism -0.09 -0.16** -0.02 -0.18** -0.05 0.24** -0.10*
ASQ Negative -0.09 -0.14** -0.05 -0.15** -0.04 0.15** -0.03
Internal Negative -0.03 -0.03 -0.02 -0.10* -0.05 0.08 0.01
Stable Negative -0.13** -0.16** -0.04 -0.16** -0.04 0.10* -0.11*
Global Negative -0.02 -0.11* -0.04 -0.08 -0.01 0.15** 0.04
Hopelessness -0.08 -0.16** -0.05 -0.14** -0.03 0.14** -0.04
ASQ Positive 0.11* 0.24** -0.09* 0.22** 0.06 -0.24** 0.17**
Internal Positive 0.06 0.22** -0.05 0.16** -0.01 -0.26** 0.08
Stable Positive 0.08 0.22** -.010* 0.19** 0.06 -0.25** 0.12*
Global Positive 0.13** 0.16** -0.08 0.18** 0.08 -0.10* 0.21**
Hopefulness 0.12** 0.22** -0.11* 0.21** 0.08 -0.20** 0.19**
ASQ Total 0.17** 0.33** -0.05 0.31** 0.09 -0.34** 0.18**
Table 3.9: Correlations of LOT-R, ASQ and Agreeableness and its six facets for the entire sample.
*P<0.05. **P<0.01.
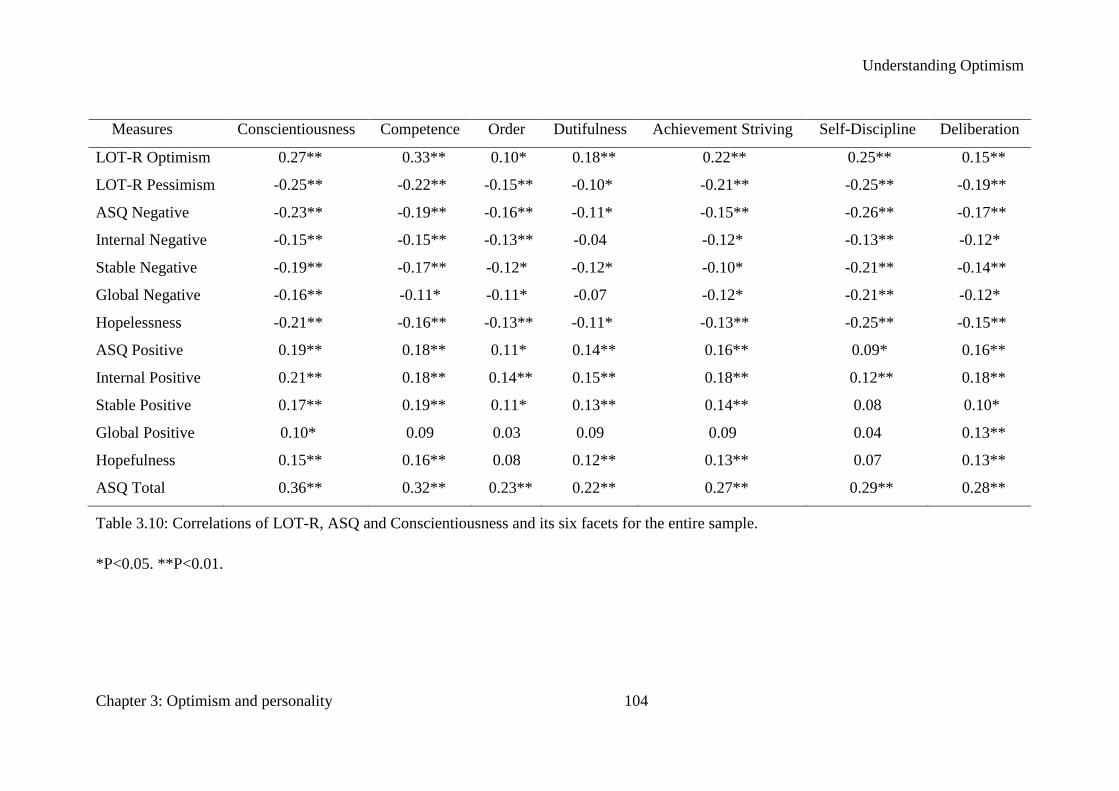
Understanding Optimism
Chapter 3: Optimism and personality 104
Measures Conscientiousness Competence Order Dutifulness Achievement Striving Self-Discipline Deliberation
LOT-R Optimism 0.27** 0.33** 0.10* 0.18** 0.22** 0.25** 0.15**
LOT-R Pessimism -0.25** -0.22** -0.15** -0.10* -0.21** -0.25** -0.19**
ASQ Negative -0.23** -0.19** -0.16** -0.11* -0.15** -0.26** -0.17**
Internal Negative -0.15** -0.15** -0.13** -0.04 -0.12* -0.13** -0.12*
Stable Negative -0.19** -0.17** -0.12* -0.12* -0.10* -0.21** -0.14**
Global Negative -0.16** -0.11* -0.11* -0.07 -0.12* -0.21** -0.12*
Hopelessness -0.21** -0.16** -0.13** -0.11* -0.13** -0.25** -0.15**
ASQ Positive 0.19** 0.18** 0.11* 0.14** 0.16** 0.09* 0.16**
Internal Positive 0.21** 0.18** 0.14** 0.15** 0.18** 0.12** 0.18**
Stable Positive 0.17** 0.19** 0.11* 0.13** 0.14** 0.08 0.10*
Global Positive 0.10* 0.09 0.03 0.09 0.09 0.04 0.13**
Hopefulness 0.15** 0.16** 0.08 0.12** 0.13** 0.07 0.13**
ASQ Total 0.36** 0.32** 0.23** 0.22** 0.27** 0.29** 0.28**
Table 3.10: Correlations of LOT-R, ASQ and Conscientiousness and its six facets for the entire sample.
*P<0.05. **P<0.01.

Understanding Optimism
Chapter 3: Optimism and personality 105
SEM modelling for LOT-R and FFM
The proposed model (see Figure 3.1) between dispositional optimism and FFM was
tested (as shown in Figure 3.3).
Figure 3.3: Standardized estimations for the initial model for LOT-R and FFM.
Standardized estimates of the original model are shown in Figure 3.3. Chi-
square for the initial model was significant (χ² (28) = 86.74, p < .001). For the initial
LOT-R Optimism
LOT-R 10
.48
LOT-R 4
.67
LOT-R 1
.24
LOT-R Pessimism
LOT-R 9
.71
LOT-R 7
.73
LOR-R 3
.26
Neuroticism Extraversion Openness Agreeableness Conscientiousness
-.40 .45 .23 .33
-.21
-.16
-.52
.27
.42
.35
.03
-.26 -.02 .01
-.15
-.19
-.05
.11 .04 .35 -.41

Understanding Optimism
Chapter 3: Optimism and personality 106
base model, other index values were obtained as: CFI = 0.933; TLI = 0.869; RMSEA
= 0.068; AIC = 162.736; BIC = 319.056. Although CFI or TLI values may be
considered acceptable, modifications were suggested and made to the original model
to obtain a better fit according to the results. These modifications include three
relationships between the residual variances of measured variables, including a
relationship between the residual variance of Neuroticism and the first item of LOT-
R. The new paths all had loadings of .16 or below, suggesting that deviation from the
theoretical model is minor (see Figure 2.4). These modifications significantly
improved model fit, and the resultant model fit reasonably well (χ² (25) = 41.95, p
=.018; CFI = 0.981; TLI = 0.957; RMSEA = 0.039; AIC = 123.945; BIC = 292.606).
Figure 3.4: Standardized estimations for the modified model for LOT-R and FFM.
LOT-R Optimism
LOT-R 10
.47
LOT-R 4
.67
LOT-R 1
.32
LOT-R Pessimism
LOT-R 9
.71
LOT-R 7
.74
LOT-R 3
.24
Neuroticism Extraversion Openness Agreeableness Conscientiousness
-.41 .45 .23 .33
-.21
-.18
-.51
.27
.42
.35
-.45
.01
.34 -.26 .04 -.02 .11
.01
-.07
-.16
-.18
.16
-.13
.15

Understanding Optimism
Chapter 3: Optimism and personality 107
As shown in Figure 3.4, modelling analysis supports the initial model
proposed in Figure 3.1. In this model, Extraversion predicts both LOT-R Optimism
and LOT-R Pessimism with coefficients of .34 and -.26, respectively. Neuroticism
predicts only LOT-R Optimism (standardized coefficient = -.45). All FFM
dimensions are correlated with each other, with Neuroticism negatively correlated
with the four other FFM factors.
Multi-group SEM for testing gender differences of the model LOT-R and FFM
To formally test the potential gender differences of the model for LOT-R and FFM
(see Figure 3.4), multi-group SEM was conducted. See details in Chapter 3.3. I first
tested this model in the male group. Fit measures for this model indicated excellent
fit between model and data (χ2 (24) = 24.60, p < 0.5; CFI = 0.99, TLI = 0.99,
RMSEA = .014). Then, this model was tested in the female group. This model
showed a good fit between model and data (χ2 (24) = 34.35, p < 0.1; CFI = 0.98, TLI
= 0.96, RMSEA = .037).
Finally, multi-group SEM was conducted to test gender differences of this
model. In addition to unconstrained base model, Measurement weights, Structural
covariances, and Measurement residuals were used as constrained conditions in multi
group analysis. The fit statistics for baseline comparisons of all models tested are laid
out in Table 3.11. Table 3.11 shows that the unconstrained model fits best for the
data. Three constrained models have similar fits as the unconstrained model. Thus,
this model is compatible in both male and female in this sample.

Understanding Optimism
Chapter 3: Optimism and personality 108
Model NFI
Delta1
RFI
rho1
IFI
Delta2
TLI
rho2 CFI △CFI
Unconstrained .942 .867 .989 .972 .988
Measurement weights .908 .837 .967 .939 .965 -.023
Structural covariances .908 .845 .970 .947 .969 -.019
Measurement residuals .867 .837 .951 .939 .950 -.038
Table 3.11: Baseline comparisons for tested models between LOT-R and FFM.
SEM modelling for ASQ and FFM
The proposed model (see Figure 3.2) between dispositional optimism and FFM was
tested (as shown in Figure 3.5).

Understanding Optimism
Chapter 3: Optimism and personality 109
Figure 3.5: Standardized estimations for the initial ASQ-FFM model.
Standardized estimates of the original model are shown in Figure 3.5. Chi-
square for the initial model was significant (χ² (26) = 88.75, p < .001). For the initial
base model, other index values were obtained as: CFI = 0.950; TLI = 0.893; RMSEA
= 0.073; AIC = 168.754; BIC = 333.301. Although CFI or GFI values may be
considered acceptable, modifications were suggested and made to the original model
Neuroticism Extraversion Openness Agreeableness Conscientiousness
ASQ Positive ASQ Negative
Global
.56
Stable
.80
Internal
.70
Global
.61
Stable
.59
Internal
.33
.58 .45 .30
.04 .32
.05 -.15 .18 .12
.01 -.05
.17
-.09
-.40 .45 .23 .33
-.21 .27 .35
-.16 .42
-.52

Understanding Optimism
Chapter 3: Optimism and personality 110
to obtain a better fit according to the results. These modifications include four
relationships between the residual variances of measured variables, for instance a
relationship between the residual variance of Neuroticism and ASQ Internal Positive.
The new paths all had loadings of .23 or below, suggesting the deviation from the
theoretical model is minor (see Figure 2.4). These modifications significantly
improved model fit, and the resultant model fit reasonably well (χ² (22) = 37.17, p
=.023; CFI = 0.988; TLI = 0.969; RMSEA = 0.039; AIC = 125.168; BIC = 306.170).
Figure 3.6: Standardized estimations for the modified ASQ-FFM model.
Neuroticism Extraversion Openness Agreeableness Conscientiousness
ASQ Positive ASQ Negative
Global
.62
Stable
.81
Internal
.73
Global
.68
Stable
.62
Internal
.33
.64 .60 .18
.11 .31
.06 -.12 .17 .11 .01
-.06
.22
-.05
-.41 .45 .23 .33
-.21 .27 .35
-.17 .42
-.51
.31
-.13
.23
.19

Understanding Optimism
Chapter 3: Optimism and personality 111
As shown in Figure 3.6, modelling analysis supports the initial model
proposed in Figure 3.2. In this model, Neuroticism predicts ASQ Negative
(standardized coefficient = .31). Conscientiousness predicts ASQ Positive with
coefficients of .22. As predicted, Internal Positive and Internal Negative are
positively correlated (r = .31), Stable Positive is positively correlated with Stable
Negative (r = .60). Similarly, Global Positive is positively correlated with Global
Negative (r = .64). All FFM dimensions are correlated with each other, with
Neuroticism negatively correlated with the four other FFM factors.
Multi-group SEM for testing gender differences of the model ASQ and FFM
Similarly, multi-group SEM was conducted to test gender differences of the model
for ASQ and FFM. See details in Chapter 3.3. This model was first tested in the male
group. Fit measures for this model indicated acceptable fit between model and data
(χ2 (22) = 29.71, p < 0.5; CFI = 0.98, TLI = 0.96, RMSEA = .052). Then, this model
was tested in the female group. For female, this model showed a good fit between
model and data (χ2 (22) = 29.18, p < 0.5; CFI = 0.99, TLI = 0.98, RMSEA = .032).
Finally, multi-group SEM was conducted to test gender differences of this
model. In addition to unconstrained base model, Measurement weights, Structural
covariances, and Measurement residuals were used as constrained conditions in multi
group analysis. The fit statistics for baseline comparisons of all models tested are laid
out in Table 3.12. It indicated that the unconstrained model fits best for the data.
Three constrained models have similar fits as the unconstrained model. Thus, this
model is compatible in both male and female in this sample.

Understanding Optimism
Chapter 3: Optimism and personality 112
Model NFI
Delta1
RFI
rho1
IFI
Delta2
TLI
rho2 CFI △CFI
Unconstrained .958 .895 .989 .971 .988
Measurement weights .941 .864 .974 .938 .973 -.015
Structural residuals .906 .862 .957 .935 .956 -.032
Measurement residuals .884 .855 .943 .927 .942 -.046
Table 3.12: Baseline comparisons for tested models between ASQ and FFM.
3.4 Optimism and the Five-Factor Model of personality
The link between attributional style, dispositional optimism, and traditional
personality traits has great value in understanding both optimism constructs in a
broader area. Taking optimism as personality trait is also supported by its
considerable stability manifested in some genetic research mentioned earlier in
Chapter 1.
In the present study, examining correlations among dispositional optimism,
explanatory style, and the FFM factors provides some evidence of the related but
distinct relationship between these two optimism structures. Generally, both LOT-R
Optimism and ASQ Total have significantly negative correlations with Neuroticism,
and significantly positive correlations with Extraversion, which is consistent with
prior studies (e.g. Poropat, 2002; Sharpe et al., 2011). Specifically, both LOT-R
Optimism and attributional style for positive events had strong associations with four
of the five FFM factors, with the exception of Neuroticism, which is only
significantly correlated with LOT-R Optimism. On the other hand, three of the Big
Five factors, Neuroticism, Extraversion, and Conscientiousness showed strong
correlations with both LOT-R Pessimism and attributional style for negative events,
though Openness is only significantly correlated with LOT-R Pessimism and not

Understanding Optimism
Chapter 3: Optimism and personality 113
with ASQ Negative. The hypothesized correlation between LOT-R Pessimism and
Agreeableness was not significant. Similarly, the negative correlation between ASQ
Positive and Neuroticism was not found. As we predicted, ASQ Total was negatively
related to Neuroticism, and positively correlated with Extraversion, Agreeableness,
and Conscientiousness. The positive correlation between ASQ Total and Openness is
significant, though it has not been reported before.
In the comparison between correlations with specific facets of each Big Five
personality factor, dispositional optimism and explanatory style demonstrated mixed
patterns. For example, while LOT-R Optimism, LOT-R Pessimism, and ASQ
Negative are all strongly associated with depression, the correlation between
attributional style for positive events and depression didn’t reach statistical
significance. All these correlational patterns imply that explanatory style and
dispositional optimism are distinct but related constructs.
Do men and women have different patterns concerning the relationship between
optimism and FFM?
Gender differences in correlations between explanatory style and FFM have been the
focus of some prior studies. One such study conducted by Bunce and Peterson (1997)
reported that men and women were different in their attributional styles for negative
events and several personality traits, such as socialisation and good impression,
which were measured by the California Psychological Inventory (CPI). Also, Poropat
(2002) reported that the correlational patterns of attributional styles and FFM
dimensions appeared to have gender differences. However, correlational analyses
investigating potential gender differences in the relationship between dispositional
optimism and the Big Five personality factors have not been published previously as
to my knowledge. In my study, both the LOT-R and the ASQ scales were involved in
examining their associations with FFM dimensions for potential gender differences.
The correlational patterns observed in the current study were not quite
consistent with results in the study of Poropat (2002). Poropat reported that
Conscientiousness is correlated with ASQ Positive for women only and is correlated
with ASQ Negative for men only. However, results in the present study showed that

Understanding Optimism
Chapter 3: Optimism and personality 114
Agreeableness is the critical factor in differentiating men and women. Agreeableness
is correlated with ASQ Positive for men but not women, while it is correlated with
ASQ Negative for women but not men.
Considering the current study has been conducted in a Chinese sample while
Poropat (2002) collected data from a group of Austrian undergraduates, and no cross-
culture study regarding gender differences of the attributional style-FFM relationship
has been reported in prior literature, these different findings may due to cultural
influence. As regards potential gender influences on the relationship between LOT-R
scales and the main NEO-PI-R dimensions, results showed that Agreeableness is
correlated with LOT-R Pessimism for men but not for women. Openness is
correlated with both LOT-R Optimism and LOT-R Pessimism for women but not for
men.
Teasing apart dispositional optimism and dispositional pessimism by linking
them to the FFM
It has been proposed that dispositional optimism and dispositional pessimism have
distinct associations with the Big Five Personality factors, in which Neuroticism and
Extraversion play a larger role than the other three FFM factors (Marshall et al.,
1992). In Marshall et al.’s widely cited study, results indicated that dispositional
optimism correlated more strongly with Extraversion than did dispositional
pessimism, and dispositional pessimism showed a stronger correlation with
Neuroticism than did dispositional optimism, and thus also supported a two-factor
model of the LOT (Marshall et al., 1992).
Since then, this two-factor model has been demonstrated in many studies (Chang
et al., 1997; L. Chang & McBrideChang, 1996; Creed et al., 2002; Roysamb &
Strype, 2002). Based on previous research and the modelling analysis in Chapter 2.2,
an initial base model, which incorporates two differentiable factors (LOT-R
Optimism and LOT-R Pessimism) through their links to the FFM, was proposed. The
hypothesized model of the relationship between dispositional optimism and the FFM
is partially supported. Extraversion predicts both LOT-R Optimism and LOT-R
Pessimism, but Neuroticism influences only LOT-R Optimism. These results are in

Understanding Optimism
Chapter 3: Optimism and personality 115
agreement with previous findings that Extraversion and Neuroticism are the two
most influential predictors of optimism. The result that Neuroticism is not a predictor
of pessimism in this model is quite unusual considering the strong relationship
between these two variables in most previous studies.
Based on these findings, dispositional optimism may be best viewed as reflecting
two distinct traits, namely Dispositional Optimism and Dispositional Pessimism,
which are reflected in LOT-R Optimism items and LOT-R Pessimism items
respectively. Scoring and interpretation of the LOT-R should reflect this. Responses
should be scored separately for Dispositional Optimism and Dispositional Pessimism.
For most individuals, it is possible to identify them as being optimistic in an absolute
sense, because they agree with optimistic items (e.g. ‘I’m always optimistic about my
future’) and disagree with pessimistic items (e.g. ‘I rarely count on good things
happening to me’). Similarly, pessimists are people who agree with pessimistic items
and disagree with optimistic items.
Are attributions for positive and negative events predicted differently by the
FFM?
Though both explanatory style and the FFM have been taken as important
personality traits, very few studies have explored the relationship between these two
constructs and even fewer such studies have adopted the NEO-PI-R as a FFM
measure and used a SEM approach. In those rare studies, attributions for negative
events has been found to be negatively correlated with Conscientiousness
(Musgrave-Marquart et al., 1997). Correlational analyses between ASQ and FFM
dimensions support this finding. Moreover, we found that attributional style for
negative and positive events had different correlational patterns with the FFM. While
ASQ Negative is positively correlated with Neuroticism, and is negatively correlated
with Extraversion and Conscientiousness, ASQ Positive is positively related to four
of the five NEO-PI-R dimensions, excepting Neuroticism.
The hypothesized model of the relationship between attributional style and
the FFM was partially supported. As expected, Neuroticism predicts ASQ Negative.

Understanding Optimism
Chapter 3: Optimism and personality 116
A new relationship between Conscientiousness and ASQ Positive, which initially
wasn’t raised, emerged in this model. Previously, ASQ Negative has been reported to
be negatively correlated with Conscientiousness (Musgrave-Marquart et al., 1997;
Poropat, 2002). Though attributions for positive and negative events may reflect
differentiated cognitive styles, these results suggest that Conscientiousness may be
considered as one important FFM predictor of attributional style.
In the examination of the psychometric structure of the ASQ in Chapter 1,
results suggested that subjects apply consistent cognitive styles independent of event
valence, with personal tendencies to explain events as, for instance, global or local:
Subjects rating positive events as global tended also to describe negative events in
terms of global attributions, and likewise for the other two styles. These coherent
tendencies in cognitive styles are supported in the model, which links the ASQ and
FFM. Internal Positive and Internal Negative are positively correlated, so are the
other two cognitive style factors (Stability and Globality).

Understanding Optimism
Chapter 4: Optimism and psychological well-being 117
Chapter 4: Optimism and psychological well-
being
4.1 Optimism and two approaches of well-being
Dispositional optimism and optimistic explanatory style have been taken as
theoretically connected. For instance, Scheier and Carver (1992) found that
differences in people’s expectations result in optimistic versus pessimistic
consequences. Also, Peterson and Seligman (1984) claimed that people’s attributions
for past events influence what they expect for the future. If individuals attribute past
failures to causes that are internal, lower self-esteem tends to be displayed and passive
expectation will be produced. If the explanation for a negative event is explained by
stable factors, individuals will expect more failures in the future, because the cause is
likely to remain for a long period. Similarly, if the cause of a negative event is
attributed to factors that are global, the expectations tend to be that these causes will
not be controllable even in different situations.
Empirical studies provide evidence for the link between explanatory style and
dispositional optimism. For example, one study revealed that individuals with positive
expectations for success also tend to have favourable attributions for their
performance (M. Marshall & Brown, 2006). Additionally, dispositional optimism and
explanatory style have also long been connected to each other because both variables
have been found to be closely correlated with depression, well-being, and other
related psychological constructs (Carver et al., 2010; Forgeard & Seligman, 2012;
Yuan & Zhang, 2007).
As optimism has been mainly conceptualized and measured in two constructs
of dispositional optimism and optimistic explanatory style, well-being has been

Understanding Optimism
Chapter 4: Optimism and psychological well-being 118
measured largely in two distinct traditions, of hedonic and eudemonic well-being.
While hedonic or subjective well-being relates mainly to happiness, the eudemonic
tradition focuses on psychological well-being, which is most widely implemented
using the Ryff scales of psychological well-being (RSPW; Ryff, 1989; Ryff & Keyes,
1995).
In the field of positive psychology, the study of psychological well-being,
which was developed by Ryff (1989), is very important, because this eudemonic
approach of well-being stems from personal development, the effort and desire to
achieve goals of life, and coping styles for life challenges. Six dimensions have been
identified in Ryff’s psychological well-being model, namely: self-acceptance or
positive attitudes toward oneself, personal growth or development, purpose in life,
control or mastery of the environment, positive relationships with others, and
autonomy or ability to be independent. These six dimensions present a set of
assessments related to positive performance, representing a general feeling of
happiness that are distinct from subjective well-being (Ryff & Singer, 2006). As one
of the most important predictors of well-being, optimism has been included in
numerous studies that examined well-being, though they mainly focused on subjective
well-being before the implementation of Ryff’s psychological well-being.
Dispositional optimism has been found to be positively related to
psychological well-being. For example, using an SEM approach, Augusto-Landa et al.
(2011) reported in a sample of 217 undergraduates that dispositional optimism
showed significant positive associations with all six psychological well-being
dimensions (r ranged from .38 to .59). Similarly, in a study conducted within a group
of 225 older adults, Ferguson and Goodwin (2010) found that dispositional optimism
was positively correlated with Purpose in Life (one of the six psychological well-
being dimensions; r = .46). The positive correlation between dispositional optimism

Understanding Optimism
Chapter 4: Optimism and psychological well-being 119
and psychological well-being has also been reported in an adolescent sample
(Monzani et al., 2014), with LOT-R scores positively correlated with all six
dimensions of the RSPW (r ranged from .32 to .56).
However, the relationship between explanatory style and psychological well-
being, which is measured by the RSPW, has not been reported to my knowledge.
Additionally, though there is much research suggesting that optimism is positively
associated with high levels of well-being (Scheier & Carver, 1992; Scheier. et al.,
2001), little has been done to explore the potential model of the two approaches of
optimism and psychological well-being in one single study. Because expectations are
regarded as a sufficient condition for maladaptive passivity following adversities
(Abramson et al., 1978), it is rational to infer that expectations may mediate the
relationship between explanatory style and well-being. Accordingly, it is reasonable
to construct a model in which explanatory style influences psychological well-being
through dispositional optimism.
Though explanatory style has not been linked to psychological well-being
previously, the mediating role of explanatory style between dispositional optimism
and subjective well-being has been examined in several previous studies. For example,
Isaacowitz (2005) reported that negative affiliated explanatory style and dispositional
optimism and pessimism predict subjective well-being (life satisfaction) measures
across three different age groups (280 young, middle-aged, and older adults). In one
study with a Chinese undergraduate sample (N = 350), Yuan and Zhang (2007)
reported that ASQ Total was negatively correlated with dispositional optimism (r = -
.30) and Satisfaction with Life (r = -.21) and positively correlated with depression (r
= .26). Dispositional optimism was revealed to be a mediating variable that mediates
the relationship between explanatory style and subjective well-being (depression and
Satisfaction with Life).

Understanding Optimism
Chapter 4: Optimism and psychological well-being 120
Currently, few investigations, however, have tested both dispositional
optimism and explanatory style together in the research of psychological well-being,
or examined the potential mediating role of expectations on the relationship between
attributional style and psychological well-being. There is no published research on the
relationship between attributions, expectations, and psychological well-being to my
knowledge.
In summary, previous investigations of optimism and well-being have shared
two primary limitations: first, they have exclusively assessed only one construct of
optimism (e.g. Augusto-Landa et al., 2011) or merely one approach of well-being (e.g.
Ahrens & Haaga, 1993). Second, even in studies where the two fundamental
constructs of optimism have both been assessed, research has not yet explored the
potential mediating model linking all these constructs. Therefore, my study aimed to
extend the positive psychology literature by examining the relationships among
dispositional optimism, explanatory style, and psychological well-being in a non-
Western sample. A further aim was to examine dispositional optimism as potential
mediator of the beneficial effects of optimistic explanatory style on psychological
well-being.
As an exploratory step, I first tested a model in which dispositional optimism
and dispositional pessimism were hypothesized to predict RSPW dimensions (see
Figure 4.1). In this model, LOT-R Optimism and LOT-R Pessimism are two
differentiated but negatively correlated factors. RSPW dimensions (correlated with
each other) will be predicted by LOT-R Optimism and LOT-R Pessimism. We next
tested a model constructing the predictive role of explanatory style on RSPW
dimensions (see Figure 4.2). In this model, ASQ Positive and ASQ Negative are
hypothesized to influence and predict RSPW dimensions (correlated with each other).

Understanding Optimism
Chapter 4: Optimism and psychological well-being 121
Figure 4.7: Proposal for an initial model with hypothesized relationship between
dispositional optimism and psychological well-being.
Figure 4.2: Proposal for an initial model with hypothesized relationship between
explanatory style and psychological well-being.
LOT-R Optimism
LOT-R Pessimism
LOT-R 10
LOT-R 4
LOT-R 1
Personal Growth
Positive Relations with Others
Purpose in Life
Self-Acceptance
Environmental Mastery
Autonomy
LOT-R 3
LOT-R 7
LOT-R 9
ASQ Positive
ASQ Negative
Global
Stable
Internal
Personal Growth
Positive Relations with Others
Purpose in Life
Self-Acceptance
Environmental Mastery
Autonomy
Internal
Stable
Global

Understanding Optimism
Chapter 4: Optimism and psychological well-being 122
If the first two models are supported by the data, we will then examine a
model in which dispositional optimism acts as a potential mediator of the beneficial
effects of optimistic explanatory style on psychological well-being. This proposed
model, with LOT-R Optimism and LOT-R Pessimism partially mediating the effects
of ASQ Positive and ASQ Negative on psychological well-being, is shown in Figure
4.3.
Figure 4.3: Proposal for an initial model with hypothesized mediating role of
dispositional optimism between the relationship of explanatory style and
psychological well-being.
Since SEM analysis to examine the possible associations among explanatory
style, dispositional optimism, and psychological well-being has not been published
previously, alternative models of the relationships among these three variables will
also be explored. Specifically, the possibility that higher psychological well-being
may lead to more positive expectations as suggested by Ferguson and Goodwin (2010)
will be explored.
PWB
Autonomy
Environmental Mastery
Personal Growth
Positive Relations with Others Purpose in Life
Self-Acceptance
Optimism
Pessimism
ASQ Positive
ASQ Negative

Understanding Optimism
Chapter 4: Optimism and psychological well-being 123
Correlational analyses will also be conducted. It is hypothesized that LOT-R
Optimism and ASQ Positive will be positively related to all RSPW dimensions, and
LOT-R Pessimism and ASQ Negative are expected to be negatively associated with
dimensions of psychological well-being.
4.2 Samples and instruments
Sample
Sample 1 was involved in the analysis of this study (for detail of this sample, see 1.5.4
of Chapter 1).
Instruments
Attributional style was assessed using the Chinese ASQ (Zhang, 2006). Composite
attributional styles were calculated separately for positive and negative events.
Reliabilities (Cronbach’s α) were acceptable 0.84 for the total and, for positive events
0.84; for negative events .77; for internality, .65; for stability, .76; and .80 for
globality.
Dispositional optimism was measured using a Chinese version of the Life
Orientation Test-Revised (Lai & Yue, 2000). Cronbach’sαfor the scale was 0.75; for
optimism, .79; and, for pessimism, .75.
Psychological well-being was measured with a Chinese version of the Ryff
Scales of Psychological Well-being (Chen, 2010). In the present sample, Cronbach’s
αcoefficients for the psychological well-being total was 0.92 (for self-acceptance, α
=.74; for positive relationships with other, α=.77; for personal growth, α=.78; for
purpose in life, α=.83; for environmental mastery, α=.81; for autonomy, α=.75).

Understanding Optimism
Chapter 4: Optimism and psychological well-being 124
Analysis strategy
Descriptive statistics and correlational analyses were first calculated. Structural
equation modelling (SEM) was then used to test a series of potential mediating
models constructing the relationships among explanatory style, dispositional
optimism, and psychological well-being using Amos 17.0 (Arbuckle, 2008). All
analyses took advantage of raw data supporting estimation of models using full
information maximum likelihood estimation.
The adequacy of model fit was assessed using the comparative fit index (CFI),
Tucker-Lewis index (TLI) and the Root Mean Square Error of Approximation
(RMSEA). For CFI and TLI, values > 0.95 were taken as indicating acceptable fit (Hu
& Bentler, 1999). For the RMSEA, values of < .05 indicated acceptable fit (C. Y. Yu,
2002). Akaike Information Criterion (AIC) and Bayesian Information Criterion (BIC)
are reported to aid model comparison.
Criterion for mediating model
Four conditions must be met to establish an acceptable mediating model (Baron &
Kenny, 1986). First, the predictor variable (explanatory style) is related to the
outcome variable (psychological well-being). Second, the predictor variable
(explanatory style) is related to the potential mediator (dispositional optimism). Third,
the mediating factor (dispositional optimism) is related to the outcome variable
(psychological well-being). Finally, the relation between the predictor variable
(explanatory style) and the outcome variable (psychological well-being) significantly
decreases once the mediator (dispositional optimism) is included in the model.

Understanding Optimism
Chapter 4: Optimism and psychological well-being 125
4.3 Results
Descriptive statistics
Table 3.1 shows the means, standard deviations, and Cronbach’s alpha of the total
samples. Reliabilities were acceptable.
Measures Means SD Cronbach’s Alpha
LOT-R Optimism 8.27 1.84 0.79
LOT-R Pessimism 3.85 1.99 0.75
LOT-R Total 16.42 3.01 0.75
ASQ Negative 12.90 1.78 0.84
ASQ Positive 15.28 1.91 0.77
ASQ Total 2.38 2.17 0.84
RSPWS1 33.05 5.46 0.75
RSPWS2 37.65 5.60 0.81
RSPWS3 41.77 5.31 0.78
RSPWS4 40.06 6.45 0.77
RSPWS5 38.45 6.36 0.83
RSPWS6 34.70 5.80 0.74
RSPW Total 225.68 25.82 0.92
Table 3.1: Means, standard deviations and Cronbach’s alpha for all measures.
Note: Means for LOT-R dimensions are on a scale ranging from 1 to 5, ASQ
dimensions range from 1 to 7, and RSPW dimensions from 1 to 6, with higher
numbers indicating greater amounts of these qualities. RSPWS1, autonomy; RSPWS2,
environmental mastery; RSPWS3, personal growth; RSPWS4, personal relations with
others; RSPWS5, purpose in life; RSPWS6, self-acceptance (n = 452).

Understanding Optimism
Chapter 4: Optimism and psychological well-being 126
Correlational analyses
The first hypothesis tested was that explanatory style, dispositional optimism, and
psychological well-being would correlate positively and significantly with each other.
Table 3.2 shows the inter-correlations among the variables of interest.
As shown in Table 3.2, dispositional optimism was positively correlated with
explanatory style for positive events and all RSPW dimensions; dispositional
pessimism was negatively correlated with explanatory style for positive events and all
RSPW dimensions; dispositional optimism was negatively correlated with
explanatory style for negative events; and dispositional pessimism was positively
correlated with explanatory style for negative events. Explanatory style for positive
events was positively associated with all RSPW dimensions, while explanatory style
for negative events was negatively associated with all RSPW dimensions. Finally, all
RSPW dimensions were positively and significantly related to each other.
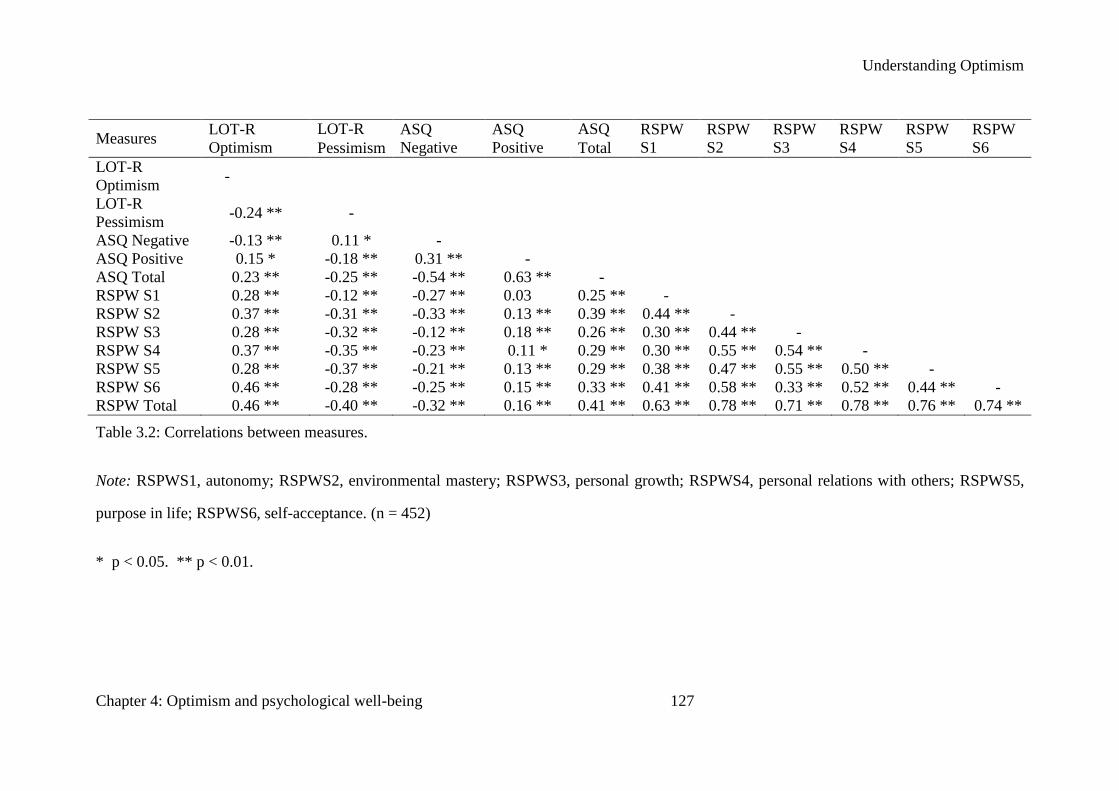
Understanding Optimism
Chapter 4: Optimism and psychological well-being 127
Measures LOT-R
Optimism
LOT-R ASQ
Negative
ASQ
Positive
ASQ RSPW
S1
RSPW
S2
RSPW
S3
RSPW
S4
RSPW
S5
RSPW
S6 Pessimism Total
LOT-R
Optimism -
LOT-R
Pessimism -0.24 ** -
ASQ Negative -0.13 ** 0.11 * -
ASQ Positive 0.15 * -0.18 ** 0.31 ** -
ASQ Total 0.23 ** -0.25 ** -0.54 ** 0.63 ** -
RSPW S1 0.28 ** -0.12 ** -0.27 ** 0.03 0.25 ** -
RSPW S2 0.37 ** -0.31 ** -0.33 ** 0.13 ** 0.39 ** 0.44 ** -
RSPW S3 0.28 ** -0.32 ** -0.12 ** 0.18 ** 0.26 ** 0.30 ** 0.44 ** -
RSPW S4 0.37 ** -0.35 ** -0.23 ** 0.11 * 0.29 ** 0.30 ** 0.55 ** 0.54 ** -
RSPW S5 0.28 ** -0.37 ** -0.21 ** 0.13 ** 0.29 ** 0.38 ** 0.47 ** 0.55 ** 0.50 ** -
RSPW S6 0.46 ** -0.28 ** -0.25 ** 0.15 ** 0.33 ** 0.41 ** 0.58 ** 0.33 ** 0.52 ** 0.44 ** -
RSPW Total 0.46 ** -0.40 ** -0.32 ** 0.16 ** 0.41 ** 0.63 ** 0.78 ** 0.71 ** 0.78 ** 0.76 ** 0.74 **
Table 3.2: Correlations between measures.
Note: RSPWS1, autonomy; RSPWS2, environmental mastery; RSPWS3, personal growth; RSPWS4, personal relations with others; RSPWS5,
purpose in life; RSPWS6, self-acceptance. (n = 452)
* p < 0.05. ** p < 0.01.

Understanding Optimism
Chapter 4: Optimism and psychological well-being 128
Structural Equation Modelling
First, the proposed model in which dispositional optimism predicts RSPW factors (as
shown in Figure 4.1) was tested.
Figure 4.4: Standardized estimations for the initial model of dispositional optimism
and psychological well-being.
For the initial base model, the fit was adequate (χ² (33) = 95.48 p < .001; CFI
= 0.961; TLI = 0.919; RMSEA = 0.063; AIC = 181.406; BIC = 370.635).
Standardized estimates of the original model are shown in Figure 4.4. Modifications
were suggested that significantly improved model fit, and the resultant model fit
reasonably well by all criteria (χ² (28) = 44.80, p = .023; CFI = 0.988; TLI = 0.973;
RMSEA = 0.036; AIC = 144.802; BIC = 350.486), as shown in Figure 4.5. The new
LOT-R Optimism
LOT-R Pessimism
LOT-R 10
.47 LOT-R 4
.71
LOT-R 1 .20
LOT-R 9 .76
LOT-R 7 .67
LOT-R 3
.28
Personal Growth
Positive Relations with Others
Purpose in Life
Self-Acceptance
Environmental Mastery
Autonomy
.51
.50
.27
.43 .29 .69
-.08
-.33
-.27 -.28
-.16 .05
.25
.27
.39
.30
.22
.17
.08
.27
.10
.34
.28
.31 .42
.09
.23
-.32

Understanding Optimism
Chapter 4: Optimism and psychological well-being 129
paths all had loadings of .24 or below, suggesting deviation from the theoretical
model is minor (see Figure 2.4).
As shown in the figure, most direct paths in this model are significant except
the path between LOT-R Pessimism and Autonomy, between LOT-R Pessimism and
Environmental Mastery, and between LOT-R Pessimism and Self-Acceptance. As
predicted, LOT-R Optimism and LOT-R Pessimism are negatively correlated (r = -
.29). Six RSPW dimensions are predicted by LOT-R Optimism and three RSPW
dimensions are predicted by LOT-R Pessimism.
Figure 4.5: Standardized estimations for the modified model of dispositional
optimism and psychological well-being.
LOT-R Optimism
LOT-R Pessimism
LOT-R 10 .48
LOT-R 4 .70
LOT-R 1 .19
LOT-R 9 .75
LOT-R 7 .67
LOT-R 3
.30
Personal Growth
Positive Relations with Others
Purpose in Life
Self-Acceptance
Environmental Mastery
Autonomy
d4
.56
.52
.23 .45
.31 .70
-.11 -.33
-.28 -.29
-.18 .03
.21
.29
.41
.29
.19
.18
.03
.24
.02
.32
.27
.28 .43
.12
.20
-.29 -.24
-.24
-.16
.16

Understanding Optimism
Chapter 4: Optimism and psychological well-being 130
I next tested the proposed model in which explanatory style predicts
psychological well-being factors (as shown in Figure 4.2). For the initial base model,
the fit was adequate (χ² (30) = 82.44 p < .001; CFI = 0.970; TLI = 0.934; RMSEA =
0.062; AIC = 178.439; BIC = 375.896). Standardized estimates of the original model
are shown in Figure 4.6.
Figure 4.6: Standardized estimations for the initial model of explanatory style and
psychological well-being.
Although CFI or GFI values may be considered adequate, modifications were
suggested and made to the original model to obtain a better fit according to the results.
These modifications include five relationships between the residual variances of
measured variables, for instance a relationship between the residual variance of
Autonomy and ASQ Positive Global. The new paths all had loadings of .23 or below,
suggesting deviation from the theoretical model is minor (see Figure 2.4). These
modifications significantly improved model fit, and the resultant model fit reasonably
well (χ² (25) = 41.31, p =.021; CFI = 0.991; TLI = 0.975; RMSEA = 0.038; AIC =
147.310; BIC = 365.336).
ASQ Positive
ASQ Negative
Global .57
Stable .83
Internal .69
.67
.55 .35
Personal Growth
Positive Relations with Others
Purpose in Life
Self-Acceptance
Environmental Mastery
Autonomy .09
.21
.25 .18
.19 .22
-.36
-.28 -.31 -.22
-.47 -.34
.34
.36
.49
.43
.35
.24
.21
.31
.32
.47
.38 .48
.50
.24 .45
.28
.42
.61 Internal
Stable
Global

Understanding Optimism
Chapter 4: Optimism and psychological well-being 131
In this model, as predicted, three cognitive style factors (internality, stability,
and globality) are correlated with event valences. ASQ Positive and ASQ Negative
predict RSPW dimensions (except ASQ Positive and Autonomy).
Figure 4.7: Standardized estimations for the modified model of explanatory style and
psychological well-being.
Finally, I tested the preferred model, in which dispositional optimism acts as a
potential mediator of the beneficial effects of optimistic explanatory style on
psychological well-being (as shown in Figure 4.3). For the initial base model, CFI or
GFI values may be considered acceptable (χ² (29) = 132.558, p < .001; CFI = 0.920;
TLI = 0.875; RMSEA = 0.089; AIC = 184.558; BIC = 291.514). Standardized
ASQ Positive
ASQ Negative
Global .57
Stable .81
Internal .72
.77
.53
.31
Personal Growth
Positive Relations with Others
Purpose in Life
Self-Acceptance
Environmental Mastery
Autonomy
.09
.22
.25 .20
.21 .23
-.34 -.26 -.29
-.23 -.43
-.34
.34
.35
.49
.44
.36
.23
.20
.31
.32
.47
.38
.49 .50
.23
.45
.39
.48
.45
-.05
.09
.12
.23 .23
Internal
Stable
Global
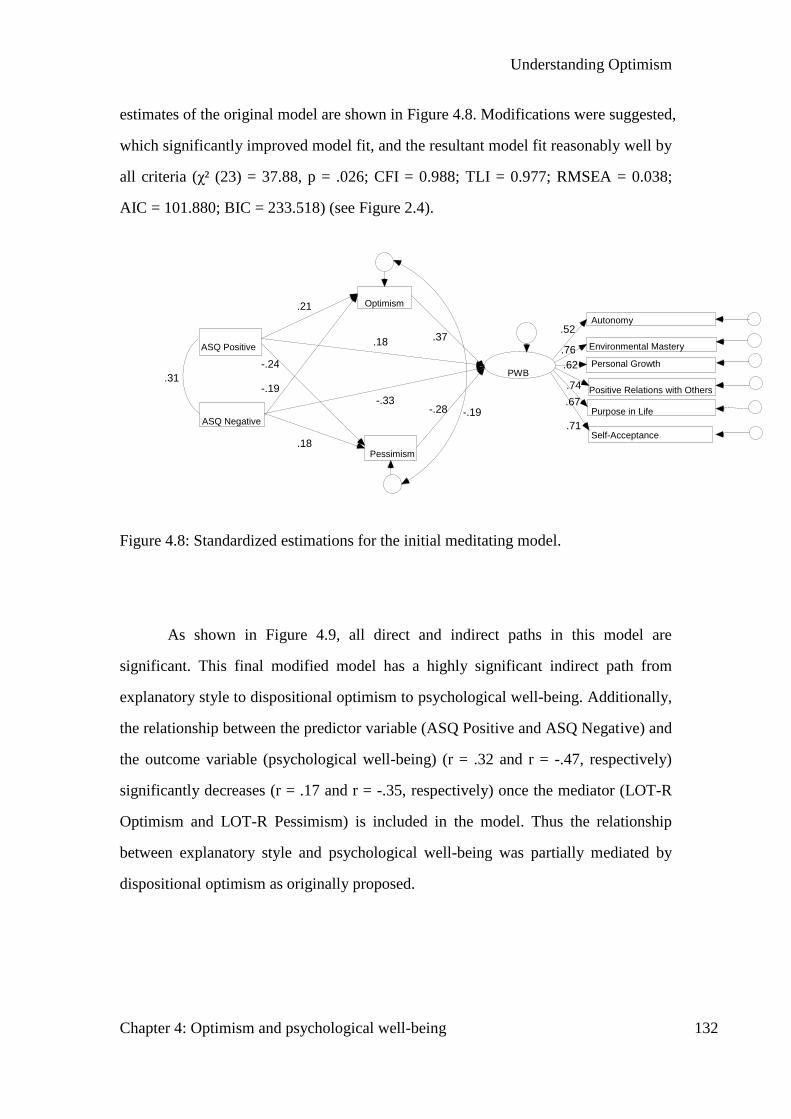
Understanding Optimism
Chapter 4: Optimism and psychological well-being 132
estimates of the original model are shown in Figure 4.8. Modifications were suggested,
which significantly improved model fit, and the resultant model fit reasonably well by
all criteria (χ² (23) = 37.88, p = .026; CFI = 0.988; TLI = 0.977; RMSEA = 0.038;
AIC = 101.880; BIC = 233.518) (see Figure 2.4).
Figure 4.8: Standardized estimations for the initial meditating model.
As shown in Figure 4.9, all direct and indirect paths in this model are
significant. This final modified model has a highly significant indirect path from
explanatory style to dispositional optimism to psychological well-being. Additionally,
the relationship between the predictor variable (ASQ Positive and ASQ Negative) and
the outcome variable (psychological well-being) (r = .32 and r = -.47, respectively)
significantly decreases (r = .17 and r = -.35, respectively) once the mediator (LOT-R
Optimism and LOT-R Pessimism) is included in the model. Thus the relationship
between explanatory style and psychological well-being was partially mediated by
dispositional optimism as originally proposed.
PWB
Autonomy
Environmental Mastery Personal Growth
Positive Relations with Others
Purpose in Life
Self-Acceptance
Optimism
Pessimism
ASQ Positive
ASQ Negative
.21
.18
.18
-.33 -.19
-.24
-.28
.37
-.19
.52
.76 .62
.74 .67
.71
.31

Understanding Optimism
Chapter 4: Optimism and psychological well-being 133
Figure 4.9: Standardized estimations for the modified meditating model.
4.4 Positive relationship between optimism and
psychological well-being
My study provided empirical evidence of the correlational patterns between
explanatory style, dispositional optimism, and psychological well-being in a non-
Western sample. Both dispositional optimism and explanatory style are strong
predictors of psychological well-being. The relationship between explanatory style
and psychological well-being, however, is predominantly mediated by dispositional
optimism and dispositional pessimism. The results were consistent with findings of
previous research in Western samples. That is, explanatory style and dispositional
optimism were weakly correlated (Forgeard & Seligman, 2012), but both of these two
PWB
Autonomy
Environmental Mastery
Personal Growth
Positive Relations with Others
Purpose in Life
Self-Acceptance
Optimism
Pessimism
ASQ Positive
ASQ Negative
.20
.19
.17
-.35 -.19
-.23
-.30
.33
-.20
.61
.77 .58
.73 .65
.67
.17
.21
.31
-.18
-.13
.20
.27

Understanding Optimism
Chapter 4: Optimism and psychological well-being 134
constructs of optimism were moderately correlated with well-being (Carver et al.,
2010).
Positive relationships were found between LOT-R Optimism and
psychological well-being dimensions. More optimistic individuals reported a higher
level of PWB, which is consistent with studies conducted in Western participants.
That is, individuals who have positive expectation for the future are more likely to
report high levels of psychological well-being. There is evidence that optimists can
cope more adaptively with stress and, therefore, gain psychological benefits (Scheier
& Carver, 1992). Similar results have been found in other studies (Carver et al., 2010).
Inversely, negative correlations were found between LOT-R Pessimism and
dimensions of psychological well-being. These findings correspond with results
reported by Chang et al. (1997) and Mäkikangas and Kinnunen (2003).
Consistent with previous studies that individuals who have an optimistic
explanatory style are more likely to report higher levels of psychological well-being
than people with a pessimistic attributional style (Wise & Rosqvist, 2006), the current
results revealed that scores on attributions for positive events were positively
correlated with levels of all six dimensions of psychological well-being. Optimists are
believed to face adversity and deal with negative situations more effectively than
pessimists and, therefore, gain more psychological benefits. Optimistic explanatory
style may serve as a protective factor for well-being. Additionally, dispositional
optimism was positively correlated with explanatory style, which is consistent with
some previous studies exploring the relationship between these two constructs.
The most important goal of the current study was to address whether
dispositional optimism mediated the link between explanatory style and psychological
well-being. The proposed mediating model was tested and supported. It indicated that
an optimistic explanatory style was a strong predictor of psychological well-being, as

Understanding Optimism
Chapter 4: Optimism and psychological well-being 135
measured by the RSPW. However, the effect of explanatory style on psychological
well-being was mediated by dispositional optimism as shown in the mediating model.
Thus, this study provides conditional evidence for the mediating role of dispositional
optimism in the relationship between attributional style and psychological well-being.
Myers and Diener (1995) suggested that the causal direction from traits to
subjective well-being may be reversed. It might be similar for psychological well-
being. Given the cross-sectional nature of these findings, the causal directions
depicted in these models may be the reverse of what was predicted. Higher levels of
psychological well-being, such as positive relations with others, may contribute to
positive expectations. However, no empirical evidence with longitudinal studies for
these reversed patterns has been carried out, as far as we know. Thus, despite a good
statistical model fit for some models with pathways from psychological well-being to
optimism (tested but not reported in Results), these models are less plausible than the
final resultant meditating model, due to lack of evidence.
Overall, this study provided consistent evidence of, and further support for, the
beneficial effects of both types of optimism on psychological well-being in a college
student sample. Both dispositional optimism and optimistic explanatory style are
strong predictors of psychological well-being. While both dispositional optimism and
explanatory style have a direct effect on psychological well-being, the effect of
explanatory style on psychological well-being was partially mediated by dispositional
optimism in the final model. It is valuable to note that an optimistic explanatory style
clearly contributes to enhancing individuals’ psychological well-being.

Understanding Optimism
Chapter 5: Cultural influence on optimism 136
Chapter 5: Cultural influence on optimism
5.1 Cultural issues: from the West to the East
Research shows that optimism as a whole has adaptive value in dealing with
environmental risks and life challenges over the million or so years of evolution
(Tiger, 1979). This adaptive advantage still works for people to achieve more in
current life (Carver et al., 2010; Seligman, 2011). The universality of being
optimistic (Michalos, 1988) and the prevalent positive associations among optimism,
subjective well-being, and perceived physical health (Gallagher, Lopez, & Pressman,
2013), have been known for a long time.
Though benefits of being optimismtic are widely acknowledged, a crucial but
often neglected concern in studying optimism is the examination of this important
psychological concept across different cultural and ethnic groups. Optimism-related
studies in recent years have been mainly conducted in Western cultures particularly,
so the results do not necessarily apply to behaviours in other cultures. Is there any
cultural difference concerning optimism-related properties? The answer may not be
as simple as it seems. To make it clear scientifically, empirical studies must be
carried out to examine whether cultural differences have considerable and
meaningful effects on optimism. The following study set out to address this question
and examine group differences on measures of dispositional optimism and
explanatory style between Eastern and Western cultures.
It is assumed that most Eastern societies, such as those in China and India,
miantain a collectivist or an interdependent self, whereas most Western societies,
such as the U.S. and Canada, foster an individualistic or an independent self (Markus
& Kitayama, 1991). These conceptions of self, in turn, may relate to an individual’s
explanation for events in their life and generalised different expectations for their
future. To be specific, one of the distinctions between Eastern and Western cultures
concerns the level of separation between the achivement domain and the
interpersonal domain in life events (Higgins & Bhatt, 2001). It has been assumed that
individuals from a collectivist culture may not differentiate these two domains as
sharply, due to a lack of separation of self from others (Higgins & Bhatt, 2001).

Understanding Optimism
Chapter 5: Cultural influence on optimism 137
To understand the influence of culture on optimism, it is critical to review
recent findings associated with the examination of optimism between these two
cultures.
5.2 Prior studies investigating cultural differences in optimism
Optimism studies conducted in both cultures
Within the broad and divergent culture frames of the East and West, differences in
both dispositonal optimism and attributional styles have been examined by
researchers from an cross-cultural perspective. J. G. Miller (1984) carried out one of
the earlier studies about cultural influences on explanatory style within a group of
Hindus and a group of Americans. He (or she) found that individuals in Western
cultures emphasised the role of internal factors in causal explanations of events,
whereas individuals in Eastern cultures tended to view the external factors as playing
a determining role in causing various life events.
Lee and Seligman (1997) also investigated cultural influences on causal
attributions. A sample of 257 white American undergraduates, a group of 312
mianland Chinese college students, and 44 Chinese-American students (32 subjects
were American-born Chinese, the others were non-American-born Chinese but had
stayed in the United States for 5.5 years on average) were recruited and completed
the ASQ. The authors found that the White Americans had a more optimistic
explantory style than Chinese-Americans, and Chinese-Americans were
characterized with a more positive attributional style than mainland Chinese. Using
the same scale, Higgins and Bhatt (2001) conducted a cross-cultural study within
Indian (n = 195) and Canadian (n = 162) college students. They found that Indian
students generated more contextual attributions for life events than did the Canadian
students.
As discussed earlier in Chapter 1, attributional style has been examined along
still another line – attributional bias, which overlaps with both the definition and

Understanding Optimism
Chapter 5: Cultural influence on optimism 138
measurement of optimistic explanatory style. According to Higgins and Bhatt (2001,
p. 55), both Westerners and Easterners showed “a self-serving tendency to explain
negative events with external-uncontrollable causes and to explain positive events
with internal-controllable causes”. That is, both cultures showed an attributional bias,
generating more external, uncontrollable causes to explain negative events and more
internal, controllable causes to explain positive events.
This self-serving attributional bias, or an optimistic explanatory style, has
been previously studied with a cross-culture perspective, and cultural effects were
reported (e.g., Kashima & Triandis, 1986). For example, the study of Lee and
Seligman (1997) indicated that Mainland Chinese attributed their success to others or
circumstances and their failure to themselves more often than did White Americans.
This idea was supported in a meta-analysis of 266 studies, including subjects from
different cultural background. Mezulis et al. (2004) reported that Asian samples
generally displayed significantly smaller attributional bias than U.S. or Western
samples. That is, Westerners received higher scores on optimistic explanatory style
than Easterners.
These studies came to the conclusion that individuals from Eastern cultures,
or so-called collectivistic cultures, expressed less self-serving attributional bias than
individuals from the West, or individualistic cultures (e.g., Higgins & Bhatt, 2001).
This finding was consistent with traditional cultural differences that Westerners have
more self-serving bias than Easterners (Lee & Seligman, 1997). However, there are
discrepancies in the level of self-serving attributional bias even among countries with
similar cultural backgrounds. For example, while both Americans and Finnish people
showed a tendency to apply self-serving bias in attribution, American participants
expressed a greater bias than Finnish subjects (Nurmi, 1992).
Using the dispositional optimism framework, Chang and colleagues
investigated the potential mechanism underlying cultural influences on optimism and
pessimism for Westerners and Easterners (Chang, 1996; Chang, Sanna, & Yang,
2003). In one of their earlier studies (Chang, 1996), 111 Asian-American and an
equal number of White American students completed an adapted version of the

Understanding Optimism
Chapter 5: Cultural influence on optimism 139
original LOT. The authors found that Asian-Americans scored significantly higher
on pessimism than White-Americans, which was consistent with traditional images
of Western-Eastern cultural differences. The results were partly replicated in another
cross-cultural study by Sinha, Willson, and Watson (2000). College students from
India (n = 198) and Canada (n = 344) were assessed on their level of dispositional
optimism and several other psychological factors. The authors found that Indian
students were more pessimistic than their Canadian counterparts.
Abdel-Khalek and Lester (2006) compared levels of dispositional optimism
of Kuwaiti (n = 460) and American (n = 273) college students using an adapted
version of the original LOT. Consistent with findings of Chang et al. (2003), the
Easterners scored significantly higher on pessimism than their Western counterparts.
However, they also found that Kuwaiti students were less optimistic than American
students, which was not found in the study of Chang et al. (2003).
Cultural differences in optimism have been supported by some meta-analytic
studies as well. For example, Nes and Segerstrom (2006) investigated the potential
differences in optimism and coping between English-speaking and non-English-
speaking countries. Looking at 50 studies, they found that participants involved in
studies in the United States or in English-speaking countries showed stronger
correlations between dispositional optimism and coping strategies than did
participants from non-English-speaking nations.
Other studies have investigated age-related dipositional optimism across
different cultures. For example, in samples including Americans and Hong Kong
Mainland Chinese, You, Fung, and Isaacowitz (2009) reported that older Mainland
Chinese displayed a lower level of dispositional optimism than did younger
Mainland Chinese, whereas older Americans showed a higher level of dispositional
optimism than their younger counterparts.
To summarize the findings to date, from the perspective of dispositional
optimism, it is generally agreed that Westerners are more optimistic than Easterners.
However, there is at least one exception. Chang et al. (2003) investigated the cultural

Understanding Optimism
Chapter 5: Cultural influence on optimism 140
influence on the role of optimism in predicting life satisfaction and depressive
symptoms. A sample of 294 South Korean and 320 European-American
undergraduates were tested on optimism, depression and subjective well-being.
Surprisingly, the South Korean students were found to be significantly less
pessimistic than the European-American students. No significant group difference on
levels of optimism between these two ethic groups was found.
The author stated that his findings were consistent with his earlier studies
conducted between Asian Americans and European Americans. However, these
groups were not strictly comparable. Further research is necessary to continue to
explore the possibility of discrepancy between specific ethnic groups. Though
research based on explanatory style has generally found that Westerners are more
optimistic than Easterners, cultural comparisons in attributional style have led to
mixed results, which suggest that cultural influences on explanatory style is not
always consistent, at least for some dimensions.
Optimism studies conducted in Easterners
In addition to cross-cultural studies that directly compare the differences in optimism
expression between Eastern and Western cultures, optimism-related research recently
conducted only within Eastern cultures has provided some findings for better
understanding of both dispositional optimism and explanatory style.
Yu and Seligman (2002) investigated associations between explanatory style
and levels of depressive symptoms and other variables within a group of Chinese
children (n = 185). The study replicated previous findings that pessimistic
explanatory style was negatively associated with academic achievement and
positively correlated with school conduct problems. Additionally, in their optimism
intervention study conducted in a Chinese sampe of 220 students with depressive
symptoms, the intervention group showed significantly fewer depressive symptoms
than the control group, and this benefit continued at 3- and 6- month follow-ups.
More studies have been conducted in dispositional optimism than in
explanatory style in Eastern cultures. One study using a Taiwanese sample (n = 381)

Understanding Optimism
Chapter 5: Cultural influence on optimism 141
examined the potential mediating role of social support between dispositional
optimism, subjective well-being (happiness and life satisfaction), and psychological
well-being (personal growth and purpose in life). The authors found that dispostional
optimism was positively associated with both subjective well-being and
psychological well-being, which had been supported by many previous studies
conducted in Western cultures (Tseng, 2007).
In another study, Ho, Cheung, and Cheung (2010) examined the role of
optimism in promoting subjective well-being within 1,807 adolescents in Hong Kong.
It showed that dispositional optimism was positively associated with life satisfaction
(r = .48, p < .05) and was negatively associated with psychosocial problems (r = -.72,
p < .05), which were consistent with previous findings in Western cultures (Wrosch
& Scheier, 2003). Also, with a sample of 250 community-dwelling older Koreans, Ju,
Shin, Kim, Hyun, and Park (2013) assessed the level of dispositional optimism,
Meaning in Life and subjective well-being of the participants. The authors found that
dispositional optimism was positively associated with both subjective well-being (r
= .50) and meaning in life (r = .75) in one group of old adults.
5.3 The present study
Previous studies revealed cultural influences on different optimism expressions
between Eastern and Western cultures, though some results were inconsistent.
Because most published research in cultural differences on optimism has been
conducted between Americans and some Eastern nations, and there are no published
studies that have compared cultural influences on optimism between British White
people and Eastern countries, we know very little about the potential cultural
influence on optimisim within these two ethnic groups. Therefore, the goal of the
present study was to extend the optimism literature by examining the differences in
dispositional optimism and explanatory style between Mainland Chinese and British
White people.

Understanding Optimism
Chapter 5: Cultural influence on optimism 142
The main purposes of the present study were to (1) test whether the ASQ and
the LOT scored within a group of White British people possess the same
psychometric structures as explicated in the sample of Mainland Chinese in Chapter
2; (2) examine correlations between measures of dispositional optimism and
explanatory styles among Easterners (Mainland Chinese) and Westerners (British
White); (3) assess potential group differences on measures of dispositional optimism
and explanatory styles between the two ethnic groups.
In agreement with the long-held perspective on cultural differences between
Easterners and Westerners, it was expected that measures of dispositional optimism
and explanatory style would be significantly intercorrelated with each other for both
cultural groups. In addition, it was expected that both Mainland Chinese and British
White groups would show an optimistically-biased attributional style, generating
more external, unstable, and specific causes to explain negative events and more
internal, stable and global causes to explain positive events. However, the
relationship between these variables may not be identical given cultural differences
between Easterners and Westerners. I did not generalize specific hypotheses
regarding levels of pessimism and explanations since results in prior research were
inconsistent, and the current study is the first to examine potential cultural
differences on optimism between these two groups.
Modelling Analyses and analysis techniques
We first tested the ASQ model (three-factor model of negative events and positive
events) described in Chapter 2 in the White British sample; and then replicated the
two-factor model of the LOT-R described in Chapter 2 in the Western participants.
Structural equation modelling (SEM) was used to test these models using Amos
17.0 (Arbuckle, 2008). All analyses took advantage of raw data supporting
estimation of models using full information maximum likelihood estimation. The
adequacy of model fit was assessed using the comparative fit index (CFI), Tucker-
Lewis index (TLI) and the Root Mean Square Error of Approximation (RMSEA).
For CFI and TLI, values > 0.95 were taken as indicating acceptable fit (Hu & Bentler,

Understanding Optimism
Chapter 5: Cultural influence on optimism 143
1999). For the RMSEA, values of < .05 indicated acceptable fit (C. Y. Yu, 2002).
Akaike Information Criterion (AIC) and Bayesian Information Criterion (BIC) are
reported to aid model comparison.
5.3.1 Method
Participants
Data were collected from undergraduates in Mainland China and the United
Kingdom. The Mainland Chinese sample consisted of 232 undergraduates in Sample
2. A total of 205 White British participants were included in Sample 3. See 1.5.4 of
Chapter 1 for details of these two samples.
Materials
The original English version of the Life Orientation Test-Revised (LOT - R; Scheier
et al., 1994) was used to measure dispositional optimism in the UK sample. A
Mainland Chinese version of Life Orientation Test-Revised (CLOT-R; Lai et al.,
1998) was used to measure dispositional optimism of the Mainland Chinese students.
The original English version of the ASQ (Peterson et al., 1982) was used to
measure explanatory style of the UK students. Attributional Style of Mainland
Chinese participants was measured using a Mainland Chinese version of the ASQ
(Zhang, 2006).
Procedure
For the Mainland Chinese sample, participants were tested in groups of 30 to 50 by
their teacher. Each teacher was trained on the administration of the task. After
detailed instructions were provided, participants completed the paper-and-pencil
questionnaires. Testing took around 20 minutes.
For the White British sample, two measures were administered to all 205
participants as part of one bigger survey that was completed in the form of paper-
and-pencil questionnaires. Instructions to all participant groups were identical. Of the
initial White British sample, three participants provided an incomplete set of surveys,

Understanding Optimism
Chapter 5: Cultural influence on optimism 144
and thus left a total of 202 completed responses that were available for subsequent
data analyses.
5.3.2 Results
Descriptive statistics
We first examined descriptive and summary statistics, and the standard composite
explanatory style scores. Table 5.1 shows the descriptive statistics of the ASQ and
the LOT-R in both groups. Reliabilities were acceptable.
Measures
Culture group
Mainland Chinese White British
Means SD Cronbach’s
Alpha Means SD
Cronbach’s
Alpha
ASQ Total 2.12 2.24 0.83 1.26 2.21 0.83
ASQ Negative 12.98 1.92 0.79 12.21 1.83 0.78
ASQ Internal Negative 4.47 0.61 0.40 4.34 0.78 0.61
ASQ Stable Negative 4.33 0.89 0.69 4.03 0.83 0.70
ASQ Global Negative 4.18 0.96 0.73 3.84 0.89 0.74
Hopelessness 4.25 0.81 0.80 3.94 0.76 0.81
ASQ Positive 15.1 1.81 0.81 13.47 1.94 0.81
ASQ Internal Positive 4.87 0.69 0.63 4.58 0.88 0.71
ASQ Stable Positive 5.29 0.78 0.71 4.63 0.82 0.71
ASQ Global Positive 4.94 0.8 0.63 4.26 0.79 0.60
Hopefulness 5.12 0.69 0.78 4.45 0.7 0.76
LOT-R Optimism 8.37 1.93 0.46 7.02 2.38 0.57
LOT-R Pessimism 4.05 2.23 0.64 4.51 2.15 0.68
Table 5.1: Means, SDs and Cronbach’s Alpha for the ASQ and the LOT-R scales.
Note: For Mainland Chinese, N=232. For White British, N=202. Correlations inside
of parentheses are for White British. Hopelessness = stability + globality of the ASQ
negative events; Hopefulness = stability + globality of the ASQ positive events.

Understanding Optimism
Chapter 5: Cultural influence on optimism 145
Modelling
Following the study of Hewitt et al. (2004) and our analysis in Chapter 1, method
(event) variance was accommodated using an MTMM structure in all modelling
analysis. We first tested the hypothesis that the structure of explanations for the
causes of negative events reflects three factors of internality, stability and globality
which are correlated based on data of Sample 3.
The base model without modifications did not fit very well (χ² (114) = 217.19,
p < .001; CFI = 0.88; TLI = 0.82; RMSEA = 0.067; AIC = 331.19; BIC = 519.77).
After modifications, the fit was improved by all criteria (χ² (98) = 122.38, p <.05;
CFI = 0.97; TLI = 0.95; RMSEA = 0.035; AIC = 268.38; BIC = 509.88). In this
modified model, internality and stability factors correlated .20; stability and globality
had an r of .66, internality and globality was uncorrelated (r = -.01). Thus, the data
collected from Sample 2 didn’t support the model previously reported by Hewitt et al.
(2004) and the similar model found in Chapter 1. Here the corrected model of causal
attributions for negative events emerged as different correlations between three
factors (correlated internality-stability and correlated globality-stability but
uncorrelated internality-globality). We next turned to see if this model would fit well
for positive events.
A model for positive events was constructed in the same fashion as the
baseline model for negative events. Fit measures for this model indicated a lack of
adequate fit between model and data (χ2
(114) = 198.15, p < 0.001; CFI = 0.91, TLI =
0.88, RMSEA = 0.061; AIC = 312.15; BIC = 500.72). But modifications were
suggested and these modifications improved fit by all criteria (χ² (104) = 133.66, p
<.05; CFI = 0.97; TLI = 0.96; RMSEA = 0.038; AIC = 267.66; BIC = 489.31). In the
correlated factor model stability and globality correlated .63, internality and
globality .34 and internality and stability .59 (See Figure 5.1).

Understanding Optimism
Chapter 5: Cultural influence on optimism 146
Figure 5.1: Well-fitting 3-factor model of attributional style for positive events.
As a result, as previously reported by Higgins et al. (1999) and in Chapter 1,
a model of causal attributions for positive events in terms of three correlated factors
of globality, stability, and internality adequately accounted for responses to these
positive events in the ASQ.
Analyses of separate ASQ positive events and ASQ negative events, then,
indicated that only ASQ scale of positive events was well accounted for by three
INTERNALITY
STABILITY
GLOBALITY
A1.12.1 d6
.71 A1.10.1 d5
.69 A1.9.1 d4
.48 A1.6.1 d3 .72
A1.3.1 d2 .46
A1.1.1 d1
.28
A1.12.2 d12
.72 A1.10.2 d11 .75
A1.9.2 d10 .57
A1.6.2 d9 .67
A1.3.2 d8 .43
A1.1.2 d7 .25
A1.12.3 d18
.65 A1.10.3 d17
.59 A1.9.3 d16
.64 A1.6.3 d15
.51
A1.3.3 d14 .31
A1.1.3 d13 .04
.59
.63
.34
.23
.09
.40
.19
.33
.29
.29
.39
.08
.14
.24
.27
.25
.25
.21
.24
.21
.37
.21
.17 -.15
.19
-.19
-.18
-.23 -.20
.14
.15
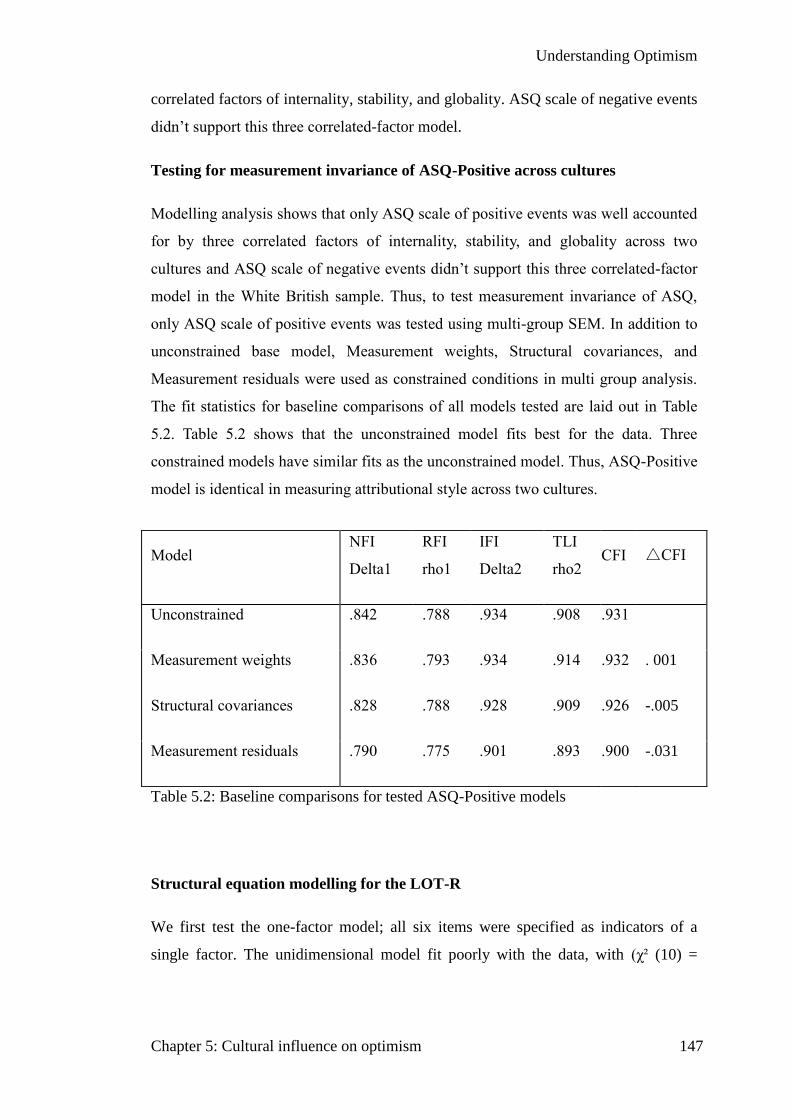
Understanding Optimism
Chapter 5: Cultural influence on optimism 147
correlated factors of internality, stability, and globality. ASQ scale of negative events
didn’t support this three correlated-factor model.
Testing for measurement invariance of ASQ-Positive across cultures
Modelling analysis shows that only ASQ scale of positive events was well accounted
for by three correlated factors of internality, stability, and globality across two
cultures and ASQ scale of negative events didn’t support this three correlated-factor
model in the White British sample. Thus, to test measurement invariance of ASQ,
only ASQ scale of positive events was tested using multi-group SEM. In addition to
unconstrained base model, Measurement weights, Structural covariances, and
Measurement residuals were used as constrained conditions in multi group analysis.
The fit statistics for baseline comparisons of all models tested are laid out in Table
5.2. Table 5.2 shows that the unconstrained model fits best for the data. Three
constrained models have similar fits as the unconstrained model. Thus, ASQ-Positive
model is identical in measuring attributional style across two cultures.
Model NFI
Delta1
RFI
rho1
IFI
Delta2
TLI
rho2 CFI △CFI
Unconstrained .842 .788 .934 .908 .931
Measurement weights .836 .793 .934 .914 .932 . 001
Structural covariances .828 .788 .928 .909 .926 -.005
Measurement residuals .790 .775 .901 .893 .900 -.031
Table 5.2: Baseline comparisons for tested ASQ-Positive models
Structural equation modelling for the LOT-R
We first test the one-factor model; all six items were specified as indicators of a
single factor. The unidimensional model fit poorly with the data, with (χ² (10) =

Understanding Optimism
Chapter 5: Cultural influence on optimism 148
123.83, p < .001; CFI = 0.343; TFI = 0.015; RMSEA = 0.238; AIC = 145.828; BIC =
146.622).
Figure 5.2 Standardized estimations for the two-factor model
We next turn to the two-factor model. Here the three positively worded items
were specified as indicators of the Dispositional Optimism factor, and the three
negatively worded items were specified as indicators of the Dispositional Pessimism
factor. Compare with the one-factor model, the two-factor model fit much better with
χ² (8, N = 202) = 21.387, p < .005; CFI = 0.923; TFI = 0.855; RMSEA = 0.091; AIC
= 47.387; BIC = 90.394). From the modified index, we established relationships
between the residual variance of Item 1 and Item 7, and between the residual
variance of Item 1 and Item 9. These modifications improved fit by all criteria (χ² (6)
= 6.86, p <0.5; CFI = 0.995; TLI = 0.988; RMSEA = 0.027; AIC = 36.860; BIC =
86.484). The correlation between the Dispositional Optimism factor and the
Dispositional Pessimism factor was -.27 (p<.01). The factor loading ranged from .30
to .81 (See Figure 5.2).
Dispositional Optimism
.77
LOT-R 10
LOT-R 4 .56
LOT-R 1 .38
Dispositional Pessimism
.75
LOT-R 9
LOT-R 7 .68
LOT-R 3 .52
-.27 .12
-.25

Understanding Optimism
Chapter 5: Cultural influence on optimism 149
Thus, as previously reported by many studies conducted in Western cultures,
a two-factor model of dispositional optimism was supported by our study in this
White British sample. That is, the LOT-R measured two negatively correlated and
independent constructs. This result was consistent with previously reported analysis
in Chapter 2.
Testing for measurement invariance of LOT-R across cultures
A two-factor model of dispositional optimism was supported in previous SEM
analysis in Chapter 2.2.2. That is, the LOT-R measures two negatively correlated and
independent constructs. Similarly, a two-factor model of dispositional optimism was
supported in the White British sample as well. To test measurement invariance across
cultures, multi-group SEM was conducted. In addition to unconstrained base model,
Measurement weights, Structural covariances, and Measurement residuals were used
as constrained conditions in multi group analysis.
Fit statistics of all models tested are laid out in Table 5.3. Table 5.3 shows
that the unconstrained model fits best for the data. Among three constrained models,
Measurement weights model and Structural covariances model have similar fits as
the unconstrained baseline model. However, the absolute CFI value between
Measurement residual model and the unconstrained model is bigger than .05. It
means that for the unconstrained model, Measurement weights model and Structural
covariances model, ASQ-Positive structure is identical in measuring attributional
style across two cultures. However, for Measurement residual model, ASQ-Positive
structure doesn't have cross-culture validity.

Understanding Optimism
Chapter 5: Cultural influence on optimism 150
Model NFI
Delta1
RFI
rho1
IFI
Delta2
TLI
rho2 CFI △CFI
Unconstrained .915 .841 .955 .912 .953
Measurement weights .893 .839 .941 .910 .940 -.013
Structural covariances .872 .833 .927 .903 .926 -.027
Measurement residuals .815 .809 .881 .877 .881 -.072
Table 5.3: Baseline comparisons for tested LOT-R models
Correlations between dispositional optimism, dispositional pessimism and
explanatory styles in Mainland Chinese and White British groups
Correlations for all the measures are presented in Table 5.4 for Mainland Chinese
(outside of parentheses) and White British (inside parentheses). As the table shows,
the pattern and magnitude of associations between measures for Mainland Chinese
and White British groups were quite similar. For example, dispositional optimism
scores were positively and significantly correlated with ASQ Total scores for both
Mainland Chinese (r = 0.13) and for White British (r = 0.17) groups; LOT-R
Pessimism scores were negatively and significantly associated with ASQ Positive for
both Mainland Chinese and for White British participants at the same level (r = -
0.23).
However, of the 21 pairs of correlations between the two cultural groups, we
still found some different patterns of correlations. For example, significantly weaker
negative associations emerged for White British participants compared with their
Mainland Chinese counterparts between dispositional optimism and dispositional
pessimism (r = -0.16 vs. r = -0.22, respectively), and between hopelessness and ASQ
Total scores (r = -0.63 vs. r = -0.54 respectively). More strikingly, while the
association between LOT-R Pessimism and Hopefulness scores was positive for
Mainland Chinese (r = 0.08), it was negative for White British (r = -0.05)

Understanding Optimism
Chapter 5: Cultural influence on optimism 151
participants. Though neither of these correlations reached statistical significance,
they partly represented different trends of associations between explanatory style and
dispositional pessimism for these two ethnic groups. As a result, the association
patterns between these study variables was not identical for Mainland Chinese and
White British participants.
Measures ASQ-
Negative
ASQ-
Positive
ASQ
Total Hopelessness Hopefulness
LOT-R
Optimism
ASQ Negative -
ASQ Positive 0.28**
- (0.31**)
ASQ Total -0.63** 0.57**
- (-0.55**) (0.62**)
Hopelessness 0.95** 0.23** -0.63**
- (0.91**) (0.23**) (-0.54**)
Hopefulness 0.34** 0.94** 0.46** 0.32**
- (0.34**) (0.91**) (0.52**) (0.33**)
LOT-R Optimism -0.04 0.12 0.13* -0.04 0.11
- (-0.09) -0.11 (0.17*) (-0.11) -0.08
LOT-R Pessimism -0.07 -0.23** -0.25** 0.08 -0.17** -0.22**
(-0.02) (-0.23**) (-0.18**) (-0.05) (-0.16*) (-0.16*)
Table 5.4: Correlations for all measures
Note: For Mainland Chinese, N=232. For White British, N=202. Correlations inside
of parentheses are for White British. Correlations outside parentheses are for
Mainland Chinese. Hopelessness = stability + globality of the ASQ negative events;
Hopefulness = stability + globality of the ASQ positive events.
* p < 0.05. ** p < 0.01.
Cultural differences in dispositional optimism, dispositional pessimism,
attributional styles, and self-serving attributional bias between Easterners and
Westerners
Table 5.5 presents the results of t-tests comparing differences in dispositional
optimism, dispositional pessimism, Composite Negative Attributional Style (ASQ

Understanding Optimism
Chapter 5: Cultural influence on optimism 152
Negative), Composite Positive Attributional Style (ASQ Positive), Composite
Positive minus Composite Negative (ASQ Total), Internal Negative, Stable Negative,
Global Negative, Internal Positive, Stable Positive, Global Positive, hopefulness, and
hopelessness. There were 13 planned comparisons assessing differences between the
two ethnic groups.
Measures
Culture group
t (432) Mainland Chinese White British
Means (SD) Means (SD)
ASQ Total 2.12 (2.24) 1.26 (2.21) 4.02***
ASQ Negative 12.98 (1.92) 12.21 (1.83) 4.26***
ASQ Internal Negative 4.47 (0.61) 4.34 (0.78) 2.06**
ASQ Stable Negative 4.33 (0.89) 4.03 (0.83) 3.60***
ASQ Global Negative 4.18 (0.96) 3.84 (0.89) 3.72***
Hopelessness 4.25 (0.81) 3.94 (0.76) 4.18***
ASQ Positive 15.1 (1.81) 13.47 (1.94) 9.05***
ASQ Internal Positive 4.87 (0.69) 4.58 (0.88) 3.89***
ASQ Stable Positive 5.29 (0.78) 4.63 (0.82) 8.57***
ASQ Global Positive 4.94 (0.80) 4.26 (0.79) 8.82***
Hopefulness 5.12 (0.69) 4.45 (0.70) 9.97***
LOT-R Optimism 8.37 (1.93) 7.02 (2.38) 6.50***
LOT-R Pessimism 4.05 (2.23) 4.51 (2.15) - 2.19**
Table 5.5: t-tests of ASQ and LOT-R between two cultural groups.
Note: For Mainland Chinese, N=232. For White British, N=202. Correlations inside
of parentheses are for White British. Hopelessness = stability + globality of the ASQ
negative events; Hopefulness = stability + globality of the ASQ positive events.
** p < 0.01. *** p < 0.001.

Understanding Optimism
Chapter 5: Cultural influence on optimism 153
As shown in Table 5.5, Mainland Chinese participants reported significantly
higher dispositional optimism scores than White British (M = 8.37 vs. M = 7.02,
respectively), and significantly lower dispositional pessimism scores (M = 4.05 vs.
M = 4.51, respectively). The former result was quite unexpected given previous
findings obtained between Easterners and Westerners (Chang, 1996). But the
difference of pessimism scores was consistent with at least one study (Chang et al.,
2003).
Also as Table 5.5 shows, Mainland Chinese participants reported
significantly higher ASQ Negative scores than White British participants (M = 12.98
vs. M = 12.21, respectively), indicating a more pessimistic explanatory style for
negative events, which was consistent with previous findings (Lee & Seligman,
1997). At the same time, however, Mainland Chinese participants reported
significantly higher ASQ Positive scores than White British participants (M = 15.10
vs. M = 13.47, respectively), indicating that Mainland Chinese participants had a
more optimistic explanatory style for positive events than White British participants.
This result seemed quite unexpected given most previous findings obtained with
Asians and North Americans (e.g. Lee & Seligman, 1997), but it was consistent with
our previous findings that individuals tend to have a similar cognitive style for both
positive and negative events (see 2.1 in Chapter 2 for details). That is, people are
inclined to explain life events using consistent cognitive style, such as attributing
both positive and negative events to internal factors.
In spite of the difference of explanatory styles described above between these
two culture groups, both ethnic groups reported that ASQ Total scores were above
zero, indicating higher scores on positive events than on negative events (see Table
5.5). These results were consistent with previous findings reported by Higgins and
Bhatt (2001).
To further investigate potential cultural differences in explanatory styles
between these groups, t-tests were also conducted based on each of 12 ASQ events.
As shown in Table 5.6, Mainland Chinese participants reported higher scores on all
12 ASQ events than White British participants, indicating a more optimistic

Understanding Optimism
Chapter 5: Cultural influence on optimism 154
attributional style for positive events and a more pessimistic attributional style for
negative events, which once again was consistent with the previous proposal of a
compatible cognitive style in explaining life events.
Life events Mainland
Chinese
White
British
Mean
Difference
Positive events Mean SD Mean SD
Achievement Becoming very rich 15.39 3.04 13.94 3.14 1.45 ***
Getting a position that you want very badly 16.00 2.71 13.72 2.89 2.28 ***
Getting a raise 15.21 2.49 13.65 2.88 1.56 ***
Affiliation Being complimented on appearance 13.63 2.84 11.84 2.88 1.79 ***
Being praised for doing a project 15.34 2.71 13.67 2.91 1.68 ***
Being treated more lovingly 15.03 2.95 14 3.24 1.03 **
Negative events
Achievement Having been failed to get a job for some time 13.35 2.74 12.51 3.1 0.84 **
An important talk gets negative reactions 13.25 3.02 12.61 2.68 0.64 *
Cannot meet expectations of others 13.53 2.81 12.42 2.58 1.12 ***
Affiliation Not helping a friend who has a problem 12.47 3.32 11.63 2.98 0.83 **
Being treated hostilely by a friend 12.61 2.92 12.03 2.47 0.58 *
A date goes badly 12.65 2.84 12.04 2.63 0.61 *
Table 5.6: Mean scores of Negative and Positive Affiliation and Achievement event
in two groups.
Note: For Mainland Chinese, N=232. For White British, N=202.
* p < 0.05.** p < 0.01. *** p < 0.001.

Understanding Optimism
Chapter 5: Cultural influence on optimism 155
5.3.3 Are Chinese people more optimistic than British people?
The main purposes of the present study were fourfold. The first aim was to test
whether the same psychometric structures of the ASQ (three-correlated-factor
structure) and the LOT-R (two-factor structure) discussed in Chapter 2 were
replicable in a White British sample. I found that a model of causal attributions in
terms of three correlated factors of globality, stability, and internality adequately
accounts for responses to positive ASQ events but not for negative events. For
dispositional optimism, just as reported previously in most studies and in the SEM
analysis in Chapter 2, a two-factor model of dispositional optimism was supported in
this White British sample. That is, the LOT-R measured two negatively correlated
and independent constructs.
Second, in my attempts to find potential differences in optimism correlations
between two ethnic groups, the overall results revealed several critical points. First,
the patterns of associations between optimism measures for Mainland Chinese and
White British participants were quite similar. Fifteen out of twenty-one correlations
were found to be statistically significant for both groups (see Table 6.2). In sum,
ASQ Total was negatively correlated with LOT-R Pessimism and positively
correlated with LOT-R Optimism. As expected, LOT-R Optimism and LOT-R
Pessimism was negatively correlated. However, correlational patterns between
measured variables were not identical for two cultural groups (such as a weaker
negative association between LOT-optimism and LOT-pessimism for White British
participants than for Mainland Chinese participants).
Finally, in attempting to examine potential group differences on dispositional
optimism and explanatory style, I found that Mainland Chinese and White British
students differ among a number of important outcome variables in optimism.
Specifically, Mainland Chinese participants were significantly more optimistic and
less pessimistic. Also, Mainland Chinese participants showed a more pessimistic
explanatory style for explaining ASQ negative events than did their White British
counterparts, which supported the proposal that Easterners tend to use more
pessimistic attributions for negative events than Westerners. On the other hand,

Understanding Optimism
Chapter 5: Cultural influence on optimism 156
although the difference in explaining ASQ positive events indicated a more
optimistic attributional style for Mainland Chinese participants, which was
seemingly inconsistent with some previous research, it supported the assumption that
individuals tend to produce similar patterns of explanations based on cognitive style
rather than on event type. Generally, these mixed results suggested that the cultural
influence on optimism is not uniform for at least some of the differentiated
dimensions.
The present findings demonstrate a trend of reversing traditional
understanding in assuming that Easterners are basically more pessimistic than
Westerners and Westerners are generally more optimistic than Easterners. These
findings appear inconsistent with many previous studies in which greater pessimism
was found in Easterners than Westerners. For example, Heine and Lehman (1995)
reported that the Japanese sample were more pessimistic than their Canadian
counterparts. Similarly, Lee and Seligman (1997) have also pointed to the greater
pessimism of Asians compared to European Americans. Therefore, we didn't expect
the opposite results. In spite of that, a few considerations may be helpful to account
for the lower pessimism found among Mainland Chinese compared to White British.
First, it has been argued that broader social factors should be taken into account in
understanding optimism and pessimism (Lee & Seligman, 1997). Accordingly, these
seemingly unexpected findings might be unique to this young Chinese population.
The relatively recent fast economic growth of China may provide an explanation for
Chinese people, especially as young generations feel more optimistic and confident
than previously, therefore dimming previous cultural influences on optimism.
Secondly, as noted by some researchers, one of the major concerns in
examing culture differences in optimism is that it might be a problem for Easterners
to get the exact meaning of LOT-R items since this questionnaire has been developed
on the basis of Western cultures (Anderson, 1999). Hence, it is possible that there are
slight gaps in understanding the meaning of optimism and pessimism. At the very
least, this is in line with some results from previous research, as discussed earlier,
that found no group differences in optimism across cultures (Chang et al., 2003), or
differences that were more nuanced (Chang, 1996).

Understanding Optimism
Chapter 5: Cultural influence on optimism 157
Finally, in spite of differences in explanatory style between these two cultural
groups, the universality of the self-serving bias in causal explanations was supported
by the data. Both these ethnic groups reported positive ASQ Total scores, indicating
no matter what their cultural background was, individuals tend to explain positive
events with more internal, stable and global causes than negative events. This
conclusion is consistent with previous cross-cultural evidence (e.g., Higgins & Bhatt,
2001), revealing that there is a universal trend of positive bias in causal attributions.
We’d better bear in mind that though some specific patterns of optimism expression
are carved with potential cultural difference, it is generally true that being optimistic
means better psychological adjustment and is associated with higher levels of
happiness.

Understanding Optimism
Chapter 6: Extending thoughts on attributional bias 158
Chapter 6: Extending thoughts on attributional bias
6.1 What we know and what we don’t know about attributional bias
One of the prevailing ideas in psychology is that individuals have an inherent and
pervasive tendency to provide explanations for the behaviour and events that they
encounter (Peterson, 2000a). As one of the most important psychosocial systems of
optimism, attributional style has been in attention of a large body of research, which
provides consistent evidence for the linkage between attributional style and many
other psychological traits. Such attributions can be functional and adaptive and may
serve psychological and social purposes when attributional bias applies (Mezulis et
al., 2004; Sanjuan & Magallares, 2014).
Attributional bias is argued to manifest itself in two related but distinct forms.
One is self-serving attributional bias (Mezulis et al., 2004). This refers to the
tendency of individuals to attribute positive situations to causes that are more internal,
stable and global than to causes for negative situations. The second form is self-
versus-other attributional bias – the tendency of individuals to attribute their own
behaviours to situational or environmental causes, while attributing behaviours of
others to dispositional or inherent causes (Ashkanasy, 1997). The literature focusing
on these two attributional biases are reviewed below.
Self-serving attributional bias
The original theoretical basis of self-serving attributional bias was that it derives
from the interaction between motivation and cognition certainty, suggesting that
people tend to “accept responsibility for positive behavioural outcomes and to deny
responsibility for negative behavioural outcomes” (Bradley, 1978, p. 59). Prior
studies addressing self-serving attributional bias used to focus solely on the
dimension of internality by assuming that individuals exhibit more internal
attributions for positive events than for negative events (Greenberg et al., 1982;
Nurmi, 1992). This concept was broadened by two facts. One is the development of a
widely-accepted three-dimensional measure for attributions – the ASQ. The other is

Understanding Optimism
Chapter 6: Extending thoughts on attributional bias 159
the rising debate of insufficient information for establishing a self-serving pattern in
attributions based only on the internality dimension. Consequently, the dimensions of
stability and globality have been incorporated, and self-serving attributional bias is
conceptualized as the tendency of people to attribute positive situations to more
internal, stable and global causes than they do for negative situations (Mezulis et al.,
2004).
Past studies have linked self-serving attributional bias to different aspects of
well-being. Sanjuan and Magallares (2014) reported positive relations between self-
serving attributional bias and two significant markers of well-being, subjective well-
being (r = .35) and adaptive coping strategies (r = .31). One of the earlier studies
found that depressed individuals were immune from self-serving attributional bias
while non-depressed subjects expressed apparent self-bias in causal attributions
(Greenberg, Pyszczynski, Burling, & Tibbs, 1992). Self-serving attributional bias has
also been implicated in the decision-making process, indicating that the preference of
attributing positive performance to internal causes increases confidence of financial
managers, and thus improve future performance as a result (Libby & Rennekamp,
2012).
In addition to research interested in the adaptive nature of self-serving
attributional bias in promoting well-being, psychologists have also investigated
potential influences of age, gender, and culture on this bias (Higgins & Bhatt, 2001;
Mezulis et al., 2004; Nurmi, 1992). Findings of these studies were basically
consistent with traditional understanding of culture differences between the East and
the West.
Though it is still not very clear what the inherent cognitive mechanism of self-
serving attributional bias is, evidence from an fMRI study has identified that this
type of bias is correlated with activation of the anterior portion of the precuneus
(Cabanis et al., 2013). This finding provides evidence for the physiological basis of
self-serving attributional bias.

Understanding Optimism
Chapter 6: Extending thoughts on attributional bias 160
Self-serving attributional bias and optimistic explanatory style
Comparing the definitions of optimistic explanatory style and self-serving
attributional bias, it is not difficult to see that both concepts share a favourable
attributional style involving both negative and positive situations. Similarity between
these two notions is strengthened by their methods of measurement. While a more
optimistic attributional style for a domain means higher scores for positive events
and a lower score for negative events for that domain (Forgeard & Seligman, 2012),
a self-serving attributional bias represents a positive score when attributions for
negative outcomes are subtracted from attributions for positive outcomes (Sanjuan &
Magallares, 2014).
Self-serving attributional bias in most current studies represents the positive
tendency in people’s causal attributions, and refers to an optimistic explanatory style,
which shows a cognitive bias in preference of an optimistic explanatory style, and
reflects a broad self-serving bias in attribution.
Prior research along both lines of optimistic explanatory style and self-serving
attributional bias are consistent in their finding of beneficial effects on well-being
(Forgeard & Seligman, 2012; Mezulis et al., 2004). For reasons of consistency, here
in my study of positive bias in attributions, the tendency of holding an optimistic
explanatory style and the tendency of expressing a self-serving attributional bias are
equal notions, both referring to the tendency for individuals to explain positive
situations through internal, stable and global causes, and negative situations to
external, unstable and specific causes.
Reflected in the ASQ, two composite scores, the ASQ Negative and the ASQ
Positive, were used to calculate a self-serving attributional bias (Sanjuan &
Magallares, 2014) or an optimistic explanatory style (Peterson et al., 1982). If the
subtraction score of the ASQ Negative from the ASQ Positive is positive, it
represents a self-serving attributional bias or an optimistic explanatory style,
reflecting stronger attributions along internal, stable and global causes for positive
than for negative events. On the other hand, if the subtraction score of the ASQ

Understanding Optimism
Chapter 6: Extending thoughts on attributional bias 161
Negative from the ASQ Positive is negative, it then stands for the lack of a self-
serving attributional bias or an optimistic explanatory style, reflecting weaker
attributions for positive than for negative events.
Self-versus-other bias in attribution of causality
Self-versus-other bias in attributions emerges when individuals attribute their own
performance outcomes to situational factors, and attribute others’ performance
outcomes to dispositional or internal factors (Ashkanasy, 1997). This notion of self-
versus-other attributional bias was originally developed based on Jones and Nisbett
(1972)’s proposition of actor-observer discrepancies or the actor-observer asymmetry.
Jones and Nisbett (1972) proposed in their theoretical analyses that based on
differences of information available for decision-making and different perspectives
on understanding personality of self and of others, individuals tend to attribute their
own behaviours to situational or environmental cause while attribute dispositional or
inherent causes for behaviours of others. This self-versus-other bias in attributions of
causality has become a common research topic in both psychology and sociology
(see Ashkanasy, 1997; Malle, 2006; Medway & Lowe, 1976; Teglasi & Fagin, 1984;
Watson, 1982). It has been connected to many potentially influential factors, such as
achievement (Medway & Lowe, 1976), social anxiety (Teglasi & Fagin, 1984),
psychosis (Wiffen et al., 2013), and perception of others (Ashkanasy, 1997).
The self-other view might also be viewed as an application of the self-serving
attributional bias, assuming that people tend to attribute their own success using
more internal causes than others’ success, and explain their own failure more
externally than others’ failure (Ashkanasy, 1997). Similar to assessment of self-
serving bias, the method of providing explanations for positive and negative
outcomes has been used widely in assessing self-versus-other attributional bias
(Malle, 2006). The outcome valence (positive-negative) has been taken as one of the
moderators of the self-other bias: Malle (2006) reported in his meta-analysis that the
self-other biased view is detectable in the case of explaining negative events but not
for positive events.
Understanding Optimism
Chapter 6: Extending thoughts on attributional bias 162
The moderating effect of interpersonal perception of the other has been
investigated. For example, Ashkanasy (1997) reported that when another individual
was seen to be similar to self, participants gave more internal causes to academic
success for others than they did for themselves, and gave more external causes to
academic failure for others than they did for themselves.
Though theory of self-versus-other bias in causal attributions has been developed
and assessed in some studies, there is no widely accepted definition and measure so
far since specific measurement for situational and dispositional causes haven’t been
developed.
6.2 Attributional evaluation system and possible attributional models
Attributional evaluation system and attributional models
If we are to understand the mechanism of attributional features, and to systematically
evaluate the potential relationship between two forms of attributional bias, it is
important that we systemically consider all components in the complex admixture of
attributions including subjects (self vs other), valences (positive vs negative events),
and causes (traits vs states) (see Table 6.1). Here, traits refer to inherent or fixed
aspects of causal attributions – internality, stability, and globality. Additionally,
states mean external or changeable features of attributions, representing the
dimensions of externality, instability, and locality. The possibility of modelling self-
serving bias and self-other bias in causal attributions jointly raises the possibility of
addressing the question whether attributions regarding the causes of positive and
negative events could be differentiated between self and other, i.e., do individuals
give more optimistic explanations for themselves than for others when both positive
and negative events apply?
Although theoretically positive or negative events could be attributed to either
traits or states independently, at least two extreme attributional styles, one of which
features attributing both good and bad situations to traits (see Table 6.1; system 1 and

Understanding Optimism
Chapter 6: Extending thoughts on attributional bias 163
system 5), and the other attributing both positive and negative outcomes to states (see
Table 6.1; system 4 and system 8), could be plausibly excluded. Moreover, previous
research has tested and confirmed self-serving attributional bias. As a result, my
understanding of causal attributions of self has predominately focused on models of
attributing positive events to traits of self, and attributing negative events to states of
self (see Table 6.1; system 3). For self-other attributional bias, based on previous
evidence of self-other attributional bias in at least the internality dimension
(Ashkanasy, 1997), we predicted that individuals would provide more biased
attributions for their own situations than they do for those of others.
Subject Valence
Attributions for Positive events Attributions for Negative events
Self
System 1 traits of self traits of self
System 2 states of self traits of self
System 3 traits of self states of self
System 4 states of self states of self
Other
System 5 traits of other traits of other
System 6 states of other traits of other
System 7 traits of other states of other
System 8 states of other states of other
Table 6.1: Computational structure of the attributional evaluation systems.
Thus, two attributional models were created to describe potentially true
evaluation patterns of causal attributions on the basis of analysis of the attributional
evaluation systems. The first model combines attributional evaluation system 3 and
system 6 (see Table 6.1); featuring two entirely opposite attributional styles between
self and other (Model A, see Figure 6.1). In this reversed model, individuals attribute
their own positive events to traits of self, and attribute other’s positive events to
states of other people; simultaneously, individuals tend to attribute their own
negative events to states of self, and attribute other’s negative events to traits of other

Understanding Optimism
Chapter 6: Extending thoughts on attributional bias 164
people. The second model stands for similar attributional patterns between self and
other (see Table 6.1, system 3 and system 7), but also features biased self-other
attributions. In this model, in addition to self-other discrepancy in causal attributions,
individuals are supposed to apply similar trends of optimistically-biased attributions
no matter what events occur to themselves or to other people (Model B, see Figure
6.2). That is, individuals tend to attribute positive events to traits and attribute
negative events to states both for themselves and for other people, though they tend
to give more credit for attributing their own behaviours.
Figure 6.1: Model A – reversed attributional model for self and for other.

Understanding Optimism
Chapter 6: Extending thoughts on attributional bias 165
Figure 6.2: Model B – more optimistic attributional model for self than for other.
Both models may reveal the truth, indicating that individuals tend to attribute
their own positive situations to more internal, stable and global causes than they did
for others in the same situations, while they tend to attribute more external, unstable
and local causes to themselves than they do for other people when negative situations
apply. Our aim was to test which model was the best attributional model when
individuals were asked to attribute the same events to themselves and other people.
Measuring issues
To investigate the possible attributional style in perception of others, we needed to
instruct participants to give attributions for themselves and others based on the same
events. So we administered a rewritten version of the ASQ, the ASQ-Other, asking
subjects what attributions they would make should these events occur to a fictional
character “Wang Chen”. Here “Wang Chen” is described as being a healthy
undergraduate with average intelligence. Subjects were asked to imagine each of a

Understanding Optimism
Chapter 6: Extending thoughts on attributional bias 166
series of events occurring to “Wang Chen”. The same 12 events were used as the
original ASQ.
6.3 Psychometric structure of the ASQ-Other
Before comparing causal attributions for the self and for the other, we first
investigated the psychometric structure of the ASQ-Other.
Participants in sample 1 (N = 452; for details, see 1.5.4 of Chapter 1) were
instructed to complete the ASQ-Other.
Analysis strategy
Descriptive statistics and correlational analyses were calculated first. Structural
equation modelling (SEM) was then used to test potential structural models of the
ASQ-Other using Amos 17.0 (Arbuckle, 2008). All analyses took advantage of raw
data supporting estimation of models using full information maximum likelihood
estimation.
Descriptive statistics
We first examined descriptive and summary statistics, and the standard composite
explanatory style scores. Table 6.2 shows the descriptive statistics. Reliabilities were
acceptable.

Understanding Optimism
Chapter 6: Extending thoughts on attributional bias 167
Measures Means SD Cronbach’s Alpha
Positive Events 14.93 1.81 0.82
Internal Positive 4.45 0.69 0.54
Stable Positive 5.33 0.82 0.79
Global Positive 5.15 0.84 0.79
Negative Events 13.97 1.74 0.79
Internal Negative 4.04 0.65 0.48
Stable Negative 5.10 0.87 0.81
Global Negative 4.83 0.89 0.79
ASQ-Other Total 0.96 1.27 0.89
Table 6.2: Means, standard deviations and Cronbach’s Alpha for all measures of the
ASQ-Other. (n = 452)

Understanding Optimism
Chapter 6: Extending thoughts on attributional bias 168
Modelling
The hypothesised three-factor model for negative events was tested using an MTMM
structure. The base model fitted reasonably well (χ² (114) = 225.59, p < .001; CFI =
0.94; TLI = 0.92; AIC = 339.59; BIC = 344.61; RMSEA = 0.047), but modifications
were suggested. The resultant model was a good fit by all criteria (χ² (109) = 168.58,
p <.001; CFI = 0.97; TLI = 0.96; AIC = 292.58; BIC = 547.63; RMSEA = 0.033), as
shown in Figure 2.4. Thus, as reported in the ASQ model earlier, a model of causal
attributions for negative events in terms of three correlated factors of globality,
stability, and internality adequately accounted for responses to these events in the
ASQ-Other as well. In this correlated factor model, stability and globality
correlated .58, internality and globality had an r of .27, and internality and stability
factors correlated .23.

Understanding Optimism
Chapter 6: Extending thoughts on attributional bias 169
Figure 6.3: Well-fitting 3-factor model of attributional style for others for negative
events.
Thus, a model of causal attributions for others for negative events in terms of
three correlated factors of globality, stability, and internality adequately accounted
for responses to these negative events in the ASQ-Other. This three-correlated-factor
model is also applicable in attributions of negative events when considering another
person being in the same situation, compared to attributions made when considering
the self in that situation.
.38
.50 .29 .15 .32
STABLE
.64 .66 .64
.63 .68 .60
GLOBAL
.55 8
.64 7
.69 .47 .65 .64
.13
.58
.27
.11
.08
.22
.26
.22
.
11
INTERNAL
.35
.31
.32
.13
.17
.22
.24
.31
.02
-.09
.03
.20
.02
.19
.20
-.19
.20
.11
-.10
2
4
5
7
8
5
2
4
7
8
11
2
4
5
11

Understanding Optimism
Chapter 6: Extending thoughts on attributional bias 170
A model for positive events was constructed in the same fashion as the baseline
model for negative events using the same MTMM structure (see Figure 2.5). Fitted
measures for the base model indicated adequate fit between model and data (χ2
(114)
= 239.21, p < 0.001; CFI = 0.94; TLI = 0.93; AIC = 353.21; BIC = 587.69; RMSEA
= .049), but modifications were suggested. The resultant model was a good fit by all
criteria (χ² (109) = 185.48, p <.001; CFI = 0.97; TLI = 0.95; AIC = 309.48; BIC =
564.53; RMSEA = 0.039). In the correlated factor model stability and globality
correlated .65, internality and globality .26 and internality and stability .43,
considerably higher than was the case for negative events.
Analyses of ASQ-Other positive and of ASQ-Other negative events, then,
indicated that these scales were well accounted for by three correlated factors of
internality, stability, and globality. That is, attributions regarding events that
occurred to others were well accounted for by the same three-correlated-factor
structure as the attributional style for explaining events occurred to self.

Understanding Optimism
Chapter 6: Extending thoughts on attributional bias 171
Figure 6.4 Well-fitting 3-factor model of attributional style for others for positive
events
INTERNAL
STABLE
GLABAL
.62 .27
.34
.48 .45
1 .24
.72
.53
.67
.62
.71 .50
.64 .62 .68
.54 .67 .55
.43
.65
.26
.14
.15
.44
.19
.28
.34
.36
.25
.41
.35
.30
.27
-.04
.09
.31
.15
.21
.13
.17
.18
.15 -.21
.17
3
6
9
10
12
1
3
6
9
10
12
1
3
6
9
10
12

Understanding Optimism
Chapter 6: Extending thoughts on attributional bias 172
6.4 Study 1: testing attributional models using ASQ and ASQ-Other
Participants in sample 1 were instructed to complete the ASQ and the ASQ-Other (N
= 452; for details, see 1.5.4 of Chapter 1).
Measures
Attributional style was assessed using the Chinese ASQ (Zhang, 2006). Attributional
style for others was measured using the ASQ-Other.
Procedure
Participants were tested in groups of 30 to 50 by their teacher. Each teacher was
trained on the administration of the task. After detailed instructions were provided,
participants completed the paper-and-pencil questionnaires. For the ASQ,
participants were instructed to make causal attributions for each of the 12 events
based on imaging that it occurs to them in real life. For the ASQ-Other, students
were asked to give explanations for the same life event when it occurred to other
people. Testing took around 30 minutes in total.
Scoring
Calculation of self-serving attributional bias followed the assessment method used in
Sanjuan and Magallares (2014).
Calculation of self-versus-other bias in attributions adapted a similar
assessment method to the ASQ. Specifically, if the subtraction score of the ASQ
positive from the ASQ-Other Positive is positive, it represents a self-other
attributional bias, reflecting stronger attributions along internal, stable and global
causes for self than for other for the same positive events. On the other hand, if the
subtraction score of the ASQ-Other Negative from the ASQ negative is positive, it
also stands for a self-other attributional bias, revealing a more optimistic explanatory
style for self than for other for the same negative events.

Understanding Optimism
Chapter 6: Extending thoughts on attributional bias 173
Results
Descriptive and summary statistics and the standard composite attributional style
scores of the ASQ are shown in Table 6.3. See Table 6.2 for the descriptive statistics
of the ASQ-Other for the total sample.
Measures Means SD Cronbach’s Alpha
Negative Events 12.9 1.78 0.84
Internal Negative 4.45 0.67 0.49
Stable Negative 4.33 0.85 0.73
Global Negative 4.12 0.9 0.73
Positive Events 15.28 1.91 0.77
Internal Positive 5.03 0.7 0.65
Stable Positive 5.36 0.78 0.75
Global Positive 4.9 0.85 0.71
ASQ Total 2.38 2.17 0.84
Table 6.3: Means, SDs and Cronbach’s Alpha for the ASQ scales.
As shown in Table 6.3, all dimensions for ASQ positive events, including ASQ
Positive, Internal Positive, Stable Positive, and Global Positive, scored higher than
the four corresponding dimensions for negative events. As a result, the subtraction
score of the ASQ Negative from the ASQ Positive is positive. Similarly, as shown in
Table 6.2, all measuring dimensions for ASQ-Other positive events, including ASQ-
Other Positive, Internal Positive, Stable Positive, and Global Positive, scored higher
than four corresponding dimensions for negative events. As a result, the subtraction
score of the ASQ-Other Negative from the ASQ-Other Positive is positive.
In order to test self-other attributional bias, t-tests were conducted and mean
differences revealed that there were significant differences between scores of all
dimensions measured in the two questionnaires (see Table 6.4). The results show that

Understanding Optimism
Chapter 6: Extending thoughts on attributional bias 174
participants had significantly higher composite scores on positive events of ASQ
than on positive events of ASQ-Other, and participants scored significantly lower on
ASQ negative than they did on ASQ-Other negative.
Dimensions ASQ ASQ-Other
Means (S.D.) Means (S.D.)
Positive Events
Internal Positive 5.03 (0.70) *** > 4.45 (0.69)
Stable Positive 5.36 (0.78) *** > 5.33 (0.82)
Global Positive 4.90 (0.85) < 5.15 (0.84) ***
Total 15.28 (1.91) *** > 14.93 (1.81)
Negative events
Internal Negative 4.45 (0.67) *** > 4.04 (0.65)
Stable Negative 4.33 (0.85) < 5.10 (0.87) ***
Global Negative 4.12 (0.90) < 4.83 (0.89) ***
Total 12.90 (1.78) < 14.00 (1.74) ***
Table 6.4: t-tests between ASQ and ASQ-Other for attributional style.
*** p < 0.001.
Mixed results emerged with regard to specific dimensions of the ASQ and ASQ-
Other. For positive events, participants scored significantly higher on internality and
stability but significantly lower on globality of the ASQ than they did on
corresponding dimensions of ASQ-Other; for negative events, participants scored
significantly lower on stability and globality but higher on internality of the ASQ
than they did on corresponding dimensions of ASQ-Other.
This self-other discrepancy of causal attributions was also generalized along
with three attributional dimensions: for Internality, participants showed significantly
higher scores for both ASQ positive and negative events than they did for ASQ-
Other positive and negative events; for Stability, subjects reported significantly
higher ratings for ASQ positive events than they did for ASQ-Other positive events

Understanding Optimism
Chapter 6: Extending thoughts on attributional bias 175
but significantly lower ratings for ASQ negative events than for ASQ-Other negative
events; for Globality, participants scored significantly lower for ASQ positive events
than for ASQ-Other positive events but significantly higher for ASQ negative events
than for ASQ-Other negative events.
Finally, self-serving attributional bias and self-other attributional bias were
combined (see Figure 6.5). Participants scored higher in attributions for positive
events than for negative events when these events occurred to themselves, and they
scored significantly lower in attributions for negative events than they did for other
people for the same events.
Figure 6.5: Attributions for positive and for negative events, for self and for other.
Discussion
As expected, results indicated that positive self-serving bias was displayed in each of
the three attributional dimensions across event valence. When individuals attribute
causal explanations for life events, they prefer to give more internal, stable and
global causes for positive events than they do for negative events. For negative
12.50
13.00
13.50
14.00
14.50
15.00
15.50
Positive Events Negative Events
Self (ASQ)
Other (ASQ-Other)

Understanding Optimism
Chapter 6: Extending thoughts on attributional bias 176
situations, individuals have the tendency to attribute those situations to more external,
unstable and specific causes than they do for positive events. A self-serving
attributional bias is manifested in the ASQ, reflecting optimistically biased
attributions with internal, stable and global causes.
Turning to the hypothesis that the subject would show a self-other attributional
bias, results indicated that individuals tend to have a more optimistic explanatory
style for similar situations with themselves than with other people for both positive
and negative events. That is, people tend to explain events in their own best interest.
While people explain their own positive outcomes using more favourable internal
causes, they attribute others’ positive outcomes to external variables. Similarly,
people also tend to see their own negative situations to be externally caused than
others.
However, caution should be taken when applying this tendency for specific
dimensions of attributional style. Though generally ASQ Positive scores were higher
than ASQ-Other positive scores, which was also the case for dimensions of
internality and stability, participants scored lower on globality of the ASQ than they
did on corresponding dimensions of ASQ-Other. Similarly, participants scored
significantly lower on composite ASQ Negative than they did on ASQ-Other
Negative, which was also applicable for dimensions of stability and globality, but the
dimension of internality was not consistent with this trend. These two exemptions
have no much influences on the general conclusion that individuals show a self-other
bias in causal attributions, because we should bear in mind that it is recommended in
ASQ scoring that the composite scores (ASQ Positive and ASQ Negative) values
much more than individual dimension scores (Peterson et al., 1982).
Model B (see Figure 6.2), which represents similar attributional trends between
the self and the other but also features a more optimistic attributional style for the
self than for the other, was supported by the data. Individuals provide more
optimistic explanations for positive outcomes than they do for negative events for
their own behaviours. At the same time, they hold a more optimistic explanatory
style when the same event is explained for themselves than for others, no matter if it

Understanding Optimism
Chapter 6: Extending thoughts on attributional bias 177
is for positive or negative events. Data analysis supported the validity of Model B,
though we found that there are bigger discrepancies between ASQ Negative and
ASQ-Other Negative than differences between ASQ Positive and ASQ-Other
Positive (see Figure 6.5). Why is there less discrimination among attribution scores
for positive events than for negative events? Peterson et al. (1982, p. 295) explained
it as “perhaps people make fewer distinctions among good events since they may not
spend as much time ruminating over them as they do over bad events, and may
attend more to the causes of bad events”.
The results of this study suggest that attributions, whether for the self or for the
other, are optimistically biased. That is, individuals tend to attribute positive events
to inherent or fixed causes (traits) and attribute negative events to external or
changeable causes (states) both for themselves and for other people. One unanswered
question from this study is whether this optimistic bias holds equally for positive and
negative events, i.e., do we have a general tendency to be more optimistically biased
for attributing positive events than we are for attributing negative events? If this is
the case, then the next question is whether our attributions for self or for other people
are closer to this generally optimistically biased tendency. To address these questions,
we conducted a second study.

Understanding Optimism
Chapter 6: Extending thoughts on attributional bias 178
6.5 Study 2: testing event-focused attibutional style using ASQ-General
We have re-written the ASQ into a novel adapted version, the ASQ-General, asking
subjects what attributions they would make should these events occur to ‘someone’,
which could be themselves or any other person. Based on findings of a general
tendency of attributional biases in both the ASQ and the ASQ-Other in the first study,
it was predicted that this optimistically biased attributional style would also be
applicable in the ASQ-General. That is, when there are no specific subjects
designated to possible life events, individuals will tend to attribute positive situations
to causes that are more internal, stable and global than to causes for negative
situations.
Subjects
Participants in sample 4 were instructed to complete the ASQ-General (N = 117; for
details see 1.5.4 of Chapter 1).
Measure
The original ASQ is based on explanations for events (positive and negative)
imagined as occurring to the subject themselves. To investigate the possible
attributional style in general, the standard ASQ was modified as the ASQ-General,
asking subjects what attributions they would make should these events occur to
“someone” who represents not just the subject but all people. The same 12 events
were used as the standard ASQ: six positive (e.g. ‘someone does a project that is
highly praised’) and six negative (e.g. ‘someone has been looking for a job
unsuccessfully for some time’) events. Rating and scoring of the ASQ-General was
the same as the standard ASQ.

Understanding Optimism
Chapter 6: Extending thoughts on attributional bias 179
Procedure
Participants were tested in groups of around 30 by their teacher. Each teacher was
trained on the administration of the task. After detailed instructions were provided,
participants completed the paper-and-pencil questionnaires. Students were instructed
to “Write down one thing you think most commonly causes this situation (on average
for all people, not just you)”. Testing took around 20 minutes in total.
Analysis and results
We first examined descriptive and summary statistics, and the standard composite
attributional style scores. Table 6.5 shows the descriptive statistics of the ASQ-
General for the total sample. Reliabilities were acceptable.
In order to test attributional bias in general situations, t-tests were conducted and
mean differences revealed that there were significant differences among scores of all
the ASQ-General dimensions (see Table 6.6). The results showed that participants
had significantly higher composite scores on positive events than composite scores
on negative events, and had significantly higher scores on all three specific
dimensions of the ASQ-General.
Means SD Cronbach’s Alpha
ASQ-General Positive 14.96 1.91 0.82
ASQ-General Internal Positive 4.69 0.73 0.59
ASQ-General Stable Positive 5.17 0.85 0.76
ASQ-General Global Positive 5.1 0.84 0.71
ASQ-General Negative 13.92 2.08 0.83
ASQ-General Internal Negative 4.49 0.72 0.56
ASQ-General Stable Negative 4.75 0.86 0.73
ASQ-General Global Negative 4.68 0.98 0.78
ASQ-General Total 1.04 1.78 0.89
Table 6.5: Means, SDs and Cronbach’s Alpha for the ASQ-General scales.

Understanding Optimism
Chapter 6: Extending thoughts on attributional bias 180
Dimensions
Means (SD)
Positive Events Negative Events
Internality 4.69 (0.73) *** > 4.49 (0.72)
Stability 5.17(0.85) *** > 4.75 (0.86)
Globality 5.10 (0.84) *** > 4.68 (0.98)
Total 14.96 (1.91) *** > 13.92 (2.08)
Table 6.6: t-tests between ASQ-General dimensions.
*** p < 0.001.
Putting the results of the two studies together (see Figure 6.6) showed that the
ASQ-Other and the ASQ-General almost overlap, while the ASQ was clearly
differentiated from the other two.
Figure 6.6: Attributions for positive and for negative events, for self, other and
general
12.50
13.00
13.50
14.00
14.50
15.00
15.50
Positive Events Negative Events
Self (ASQ)
Other (ASQ-Other)
General (ASQ-General)

Understanding Optimism
Chapter 6: Extending thoughts on attributional bias 181
Discussion
Results from the second study showed higher composite scores on the ASQ-General
positive events than composite scores on ASQ-General negative events, as well as
higher scores on all three specific dimensions of the ASQ-General positive events
than for negative events. These results suggest that optimistically biased attributions
are also applicable in general situations. Individuals generated attributional style on
the basis of judgment for features of those events (positive or negative). No matter
whom was the subject experiencing these events, themselves or other people,
individuals showed a general attributional bias, indicating more internal, stable, and
global attributions for positive events than they did for negative events.
Comparing scores of the ASQ-General with the two measures in the first
study, we found that individuals show more positive bias towards themselves than
for other people or a general population in causal attributions, especially for negative
events.
6.6 Attributional biases in reality
There has been widespread recognition that attributional bias plays an important role
in the causal attributions that people make across event valence (positive vs negative
outcomes) and across perception (self vs other), and categorise them as self-serving
attributional bias and self-other attributional bias, respectively. Though these two
forms of attributional biases are theoretically connected (Ashkanasy, 1997), research
testing attributions for the causes of events occurring to others has been separated
from studies of attributional bias regarding the self, with no research including both
into a constructed evaluation system.
Prior research examining attributional bias has taken into account subjects (self
vs other), valences (positive vs negative events), or causes (traits vs states). Not all of
these components have been systemically reviewed in one single study. We
combined these critical components into the complex admixture of causal
attributions, generating eight potential attributional systems and two potential

Understanding Optimism
Chapter 6: Extending thoughts on attributional bias 182
attributional models. Using the most widely used assessment for causal attributions,
the ASQ, and a rewritten novel version of this instrument, the ASQ-Other, I first
tested which of the two models was the best attributional model when individuals
were asked to attribute the same events when they happened to themselves and to
other people.
Findings of the first study demonstrated that causal attributions about life events
possess self-protection features, as suggested by Heider (1958). Individuals tend to
maximise positive and minimise negative future outcomes in making attributions,
thus showing a self-protective bias in causal explanations for personal outcomes or
situations. As expected, I found that positive self-serving bias manifested in each of
the three attributional dimensions across event valence. When individuals attribute
causal explanations for life events, they prefer giving more internal, stable and global
causes for positive outcomes than for negative outcomes. For unfavourable situations,
individuals have the tendency of attributing those situations to external, unstable and
specific causes. Confirmation of self-serving attributional bias in this Eastern sample
provided further evidence to the universality of this positive bias (Mezulis et al.,
2004). It appears that there may be a universal tendency for individuals to protect
themselves against negative feelings by using an optimistic attributional style.
Regarding self-versus-other bias in attributions of causality, results supported the
idea that individuals do have biased attributions for what happens to themselves and
to others. This optimistically biased tendency applies to both positive and negative
events. While individuals attribute their own positive outcomes to dispositional
factors and attribute their own negative outcomes to situational factors, they tend to
attribute other peoples’ positive outcomes to situational factors and other people’s
negative outcomes to dispositional factors. As a result, in the two proposed potential
attributional models, Model B (see Figure 6.2) was supported with more biased
attributions for negative events than for positive events between the self and the other.
The first study suggests that attributions are optimistically biased for both the
self and the other. Individuals apply similar trends of optimistically biased
attributions no matter what events occur to themselves or to other people. This raised

Understanding Optimism
Chapter 6: Extending thoughts on attributional bias 183
the question whether this optimistic bias holds equally for positive and negative
events, i.e., are individuals more optimistically biased for attributing positive events
than they are for attributing negative events with a general tendency. This question
was tested in Study two using another rewritten version of the ASQ, the ASQ-
General. Results revealed that the optimistically-biased tendency in causal
attributions were generally applicable when there is no specific subject was
designated. People tend to attribute internal, stable, and global attributions for
positive events while they generate external, unstable, and specific explanations for
negative events no matter whether the subject is themselves or other people. In
summary, individuals generally show an optimistically biased attributional style
towards positive outcomes than they do for negative outcomes.
Previous studies examined either just one type of attributional bias or
investigated only the dimension of internality concerning self-other bias. My study
made it possible to combine self-serving bias and self-versus other bias in
attributions in a widely-accepted three-dimensional model of causal attributions. It
revealed that explanations for causes of positive events and negative events could be
differentiated between self and other. Individuals gave more optimistic explanations
for themselves than they did for others. This self-versus-other bias existed in
people’s attributions for both positive events and negative events.

Understanding Optimism
Chapter 7: Depression, positive psychology and optimism interventions 184
Chapter 7: Depression, positive psychology and
optimism interventions
According to a report from the World Health Organization (2012), over 250 million
people are affected worldwide by depression, which is believed to lead to the suicide
of approximately 1 million people every year. Unfortunately, less than half of the
population affected by depression receive any effective physical or psychological
treatments. This figure is even less than 10 percent in some underdeveloped countries.
Insufficient information available for diagnosis can cause delays and improper
treatment for depression, and there is a lack of effective intervention resources that are
low cost and easily accessible (Sin et al., 2011).
Over the past 15 years, research in the field of positive psychology has shown
that psychological well-being can be cultivated and promoted through brief
interventions aimed at developing positive feelings, behaviours, or cognitions (Layous
et al., 2011; Seligman et al., 2006; Sin & Lyubomirsky, 2009). Diverse positive
psychology interventions have emerged and have provided empirical evidence for the
happiness-enhancing effect of individual strengths and resources. Unsurprisingly,
positive interventions can be particularly useful for the amelioration of depressive
symptoms, since depressed individuals will likely benefit from increases in positive
emotions (Sin et al., 2011).
Since optimism has been identified as having the strongest link to well-being in
the identified 24 character strengths in positive psychology (Park et al., 2004), and has
been shown to be beneficial in decreasing depressive symptoms (Sin et al., 2011), I
also wanted to look at the application of optimism interventions to depression
treatment, testing whether optimism manipulations could alleviate depressive
symptoms in the group of first-year college students. To understand mechanisms

Understanding Optimism
Chapter 7: Depression, positive psychology and optimism interventions 185
underlying optimism interventions, I first reviewed several traditional treatments for
depression, and then turned to theoretical background and practical manipulations of
optimism interventions, which have been included into the increasing development of
positive psychology therapy.
7.1 Traditional treatments for depression
Currently, there are two main approaches to treating depression: physical and
psychological treatment. The main physical treatment is anti-depressant medication,
which addresses the neuro-transient of the chemical process underlying depression in
the brain. The molecular and biochemical origins of depression are still not fully
understood. It is not surprising, then, that current medication is suboptimal. For
example, for mild to moderate depression, there is no significant difference between
the effect of a treatment pill and a placebo, with more than 80% of the effect of the
anti-depressant drug accounted for by placebo effects (Kirsch, Moore, Scoboria, &
Nicholls, 2002). Another problem with anti-depressant treatment is the high risk of
relapse following the cessation of treatment (Layous et al., 2011)
There are a number of psychological treatments for depression that show
evidence of working well, such as Cognitive Behavioural Therapy and problem-
solving therapy. Cognitive Behavioural Therapy enables patients to correct false self-
beliefs that can lead to certain negative emotions and behaviours (Rupke, Blecke, &
Renfrow, 2006). American psychologist Aaron Beck is regarded as a pioneer in
cognitive therapy. Through his working with depressed patients, he found that
negative moods and behaviours were usually caused by distorted thoughts and beliefs
(Beck, 1976).

Understanding Optimism
Chapter 7: Depression, positive psychology and optimism interventions 186
Three cognitive aspects – automatic thoughts, emotional responses, and
behavioural responses, have been identified as the cognitive view of human
functioning. It has long been debated that the spontaneous and immediate judgement
of a situation may be crucial in eliciting and shaping a person’s emotional and
behavioural responses to that situation. On the basis of this, Beck (1976) developed
the Cognitive Therapy (CT) for psychopathological treatment of depression. The
fundamental assumption behind CT is that a thought precedes a mood, and that both
thought and mood are interrelated with environment, physical reaction, and
subsequent behaviour. In this sense, the way people feel is related to the way in which
they explain and think about an event. The event itself does not directly determine
how they feel; their emotional response is mediated by their perception of the event (J.
S. Beck & Beck, 2011).
CT and interpersonal treatment have been shown to be effective for mild and
moderate depression. A meta-analysis of 15 studies on psychological treatments on
adult depression showed a standardised mean effect size of psychological treatment
versus control groups of 0.31 (Cuijpers, Van Straten, Van Schaik, & Andersson,
2009). Another more recent meta-analysis covering 1,036 studies on the effects of
psychotherapy for adult depression had a mean effect size of 0.42 after adjustment for
publication bias (Cuijpers, Smit, Bohlmeijer, Hollon, & Andersson, 2010).
Taken together, current medication treatments are criticised for their high
financial costs, potential side-effects, and limited effect (Layous et al., 2011). By
contrast, traditional psychological treatments have been shown to be effective in
reducing acute distress in depressed individuals and more preferable to drug therapy
among all but the most depressed people. However, these traditional psychological
treatments focus on alleviating depressive symptoms, and assume that mental health
equate to the absence of mental illness. This assumption makes traditional

Understanding Optimism
Chapter 7: Depression, positive psychology and optimism interventions 187
psychological treatments vulnerable to newly-rising positive psychotherapy (Sin et al.,
2011). New treatments that can balance the advantages and deficits of medication
therapy and traditional psychology treatments are needed.
7.2 Rising of positive psychology interventions
According to the learned helplessness theory (Abramson et al., 1978) and its later
version, the hopelessness theory of depression (Abramson et al., 1989), depression is
conceptualized as an overabundance of negative moods and negative cognition. It is
the tendency to attribute internal, stable, and global causes to negative events that
results in hopelessness and thus depression. Depression treatments developed on the
basis of these ideas then predominantly focused on fixing and alleviating negative
feelings behaviours. Positive psychology grew from the recognition that a positive
state or trait is not necessarily the obverse of negative experiences and traits; and,
positive emotions and behaviours stand for a completely separate psychological
process that functions via an isolated neural mechanism (Duckworth et al., 2005).
If traditional depression treatment aims to cure mental illness by fixing
negative feelings and negative thoughts, positive psychotherapy strives to ameliorate
depressive symptoms by promoting positive affect and positive thoughts, such as
savouring (Bryant & Veroff, 2007), practicing forgiveness (Reed & Enright, 2006),
using signature strengths (Linley et al., 2010), and expressing optimism and gratitude
(Lyubomirsky et al., 2011). This has been shown to boost positive emotions, positive
thoughts, positive behaviours, and alleviating depressive symptoms (Layous et al.,
2011; Seligman et al., 2006; Sin & Lyubomirsky, 2009).
Positive psychology includes many traits that are associated with indices of
well-being. Twenty-four character strengths have been identified, in which optimism

Understanding Optimism
Chapter 7: Depression, positive psychology and optimism interventions 188
was found to have the strongest link to life satisfaction – one of three significant
marks of well-being (Park et al., 2004). Additionally, numerous cross-sectional and
longitudinal studies have revealed that optimism is strongly correlated with a host of
psychological variables, such as self-esteem, academic achievement, coping strategy,
and positive emotions, and perhaps most importantly, predicts psychological and
physical well-being both in the presence and absence of stressors (Carver & Scheier,
2014; Carver et al., 2010; Forgeard & Seligman, 2012; Scheier & Carver, 1992).
Taken together, research suggests that optimism is associated with various indices of
positive functioning in a wide variety of stressful situations. To fully understand the
mechanisms underlying the beneficial effects of cultivating optimism in relationship
to depressive symptoms, I next turn to the theoretical background of the optimism-
depression relationship.
7.3 Optimism and depression
As stated in previous chapters, optimism has been conceptualized and measured in
different ways, among which dispositional optimism and optimistic explanatory style
are regarded as the two main contrasting approaches (Carver et al., 2010; Forgeard &
Seligman, 2012). No matter how optimism is conceptualized and measured, research
is uniform in indicating that optimism is bonded with beneficial characteristics:
happiness, achievement, health, and persistence. Considering all the direct and
indirect associations between optimism and personal and social benefits, it is not
surprising that optimism is reported to be relevant to clinical psychology. Results of
optimism interventions for depression have been both involved in the whole frame of
positive psychotherapy and taken as single treatment. The strength of optimism in
ameliorating depressive symptoms has received substantial empirical support (Csillik,
Aguerre, & Bay, 2012; Seligman et al., 2005; Sin et al., 2011).

Understanding Optimism
Chapter 7: Depression, positive psychology and optimism interventions 189
7.3.1 Attributional style in depression
To understand presumptions behind the relationship between optimism and
depression and to find out the mechanisms under which optimism interventions works
for depression treatment, it’s necessary to first illustrate the theoretical assumptions of
related optimism theories.
Attributional models of depression
The causes and consequences of depression have long occupied the attention of
psychologists and clinical practitioners. Before the application of Seligman’s (1976)
learned helplessness model of depression, most theories and research had been
developed by clinical psychologists. Based on findings in psychological experiments
on animals, Maier and Seligman (1976) developed principles of “learned
helplessness”, assuming that helplessness occurs when there is an expectation of
uncontrollable events. In humans, only certain individuals respond pessimistically
after being exposed to uncontrollable aversive events.
To account for these findings, the learned helplessness model was refined into
the reformulated learned helplessness theory (Abramson et al., 1978), in which the
dimensions of attributional style – internal-external (Heider, 1958), stable-unstable
(Weiner, 1974), and global-specific (Abramson et al., 1978) (especially for negative
events) – were emphasised. An internal attribution explains the cause of a negative
event to factors inside the self, whereas an external attribution explains the cause in
self-referent terms. The more internal one’s attribution for lack of control is, the more
self-esteem will be lowered. A stable attribution assigns the causes of a negative event
with constant and perpetual factors across time, whereas an unstable attribution
explains the event in terms of momentary and time-limited factors.
Understanding Optimism
Chapter 7: Depression, positive psychology and optimism interventions 190
Similarly, attributions may also vary in their degree of globality. A global
attribution assigns pervasive factors to causes of a negative event across different
situations, whereas a specific attribution explains a negative event in terms of
exceptional and situational factors. Accordingly, individuals who explain causes of
negative events with internal, stable, and global factors will be more vulnerable to
depression than those who provide attributions in terms of external, unstable, and
specific factors. Thus, the traditional study in depression was extended to the domains
of social and personality psychology, taking individual differences in attributional
style into account.
Within attributional models of depression, the attributions are seen to cause
distinct behavioural responses. For instance, low self-esteem is agreed to be linked
with internal attributions regarding negative events, while chronic depression may
result from stable attributions for negative events (Haugen & Lund, 1998; Peterson et
al., 1982). In this learned helplessness model, depression emerges as a consequence of
experience with uncontrollable negative events (Abramson et al., 1978).
To expand earlier concepts, the hopelessness theory of depression was
developed from the reformulated learned helplessness theory. In addition to the
original presumption of helplessness, the expectation for the occurrence of negative
outcomes was added to construct the core concept of hopelessness. According to the
hopelessness theory of depression, hopelessness is conceptualized as the expectancy
that future outcomes will be stable, global, and will negatively influence many aspects
of an individual’s life regardless of his or her efforts (Abramson et al., 1989). As a
result, hopelessness about the future constitutes a sufficient and proximal cause of a
subtype of depression, called hopelessness depression (Abramson et al., 1989). This
attributional model of depression has accumulated substantial evidence from
empirical studies (e.g. Vazquez et al., 2001).

Understanding Optimism
Chapter 7: Depression, positive psychology and optimism interventions 191
Though originally this depressive attributional style was applied mainly to
negative events, Seligman, Abramson, Semmel, and Von Baeyer (1979) suggested
that it might also play a part in explaining positive events. The authors found that
depressed students attributed good outcomes to more external and unstable factors
than did non-depressed students, and attributed more internal, stable, and global
causes to negative events than non-depressed students.
Studies on the attribution-depression relationship
Studies examining associations between attributional style and depression have been
conducted both from a cross-sectional perspective and a prospective approach,
involving adults, children, and adolescents. Cross-sectional studies propose that a
pessimistic attributional style is correlated with hopelessness and thus depression. On
the other hand, an optimistic explanatory style has been linked to protection from
depression. A pessimistic explanatory style predicts increases in depression over time
in different populations, such as lower-class women, children, and depressed patients
(Peterson & Seligman, 1984). Peterson and Vaidya (2001) reported that hopelessness
positively correlated with depression in their study with a group of college students (r
= .20).
In an earlier meta-analytic review, Sweeney, Anderson, and Bailey (1986)
reviewed 100 studies involving nearly 15,000 subjects. They found that attributions to
external, unstable, and specific causes for positive events and attributions to internal,
stable, and global factors for negative events were correlated with depression (average
r = -.15 and average r = .27 respectively). Haugen and Lund (1998) also reported a
negative correlation between ASQ Positive and depression (r = -.27), and a positive
correlation between ASQ Negative and depression (r = .20).

Understanding Optimism
Chapter 7: Depression, positive psychology and optimism interventions 192
Subsequent studies have incorporated structural equation modelling (SEM),
allowing a better understanding of the relationship between attributional style and
depression by contrasting competing theoretical models. For instance, Ledrich and
Gana (2013) reported a SEM analysis of the attribution-depression relationship in 334
participants. EASQ was used to measure attributional style. The correlation between
pessimistic attributions for negative events and depression was .36. In addition to the
composite score, each of the three attributional dimensions, internality (r = .15),
stability (r = .19), and globality (r = .28) also positively correlated with depressive
mood.
Prospective studies collect longitudinal data to analyse the attribution-
depression relationship, which has been shown to be persistent over time (for a review,
see Wise & Rosqvist, 2006). For instance, Iacoviello, Alloy, Abramson, Whitehouse,
and Hogan (2006) examined whether cognitive style predicts the future development
of depression. One hundred and fifty-nine college students were divided into a high-
risk group and a low-risk group based on their scores of attributional style and
dysfunctional attitudes at baseline, and then were assessed for their depressive
symptoms every six weeks across a period of 2.5 years. This study showed that
cognitive high-risk participants experienced more episodes of depression, more severe
episodes, and more chronic courses than low-risk participants. The results suggested
that negative attributional style may confer risk for the development of depressive
symptoms.
Further, attributing life events along the dimension of globality may play a
significant part in predicting depression. For example, in a recent 10-month follow-up
study (n = 3500), Pearson et al. (2015) found that attributions to global factors for
negative events clearly correlated with future depressed mood in young adults. This

Understanding Optimism
Chapter 7: Depression, positive psychology and optimism interventions 193
effect was independent of the other two dimensions of causal attribution, internality
and stability.
If it is true that a pessimistic attributional style interacts with adversity to
predict depression in the long run, does it mean that an optimistic explanatory style
interacting with positive events could reduce depressive symptoms? Haeffel and
Vargas (2011) tried to answer this question by asking 128 college students to
complete measures for depression, attibutional style (CSQ), and life events at baseline
and then reassessing them with the same questionnaires four weeks later. Results
indicated that participants with a pessimistic attributional style who experienced a
high ratio of stressful life events reported the greatest level of depressive symptoms.
However, they were buffered from depression and displayed similar levels of
depression with participants without a pessimistic explanatory style if they also
possessed an optimistic attributional style or had experienced many positive events.
These findings suggest that having an optimistic attributional style and experiencing
positive events may play a protective role against depressive symptoms.
Potential mediating roles of attributional style between depression and some
physical variables have been investigated. For instance, 23 depressed patients and 31
never-depressed controls completed the ASQ and a measure of sleep over a period of
seven days (P. L. Haynes, Ancoli-Israel, Walter, & McQuaid, 2012). Among the three
individual dimensions of attributional style, globality was found to mediate the
relationship between sleep disturbance (poor sleep continuity, delayed morning wake
time, and increased total time spent in bed) and depression.
The prospective relationship between attributional style and depression has
been reported in clinical settings as well. For instance, Sanjuán, Arranz, and Castro
(2012) conducted a two-wave longitudinal study in a group of 99 patients with
coronary heart disease. An adaption version of the original ASQ which contains only

Understanding Optimism
Chapter 7: Depression, positive psychology and optimism interventions 194
six negative events was used to assess attributional style. The globality dimension was
associated with both Time 1 and Time 2 depressive symptoms (r = .26 and r = .34
respectively), while the stability dimension was only correlated with Time 2
depression (r = .20). For the dimension of internality, no significant correlations with
either Time 1 or Time 2 depressive symptoms were found. Additionally, global
attributions predicted persistence of depressive symptoms eight weeks later. These
results suggested that attributing negative events to pervasive and global causes lead
to increased depressive symptoms.
Using both a cross-sectional approach and a prospective design, Fresco, Alloy,
and Reilly-Harrington (2006) examined the relationship between causal attributions
and depression across a period of four weeks. Two hundred and thirty-nine
undergraduates were divided into either a currently depressed/anxious group or a
normal control group, and completed self-reported measures of attributional style,
depression, life events, and mood disorders, as well as structured diagnostic
interviews in two time slots. Results showed that participants in the depressed group
scored higher in attributions for positive events than their counterparts in control
group. Attributional style moderated the relationship between the occurrence of life
events and changes in depressive symptoms from Time 1 to Time 2.
Studies conducted in children and adolescents support the attribution-
depression relationship as well. For instance, 295 secondary school students were
instructed to complete measures of attributional style, self-esteem, and depression
(Kurtovic, 2012). This study indicated that attributing academic failure to stable and
global causes correlated with higher depression (r = .17 and r = .20 respectively),
while attributing academic success along stable dimension correlated with lower
levels of depression (r = .15). Additionally, hopelessness correlated significantly with
depression (r = .58). In a meta-analytic review of attribution-depression studies

Understanding Optimism
Chapter 7: Depression, positive psychology and optimism interventions 195
conducted in children and adolescents (27 studies, 4,000 subjects), Joiner and Wagner
(1995) reported that attributional style scores clearly correlated with both self-
reported depression and with clinical depression (for overall composite scores,
average r = -.50; for positive events, average r = -.38; for negative events, average r
= .35).
7.3.2 Dispositional optimism and depression
Dispositional optimism has also been shown to be associated with depression.
According to the theory of dispositional optimism, being optimistic means having
favourable generalized expectations and continuing goal-pursuit for the future
(Scheier & Carver, 1993). Optimists expect good outcomes, which result in more
positive feelings and affections, while pessimists expect bad outcomes, and this yields
a relatively negative mix of feelings, such as anxiety, sadness, disappointment, and
anger (Scheier & Carver, 1992). Depression and distress sometimes occur due to these
negative feelings.
In a meta-analytic review of 56 studies (Andersson, 1996), the average
weighted correlation between dispositional optimism and depressive symptoms was -
.45. Peterson and Vaidya (2001) also reported that expectations (measured by the
LOT) were significantly correlated with depressive symptoms (r = -.55). Isaacowitz
(2005) addressed this issue in a wider range with three age groups (100 young, 86
middle-aged, and 94 older adults). The study reported that LOT optimism negatively
correlated with depressive symptoms across all three age groups (r = -.34, r = -.32,
and r = -.31 respectively), and LOT pessimism positively correlated with depression
in the middle-aged group (r = .29) and older adults group (r = .41). No significant
association between LOT pessimism and depressive symptoms of young adults was
found.

Understanding Optimism
Chapter 7: Depression, positive psychology and optimism interventions 196
Stressful life changes may play a role in the relationship between dispositional
optimism and depression. One study examined the relationship between dispositional
optimism and depression in a small group of postnatal women (n = 75). The results
showed that LOT optimism was inversely correlated with depression both in initial
assessment (r = -.41) and three weeks later (r = -.43) (Carver & Gaines, 1987).
Armbruster, Pieper, Klotsche, and Hoyer (2015) examined whether
dispositional optimism reliably predicts depression across a period of five years.
Participants (n = 4,046) were divided into five age groups (18-44, 45-54, 55-64, 65-74,
and 75-84). They were instructed to complete the LOT-R and a measure of depression
at three time points (baseline, 1-year follow-up, and 4-5 year follow-up). The authors
found that LOT optimism baseline scores could predict depression at both follow-ups
in the first four younger-age groups. LOT-R pessimism predicted depression at the
two follow-ups in the first three younger-age groups.
The genetic and environmental origins of the links between dispositional
optimism and depression have been investigated in some studies. For instance, Plomin
et al. (1992) administered measures of dispositional optimism, depression, and life
satisfaction in 500 twins (72 pairs of identical twins reared apart, 126 pairs of
identical twins reared together, 178 pairs of fraternal twins reared apart, and 146 pairs
of fraternal twins reared together). It showed that both LOT optimism and LOT
pessimism were significantly associated with depression (r = -.31 and r = .44
respectively).

Understanding Optimism
Chapter 7: Depression, positive psychology and optimism interventions 197
7.4 How to manipulate optimism?
Optimism-enhanced manipulations have been developed on the basis of the main
optimism approaches and implemented in numerous studies both in normal
populations and in clinical settings. Given the strong association between optimism
and depression, optimism interventions have been developed to promote optimistic
explanatory style and favourable expectations.
CBT-based optimism intervention: attributional retraining (AR)
In addition to Peterson et al. (1982)’s theory of attributional style, several other
attribution theories have been proposed. For example, the causal attribution theory of
Weiner (1985) specifically analyses the attributional style of students who are
vulnerable when searching for explanations of academic success and failure within
themselves, especially for negative events. According to Weiner’s proposal, all
attributions can be made along three dimensions: internality, stability, and
controllability. This 2 × 2 × 2 taxonomy offers eight possible causal attributions in
which any given explanation can be classified (Weiner, 1985).
Based on Weiner’s theory, attributional retraining (AR) has been developed to
help people to alter their maladaptive attributional style, reframe the way they think
about positive and negative life events, and develop more adaptive and self-helping
explanations for success and failure (Haynes, Perry, Stupnisky, & Daniels, 2009).
Most of the recent studies on AR have been conducted with college students, in whom
AR was found to have beneficial effects on cognition and academic performance (for
a review, see Haynes et al., 2009).

Understanding Optimism
Chapter 7: Depression, positive psychology and optimism interventions 198
Self-administered optimism training (SOT)
In addition to mainstream AR manipulations, Fresco et al. (2009) developed self-
administered optimism training (SOT) based on traditional Cognitive Behavioural
Therapy (Beck, 1976), the reformulated learned helplessness theory (Abramson et al.,
1978), and the AR protocols, aiming to reduce current levels of pessimistic
explanatory style which are believed to predict depressive symptoms (Metalsky et al.,
1993). Theoretically, SOT represents an AR intervention that emphasizes a person’s
attention to daily life events and their explanations for these events by means of daily
writing (Fresco et al., 2009).
During a typical SOT session designed by Fresco et al. (2009), participants are
instructed to spend around 10 minutes each day for a week to identify 5 positive and 5
negative events in their life, finding initial causes along the dimensions of internality,
stability, and globality for each event, then revise and reassess alternatives and more
adaptive attributions for these events along the same three dimensions after reflection.
The process is completed within 28 days. The SOT was found to be effective in
building an optimistic explanatory style and reducing depressive symptoms in at least
some college students who scored high in attributions for negative events (Fresco et
al., 2009).
Other CBT-based optimism intervention techniques
In addition to AR techniques, a variety of other CBT-based optimism interventions
have been developed. For example, Burns (1980) proposed the anti-pessimism sheet
technique, which targets the specific expectations an individual holds for a relevant
situation.
Riskind and colleagues (1996) contributed several optimism interventions
designed specifically to decrease pessimism or increase optimism. One such

Understanding Optimism
Chapter 7: Depression, positive psychology and optimism interventions 199
intervention helps the client to identify negative thinking and adopt a more adaptive
positive view. Positive visualization, which instructs the client to visually rehearse
attaining a positive outcome for a chosen negative event, was proposed as an
alternative technique for increasing optimism. The silver lining technique which was
described in this paper can be implemented more easily. Clients are instructed to
identify one genuinely positive element in one problematic situation. The technique of
pump priming was developed based on the principle of cognitive priming. This
technique aims to increase an individual’s ability to think and define situations
optimistically by priming the instantaneous approachability to working memory of
cognitive divisions that are demanded for optimism.
Positive writing and Best Possible Self (BPS)
King (2001) conducted a pioneering study in which participants were asked to
“imagine that everything has gone as well as it possibly could” (the Best Possible Self
condition, the BPS) and write about it for 20 minutes each day for four consecutive
days. This manipulation has been shown to be beneficial for promoting subject well-
being and has been replicated in two follow-up studies (Burton & King, 2004, 2008).
Within a group of third-year medical school students, the beneficial effects of writing
about emotions and goals were reported as well (Austenfeld et al., 2006).
Based on King’s study, the BPS imaginary exercise has been further used in
later studies of optimism intervention by many psychologists, with some alterations.
In the BPS intervention, participants normally are instructed to imagine and write
down some features (such as in the professional domain) that their future best possible
self should have. The interventions vary in time (from four days to four weeks), style
(writing or talking), administration (self-conducted or supervised by administrators),
and form (face-to-face or online).

Understanding Optimism
Chapter 7: Depression, positive psychology and optimism interventions 200
Theoretically, the BPS manipulation aims to (temporarily) increase positive
expectations for the future by means of an experimental manipulation, which is
related to the beneficial effects of dispositional optimism (Meevissen et al., 2011).
The mechanism underlying the beneficial effects of BPS on well-being was assumed
to be the optimists’ tendency to generate more vivid positive mental images of future
events than pessimists (Blackwell et al., 2013). Evidence from the neurobiological
study of optimism partly supports this assumption. Brain images reveal that optimism
is associated with greater activation of a brain area that is related to positive imagery
of future events (Sharot, Riccardi, Raio, & Phelps, 2007).
Semantic optimism priming
Semantic optimism priming was used to temporarily manipulate generalized
expectations in one study conducted by Fosnaugh et al. (2009). Participants were
given a packet of scrambled sentence tests including 15 items (11 of which were
related to optimism), and told to build a sentence with four of the five words
contained in each item. It was assumed that this manipulation would activate
optimistic thinking unconsciously. It revealed that this optimism intervention is
effective in promoting dispositional optimism.
7.5 Empirical studies of optimism interventions
Optimism has long been seen as a simple yet powerful way for a person to cope more
adaptively with stress (Nes & Segerstrom, 2006; Scheier & Carver, 1992). Though
optimism interventions have been mainly integrated with other positive activities in
most previous practices, single optimism-enhanced manipulations have been
conducted both in non-clinical populations and in clinical settings. Generally, research
has shown that optimism interventions are effective in enhancing well-being and

Understanding Optimism
Chapter 7: Depression, positive psychology and optimism interventions 201
reducing negative emotions (Austenfeld et al., 2006; Burton & King, 2004; Fosnaugh
et al., 2009; Littman-Ovadia & Nir, 2014; Meevissen et al., 2011).
7.5.1 Optimism interventions in nonclinical samples
Perry and colleagues have conducted a series of AR studies in college students
focusing on academic achievement (Haynes, Ruthig, Perry, Stupnisky, & Hall, 2006;
Perry, Hechter, Menec, & Weinberg, 1993; Perry & Penner, 1990; Ruthig, Perry, Hall,
& Hladkyj, 2004). In one of these studies (Ruthig et al., 2004), attribution retraining
was designed to improve academic motivation and achievement striving. The authors
found that the AR treatment group exhibited significantly lower test anxiety and
greater persistence in college courses than the control group. These types of studies
have shown that AR treatments are effective in fostering adaptive attibutional
thinking, positive academic motivation, and good academic performance (Haynes et
al., 2009). Riskind et al. (1996) introduced several AR-similar optimism training
methods and conducted these techniques in their study. They found that the optimism
training group reported more optimistic explanations, higher problem-solving self-
efficacy, and more positive cognition than the control group.
Because AR has been designed primarily to enhance student persistence
following possible academic failures, it has long been used to cultivate students’ more
adaptive attributions. The typical AR intervention instructs children to make a more
adaptive attribution, like lack of effort, instead of more pessimistic ones, like a lack of
ability, to their failure on academic tasks (Cecil & Medway, 1986). Most attribution
retraining techniques are more accessible to younger children compared with CBT-
based interventions, since they are much less cognitively demanding than cognitive
restructuring tasks. AR conducted in children has benefits in enhancing children’s
persistence in math problem-solving (Okolo, 1992), social competence (Aydin, 1988),
and reading tasks (Fowler & Peterson, 1981). However, the long-term effect of AR is

Understanding Optimism
Chapter 7: Depression, positive psychology and optimism interventions 202
unknown; positive attributions may be hard to maintain if children are frequently
faced with failures.
In addition to AR, other optimism manipulations have also been applied in
normal populations. For example, The benefits of positive writing life goals was
compared with expressive talking about life goals in one study (Harrist, Carlozzi,
McGovern, & Harrist, 2007). Comparing with the control group, both intervention
groups reported less negative emotions, and writing intervention was more effective
in enhancing positive emotions. Sheldon and Lyubomirsky (2006) revealed that the
BPS intervention is more beneficial than the gratitude treatment for increasing and
maintaining positive emotions.
Peters and colleagues adapted the original BPS technique and conducted a
series of studies of BPS intervention. Their studies employed a random-assignment,
placebo-controlled design, in which participants in the optimism intervention
condition imagined and wrote about their future best possible self in a personal, a
relational, and a professional domain, for five-minute intervals per day over a period
of two weeks. Participants in the control group imagined and wrote down their daily
activities (Peters, Flink, Boersma, & Linton, 2010). In one study (Peters et al., 2010),
the BPS group exhibited larger increases in positive affect and positive future
expectations compared with the control group. BPS imagery caused a boost in
optimism, and the effects remained two weeks after the intervention ended. This result
was replicated in another study conducted by Meevissen & Peters (Meevissen et al.,
2011).
The benefits of thinking and writing optimistically were also replicated in
longer-term follow-up studies. For example, in one eight-month-long experimental
study, participants imagined and wrote their future BPS for 15 minutes a week over a
period of eight weeks. Individuals in the control condition listed what they did in the

Understanding Optimism
Chapter 7: Depression, positive psychology and optimism interventions 203
previous seven days for 15 minutes a week. Notably, significant differences in
happiness between the intervention and comparison groups remained even six months
later (Lyubomirsky et al., 2011).
Evidence from BPS conducted online also supports its benefits in improving
psychological well-being. For example, Shapira and Mongrain (2010) conducted an
on-line intervention study, in which participants were randomly allocated into three
groups (BPS was one of the two intervention groups). The results showed that
individuals in the optimism condition were less depressed for up to three months and
were happier up to six months later compared to participants in the control condition.
Even self-administered optimism-cultivation activity is beneficial in reducing
negative emotions. For example, Littman-Ovadia and Nir (2014) adapted the three-
good-thing intervention to a brief daily self-administered optimism intervention,
which instructed the participants to “Think of three good things (items, people or
events) waiting for you tomorrow. Write them down. Choose one of them and try to
experience and maintain the sincere heart-felt feelings associated with it for five
minutes”. The intervention group did this practice for six consecutive days. This daily
optimism intervention effectively reduced pessimism, negative affect, and emotional
exhaustion at post-test and one month follow-ups.
In a study with undergraduate students, two different optimism manipulations,
optimistic orientation and optimism priming, were examined. It was found that both
interventions produced modest increases on a dispositional optimism measure and a
situational optimism measure, unlike in the control group (Fosnaugh et al., 2009).

Understanding Optimism
Chapter 7: Depression, positive psychology and optimism interventions 204
7.5.2 Optimism intervention in clinical settings
Optimism intervention studies for alleviating depressive symptoms
Though diverse optimism interventions have been shown to be effective in promoting
positive emotions and reducing pessimism, very few optimism cultivation studies
have been conducted to directly decrease depressive symptoms. In the following three
rare examples, Self-Administered Optimism Training (SOT) and Attibutional
Retraining (AR), which have been developed based on the attributional theory of
depression, have demonstrated promising results in treating depression. In addition,
an adapted online optimism intervention study has also shown that positive optimism-
enhanced activities are effective in reducing depressive symptoms.
Fresco et al. (2009) randomly assigned 112 participants with a pessimistic
explanatory style and depressive symptoms (measured by BDI) into a SOT
experimental group or a no-treatment control group. Individuals in the intervention
group received 10 minutes of instruction concerning self-administering of optimistic
explanatory style, and then engaged in self-administered optimism training every day
for 28 days, while participants in the control condition were not involved in any tasks.
Participants in the intervention group reported a significant drop in their depressive
symptoms.
Sharifi, Hajiheidari, Khorvash, and Mirabdollahi (2013) examined the
effectiveness of a six-week attributional retraining intervention (two sessions per
week, forty-five minutes per session) on reducing depression and anxiety in 32
women who suffered from miscarriage. Participants were randomly assigned to either
an intervention group or a control group. Depression and anxiety were assessed at
three time points: pre-test, post-test, and five-week follow-up. Results demonstrated

Understanding Optimism
Chapter 7: Depression, positive psychology and optimism interventions 205
that participants in the intervention group scored lower in depressive symptoms than
their counterparts in the control group both in the post-test and the follow-up.
Optimism interventions conducted online have also been shown to be
beneficial in ameliorating depressive symptoms. Sergeant and Mongrain (2014)
conducted an online optimism intervention over a period of three weeks and collected
two-month follow-up data. Participants (n = 466) were randomly assigned to the
optimism intervention group or the control group. Participants in the intervention
group were instructed to perform several optimism techniques, including “listing five
things that made them feel like their life was enjoyable, enriching, and/or worthwhile”,
listing “three things that could help them see the bright side of a difficult situation”,
and describing briefly a goal that “they would like to achieve in the next day or two”
with “steps they would like to meet this goal”. By contrast, participants in the control
condition were asked to describe their daily activities. Depression, dispositional
optimism, and happiness were measured. Results indicated that online optimism
cultivation practice was effective in decreasing depressive symptoms and promoting
happiness immediately and in the one- and two-month follow-ups, especially for
pessimists.
Optimism interventions in other clinical samples
Stanton et al. (2002) carried out a pioneering study on the written expression of
positive emotions within a group of breast cancer patients. The participants were
instructed to join a four-session writing task, including writing about their “positive
thoughts and feelings regarding their experience with breast cancer”. Patients who
wrote about the positive consequences of their experience had significantly fewer
negative physical symptoms and fewer medical appointments for cancer-related
morbidities at three months than did the control group. This finding was duplicated in

Understanding Optimism
Chapter 7: Depression, positive psychology and optimism interventions 206
a later study conducted within another group of breast cancer patients (Low, Stanton,
& Danoff-Burg, 2006).
7.5.3 Optimism interventions in children and adolescents
Most studies on optimism intervention are conducted on adults, though there are still
some attempts in cultivating optimism and preventing depression in childhood and
adolescence. One such attempt, the Penn Resiliency Program (PRP), (Jaycox, Reivich,
Gillham, & Seligman, 1994) is comprised of cognitive-behavioral based interventions
targeting early adolescence (11-14 years old). Teachers and counselors at school
deliver this program. Intervention techniques have been adapted from adult CBT
(Beck, 1976), including self-disputing, goal setting, assertiveness, and negotiation
training. All these intervention techniques aim to help children to learn to challenge
their pessimistic explanatory style and develop adequate problem solving skills in
social life (Gillham & Reivich, 2004).
PRP has been shown to be effective in reducing moderate to severe depressive
symptoms after a two year follow-up (Gillham, Reivich, Jaycox, & Seligman, 1995).
Children who had completed the PRP were more inclined to show an optimistic
attributional style and less likely to be depressed compared with the control group
(Gillham & Reivich, 2004; Gillham et al., 1995). Results of several studies conducted
in Chinese samples also support the beneficial influence of the PRP in reducing
depressive symptoms and cultivating optimistic explanatory style in children (Yu &
Seligman, 2002). However, the effectiveness of the PRP has been challenged, since
some of the participants (one of the three schools) reported no significant decrease in
depressive symptoms after a three-year follow-up (Gillham et al., 2007). Cultivating
optimism techniques should be conducted with caution, considering the potential
influences of other individual and social factors.

Understanding Optimism
Chapter 7: Depression, positive psychology and optimism interventions 207
Summary
Taken together, a diverse amount of optimism interventions have emerged to provide
possible answers to the question, how does one enhance well-being and relieve
suffering? AR and SOT were designed and developed based on attributional theories.
Generally, AR has been mainly conducted in academic backgrounds and has shown
beneficial effects on academic performance. By contrast, SOT aims to reduce current
levels of pessimistic attributional style that characterise depression. The BPS aims to
increase positive expectations which can be effective in boosting positive emotions
and in turn decreasing depressive symptoms.
7.6 Research questions
Using optimism interventions to decrease depressive symptoms
Traditionally, Cognitive Behavioural Therapy emphasised the influence of specific
beliefs and thoughts instead of focusing on broad cognitive biases such as explanatory
style and dispositional optimism, without examining the possibility of individual
differences in optimism (Pretzer & Walsh, 2001). The situation has recently changed
since psychologists began to understand optimism from a cognitive perspective, and
therefore including the approach of attributional style and dispositional optimism.
Previous research has shown that both SOT and BPS are effective in
promoting psychological well-being and reducing depressive symptoms. Applications
of these two optimism manipulations in empirical studies have yielded positive results
confirming the benefits of optimism interventions on enhancing well-being. However,
very little systematic work has been done to investigate the advantageous effects of
optimism interventions on psychotherapy applications in concrete settings. The

Understanding Optimism
Chapter 7: Depression, positive psychology and optimism interventions 208
question of how to convert the benefits of optimism interventions to systematic and
effective activities diminishing depressive symptoms has not been addressed
adequately. Optimism intervention studies aimed particularly at decreasing depressive
symptoms and those clinically diagnosed with depressive disorders are needed.
Additionally, manipulating optimism has been conducted separately, aimed at
addressing general expectations or attributional style. There is no research including
both kinds of optimism interventions conducted so far to my knowledge. Since
previous research has shown that both optimism techniques are effective in promoting
psychological well-being and reducing depressive symptoms and theoretical
connections between attributional style and dispositional optimism have been found in
our early-stage analysis, the possibility of combining both SOT and BPS in one
optimism intervention study raises the possibility of fully understanding the
effectiveness of optimism interventions in depression treatment.
Participants: first-year college students
For my study of optimism interventions, young adults entering their first year of
university were chosen as targeted participants. Maladaptation of freshmen to
university life has been given much attention recently. Starting college is a
challenging time for first-year students and is often characterized by negative
emotions, such as depression and anxiety, which can negatively affect quality of life
and academic performance. First-year students typically experience a stressful life due
to a variety of causes, such as the challenges of living in a different and unfamiliar
environment (Negovan & Bagana, 2011). This life transition from late adolescence to
early adulthood may bring a series of difficult situations to deal with.
All these factors may increase first-year students’ vulnerability to depression.
Brandy, Penckofer, Solari-Twadell, and Velsor-Friedrich (2015) reported that 45% of

Understanding Optimism
Chapter 7: Depression, positive psychology and optimism interventions 209
students demonstrated greater than average levels of stress and 48% reported
clinically significant depressive symptomology in one freshmen sample (N = 188). In
a sample of veterinary medical students (N = 240), data showed that 49%, 65%, and
69% of the participants reported depression levels at or above the clinical cut-off
across their first three semesters of study. Results indicated that transitional stress
predicted increased depression and anxiety symptoms and decreased life satisfaction
(Reisbig et al., 2012).
Some research has begun to investigate the role of optimism in psychological
adjustment during life transitions such as this. For example, Brissette et al. (2002)
reported that higher levels of dispositional optimism, assessed at the beginning of the
first semester of university, was prospectively associated with smaller increases in
stress and depression over the course of the first semester. Chemers et al. (2001)
found that LOT scores were strongly correlated with academic performance and
personal adjustment in a sample of first-year university students (N = 256). Similarly,
in a much larger sample of college freshmen (n = 2,189), L. S. Nes et al. (2009) found
that optimistic students had better psychological adjustment and motivation than
pessimists in the period of college transition. Students with a higher level of
dispositional optimism were more likely to return to school for the second year, with
increased motivation and decreased distress.
Though there is no single study that has directly examined the relationship
between attributional style and depression in first-year college students, it has been
reported that students who had pessimistic attributions for their academic failure
received lower exam scores than their freshmen counterparts who held an optimistic
attributional style in explaining academic failure (Peterson & Barrett, 1987).
Academic stress has been found to be a strong predictor of depression and anxiety in a
group of veterinary medical students during their first three semesters (Reisbig et al.,

Understanding Optimism
Chapter 7: Depression, positive psychology and optimism interventions 210
2012). Based on these findings concerning the influences of attributional style and
dispositional optimism on academic performance, depression, and psychological
adjustment in first-year college students, interventions targeting cultivating optimism
in this specific group should be considered for decreasing depressive symptoms to
enhance their college experience.
My aim was to test whether manipulations based on optimism theories might
alleviate depressive symptoms in first-year college students. I hypothesised that
optimism interventions can produce stronger and lasting benefits on psychological
well-being, especially in reducing depressive symptoms of participants in the
experimental condition than in the control condition.

Understanding Optimism
Chapter 8: Optimism interventions for depression in first-year college students 211
Chapter 8: Optimism interventions for depression in first-year college students
8.1 Study 1: individual optimism interventions with depression
8.1.1 Intervention designs
Corresponding respectively to dispositional optimism and explanatory style, two
optimism manipulation techniques were adopted in my interventions for depression.
One is the Best Possible Self (BPS) technique adapted from several previous BPS
studies. As in the BPS intervention, participants normally are instructed to imagine
and write down some aspects (such as professional domain) that their future best
possible self should have. The interventions were variant in time (from 4 days to 4
weeks), style (writing or talking), administration (self-conducted or supervised by
administrators), domains of writing (three or more), and form of intervention (face to
face or online). Borrowing from Lyubomirsky et al. (2011)’s BPS paradigm, students
in my study were instructed to write about their best possible future in each of the 7
domains (romantic life, educational attainment, hobbies or personal interest, family
life, career situation, social life, and physical/mental health). Instead of doing BPS
every week, students were asked to do these positive writings on a daily basis across
a week, similarly to the BPS study of Peters, Meevissen, and Hanssen (2013).
The other optimism activity is the self-administered optimism training (SOT)
adapted from Fresco et al. (2009). In their SOT study, participants were instructed to
spend around 10 minutes each day for a week to identify five positive and five
negative events in their life, finding initial causes along the dimensions of internality,
stability, and globality for each event, then revising and reassessing alternative and
more adaptive attributions for these events along the same three dimensions after
some reflection. The whole procession of SOT is completed within 28 days. We
adapted Fresco et al. (2009)’s SOT into a shorter version of 7 days. Instead of
identifying five positive and five negative events in their life each day, participants
are asked to identify three positive and three negative events.

Understanding Optimism
Chapter 8: Optimism interventions for depression in first-year college students 212
Previously, SOT was applied in one study aiming at reducing depressive
symptoms, and BPS was adopted only in intervention studies of nonclinical samples
to my knowledge. In addition to SOT and BPS, face-to-face individual
psychotherapy was conducted in my study on the basis of individual positive
psychotherapy with mild-to-moderate depression (Seligman et al., 2006). In total, the
whole intervention consisted of three sessions, in which each consists of a 45-
minutes face-to-face individual counselling.
The first session is SOT practice. Before SOT, every participant in the
intervention group receives an individual counselling, in which the counsellor
introduces basic theory of attributional style, and gives instructions of the SOT
procedure. Then the participant is asked to do homework. The homework contains
approximately 15 minutes of SOT every day in the following week. The daily SOT
is completed following three steps: (a) self-monitoring daily 3 negative and 3
positive events; (b) identifying the initial cause, and rating that cause along the
dimensions of internality, stability and globality; (c) brainstorming additional or
alternate causes; and (d) arriving at a revised cause that was also rated along the
dimensions of internality, stability, and globality.
The second session is BPS exercise. Similar as SOT session, every participant
in the intervention group receives a 45-minute individual counselling, in which the
counsellor helps the participant identify their core values, they were asked to “think
about how they wanted to be remembered at the end of their lives by their loved ones”
(Peters et al., 2013). Home work is assigned at the end of the individual counselling.
The participant is asked to imagine and write about his or her life if everything
unfolded as he or she wanted. The participant is instructed to envisage that perhaps
he or she has worked diligently and achieved his or her most important dreams. Once
this image had been invoked, the participant wrote about this future for 15 minutes in
one of 7 aspects, including best possible future romantic life, educational attainment,
hobbies or personal interest, family life, career situation, social life, and
physical/mental health. These tasks were required to be completed on a daily basis in
the following week.

Understanding Optimism
Chapter 8: Optimism interventions for depression in first-year college students 213
The third session is for summary and post-intervention test. The counsellor
and the participant review progress of intervention and discuss gains and
maintenance of these two positive activities. At the end, the participant completes
measures of depression, attributional style, dispositional optimism, and subjective
well-being (life satisfaction).
Hypotheses
Our first hypothesis concerned the beneficial effects of optimism intervention on
depressive symptoms. I predicted that participants in the experimental group would
experience lower levels of depression outcomes by the end of the intervention than
the control group, and that these beneficial effects might even be maintained at the
one-month and three-month follow-ups.
Similarly, our second hypothesis was that for the intervention group, a
decrease in depressive symptoms would be accompanied by the corresponding
improvement in optimistic explanatory style, especially for attributions of negative
events, not only immediately after the manipulations, but also the following three
months after the interventions had ended.
Also, I predicted that positive activities would bolster subjective well-being
(life satisfaction) and dispositional optimism and decrease dispositional pessimism
immediately after the intervention, and these improvements might last in the follow-
up periods.
8.1.2 Method
Participants
Fifty-two undergraduate students in Sample 5 (see Chapter 1.5.4 for details) took
part in this study. All participants were native Chinese speakers with ages ranging
from 17 to 21 (M = 18.50, SD = 0.71). They were randomly divided into one of the
two conditions: an experimental group (n = 26) and a control group (n = 26). There
were no significant differences in gender, age, ethnicity, and year of education
between these two conditions.

Understanding Optimism
Chapter 8: Optimism interventions for depression in first-year college students 214
Not all participants completed the whole procedure. Three participants
dropped out of the intervention group and two dropped out of the control group. As a
result, there were 23 participants in the intervention group and 24 participants in the
control group available for the final data analysis (M = 19.07, SD = 0.86; 19 males
and 28 females). There were no significant differences in gender, age, ethnicity,
years of education, or pre-test measures between those who remained in this study
and those who left.
Measures
Attributional style was measured using a Chinese version of the ASQ (Zhang, 2006).
The ASQ takes on average 15 minutes to complete. Composite attributional styles
were calculated separately for positive and negative events. Higher scores for
positive events and a lower score for negative events on any area demonstrates a
more “optimistic” attributional style for that domain, i.e., more external, temporary
and specific for negative events, and more internal, stable and global for positive
events. Cronbach’sαof the pre-test for the scale was 0.85 for negative events and
0.66 for positive events; for the post-test, 0.82 for negative events and 0.89 for
positive events; and for the three-mohth follow-up, 0.86 for negative events and 0.86
for positive events.
Dispositional optimism was measured using a Chinese version of the Life
Orientation Test-Revised (Lai & Yue, 2000). Subjects were scored for two separate
composite scores, LOT-R Optimism and LOT-R Pessimism. Cronbach’sαfor the
pre-test was 0.74 for dispositional optimism and 0.62 for dispositional pessimism; for
the post-test, 0.47 for LOT-R Optimism and 0.72 for LOT-R Pessimism; for the one-
month follow-up, 0.74 for LOT-R Optimism and 0.62 for LOT-R Pessimism; and for
the three-month follow-up, 0.62 for LOT-R Optimism and 0.52 for LOT-R
Pessimism.
Subjective well-being was assessed using a Chinese version of Satisfaction
with Life Scale (SWLS; Chen & Zhang, 2004). Subjects were scored for total

Understanding Optimism
Chapter 8: Optimism interventions for depression in first-year college students 215
optimism scores. Cronbach’sαfor the pre-test was 0.82; for the post-test, 0.83; for
the one-month follow-up, 0.85; and for the three-month follow-up, 0.80.
A Chinese version of the Beck Depression Inventory (BDI; Chan & Tsoi,
1984) was used to measure depression. Cronbach’sαfor the pre-test was 0.83; for
the post-test, 0.82; for the one-month follow-up, 0.87; and for the three-month
follow-up, 0.83.
Procedure
Recruiting participants. To conduct the present optimism intervention pilot
study, a general sample was recruited from all 980 freshmen in China Youth
University of Political Studies. To test mental health of first-year students, Self-
Reporting Inventory 90 (SCL-90; Derogatis & Cleary, 1977; Derogatis, S, Covi, &
Rickeis, 1973) was conducted in the end of the first month of their entry into the
university. According to the generally accepted criterion of SCL-90, a total score of
160 and above or a score of 2 and above for any single dimension was seen as
indicators of possible mental illness. Accordingly, a total SCL-90 score of 160 or
above and a score of 2 or above in depression were utilized in selecting eligible
participants. A total of 85 students were selected as a general sample based on the
criterion above and were contacted by teachers of the University Consulting Centre.
The research was presented as a study involving activities designed to develop
personal strength and psychological well-being. Finally, 52 students agreed to take
part in this study.
Baseline assessment. Participants completed the first set of questionnaires at
their convenience within a week. Baseline assessments included a consent form,
demographic questions, and measures of depression, attributional style, dispositional
optimism, and SWB (life satisfaction). The consent form informed students of their
rights as participants in this study. They then were asked to provide general
background information, such as gender, ethnicity, age, and married status. Three
days after completion of the baseline questionnaires, participants began the
intervention.

Understanding Optimism
Chapter 8: Optimism interventions for depression in first-year college students 216
Optimism interventions. Students were randomly assigned to either an
experimental condition or a control condition for a period of up to three weeks.
For the experimental condition, optimism interventions took place over three
sessions (each session lasts for about 40 minutes) over three consecutive weeks.
Individual face-to-face counselling was conducted by three qualified counsellors in
the University Consulting Centre. They followed the intervention manual to conduct
all the intervention sessions. A notebook was assigned to participants in the
intervention group in the first session for completing their homework. The
homework can be written down on the notebook or be printed out. In the intervention
period, participants in the control group were not involved in any tasks related to this
study.
Time 1, time 2, and time 3 assessments. Optimism intervention participants
completed the measure battery in the final session, and control participants were
scheduled a similar time for their Time 1 measure. Then participants in both
conditions were scheduled a time to return for their Time 2 (one-month follow-up),
and Time 3 (three-month follow-up) packet of self-report measures. Because of the
length of time it took to take the questionnaire (approximately 15 minutes), the ASQ
was only re-administered at Time 1 and Time 3.
8.1.3 Results
Baseline descriptive
An independent samples t-test on baseline scores between the intervention group and
control group revealed no significant differences between the two groups on any of
the measures (LOT-R Optimism, LOT-R Pessimism, ASQ Negative, ASQ Positive,
SWLS, and BDI), indicating that randomization was successful.
Table 8.1 shows the descriptives and correlations of baseline scores for the
whole sample on the LOT-R, ASQ, SWLS, and BDI. In line with at least one
previous finding (Isaacowitz & Seligman, 2002), both ASQ Negative and ASQ
Positive did not significantly correlate either LOT-R Optimism or LOT-R Pessimism,
indicating that explanatory style of life events may be uncorrelated to general

Understanding Optimism
Chapter 8: Optimism interventions for depression in first-year college students 217
expectancies of future events. As expected, the LOT-R Pessimism was positively
correlated with BDI (r = 0.29) and negatively correlated with SWLS (r = -0.41), and
BDI was negatively correlated with SWLS (r = -0.38).
Measures Descriptives Correlations
Mean SD 1 2 3 4 6
1. BDI 20.60 8.73
2. LOT-R Optimism 6.28 2.50 -0.25
3. LOT-R Pessimism 5.20 2.22 0.29* -0.41**
4. SWLS 15.66 6.10 -0.38** 0.13 -0.19
5. ASQ Negative 13.64 2.06 -0.07 0.06 0.24 0.09
6. ASQ Positive 15.15 1.42 0.28 -0.05 0.24 -0.17 0.07
Table 8.1: Descriptives and intercorrelations between measures at baseline.
* p < 0.05. ** p < 0.01.
Intervention effects: immediate and longer term changes
Means and standards deviations for all measures for both two conditions from
baseline to post-interventions, as well as to one-month follow-up and three-month
follow-up are presented in Table 8.2. Changes for all measures for both groups in
four time-points are illustrated in Figures 8.1-8.6 (based on standardized scores).

Understanding Optimism
Chapter 8: Optimism interventions for depression in first-year college students 218
Measures Pre-test Post-test 1-month Follow-up 3-month Follow-up
Mean SD Mean SD Mean SD Mean SD
Intervention group
BDI 20.09 8.90 11.39 6.82 11.57 6.85 11.00 4.94
LOT-R Optimism 6.26 2.61 8.09 1.78 7.91 2.25 7.57 1.16
LOT-R Pessimism 5.17 2.25 4.48 1.75 4.43 1.85 4.65 1.56
SWLS 15.61 6.29 19.70 4.95 21.39 5.68 19.35 6.03
ASQ Negative 13.59 1.86 12.99 1.88 12.64 2.20
ASQ Positive 15.31 1.44 16.11 1.45 15.49 1.69
Control group
BDI 21.08 8.72 21.58 5.56 17.33 8.05 18.04 8.30
LOT-R Optimism 6.29 2.44 7.29 2.05 6.92 2.06 7.08 1.79
LOT-R Pessimism 5.42 2.22 5.33 2.24 5.25 1.98 4.92 1.86
SWLS 15.71 6.05 18.33 6.65 19.67 6.95 18.42 4.66
ASQ Negative 13.69 2.28 13.82 1.75 14.22 1.80
ASQ Positive 14.99 1.42 14.64 2.09 14.85 1.94
Table 8.2: Means and Standard Deviations of outcome measures by condition at all
time-points.
Figure 8.1: Depression as measure by the BDI at baseline, at post-intervention, 1-
month follow-up, and 3-month follow-up per condition.
-0.80
-0.60
-0.40
-0.20
0.00
0.20
0.40
0.60
0.80
Pre Post 1m 3m
intervention group
control group

Understanding Optimism
Chapter 8: Optimism interventions for depression in first-year college students 219
Figure 8.2: Dispositional Optimism as measure by the LOT-R at baseline, at post-
intervention, 1-month follow-up, and 3-month follow-up per condition.
Figure 8.3: Dispositional Pessimism as measure by the LOT-R at baseline, at post-
intervention, 1-month follow-up, and 3-month follow-up per condition.
-0.50
-0.40
-0.30
-0.20
-0.10
0.00
0.10
0.20
0.30
0.40
0.50
Pre Post 1m 3m
intervention group
control group
-0.30
-0.20
-0.10
0.00
0.10
0.20
0.30
Pre Post 1m 3m
intervention group
control group

Understanding Optimism
Chapter 8: Optimism interventions for depression in first-year college students 220
Figure 8.4. Subjective well-being as measure by the SWLS at baseline, at post-
intervention, 1-month follow-up, and 3-month follow-up per condition.
Figure 8.5. Attributional style for negative events as measure by the ASQ at baseline,
at post-intervention and 3-month follow-up per condition.
-0.60
-0.40
-0.20
0.00
0.20
0.40
0.60
Pre Post 1m 3m
intervention group
control group
-0.50
-0.40
-0.30
-0.20
-0.10
0.00
0.10
0.20
0.30
0.40
Pre Post 3mIntervention Group
Control Group

Understanding Optimism
Chapter 8: Optimism interventions for depression in first-year college students 221
Figure 8.6: Attributional style for positive events as measure by the ASQ at baseline,
at post-intervention and 3-month follow-up per condition.
Immediate post-intervention
Right after the completion of the three-week intervention, supporting our first
hypothesis, students in the experimental group reported a greater decrease in
depressive symptoms relative to students in the control group (see Figure 8.1), t(45)
= -5.63, p < .001. However, although participants in the intervention group displayed
a tread toward a greater increase in LOT-R Optimism and a greater decrease in LOT-
R Pessimism relative to the control group right after the intervention (see Figure 8.2
and Figure 8.3), two-tailed t tests showed that the experimental group and the control
group did not significantly differ on either LOT-R Optimism or LOT-R Pessimism.
Similarly, as displayed in Figure 8.4, although intervention group participants were
still showing a trend toward greater subjective well-being gains compared with the
control group, it was not significant.
Participants in the experimental group reported a greater increase in
explanatory style for positive events relative to participants in the control group (see
Figure 8.6), t(45) = 2.79, p = .008. However, comparison of the ASQ-negative
-0.40
-0.30
-0.20
-0.10
0.00
0.10
0.20
0.30
0.40
0.50
0.60
Pre Post 3m
Intervention Group
Control Group
Understanding Optimism
Chapter 8: Optimism interventions for depression in first-year college students 222
contrasting the intervention group with the control group failed to reach statistical
significance, though participants in the experimental group displayed a trend toward
a decrease in explanatory style for negative events while the control group displayed
a trend toward increase (see Figure 8.5).
Follow-ups
As expected, again supporting our most important prediction, depression scores of
the intervention group were much lower than those in the control group, t(45) = -2.64,
p = .01, though depressive symptoms in the control group also experienced a trend of
slight decrease (see Figure 8.1); and this significant difference was even bigger three
months after the intervention had ended, t(45) = -3.52, p = .001.
The comparison of LOT-R Optimism, LOT-R Pessimism, and SWLS
contrasting the experimental group with the control group failed to reach statistical
significance in either the one-month follow-up or the three-month follow-up.
Although participants who had completed the optimism intervention displayed a
trend toward greater increases in life satisfaction relative to the control group, one
month after the intervention had ended (see Figure 8.4), this difference did not reach
statistical significance. For LOT-R Optimism, students in the intervention group
showed trend of decreas one month and also three months after the intervention had
ended, while their counterparts in the control group were showing a trend of losses in
the one-month follow-up and then a trend of gains in the three-month follow-up.
That is, the optimism scores of the control group in the one-month follow-up was
lower than in post-intervention, then the level of optimism increased in the three-
month follow-up compared with the one-month follow up. (see Figure 8.2). however,
scores of LOT-R Pessimism in the one-month follow-up were lower than in post-
intervention for both the experimental group and the control group. For the three-
month follow-up, the intervention group showed an increase in LOT-R Pessimism
scores, while the control group showed an increase (see Figure 8.3). The changes and
differences in both LOT-R Optimism and LOT-R Pessimism were not significant.
Understanding Optimism
Chapter 8: Optimism interventions for depression in first-year college students 223
Explanatory style as measured by the ASQ showed different changing
patterns for positive and negative events three months after the optimism intervention.
Specifically, for the ASQ-Negative, students in the experimental group showed
decreased scores, while the control group students showed an increase (see Figure
8.5), and as a result the intervention group participants reported more optimistic
explanatory styles for negative events than their counterparts in the control group,
t(45) = -2.68, p = .01. However, a comparison between the intervention group and
the control group on the ASQ-positive failed to reach statistical significance. It
showed that participants in the experimental group displayed a trend toward
decreased scores, while the control group displayed a trend of slightly increased
scores (see Figure 8.6). Different changing patterns between explanatory style for
positive and negative events were consistent with previous findings of the ASQ
structure; attributional biases to positive events and to negative events emerged as
uncorrelated in the joint model (see Chapter 2.1).
8.1.4 Discussion
Results provided partial confirmatory support for the hypotheses. They indicate that
at post-intervention, one month and three months following the intervention,
individuals in the optimism condition were less depressed than those in the non-
treatment control condition. This provides preliminary evidence of the effectiveness
of optimism manipulations on reducing depressive symptoms. Data analysis also
revealed that positive activities in optimism were beneficial in developing optimistic
explanatory styles, especially for attributions for negative events. Overall, these
results are in line with previous findings that optimistic thinking can have
advantageous psychological benefits (Fresco et al., 2009; King, 2001). The results
indicate that these positive activities can lead to sustained increase in optimism and
decrease in depressive symptoms. Moreover, the effects remained one month and
three months later after the intervention had ended.
A number of potential active elements in the positive, future-oriented optimism
intervention may have contributed to these positive outcomes, such as the feeling of

Understanding Optimism
Chapter 8: Optimism interventions for depression in first-year college students 224
attentive communication, positive re-evaluation of life events, and active arousal of
expectations.
Participants in the intervention group did not experience higher levels of
dispositional optimism or life satisfaction following the intervention period. There
are several possible reasons for this.
First, the sample size was rather small in total (N = 47). The results showed that
participants who had completed the optimism intervention generally displayed a
trend toward greater increases in dispositional optimism and life satisfaction relative
to the control group immediately and one month after the intervention, but the
differences did not reach statistical significance. Second, the general sample was
selected based on a total SCL-90 score of 160 or above and a score of 2 or above in
depression. Since depression and psychological dysfunction were utilized in
selecting eligible participants, it is possible that the optimism interventions may be
more effective for decreasing depressive symptoms than for increasing positive
feelings and general expectations, though benefits in decreasing depression have
been gained though boosting positive affections. Finally, it has been theoretically and
empirically widely accepted in positive psychology that relieving negative feelings
and increasing positive feelings are two separate endeavours (Seligman &
Csikszentmihalyi, 2000; Seligman et al., 2005).
Altogether, the current investigation indicated that optimism manipulations over
a period of two weeks led to significantly larger improvements in depressive
symptoms and increase in optimistic explanatory style compared to not receiving any
treatment. A different pattern emerged for short-term and long-term effects, such that
a relatively large reduction in depressive symptoms occurred immediately after the
intervention period, whereas the one-month and three-month follow-ups featured
stable levels of depression.

Understanding Optimism
Chapter 8: Optimism interventions for depression in first-year college students 225
Further questions
In this pilot study, instead of conducting group optimism interventions that have been
mainly applied in previous research, an individual approach with face-to-face
counselling sessions was used. As results have shown, this individual intervention
was effective in decreasing depressive symptoms and in enhancing optimistic
attributional style. However, the way in which self-administered positive activities
and individual counselling were combined made it unclear what might be the cause
of those benefits. Whether it was the self-administered optimism interventions or the
individual consulting session is an unresolved question.
Additionally, the possibility of social desirability and demand effects when
students were keen on making good impressions to the counsellors might also be a
factor that should be considered. Moreover, though no-treatment control design has
been used in previous studies, it is more plausible to apply ‘placebo’-treatment
control design in intervention studies.
8.2 Study 2: group optimism interventions with depression
8.2.1 Intervention designs
Considering the unresolved questions from Study 1, I conducted a second study in
which purely self-administered optimism interventions were applied in first-year
college students with mild-to-moderate depressive symptoms. Two changes were
made in Study 2. The first was that the individual counselling sessions were excluded
in the experimental condition. The second change was that participants in the control
condition were asked to list their daily activities instead of doing nothing.
As in Study 1, optimism interventions in Study 2 consisted of two optimism
manipulation techniques, namely BPS and SOT. Participants were instructed to
complete SOT in the first week, and then complete BPS in the second week on a self-
administered basis.

Understanding Optimism
Chapter 8: Optimism interventions for depression in first-year college students 226
Hypothesis
My first hypothesis concerned the beneficial effects of the optimism intervention on
depressive symptoms. I predicted that participants in the experimental group would
have lower levels of depression outcomes by the end of the intervention, and that
these beneficial effects might even be maintained at the one-month and three-month
follow-ups.
Similarly, my second hypothesis was that for the intervention group, a
decrease in depressive symptoms would be accompanied by a corresponding
improvement in optimistic explanatory style, especially for attributions of negative
events, not only immediately after the manipulations, but also following three
months after the interventions had ended.
Also, I predicted that our positive activities would bolster SWB (life
satisfaction) and dispositional optimism immediately and decrease dispositional
pessimism after the intervention and these improvements might last in the follow-up
periods.
8.2.2 Method
Participants
Participants in Sample 6 were involved in this study (see Chapter 1.5.4 for details).
Measures
Attributional style was measured using a Chinese version of the ASQ (Zhang, 2006).
Two composite scores, ASQ Negative and ASQ Positive, were calculated to assess
attributional style for negative and positive events respectively. Cronbach’sαfor the
pre-test for the scale were 0.73 for negative events and 0.84 for positive events; for
the post-test, 0.86 for negative events and 0.88 for positive events; and for the three-
month follow-up, 0.72 for negative events and 0.83 for positive events.
Dispositional optimism was measured using a Chinese version of the Life
Orientation Test-Revised (Lai & Yue, 2000). Subjects were scored for two separate

Understanding Optimism
Chapter 8: Optimism interventions for depression in first-year college students 227
composite scores, LOT-R Optimism and LOT-R Pessimism. Cronbach’sαfor the
pre-test for the scale was 0.50 for LOT-R Optimism and 0.53 for LOT-R Pessimism;
for the post-test, 0.47 for LOT-R Optimism and 0.59 for LOT-R Pessimism; for the
one-month follow-up, 0.61 for LOT-R Optimism and 0.64 for LOT-R Pessimism;
and for the three-month follow-up, 0.43 for LOT-R Optimism and 0.56 for LOT-R
Pessimism.
Subjective well-being was assessed using a Chinese version of the
Satisfaction with Life Scale (SWLS; Chen & Zhang, 2004). Subjects were scored for
total optimism scores. Cronbach’sαfor the pre-test for the scale was 0.79; for the
post-test, 0.74; for the one-month follow-up, 0.76; and for the three-month follow-up,
0.80.
Depression was measured using a Chinese version of the Beck Depression
Inventory (BDI; Chan & Tsoi, 1984). Cronbach’sαfor the pre-test for the scale was
0.79; for the post-test, 0.75; for the one-month follow-up, 0.70; and for the three-
month follow-up, 0.49.
Procedure
Participant recruiting and baseline assessment were the same as in Study 1.
Optimism interventions. Students were randomly assigned to either an
experimental condition or a control condition for a period of 2 weeks.
For the experimental condition, participants were instructed to apply SOT in
the first week, and then apply BPS in the second week. Participants reported to small
group (5-6 people per group) training sessions, which consisted of approximately 10
minutes of instructions on how to apply SOT and BPS in the beginning of the first
week and the second week. Participants were asked to complete their homework on a
self-administered basis (the same as in Study 1).

Understanding Optimism
Chapter 8: Optimism interventions for depression in first-year college students 228
For the comparison control condition, participants were asked to spend 15
minutes per day listing what they did during that day. A notebook was assigned to
students for writing down their daily activities.
Time 1, time 2, and time 3 assessments. Optimism intervention participants
completed the measure battery in the following three days after they completed the
intervention sessions, and control participants were scheduled a similar time for their
Time 1 measure. Then participants in both conditions were scheduled a time to return
for Time 2 (one-month follow-up), and Time 3 (three-month follow-up) packet of
self-report measures. The ASQ was only re-administered at Time 1 and Time 3 due
to its length.
8.2.3 Results and analysis
An independent samples t-test on baseline scores between intervention group and
control group revealed no significant differences between the groups on any of the
measures (LOT-R Optimism, LOT-R Pessimism, ASQ Negative, ASQ Positive,
SWLS, and BDI). The descriptives and correlations of baseline scores for the whole
sample on the LOT-R, ASQ, SWLS, and BDI are shown in Table 8.3.
As shown in Table 8.3, BDI was negatively correlated with SWLS (r = -.35);
LOT-R Optimism was negatively correlated with LOT-R Pessimism (r = -.33) and
positively correlated with ASQ Positive (r = .30); and ASQ Negative was negatively
correlated with SWLS (r = -.31).

Understanding Optimism
Chapter 8: Optimism interventions for depression in first-year college students 229
Measures Descriptives Correlations
Mean SD 1 2 3 4 5
1. BDI 21.81 7.40 -
2. LOT-R Optimism 8.19 1.76 -0.13 -
3. LOT-R Pessimism 4.41 1.58 0.23 - 0.33* -
4. ASQ Negative 12.74 1.60 0.07 -0.14 -0.04 -
5. ASQ Positive 14.07 1.90 -0.23 0.30* -0.20 -0.03 -
6. SWLS 16.22 5.76 - 0.35** 0.12 -0.21 - 0.31* 0.13
Table 8.3: Descriptives and intercorrelations between measures at baseline.
* p < 0.05. ** p < 0.01.
Intervention effects: immediate and longer term changes
Means and standards deviations for all measures for both conditions from baseline to
post-interventions, as well as to one-month follow-up and three-month follow-up are
presented in Table 8.4.
Changes for all measures for both groups in four time-points are illustrated in
Figures 8.7-8.12 (based on standardized scores).

Understanding Optimism
Chapter 8: Optimism interventions for depression in first-year college students 230
Measures Pre-test Post-test 1-month Follow-up 3-month Follow-up
Mean SD Mean SD Mean SD Mean SD
Intervention group
BDI 21.43 7.44 17.47 6.03 16.27 5.04 16.63 3.80
LOT-R Optimism 8.17 1.90 9.13 1.04 9.17 1.53 8.80 1.58
LOT-R Pessimism 4.27 1.53 3.87 2.16 3.90 2.32 4.10 1.92
SWLS 16.13 5.89 19.53 4.47 20.20 4.78 19.60 3.66
ASQ Negative 12.59 1.72 11.83 1.88 - - 11.68 1.51
ASQ Positive 14.13 1.73 14.83 1.38 - - 15.04 1.88
Control group
BDI 22.21 7.46 21.10 6.12 19.48 5.16 18.90 4.93
LOT-R Optimism 8.21 1.63 8.24 2.28 8.34 1.42 8.31 1.65
LOT-R Pessimism 4.55 1.64 4.69 1.93 4.62 1.52 4.59 1.68
SWLS 16.31 5.73 17.59 4.08 18.24 5.14 19.07 5.59
ASQ Negative 12.90 1.49 12.95 2.13 - - 12.76 1.66
ASQ Positive 14.01 2.08 14.40 2.98 - - 14.31 1.96
Table 8.4: Means and Standard Deviations of outcome measures by condition at all
time-points.
Figure 8.7: Depression as measure by the BDI at baseline, at post-intervention, 1-
month follow-up, and 3-month follow-up per condition.
-0.60
-0.40
-0.20
0.00
0.20
0.40
0.60
Pre Post 1m 3m
intervention group
control group
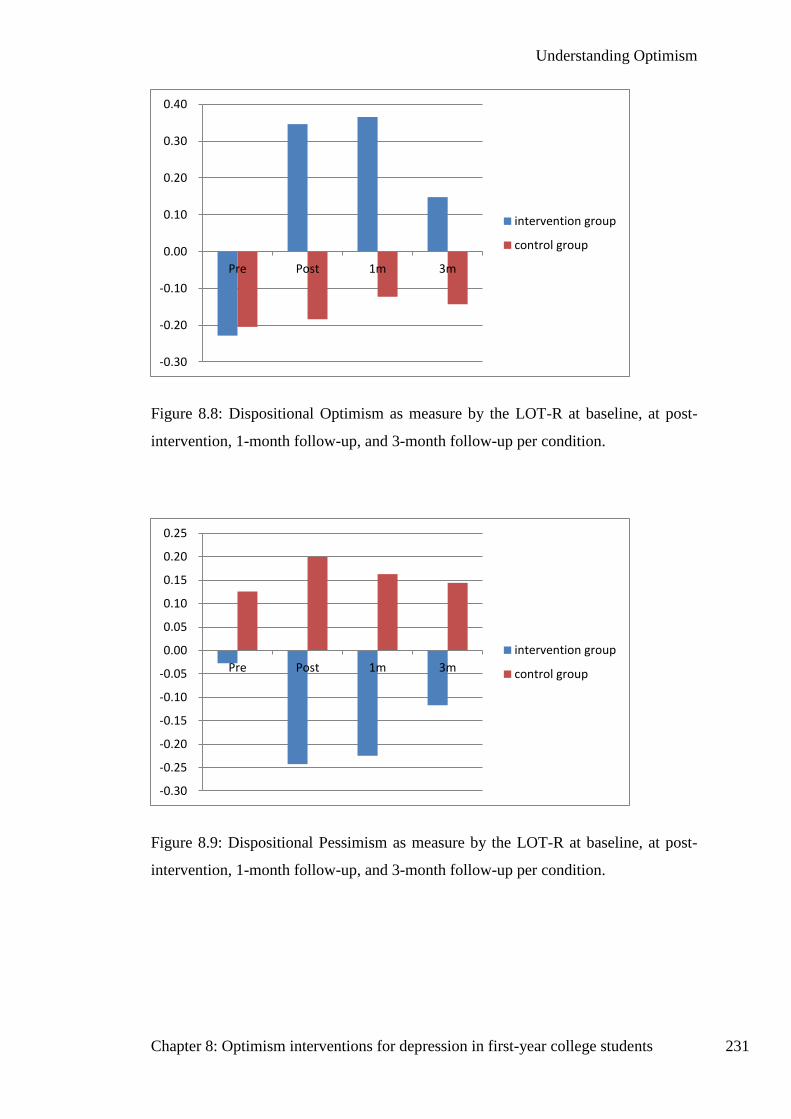
Understanding Optimism
Chapter 8: Optimism interventions for depression in first-year college students 231
Figure 8.8: Dispositional Optimism as measure by the LOT-R at baseline, at post-
intervention, 1-month follow-up, and 3-month follow-up per condition.
Figure 8.9: Dispositional Pessimism as measure by the LOT-R at baseline, at post-
intervention, 1-month follow-up, and 3-month follow-up per condition.
-0.30
-0.20
-0.10
0.00
0.10
0.20
0.30
0.40
Pre Post 1m 3m
intervention group
control group
-0.30
-0.25
-0.20
-0.15
-0.10
-0.05
0.00
0.05
0.10
0.15
0.20
0.25
Pre Post 1m 3m
intervention group
control group

Understanding Optimism
Chapter 8: Optimism interventions for depression in first-year college students 232
Figure 8.10: Subjective well-being as measure by the SWLS at baseline, at post-
intervention, 1-month follow-up, and 3-month follow-up per condition.
Figure 8.11: Attributional style for negative events as measure by the ASQ at
baseline, at post-intervention and 3-month follow-up per condition.
-0.50
-0.40
-0.30
-0.20
-0.10
0.00
0.10
0.20
0.30
0.40
0.50
Pre Post 1m 3m
intervention group
control group
-0.50
-0.40
-0.30
-0.20
-0.10
0.00
0.10
0.20
0.30
0.40
Pre Post 3mintervention group
control group

Understanding Optimism
Chapter 8: Optimism interventions for depression in first-year college students 233
Figure 8.12: Attributional style for positive events as measure by the ASQ at baseline,
at post-intervention and 3-month follow-up per condition.
Immediate post-intervention
Right after the completion of the two-week intervention, supporting the first
hypothesis, students in the experimental group reported a greater decrease in
depressive symptoms relative to students in the control group (see Figure 8.7), t(57)
= -2.30, p = 0.025. However, although participants in the intervention group
displayed a trend toward an increase in LOT-R Optimism and a decrease in LOT-R
Pessimism relative to the control group right after the intervention (see Figure 8.8
and Figure 8.9), two-tailed t tests showed that the experimental group and the control
group did not significantly differ on either LOT-R Optimism (t(57) = 1.95, p = 0.057)
or LOT-R Pessimism (t(57) = -1.54, p = 0.129). Similarly, as displayed in Figure
8.10, although intervention group participants were still showing a trend toward
greater subjective well-being gains compared with the control group, it was not
significant (t(57) = 1.75, p = 0.086).
For explanatory style measured by the ASQ, participants in the experimental
group reported a greater decrease in ASQ-Negative relative to participants in the
-0.30
-0.20
-0.10
0.00
0.10
0.20
0.30
0.40
Pre Post 3m
intervention group
control group

Understanding Optimism
Chapter 8: Optimism interventions for depression in first-year college students 234
control group (see Figure 8.11), t(57) = -2.16, p = 0.035. However, a comparison of
the intervention group with the control group on the ASQ-Positive failed to reach
statistical significance, though participants in the experimental group displayed a
trend toward an increase in ASQ-Positive (see Figure 8.12).
Follow-ups
As expected, again supporting our most important prediction, BDI scores of the
intervention group were lower than those in the control group, t(57) = -2.42, p =
0.019, though depressive symptoms in the control group also experienced a trend
toward decreasing one month after the intervention (see Figure 8.7). This difference
was kept three months after the intervention had ended but did not reach statistical
significance, t(57) = -1.98, p = .053.
A comparison of LOT-R Optimism, LOT-R Pessimism, and SWLS
contrasting the experimental group with the control group in the one-month follow-
up or the three-month follow-up failed to reach statistical significance, with one
exception. LOT-R Optimism scores for the intervention group were significantly
lower than those in the control group one month after the intervention had ended,
t(57) = 2.13, p = 0.037, though LOT-R Optimism in the control group also
experienced a trend toward increasing (see Figure 8.8). For life satisfaction, although
participants who had completed the optimism intervention displayed a trend toward
greater increases relative to the control group one month after the intervention had
ended, this difference did not reach statistical significance (see Figure 8.10).
As expected, three months after the intervention had ended, ASQ-Positive
and ASQ-Negative showed beneficial changing patterns, though only the differences
and changes of ASQ-Negative reached statistical significance. Specifically, for the
ASQ-Negative, participants in the experimental group decreased their scores while
the control group kept a relatively stable level (see Figure 8.11), and as a result the
intervention group participants reported lower ASQ-Negative scores than their
counterparts in the control group, t(57) = -2.62, p = .011. For ASQ-Positive,
participants in the experimental group displayed a trend toward increasing their

Understanding Optimism
Chapter 8: Optimism interventions for depression in first-year college students 235
scores, while the control group slightly decreased their scores. The difference of
ASQ-Positive scores between the intervention group and the control group in the
three-month follow-up was even bigger than the difference between these two groups
in post-intervention (see Figure 8.12). However, this difference failed to reach
statistical significance.
8.2.4 Discussion
The current investigation demonstrated that minimally supervised and self-
administered optimism interventions for a two-week period could result in decreases
in depressive symptoms and pessimistic explanatory style and enhance dispositional
optimism. Although participants in the experimental group did not significantly
decrease dispositional pessimism and significantly increase subjective well-being,
findings indicate that increases in dispositional optimism and decreases in
pessimistic explanatory style were associated with decreases in depressive symptoms.
Moreover, the benefits in decreasing depression in the intervention group
continued one month and three months after the intervention. These results indicate
that a brief and self-monitored intervention is effective in reducing symptoms of
depression and enhancing well-being.
8.3 General discussion
Both studies shared similar and slightly different trends in changes of depressive
symptoms in LOT-R Optimism, LOT-R Pessimism, ASQ Positive, ASQ Negative,
and subjective well-being of experiment groups. They generally showed a greater
increase in LOT-R Optimism, ASQ Positive, and subjective well-being and a greater
decrease in depressive symptoms, LOT-R Pessimism, and ASQ Negative for
participants in the intervention group than their counterparts in the control group,
though not all of these changes and differences reached statistical significance. For
example, though LOT-R Optimism showed a greater increase in post-intervention for
the intervention group in both studies, it produced differential increases between the
intervention condition and the control condition only in the one-month follow-up in
Study 2. This finding was unexpected given that previous findings showed that

Understanding Optimism
Chapter 8: Optimism interventions for depression in first-year college students 236
writing about and imagining a BPS leads to an immediate increase in dispositional
optimism (Meevissen et al., 2011; Peters et al., 2010; Peters et al., 2013). Given that
previous studies of BPS had only been applied in non-clinical settings and
participants in my studies were first-year college students with mild-to-moderate
depressive symptoms, the failure of significant increases in LOT-R Optimism might
not be so unexpected.
I should point out, though, that the level of depression reduction of the
intervention group in Study 2 was lower as compared to the level of depression
reduction for the intervention group in Study 1. Two considerations may be helpful
to account for the smaller difference found between the experiment group and the
control group in Study 1 than in Study 2. First, it has been argued that individual
positive psychotherapy is effective in reducing depressive symptoms (Seligman et al.,
2006). Accordingly, since three individual counselling sessions were included in
Study 1 in addition to SOT and BPS exercises, and these individual counselling
sessions were excluded in Study 2, differences in reduction of depressive symptoms
between these two studies could be expected. Secondly, as noted by some
researchers, one of the major concerns in psychological assessment is the possibility
of social desirability and demand effects. The social desirability bias might be larger
if students were keen on making good impressions to the counsellors. Hence, it is
possible that participants in the intervention group in Study 1 were more obviously
affected by social desirability than in Study 2.
.

Understanding Optimism
Chapter 9: Understanding optimism 237
Chapter 9: Understanding optimism
Thinking rosy futures is as biological as sexual fantasy. Optimistically calculating
the odds is as basic a human action seeking food when hungry or craving fresh air in
a dump. Making deals with uncertainty marks us [as a species] as plainly as
bipedalism. – Tiger (1979, p. 35)
Tiger’s quotation suggests that the trait of being optimistic or pessimistic has
biological origins as similarly stated by evolutionary hypotheses, which assume that
something genetic underlies the trait that is selected. Basically, evolutionary
psychology focuses on general traits, and provides interpretations for distal causes of
these traits relative to other species in terms of the environmental risks faced by the
species and of their physical properties in dealing with these challenges.
Optimism has had a profound influence in the fields of counselling,
psychology, and sociology. The psychological accounts of optimism have long been
involved in the pursuit of a more adaptive life for human beings. No matter what the
appoach in defining and measuring optimism, it has been widely accepted that being
optimistic represents the tendency and desire to maintain positive and adaptive
thinking, leading to positive emotions and behaviors, for promising expectations and
optimisitc attributions in life (Alarcon, Bowling, & Khazon, 2013; Andersson, 1996;
Carver & Scheier, 2014; Carver et al., 2010; Forgeard & Seligman, 2012).
Two main approaches of optimism, dispositional optimism and optimistic
explanatory style, were the core variables in my research of understanding optimism.
In a series of studies I investigated several aspects concerning these two traits,
including their psychometric structures, the relationship between dispositional
optimism and explanatory style, associations of optimism with psychological well-
being and personality, and potential cultural influences on optimism between two
ethnic groups. In addition, I conducted two pilot studies in the field of attributional

Understanding Optimism
Chapter 9: Understanding optimism 238
style, including the exploration of attributional style in others, and an examination of
the potential self-serving attributional bias in self- and other-settings. Finally and
importantly, after examining what optimism is and how we measure it, I explored the
possibility of optimism interventions on depressive symptoms.
Most of the studies involved Chinese undergraduate samples, except the cross-
cultural study of optimism. Findings in these studies are helpful to improve the
understanding of optimism in non-English speaking countries. In the first part of this
chapter, I reviewed and summarized the main findings concerning the psychometirc
structure of the basic measures in my study: the ASQ for explanatory style and the
LOT-R for dispostional optimism. Additionally, correlations between dimensions of
these two measures and two important psychogical variables, which include
psychological well-being and the FFM, were also briefly reported.
9.1 Summary of main findings
ASQ: three valence-independent cognitive styles
Explanatory style or attributional models of optimism, as measured by the ASQ,
focus on three aspects of attributions for the causes of positive and negative events:
internality, stability, and pervasiveness. These three aspects are assumed to cluster
within each valence forming explanatory-style factors and these in turn are predicted
to correlate negatively. Optimistic explanatory styles are associated with the belief
that the causes of negative events are external, unstable, and pervasive, while a
pessimistic attributional style assigns negative events as brief, affecting more than
one aspect of life, and internally caused (Forgeard & Seligman, 2012). However,
several empirical studies reported positive and negative events being uncorrelated
(Philip J. Corr & Jeffrey A. Gray, 1996; Peterson et al., 1982). With a non-Western
sample, I carried out the first test of the full structure of attributions controlling for
response non-independence.

Understanding Optimism
Chapter 9: Understanding optimism 239
Both negative and positive event attributions fit a three-dimensional structure
just as reported by Hewitt et al. (2004) and Higgins et al. (1999). However, the joint
modelling analysis of positive and negative events revealed that attributional biases
to positive and negative events were uncorrelated (see Figure 2.8). This model was
successfully replicated in an independent sample. Cognitive styles emerged as an
important influence on responding: valence-independent cognitive styles accounted
for 85 percent of variance in the latent-factor model. This suggests that subjects
apply consistent cognitive styles independent of event-valence, with personal
tendencies to explain events as, for instance, global or local independent of event
valence. Subjects rating negative events as global tended also to describe positive
events in terms of pervasive attributions, and likewise for the other two styles. In
conclusion, attributions may be best viewed as reflecting large differences in
cognitive style (independent of event valence), and smaller independent positive–
and negative-event biases.
LOT-R: separating dispositional optimism from dispositional pessimism
As the most frequently used measure of dispositional optimism, the LOT or its
revised version, the LOT-R, has been applied widely in numerous studies. Though
dispositional optimism was originally presumed to be a bipolar dimension, as
measured by the LOT or LOT-R (Scheier & Carver, 1985; Scheier et al., 1994), a
debate concerning the dimensionality of this variable has begun. More and more
evidence indicates that the LOT or LOT-R may reflect a two-factor model of
dispositional optimism. The positively and negatively phrased items in the measure
split into two factors, namely “optimism” and “pessimism”, representing two distinct
traits (Chang et al., 1997; L. Chang & McBrideChang, 1996; Creed et al., 2002;
Roysamb & Strype, 2002). Structural modelling of the LOT-R in my study
corresponded with previous findings that this measurement is better to be explained
as a two-dimensional structure scale.
Additionally, correlations between dispositional optimism and explanatory
style were examined. LOT-R optimism was positively correlated with ASQ Total
and ASQ Positive, but the correlation was lower than it has been reported by earlier

Understanding Optimism
Chapter 9: Understanding optimism 240
studies. Moreover, LOT-R optimism was positively correlated with Stable Positive
and negatively correlated with Stable Negative, but had no significant correlation
either with ASQ Negative or with any three dimensions of negative events. No
significant correlation was found between ASQ Pessimism and any ASQ dimensions.
Because only a general correlation between the LOT-R and ASQ composite has been
reported in most previous studies, results in this study provided at least some benefits
to better understanding the relationship between dispositional optimism and
explanatory style.
Furthermore, my study provided empirical evidence of the correlational
patterns between explanatory style and dispositional optimism in a non-Western
sample. The results were generally consistent with findings of previous research in
Western samples. That is, explanatory style and dispositional optimism are weakly
correlated (Forgeard & Seligman, 2012).
Optimism and the Five-Factor Model of personality
Optimism has been identified as thoughts and beliefs people hold for life and the
future. Both attributional style and dispositional optimism have been assessed largely
through their linkage to traditional personality traits, especially the FFM.
For explanatory style, attributions for negative events has been found to be
negatively correlated with Conscientiousness (Musgrave-Marquart et al., 1997).
Correlational analyses between ASQ and FFM dimensions in my study supported
this finding. Attributional styles for negative and positive events have been found to
have different correlational patterns with the FFM. While the ASQ Negative is
positively correlated with Neuroticism, and is negatively correlated with
Extraversion and Conscientiousness, ASQ Positive is positively related to four of the
five NEO-PI-R dimensions, excepting Neuroticism. Though attributions for positive
and negative events may reflect differentiated cognitive styles, these results suggest
that Conscientiousness may be considered as an important predictor of attributional
style.

Understanding Optimism
Chapter 9: Understanding optimism 241
For dispositional optimism, its bidimensional structure has been further
supported in an SEM model correlating LOT-R and the FFM. An initial base model
that incorporates two differentiable but related factors (LOT-R Optimism and LOT-R
Pessimism) through their links to the FFM was proposed and supported by data.
Based on these findings, dispositional optimism may be best viewed as reflecting two
distinct traits, which are reflected in LOT-R Optimism items and LOT-R Pessimism
items.
Additionally, associations among the LOT-R, ASQ, and NEO-PI-R scales
provide at least some evidence of the related but distinct relationship between the
two optimism structures. Though LOT-R Optimism and ASQ Positive both had
strong associations with the same four FFM factors, Neuroticism was only
significantly correlated with LOT-R Optimism but not ASQ Positive. In addition,
Openness only significantly correlated with LOT-R Pessimism but not with ASQ
Negative.
Mixed correlational patterns emerged when gender differences were taken
into account in analysing the relationship between optimism and personality. Results
showed that Agreeableness was the critical factor in differentiating attributional
styles of men and women. Specifically, Agreeableness was correlated with ASQ
Positive for men but not women, while it was correlated with ASQ Negative for
women but not men. For associations between LOT-R and NEO-PI-R scales, gender
differences presented a more complicated pattern. While Agreeableness was
correlated with dispositional pessimism for men but not for women, Openness was
correlated with both dispositional optimism and dispositional pessimism for women
but not for men.
Moreover, in the correlational analysis on optimism and specific facets of
each FFM factor, results demonstrated the positive correlations between optimism
(both high levels of dispositional optimism and optimistic explanatory styles) and
psychological well-being, such as lower depression scores and higher levels of
positive emotions.

Understanding Optimism
Chapter 9: Understanding optimism 242
Optimism: a strong predictor of psychological well-being
Dispositional optimism and explanatory style have been consistently related to health
and well-being. Previous investigations have shared two primary limitations. They
either have exclusively assessed only one construct of optimism (attributional style
or dispositional optimism) or merely measured one approach of well-being
(subjective well-being or psychological well-being). Even in studies where the two
fundamental constructs of optimism have both been assessed, the potential mediating
model linking all these constructs has not been examined. My study used SEM
models to construct relationships between optimism and psychological well-being.
Results from my study indicate that more optimistic individuals report a
higher level of psychological well-being, which is consistent with studies conducted
in Western participants. That is, individuals who have positive expectations for the
future are more likely to report high levels of psychological well-being. Optimistic
explanatory style may serve as another protective factor for well-being. There is
evidence that optimists tend to face adversity and deal with negative situations more
effectively than pessimists and can cope more adaptively with stress and, in turn,
gain more psychological benefits (Scheier & Carver, 1992).
Also, consistent with previous studies that individuals who have an optimistic
explanatory style are more likely to report higher levels of psychological well-being
than people with a pessimistic attributional style (Wise & Rosqvist, 2006), the
current results revealed that higher scores on ASQ Positive and lower scores on ASQ
Negative were significantly correlated with higher levels of psychological well-being
dimensions. Optimistic explanatory style may serve as a protective factor for well-
being.
The proposed mediating role of dispositional optimism between explanatory
style and psychological well-being was supported in the study. Results from
structural equation modelling indicated that explanatory style, dispositional optimism,
and PWB are positively associated with each other; dispositional optimism and
optimistic explanatory style are predictors of psychological well-being; and

Understanding Optimism
Chapter 9: Understanding optimism 243
dispositional optimism acts as a mediator between explanatory style and
psychological well-being.
Overall, this study provides consistent evidence of, and further support for,
the beneficial effects of both two types of optimism on psychological well-being in a
college student sample. Both dispositional optimism and optimistic explanatory style
are strong predictors of psychological well-being. Explanatory style and dispositional
optimism are weakly correlated (Forgeard & Seligman, 2012), though both
constructs are moderately correlated with well-being (Carver et al., 2010). Overall,
these findings are consistent with previous research in Western samples.
9.2 Does culture make a difference
Several studies investigated the universality of optimism using large sample sizes.
Fischer and Chalmers (2008) examined levels of dispositional optimism using a
meta-analytic approach, and reported that overall cultural differences in dispositional
optimism were small. The study involved a sample of 89,138 participants (more than
half American) from 22 countries. The optimism scores on average were found to be
significantly higher than the midpoint of LOT responses. Later, Gallagher et al.
(2013) examined the cross-cultural effects in optimism using a much larger sample
(n = 150,048) collected in the first wave of the Gallup World Poll involving
participants from 148 countries. They found that dispositional optimism was
significantly correlated with subjective well-being and perceived physical health both
at the country and the individual level, though the associations varied across
countries.
Cultural differences in optimism have been found in cross-cultural studies as
well. Michalos (1988) conducted one of the very first studies examining the
worldwide optimism level using the Gallup Report data. Participants from 31
countries were asked a single question: “So far as you are concerned, do you think
that 1987 will be better or worse than 1986?” Participants who gave the positive
answer to this question were classified as being optimistic for the future. Results

Understanding Optimism
Chapter 9: Understanding optimism 244
revealed that the optimism level of most countries and most individuals was not
promising, with only an average of 32 percent of participants in all countries
expecting a better future for the next year. The fact that some countries (such as
Canada and the U.S.) had a higher ratio of optimistic people than average indicated
potential cultural differences in optimism.
Still, in a meta-analytic study of the relationship between dispositional
optimism and coping style, Nes and Segerstrom (2006) reported that stronger
correlations between optimism and coping were found among participants in
English-speaking countries than their counterparts in non-English-speaking countries.
The results indicated that culture and language may have impacts on the optimism-
coping relationship.
The universality of the self-serving bias in causal explanations was supported
by the data in my study. Both ethnic groups (Mainland Chinese and White British)
reported positive ASQ Total scores, indicating a universal trend of holding an
optimistic explanatory style or a self-serving bias in causal attributions no matter
what the cultural background.
Admittedly, culture still plays a part in labelling different patterns and merits
of optimism, including both dispositional optimism and explanatory style. My study
concerning potential cultural differences on these two optimism approaches tested
several hypotheses. The first aim was to test whether similar psychometric structures
were applicable for the White British sample as in the Mainland Chinese sample. the
results revealed that a model of causal attributions for positive events in terms of
three correlated factors of globality, stability, and internality adequately accounted
for responses to these positive but not negative events in the ASQ. For the LOT-R
construct, a similar two-factor model of dispositional optimism was supported by my
study in the White British sample.
Results revealed several basic points concerning potential cultural differences
in optimism between the two ethnic groups. First, they were found to differ among a
number of important outcome variables in optimism. For example, Mainland Chinese

Understanding Optimism
Chapter 9: Understanding optimism 245
showed a more pessimistic explanatory style for explaining ASQ negative events
than their White British counterparts, which supported the proposal that Easterners
tend to use more unfavourable attributions for negative events than Westerners. For
explanations of ASQ positive events, unexpected patterns emerged. Mainland
Chinese expressed a more optimistic attributional style than White British in
attributing positive events, which was inconsistent with some previous research.
However, the results were consistent with our analysis that individuals tend to
produce similar patterns of explanations based on cognitive style rather than on event
type. These mixed results suggest that the cultural influence on optimism is not
uniform for at least some of the differentiated dimensions.
Additionally, the associational patterns between measuring scores of
optimism dimensions was quite similar for the two ethnic groups concerned, for
example, positive correlations between LOT-R-optimism and optimistic explanatory
style were found for both Mainland Chinese and White British. Discrepancies
between these two ethnic groups exist, however. For example, there was a weaker
negative association between LOT-R-optimism and LOT-R-pessimism for White
British than for Mainland Chinese, indicating a potential cultural or linguistic effect
on optimism measuring outcomes.
One aspect worth noting was the change in tendency of traditional
discrepancies in optimism between Easterners and Westerners found in my study.
The Mainland Chinese sample in this study expressed higher levels of LOT-R-
optimism and lower levels of LOT-R-pessimism than their White British
counterparts. In addition, Mainland Chinese also reported a more optimistic
explanatory style for positive events than White British. All these results are
inconsistent with traditional views of cultural discrepancies between the East and the
West. However, these findings are not as unexpected as they may seem, if two
factors are considered. First, it has been argued that broader social factors should be
taken into account in understanding optimism and pessimism (Lee & Seligman,
1997). Accordingly, these seemingly unexpected findings might be unique to this
young Chinese population. The relatively recent fast economic growth of China may
provide an explanation for Chinese people, especially as young generations feel more

Understanding Optimism
Chapter 9: Understanding optimism 246
optimistic and confident than previously, therefore dimming previous cultural
influences on optimism.
Secondly, as noted by some researchers, one of the major concerns in examing
culture differences in optimism is that it might be a problem for Easterners to get the
exact meaning of LOT-R items since this questionnaire has been developed on the
basis of Western cultures (Anderson, 1999). Hence, it is possible that there are slight
gaps in understanding the meaning of optimism and pessimism. At the very least, this
is in line with some results from previous research, as discussed earlier, that found no
group differences in optimism across cultures (Chang et al., 2003), or differences that
were more nuanced (Chang, 1996).
It should also be bear in mind that both these ethnic groups reported positive
ASQ Total scores in spite of differences in explanatory style between these two
cultural groups. This result indicated taht no matter what their cultural background
was, individuals tend to explain positive events with more internal, stable and global
causes than negative events. This conclusion is consistent with previous cross-
cultural evidence (e.g., Higgins & Bhatt, 2001), revealing that there is a universal
trend of positive bias in causal attributions.
9.3 Do people exhibit bias in attributing causes to events happening to others?
Though self-serving bias and self-versus other bias in causal attributions are
theoretically linked to each other, these two attributional biases have been studied
separately in prior literature. Unlike self-serving attributional bias that is mainly
assessed by the three-dimensional ASQ, self-versus other bias in causal attributions
has been restricted to the dimension of internality using diverse measures. To include
both self-serving bias and self-other bias in attributions into the widespread three-
dimensional model, I combined these two biases systematically across subjects (self
and other), valences (positive and negative events), and causes (traits and states) by

Understanding Optimism
Chapter 9: Understanding optimism 247
using the ASQ and a rewritten novel version of this measure (ASQ-Other), in which
participants generated attributions for events occurring to others.
Data and modelling analysis supported a model of causal attribution in terms of
three correlated factors of internality, stability, and globality accounting for
responses to both positive and negative events in the ASQ-Other, just as in the ASQ.
In particular, the ASQ-Other scale appears to be a valid and reliable measure, and
should be used in future studies to measure how people attribute others’ life events
outcomes.
The ASQ and the ASQ-Other were then used to assess self-serving attributional
bias and self-other attributional bias respectively. For self-serving attributional bias,
findings demonstrated that individuals tend to maximise positive and minimise
negative future outcomes in making attributions, thus show a self-protective bias in
causal explanations for personal outcomes or situations. This self-serving bias
manifested in each of the three attributional dimensions across event valence. When
individuals assign causal explanations for life events, they prefer giving more
internal, stable and pervasive causes for positive outcomes than for negative
outcomes. For unfavourable situations, individuals have the tendency of attributing
those situations to external, unstable, and specific causes.
For self-versus-other bias, results showed that people have more optimistic
explanatory styles for similar situations for themselves than for other people. This
self-versus-other bias exist in people’s attributions for both positive and negative
events. While individuals attribute others’ positive situations to external variables,
they explain their own positive outcomes using more favourable internal causes. The
opposite is true for negative situations. In summary, explanations for causes of
positive and negative events can be differentiated between self and other. Individuals
give more optimistic explanations for themselves than they did for others.
Additionally, results revealed that participants tend to attribute internal, stable,
and global attributions for positive events while they generate external, unstable, and
specific explanations for negative events no matter whether the subjects are

Understanding Optimism
Chapter 9: Understanding optimism 248
themselves or other people. Though people tend to have a more optimistic
explanatory style in events for themselves than for others, they expressed an
optimistic-biased attribution in explaining the causes of life events for other people.
Since prior studies in attributional bias have mainly been conducted in
Westerners, results confirming the existence of two forms of attributional biases in
an Eastern sample provided further evidence to prior findings. It appears that there
may be a universal tendency for individuals to protect themselves against negative
feelings by using an optimistic attributional style.
In summary, the results show that consistent with prior studies, these two
cognitive biases in causal attribution, or a tendency to hold an optimistic explanatory
style, also exist in at least the ,non-Western group in this study. Findings in the
current study demonstrated that causal attributions about life events possess a self-
protection feature, as suggested by Heider (1958). That is, individuals tend to
maximize positive and minimize negative future outcomes in making attributions,
thus showing a self-protective bias in causal explanations for personal outcomes or
situations.
9.4 Effective optimism interventions for depression
Due to diverse causes pf life transitions, such as challenges of living in a
different and unfamiliar environment, first-year undergraduate students have often
been found vulnerable to negative feelings, such as depression and anxiety, which
can negatively affect quality of life and academic performance (Brandy et al., 2015;
Negovan & Bagana, 2011). Previous studies have indicated that dispositional
optimism and attributional style may play an important role in psychological
adjustment during the first year in university (Brissette et al., 2002; Chemers et al.,
2001; Peterson & Barrett, 1987; Reisbig et al., 2012).
Previous research has shown that the effortful practice of imagining one’s best
possible future self and figuring out optimistic attributional styles for life events lead
to improved well-being and decreased negative feelings (Fresco et al., 2009;

Understanding Optimism
Chapter 9: Understanding optimism 249
Lyubomirsky et al., 2011; Peters et al., 2013). Although a number of studies have
explored the impact of BPS and SOT, no extensive study has tested their
effectiveness for treating depression has yet, to my knowledge, been conducted. I
applied these two forms of optimism interventions in two studies to evaluate the
feasibility of these interventions in depressed first-year college students. According
to previous findings concerning the influences of attributional style and dispositional
optimism have on academic performance, depression, and psychological adjustment,
the current investigations aimed to evaluate the feasibility of a prophylactic optimism
intervention in reducing depressive symptoms and improving psychological well-
being. Specifically, I sought to examine the beneficial effects of practicing SOT and
BPS daily on depressive symptoms, subjective well-being, dispositional optimism,
and explanatory style in a non-Western population.
The first pilot study combined an individual counselling session and self-
administered optimism manipulations to investigate the potential benefits of
optimism intervention. Results showed that individuals in the experimental condition
were less depressed than those in the control condition at post-intervention and two
follow-ups. Study 1 also showed that optimism interventions were beneficial in
developing optimistic explanatory styles, especially for attributions for negative
events. Extending previous findings that imagining and writing about a BPS leads to
an decrease in negative feelings (Shapira & Mongrain, 2010) and that practicing
optimistic attributions results in a reduction of depressive symptoms (Fresco et al.,
2009), the first study showed that daily practice of BPS an SOT for two weeks can
lead to sustained decrease in depression. In comparison with participants of the
control group, results revealed that individuals who practiced the BPS and SOT
techniques experienced less depressive symptoms and generated more optimistic
explanatory styles.
Though Study 1 has demonstrated that supervised and self-monitored optimism
interventions results in greater decreases in depressive symptoms in the experimental
condition, it raised the concern that this beneficial effect might be due to the
individual face-to-face counselling sessions in the interventions. To test whether self-

Understanding Optimism
Chapter 9: Understanding optimism 250
directed and self-administered optimism interventions could result in similar benefits
for decreasing depression, a second study was conducted.
The second study demonstrated that minimally supervised and self-administered
optimism interventions for a two-week period could result in decreases in depressive
symptoms and pessimistic explanatory styles and enhance dispositional optimism.
Although participants in the experiment group did not show a significantly greater
decrease in dispositional pessimism or a significantly greater increase in subjective
well-being, findings indicated that increases in dispositional optimism and decreases
in pessimistic explanatory style were associated with decreases in depressive
symptoms. Moreover, the benefits in decreased depression in the intervention group
was continued one month and three months after the intervention. the results
indicated that a brief and self-monitoring intervention is effective in reducing
symptoms of depression and enhancing well-being.
In general, both studies found evidence that a best possible self (BPS) imagery
intervention and self-administered optimism training in attributional style (SOT)
reduces the incidence of episodes of mild-to-moderate depression compared to a
control condition.
9.5 Deeper understanding of optimism: theoretical contributions to optimism literature and future directions
Although it is still not clear what the exact relationship between explanatory style
and dispositional optimism is, findings from the literature are mostly consistent.
Attributional style is related to a variety of psychological and physical health indices,
including academic achievement, depression, and physical illness (Wise & Rosqvist,
2006). Peterson and Seligman (1984) reviewed a variety of evidence showing that a
pessimistic attributional style predicts increases in depression over time in different
populations, such as lower-class women, children, and depressed patients. Similarly,
dispositional optimists report fewer depressive symptoms and fewer physical health

Understanding Optimism
Chapter 9: Understanding optimism 251
problems than pessimistic people (Carver & Scheier, 2014; Carver et al., 2010;
Scheier & Carver, 1987, 1992). These associations between the tendency to maintain
positive expectations for the future and improved well-being have been widely
recognized (Gallagher et al., 2013). My studies have replicated findings of a positive
relationship between optimism and well-being.
Previous studies have tried to identify optimism within a broad personality
domain, and it has been suggested that optimism represents a blend of Neuroticism
and Extraversion (Marshall et al., 1992). However, later work tends to support the
view that optimism also has some overlap with other Big Five Factors (Kam &
Meyer, 2012; Poropat, 2002; Sharpe et al., 2011). Findings in my study also support
this view.
In summary, optimism is a personality trait that can be related to nearly every
aspect of people’s life. It is clear that for encouraging people in general to be more
hopeful about the future, optimism interventions related to both attributional style
and dispositional optimism are worth further exploration. Though this stage of
research is focused on several aspects of feasibility, such as manual development,
pilot testing, and psychometric evaluation, the current investigation in my studies
supports the feasibility of prophylactic optimism intervention in reducing depressive
symptoms. The results indicate that positive interventions using optimism may be
suitable to study and establish effective early intervention for decreasing depressive
symptoms.
In recent years, the effects of positive thinking and behaviour have received
growing attention by psychologists, sociologists, anthropologists, clinicians, and
health professionals. With the increase in popularity of positive psychology,
optimism has gained more attention from the field of positive social science, and
allows for an examination of more aspects in life outcomes, such as the domain of
social relationships. It has been reported that optimism is linked to greater social
network size, and greater social support than pessimism (Carver & Scheier, 2014).
Given the accumulation of evidence, it is clear that optimism is an individual
difference variable that plays a central role in human experience in positive

Understanding Optimism
Chapter 9: Understanding optimism 252
psychology. Psychologists interested in optimism tend to correlate it with many other
psychological constructs, for instance those related to explanatory style and
dispositional optimism.
Although our findings provide some insight into the intricate covariations
frequently observed between certain psychological traits and optimism, a few
methodological and sampling limitations of my studies must be mentioned. First, all
the samples involved are consisted of college students, which might have specific
characteristics in optimism. Previous studies have shown that older people may have
different characteristics comparing with younger people. For example, in samples
including Americans and Hong Kong Mainland Chinese, You et al. (2009) reported
that older Mainland Chinese displayed a lower level of dispositional optimism than
did younger Mainland Chinese, whereas older Americans showed a higher level of
dispositional optimism than their younger counterparts. However, there is no
concrete evidence supporting this view in explanatory style in Chinese samples as far
as I know. Second, all the participants are undergraduates studying in the cities. The
level of optimism and correlations between optimism and other psychological
constructs, like psychological well-being, might vary to backgrounds of rural/urban
or different social economic status (Heinonen et al., 2006; MacLeod & Conway,
2005). Accordingly, further investigations and future studies would link optimism
variation to samples of several age groups, with different social backgrounds and
other features that might have influences on optimism. Third, it should be kept in
mind that SEM does not allow one to many any confident causal inferences about
relationships between variables. A model that fits the data well can only explain part
of the true correlations but not the whole truth. Thus, my conclusions got though
SEM modelling remain tentative. Additional work on these relations will strengthen
inferences regarding some pathways that have not been previously reported.
Fourth, though the two intervention studies have both supported effectiveness of
optimism intervention in promoting psychological well-being, especially in
decreasing depressive symptoms, they were only pilot studies with relatively small
samples of college students. It should be very cautious to generalize these findings in
people with wide backgrounds and varieties. Another possible limit was the use of

Understanding Optimism
Chapter 9: Understanding optimism 253
self-report surveys in assessing variables involved in all my studies. As discussed,
people’s self-reporting perceptions of optimism-related traits may be greatly affected
by social desirability. Data from multiple perspectives, such as reports from friends
and family members, might improve findings’ validity and reduce problems of
shared method variance.
9.6 Is optimism always good? Is pessimism always bad? The evolutionary explanations for optimism and pessimism
Having a different approach in dealing with people and happenings in the
surrounding world, in attempts to solve problems encountering in life, in attributional
styles to explain good or bad life events, in coping strategies facing difficult
situations, and even in attitudes dealing with social relationships, optimists and
pessimists behave differently in many core psychological and social processes, which
undoubtedly have substantial impacts on every aspect of their lives. Basically,
optimism and pessimism have been taken as inherent aspects of human nature and
also as individual differences in both theoretical discussions and empirical
investigations. Diverse benefits of optimism and concomitant drawbacks of
pessimism have been documented by a number of researches in psychology and
other social fields.
It has long been believed that positive thinking is linked to promising feeling.
Such an assertion has been examined over the last 35 years, with much solid
scientific evidence provided by psychologists through numerous empirical studies. In
addition to the benefits of being optimistic on physical health, it also has to be made
clear that positive thinking is linked to physical well-being only through a complex
process that involves intertwined biological, emotional, cognitive, and social
elements (Peterson & Bossio, 2001), but does not directly determine how well people
feel about their physical health.
The evidence reviewed in the prior sections suggests that being optimistic
seems like holding the keys to a rich and fulfilling life. Optimism is such an adaptive
feature that it is positively correlated with promising results in various contexts.

Understanding Optimism
Chapter 9: Understanding optimism 254
Conversely, pessimism is such an unfavourable trait that it indicates passivity,
failure, social estrangement, mortality, and depression.
Generally speaking, lines of research in optimism and pessimism are
surprisingly uniform, so much so that a popular trend of optimism has been created,
within psychology as well as the general public. Then one question comes: Why
pessimism has not been entirely abandoned in the life of human being? To answer
this question properly, we have to first entangle the relationship of optimism and
pessimism from an evolutionary view, and also review some concrete evidence of the
downside optimism and upside of pessimism.
Optimism has long been taken as an inherent aspect of human nature and one
of the most defining and adaptive characteristics of human being (Tiger, 1979). From
an evolutionary view, Tiger speculated that optimism first appeared when people
began to think about the future concerning dire consequences, which their own
mortality was included. To counteract the fear and powerlessness that these
anticipations might involve, something entailing hope had to be developed. Then
optimism came as an inherent and nature part of human nature.
To think about the evolutionary nature of optimism, we have to deal with the
relationship of optimism and pessimism. Are there effects of optimism above and
beyond those of the absence of pessimism? This intriguing question has to be
investigated first. Optimism and pessimism are usually taken as mutually exclusive,
but there is evidence that they are not. Taking one of the most popular measuring
tools of optimism, the LOT, as example, optimism was constructed reflecting a
bipolar construct (Scheier & Carver, 1985). That is, there is plentiful possibility that
some people expect both good things and bad things. Optimism and pessimism are
not exclusively independent of one another.
Similarly, though explanatory style was originally differentiated as two
independent categories, which assigns people an optimistic or a pessimistic
explanatory style. An optimistic explanatory style consists of explaining positive
events as enduring, global and internally generated, while also explaining negative
events as unstable, specific, and externally caused (Forgeard & Seligman, 2012).
Concept of attributional style also predicts that the three types of explanation are
correlated each other within at least within each event valence. Subsequent

Understanding Optimism
Chapter 9: Understanding optimism 255
researches have resolved in findings that are somewhat counterintuitive. For
instance, P.J. Corr and J.A. Gray (1996) investigated the factor structure of the ASQ
in two independent samples and found that positive and negative explanatory styles
were independent. The study of Bunce and Peterson (1997) also revealed that there is
no correlation between explanations for positive and negative events. This
independence was reported in my SEM analysis of ASQ in two Chinese samples as
well. Along these lines, as already noted, explanatory style derived from attributions
about negative events and explanatory style based on attributions about positive
events may be not as independent as originally thought. It might be best to view
explanatory style as a strategy of excuse making (Snyder et al., 1996). For most
individuals, mixed attributional styles should be expected: such as optimistic
explanations for negative events and pessimistic attributions for positive events.
Within attributional models of depression, the attributions are seen to cause
heavy distinct behavioural consequences. For instance, low self-esteem is agreed to
be linked with internal attributions regarding negative events, while chronic
depression is suggested to result from stable attributions for negative events (Haugen
& Lund, 1998; Peterson et al., 1982). In this learned helplessness model, depression
emerges as a consequence of experience with uncontrollable negative events
(Abramson et al., 1978).
From the underlying assumption of positive psychology, psychological well-
being cannot be simply seen as the absence of distress and negative emotions.
Positive states or traits are not necessarily the obverse of negative experiences and
traits; and positive emotions and behaviours are described by a completely separate
psychological process that functions via an isolated neural mechanism (Duckworth et
al., 2005). Along these lines, dispositional optimism is not necessarily the obverse of
dispositional pessimism; and optimistic explanatory style is not exclusively absence
of pessimistic explanatory style.
In addition to the evolutionary explanations and theoretical origins of
optimism and pessimism, evidence from some empirical studies has proven that
optimism in some circumstances can have drawbacks and costs. Researchers have
begun to look for these qualifying conditions in various contexts. It is proposed that
optimists may have worse experiences in confronting negative outcomes than

Understanding Optimism
Chapter 9: Understanding optimism 256
pessimists due to their disconfirmed promising expectations (Gibson &
Sanbonmatsu, 2004). Accordingly, a question has then been raised virtually from the
inception of research on the optimism structure:Are there certain contexts or
situations in which optimism can potentially result in undesirable outcomes?
Some studies have tried to answer this question with concrete evidences. For
example, Gibson and Sanbonmatsu (2004) investigated relationships between
dispositional optimism and gambling expectations and behaviours. They reported
that optimists had more positive expectations for gambling than did pessimists, and
were more likely to maintain their betting even after poor outcomes. These findings
suggest that too much confidence and persistence might be counterproductive at least
in certain kinds of contexts, such as gambling.
Also, it has been suggested that optimism might not have the same protective
benefits as pessimism because optimists tend to see only what they want to see and
might ignore information of potential health threats (Norem & Chang, 2002). For
example, Luo and Isaacowitz (2007) examined how optimists process health-related
information regarding skin cancer. Their results indicated that pessimists paid more
attention to negative health-related information than optimists in certain kinds of
situations, though optimists were more likely to perform adaptive health-promoting
behaviours. These results suggest the possibility of different information-processing
methods between optimists and pessimists.
In another study, Hmieleski and Baron (2009) reported a negative relationship
between entrepreneurs’ optimism and their performance, defined as revenue and
employment growth of their new ventures. This negative relationship suggests that
optimists often hold unrealistic expectations and are overconfident, which was
assumed to lead to poor decision-making in processing negative information. In a
very recent study, Lau et al. (2014) did not find a positive relationship between
optimism and positive affect. Instead, pessimism showed beneficial effects on
positive affect and feelings of success when optimism and internal attribution were
disentangled.
Though these rare findings of potential adverse effects of optimism seem
small in comparison with the vast beneficial effects of being optimistic, they should
be taken into account when considering the effects of optimism, at least in certain

Understanding Optimism
Chapter 9: Understanding optimism 257
kinds of contexts and situations. It should be kept in mind that pessimism is an
independent trait that has its own evolutionary origin and theoretical meaning.
Optimism and pessimism are not the absence of each other.

Understanding Optimism
258
Reference
Abdel-Khalek, A., & Lester, D. (2006). Optimism and pessimism in Kuwaiti and
American college students. International journal of social psychiatry, 52(2),
110-126.
Abramson, & Metalsky. (1989). The Cognitive Style Questionnaire: Measurement of
negative cognitive styles about self and consequences. Unpublished
manuscript.
Abramson, Metalsky, G. I., & Alloy, L. B. (1989). Hopelessness depression: A
theory-based subtype of depression. Psychological review, 96(2), 358.
Abramson, Seligman, & Teasdale. (1978). Learned helplessness in humans: critique
and reformulaiton. Journal of Abnormal Psychology, 87(1), 49-74. doi:
10.1037//0021-843x.87.1.49
Ahrens, A. H., & Haaga, D. A. F. (1993). The specificity of attributional style and
expectations to positive and negative affectivity, depression, and anxiety.
Cognitive therapy and research, 17(1), 83-98. doi: 10.1007/bf01172742
Alarcon, G. M., Bowling, N. A., & Khazon, S. (2013). Great expectations: A meta-
analytic examination of optimism and hope. Personality and Individual
Differences, 54(7), 821-827. doi: http://dx.doi.org/10.1016/j.paid.2012.12.004
Anderson, C. A. (1999). Attributional style, depression, and loneliness: A cross-
cultural comparison of American and Chinese students. Personality and
Social Psychology Bulletin, 25(4), 482-499. doi:
10.1177/0146167299025004007
Andersson, G. (1996). The benefits of optimism: A meta-analytic review of the Life
Orientation Test. Personality and Individual Differences, 21(5), 719-725.
Applebaum, A., Stein, E., Rosenfeld, B., & Breitbart, W. (2012). Optimism, Social
Support and Mental Health Outcomes in Patients With Advanced Cancer.
Psycho-Oncology, 21, 96-96.
Arbuckle, J. (2008). Amos 17.0. 0. AMOS Development Corporation, Crawfordville.
Armbruster, D., Pieper, L., Klotsche, J., & Hoyer, J. (2015). Predictions get tougher
in older individuals: a longitudinal study of optimism, pessimism and
depression. Social psychiatry and psychiatric epidemiology, 50(1), 153-163.
doi: 10.1007/s00127-014-0959-0
Ashkanasy, N. M. (1997). Attributions for the performance of self and other: it
matters who the “other” is. Australian journal of psychology, 49(1), 14-20.
Atienza, A. A., Stephens, M. A. P., & Townsend, A. L. (2004). Role stressors as
predictors of changes in womens’ optimistic expectations. Personality and
Individual Differences, 37(3), 471-484.
Augusto-Landa, J. M., Pulido-Martos, M., & Lopez-Zafra, E. (2011). Does Perceived
Emotional Intelligence and Optimism/pessimism Predict Psychological Well-
being? Journal of Happiness Studies, 1-12.
Austenfeld, J. L., Paolo, A. M., & Stanton, A. L. (2006). Effects of Writing About
Emotions Versus Goals on Psychological and Physical Health Among
Third‐Year Medical Students. Journal of Personality, 74(1), 267-286.
Austin, J. T., & Vancouver, J. B. (1996). Goal constructs in psychology: Structure,
process, and content. Psychological bulletin, 120(3), 338.

Understanding Optimism
259
Aydin, G. (1988). The remediation of children's helpless explanatory style and
related unpopularity. Cognitive therapy and research, 12(2), 155-165.
Baron, R. M., & Kenny, D. A. (1986). The moderator–mediator variable distinction
in social psychological research: Conceptual, strategic, and statistical
considerations. Journal of personality and social psychology, 51(6), 1173.
Beck. (1976). Cognitive therapy and the emotional disorders.
Beck, J. S., & Beck, A. T. (2011). Cognitive behavior therapy: Basics and beyond:
The Guilford Press.
Bennett, K. K., & Elliott, M. (2005). Pessimistic explanatory style and cardiac health:
What is the relation and the mechanism that links them? Basic and Applied
Social Psychology, 27(3), 239-248. doi: 10.1207/s15324834basp2703_5
Billingsley, K. D., Waehler, C. A., & Hardin, S. I. (1993). Stability of optimism and
choice of coping strategy. Perceptual and Motor Skills, 76(1), 91-97.
Blackwell, S. E., Rius-Ottenheim, N., Schulte-van Maaren, Y. W. M., Carlier, I. V.
E., Middelkoop, V. D., Zitman, F. G., . . . Giltay, E. J. (2013). Optimism and
mental imagery: A possible cognitive marker to promote well-being?
Psychiatry Research, 206(1), 56-61. doi: 10.1016/j.psychres.2012.09.047
Boker, S., Neale, M., Maes, H., Wilde, M., Spiegel, M., Brick, T., . . . Fox, J. (2011).
OpenMx: An Open Source Extended Structural Equation Modeling
Framework. Psychometrika, 76(2), 306-317. doi: 10.1007/s11336-010-9200-
6
Boker, S., Neale, M., Maes, H., Wilde, M., Spiegel, M., Brick, T. R., . . . Fox, J.
(2013). OpenMx: Multipurpose Software for Statistical Modeling (Version R
package version 1.3.2). Virginia. Retrieved from
http://openmx.psyc.virginia.edu.
Boland, A., & Cappeliez, P. (1997). Optimism and neuroticism as predictors of
coping and adaptation in older women. Personality and Individual
Differences, 22(6), 909-919.
Bradley, G. W. (1978). Self-serving biases in the attribution process: A
reexamination of the fact or fiction question. Journal of personality and
social psychology, 36(1), 56.
Brandy, J. M., Penckofer, S., Solari-Twadell, P. A., & Velsor-Friedrich, B. (2015).
Factors predictive of depression in first-year college students. Journal of
psychosocial nursing and mental health services, 53(2), 38-44. doi:
10.3928/02793695-20150126-03
Brissette, I., Scheier, M. F., & Carver, C. S. (2002). The role of optimism in social
network development, coping, and psychological adjustment during a life
transition. Journal of personality and social psychology, 82(1), 102.
Bryant, F. B., & Veroff, J. (2007). Savoring: A new model of positive experience.
Buchanan, G. M. C. E., & Seligman, M. E. P. (1995). Explanatory style: Lawrence
Erlbaum Associates, Inc.
Bunce, S. C., & Peterson. (1997). Gender differences in personality correlates of
explanatory style. Personality and Individual Differences, 23(4), 639-646. doi:
10.1016/s0191-8869(97)00072-x
Burns, & Seligman. (1989). Explanatory style across the life span: evidence for
stability over 52 years. Journal of personality and social psychology, 56(3),
471.

Understanding Optimism
260
Burns, D. D. (1980). Feeling good: The new mood therapy. New York: William
Morrow.
Burton, C. M., & King, L. A. (2004). The health benefits of writing about intensely
positive experiences. Journal of Research in Personality, 38(2), 150-163.
Burton, C. M., & King, L. A. (2008). Effects of (very) brief writing on health: The
two‐minute miracle. British Journal of Health Psychology, 13(1), 9-14.
Cabanis, M., Pyka, M., Mehl, S., Müller, B. W., Loos-Jankowiak, S., Winterer,
G., . . . Rapp, A. M. (2013). The precuneus and the insula in self-attributional
processes. Cognitive, Affective, & Behavioral Neuroscience, 13(2), 330-345.
Cadinu, M. R., Arcuri, L., & Kodilja, R. (1993). Sefl-serving biases - the role of
perspective-taking. European Journal of Social Psychology, 23(1), 97-102.
doi: 10.1002/ejsp.2420230109
Campbell, D. T., & Fiske, D. W. (1959). Convergent and Discriminant Validation by
the Multitriat - Multimethod Matrix. Psychological bulletin, 56(2), 81-105.
doi: 10.1037/h0046016
Caprara, G. V., Fagnani, C., Alessandri, G., Steca, P., Gigantesco, A., Sforza, L. L.
C., & Stazi, M. A. (2009). Human optimal functioning: The genetics of
positive orientation towards self, life, and the future. Behav Genet, 39(3),
277-284.
Carver, & Gaines, J. G. (1987). Optimism, pessimism, and postpartum depression.
Cognitive therapy and research, 11(4), 449-462.
Carver, Pozo, C., Harris, S. D., Noriega, V., Scheier, Robinson, D. S., . . . Clark, K.
C. (1993). How coping mediates the effect of optimism on distress: a study of
women with early stage breast cancer. Journal of personality and social
psychology, 65(2), 375.
Carver, & Scheier. (2001). Optimism, pessimism, and self-regulation (chapter 2). In
E. C. Chang (Ed.), Optimism & Pessimism, Implications for theory, research,
and practice. Washington, DC: American Psychological Association.
Carver, & Scheier. (2014). Dispositional optimism. Trends in cognitive sciences.
Carver, Scheier, & Segerstrom. (2010). Optimism. Clinical Psychology Review,
30(7), 879-889.
Carver, Scheier, & Weintraub, J. K. (1989). Assessing coping strategies: a
theoretically based approach. Journal of personality and social psychology,
56(2), 267-283. doi: 10.1037//0022-3514.56.2.267
Cattell, R. B. (1943). The description of personality: Basic traits resolved into
clusters. Journal of Abnormal and Social Psychology, 38(4), 476-506. doi:
10.1037/h0054116
Cecil, M. A., & Medway, F. J. (1986). Attribution retraining with low-achieving and
learned helpless children. Techniques.
Chan, C.-M., & Tsoi, M. M. (1984). The BDI and stimulus determinants of
cognitive-related depression among Chinese college students. Cognitive
therapy and research, 8(5), 501-507.
Chang. (1996). Cultural differences in optimism, pessimism, and coping: Predictors
of subsequent adjustment in Asian American and Caucasian American
college students. Journal of Counseling Psychology, 43(1), 113.

Understanding Optimism
261
Chang. (2001a). Introduction: Optimism and pessimism and moving beyond the most
fundamental question. Optimism and pessimism. Implications for theory,
research and practice, 4-12.
Chang. (2001b). Optimism & pessimism: Implications for theory, research, and
practice: American Psychological Association.
Chang, Maydeu-Olivares, A., & D'Zurilla, T. J. (1997). Optimism and pessimism as
partially independent constructs: Relationship to positive and negative
affectivity and psychological well-being. Personality and Individual
Differences, 23(3), 433-440.
Chang, Sanna, L. J., & Yang, K. M. (2003). Optimism, pessimism, affectivity, and
psychological adjustment in US and Korea: A test of a mediation model.
Personality and Individual Differences, 34(7), 1195-1208.
Chang, L., & McBrideChang, C. (1996). The factor structure of the Life Orientation
Test. Educational and Psychological Measurement, 56(2), 325-329. doi:
10.1177/0013164496056002013
Chemers, M. M., Hu, L.-t., & Garcia, B. F. (2001). Academic self-efficacy and first
year college student performance and adjustment. Journal of educational
psychology, 93(1), 55.
Chen, L., & Zhang, J. (2004). General Life Satisfaction and Self-esteem of
University Students. Chinese Mental Health Journal, 4.
Cheng, S. T., & Hamid, P. N. (1997). Dispositional optimism in Chinese people:
What does the Life Orientation Test measure? International Journal of
Psychology, 32(1), 15-22. doi: 10.1080/002075997400935
Chirivella, E. C., Checa, I., & Budzynska, N. (2013). Coping, optimism and
satisfaction with life among Spanish and Polish football players: a
preliminary study. Revista De Psicologia Del Deporte, 22(2), 337-343.
Colby, D. A., & Shifren, K. (2013). Optimism, mental health, and quality of life: A
study among breast cancer patients. Psychology Health & Medicine, 18(1),
10-20. doi: 10.1080/13548506.2012.686619
Corr, P. J., & Gray, J. A. (1996). Structure and validity of the Attributional Style
Questionnaire: A cross-sample comparison. Journal of Psychology, 130(6),
645-657.
Corr, P. J., & Gray, J. A. (1996). Structure and validity of the Attributional Style
Questionnaire: A cross-sample comparison. The Journal of psychology,
130(6), 645-657.
Costa, & McCrae, R. R. (1992). The Revised NEO Personality Inventory (NEO-PI-R)
and NEO Five Factor Inventory (NEO-FFI) professional manual. .
Costa, & McCrae, R. R. (1995). Domains and facets: Hierarchical personality
assessment using the Revised NEO Personality Inventory. Journal of
personality assessment, 64(1), 21-50.
Creed, P. A., Patton, W., & Bartrum, D. (2002). Multidimensional properties of the
LOT-R: Effects of optimism and pessimism on career and well-being related
variables in adolescents. Journal of Career Assessment, 10(1), 42-61.
Csillik, A., Aguerre, C., & Bay, M. (2012). Positive psychotherapy of depression:
Specificities and clinical contributions. Annales Medico-Psychologiques,
170(8), 541-546. doi: 10.1016/j.amp.2011.10.012

Understanding Optimism
262
Cuijpers, P., Smit, F., Bohlmeijer, E., Hollon, S. D., & Andersson, G. (2010).
Efficacy of cognitive–behavioural therapy and other psychological treatments
for adult depression: meta-analytic study of publication bias. The British
Journal of Psychiatry, 196(3), 173-178.
Cuijpers, P., Van Straten, A., Van Schaik, A., & Andersson, G. (2009).
Psychological treatment of depression in primary care: a meta-analysis. The
British Journal of General Practice, 59(559), e51.
Daukantaite, D., & Zukauskiene, R. (2012). Optimism and Subjective Well-Being:
Affectivity Plays a Secondary Role in the Relationship Between Optimism
and Global Life Satisfaction in the Middle-Aged Women. Longitudinal and
Cross-Cultural Findings. Journal of Happiness Studies, 13(1), 1-16. doi:
10.1007/s10902-010-9246-2
Derogatis, L. R., & Cleary, P. A. (1977). Confirmation of the dimensional structure
of the SCL‐90: A study in construct validation. Journal of Clinical
Psychology, 33(4), 981-989.
Derogatis, L. R., S, L. R., Covi, L., & Rickeis, K. (1973). The SCL-90: An outpatient
psychiatric rating scale. Psychopharmacology Bulletin, 9, 13-28.
Descartes, R. (1985). The philosophical writings of Descartes (Vol. 2): Cambridge
University Press (Original work published 1649).
Diener, E., Emmons, R. A., Larsen, R. J., & Griffin, S. (1985). The satisfaction with
life scale. Journal of personality assessment, 49(1), 71-75.
Diener, E., Suh, E. M., Lucas, R. E., & Smith, H. L. (1999). Subjective well-being:
Three decades of progress. Psychological bulletin, 125(2), 276.
Domino, B., & Conway, D. W. (2001). Optimism and pessimism from a historical
perspective. In E. C. Chang (Ed.), Optimism & pessimism: Implications for
theory, research, and practice (pp. 13-30). Washington, DC: American
Psychological Associatioin.
Duckworth, A. L., Steen, T. A., & Seligman. (2005). Positive psychology in clinical
practice. Annu. Rev. Clin. Psychol., 1, 629-651.
Ebert, S. A., Tucker, D., & Roth, D. (2002). Psychological resistance factors as
predictors of general health status and physical symptom reporting.
Psychology, health & medicine, 7(3), 363-375.
Eichner, K. V., Kwon, P., & Marcus, D. K. (2014). Optimists or optimistic? A
taxometric study of optimism. Psychological Assessment, 26(3), 1056-1061.
doi: 10.1037/pas0000010
Eysenck, H. J. (1965). A 3-factor theory of reminiscence. British Journal of
Psychology, 56(2-3), 163-181.
Ferguson, S. J., & Goodwin, A. D. (2010). Optimism and Well-Being in Older
Adults: The Mediating Role of Social Support and Perceived Control. The
International Journal of Aging and Human Development, 71(1), 43-68.
Fischer, R., & Chalmers, A. (2008). Is optimism universal? A meta-analytical
investigation of optimism levels across 22 nations. Personality and Individual
Differences, 45(5), 378-382. doi: http://dx.doi.org/10.1016/j.paid.2008.05.008
Folkman, S., & Lazarus, R. S. (1980). An analysis of coping in a middle-aged
commmunity sample. Journal of Health and Social Behavior, 21(3), 219-239.
doi: 10.2307/2136617

Understanding Optimism
263
Folkman, S., & Moskowitz, J. T. (2004). Coping: Pitfalls and promise. Annual
review of psychology, 55, 745-774. doi:
10.1146/annurev.psych.55.090902.141456
Fontaine, K. R., Manstead, A. S. R., & Wagner, H. (1993). Optimism, perceived
control over stress, and coping. European Journal of Personality, 7(4), 267-
281. doi: 10.1002/per.2410070407
Forgeard, M. J. C., & Seligman, M. E. P. (2012). Seeing the glass half full: A review
of the causes and consequences of optimism. Pratiques Psychologiques,
18(2), 107-120. doi: 10.1016/j.prps.2012.02.002
Fosnaugh, J., Geers, A. L., & Wellman, J. A. (2009). Giving Off a Rosy Glow: The
Manipulation of an Optimistic Orientation. The Journal of social psychology,
149(3), 349-364.
Fowler, J. W., & Peterson, P. L. (1981). Increasing reading persistence and altering
attributional style of learned helpless children. Journal of educational
psychology, 73(2), 251.
Fresco, Alloy, L. B., & Reilly-Harrington, N. (2006). Association of attributional
style for negative and positive events and the occurrence of life events with
depression and anxiety. Journal of Social and Clinical Psychology, 25(10),
1140-1159. doi: 10.1521/jscp.2006.25.10.1140
Fresco, Moore, M. T., Walt, L., & Craighead, L. W. (2009). Self-administered
optimism training: mechanisms of change in a minimally supervised
psychoeducational intervention. Journal of Cognitive Psychotherapy, 23(4),
350-367.
Freud, S. (1961). The future of an illusion. In J. S. E. a. Trans.) (Ed.), The standard
edition of the complete psychological works of Sigmund Freud (Vol. Vol. 21).
London: Hogarth Press (Original work pulished 1927).
Fry, P. S. (1995). Perfectionism, humor, and optimism as moderators of health
outcomes and determinants of coping styles of women executives. Genetic
Social and General Psychology Monographs, 121(2), 211-&.
Gallagher, M. W., Lopez, S. J., & Pressman, S. D. (2013). Optimism Is Universal:
Exploring the Presence and Benefits of Optimism in a Representative Sample
of the World. Journal of Personality, 81(5), 429-440. doi:
10.1111/jopy.12026
Gibran, K. (1951). The Kahlil Gibran reader: inspirational writings. . New York:
Citadel Press.
Gibson, B., & Sanbonmatsu, D. M. (2004). Optimism, pessimism, and gambling:
The downside of optimism. Personality and Social Psychology Bulletin,
30(2), 149-160.
Gillham, & Reivich, K. (2004). Cultivating optimism in childhood and adolescence.
The Annals of the American Academy of Political and Social Science, 591(1),
146-163.
Gillham, Reivich, K. J., Freres, D. R., Chaplin, T. M., Shatté, A. J., Samuels, B., . . .
Gallop, R. (2007). School-based prevention of depressive symptoms: A
randomized controlled study of the effectiveness and specificity of the Penn
Resiliency Program. Journal of Consulting and Clinical Psychology, 75(1), 9.
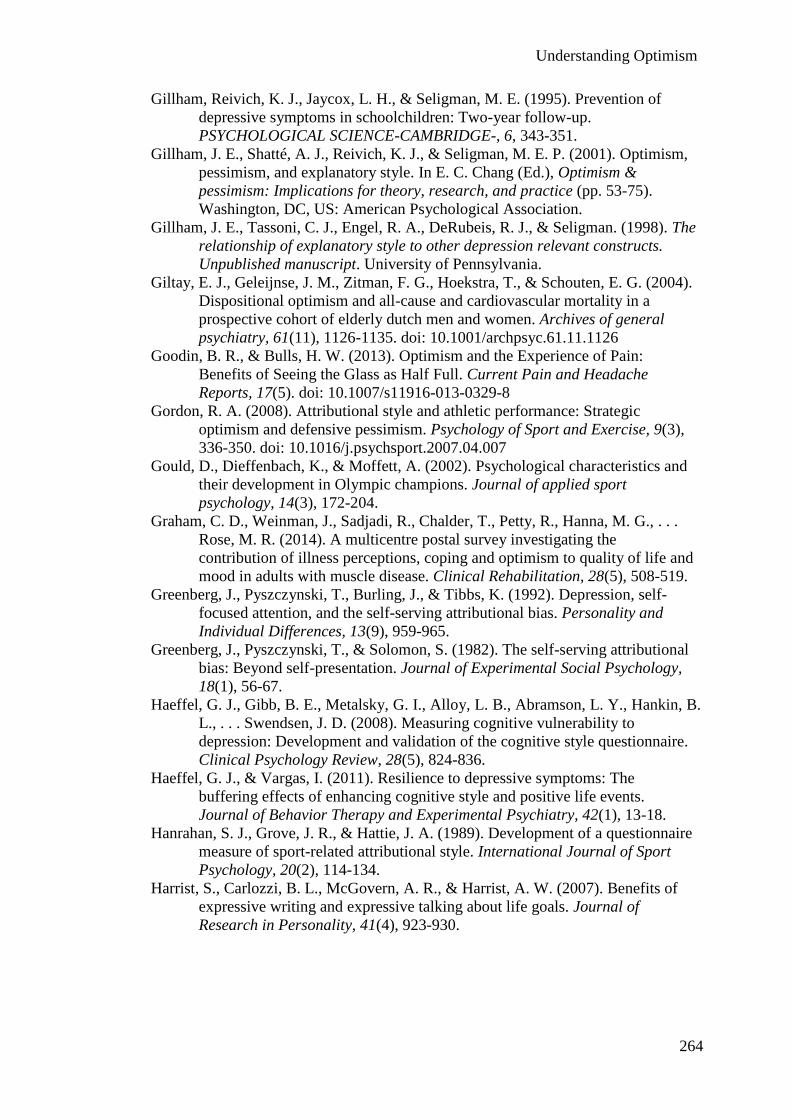
Understanding Optimism
264
Gillham, Reivich, K. J., Jaycox, L. H., & Seligman, M. E. (1995). Prevention of
depressive symptoms in schoolchildren: Two-year follow-up.
PSYCHOLOGICAL SCIENCE-CAMBRIDGE-, 6, 343-351.
Gillham, J. E., Shatté, A. J., Reivich, K. J., & Seligman, M. E. P. (2001). Optimism,
pessimism, and explanatory style. In E. C. Chang (Ed.), Optimism &
pessimism: Implications for theory, research, and practice (pp. 53-75).
Washington, DC, US: American Psychological Association.
Gillham, J. E., Tassoni, C. J., Engel, R. A., DeRubeis, R. J., & Seligman. (1998). The
relationship of explanatory style to other depression relevant constructs.
Unpublished manuscript. University of Pennsylvania.
Giltay, E. J., Geleijnse, J. M., Zitman, F. G., Hoekstra, T., & Schouten, E. G. (2004).
Dispositional optimism and all-cause and cardiovascular mortality in a
prospective cohort of elderly dutch men and women. Archives of general
psychiatry, 61(11), 1126-1135. doi: 10.1001/archpsyc.61.11.1126
Goodin, B. R., & Bulls, H. W. (2013). Optimism and the Experience of Pain:
Benefits of Seeing the Glass as Half Full. Current Pain and Headache
Reports, 17(5). doi: 10.1007/s11916-013-0329-8
Gordon, R. A. (2008). Attributional style and athletic performance: Strategic
optimism and defensive pessimism. Psychology of Sport and Exercise, 9(3),
336-350. doi: 10.1016/j.psychsport.2007.04.007
Gould, D., Dieffenbach, K., & Moffett, A. (2002). Psychological characteristics and
their development in Olympic champions. Journal of applied sport
psychology, 14(3), 172-204.
Graham, C. D., Weinman, J., Sadjadi, R., Chalder, T., Petty, R., Hanna, M. G., . . .
Rose, M. R. (2014). A multicentre postal survey investigating the
contribution of illness perceptions, coping and optimism to quality of life and
mood in adults with muscle disease. Clinical Rehabilitation, 28(5), 508-519.
Greenberg, J., Pyszczynski, T., Burling, J., & Tibbs, K. (1992). Depression, self-
focused attention, and the self-serving attributional bias. Personality and
Individual Differences, 13(9), 959-965.
Greenberg, J., Pyszczynski, T., & Solomon, S. (1982). The self-serving attributional
bias: Beyond self-presentation. Journal of Experimental Social Psychology,
18(1), 56-67.
Haeffel, G. J., Gibb, B. E., Metalsky, G. I., Alloy, L. B., Abramson, L. Y., Hankin, B.
L., . . . Swendsen, J. D. (2008). Measuring cognitive vulnerability to
depression: Development and validation of the cognitive style questionnaire.
Clinical Psychology Review, 28(5), 824-836.
Haeffel, G. J., & Vargas, I. (2011). Resilience to depressive symptoms: The
buffering effects of enhancing cognitive style and positive life events.
Journal of Behavior Therapy and Experimental Psychiatry, 42(1), 13-18.
Hanrahan, S. J., Grove, J. R., & Hattie, J. A. (1989). Development of a questionnaire
measure of sport-related attributional style. International Journal of Sport
Psychology, 20(2), 114-134.
Harrist, S., Carlozzi, B. L., McGovern, A. R., & Harrist, A. W. (2007). Benefits of
expressive writing and expressive talking about life goals. Journal of
Research in Personality, 41(4), 923-930.

Understanding Optimism
265
Haugen, R., & Lund, T. (1998). Attributional style and its relation to other
personality dispositions. British Journal of Educational Psychology, 68, 537-
549.
Haynes, Perry, R. P., Stupnisky, R. H., & Daniels, L. M. (2009). A review of
attributional retraining treatments: Fostering engagement and persistence in
vulnerable college students Higher education: Handbook of theory and
research (pp. 227-272): Springer.
Haynes, Ruthig, J. C., Perry, R. P., Stupnisky, R. H., & Hall, N. C. (2006). Reducing
the academic risks of over-optimism: The longitudinal effects of attributional
retraining on cognition and achievement. Research in Higher Education,
47(7), 755-779.
Haynes, P. L., Ancoli-Israel, S., Walter, C. M., & McQuaid, J. R. (2012).
Preliminary Evidence for a Relationship Between Sleep Disturbance and
Global Attributional Style in Depression. Cognitive therapy and research,
36(2), 140-148. doi: 10.1007/s10608-011-9416-5
Heider, F. (1958). The psychology of interpersonal relations. New York: Wildy.
Heine, S. J., & Lehman, D. R. (1995). Cultural variation in unrealistic optimism:
Does the West feel more vulnerable than the East? Journal of personality and
social psychology, 68(4), 595.
Heine, S. J., Lehman, D. R., Markus, H. R., & Kitayama, S. (1999). Is there a
universal need for positive self-regard? Psychological review, 106(4), 766.
Heinonen, K., Raikkonen, K., Matthews, K. A., Scheier, M. F., Raitakari, O. T.,
Pulkki, L., & Keltikangas-Jarvinen, L. (2006). Socioeconomic status in
childhood and adulthood: Associations with dispositional optimism and
pessimism over a 21-year follow-up. Journal of Personality, 74(4), 1111-
1126. doi: 10.1111/j.1467-6494.2006.00404.x
Herzberg, P. Y., Glaesmer, H., & Hoyer, J. (2006). Separating optimism and
pessimism: A robust psychometric analysis of the Revised Life Orientation
Test (LOT-R). Psychological Assessment, 18(4), 433.
Hewitt, A. K., Foxcroft, D. R., & MacDonald, J. (2004). Multitrait-multimethod
confirmatory factor analysis of the attributional style questionnaire.
Personality and Individual Differences, 37(7), 1483-1491. doi:
10.1016/j.paid.2004.02.005
Higgins, N. C., & Bhatt, G. (2001). Culture moderates the self-serving bias: Etic and
emic features of causal attributions in India and in Canada. Social Behavior
and Personality: an international journal, 29(1), 49-61.
Higgins, N. C., Zumbo, B. D., & Hay, J. L. (1999). Construct validity of attributional
style: Modeling context-dependent item sets in the Attributional Style
Questionnaire. Educational and Psychological Measurement, 59(5), 804-820.
doi: 10.1177/00131649921970152
Hiroto, D. S., & Seligman, M. E. (1975). Generality of learned helplessness in man.
Journal of personality and social psychology, 31(2), 311.
Hjelle, L., Belongia, C., & Nesser, J. (1996). Psychometric properties of the life
orientation test and attributional style questionnaire. Psychological Reports,
78(2), 507-515.

Understanding Optimism
266
Hmieleski, K. M., & Baron, R. A. (2009). Entrepreneurs' optimism and new venture
performance: A social cognitive perspective. Academy of management
Journal, 52(3), 473-488.
Ho, M. Y., Cheung, F. M., & Cheung, S. F. (2010). The role of meaning in life and
optimism in promoting well-being. Personality and Individual Differences,
48(5), 658-663.
Hochhausen, N., Altmaier, E. M., McQuellon, R., Davies, S. M., Papadopolous, E.,
Carter, S., & Henslee-Downey, J. (2007). Social support, optimism, and self-
efficacy predict physical and emotional well-being after bone marrow
transplantation. Journal of Psychosocial Oncology, 25(1), 87-101. doi:
10.1300/J077v25n01_05
Horney, D. J., Smith, H. E., McGurk, M., Weinman, J., Herold, J., Altman, K., &
Llewellyn, C. D. (2011). Association between quality of life, coping styles,
optimism, and anxiety and depression in pretreatment patient with head and
neck cancer. Head and Neck-Journal for the Sciences and Specialties of the
Head and Neck, 33(1), 65-71. doi: 10.1002/hed.21407
Hu, L., & Bentler, P. M. (1999). Cutoff criteria for fit indexes in covariance structure
analysis: Coventional criteria versus new alternatives. Structural Equation
Modeling, 6, 1-55.
Iacoviello, B. M., Alloy, L. B., Abramson, L. Y., Whitehouse, W. G., & Hogan, M. E.
(2006). The course of depression in individuals at high and low cognitive risk
for depression: A prospective study. Journal of affective disorders, 93(1–3),
61-69. doi: http://dx.doi.org/10.1016/j.jad.2006.02.012
Isaacowitz, D. M. (2005). Correlates of well-being in adulthood and old age: A tale
of two optimisms. Journal of Research in Personality, 39(2), 224-244.
Isaacowitz, D. M., & Seligman. (2002). Cognitive style predictors of affect change in
older adults. The International Journal of Aging and Human Development,
54(3), 233-253.
James, W. (1985). The varieties of religious experience (Vol. 13): Harvard
University Press.
Jaycox, L. H., Reivich, K. J., Gillham, J., & Seligman, M. E. (1994). Prevention of
depressive symptoms in school children. Behaviour Research and Therapy,
32(8), 801-816.
Johnstone, J., Rooney, R. M., Hassan, S., & Kane, R. T. (2014). Prevention of
depression and anxiety symptoms in adolescents: 42 and 54 months follow-
up of the Aussie Optimism Program-Positive Thinking Skills. Frontiers in
Psychology, 5. doi: 10.3389/fpsyg.2014.00364
Joiner, T. E., & Wagner, K. D. (1995). Attributional style and depression in children
and adolescents: A meta-analytic review. Clinical Psychology Review, 15(8),
777-798. doi: 10.1016/0272-7358(95)00046-1
Jones, E. E., & Nisbett, R. E. (1972). The actor and the observer: Divergent
perceptions of the causes of behavior. In E. E. Jones, D. E. Kanouse, H. H.
Kelley, R. E. Nisbett, S. Valins & B. Weiner (Eds.), Attribution: Perceiving
the causes of behavior (pp. 79-84): General Learning Press Morristown, NJ.
Jowsey, S. G., Cutshall, S. M., Colligan, R. C., Stevens, S. R., Kremers, W. K.,
Vasquez, A. R., . . . McGregor, C. G. A. (2012). Seligman's theory of
attributional style: optimism, pessimism, and quality of life after heart

Understanding Optimism
267
transplant. Progress in Transplantation, 22(1), 49-55. doi:
10.7182/pit2012451
Ju, H., Shin, J. W., Kim, C.-W., Hyun, M.-H., & Park, J.-W. (2013). Mediational
effect of meaning in life on the relationship between optimism and well-being
in community elderly. Archives of gerontology and geriatrics, 56(2), 309-313.
doi: 10.1016/j.archger.2012.08.008
Kam, C., & Meyer, J. P. (2012). Do optimism and pessimism have different
relationships with personality dimensions? A re-examination. Personality and
Individual Differences, 52(2), 123-127. doi: 10.1016/j.paid.2011.09.011
Kamen, L. P., & Seligman, M. E. P. (1987). Explanaotry style and health. Current
Psychology-Research & Reviews, 6(3), 207-218. doi: 10.1007/bf02686648
Kashima, Y., & Triandis, H. C. (1986). The Sefl-serving Bias in attibutions as a
coping stratege: A cross-cultural study. Journal of Cross-Cultural Psychology,
17(1), 83-97. doi: 10.1177/0022002186017001006
Kaslow, N. J., Tannenbau, R. L., & Seligman. (1978). The KASTAN: A children's
attributional style questionnaire. . Unpublished manuscript. University of
Pennsylvania. Philadelphia.
King, L. A. (2001). The health benefits of writing about life goals. Personality and
Social Psychology Bulletin, 27(7), 798-807.
Kirsch, I., Moore, T. J., Scoboria, A., & Nicholls, S. S. (2002). The emperor's new
drugs: An analysis of antidepressant medication data submitted to the US
Food and Drug Administration. Prevention & Treatment, 5(1), 23a.
Kleiman, E. M., Liu, R. T., & Riskind, J. H. (2013). Enhancing attributional style as
a resiliency factor in depressogenic stress generation. Anxiety, stress, and
coping, 26(4), 467-474. doi: 10.1080/10615806.2012.684381
Klein, D. C., Fencil-Morse, E., & Seligman, M. E. (1976). Learned helplessness,
depression, and the attribution of failure. Journal of personality and social
psychology, 33(5), 508.
Kubzansky, L. D., Kubzansky, P. E., & Maselko, J. (2004). Optimism and pessimism
in the context of health: bipolar opposites or separate constructs? Personality
and Social Psychology Bulletin, 30(8), 943.
Kurtovic, A. (2012). Relationship between Attributions for Success and Failure and
Self-esteem, Hopelessness and Depression in Secondary School Students.
Croatian Journal of Education-Hrvatski Casopis Za Odgoj I Obrazovanje,
14(4), 771-797.
Lai, J. C. L. (1997). Relative predictive power of the optimism versus the pessimism
index of a Chinese version of the life orientation test. Psychological Record,
47(3), 399-410.
Lai, J. C. L., Cheung, H., Lee, W. M., & Yu, H. (1998). The utility of the revised life
orientation test to measure optimism among Hong Kong Chinese.
International Journal of Psychology, 33(1), 45-56.
Lai, J. C. L., & Yue, X. D. (2000). Measuring optimism in Hong Kong and mainland
Chinese with the revised Life Orientation Test. Personality and Individual
Differences, 28(4), 781-796. doi: 10.1016/s0191-8869(99)00138-5
Lau, S., Kubiak, T., Burchert, S., Goering, M., Oberlaender, N., von Mauschwitz,
H., . . . Hiemisch, A. (2014). Disentangling the effects of optimism and

Understanding Optimism
268
attributions on feelings of success. Personality and Individual Differences, 56,
78-82. doi: 10.1016/j.paid.2013.08.030
Layous, K., Chancellor, J., Lyubomirsky, S., Wang, L., & Doraiswamy, P. M. (2011).
Delivering happiness: Translating positive psychology intervention research
for treating major and minor depressive disorders. The Journal of Alternative
and Complementary Medicine, 17(8), 675-683.
Ledrich, J., & Gana, K. (2013). Relationship between attributional style, perceived
control, self-esteem, and depressive mood in a nonclinical sample: A
structural equation-modelling approach. Psychology and Psychotherapy-
Theory Research and Practice, 86(4), 413-430. doi: 10.1111/j.2044-
8341.2012.02067.x
Lee, Y.-T., & Seligman, M. E. (1997). Are Americans more optimistic than the
Chinese? Personality and Social Psychology Bulletin, 23, 32-40.
Leibniz, G. W. (2010). Theodicy: Cosimo, Inc. (Original work published 1710).
Lemola, S., Räikkönen, K., Scheier, M. F., Matthews, K. A., Pesonen, A. k.,
Heinonen, K., . . . Kajantie, E. (2011). Sleep quantity, quality and optimism
in children. Journal of sleep research, 20(1pt1), 12-20.
Lemola, S., Raikkonen, K., Gomez, V., & Allemand, M. (2013). Optimism and Self-
Esteem Are Related to Sleep. Results from a Large Community-Based
Sample. International Journal of Behavioral Medicine, 20(4), 567-571. doi:
10.1007/s12529-012-9272-z
Li, C.-H. (2012). Validation of the Chinese Version of the Life Orientation Test With
A Robust Weighted Least Squares Approach. Psychological Assessment,
24(3), 770-776. doi: 10.1037/a0026612
Libby, R., & Rennekamp, K. (2012). Self-Serving Attribution Bias, Overconfidence,
and the Issuance of Management Forecasts. Journal of Accounting Research,
50(1), 197-231. doi: 10.1111/j.1475-679X.2011.00430.x
Linley, P. A., Nielsen, K. M., Wood, A. M., Gillett, R., & Biswas-Diener, R. (2010).
Using signature strengths in pursuit of goals: Effects on goal progress, need
satisfaction, and well-being, and implications for coaching psychologists.
International Coaching Psychology Review, 5(1), 6-15.
Littman-Ovadia, H., & Nir, D. (2014). Looking forward to tomorrow: The buffering
effect of a daily optimism intervention. Journal of Positive Psychology, 9(2),
122-136. doi: 10.1080/17439760.2013.853202
Llewellyn, C. D., Horney, D. J., McGurk, M., Weinman, J., Herold, J., Altman, K.,
& Smith, H. E. (2013). Assessing the psychological predictors of benefit
finding in patients with head and neck cancer. Psycho-Oncology, 22(1), 97-
105. doi: 10.1002/pon.2065
Lounsbury, J. W., Saudargas, R. A., & Gibson, L. W. (2004). An investigation of
personality traits in relation to intention to withdraw from college. Journal of
College Student Development, 45(5), 517-534.
Low, C. A., Stanton, A. L., & Danoff-Burg, S. (2006). Expressive disclosure and
benefit finding among breast cancer patients: mechanisms for positive health
effects. Health Psychology, 25(2), 181.
Lucas, R. E., Diener, E., & Suh, E. (1996). Discriminant validity of well-being
measures. Journal of personality and social psychology, 71(3), 616.

Understanding Optimism
269
Luo, J., & Isaacowitz, D. M. (2007). How optimists face skin cancer information:
risk assessment, attention, memory, and behavior. Psychology and Health,
22(8), 963-984.
Lyubomirsky, S., Dickerhoof, R., Boehm, J. K., & Sheldon, K. M. (2011). Becoming
happier takes both a will and a proper way: An experimental longitudinal
intervention to boost well-being. Emotion, 11(2), 391.
Mäkikangas, A., & Kinnunen, U. (2003). Psychosocial work stressors and well-being:
Self-esteem and optimism as moderators in a one-year longitudinal sample.
Personality and Individual Differences, 35(3), 537-557.
MacLeod, A. K., & Conway, C. (2005). Well‐being and the anticipation of future
positive experiences: The role of income, social networks, and planning
ability. Cognition & Emotion, 19(3), 357-374.
Maier, & Seligman. (1976). Learned helplessness: Theory and evidence. Journal of
Experimental Psychology: General; Journal of Experimental Psychology:
General, 105(1), 3.
Malle, B. F. (2006). The actor-observer asymmetry in attribution: a (surprising)
meta-analysis. Psychological bulletin, 132(6), 895.
Markus, H. R., & Kitayama, S. (1991). Culture and the self: Implications for
cognition, emotion, and motivation. Psychological review, 98(2), 224.
Marshall, Wortman, C. B., Kusulas, J. W., Hervig, L. K., & Vickers Jr, R. R. (1992).
Distinguishing optimism from pessimism: Relations to fundamental
dimensions of mood and personality. Journal of personality and social
psychology, 62(6), 1067.
Marshall, M., & Brown, J. (2006). Emotional reactions to achievement outcomes: Is
it really best to expect the worst? Cognition & Emotion, 20(1), 43-63.
Matthews, K. A., Räikkönen, K., Sutton-Tyrrell, K., & Kuller, L. H. (2004).
Optimistic attitudes protect against progression of carotid atherosclerosis in
healthy middle-aged women. Psychosomatic Medicine, 66(5), 640-644.
McCrae, R. R., & Costa, P. T. (1987). Validation of the 5-factor model of personality
across instruments and observers. Journal of personality and social
psychology, 52(1), 81-90. doi: 10.1037/0022-3514.52.1.81
McPherson, J., & Mohr, P. (2005). The role of item extremity in the emergence of
keying-related factors: an exploration with the life orientation test.
Psychological methods, 10(1), 120.
Medway, F. J., & Lowe, C. A. (1976). Effect of stimulus person valence on divergent
self-other attributions for success and failure. Journal of Research in
Personality, 10(3), 266-278. doi: 10.1016/0092-6566(76)90017-9
Meevissen, Y., Peters, M. L., & Alberts, H. J. E. M. (2011). Become more optimistic
by imagining a best possible self: Effects of a two week intervention. Journal
of Behavior Therapy and Experimental Psychiatry.
Metalsky, G. I., Joiner, T. E., Hardin, T. S., & Abramson, L. Y. (1993). Depressive
reactions to failure in a naturalistic setting: A test of the hopelessness and
self-esteem theories of depression. Journal of Abnormal Psychology, 102(1),
101.
Mezulis, A. H., Abramson, L. Y., Hyde, J. S., & Hankin, B. L. (2004). Is there a
universal positivity bias in attributions? A meta-analytic review of individual,

Understanding Optimism
270
developmental, and cultural differences in the self-serving attributional bias.
Psychological bulletin, 130(5), 711.
Michalos, A. C. (1988). Optimism in thirty countries over a decade. Social Indicators
Research, 20(2), 177-180.
Miller, D. T., & Ross, M. (1975). Self-serving biases in the attribution of causality:
Fact or fiction? Psychological bulletin, 82(2), 213.
Miller, J. G. (1984). Culture and the development of everyday social explanation.
Journal of personality and social psychology, 46(5), 961.
Minton, M. E., Hertzog, M., Barron, C. R., French, J. A., & Reiter-Palmon, R. (2009).
The First Anniversary: Stress, Well-Being, and Optimism in Older Widows.
Western Journal of Nursing Research, 31(8), 1035-1056.
Monzani, D., Steca, P., & Greco, A. (2014). Brief report: Assessing dispositional
optimism in adolescence--factor structure and concurrent validity of the Life
Orientation Test--Revised. Journal of adolescence, 37(2), 97-101. doi:
10.1016/j.adolescence.2013.11.006
Mosing, M. A., Medland, S. E., McRae, A., Landers, J. G., Wright, M. J., & Martin,
N. G. (2012). Genetic Influences on Life Span and Its Relationship to
Personality: A 16-Year Follow-Up Study of a Sample of Aging Twins.
Psychosomatic Medicine, 74(1), 16-22. doi:
10.1097/PSY.0b013e3182385784
Mosing, M. A., Pedersen, N. L., Martin, N. G., & Wright, M. J. (2010). Sex
Differences in the Genetic Architecture of Optimism and Health and Their
Interrelation: A Study of Australian and Swedish Twins. Twin Research and
Human Genetics, 13(4), 322-329.
Mosing, M. A., Zietsch, B. P., Shekar, S. N., Wright, M. J., & Martin, N. G. (2009).
Genetic and Environmental Influences on Optimism and its Relationship to
Mental and Self-Rated Health: A Study of Aging Twins. Behav Genet, 39(6),
597-604. doi: 10.1007/s10519-009-9287-7
Musgrave-Marquart, D., Bromley, S. P., & Dalley, M. B. (1997). Personality,
academic attribution, and substance use as predictors of academic
achievement in college students. Journal of Social Behavior and Personality,
12(2), 501-511.
Myers, D. G., & Diener, E. (1995). Who is happy? Psychological Science, 6(1), 10-
19.
Negovan, V., & Bagana, E. (2011). A comparison of relationship between self
esteem and vulnerability to depression among high school and freshmen
university students. In D. E. Ongen, C. Hursen, M. Halat & H. Boz (Eds.),
2nd World Conference on Psychology, Counselling and Guidance-2011 (Vol.
30).
Nes, & Segerstrom. (2006). Dispositional optimism and coping: A meta-analytic
review. Personality and Social Psychology Review, 10(3), 235-251. doi:
10.1207/s15327957pspr1003_3
Nes, L. S., Evans, D. R., & Segerstrom, S. C. (2009). Optimism and College
Retention: Mediation by Motivation, Performance, and Adjustment(1).
Journal of Applied Social Psychology, 39(8), 1887-1912.

Understanding Optimism
271
Nes, L. S., Segerstrom, S. C., & Sephton, S. E. (2005). Engagement and arousal:
Optimism’s effects during a brief stressor. Personality and Social Psychology
Bulletin, 31(1), 111-120.
Nicholls, A. R., Polman, R. C. J., Levy, A. R., & Backhouse, S. H. (2008). Mental
toughness, optimism, pessimism, and coping among athletes. Personality and
Individual Differences, 44(5), 1182-1192. doi: 10.1016/j.paid.2007.11.011
Norem, J. K., & Chang, E. C. (2002). The positive psychology of negative thinking.
Journal of Clinical Psychology, 58(9), 993-1001.
Norvell, N. K. (1992). Health and optimism - new research on the relationship
between positive thinking and physical well-being. Journal of Nervous and
Mental Disease, 180(3), 214-214.
Nurmi, J. E. (1992). Cross-cultural differences in self-serving bias - responses to the
Attributional Sytle Questionnaire by American and Finnish students. Journal
of Social Psychology, 132(1), 69-76.
Okolo, C. M. (1992). The effects of computer-based attribution retraining on the
attributions, persistence, and mathematics computation of students with
learning disabilities. Journal of Learning Disabilities, 25(5), 327-334.
Organization, W. H. (2012). Fact sheet of depression.
Park, N., Peterson, & Seligman. (2004). Strengths of character and well-being.
Journal of Social and Clinical Psychology, 23(5), 603-619.
Pearson, R. M., Heron, J., Button, K., Bentall, R. P., Fernyhough, C., Mahedy, L., . . .
Lewis, G. (2015). Cognitive styles and future depressed mood in early
adulthood: The importance of global attributions. Journal of affective
disorders, 171, 60-67. doi: 10.1016/j.jad.2014.08.057
Perry, R. P., Hechter, F. J., Menec, V. H., & Weinberg, L. E. (1993). Enhancing
achievement motivation and performance in college students: An attributional
retraining perspective. Research in Higher Education, 34(6), 687-723.
Perry, R. P., & Penner, K. S. (1990). Enhancing academic achievement in college
students through attributional retraining and instruction. Journal of
educational psychology, 82(2), 262.
Peters, Flink, I. K., Boersma, K., & Linton, S. J. (2010). Manipulating optimism: Can
imagining a best possible self be used to increase positive future expectancies?
The Journal of Positive Psychology, 5(3), 204-211.
Peters, Meevissen, Y. M. C., & Hanssen, M. M. (2013). Specificity of the Best
Possible Self intervention for increasing optimism: Comparison with a
gratitude intervention. Terapia Psicologica, 31(1), 93-100.
Peterson. (1988). Explanatory style as a risk factor for illness. Cognitive therapy and
research, 12(2), 119-132.
Peterson. (2000a). The future of optimism. American Psychologist, 55(1), 44.
Peterson. (2000b). Optimistic explanatory style and health (Vol. 2).
Peterson, & Barrett, L. C. (1987). Explanatory style and academic performance
among university freshmen. Journal of personality and social psychology,
53(3), 603-607. doi: 10.1037/0022-3514.53.3.603
Peterson, Berres, B. A., & Seligman. (1985). Depressive symptoms and unprompted
causal attributions: Content analysis. Behaviour Research and Therapy, 23(4),
379-382.

Understanding Optimism
272
Peterson, & Bossio, L. M. (2001). Optimism and physical well-being. In E. C. Chang
(Ed.), Optimism & pessimism: implications for theory, research, and practice.
Washington, DC: American Psychological Association.
Peterson, & Seligman. (1984). Causal explanations as a risk factor for depression:
Theory and evidence. Psychological review, 91(3), 347.
Peterson, Semmel, A., von Baeyer, C., Abramson, Metalsky, G. I., & Seligman.
(1982). The attributional style questionnaire. Cognitive therapy and research,
6(3), 287-299.
Peterson, & Vaidya, R. S. (2001). Explanatory style, expectations, and depressive
symptoms. Personality and Individual Differences, 31(7), 1217-1223.
Peterson, & Villanova, P. (1988). An Expanded Attributional Style Questionnaire.
Journal of Abnormal Psychology, 97(1), 87.
Peterson, C., & Steen, T. A. (2009). Optimistic Explanatory Style. In S. J. L. C. R.
Snyder (Ed.), Oxford handbook of positive psychology (Vol. 2, pp. 313-321):
Oxford University Press.
Plomin, R., Scheier, M. F., Bergeman, C. S., Pedersen, N. L., Nesselroade, J. R., &
McClearn, G. E. (1992). Optimism, pessimism and mental health: A
twin/adoption analysis. Personality and Individual Differences, 13(8), 921-
930. doi: http://dx.doi.org/10.1016/0191-8869(92)90009-E
Poropat, A. (2002). The relationship between attributional style, gender and the Five-
Factor Model of personality. Personality and Individual Differences, 33(7),
1185-1201. doi: 10.1016/s0191-8869(02)00008-9
Prati, G., & Pietrantoni, L. (2009). Optimism, Social Support, and Coping Strategies
As Factors Contributing to Posttraumatic Growth: A Meta-Analysis. Journal
of Loss & Trauma, 14(5), 364-388. doi: 10.1080/15325020902724271
Pretzer, J. L., & Walsh, C. A. (2001). Optimism, pessimism, and psychotherapy:
Implications for clinical practice. In Chang (Ed.), Optimism and pessimism.
Implications for theory, research and practice.
R Core Team. (2012). R: A language and environment for statistical computing
(Version 2.15.X). Vienna, Austria: R Foundation for Statistical Computing.
Retrieved from http://www.R-project.org
Räikkönen, K., & Matthews, K. A. (2008). Do dispositional pessimism and optimism
predict ambulatory blood pressure during schooldays and nights in
adolescents? Journal of Personality, 76(3), 605-630.
Rand, K. L., Martin, A. D., & Shea, A. M. (2011). Hope, but not optimism, predicts
academic performance of law students beyond previous academic
achievement. Journal of Research in Personality, 45(6), 683-686.
Rasmussen, H. N., Scheier, M. F., & Greenhouse, J. B. (2009). Optimism and
physical health: A meta-analytic review. Annals of Behavioral Medicine,
37(3), 239-256.
Rauch, S. A. M., Defever, E., Oetting, S., Graham-Bermann, S. A., & Seng, J. S.
(2013). Optimism, Coping, and Posttraumatic Stress Severity in Women in
the Childbearing Year. Psychological Trauma-Theory Research Practice and
Policy, 5(1), 77-83. doi: 10.1037/a0022214
Reed, G. L., & Enright, R. D. (2006). The effects of forgiveness therapy on
depression, anxiety, and posttraumatic stress for women after spousal
emotional abuse. Journal of Consulting and Clinical Psychology, 74(5), 920.

Understanding Optimism
273
Reisbig, A. M. J., Danielson, J. A., Wu, T.-F., Hafen, M., Jr., Krienert, A., Girard, D.,
& Garlock, J. (2012). A Study of Depression and Anxiety, General Health,
and Academic Performance in Three Cohorts of Veterinary Medical Students
across the First Three Semesters of Veterinary School. Journal of Veterinary
Medical Education, 39(4), 341-358. doi: 10.3138/jvme.0712-065R
Rhemtulla, M., Brosseau-Liard, P. E., & Savalei, V. (2012). When can categorical
variables be treated as continuous? A comparison of robust continuous and
categorical SEM estimation methods under suboptimal conditions. Psychol
Methods, 17(3), 354-373. doi: 10.1037/a0029315
Rim, Y. (1991). Personality and attributional styles. Personality and Individual
Differences, 12(1), 95-96. doi: 10.1016/0191-8869(91)90137-z
Riskind, J. H., Sarampote, C. S., & Mercier, M. A. (1996). For every malady a
sovereign cure: Optimism training. Journal of Cognitive Psychotherapy,
10(2), 105-117.
Rius-Ottenheim, N., Kromhout, D., de Craen, A. J., Geleijnse, J. M., van der Mast, R.
C., Zitman, F. G., . . . Giltay, E. J. (2012). Parental longevity correlates with
offspring’s optimism in two cohorts of community-dwelling older subjects.
Age, 34(2), 461-468.
Rogers, M. E., Hansen, N. B., Levy, B. R., Tate, D. C., & Sikkema, K. J. (2005).
Optimism and coping with loss in bereaved HIV-infected men and women.
Journal of Social and Clinical Psychology, 24(3), 341-360. doi:
10.1521/jscp.24.3.341.65619
Rotter, J. B. (1966). Generalized expectancies for internal versus external control of
reinforcement. Psychol Monogr, 80(1), 1-28.
Roysamb, E., & Strype, J. (2002). Optimism and pessimism: Underlying structure
and dimensionality. Journal of Social and Clinical Psychology, 21(1), 1-19.
Rupke, S. J., Blecke, D., & Renfrow, M. (2006). Cognitive therapy for depression.
Am Fam Physician, 73(1), 82-86.
Ruthig, J. C., Perry, R. P., Hall, N. C., & Hladkyj, S. (2004). Optimism and
Attributional Retraining: Longitudinal Effects on Academic Achievement,
Test Anxiety, and Voluntary Course Withdrawal in College Students1.
Journal of Applied Social Psychology, 34(4), 709-730.
Ryff. (1989). Happiness is everything, or is it? Explorations on the meaning of
psychological well-being. Journal of personality and social psychology,
57(6), 1069.
Ryff. (1995). Psychological well-being in adult life. Current directions in
psychological science, 4(4), 99-104.
Ryff, & Keyes, C. L. M. (1995). The structure of psychological well-being revisited.
Journal of personality and social psychology, 69(4), 719-727. doi:
10.1037/0022-3514.69.4.719
Ryff, & Singer, B. H. (2006). Know Thyself and Become What You Are: A
Eudaimonic Approach to Psychological Well-Being. Journal of Happiness
Studies, 9(1), 13-39. doi: 10.1007/s10902-006-9019-0
Sanjuán, P., Arranz, H., & Castro, A. (2012). Pessimistic attributions and coping
strategies as predictors of depressive symptoms in people with coronary heart
disease. Journal of health psychology, 17(6), 886-895.

Understanding Optimism
274
Sanjuan, P., & Magallares, A. (2014). Coping Strategies as Mediating Variables
Between Self-serving Attributional Bias and Subjective Well-Being. Journal
of Happiness Studies, 15(2), 443-453. doi: 10.1007/s10902-013-9430-2
Scheier, & Carver. (1985). Optimism, coping, and health: assessment and
implications of generalized outcome expectancies. Health Psychology, 4(3),
219.
Scheier, & Carver. (1987). Dispositional optimism and physical well‐being: the
Influence of generalized outcome expectancies on health. Journal of
Personality, 55(2), 169-210.
Scheier, & Carver. (1992). Effects of optimism on psychological and physical well-
being: Theoretical overview and empirical update. Cognitive therapy and
research, 16(2), 201-228.
Scheier, & Carver. (1993). On the power of positive thinking: The benefits of being
optimistic. Current directions in psychological science, 2(1), 26-30.
Scheier, Carver, & Bridges. (1994). Distinguishing optimism from neuroticism (and
trait anxiety, self-mastery, and self-esteem): A reevaluation of the Life
Orientation Test. Journal of personality and social psychology, 67(6), 1063.
Scheier, Weintraub, J. K., & Carver. (1986). Coping with stress: divergent strategies
of optimists and pessimists. Journal of personality and social psychology,
51(6), 1257.
Scheier., Carver, C. S., & Bridges, M. W. (2001). Optimism, pessimism, and
psychological well-being (chapter 9). Chang, Edward C. (Ed), (2001).
Optimism & pessimism: Implications for theory, research, and practice.
Schou, I., Ekeberg, O., & Ruland, C. M. (2005). The mediating role of appraisal and
coping in the relationship between optimism-pessimism and quality of life.
Psycho-Oncology, 14(9), 718-727. doi: 10.1002/896
Schulman, P., Keith, D., & Seligman. (1993). Is optimism heritable? A study of
twins. Behaviour Research and Therapy, 31(6), 569-574. doi: 10.1016/0005-
7967(93)90108-7
Segerstrom, S. C. (2007). Optimism and resources: Effects on each other and on
health over 10 years. Journal of Research in Personality, 41(4), 772-786. doi:
10.1016/j.jrp.2006.09.004
Segerstrom, S. C., Castañeda, J. O., & Spencer, T. E. (2003). Optimism effects on
cellular immunity: testing the affective and persistence models. Personality
and Individual Differences, 35(7), 1615-1624.
Segerstrom, S. C., Evans, D. R., & Eisenlohr-Moul, T. A. (2011). Optimism and
pessimism dimensions in the Life Orientation Test-Revised: Method and
meaning. Journal of Research in Personality, 45(1), 126-129. doi:
10.1016/j.jrp.2010.11.007
Segerstrom, S. C., & Sephton, S. E. (2010). Optimistic Expectancies and Cell-
Mediated Immunity: The Role of Positive Affect. Psychological Science,
21(3), 448-455. doi: 10.1177/0956797610362061
Seligman. (1989). Explanatory style - predicting depression, achievement, and health.
Seligman. (1991). Learned optimism: New York: Knopf.
Seligman. (2002). Positive psychology, positive prevention, and positive therapy.
Handbook of positive psychology, 2, 3-12.

Understanding Optimism
275
Seligman. (2011). Learned optimism: How to change your mind and your life:
William Heinemann.
Seligman, Abramson, L. Y., Semmel, A., & Von Baeyer, C. (1979). Depressive
attributional style. Journal of Abnormal Psychology, 88(3), 242.
Seligman, & Csikszentmihalyi, M. (2000). Positive psychology: An introduction.
American Psychologist; American Psychologist, 55(1), 5.
Seligman, Rashid, T., & Parks, A. C. (2006). Positive psychotherapy. American
Psychologist, 61(8), 774.
Seligman, & Schulman, P. (1986). Explanatory style as a predictor of productivity
and quitting among life insurance sales agents. Journal of personality and
social psychology, 50(4), 832.
Seligman, Steen, T. A., Park, N., & Peterson. (2005). Positive psychology progress:
empirical validation of interventions. American Psychologist, 60(5), 410.
Sergeant, S., & Mongrain, M. (2014). An Online Optimism Intervention Reduces
Depression in Pessimistic Individuals. Journal of Consulting and Clinical
Psychology, 82(2), 263-274. doi: 10.1037/a0035536
Shapcott, K. M., & Carron, A. V. (2010). Development and validation of a team
attributional style questionnaire. Group Dynamics: Theory, Research, and
Practice, 14(2), 93.
Shapira, L. B., & Mongrain, M. (2010). The benefits of self-compassion and
optimism exercises for individuals vulnerable to depression. The Journal of
Positive Psychology, 5(5), 377-389.
Sharifi, M., Hajiheidari, M., Khorvash, F., & Mirabdollahi, M. A. (2013).
Effectiveness of Attribution Retraining on Women's Depression and Anxiety
After Miscarriage. International journal of preventive medicine, 4(Suppl 2),
S239-244.
Sharot, T., Riccardi, A. M., Raio, C. M., & Phelps, E. A. (2007). Neural mechanisms
mediating optimism bias. Nature, 450(7166), 102-105.
Sharpe, J. P., Martin, N. R., & Roth, K. A. (2011). Optimism and the Big Five
factors of personality: Beyond Neuroticism and Extraversion. Personality and
Individual Differences, 51(8), 946-951. doi: 10.1016/j.paid.2011.07.033
Shek, D. T. (1990). Reliability and factorial structure of the Chinese version of the
Beck Depression Inventory. Journal of Clinical Psychology, 46(1), 35-43.
Sheldon, K. M., & Lyubomirsky, S. (2006). How to increase and sustain positive
emotion: The effects of expressing gratitude and visualizing best possible
selves. The Journal of Positive Psychology, 1(2), 73-82.
Sin, N. L., Della Porta, M. D., & Lyubomirsky, S. (2011). Tailoring Positive
Psychology Interventions to Treat Depressed Individuals.
Sin, N. L., & Lyubomirsky, S. (2009). Enhancing Well-Being and Alleviating
Depressive Symptoms With Positive Psychology Interventions: A Practice-
Friendly Meta-Analysis. Journal of Clinical Psychology, 65(5), 467-487. doi:
10.1002/jclp.20593
Sinha, B. K., Willson, L. R., & Watson, D. C. (2000). Stress and coping among
students in India and Canada. Canadian Journal of Behavioural
Science/Revue canadienne des sciences du comportement, 32(4), 218.

Understanding Optimism
276
Smith, P., Caputi, P., & Crittenden, N. (2013). Measuring optimism in organizations:
development of a workplace explanatory style questionnaire. Journal of
Happiness Studies, 14(2), 415-432.
Snyder. (1989). Reality negotiation: From excuses to hope and beyond. Journal of
Social and Clinical Psychology, 8(2), 130-157. doi:
10.1521/jscp.1989.8.2.130
Snyder. (2002). Hope theory: Rainbows in the mind. Psychological Inquiry, 13(4),
249-275.
Snyder, Harris, C., Anderson, J. R., Holleran, S. A., Irving, L. M., Sigmon, S. T., . . .
Harney, P. (1991). The will and the ways: development and validation of an
individual-differences measure of hope. Journal of personality and social
psychology, 60(4), 570.
Snyder, Sympson, S. C., Ybasco, F. C., Borders, T. F., Babyak, M. A., & Higgins, R.
L. (1996). Development and validation of the State Hope Scale. Journal of
personality and social psychology, 70(2), 321-335. doi: 10.1037//0022-
3514.70.2.321
Stanton, A. L., Danoff-Burg, S., Sworowski, L. A., Collins, C. A., Branstetter, A. D.,
Rodriguez-Hanley, A., . . . Austenfeld, J. L. (2002). Randomized, controlled
trial of written emotional expression and benefit finding in breast cancer
patients. Journal of Clinical Oncology, 20(20), 4160-4168.
Steed, L. G. (2002). A psychometric comparison of four measures of hope and
optimism. Educational and Psychological Measurement, 62(3), 466-482.
Strutton, D., & Lumpkin, J. (1992). Relationship between optimism and coping
strategies in the work environment. Psychological Reports, 71(3), 1179-1186.
doi: 10.2466/pr0.71.8.1179-1186
Suls, J., & Fletcher, B. (1985). The relative efficacy of avoidant and nonavoidant
coping strategies: A meta-analysis. Health Psychology, 4(3), 249-288. doi:
10.1037/0278-6133.4.3.249
Sumi, K. (2004). The Japanese version of the revised Life orientation Test:
Reliability and construct validity. Psychological Reports, 95(1), 86-88. doi:
10.2466/pr0.95.1.86-88
Sweeney, P. D., Anderson, K., & Bailey, S. (1986). Attributional style in depression:
A meta-analytic review. Journal of personality and social psychology, 50(5),
974-991. doi: 10.1037/0022-3514.50.5.974
Taylor, S. E., Kemeny, M. E., Aspinwall, L. G., Schneider, S. G., Rodriguez, R., &
Herbert, M. (1992). Opitmism, coping, psychological distress, and high-risk
sexual-behavior among men at risk for acquired-immunodeficiency-
syndrome (AIDS). Journal of personality and social psychology, 63(3), 460-
473. doi: 10.1037//0022-3514.63.3.460
Teglasi, H., & Fagin, S. S. (1984). Social anxiety and self-other biases in causal
attribution. Journal of Research in Personality, 18(1), 64-80.
Thompson, A. S., Gaudreau, P., Hoar, S. D., Hadd, V., & Lelievre, J. (2008).
Domain specific coping as intermediate processes in the relationships
between dispositional optimism-pessimism and satisfaction in the school and
sport domains. Journal of Sport & Exercise Psychology, 30, S205-S205.
Tiger, L. (1979). Optimism: The biology of hope (Vol. 1st Touchstone edition). New
York: Simon and Schuster.

Understanding Optimism
277
Tiggemann, M., Winefield, A. H., Winefield, H. R., & Goldney, R. D. (1991). The
prediction of psychological distress from attributional style: A test of the
hopelessness model of depression. Australian journal of psychology, 43(3),
125-127.
Tindle, H. A., Chang, Y.-F., Kuller, L. H., Manson, J. E., Robinson, J. G., Rosal, M.
C., . . . Matthews, K. A. (2009). Optimism, cynical hostility, and incident
coronary heart disease and mortality in the Women’s Health Initiative.
Circulation, 120(8), 656-662.
Tomakowsky, J., Lumley, M. A., Markowitz, N., & Frank, C. (2001). Optimistic
explanatory style and dispositional optimism in HIV-infected men. Journal of
Psychosomatic Research, 51(4), 577-587. doi: 10.1016/s0022-
3999(01)00249-5
Tseng, W. C. (2007). Social Support as a Mediator of Optimism and Well-being in
College Students: A Structural Equation Modeling Approach (Article written
in Chinese). Journal of Education and Psychology, 30(4), 117-146.
Vacek, K. R., Coyle, L. D., & Vera, E. M. (2010). Stress, Self-Esteem, Hope,
Optimism, and Well-Being in Urban, Ethnic Minority Adolescents. Journal
of Multicultural Counseling and Development, 38(2), 13.
Vazquez, C., Jimenez, F., Saura, F., & Avia, M. D. (2001). The importance of
"importance": a longitudinal confirmation of the attributional-stress model of
depression measuring the importance of the attributions and the impact of the
stressor. Personality and Individual Differences, 31(2), 205-214. doi:
10.1016/s0191-8869(00)00129-x
Wang, C., & Zhang, N. (2005). Personality Correlates to Attributional Style in
Undergraduates. Chinese Journal of Clinical Psychology, 13(1), 53-54.
Watson, D. (1982). The actor and the observer: How are their perceptions of
causality divergent? Psychological bulletin, 92(3), 682.
Watson, D., Clark, L. A., & Tellegen, A. (1988). Development and validation of
brief measures of positive and negative affect: the PANAS scales. Journal of
personality and social psychology, 54(6), 1063.
Weiner, B. (1974). Achievement motivation and attribution theory: General Learning
Press.
Weiner, B. (1985). An attributional theory of achievement motivation and emotion.
Psychological review, 92(4), 548.
Wiffen, B. D. R., O'Connor, J. A., Gayer-Anderson, C., Marques, T. R., McQueen,
G., Happe, F., . . . David, A. S. (2013). "I am sane but he is mad": Insight and
illness attributions to self and others in psychosis. Psychiatry Research,
207(3), 173-178. doi: 10.1016/j.psychres.2013.01.020
Williams, D. (1992). Dispositional optimism, neuroticism, and extraversion.
Personality and Individual Differences, 13(4), 475-477.
Wise, D., & Rosqvist, J. (2006). Explanatory Style and Well-Being. In D. L. S. Jay C.
Thomas (Ed.), Comprehensive Handbook of Personality and
Psychopathology (pp. 285-305). Newjercy: John Wiley & Sons, Inc.
Wrosch, C., & Scheier, M. F. (2003). Personality and quality of life: The importance
of optimism and goal adjustment. Quality of Life Research, 12, 59-72.
Yang, J., McCrae, R. R., Costa Jr, P. T., Dai, X., Yao, S., Cai, T., & Gao, B. (1999).
Cross-cultural personality assessment in psychiatric populations: The NEO-

Understanding Optimism
278
PI—R in the People's Republic of China. Psychological Assessment, 11(3),
359.
You, J., Fung, H. H., & Isaacowitz, D. M. (2009). Age differences in dispositional
optimism: A cross-cultural study. European Journal of Ageing, 6(4), 247-252.
Yu, & Seligman. (2002). Preventing depressive symptoms in Chinese children.
Prevention & Treatment, 5(1), 9a.
Yu, C. Y. (2002). Evaluating cutoff criteria of model fit indices for latent variable
models with binary and continuous outcomes. University of California, Los
Angeles, Los Angeles. Retrieved from
http://www.statmodel.com/download/Yudissertation.pdf
Yu, J. J., & Ko, Y. K. (2013). Paternal family expressiveness as a mediator between
father's dispositional optimism and child's dispositional optimism. The
Journal of genetic psychology, 174(6), 677-695.
Yuan, L., & Zhang, R. (2007). A Research on the Relationships among Explanatory
style, Dispositional Optimism and Psychological well-being. Psychological
Development and Education, 2, 111-115.
Zhang, C. W. N. (2006). A Study on the Scale of Attributional Style Questionnaire.
China Journal of Behavioral Medical Science, 15(5), 470-471.
Related Documents