RESEARCH ARTICLE Lithology Discrimination in Foreland Basin with Landsat TM Murat Gül & Kemal Gürbüz & Özgür Kalelioğlu Received: 4 January 2011 /Accepted: 17 June 2011 /Published online: 10 August 2011 # Indian Society of Remote Sensing 2011 Abstract The Kahramanmaraş Foreland Basin (KFB) margins are formed by Paleozoic-Mesozoic limestone, metamorphic and ophiolite. This basin contains sandstone and claystone alternations with lesser amounts of reefal limestone, channelized conglom- erates, debrites and slump deposits. An irregular topography and absence of path obscured the accurate and complete mapping of the basin. Thus, Landsat TM images were used. The RGB 751 false colour composites were chosen due to abundant claystone and limestone content of the KFB. The RGB PCA 145 was preferred due to high loading of TM bands 5 (clay and iron oxide mineral), 7 (carbonate mineral), 3 and 1 (albedo and topography). The RGB 5/7-5/1-4 (light green dots in 5/7 indicate enhanced claystone area and OH - bearing alteration zone; red dots in 5/1 indicate enhanced iron oxide bearing alteration zone; fourth band for water bearing minerals) shows the transportation way of sediments. The OH - and iron oxide bearing alteration zones are found on older source rocks and younger deposition area. Main lithological boundary, geometry and provenance properties of the KFB were satisfactorily obtained from the Landsat TM images. However, low spatial resolution (30 m) prevents detail facies discrimination that still requires hard field working and/or detailed satellite images. Keywords Landsat 5 TM . Foreland basin . Miocene . Kahramanmaraş . Sedimentary rock Introduction Landsat images have been widely used for delineation and mapping the lithological units and structural alignments (Abrams et al. 1983; Loughlin 1991; Nalbant and Alptekin 1995; Inzana et al. 2003; Khan and Glenn 2006; Khan et al. 2007; Kalelioğlu et al. 2009). In addition, the satellite images provide valuable information about the alteration zones and mineral types (Abrams et al. 1983; Kusky and Ramadan 2002). The map obtained from remote J Indian Soc Remote Sens (June 2012) 40(2):257–269 DOI 10.1007/s12524-011-0146-7 M. Gül (*) Engineering Faculty, Department of Geological Engineering, Mugla University, 48100 Kotekli/Mugla, Turkey e-mail: [email protected] K. Gürbüz Engineering-Architecture Faculty, Department of Geological Engineering, Çukurova University, 01330 Balcalı/Adana, Turkey e-mail: [email protected] Ö. Kalelioğlu Engineering Faculty, Department of Geological Engineering, Mersin University, 33343 Mezitli/Mersin, Turkey e-mail: [email protected]

Welcome message from author
This document is posted to help you gain knowledge. Please leave a comment to let me know what you think about it! Share it to your friends and learn new things together.
Transcript
RESEARCH ARTICLE
Lithology Discrimination in Foreland Basinwith Landsat TM
Murat Gül & Kemal Gürbüz & Özgür Kalelioğlu
Received: 4 January 2011 /Accepted: 17 June 2011 /Published online: 10 August 2011# Indian Society of Remote Sensing 2011
Abstract The Kahramanmaraş Foreland Basin (KFB)margins are formed by Paleozoic-Mesozoic limestone,metamorphic and ophiolite. This basin containssandstone and claystone alternations with lesseramounts of reefal limestone, channelized conglom-erates, debrites and slump deposits. An irregulartopography and absence of path obscured the accurateand complete mapping of the basin. Thus, LandsatTM images were used. The RGB 751 false colourcomposites were chosen due to abundant claystoneand limestone content of the KFB. The RGB PCA145 was preferred due to high loading of TM bands 5
(clay and iron oxide mineral), 7 (carbonate mineral), 3and 1 (albedo and topography). The RGB 5/7-5/1-4(light green dots in 5/7 indicate enhanced claystonearea and OH- bearing alteration zone; red dots in 5/1indicate enhanced iron oxide bearing alteration zone;fourth band for water bearing minerals) shows thetransportation way of sediments. The OH- and ironoxide bearing alteration zones are found on oldersource rocks and younger deposition area. Mainlithological boundary, geometry and provenanceproperties of the KFB were satisfactorily obtainedfrom the Landsat TM images. However, low spatialresolution (30 m) prevents detail facies discriminationthat still requires hard field working and/or detailedsatellite images.
Keywords Landsat 5 TM . Foreland basin .Miocene .
Kahramanmaraş . Sedimentary rock
Introduction
Landsat images have been widely used for delineationand mapping the lithological units and structuralalignments (Abrams et al. 1983; Loughlin 1991;Nalbant and Alptekin 1995; Inzana et al. 2003; Khanand Glenn 2006; Khan et al. 2007; Kalelioğlu et al.2009). In addition, the satellite images providevaluable information about the alteration zones andmineral types (Abrams et al. 1983; Kusky andRamadan 2002). The map obtained from remote
J Indian Soc Remote Sens (June 2012) 40(2):257–269DOI 10.1007/s12524-011-0146-7
M. Gül (*)Engineering Faculty,Department of Geological Engineering,Mugla University,48100 Kotekli/Mugla, Turkeye-mail: [email protected]
K. GürbüzEngineering-Architecture Faculty,Department of Geological Engineering,Çukurova University,01330 Balcalı/Adana, Turkeye-mail: [email protected]
Ö. KalelioğluEngineering Faculty,Department of Geological Engineering,Mersin University,33343 Mezitli/Mersin, Turkeye-mail: [email protected]
sensing data gives consistent results with field basedmap (Kusky and Ramadan 2002; Kalelioğlu et al.2009). The multivariate statistical techniques (principalcomponent analysis), band rationing and false colourcomposites are additional solution methods, since theysolve or reduce some image problems such as noise,topography effect, albedo etc. (Abrams et al. 1983;Loughlin 1991; Kusky and Ramadan 2002; Kaleliogluet al. 2009).
The foreland basin is described as an elongatedthrough between the overlying and underlying platesas a linear compressional orogenic belts (DeCellesand Giles 1996). Each zone of the foreland basin(accretionary wedge, foredeep, forebulge and back-bulge) includes various types of sediments (DeCellesand Giles 1996). The investigation of these zonessupplies information about local and regional geolog-ical situation. This study was performed on theKahramanmaraş Foreland Basin (KFB) in the SouthEast of Turkey (Fig. 1). The KFB evolved on theunderlying Arabian Plate at the beginning of Miocene(Önalan 1988; Boulton and Robertson 2007). Thewestern and north-western mountainous margins ofKFB are formed by the large Mesozoic limestoneolistoliths in the accretionary wedge, while thenorthern mountainous margins are formed by theDevonian-Upper Cretaceous metamorphites and UpperJurassic-Cretaceous ophiolite (Gül et al. 2003; Gül2004). The northern part of KFB contains small basinslocated at the top of accretionary wedge. Those basinswere filled by channelized conglomerates and sandstoneon the deep-sea claystone and local shallow marinereefal limestone (Gül 2004). The southern part of KFB(refer to foredeep zone in DeCelles and Giles (1996)model) is filled by mostly finer-grained sedimentsexcept debrites in front of the northern basin marginand canyon near the centre of the basin (Önalan 1988;Gül 2000; Gül 2004; Gül et al. 2011).
The depositional environments of KFB werefixed as a reef, fan delta, submarine slope andabyssal plain. Sediment type and quantity, irregularsea floor topography, structural alignments andtectonic activities caused distinct facies changes ina short distance in these sub-environments. Moreover,recent ragged topography and absence of road accesshas prevented to complete mapping of the Miocenemarine sediments of KFB.
This paper aims to determine the success of the multispectral imagery data application on discrimination of
the foreland basin fillings. In addition, the older rocks(source area) are very close to depositional area in theKFB. Thus, the remote sensing of alteration minerals ofKFB (hydroxyl and iron oxide bearing minerals) cansupply useful information about the transportation ofweathered products. The determination of sedimenttransportation paths is important for provenance studiesof the KFB.
Materials and Methods
Study Area
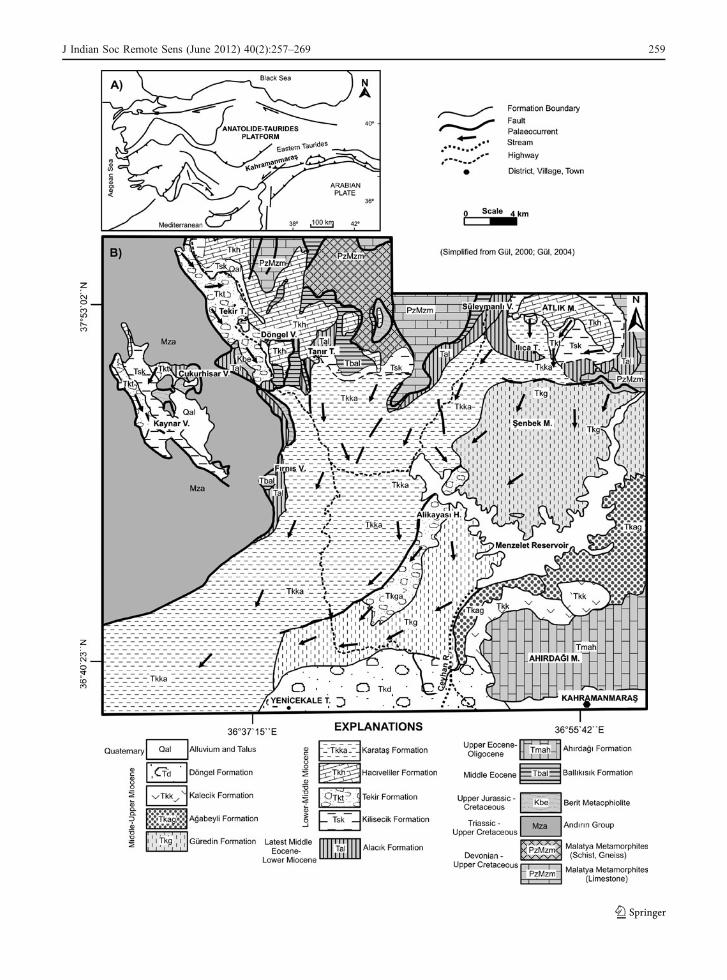
The study area is situated in between the latitudes37°30′–38°10′ N and longitudes 36°20′–37°00′ E(SE Turkey; Fig. 1). General tendency basin altitudeis increasing from S-SE to N-NW and changesbetween 850–2785 m (above mean sea level). Thesouthern margin of KFB is formed by the AhırdağıMountain (Upper Eocene-Oligocene limestone),while the north - northwestern margin is formed bythe limestone and dolomite mountains (Triassic-UpperCretaceous), and north-northeastern margin is formedby the metamorphites (Devonian-Upper Cretaceous)and ophiolite (Upper Jurassic-Cretaceous). Marginsof the basin are rocky, cliffy, and steep highland,while centre of the basin is rough lowlandincluding small hills. Climatic condition of thestudy area is dry. Pine and cypress forest andmaquis are observed on limestone, ophiolite andclayey basement.
Satellite Data and Image Processing
The multi-spectral, cloud-free remote sensing image[Landsat-5 TM scene (WRS-2 Path/Row: 174/34)]was obtained during dry season on 26 July 1989. AllLandsat TM bands have same spatial resolution(30 m) except the sixth band (thermal infrared) has avery low spatial resolution (120 m). Thus, the sixthband was not considered under comprise of this study(due to facies change in a short distance). The rawLandsat-TM image was georectified using well-definedground control points (GCPs) (n: 105) from the 1/25
Fig. 1 a The Kahramanmaraş Foreland Basin is located in thesouth-eastern Turkey (Kissel et al. 2003). b General geologicalmap of the study area (simplified from Gül 2000 and 2004)
b
258 J Indian Soc Remote Sens (June 2012) 40(2):257–269
J Indian Soc Remote Sens (June 2012) 40(2):257–269 259
000 scaled topographical maps. GCPs (includingone centre point surrounded by another four pointsat the corners) were equally distributed to thewhole image. The image of the study area wasconnected to real-world coordinates using theUniversal Transverse Mercator (UTM) projectionsystem with grid zone number 36S and WGS84datum. Radiometric corrections or enhancementsthat applied in this study are linear contrast,histogram equalization, band rationing, contrastenhancement on the single band according to Liuand Moore (1989); and principal component analy-sis (PCA) on multiple bands based on techniques ofSabins (1997), Crosta and Moore (1989), Lillesandand Kiefer (1994). In addition, false colour compo-sites of images (Red–Green–Blue, RGB) wereprepared for better visualization.
Geological Properties of the Study Area
General Geological Setting
The Southern Neotethys Ocean evolved between theArabian Plate and the Anatolide-Taurides Platformafter Triassic (Şengör and Yılmaz 1981). Depend onnorthern movement of the Arabian and African Plates,this ocean subducted to north during and after theLate Cretaceous (Yılmaz 1993). This continentalconvergence (developed under the effect of AlpineOrogeny) caused crustal shortening and thickening ofthe south-eastern Turkey (Yılmaz 1993). Connectedwith this continental convergence, various sizednappes also derived from north of the Anatolide-Taurides Platform and transported to south (Yılmazand Gürer 1996; Yılmaz and Yıldırım 1996). Theaccretionary wedge (oceanic crust and nappes blockswithin the matrix with chaotic sediments) evolved infront of the Anatolide-Taurides Platform during thistransportation (Yılmaz and Gürer 1996; Robertson etal. 2004, 2006). Continental collision of the ArabianPlate and the Anatolide-Taurides Platform started atthe beginning of Early Miocene from east (Robertsonet al. 2004). The foredeep part of KFB evolved on theunderlying Arabian Plate (Robertson et al. 2004). TheAnatolide-Taurides Platform units, nappes and accre-tionary wedge formed the overlying plate. Small,confined and half-graben type basins (obliquely cutthe fore deep) developed at the top of the accretionary
wedge in the northwest of KFB (Karig and Kozlu1990; Kozlu 1997). These basins are filled by theplanktic foraminifera bearing claystone at the base,then channelized conglomerates-sandstone andlocally reef limestone (Derman 1999; Cronin2002; Gül 2004). Mostly fine-grained sediments(claystone-sandstone alternations) filled the centreof KFB. The KFB regionally uplifted and closed afterthe Upper Miocene, for this reason the southwestmargin of basin heavily folded and faulted (Kozlu1997; Gül 2000).
The properties of the geologic units of KFB weremainly compiled and summarized from Kozlu (1997),Gül (2000) and Gül (2004).
Pre-Miocene Geologic Units: The oldest rock of theKFB is the Malatya Metamorphites (Devonian-UpperCretaceous; PzMzm), which consist of green, darkgrey schist, gneiss, metaquartzite and limestone. TheAndırın Group (Triassic-Upper Cretaceous; Mza)contains milky brown limestone and dolomites. TheBerit Ophiolite (Upper Jurassic- Cretaceous; Kbe)includes serpentinite, peridodite, pyroxenite, diabaseand basalts. The Ballıkısık Formation (Middle Eocene;Tbal) contains volcanic breccias, limestone olistholitsand conglomerates. The Alacık formation (LatestMiddle Eocene–LowerMiocene; Tal) consists of chaoticclaystone, limestone and channel conglomerates. It wasreported that these Eocene formation evaluated underthe accretionary complex (Yılmaz and Gürer 1996;Kozlu 1997; Robertson et al. 2004). The AhırdağıFormation limestone (Upper Eocene-Oligocene; Tmah)formed the Mount Ahırdağı area (Gül 2000). The olderrock units of KFB are unconformable overlain by theMiocene units (Fig. 1).
Miocene Geologic Units: Miocene sedimentationinitiated after the deposition and rapid tectonicallydisturbing of the Alacık Formation at the beginningof Miocene (Gül et al. 2005). The KilisecikFormation (Lower-Middle Miocene; Tsk) consists ofgreen claystone and fine-grained sandstone alternations.The Tekir Formation (Lower-Middle Miocene; Tkt)contains channelized conglomerates and sandstoneexposed in and around the town of Tekir, ÇukurhisarVillage and locally in the north of Ilıca town. TheHacıveliler Formation (Lower-Middle Miocene; Tkh)includes reef limestone, formed the Mount Atlık (in thenorth of Ilıca town) and topographically higher land
260 J Indian Soc Remote Sens (June 2012) 40(2):257–269
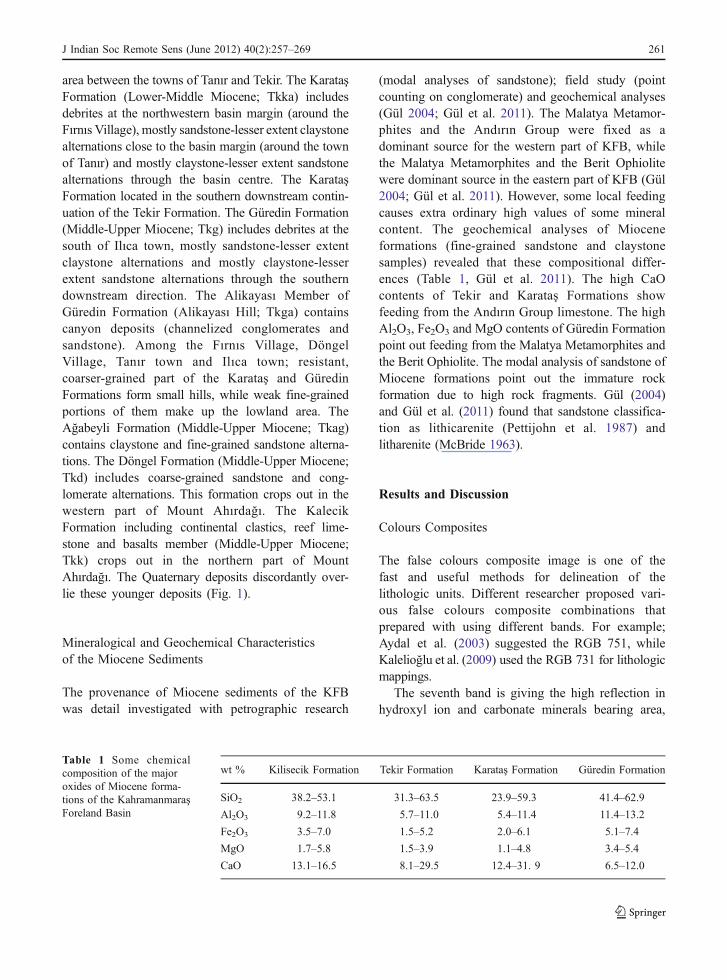
area between the towns of Tanır and Tekir. The KarataşFormation (Lower-Middle Miocene; Tkka) includesdebrites at the northwestern basin margin (around theFırnıs Village), mostly sandstone-lesser extent claystonealternations close to the basin margin (around the townof Tanır) and mostly claystone-lesser extent sandstonealternations through the basin centre. The KarataşFormation located in the southern downstream contin-uation of the Tekir Formation. The Güredin Formation(Middle-Upper Miocene; Tkg) includes debrites at thesouth of Ilıca town, mostly sandstone-lesser extentclaystone alternations and mostly claystone-lesserextent sandstone alternations through the southerndownstream direction. The Alikayası Member ofGüredin Formation (Alikayası Hill; Tkga) containscanyon deposits (channelized conglomerates andsandstone). Among the Fırnıs Village, DöngelVillage, Tanır town and Ilıca town; resistant,coarser-grained part of the Karataş and GüredinFormations form small hills, while weak fine-grainedportions of them make up the lowland area. TheAğabeyli Formation (Middle-Upper Miocene; Tkag)contains claystone and fine-grained sandstone alterna-tions. The Döngel Formation (Middle-Upper Miocene;Tkd) includes coarse-grained sandstone and cong-lomerate alternations. This formation crops out in thewestern part of Mount Ahırdağı. The KalecikFormation including continental clastics, reef lime-stone and basalts member (Middle-Upper Miocene;Tkk) crops out in the northern part of MountAhırdağı. The Quaternary deposits discordantly over-lie these younger deposits (Fig. 1).
Mineralogical and Geochemical Characteristicsof the Miocene Sediments
The provenance of Miocene sediments of the KFBwas detail investigated with petrographic research
(modal analyses of sandstone); field study (pointcounting on conglomerate) and geochemical analyses(Gül 2004; Gül et al. 2011). The Malatya Metamor-phites and the Andırın Group were fixed as adominant source for the western part of KFB, whilethe Malatya Metamorphites and the Berit Ophiolitewere dominant source in the eastern part of KFB (Gül2004; Gül et al. 2011). However, some local feedingcauses extra ordinary high values of some mineralcontent. The geochemical analyses of Mioceneformations (fine-grained sandstone and claystonesamples) revealed that these compositional differ-ences (Table 1, Gül et al. 2011). The high CaOcontents of Tekir and Karataş Formations showfeeding from the Andırın Group limestone. The highAl2O3, Fe2O3 and MgO contents of Güredin Formationpoint out feeding from the Malatya Metamorphites andthe Berit Ophiolite. The modal analysis of sandstone ofMiocene formations point out the immature rockformation due to high rock fragments. Gül (2004)and Gül et al. (2011) found that sandstone classifica-tion as lithicarenite (Pettijohn et al. 1987) andlitharenite (McBride 1963).
Results and Discussion
Colours Composites
The false colours composite image is one of thefast and useful methods for delineation of thelithologic units. Different researcher proposed vari-ous false colours composite combinations thatprepared with using different bands. For example;Aydal et al. (2003) suggested the RGB 751, whileKalelioğlu et al. (2009) used the RGB 731 for lithologicmappings.
The seventh band is giving the high reflection inhydroxyl ion and carbonate minerals bearing area,
wt % Kilisecik Formation Tekir Formation Karataş Formation Güredin Formation
SiO2 38.2–53.1 31.3–63.5 23.9–59.3 41.4–62.9
Al2O3 9.2–11.8 5.7–11.0 5.4–11.4 11.4–13.2
Fe2O3 3.5–7.0 1.5–5.2 2.0–6.1 5.1–7.4
MgO 1.7–5.8 1.5–3.9 1.1–4.8 3.4–5.4
CaO 13.1–16.5 8.1–29.5 12.4–31. 9 6.5–12.0
Table 1 Some chemicalcomposition of the majoroxides of Miocene forma-tions of the KahramanmaraşForeland Basin
J Indian Soc Remote Sens (June 2012) 40(2):257–269 261
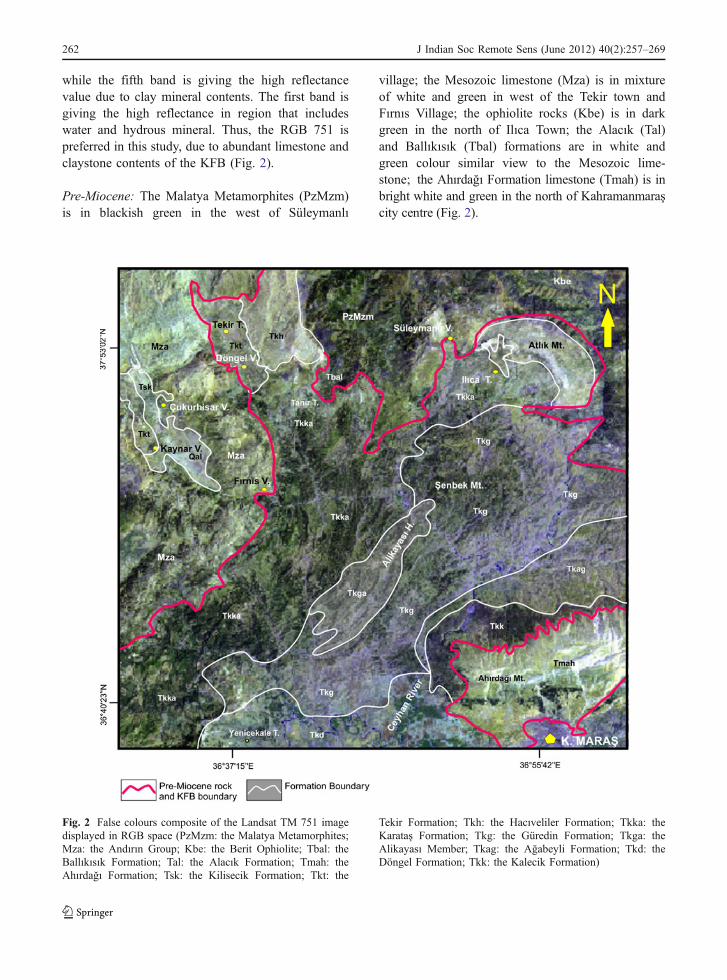
while the fifth band is giving the high reflectancevalue due to clay mineral contents. The first band isgiving the high reflectance in region that includeswater and hydrous mineral. Thus, the RGB 751 ispreferred in this study, due to abundant limestone andclaystone contents of the KFB (Fig. 2).
Pre-Miocene: The Malatya Metamorphites (PzMzm)is in blackish green in the west of Süleymanlı
village; the Mesozoic limestone (Mza) is in mixtureof white and green in west of the Tekir town andFırnıs Village; the ophiolite rocks (Kbe) is in darkgreen in the north of Ilıca Town; the Alacık (Tal)and Ballıkısık (Tbal) formations are in white andgreen colour similar view to the Mesozoic lime-stone; the Ahırdağı Formation limestone (Tmah) is inbright white and green in the north of Kahramanmaraşcity centre (Fig. 2).
Fig. 2 False colours composite of the Landsat TM 751 imagedisplayed in RGB space (PzMzm: the Malatya Metamorphites;Mza: the Andırın Group; Kbe: the Berit Ophiolite; Tbal: theBallıkısık Formation; Tal: the Alacık Formation; Tmah: theAhırdağı Formation; Tsk: the Kilisecik Formation; Tkt: the
Tekir Formation; Tkh: the Hacıveliler Formation; Tkka: theKarataş Formation; Tkg: the Güredin Formation; Tkga: theAlikayası Member; Tkag: the Ağabeyli Formation; Tkd: theDöngel Formation; Tkk: the Kalecik Formation)
262 J Indian Soc Remote Sens (June 2012) 40(2):257–269
Miocene: The Kilisecik Formation (Tsk) fine-grainedclastics is in grey-light green colour in the southeastof Kaynar Village. The Tekir Formation channeldeposits (Tkt; around the Tekir town, in between theÇukurhisar and Kaynar Villages) are in green,lavender green colour. The Hacıveliler Formationlimestone (Tkh) is in bright white and bluish greenaround the Atlık Mountain. The Karataş Formationdebrites (Tkka) is in dark green and lavender greencolour around the Fırnıs Village. The Karataş Forma-tion mostly sandstone-lesser extent claystone alterna-tions (Tkka) are in grey-green colour around the townof Tanır. Mostly claystone-lesser extent sandstonealternations (Tkka) of it is in light grey and greencolour in north of the town of Yenicekale. TheGüredin Formation (Tkg) debrites (west of theŞenbek Mountain and south of Ilıca town) are indark green and lavender green. The Güredin Forma-tion (Tkg) sandstone dominated deposits is in darkgrey-lavender in and around the Şenbek Mountain.The Güredin Formation (Tkg) mudstone dominateddeposits is in grey-green-lavender in between theAlikayası and the Mount Ahırdağı. The Alikayasımember of the Güredin Formation is in green andlavender green. The Ağabeyli Formation (Tkag)claystone-sandstone alternations are in pale lavendercolour in the north of Mount Ahırdağı. The DöngelFormation (Tkd) is in pale lavender-pale green-greencolour around the Ceyhan River in the west of MountAhırdağı. The Kalecik Formation is in dark greencolour in the northern part of Mount Ahırdağı(Fig. 2).
Principal Components Analysis (PCA)
Main aim of the principal component transforma-tion removes to excess multispectral data. Nchannelled multivariate spectral images are reducedto n channelled but less bands, so repetitions in theimages are decreased even destroyed (Abrams et al.1983; Kaufman 1988; Sabins 1997; Ricotta et al.1999). A Crosta technique is another statisticaltechnique, which is also known as the “FeatureOriented Principal Components Selection” (Crostaand Moore 1989). In this technique, fewer bandsused in the principal component transformation(Loughlin 1991; Ranjbar et al. 2004). The Eigenvector values that show spectral information ofminerals are used during the principal component
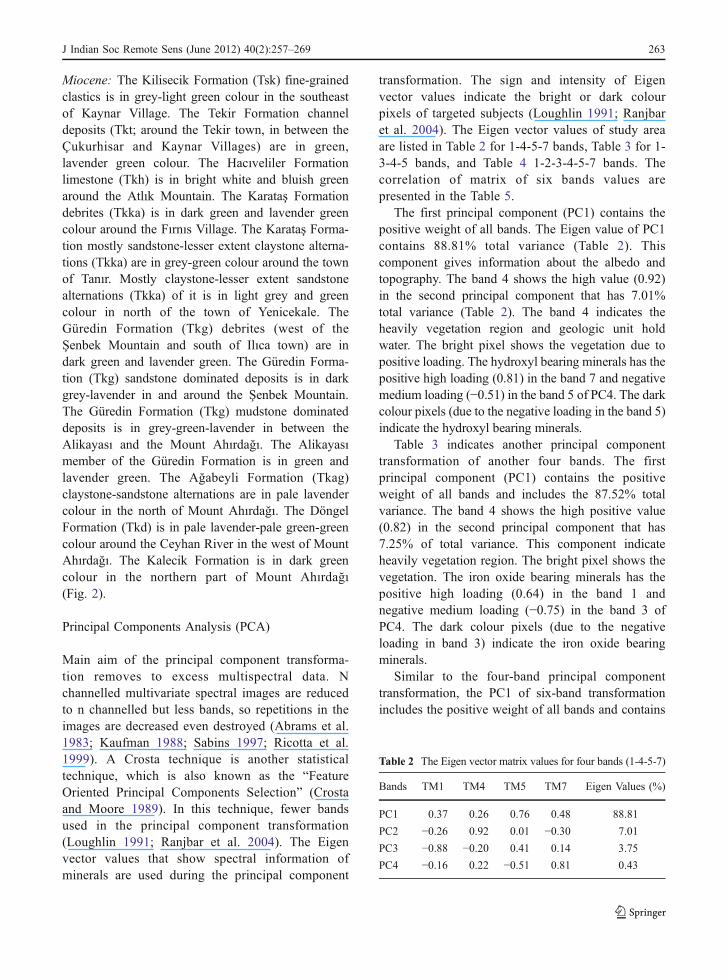
transformation. The sign and intensity of Eigenvector values indicate the bright or dark colourpixels of targeted subjects (Loughlin 1991; Ranjbaret al. 2004). The Eigen vector values of study areaare listed in Table 2 for 1-4-5-7 bands, Table 3 for 1-3-4-5 bands, and Table 4 1-2-3-4-5-7 bands. Thecorrelation of matrix of six bands values arepresented in the Table 5.
The first principal component (PC1) contains thepositive weight of all bands. The Eigen value of PC1contains 88.81% total variance (Table 2). Thiscomponent gives information about the albedo andtopography. The band 4 shows the high value (0.92)in the second principal component that has 7.01%total variance (Table 2). The band 4 indicates theheavily vegetation region and geologic unit holdwater. The bright pixel shows the vegetation due topositive loading. The hydroxyl bearing minerals has thepositive high loading (0.81) in the band 7 and negativemedium loading (−0.51) in the band 5 of PC4. The darkcolour pixels (due to the negative loading in the band 5)indicate the hydroxyl bearing minerals.
Table 3 indicates another principal componenttransformation of another four bands. The firstprincipal component (PC1) contains the positiveweight of all bands and includes the 87.52% totalvariance. The band 4 shows the high positive value(0.82) in the second principal component that has7.25% of total variance. This component indicateheavily vegetation region. The bright pixel shows thevegetation. The iron oxide bearing minerals has thepositive high loading (0.64) in the band 1 andnegative medium loading (−0.75) in the band 3 ofPC4. The dark colour pixels (due to the negativeloading in band 3) indicate the iron oxide bearingminerals.
Similar to the four-band principal componenttransformation, the PC1 of six-band transformationincludes the positive weight of all bands and contains
Table 2 The Eigen vector matrix values for four bands (1-4-5-7)
Bands TM1 TM4 TM5 TM7 Eigen Values (%)
PC1 0.37 0.26 0.76 0.48 88.81
PC2 −0.26 0.92 0.01 −0.30 7.01
PC3 −0.88 −0.20 0.41 0.14 3.75
PC4 −0.16 0.22 −0.51 0.81 0.43
J Indian Soc Remote Sens (June 2012) 40(2):257–269 263
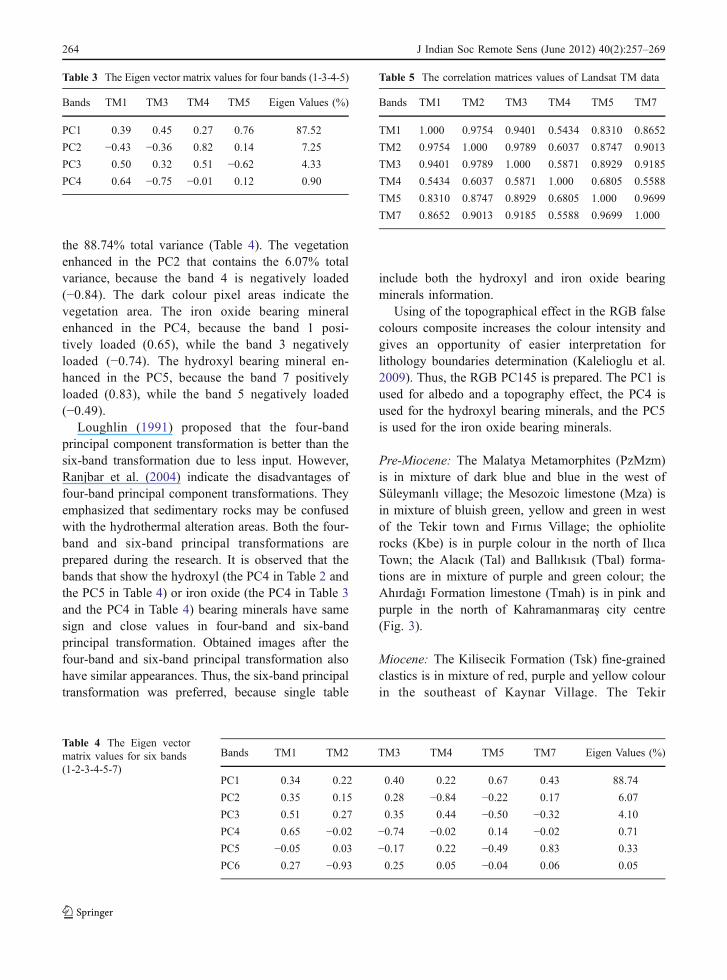
the 88.74% total variance (Table 4). The vegetationenhanced in the PC2 that contains the 6.07% totalvariance, because the band 4 is negatively loaded(−0.84). The dark colour pixel areas indicate thevegetation area. The iron oxide bearing mineralenhanced in the PC4, because the band 1 posi-tively loaded (0.65), while the band 3 negativelyloaded (−0.74). The hydroxyl bearing mineral en-hanced in the PC5, because the band 7 positivelyloaded (0.83), while the band 5 negatively loaded(−0.49).
Loughlin (1991) proposed that the four-bandprincipal component transformation is better than thesix-band transformation due to less input. However,Ranjbar et al. (2004) indicate the disadvantages offour-band principal component transformations. Theyemphasized that sedimentary rocks may be confusedwith the hydrothermal alteration areas. Both the four-band and six-band principal transformations areprepared during the research. It is observed that thebands that show the hydroxyl (the PC4 in Table 2 andthe PC5 in Table 4) or iron oxide (the PC4 in Table 3and the PC4 in Table 4) bearing minerals have samesign and close values in four-band and six-bandprincipal transformation. Obtained images after thefour-band and six-band principal transformation alsohave similar appearances. Thus, the six-band principaltransformation was preferred, because single table
include both the hydroxyl and iron oxide bearingminerals information.
Using of the topographical effect in the RGB falsecolours composite increases the colour intensity andgives an opportunity of easier interpretation forlithology boundaries determination (Kalelioglu et al.2009). Thus, the RGB PC145 is prepared. The PC1 isused for albedo and a topography effect, the PC4 isused for the hydroxyl bearing minerals, and the PC5is used for the iron oxide bearing minerals.
Pre-Miocene: The Malatya Metamorphites (PzMzm)is in mixture of dark blue and blue in the west ofSüleymanlı village; the Mesozoic limestone (Mza) isin mixture of bluish green, yellow and green in westof the Tekir town and Fırnıs Village; the ophioliterocks (Kbe) is in purple colour in the north of IlıcaTown; the Alacık (Tal) and Ballıkısık (Tbal) forma-tions are in mixture of purple and green colour; theAhırdağı Formation limestone (Tmah) is in pink andpurple in the north of Kahramanmaraş city centre(Fig. 3).
Miocene: The Kilisecik Formation (Tsk) fine-grainedclastics is in mixture of red, purple and yellow colourin the southeast of Kaynar Village. The Tekir
Bands TM1 TM2 TM3 TM4 TM5 TM7 Eigen Values (%)
PC1 0.34 0.22 0.40 0.22 0.67 0.43 88.74
PC2 0.35 0.15 0.28 −0.84 −0.22 0.17 6.07
PC3 0.51 0.27 0.35 0.44 −0.50 −0.32 4.10
PC4 0.65 −0.02 −0.74 −0.02 0.14 −0.02 0.71
PC5 −0.05 0.03 −0.17 0.22 −0.49 0.83 0.33
PC6 0.27 −0.93 0.25 0.05 −0.04 0.06 0.05
Table 4 The Eigen vectormatrix values for six bands(1-2-3-4-5-7)
Table 5 The correlation matrices values of Landsat TM data
Bands TM1 TM2 TM3 TM4 TM5 TM7
TM1 1.000 0.9754 0.9401 0.5434 0.8310 0.8652
TM2 0.9754 1.000 0.9789 0.6037 0.8747 0.9013
TM3 0.9401 0.9789 1.000 0.5871 0.8929 0.9185
TM4 0.5434 0.6037 0.5871 1.000 0.6805 0.5588
TM5 0.8310 0.8747 0.8929 0.6805 1.000 0.9699
TM7 0.8652 0.9013 0.9185 0.5588 0.9699 1.000
Table 3 The Eigen vector matrix values for four bands (1-3-4-5)
Bands TM1 TM3 TM4 TM5 Eigen Values (%)
PC1 0.39 0.45 0.27 0.76 87.52
PC2 −0.43 −0.36 0.82 0.14 7.25
PC3 0.50 0.32 0.51 −0.62 4.33
PC4 0.64 −0.75 −0.01 0.12 0.90
264 J Indian Soc Remote Sens (June 2012) 40(2):257–269
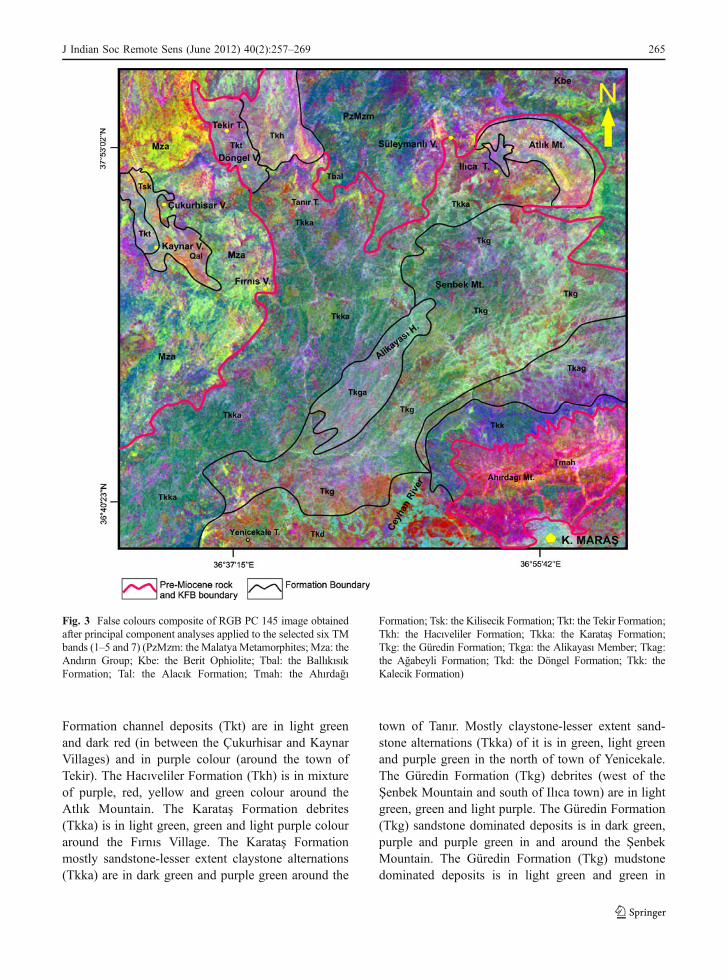
Formation channel deposits (Tkt) are in light greenand dark red (in between the Çukurhisar and KaynarVillages) and in purple colour (around the town ofTekir). The Hacıveliler Formation (Tkh) is in mixtureof purple, red, yellow and green colour around theAtlık Mountain. The Karataş Formation debrites(Tkka) is in light green, green and light purple colouraround the Fırnıs Village. The Karataş Formationmostly sandstone-lesser extent claystone alternations(Tkka) are in dark green and purple green around the
town of Tanır. Mostly claystone-lesser extent sand-stone alternations (Tkka) of it is in green, light greenand purple green in the north of town of Yenicekale.The Güredin Formation (Tkg) debrites (west of theŞenbek Mountain and south of Ilıca town) are in lightgreen, green and light purple. The Güredin Formation(Tkg) sandstone dominated deposits is in dark green,purple and purple green in and around the ŞenbekMountain. The Güredin Formation (Tkg) mudstonedominated deposits is in light green and green in
Fig. 3 False colours composite of RGB PC 145 image obtainedafter principal component analyses applied to the selected six TMbands (1–5 and 7) (PzMzm: the MalatyaMetamorphites; Mza: theAndırın Group; Kbe: the Berit Ophiolite; Tbal: the BallıkısıkFormation; Tal: the Alacık Formation; Tmah: the Ahırdağı
Formation; Tsk: the Kilisecik Formation; Tkt: the Tekir Formation;Tkh: the Hacıveliler Formation; Tkka: the Karataş Formation;Tkg: the Güredin Formation; Tkga: the Alikayası Member; Tkag:the Ağabeyli Formation; Tkd: the Döngel Formation; Tkk: theKalecik Formation)
J Indian Soc Remote Sens (June 2012) 40(2):257–269 265
between the Alikayası and the Mount Ahırdağı. TheAlikayası Member of the Güredin Formation is indark green and purple. The Ağabeyli Formation(Tkag) claystone-sandstone alternations are ingreen-purple-lavender colour in the north of MountAhırdağı. The Döngel Formation (Tkd) is in paleblue and red colour around the Ceyhan River in thewest of Mount Ahırdağı. The Kalecik Formation isin dark blue colour in the northern part of MountAhırdağı (Fig. 3).
Band Rationing
The band rationing is another method using fordiscrimination of the lithological units and alterationzones (Hunt et al. 1973; Hunt and Ashley 1979; Hunt1980, 1981; Ramadan and Kontny 2004; Kaleliogluet al. 2009). In this method, digital numbers of theband is mathematically divided into other bandnumber and new values are added to single image(Sabins 1997). So, some spectral differences of thematerials are enhancing.
Clay minerals show strong absorption in the band7 and high reflectance in the band 5 (Rowan et al.1977; Sabins 1997; Aydal et al. 2007). Hence, theenhancement of clay minerals may supply withratioing of the band 5/band 7.
The iron oxide minerals show strong absorptionand the lower reflectance value in the band 1 and thehigh reflectance in the band 5 (Hunt et al. 1973;Sabins 1997). Therefore, the enhancement of ironoxide minerals may supply with rationing of the band5/band 1.
Most of the clay minerals of KFB sourced fromalteration of the limestones, metamorphites andophiolites. Thus, they are enriched by the hydroxyland iron oxide minerals (Table 1). The most ofMiocene deep-sea clastics of KFB contain abundantclaystone or deposits with clayey matrix. Thus, theband 4 has been chosen for the RGB preparation dueto its high reflectance in watery geologic units. So,the RGB 5/7-5/1-4 was prepared for the separations offiner-grained clastics of the KFB (Fig. 4).
Pre-Miocene: The Malatya Metamorphites (PzMzm)is in dark green colour with red dots (the iron oxidebearing minerals) in the west of Süleymanlı village;the Mesozoic limestone (Mza) is in dark green withlight green dots (the hydroxyl bearing minerals) in the
west of Tekir town and Fırnıs Village; the ophioliterocks (Kbe) is in dark green colour with red dots (theiron oxide bearing minerals) in the north of IlıcaTown; the Alacık (Tal) and Ballıkısık (Tbal) formationsare not separated; the Ahırdağı Formation limestone(Tmah) is in dark blue with light green dots (hydroxylbearing minerals) in the north of Kahramanmaraş citycentre (Fig. 4).
Miocene: The Kilisecik Formation (Tsk) fine-grainedclastics is dark blue colour with green dots in thesoutheast of Kaynar Village. The Tekir Formationchannel deposits (Tkt; around the Tekir town, inbetween the Çukurhisar and Kaynar Villages) are indark blue with light green dots. The HacıvelilerFormation (Tkh) is in dark blue colour around theAtlık Mountain. The Karataş Formation debrites(Tkka) is in dark green and blue colour with red dotsaround the Fırnıs Village. The Karataş Formationmostly sandstone-lesser extent claystone alternations(Tkka) are in dark green colour with red dots aroundthe town of Tanır. Mostly claystone-lesser extentsandstone alternations (Tkka) of it is in dark greencolour with red dots in north of the town ofYenicekale. The Güredin Formation (Tkg) debrites(west of the Şenbek Mountain and south of Ilıcatown) are in dark green colour with red dots. TheGüredin Formation (Tkg) sandstone dominateddeposits is in dark green colour with red dots in andaround the Şenbek Mountain. The Güredin Formation(Tkg) mudstone dominated deposits is dark green andblue colour in between the Alikayası and the MountAhırdağı. The Alikayasımember of Güredin Formationis dark green and blue colour with red dots. TheAğabeyli Formation (Tkag) claystone-sandstone alter-nations are in dark green colour in the north of MountAhırdağı. The Döngel Formation (Tkd) is in dark greenand blue colour with pink dots around the Ceyhan Riverin the west of Mount Ahırdağı. The Kalecik Formationis in dark green colour in the northern part of MountAhırdağı (Fig. 4).
The channel deposits located in the Tekir town andthe Çukurhisar Village have the hydroxyl bearingminerals and fed from the mostly limestones. Thehigh CaO contents of the Tekir and Karataş For-mations confirm this result (Table 1). However, thechannel deposits of Alikayası Member include reddots points out fed from the Berit Ophiolite andMalatya Metamorphites. The sandstone, debrite and
266 J Indian Soc Remote Sens (June 2012) 40(2):257–269
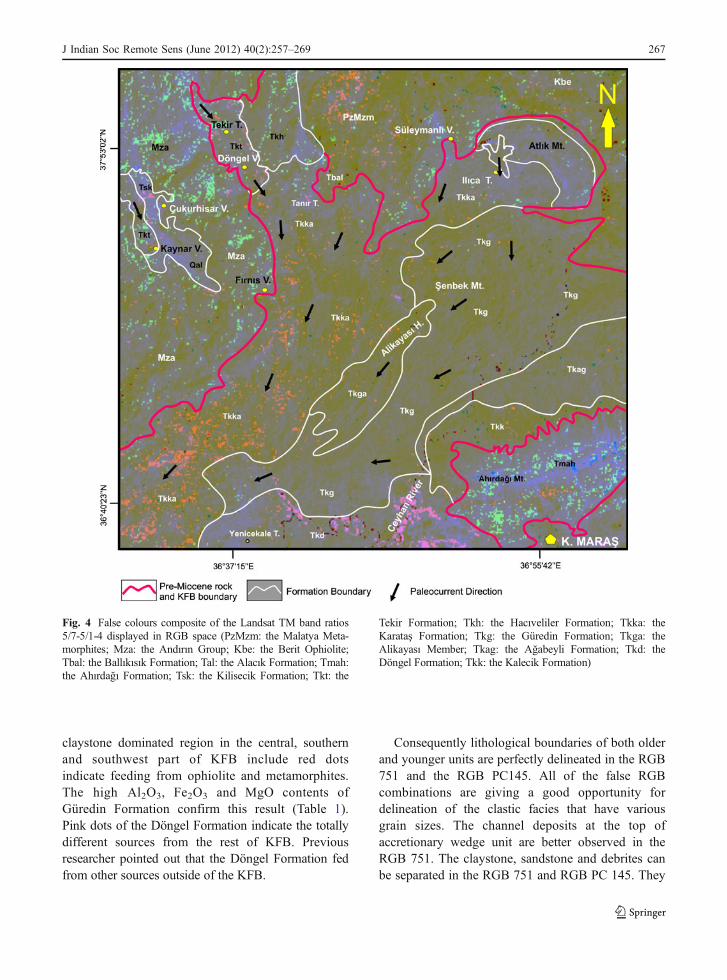
claystone dominated region in the central, southernand southwest part of KFB include red dotsindicate feeding from ophiolite and metamorphites.The high Al2O3, Fe2O3 and MgO contents ofGüredin Formation confirm this result (Table 1).Pink dots of the Döngel Formation indicate the totallydifferent sources from the rest of KFB. Previousresearcher pointed out that the Döngel Formation fedfrom other sources outside of the KFB.
Consequently lithological boundaries of both olderand younger units are perfectly delineated in the RGB751 and the RGB PC145. All of the false RGBcombinations are giving a good opportunity fordelineation of the clastic facies that have variousgrain sizes. The channel deposits at the top ofaccretionary wedge unit are better observed in theRGB 751. The claystone, sandstone and debrites canbe separated in the RGB 751 and RGB PC 145. They
Fig. 4 False colours composite of the Landsat TM band ratios5/7-5/1-4 displayed in RGB space (PzMzm: the Malatya Meta-morphites; Mza: the Andırın Group; Kbe: the Berit Ophiolite;Tbal: the Ballıkısık Formation; Tal: the Alacık Formation; Tmah:the Ahırdağı Formation; Tsk: the Kilisecik Formation; Tkt: the
Tekir Formation; Tkh: the Hacıveliler Formation; Tkka: theKarataş Formation; Tkg: the Güredin Formation; Tkga: theAlikayası Member; Tkag: the Ağabeyli Formation; Tkd: theDöngel Formation; Tkk: the Kalecik Formation)
J Indian Soc Remote Sens (June 2012) 40(2):257–269 267
give a different colour in the each false RGBcomposites. The band rationing is not giving goodresults for lithology discrimination. However, itsupplies valuable information about the sedimenttransportation path. Previous studies (Gül 2004; Gület al. 2011) have already discussed the two evolu-tionary stage of the KFB. They mentioned that theLower Miocene channelized deposits initially evolvedat the northwest of basin; they mostly fed from theAndırın Group. Then, depend on regional uplifting,sedimentation shifted to the south during the MiddleMiocene, and the centre of the basin mostly fed fromthe metamorphites and ophiolite. Alteration traces onFig. 4 are confirming these results.
Conclusions
The three different satellite images are proposed forfuture deep-sea sediment investigations. These are theRGB 751, RGB PC145 and RGB 5/7-5/1-4 falsecolour composite. These band combinations havebeen preferred due to abundant fine-grained clasticcontent of the Miocene aged Kahramanmaraş Fore-land Basin. These three false colour images give goodopportunity for delineation of general lithologicalboundary of the both older and younger units. Theyalso give good results in general lithologicalseparation of the younger foreland basin filling.However, similar lithology of the formation withdifferent ages gave the similar colour reflection. Inaddition, the channel deposits (including conglom-erate and coarse-grained sandstone) can be success-fully delineated in the RGB 751; the various agedlimestone and finer-grained sediments (includingclaystone-siltstone-sandstone) can be successfullydelineated in the RGB 751 and the RGB PC145.The RGB 5/7-5/1-4 image is not giving good resultfor the lithology separation. However, it supplies goodview of the alteration products and give meaningfulinformation about the transportation way of thesediments. So, the Landsat TM images provide timesavings and low cost results instead of the physicallyhard field working. However, it gives the generallithological boundary or trend of the sedimentationdue to very low spatial resolution (30 m). Thus, detailfacies studies of deep-sea sediments still required detailfield working or new satellite image that has moredetailed spatial resolution.
References
Abrams, M. J., Brown, L., Lepley, R., & Sadowski, P. (1983).Remote sensing for porphyry copper deposits in southernArizona. Economic Geology, 78, 591–604.
Aydal, D., Altaş, M., & Polat, O. (2003). Usage of GeographicInformation Systems with the remote sensing techniquesfor geological mapping and the ore research in theKızıldağ ophiolites. In Proceedings of the 10th AnniversarySymposium of the Mersin University, Department ofGeological Engineering (in Turkish), (Mersin, Turkey:Mersin University), (p. 112).
Aydal, D., Arda, E., & Dumanlılar, O. (2007). Application of theCrosta technique for alteration mapping of granitoidic rocksusing ETM+ data: case study from eastern Tauride belt (SETurkey). International Journal of Remote Sensing, 28,3895–3913.
Boulton, S. J., & Robertson, A. H. F. (2007). The Miocene of theHatay area, S Turkey: transition from the Arabian passivemargin to an underfilled foreland basin related to closure ofthe Tethys Ocean. Sedimentary Geology, 198, 93–124.
Cronin, B. T. (2002). Turbidite Systems of Southern andEastern Turkey, Analogue Data for Subsurface Modellingand Understanding Sub Seismic-Scale Heterogeneity inDeep-Water Clastic Systems. Field guide, 57 p.
Crosta, A., & Moore, J. M. C. M. (1989). Enhancement ofLandsat Thematic Mapper imagery for residual soilmapping in SW Minais Gerais State, Brazil: a prospectingcase history in Greenstone belt terrain. In Proceedings ofthe Seventh ERIM Thematic Conference: Remote Sensingfor Exploration Geology (pp. 1173–1187). Calgary, AB:ERIM.
DeCelles, P. G., & Giles, K. A. (1996). Foreland basin systems.Basin Research, 8, 105–123.
Derman, A. S. (1999). Proximal Submarine Fan Conglomerateand Valley Fill Pattern. 12nd Petroleum Congress ofTurkey, (pp. 207–218). Ankara, Turkey.
Gül, M. A. (2000). Geology of the Kahraman Maraş Region.PhD Thesis, Hacettepe University, Institute of Basic andApplied Science, 304 p. (Unpublished, in Turkish withEnglish abstract).
Gül, M. (2004). Evolution of the Turbidite System in theKahraman Maraş Basin. PhD Thesis, Çukurova University,Institute of Basic and Applied Science, 354 p. (Unpublished).
Gül, M., Gürbüz, K., Cronin, B. T., & Aiken, E. (2003).Multiple Deep Water Slope Feeder Channel Evolution of aSubmarine Fan System in the Maraş Basin (Miocene, S.Turkey). In Submarine Slope Systems: Processes, Productsand Prediction Conference, (p. 46), Liverpool, UK.
Gül, M., Darbaş, G., & Gürbüz, K. (2005). Tectono-stratigraphicalposition of Alacık Formation (Latest Middle Eocene-EarlyMiocene) in the Kahramanmaraş basin. İstanbul ÜniversitesiYer Bilimleri Dergisi, 18(2), 185–199. in Turkish withEnglish Abstract.
Gül, M., Gürbüz, K., & Cronin, B. T. (2011). Provenance of theNorthern Part of the Kahramanmaraş Peripheral ForelandBasin (Miocene, S Turkey). Journal of Asian EarthScience, 40(2), 475–495.
Hunt, G. R. (1980). Electromagnetic radiation: The communi-cation link in remote sensing. In B. S. Siegal & A. R.
268 J Indian Soc Remote Sens (June 2012) 40(2):257–269
Gillespie (Eds.), Remote sensing in geology (pp. 5–45).New York: Wiley.
Hunt, G. R. (1981). Spectra of kaolin minerals in alteredvolcanic rocks. Clays and Clay Minerals, 29, 76–81.
Hunt, G. R., & Ashley, R. P. (1979). Spectra of altered rocks inthe visible and near infrared. Economic Geology, 74,1613–1629.
Hunt, G. R., Salisbury, J. W., & Lenhoff, C. J. (1973). Visibleand near-infrared spectra of minerals and rocks IV.Additional silicates. Modern Geology, 4, 85–106.
Inzana, J., Kusky, T., Higgs, G., & Tucker, R. (2003).Supervised classifications of Landsat TM band ratioimages and Landsat TM band ratio image with radar forgeological interpretations of central Madagascar. Journalof African Earth Sciences, 37, 59–72.
Kalelioğlu, Ö., Zorlu, K., Kurt, M. A., Gül, M., & Güler, C.(2009). Delineating compositionally different dykes in theUlukışla basin (Central Anatolia, Turkey) using computer-enhanced multi-spectral remote sensing data. InternationalJournal of Remote Sensing, 30(11), 2997–3011.
Karig, D. E., & Kozlu, H. (1990). Late Palaeogene evolution of thetriple junction region nearMaraş south-central Turkey. Journalof the Geological Society of London, 147, 1023–1034.
Kaufman, H. (1988). Mineral exploration along the Agaba-Levant structure by use of TM data concepts, processingand results. International Journal of Remote Sensing, 9,1630–1658.
Khan, S. D., & Glenn, N. F. (2006). New strike-slip faults andlitho-units mapped in Chitral (N. Pakistan) using field andASTER data yield regionally significant results. InternationalJournal of Remote Sensing, 27, 4495–4512.
Khan, T., Murata, M., Karim, T., Zafar, M., Ozawa, H., &Rehman, H. (2007). A Cretaceous dike swarm providesevidence of a spreading axis in the back-arc basin of theKohistan paleo-island arc, northwestern Himalaya, Pakistan.Journal of Asian Earth Sciences, 29, 350–360.
Kissel, C., Laj, C., Poisson, A., & Görür, N. (2003). Paleomagneticreconstruction of the Cenozoic Evolution of the EasternMediterranean. Tectonophysics, 362, 199–217.
Kozlu, H. (1997). Tectono-stratigraphic units and tectonic develop-ments of the Neogene Basins (İskenderun, Misis-Andırın) inthe EasternMediterranean. PhDThesis, Çukurova University,Institute of Basic and Applied Science, 189p, (Unpublished,in Turkish with English abstract).
Kusky, T. M., & Ramadan, T. M. (2002). Structural controls onNeoproterozoic mineralization in theSouth Eastern Desert,Egypt: an integrated field, Landsat TM, and SIR-C/X SARapproach. Journal of African Earth Sciences, 35, 107–121.
Lillesand, T. M., & Kiefer, R. W. (1994). Remote sensing andimage interpretation. New York: John Wiley & Sons, Inc.
Liu, J. G., & Moore, J. M. C. M. (1989). Color enhancementand shadow suppression techniques for TM images. InProceedings of the 7th (ERIM) Thematic Conference:Remote Sensing for Exploration Geology (pp. 901–915).Calgary, Alberta, Canada.
Loughlin, W. P. (1991). Principal component analysis foralteration mapping. Photogrammetric Engineering andRemote Sensing, 57, 1163–1169.
McBride, E. F. (1963). A classification of common sandstones.Journal of Sedimentary Petrology, 34, 665–667.
Nalbant, S. S., & Alptekin, O. (1995). The use of LandsatThematic Mapper imagery for analysing lithology andstructure of Korucu-Muğla area in Western Turkey.International Journal of Remote Sensing, 16, 2357–2374.
Önalan, M. (1988). Geologic Evolution of the KahramanmaraşPeripheral Foreland Basin. Geological Bulletin of Turkey,31, 1–10 (in Turkish with English Abstract).
Pettijohn, F. J., Potter, P. E., & Siever, R. (1987). Sand andsandstone. Berlin: Springer and Verlag. 553 p.
Ramadan, T. M., & Kontny, A. (2004). Mineralogical andstructural characterization of alteration zones detected byorbital remote sensing at Shalatin District area, SE Desert,Egypt. Journal of African Earth Sciences, 40, 89–99.
Ranjbar, H., Honarmand, H. M., & Moezifar, Z. (2004).Application of the Crosta technique for porphyry copperalteration mapping, using ETM data in the southern part ofthe Iranian volcanic sedimentary belt. Journal of AsianEarth Sciences, 24, 237–243.
Ricotta, C., Avena, G. C., & Volpe, F. (1999). The influence ofprincipal component analysis on the spatial structure of amultispectral dataset. International Journal of RemoteSensing, 20, 3367–3376.
Robertson, A. H. F., Ünlügenç, U. C., İnan, N., & Taslı, K. (2004).The Misis-Andırın Complex: a Mid-Tertiary melange relatedto late-stage subduction of the Southern Neotethys in STurkey. Journal of Asian Earth Sciences, 22, 413–453.
Robertson, A. H. F., Ustaömer, T., Parlak, O., Ünlügenç, U. C., İnan,N., & Taslı, K. (2006). The Berit transect of the Tauride thrustbelt, S Turkey: Late Cretaceous–Early Cenozoic accretionary/collisional processes related to closure of the SouthernNeotethys. Journal of Asian Earth Sciences, 27, 108–145.
Rowan, L. C., Goetz, A. F. H., & Ashley, R. P. (1977).Discrimination of hydrothermally altered and unalteredrocks in visible and near infrared multispectral images.Geophysics, 42, 522–535.
Sabins, F. F. (1997).Remote sensing. Principles and interpretation.New York: Freeman. 494 p.
Şengör, A.M. C., &Yılmaz, Y. (1981). Tethyan evolution of Turkey:a plate tectonic approach. Tectonophysics, 75, 181–241.
Yılmaz, Y. (1993). New evidence and model on the evolution ofthe southeast Anatolian orogen. Geological Society ofAmerica Bulletin, 105, 251–271.
Yılmaz, Y., & Gürer, Ö. F. (1996). The geology and evolution ofthe Misis-Andırın Belt around Andırın (Kahramanmaras).Turkish Journal of Earth Science, 5, 39–55 (in Turkishwith English abstract).
Yılmaz, Y., & Yıldırım, M. (1996). Geology and evaluation ofthe nap region (the Metamorphic Massifs) of the SoutheastAnatolian Orogenic Belt. Turkish Journal of EarthScience, 5, 21–38 (in Turkish with English abstract).
J Indian Soc Remote Sens (June 2012) 40(2):257–269 269
Related Documents