JKAU; Earth Sci., Vol. 20 No.1, pp: 193-213 (2009 A.D./1430 A.H.) 193 Lithologic Discrimination Using Selective Image Processing Technique of Landsat 7 Data, Um Bogma Environs Westcentral Sinai, Egypt Adel Zein Bishta Faculty of Earth Sciences, King Abdulaziz University, Jeddah, Kingdom of Saudi Arabia E-mail: [email protected] Received: 1/3/2008 Accepted: 23/6/2008 Abstract. Um-Bogma area located in the westcentral part of Sinai, Egypt is covered by Precambrian basement rocks within the northern part of the Precambrian Arabian-Nubian crystalline massive. Satellite images are among continuous sources of digital data for mapping lineaments and lithology. In the present work, the lithologic discrimination and lineament analysis of Landsat-7 ETM+ data for Um Bogma area have been carried out using Geomatica PCI EASI/PACE (9.1) and GeoAnalyst PCI packages. A selective image processing technique (SIPT) is a new approach in Geomatica, which gives rise to valuable results in this work. The SIPT and the visual interpretation of the constructed Landsat false colour composite (FCC) and ratio images led to discriminate and delineate the lithologic rock units of the study area. The structural lineament pattern for each interpreted lithologic unit has been constructed using SIPT. The prepared rose diagrams for the extracted lineaments are very characteristic for each interpreted lithologic unit. The structural lineament analyses and the discriminated lithologic units are integrated to show their relationships to the high radioactivity occurrences of the study area. The NW-SE trend is the predominant regional structural lineament trend in the investigated area. The NE-SW to the ENE-WSW directions is the predominant minor structural lineament trends. The highest radioactivity zones of the study area are restricted to Um Bogma formation and the younger granitic rocks.

Welcome message from author
This document is posted to help you gain knowledge. Please leave a comment to let me know what you think about it! Share it to your friends and learn new things together.
Transcript
JKAU; Earth Sci., Vol. 20 No.1, pp: 193-213 (2009 A.D./1430 A.H.)
193
Lithologic Discrimination Using Selective Image
Processing Technique of Landsat 7 Data, Um Bogma
Environs Westcentral Sinai, Egypt
Adel Zein Bishta
Faculty of Earth Sciences, King Abdulaziz University, Jeddah, Kingdom
of Saudi Arabia
E-mail: [email protected]
Received: 1/3/2008 Accepted: 23/6/2008
Abstract. Um-Bogma area located in the westcentral part of Sinai,
Egypt is covered by Precambrian basement rocks within the northern
part of the Precambrian Arabian-Nubian crystalline massive. Satellite
images are among continuous sources of digital data for mapping
lineaments and lithology. In the present work, the lithologic
discrimination and lineament analysis of Landsat-7 ETM+ data for
Um Bogma area have been carried out using Geomatica PCI
EASI/PACE (9.1) and GeoAnalyst PCI packages.
A selective image processing technique (SIPT) is a new
approach in Geomatica, which gives rise to valuable results in this
work. The SIPT and the visual interpretation of the constructed
Landsat false colour composite (FCC) and ratio images led to
discriminate and delineate the lithologic rock units of the study area.
The structural lineament pattern for each interpreted lithologic
unit has been constructed using SIPT. The prepared rose diagrams for
the extracted lineaments are very characteristic for each interpreted
lithologic unit. The structural lineament analyses and the
discriminated lithologic units are integrated to show their relationships
to the high radioactivity occurrences of the study area. The NW-SE
trend is the predominant regional structural lineament trend in the
investigated area. The NE-SW to the ENE-WSW directions is the
predominant minor structural lineament trends. The highest
radioactivity zones of the study area are restricted to Um Bogma
formation and the younger granitic rocks.
Adel Zein Bishta 194
Introduction
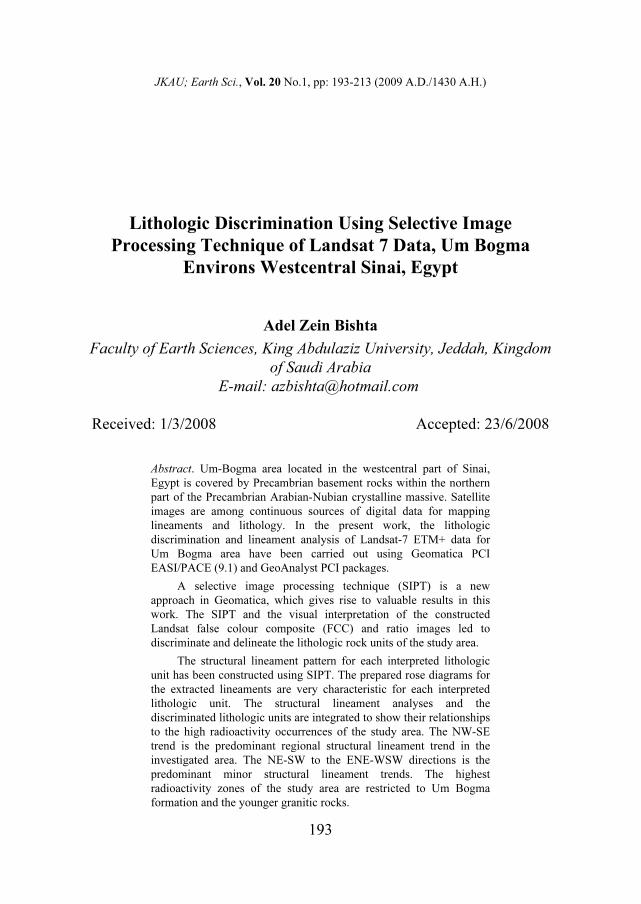
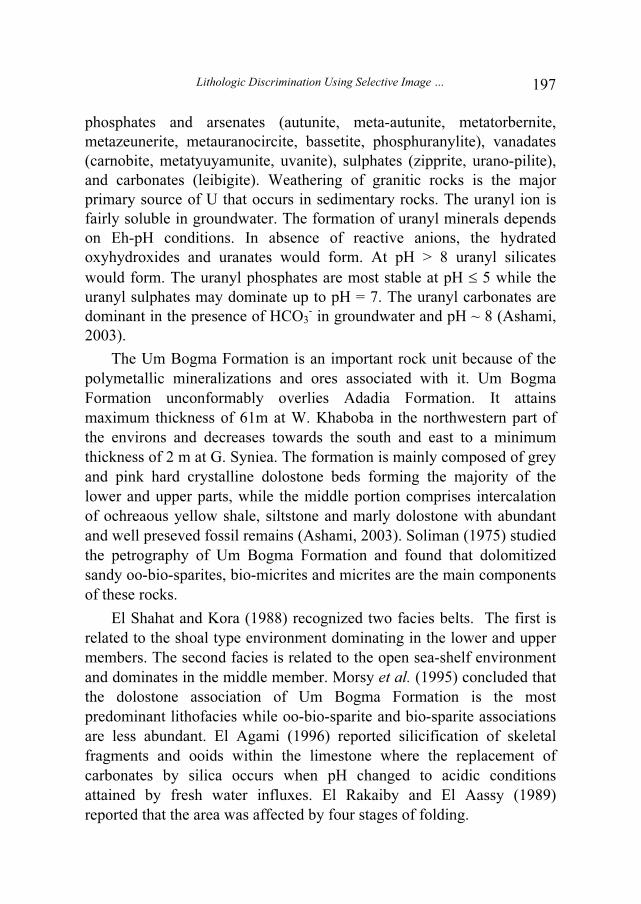
The Um Bogma environs are located to the east of Abu Zeneima town on
the eastern coast of the Gulf of Suez, Southwestern Sinai Peninsula.
These environs are bounded between longitudes 33° 10` & 33° 32` E and
latitudes 28° 50` & 29° 05` N (Fig. 1) covering an area of about 700 km2.
This district has been known for its polymetallic mineralization since the
Ancient Egyptians, especially copper-deposits and torquois. Recently this
area became famous for Mn-ores and some industrial minerals such as
kaolinite and bentonite clays as well as sand glass.
Fig. 1. Location map of the study area.
The radiometry exploration, which was carried out by the Egyptian
Nuclear Materials Authority, led to discovery of some important
occurrences of radioactive mineralization. The investigated area is
topographically moderately mountainous such as Gabal (G.) Samra, G.
Allouga, G. Um Bogma, G. Deleidim and G. Adedia and dissected by
numerous wadies such as W. Lehian, W. Nasib, W. Khababa, W. Abu
Thor, W. Shalal, W. Aseih, and W. Baba. These wadis are structurally
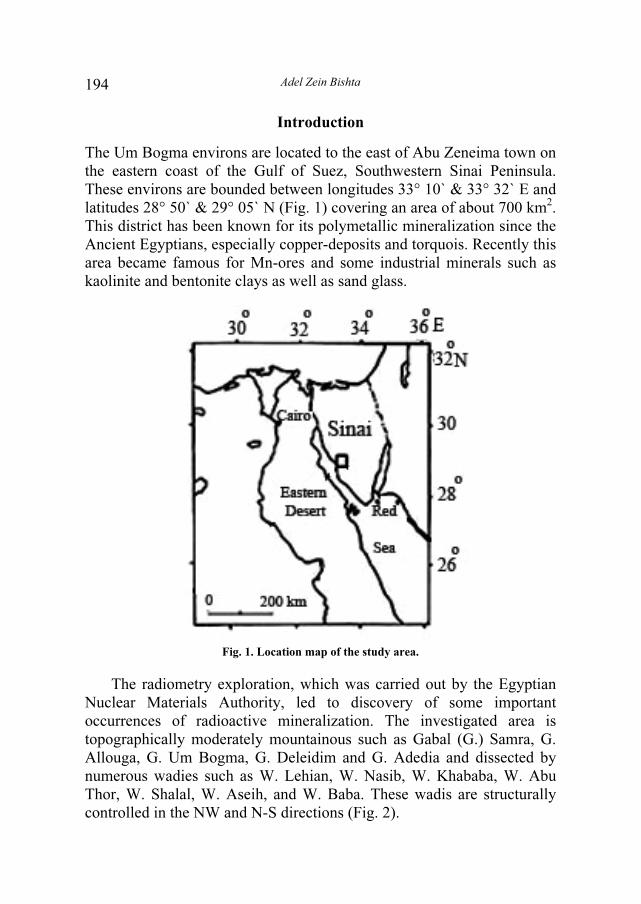
controlled in the NW and N-S directions (Fig. 2).
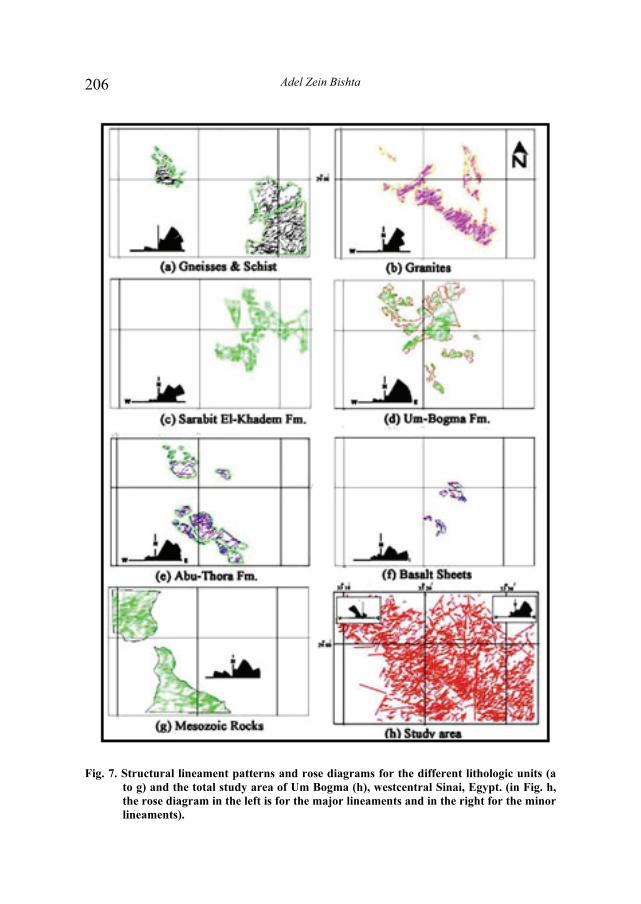
Lithologic Discrimination Using Selective Image … 195
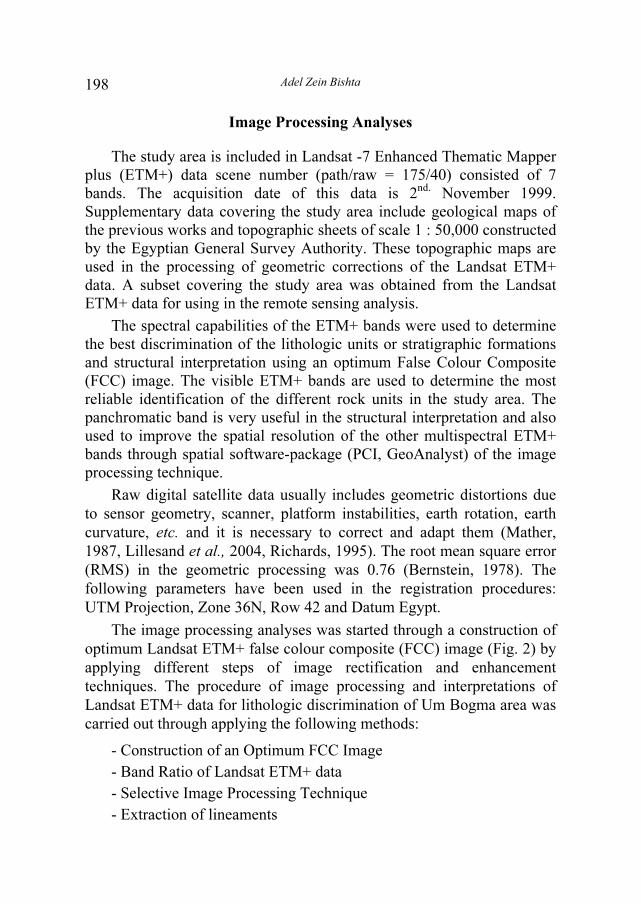
Fig. 2. False colour composite Landsat image of Um Bogma area, westcentral Sinai, Egypt.
(ETM bands, 7-4-2).
Um Bogma area is covered mainly by a complex of basement rocks,
comprise migmatized gneisses and schists. The igneous plutonic rocks
comprise diorite to quartz diorite masses, granodiorite batholithic
intrusions, and pink coloured coarse grained granitic plutons.
The Paleozoic succession unconformably overlies the basement with
a separating thin layer (61 cm) of basal conglomerate. The succession
attains a thickness of about 160 m at northwestern end of the studied
environs increasing to 370 m at the southeastern corner. The Paleozoic
succession in some places is capped by Mesozoic basaltic sheets as well
as dissected by basaltic and doloritic dykes (Ashami, 2003).
The selective image processing technique (SIPT) was applied in this
work using different sets of remotely sensed Landsat-7 Satellite data, for
the investigated area. The spatial program software packages of remote
sensing and Geographic Information System (GIS) were used in this
study such as PCI-Geomatica-9, Geoanalyst, Spans and Ace. The aim of
applying this advanced technique is to determine and separate the main
lithologic units of the investigated area and determine the main
characteristics of these units, and their relations to the high radioactivity.
Adel Zein Bishta 196
Geologic Setting
The succession is classified into the following formations starting
from the oldest: Sarabit El Khadim, Abu Hamata and Adedia Formations
representing the lower clastic or sandstone series. This is followed
unconformably upwards by Um Bogma Formation representing the
middle carbonate series. This is unconformably overlain by Abu Thora
Formation representing the upper clastic or sandstone series. Owing to
the importance of Um Bogma Formation, for hosting most of
polymetallic mineralization associated with Paleozoic rocks, it is
classified into three members: Lower member comprising siltstone,
claystone and sandy dolostone; middle member comprising marly
dolostone, and upper member comprising sandy dolostone, claystone and
siltstone. The uranium mineralizations are mainly associated with the
middle member of Um Bogma Formation (Ashami, 2003 and Aita,
1996).
The Paleozoic rocks are cut by numerous faults in various blocks
with vertical displacement reaching up to 100 m, sometimes forming
horsts and grabens. The major faults usually control the location of deep
wadis as well as the landscape, (Ashami, 2003).
Many geological, structural, geochemical and geophysical works
have been carried out for Um Bogma area such as El Kassas (1967),
Soliman (1975), Mostafa (1987), El Shahat and Kora (1988), El Rakaiby
and El Aassy (1989), El- Sharkawi, et al.(1990a), Mansour, (1994),
Bishay, (1994), Morsy et al. (1995), Botros (1995), Ashami (1995 &
2003), Aita, (1996), El Agami (1996), Amer (1997), Abd EL-Monem, et
al. (1997), Ammar et al.(1999), Afifi (2001) and Abdelaziz (2000). The
U-mineralizations associated with Paleozoic rocks are classified into
three types: 1) Paleo-channel fill deposits in the Quaternary
conglomerates; 2) Paleoplacer deposits comprising lenses of enriched
radioactive heavy minerals such as zircon, monazite and xenotime hosted
within basal conglomerate, sandstones and shales of Adadia Formation;
3) Epigenetic U-deposits comprising oxidized uranyl minerals in the
form of disseminations, encrustations, thin films and minute veinlets
associated with marl, shale, claystone, gibbsite and (Mn, Fe) ores of Um
Bogma formation. The uranyl minerals assemblage comprises: oxide
hydrate (clarkeite), silicates (uranophane, B-uranophane, kasolite),
Lithologic Discrimination Using Selective Image … 197
phosphates and arsenates (autunite, meta-autunite, metatorbernite,
metazeunerite, metauranocircite, bassetite, phosphuranylite), vanadates
(carnobite, metatyuyamunite, uvanite), sulphates (zipprite, urano-pilite),
and carbonates (leibigite). Weathering of granitic rocks is the major
primary source of U that occurs in sedimentary rocks. The uranyl ion is
fairly soluble in groundwater. The formation of uranyl minerals depends
on Eh-pH conditions. In absence of reactive anions, the hydrated
oxyhydroxides and uranates would form. At pH > 8 uranyl silicates
would form. The uranyl phosphates are most stable at pH ≤ 5 while the
uranyl sulphates may dominate up to pH = 7. The uranyl carbonates are
dominant in the presence of HCO3- in groundwater and pH ~ 8 (Ashami,
2003).
The Um Bogma Formation is an important rock unit because of the
polymetallic mineralizations and ores associated with it. Um Bogma
Formation unconformably overlies Adadia Formation. It attains
maximum thickness of 61m at W. Khaboba in the northwestern part of
the environs and decreases towards the south and east to a minimum
thickness of 2 m at G. Syniea. The formation is mainly composed of grey
and pink hard crystalline dolostone beds forming the majority of the
lower and upper parts, while the middle portion comprises intercalation
of ochreaous yellow shale, siltstone and marly dolostone with abundant
and well preseved fossil remains (Ashami, 2003). Soliman (1975) studied
the petrography of Um Bogma Formation and found that dolomitized
sandy oo-bio-sparites, bio-micrites and micrites are the main components
of these rocks.
El Shahat and Kora (1988) recognized two facies belts. The first is
related to the shoal type environment dominating in the lower and upper
members. The second facies is related to the open sea-shelf environment
and dominates in the middle member. Morsy et al. (1995) concluded that
the dolostone association of Um Bogma Formation is the most
predominant lithofacies while oo-bio-sparite and bio-sparite associations
are less abundant. El Agami (1996) reported silicification of skeletal
fragments and ooids within the limestone where the replacement of
carbonates by silica occurs when pH changed to acidic conditions
attained by fresh water influxes. El Rakaiby and El Aassy (1989)
reported that the area was affected by four stages of folding.
Adel Zein Bishta 198
Image Processing Analyses
The study area is included in Landsat -7 Enhanced Thematic Mapper
plus (ETM+) data scene number (path/raw = 175/40) consisted of 7
bands. The acquisition date of this data is 2nd.
November 1999.
Supplementary data covering the study area include geological maps of
the previous works and topographic sheets of scale 1 : 50,000 constructed
by the Egyptian General Survey Authority. These topographic maps are
used in the processing of geometric corrections of the Landsat ETM+
data. A subset covering the study area was obtained from the Landsat
ETM+ data for using in the remote sensing analysis.
The spectral capabilities of the ETM+ bands were used to determine
the best discrimination of the lithologic units or stratigraphic formations
and structural interpretation using an optimum False Colour Composite
(FCC) image. The visible ETM+ bands are used to determine the most
reliable identification of the different rock units in the study area. The
panchromatic band is very useful in the structural interpretation and also
used to improve the spatial resolution of the other multispectral ETM+
bands through spatial software-package (PCI, GeoAnalyst) of the image
processing technique.
Raw digital satellite data usually includes geometric distortions due
to sensor geometry, scanner, platform instabilities, earth rotation, earth
curvature, etc. and it is necessary to correct and adapt them (Mather,
1987, Lillesand et al., 2004, Richards, 1995). The root mean square error
(RMS) in the geometric processing was 0.76 (Bernstein, 1978). The
following parameters have been used in the registration procedures:
UTM Projection, Zone 36N, Row 42 and Datum Egypt.
The image processing analyses was started through a construction of
optimum Landsat ETM+ false colour composite (FCC) image (Fig. 2) by
applying different steps of image rectification and enhancement
techniques. The procedure of image processing and interpretations of
Landsat ETM+ data for lithologic discrimination of Um Bogma area was
carried out through applying the following methods:
- Construction of an Optimum FCC Image
- Band Ratio of Landsat ETM+ data
- Selective Image Processing Technique
- Extraction of lineaments
Lithologic Discrimination Using Selective Image … 199
Construction of an Optimum FCC Image
The Landsat satellite ETM+ data bands 7, 4 and 2 were used to
construct a false colour composite image of scale 1 : 100000 for the study
area in blue (B), green (G) and red (R) respectively (Fig.2). A histogram
equalization enhancement was carried out for the prepared FCC Landsat
image to be more interpretable (Fig. 2).
The granites in the southcentral part of the mapped area as well as
the Mesozoic rocks have been delineated and identified by their lighter
pink colour and brown colour respectively on the FCC image. While the
dark coloured tones distinguish the gneisses and schists and the mafic-
ultramafic rocks.
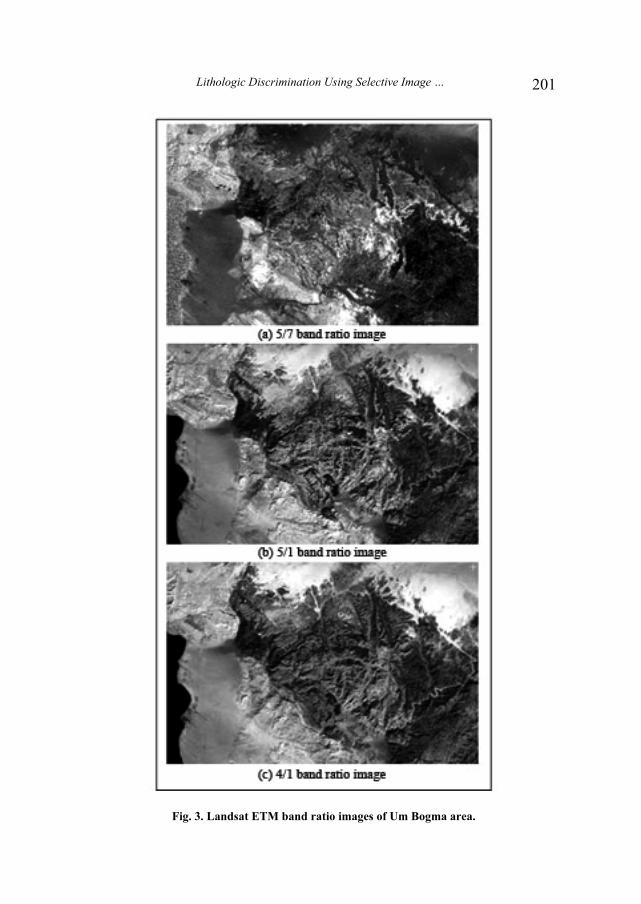
Band Ratio of Landsat ETM + data
Addition, subtraction, multiplication and division of the pixel
brightness from two bands of image data to form a new image are
particularly simple transformations to apply, and can often be
implemented in hardware using look up table (Richards, 1995). Band
ratio technique is applied by dividing the DN pixel values of one band by
the DN pixel values of another band (Drury, 1993). The geological
mapping of serpentinites and Meatiq dome in the Eastern Desert of
Egypt, using band ratios of Landsat thematic mapper, were carried out by
Sultan et al. (1986 and 1987). The band ratios 5/7, 5/1 and 4/1 (Fig. 3) of
ETM+ data were constructed to help in the lithology discriminations of
Um Bogma area. Bishta (2004) used the Landsat ETM+ band ratios for
litholgic discrimination of Gabal Qattar area in the Eastern Desert of
Egypt.
The ratio of band 5/7 was used as a measure of the intensity of the
hydroxyl absorption in the 2.2 to 2.4 um region. This ratio was used
because band 5 is not within the confines of the Fe-bearing
aluminosilicate related or hydroxyl-related absorption features, whereas
band 7 is within the hydroxyl absorption wave lengths (Sultan et al.,
1987). The 5/7 band ratio image (Fig. 3a) shows dark tone characterizing
the younger granitic rocks in the northern part and south central part of
the mapped area, due to the low content of hydroxyl-bearing minerals
and opaques.
The minerals that have low flat spectral reflectance such as magnetite
and ilmenite (due to iron and titanium related overlapping electronic
Adel Zein Bishta 200
transition and crystal field absorption) are defined as opaque phases
(Hunt, 1977 and 1979). The 5/1 band ratio image (Fig. 3b) shows
generally high reflectance value except for the rocks bearing high
contents of opaques. This ratio image exhibits also dark and gray tone
signature for the basaltic sheets in the central part of the map, gneisses
and schists in the eastern part of the map which are relatively enriched in
opaques and hydroxyl bearing phases. The dark tone signature is noticed
also along some fractures and wadis in the 5/1 band ratio image due to
the invasion of opaque minerals.
The 4/1-band ratio image (Fig. 3c) is used to detect rocks bearing Fe-
silicates and opaque phases. This band ratio show bright tone signature
for Um Bogma formation, Mesozoic rocks and Quaternary wadi deposits
because they are poor in Fe-silicate minerals and opaque phases. The
basaltic sheets have a dark tone signature on the image ratio 4/1 due to
their relatively high contents of Fe-silicate minerals and opaque phases
(Fig. 3c).
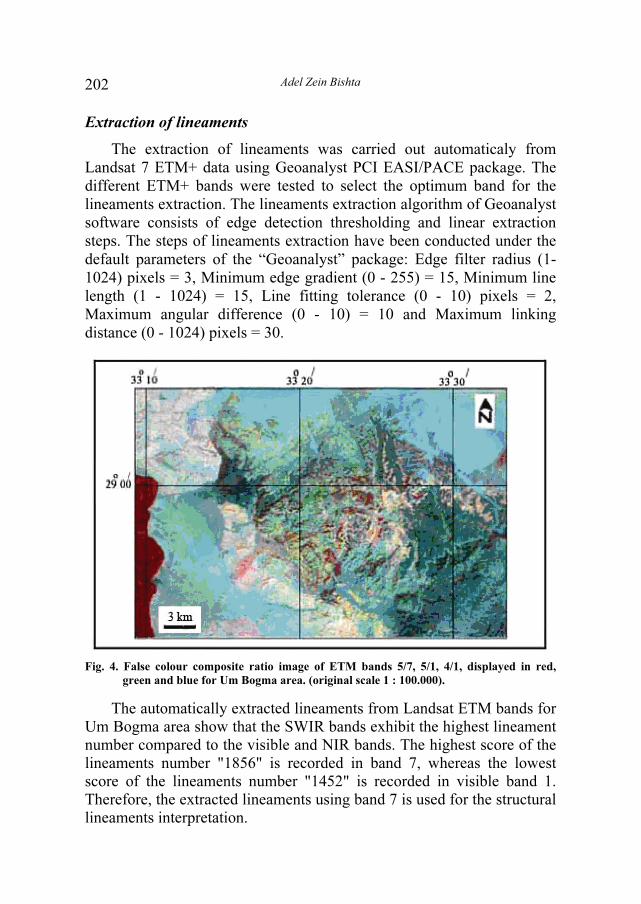
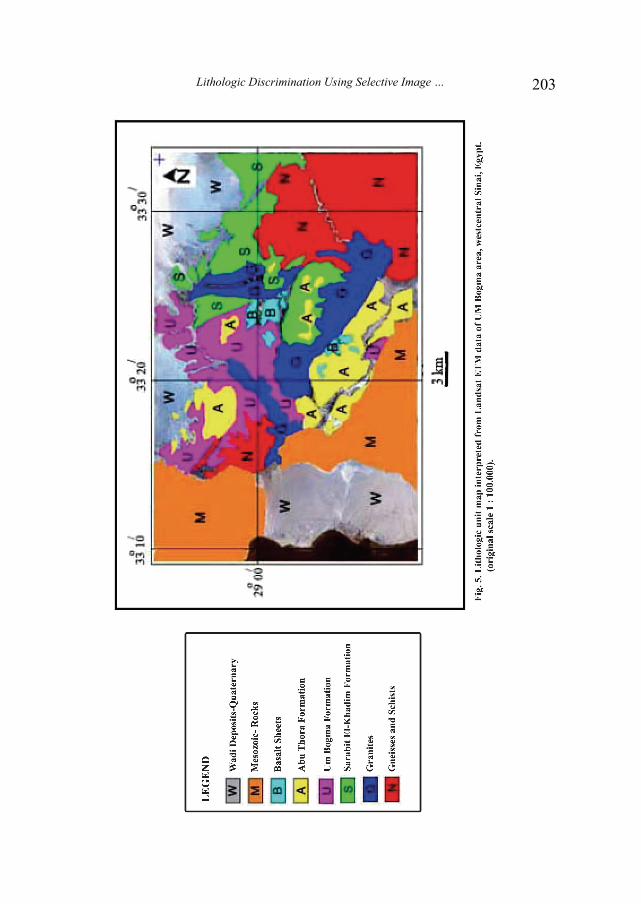
A false colour composite ratio image is constructed from ETM-bands
5/7, 5/1 and 4/1 displayed in red, green and blue respectively (Fig. 4).
This image helped in the lithologic discrimination of the investigated
area and in construction of the lithologic map shown in Fig. 5.
Visual inspection of the FCC ratio image (Fig. 4) shows that the
gneisses and schists corresponds to green and dark green colour, the
granites corresponds to light green colour, the sarabit El Khadem
formation corresponds to pinkish colour, Abu Thora formation
corresponds to yellowish and dark yellowish colour while the basaltic
sheets corresponds to dark brown colours (Fig. 4 & 5).
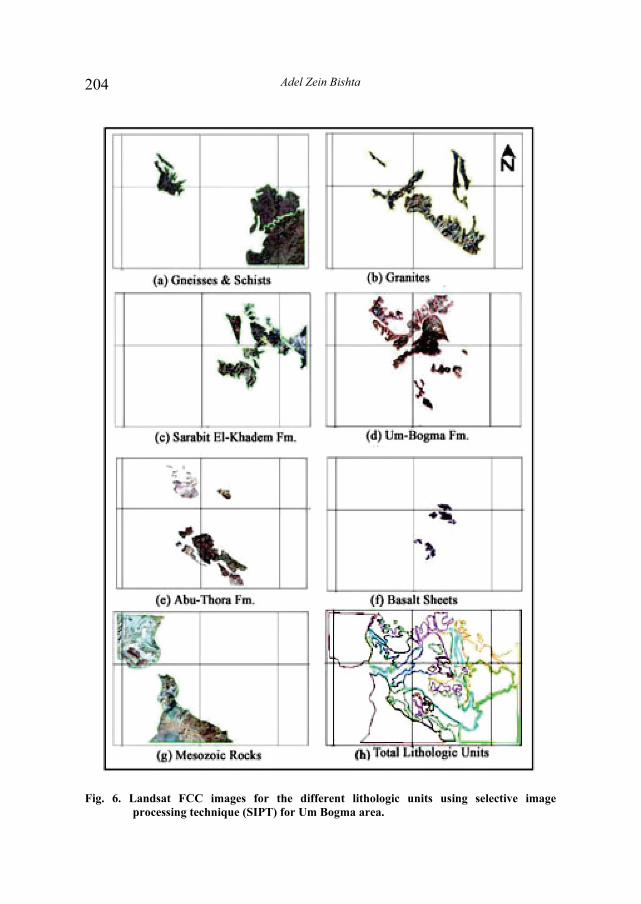
Selective Image Processing Technique
A selective image processing technique (SIPT) is applied in this
work using PCI-Geomatica-9 software to delineate and separate the
different interpreted lithologic units of Um Bogma area. The selective
separations of the Landsat FCC image for the different lithologic units as
well as the boundary of each unit of the investigated area are shown in
Fig. 6. The SIPT enable us also to inspect carefully the main spectral
characteristics of each lithologic unit alone. This technique enables us
also to separate and inspect the high radioactivity zone (HRZ) for the
study area (Bishta, 2005).
Lithologic Discrimination Using Selective Image … 201
Fig. 3. Landsat ETM band ratio images of Um Bogma area.
Adel Zein Bishta 202
Extraction of lineaments
The extraction of lineaments was carried out automaticaly from
Landsat 7 ETM+ data using Geoanalyst PCI EASI/PACE package. The
different ETM+ bands were tested to select the optimum band for the
lineaments extraction. The lineaments extraction algorithm of Geoanalyst
software consists of edge detection thresholding and linear extraction
steps. The steps of lineaments extraction have been conducted under the
default parameters of the “Geoanalyst” package: Edge filter radius (1-
1024) pixels = 3, Minimum edge gradient (0 - 255) = 15, Minimum line
length (1 - 1024) = 15, Line fitting tolerance (0 - 10) pixels = 2,
Maximum angular difference (0 - 10) = 10 and Maximum linking
distance (0 - 1024) pixels = 30.
Fig. 4. False colour composite ratio image of ETM bands 5/7, 5/1, 4/1, displayed in red,
green and blue for Um Bogma area. (original scale 1 : 100.000).
The automatically extracted lineaments from Landsat ETM bands for Um Bogma area show that the SWIR bands exhibit the highest lineament
number compared to the visible and NIR bands. The highest score of the lineaments number "1856" is recorded in band 7, whereas the lowest score of the lineaments number "1452" is recorded in visible band 1. Therefore, the extracted lineaments using band 7 is used for the structural
lineaments interpretation.
Lithologic Discrimination Using Selective Image … 203
Adel Zein Bishta 204
Fig. 6. Landsat FCC images for the different lithologic units using selective image
processing technique (SIPT) for Um Bogma area.
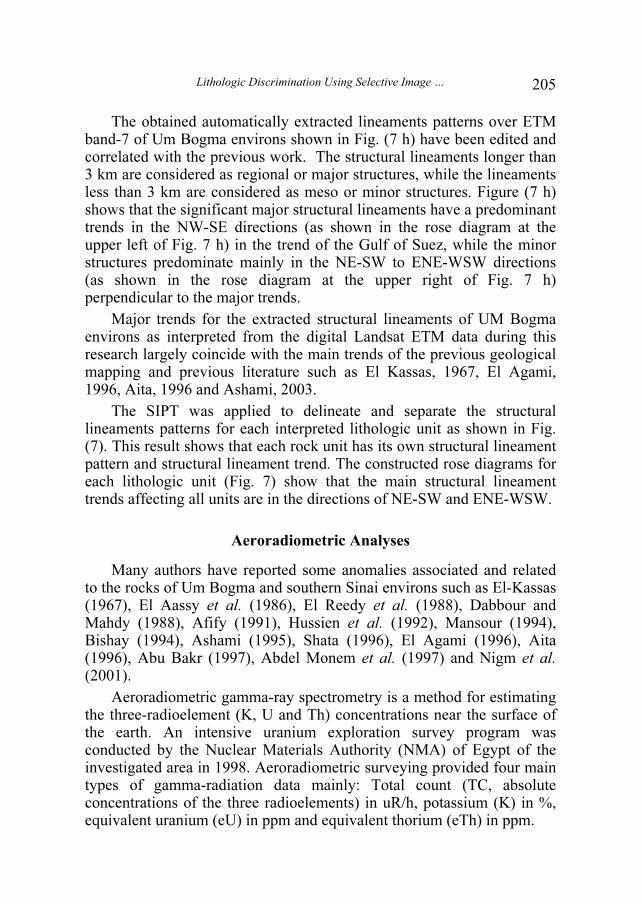
Lithologic Discrimination Using Selective Image … 205
The obtained automatically extracted lineaments patterns over ETM band-7 of Um Bogma environs shown in Fig. (7 h) have been edited and correlated with the previous work. The structural lineaments longer than 3 km are considered as regional or major structures, while the lineaments less than 3 km are considered as meso or minor structures. Figure (7 h) shows that the significant major structural lineaments have a predominant trends in the NW-SE directions (as shown in the rose diagram at the upper left of Fig. 7 h) in the trend of the Gulf of Suez, while the minor structures predominate mainly in the NE-SW to ENE-WSW directions (as shown in the rose diagram at the upper right of Fig. 7 h) perpendicular to the major trends.
Major trends for the extracted structural lineaments of UM Bogma environs as interpreted from the digital Landsat ETM data during this research largely coincide with the main trends of the previous geological mapping and previous literature such as El Kassas, 1967, El Agami, 1996, Aita, 1996 and Ashami, 2003.
The SIPT was applied to delineate and separate the structural lineaments patterns for each interpreted lithologic unit as shown in Fig. (7). This result shows that each rock unit has its own structural lineament pattern and structural lineament trend. The constructed rose diagrams for each lithologic unit (Fig. 7) show that the main structural lineament trends affecting all units are in the directions of NE-SW and ENE-WSW.
Aeroradiometric Analyses
Many authors have reported some anomalies associated and related to the rocks of Um Bogma and southern Sinai environs such as El-Kassas (1967), El Aassy et al. (1986), El Reedy et al. (1988), Dabbour and Mahdy (1988), Afify (1991), Hussien et al. (1992), Mansour (1994), Bishay (1994), Ashami (1995), Shata (1996), El Agami (1996), Aita (1996), Abu Bakr (1997), Abdel Monem et al. (1997) and Nigm et al. (2001).
Aeroradiometric gamma-ray spectrometry is a method for estimating the three-radioelement (K, U and Th) concentrations near the surface of the earth. An intensive uranium exploration survey program was conducted by the Nuclear Materials Authority (NMA) of Egypt of the investigated area in 1998. Aeroradiometric surveying provided four main types of gamma-radiation data mainly: Total count (TC, absolute concentrations of the three radioelements) in uR/h, potassium (K) in %, equivalent uranium (eU) in ppm and equivalent thorium (eTh) in ppm.
Adel Zein Bishta 206
Fig. 7. Structural lineament patterns and rose diagrams for the different lithologic units (a
to g) and the total study area of Um Bogma (h), westcentral Sinai, Egypt. (in Fig. h,
the rose diagram in the left is for the major lineaments and in the right for the minor
lineaments).
Lithologic Discrimination Using Selective Image … 207
The relative concentrations of uranium with respect to potassium and
thorium are important diagnostic factors in the recognition of possible
uranium deposits (IAEA, 1988).
The aerial gamma-ray spectrometric records vary widely from one
type of rock to another and to some extent between units of the same
rock type too. On the aerial total-count (TC) radiometric map, the records
vary from 0.1 to 47 uR/h. On the equivalent thorium (eTh) and the
equivalent uranium (eU) maps the records vary from 2.6 to 51.9 ppm and
from 2 to 18 ppm respectively (Abdelaziz, 2000).
The application of SIPT to separate the different lithologic units and
comparing them with the previous published aeroradiometric and
spectrometric maps revealed that the high radioactivity zones are mainly
restricted to Um Bogma formation and the younger granitic rocks
(Bishta, 2005).
Discussion and Conclusions
The selective image processing technique was applied in this study
for lithological discrimination of Um Bogma area. The result of the
digital image processing of Landsat - 7 satellite data leads to produce a
false colour composite image at scale 1 : 100,000. This FCC image has
been constructed by combinations of the ETM bands 7, 4 and 2 in red,
green and blue respectively. This image helped in the identifications of
the lithologic rock units and formations in the mapped area. The
produced colour composite image of ETM band ratios (5/7, 5/1 and 4/1)
was helpful also in outlining and discriminating the lithologic units of the
investigated area.
The prepared FCC image (Fig. 2) and the colour composite image of
the band ratios (Fig. 4) obtained from the Landsat ETM digital data, have
been used in constructing the detailed lithologic map of Um Bogma area
(Fig. 5) which illustrates the following:
1- The sharp contacts between the Sarabit El-Khadim, Um Bogma
and Abu Thora formations are clearly discriminated.
2- The granitc rocks are discriminated and easily delineated due to
their sharp contacts with all the other rocks and its light green and
pinkish colour on the ETM images. While the dark coloured tones
distinguished the gneisses and schists on the FCC image.
Adel Zein Bishta 208
3- The applications of Landsat ETM+ band ratios were also helpful
in the litholoical mapping of the study area. Using of FCC image of
Landsat band ratios 5/7, 5/1 and 4/1 displayed in red, green and blue
respectively discriminating the gneisses and schists, granites, Sarabit El
Khadem Formation, Abu Thora Formation and the basaltic sheets.
4- The prepared composite ETM images are failed in identifying
some small rock-outcrops in the northern parts of the mapped area, due to
the relatively low spatial resolution of the ETM data (30 m).
5- This map shows the validity and usefulness of applying the
selective image processing technique in the lithological mapping.
Comparing the constructed lithological map of Um Bogma area
(Fig.5) with the previously published maps, the study shows the
following:
1- The lithological map in the present work shows more detailed
informations about lithology and structural lineaments than the previous
mapping.
2- The FCC image, the ratio images and the detected lineaments
from digital ETM data gave additional information helping in modifying
and improving the previous geological maps of the study area.
3- This new lithological map in this study (Fig. 5) needs more field
investigations and verifications to construct the detailed geological map
of Um Bogma area.
This study proved the important use of both the colour composite
images constructed from the ETM band ratios, and the SIPT for the
lithological mapping. The use of these techniques produced a more
detailed lithological map for the investigated area, which clarifies the
contacts between the different rock units and illustrates the main
structural lineament trends for each selective rock unit of the study area.
The SIP technique enables us to select and separate in individual
layers the remotely sensed ETM+ data. The extracted structural
lineaments and the radioactivity zones for the interpreted individual
lithologic units have been analyzed as discussed before. This technique
enables us to discriminate, identify and delineate the lithological units
and their structural lineament signature of the investigated area.
Lithologic Discrimination Using Selective Image … 209
The application of image processing technique of FCC image, image
ratios and SIPT proved their important usage for the geological mapping
of Um Bogma environs and yielded a detailed lithological map of the
investigated area.
References
Abd El-Monem, A., El-Aaassy, I.E., Hegab, O., El-Fayomy, I. and El-Agami, N., (1997)
Gibbsite uranium and copper mineralization, Um Bogma area, south western Sinai, Egypt
Sedimentology of Egypt, 5: 117-132.
Abdelaziz, A.S. (2000) Aireborne spectrometric studies and uranium mineralization in Um
Bogma-Altor environs, southwestern Sinai, Egypt, Ph.D. Thesis, Geophysical Department,
Faculty of Science, Ain Shams University, Egypt, 184p.
Afifi, S.Y. (1991) Geochemical investigation of some radioactive Lower Carboniferous
sedimentary rocks of Wadi Nasib area, west central Sinai, Egypt, M. Sc. Thesis, Suez Canal
Univ., Egypt. 253 p.
Afifi, S.Y. (2001) Paragenesis of Mn-Cu-U in Quaternary paleochannels, West Central Sinai,
Egypt. 5th Inter. Conf. On Geochemistry. Alex. Univ. Egypt, 12-13, Sept. 2001, 505-521.
Aita, S.K. (1996) Geological, mineralogical and geochemical studies on some radioactive
anomalies of the Paleozoic sediments of Um Bogma area, West Central Sinai Egypt, M.Sc.
Thesis, Faculty of Science, Cairo University.
Amer, T.E. (1997) Geochemistry and extraction of uranium, copper and manganese from the ore
materials of the uraniferous Paleozoic sedimentary rocks, West Central Sinai, Egypt. Ph.D.
Thesis, Faculty of Science, Cairo University 139 p.
Ammar, F.A., Abdou, N.M.F., and Dewedar A.A. (1999) Mineralogy and Geochemistry of the
Radioactive shale bed of the middle Member of Um Bogma Formation in Allouga
Exploratory Tunnels, West central Sinai, Egypt, 4th intern. Conf. On Geochemistry, Alex.
Univ., Egypt, 15-16 Sept., 1999, Pages 179-198.
Ashami, A.S. (1995) Studies on geology and uranium occurrences of some Paleozoic rocks, Wadi
Allouga area, Sinai, Egypt, M.Sc. Thesis, Faculty of Science, Zagazig University, 156 p.
Ashami, A.S. (2003) Structural and lithologic controls of uranium and copper mineralization in
Um Bogma environs, southwestern Sinai, Egypt, Ph.D. Thesis, Geology Department,
Faculty of Science, Mansoura University, Egypt, 134p.
Bernstein, R. (1978) Digital Image Processing for Remote Sensing, Wiley, New Yourk.
Bishay, A.F. (1994) Geological investigation and physical beneficiations of xenotime sediments
of Um Bogma Area, Sinai, Egypt, M.Sc. Thesis, Faculty of Science, Cairo University 188 p.
Bishta, A.Z. (2004) Lithologic discrimination of Gabal Qattar-Um Disi environs, north Eastern
Desert of Egypt using thematic mapper data of Landsat 7.3rd Intern. Symposium on
Geophysics, Tanta Univ., Egypt, 541-557.
Bishta, A.Z. (2005) Characterization of radioactivity zones using selective image processing
technique, Um Bogma environs westcentral Sinai, Egypt, 4th Intern. Conference on the
Geology of Africa, Assuit Univ., Assuit, Egypt.
Botros, N. (1995) The effect of rift tectonics on the mode of distribution of uranium bearing-
sediments, Um Bogma area, West Central Sinai, Egypt. Ascad. Sci., 45: 193- 204.
Dabbour, G.A. and Mahdy, M.A. (1988) Mineralogical studies on the Carboniferous uraniferous
sediments in west central Sinai, Egypt, 4th Conf. Nucl. Sci. and Appl., Cairo, 1, 230-237.
Adel Zein Bishta 210
Drury, S. (1993) Image Interpretation in Geology, 2nd Ed. Chapman and Hall, London.
El-Aassy, I.E., Botros, N.H, Abdel Razik, A, Sherif, H, Al Moafy, A., Atia, K., El Terb, R.,
and Ashami, A.S. (1986) Report on the Prospection and Proving of Some Radioactive
Occurrences in West Central Sinai, Egypt, Internal Rept., Nuclear Materials Authority
(NMA), Cairo.
El Agami, N. L. (1996) Geology and Radioactivity Studies on the Paleozoic rock units in the
Sinai peninsula, Egypt. Ph.D. Thesis, Fac. of Science, Mansoura Univ., Egypt, 302p.
El Kassas, I.A. (1967) Geologic and Radiometric Prospection of Radioactive Raw Materials in
West Central Sinai, Internal Report, geology and Raw Materials Dept. (AEE), Cairo.
El Rakaiby, M.L. and El-Aassy, I.E. (1989) Structural interpretation of Paleozoic-Mesozoic
rocks, southwestern Sinai, Egypt, Annual, Geol., Surv. Egypt, XVI, 269-273.
El- Sharkawi, M.A., El-Aref, and Abdel Motelib, A. (1990a) Manganese deposits in a
Carboniferous paleokarst profile, Um Bogma region, West Central Sinai, Egypt, Mineralium
Deposita, 25: 343.
EL Shahat, A. and Kora, M. (1988) Composition of dolostones of Um Bogma Formation, Sinai,
Mansoura science Bulletin, 15: 33-58.
Hunt, G.R., (1977) Spectral signatures of particulate minerals in the visible and near-infrared,
Geophysics, 24: 501-513.
Hunt, G.R., (1979) Near-infrared spectra of alteration minerals-potential for use in remote
sensing, Geophysics, 44: 1974-1986.
Hussein, H. A., Abdel Monem, A.A., Mahdy, M. A., El Aassy, I.E. and Dabbour, G. A. (1992)
On the genesis of surficial uranium occurrences in West Central Sinai, Egypt, Ore Geology
Review, 7.
International Atomic Energy IAEA, (1988) Geochemical exploration for uranium. Technical
Reports Series No. 284, Vienna, Austria, 96 p.
Lillesand, T.M. Kiefer, R.W. and Chipman, J.W. (2004) Remote Sensing and Image
Interpretation, 5th Ed., John Wiley and sons Inc. New York, ISBN 0-471-25515-7, 763P.
Moustafa, A.M. (1987) Drap folding in the Baba -Sidri area, eastern side of the Suez rift, Egypt,
J. Geol., 31: 13-24.
Mather, P.M., (1987) Computer Processing of Remotely Sensed Images, an Introduction. Johan
Wiley and Sons, ISBN: 0 – 471 – 9064 –4.
Mansour, M. (1994) sedimentology and radioactivity of Um Bogma Formation, West Central
Sinai, Egypt, M.Sc. Thesis, Faculty of Science, Suez Canal Univ., 157 p.
Morsy, A.M., El-Fawal, F.M., EL-Aassy, I.E. and Mansour, M. Gh. (1995) Sedimentology of
the Um Bogma Formation, west central Sinai, Proc. 4h conf. Geol Sinai Develop, Ismailia,
121-139.
Nigm, A., Khalil, A., Gheith, B., Abdelrehim, R. and Ashami, A. (2001) The role of the electric
and seismic tools in delineating of Um Bogma Formation, Southwestern Sinai, Egypt, Proc.
2nd International Symposium on Geophysics, Tanta, 43-51.
PCI, Using PCI Software (1997) vol. 2 version 6.3, Richmond Hill, Ontario, Canada.
PCI, GeoAnalyst, (1998) version 6.3, Richmond Hill, Ontario, Canada.
PCI, Geomatica-9 (2004) version 9.1, Richmond Hill, Ontario, Canada.
Richards, J.A (1995) Remote Sensing, Digital Image Processing, an Introduction.

Lithologic Discrimination Using Selective Image … 211
Soliman, M.S. (1975) Petrology of Carboniferous dolostone marine transgression over West
Central Sinai, Egypt, 7th Int. Congr. Straits. Geol. Carbnonif., C.R. Krefeld, 4: 53-265.
Springer Verlag, Berlin. P340.
Sultan, M., Arvidson, R.E. and Sturchio, N. (1986) Mapping of serpentinites in the Eastern
Desert of Egypt by using Landsat them,atic mapper data, Geology, 14: 995-999.
Sultan, M., Arvidson, R.E. and Sturchio, N. (1987) Lithologic mapping in arid regions with
Landsat thematic mapperdata: Meatiqdome, Egypt. Geological Socity of America Bulletin,
99: 748-762.
Adel Zein Bishta 212
������� ������ � ���� ����� ������� ����� ������
����� ������ ������� � �� �� �� ����� !– ��� "�#
$����%���
���� ������ �� ���
��� ���� ��� ����� ��������� �������������� ��� ����� ����� �����
������������ �������� ������� ��������
�������. ������� �� �� ��� ��� �� ��� �� ��� � ���
������ ���� ������� ���� !"#������$� %� ����� %����� .
��� ��#� ��� ���&'� (��)�� ����� *�"�� ���& �*��+ � ����$�,� �
������� . �� ���� -�$���/������ (��,�# (�� 0���� �1+ ���
(���" 2 (� �� ��"$��� ��� �� ��� �� �������� (���$��34 �
5��� ��"$����PCI ���$���� .
��)�6�7�� (���)���� ������ �8�"9�� (�� ���� :1+ (�"$���
!���$���SIPT � ����$��� (���,��� !"�� 5)��� (�#� ;�9
�$���- ������� < ����"�� ��� � � (���" 2 (��)�� ��"$���
� �,��� �������� �� (��)�� =�1�� �1�� %���>.
!"�9� 0��� /������ <������ <�$�� �� �� �)��$ (���
�� ���� :1+ ��"$��� ���$�SIPT .� ���"���� 0���?'� (� ��
2 � (�+�� ���$� !"9� 0�� !/��� �������� (���$� . ��� "���
���$���� (�"�9���� ���)� �� (���$�� :1+ %� 0� %� 0������
@� (�1�?�� ���&A# ��������� ��� ������� ��#��?.

Lithologic Discrimination Using Selective Image … 213
@� (�+��2� ( �� ��� ���� ��� ��)� �� (���$,� !")���� ����,&
��� 0��? :���– B�? �� .� (�1�?�� %� "� @� ��� ��#��?
���� ���� ��$���� ��� �� 0��?� �� ����� %��� ��� ���.
Related Documents