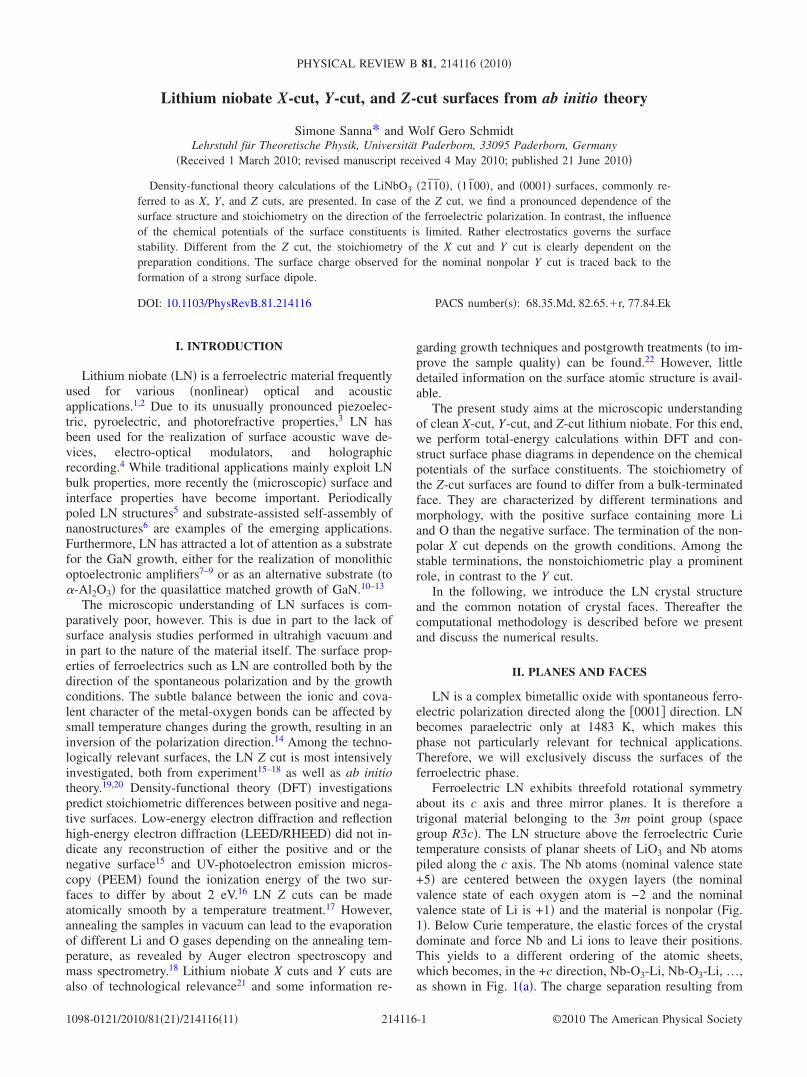
Lithium niobate X-cut, Y-cut, and Z-cut surfaces from ab initio theory Simone Sanna* and Wolf Gero Schmidt Lehrstuhl für Theoretische Physik, Universität Paderborn, 33095 Paderborn, Germany Received 1 March 2010; revised manuscript received 4 May 2010; published 21 June 2010 Density-functional theory calculations of the LiNbO 3 21 ¯ 1 ¯ 0, 11 ¯ 00, and 0001 surfaces, commonly re- ferred to as X, Y , and Z cuts, are presented. In case of the Z cut, we find a pronounced dependence of the surface structure and stoichiometry on the direction of the ferroelectric polarization. In contrast, the influence of the chemical potentials of the surface constituents is limited. Rather electrostatics governs the surface stability. Different from the Z cut, the stoichiometry of the X cut and Y cut is clearly dependent on the preparation conditions. The surface charge observed for the nominal nonpolar Y cut is traced back to the formation of a strong surface dipole. DOI: 10.1103/PhysRevB.81.214116 PACS numbers: 68.35.Md, 82.65.r, 77.84.Ek I. INTRODUCTION Lithium niobate LN is a ferroelectric material frequently used for various nonlinear optical and acoustic applications. 1,2 Due to its unusually pronounced piezoelec- tric, pyroelectric, and photorefractive properties, 3 LN has been used for the realization of surface acoustic wave de- vices, electro-optical modulators, and holographic recording. 4 While traditional applications mainly exploit LN bulk properties, more recently the microscopic surface and interface properties have become important. Periodically poled LN structures 5 and substrate-assisted self-assembly of nanostructures 6 are examples of the emerging applications. Furthermore, LN has attracted a lot of attention as a substrate for the GaN growth, either for the realization of monolithic optoelectronic amplifiers 7–9 or as an alternative substrate to -Al 2 O 3 for the quasilattice matched growth of GaN. 10–13 The microscopic understanding of LN surfaces is com- paratively poor, however. This is due in part to the lack of surface analysis studies performed in ultrahigh vacuum and in part to the nature of the material itself. The surface prop- erties of ferroelectrics such as LN are controlled both by the direction of the spontaneous polarization and by the growth conditions. The subtle balance between the ionic and cova- lent character of the metal-oxygen bonds can be affected by small temperature changes during the growth, resulting in an inversion of the polarization direction. 14 Among the techno- logically relevant surfaces, the LN Z cut is most intensively investigated, both from experiment 15–18 as well as ab initio theory. 19,20 Density-functional theory DFT investigations predict stoichiometric differences between positive and nega- tive surfaces. Low-energy electron diffraction and reflection high-energy electron diffraction LEED/RHEED did not in- dicate any reconstruction of either the positive and or the negative surface 15 and UV-photoelectron emission micros- copy PEEM found the ionization energy of the two sur- faces to differ by about 2 eV. 16 LN Z cuts can be made atomically smooth by a temperature treatment. 17 However, annealing the samples in vacuum can lead to the evaporation of different Li and O gases depending on the annealing tem- perature, as revealed by Auger electron spectroscopy and mass spectrometry. 18 Lithium niobate X cuts and Y cuts are also of technological relevance 21 and some information re- garding growth techniques and postgrowth treatments to im- prove the sample quality can be found. 22 However, little detailed information on the surface atomic structure is avail- able. The present study aims at the microscopic understanding of clean X-cut, Y -cut, and Z-cut lithium niobate. For this end, we perform total-energy calculations within DFT and con- struct surface phase diagrams in dependence on the chemical potentials of the surface constituents. The stoichiometry of the Z-cut surfaces are found to differ from a bulk-terminated face. They are characterized by different terminations and morphology, with the positive surface containing more Li and O than the negative surface. The termination of the non- polar X cut depends on the growth conditions. Among the stable terminations, the nonstoichiometric play a prominent role, in contrast to the Y cut. In the following, we introduce the LN crystal structure and the common notation of crystal faces. Thereafter the computational methodology is described before we present and discuss the numerical results. II. PLANES AND FACES LN is a complex bimetallic oxide with spontaneous ferro- electric polarization directed along the 0001 direction. LN becomes paraelectric only at 1483 K, which makes this phase not particularly relevant for technical applications. Therefore, we will exclusively discuss the surfaces of the ferroelectric phase. Ferroelectric LN exhibits threefold rotational symmetry about its c axis and three mirror planes. It is therefore a trigonal material belonging to the 3m point group space group R3c. The LN structure above the ferroelectric Curie temperature consists of planar sheets of LiO 3 and Nb atoms piled along the c axis. The Nb atoms nominal valence state +5 are centered between the oxygen layers the nominal valence state of each oxygen atom is -2 and the nominal valence state of Li is +1 and the material is nonpolar Fig. 1. Below Curie temperature, the elastic forces of the crystal dominate and force Nb and Li ions to leave their positions. This yields to a different ordering of the atomic sheets, which becomes, in the +c direction, Nb-O 3 -Li, Nb-O 3 -Li, …, as shown in Fig. 1a. The charge separation resulting from PHYSICAL REVIEW B 81, 214116 2010 1098-0121/2010/8121/21411611 ©2010 The American Physical Society 214116-1

Welcome message from author
This document is posted to help you gain knowledge. Please leave a comment to let me know what you think about it! Share it to your friends and learn new things together.
Transcript
Lithium niobate X-cut, Y-cut, and Z-cut surfaces from ab initio theory
Simone Sanna* and Wolf Gero SchmidtLehrstuhl für Theoretische Physik, Universität Paderborn, 33095 Paderborn, Germany
�Received 1 March 2010; revised manuscript received 4 May 2010; published 21 June 2010�
Density-functional theory calculations of the LiNbO3 �21̄1̄0�, �11̄00�, and �0001� surfaces, commonly re-ferred to as X, Y, and Z cuts, are presented. In case of the Z cut, we find a pronounced dependence of thesurface structure and stoichiometry on the direction of the ferroelectric polarization. In contrast, the influenceof the chemical potentials of the surface constituents is limited. Rather electrostatics governs the surfacestability. Different from the Z cut, the stoichiometry of the X cut and Y cut is clearly dependent on thepreparation conditions. The surface charge observed for the nominal nonpolar Y cut is traced back to theformation of a strong surface dipole.
DOI: 10.1103/PhysRevB.81.214116 PACS number�s�: 68.35.Md, 82.65.�r, 77.84.Ek
I. INTRODUCTION
Lithium niobate �LN� is a ferroelectric material frequentlyused for various �nonlinear� optical and acousticapplications.1,2 Due to its unusually pronounced piezoelec-tric, pyroelectric, and photorefractive properties,3 LN hasbeen used for the realization of surface acoustic wave de-vices, electro-optical modulators, and holographicrecording.4 While traditional applications mainly exploit LNbulk properties, more recently the �microscopic� surface andinterface properties have become important. Periodicallypoled LN structures5 and substrate-assisted self-assembly ofnanostructures6 are examples of the emerging applications.Furthermore, LN has attracted a lot of attention as a substratefor the GaN growth, either for the realization of monolithicoptoelectronic amplifiers7–9 or as an alternative substrate �to�-Al2O3� for the quasilattice matched growth of GaN.10–13
The microscopic understanding of LN surfaces is com-paratively poor, however. This is due in part to the lack ofsurface analysis studies performed in ultrahigh vacuum andin part to the nature of the material itself. The surface prop-erties of ferroelectrics such as LN are controlled both by thedirection of the spontaneous polarization and by the growthconditions. The subtle balance between the ionic and cova-lent character of the metal-oxygen bonds can be affected bysmall temperature changes during the growth, resulting in aninversion of the polarization direction.14 Among the techno-logically relevant surfaces, the LN Z cut is most intensivelyinvestigated, both from experiment15–18 as well as ab initiotheory.19,20 Density-functional theory �DFT� investigationspredict stoichiometric differences between positive and nega-tive surfaces. Low-energy electron diffraction and reflectionhigh-energy electron diffraction �LEED/RHEED� did not in-dicate any reconstruction of either the positive and or thenegative surface15 and UV-photoelectron emission micros-copy �PEEM� found the ionization energy of the two sur-faces to differ by about 2 eV.16 LN Z cuts can be madeatomically smooth by a temperature treatment.17 However,annealing the samples in vacuum can lead to the evaporationof different Li and O gases depending on the annealing tem-perature, as revealed by Auger electron spectroscopy andmass spectrometry.18 Lithium niobate X cuts and Y cuts arealso of technological relevance21 and some information re-
garding growth techniques and postgrowth treatments �to im-prove the sample quality� can be found.22 However, littledetailed information on the surface atomic structure is avail-able.
The present study aims at the microscopic understandingof clean X-cut, Y-cut, and Z-cut lithium niobate. For this end,we perform total-energy calculations within DFT and con-struct surface phase diagrams in dependence on the chemicalpotentials of the surface constituents. The stoichiometry ofthe Z-cut surfaces are found to differ from a bulk-terminatedface. They are characterized by different terminations andmorphology, with the positive surface containing more Liand O than the negative surface. The termination of the non-polar X cut depends on the growth conditions. Among thestable terminations, the nonstoichiometric play a prominentrole, in contrast to the Y cut.
In the following, we introduce the LN crystal structureand the common notation of crystal faces. Thereafter thecomputational methodology is described before we presentand discuss the numerical results.
II. PLANES AND FACES
LN is a complex bimetallic oxide with spontaneous ferro-electric polarization directed along the �0001� direction. LNbecomes paraelectric only at 1483 K, which makes thisphase not particularly relevant for technical applications.Therefore, we will exclusively discuss the surfaces of theferroelectric phase.
Ferroelectric LN exhibits threefold rotational symmetryabout its c axis and three mirror planes. It is therefore atrigonal material belonging to the 3m point group �spacegroup R3c�. The LN structure above the ferroelectric Curietemperature consists of planar sheets of LiO3 and Nb atomspiled along the c axis. The Nb atoms �nominal valence state+5� are centered between the oxygen layers �the nominalvalence state of each oxygen atom is −2 and the nominalvalence state of Li is +1� and the material is nonpolar �Fig.1�. Below Curie temperature, the elastic forces of the crystaldominate and force Nb and Li ions to leave their positions.This yields to a different ordering of the atomic sheets,which becomes, in the +c direction, Nb-O3-Li, Nb-O3-Li, …,as shown in Fig. 1�a�. The charge separation resulting from
PHYSICAL REVIEW B 81, 214116 �2010�
1098-0121/2010/81�21�/214116�11� ©2010 The American Physical Society214116-1

this shift makes the material polar �displacement ferroelec-trics�. The spontaneous polarization �0.7 C /m2� is unusuallyhigh4 and directed along the c axis. Cutting the material per-pendicularly to this direction will result in the creation oftwo differently polarized �0001� surfaces with peculiar prop-erties such as macroscopic polarization charge.
Crystals belonging to the trigonal may be represented by arhombohedral or by a hexagonal unit cell, with several pos-sibilities for the choice of the primitive vectors. The cellsused in this work are shown in Fig. 2. The conventionalrhombohedral unit cell contains two formula weights �10 at-oms� while the conventional hexagonal unit cells containssix formula weights �30 atoms�. The coordinate system usedto describe the physical properties of LN is, however, neitherrhombohedral nor hexagonal but a Cartesian x, y, and z sys-tem. In fact, many physical properties and symmetries of the
material are conveniently described in this coordinate sys-tem. The most widely used coordinate systems are the ortho-hexagonal and the pseudocubic rhombohedral systems,which are described in Ref. 23. The presence of differentnotations and the fact that the conventions are not alwaysobeyed generates some confusion. We follow Ref. 3 in thedefinition of the LN X, Y, and Z cuts, which is shortly sum-marized in the following. In Fig. 3, we show the hexagonallattice with the standard basis vectors t1, t2, and t3. Accordingto Ref. 3, the z axis is parallel to the crystal c axis. The x axiscoincides with one of the three equivalent translation vectorsof the conventional hexagonal unit cell. These have, in thereal-space representation, the directions of the three vectors
�100�, �010�, and �1̄1̄0�. Using the conversion formula,
�u,v,w� → �2u − v,− u + 2v,− u − v,3w�
they correspond to the crystallographic directions �21̄1̄0�,�1̄21̄0�, and �1̄1̄20�, as shown in Fig. 3. Once the x axis andthe z axis are determined, the y axis is chosen to be orthogo-nal and right handed. This means that the y axis will have the
direction of the real-space vectors �11̄0�, �120�, and �2̄1̄0�and crystallographic directions �11̄00�, �011̄0�, and �1̄010�,i.e., the y axis lies in a plane of mirror symmetry. Followingthe standard convention, the LN X cut, Y cut and Z cut arethe planes normal to the x, y, and z axes and are character-
ized by the Miller-Bravais indices �21̄1̄0�, �11̄00�, and�0001�, respectively, as shown in Figs. 3 and 4.
The Z cut is perpendicular to the spontaneous polarizationof the material and is therefore a polar plane, with a nominalsurface charge �0
z =0.7 C /m2. The measured surface charge�z is however three order of magnitude smaller,24 indicatingthat charge compensation mechanisms occur at the surface.
The X and Y cuts are nominally nonpolar. The Y cut,however, shows a surface charge �y as big as one third of
(c)(a) (b)
+z
+z
FIG. 1. �Color online� Stacking sequence of the atoms in theferroelectric phase �T�TC� of lithium niobate �a� and �c� and in thehigh-symmetry paraelectric phase �T�TC� �b� of LN. The displace-ment of the cations due to the ferroelectric phase transition and thetwo possible domain directions are indicated.
Pola
riza
tion
Nb
Li
FIG. 2. Conventional rhombohedral unit cell and conventionalhexagonal unit cell of ferroelectric LiNbO3. Li atoms are gray andNb atoms are white. For the sake of clarity, the oxygen atoms areomitted.
t
−−
−−
−−
−
(210)−>[1010]
−−
(010)−>
[1210]
−
(120)−>[0110]
X X
X
Y
2t1
(110)−>[1120]
−−
− −
3t
Y
Y
(100)−>
[2110]
(110) −> [1100]
FIG. 3. �Color online� Relationships between the conventionalhexagonal coordinate system and the Cartesian coordinate systemused in this work �real-space representation�. X and Y label the xdirection and y direction, t1, t2, and t3 are the translational basisvectors of the hexagonal lattice. In round brackets the �real-space�vectors expressed in terms of the basis t1, t2, and t3, and in squarebrackets the corresponding Miller-Bravais indices indicating thecrystallographic directions.
SIMONE SANNA AND WOLF GERO SCHMIDT PHYSICAL REVIEW B 81, 214116 �2010�
214116-2

�z.25 Furthermore, �y changes upon compression in the ydirection �piezoelectricity�. This is not the case for the X cutbecause the x axis is perpendicular to a mirror plane and anycharge movement on one side of the plane is mirrored on theopposite site.
III. METHODOLOGY
Our first-principles calculations within the DFT use theall-electron projector-augmented wave method26 as imple-mented in VASP.27 The PW91 formulation of the generalizedgradient approximation �GGA� exchange-correlationfunctional,28 plane-wave expansions up to 400 eV, and pro-jectors up to l=3 for Nb and l=2 for Li and O have beenused for the calculations. This approach yields reliable struc-tures and energies for bulk LN in the ferroelectric andparaelectric phase.29 As there is no experimental evidence ofLN surfaces with net spin moment, we restrict ourself tospin-unpolarized calculations. The dipole corrections de-scribed in Refs. 30 and 31 have been used to correct thespurious interactions due to the slab periodic images.
A. Computational
The slabs for the simulation of �0001� surfaces are hex-agonal supercells based on the hexagonal unit cell shown inFig. 2 consisting of 12 Nb-O3-Li trilayers �60 atoms� plus asurface termination and a vacuum layer of �15 Å. The outerthree trilayers �i.e., nine LN layers� and all the terminationatoms are allowed to relax freely �force threshold0.02 eV /Å� while the remaining layers are kept fixed to
simulate the bulk of the material. As no other surface peri-odicity than the 1�1 has been observed for both the positiveand the negative Z cuts,15 we do not consider surface recon-structions.
Neither the hexagonal nor the rhombohedral unit cellshown in Fig. 2 is appropriate for the simulation of the LN Xcut and Y cut, as none of the cell faces is parallel to the LNcut. For this reason, we define a different unit cell, with allthe axes orthogonal and of different length. The new unit cellhas the same height of the hexagonal unit cell but twice itsvolume. The cell contains 12 formula weights �60 atoms� andis depicted in Fig. 5. Based on this unit cell, the slabs for thesimulation of the X cut and of the Y cut are set up.
For the simulation of the X cut, we double the orthogonalunit cell along the x direction, so that the slab consists of astacking in the x direction of four Li6Nb6-O9-O9 trilayers�120 atoms� plus a surface termination and �15 Å ofvacuum. The atomic positions of the first nine layers havebeen fixed at bulk values. The outer three layers and all ofthe terminating atoms in the slab unit cell are allowed torelax freely.
For the simulation of the Y cut, we double the new unitcell along the y direction so the slab consists of 12 Li2Nb2O6layers �120 atoms� plus a surface termination and �18 Å ofvacuum. The last four Li2Nb2O6 layers and all the termina-tions atoms are allowed to relax while the rest is frozen at thebulk positions. A Monkhorst-Pack32 k-point mesh was usedto carry out the integration in the Brillouin zone for the simu-lation of the X cut, Y cut, and Z cut. In order to reflect thegeometry of the supercell, our meshes consist of a single kpoint in the direction perpendicular to the surface and 2�2 kpoints in the remaining directions. The convergence of thek-point mesh has been tested with respect to total-energy
[1100]
z−C
ut
[2110]
−
[0001]
Y−C
ut
X−Cut
−−
FIG. 4. �Color online� Real-space representation of the x axis, yaxis, z axis and of the X cut and Y cut as defined and used in thiswork.
Li
O
Nb
[0001] [1100]
[2110]−−
−
[1120]
−−
FIG. 5. �Color online� Top view of the two supercells used tomodel the LN slabs. The orthogonal supercell is in the middle of thepicture and the hexagonal supercell on the lower right corner.
LITHIUM NIOBATE X-CUT, Y-CUT, AND Z-CUT… PHYSICAL REVIEW B 81, 214116 �2010�
214116-3
differences, band structure, atomic forces, and ionization en-ergy.
B. Surface energetics
To compare energetically LN surfaces with different sto-ichiometry, we follow Refs. 33–35 and use the grand �orLandau� potential �, approximated as
���Li,�Nb,�O� � EDFT�NLi,NNb,NO� − �i
Li,Nb,O
�iNi. �1�
Here EDFT�NLi ,NNb,NO� is the total energy calculated withinDFT for the respective slab containing NLi Li atoms, NNb Nbatoms, and NO O atoms and �Li, �Nb, and �O are the chemi-cal potentials of Li, Nb, and O determined by the experimen-tal conditions. Equation �1� is not an equality and holds onlyin approximate form, as the surface free energy �Fs=Us−TSs with Us being the internal energy� should be usedrather than the DFT total energy. However, it must be con-sidered that �1� the direct influence of the pressure variationon the surface energy can be neglected, �2� the contributionof the surface formation entropy Ss to the surface energy at acertain temperature is similar for the different surfaces wewant to compare, and �3� a wide compensation of the lattice-dynamical contributions to Fs is expected. Consequently, thefree energy can nearly be replaced by the total energy E.Furthermore, as one expects a compensation of the effects ofthe zero-point vibrations on the total energy and on thechemical potentials, the total energy E is usually replaced bythe DFT total energy EDFT in explicit calculations.35
For convenience, we use in the following the chemical-potential variations:
�Li = �Li − �Libulk,
�Nb = �Nb − �Nbbulk,
�O = �O −1
2�O2
gas �2�
as variables, the thermodynamically allowed range of whichis restricted by several conditions, see also Ref. 36.
From the definition of the LN heat of formation, it follows
HfLN = �LN − �Li − �Nb − 3�O. �3�
Given that upper limits are given by the respective bulkphases, the variables are bound within
HfLN �i 0 i = Li,Nb,O. �4�
Thus, the variation in each �i is constrained in a range givenby Hf
LN below its bulk value. The i-rich preparation condi-tions are given by �i=0.
Equation �1� can be simplified considering that only twoof three chemical potentials are linearly independent,
�Li + �Nb + 3�O = �LNbulk.
We express �Nb as a function of �Li and �O since the lattercan be better controlled experimentally. Furthermore, with
this choice our results are directly comparable with earliercalculations for the Z cut.19 It follows
���Li,�O� = E�NLi,NNb,NO� − �Li�NLi − NNb�
− �O�NO − 3NNb� − �Libulk�NLi − NNb�
−1
2�O2
gas�NO − 3NNb� − NNb�LNbulk. �5�
The values of the bulk chemical potentials are approxi-mated by the total energy per atom calculated within DFT.The total energies of bulk Li and Nb, oxygen gas, Li2O,Nb2O5, and LiNbO3 have been calculated with the approachdescribed in Sec. III A, using in each case their primitivecells and minimizing the respective lattice constants. The gasphase of oxygen has been calculated with an oxygen dimerin a vacuum box of sides 10 Å. No correction for the knownGGA overbinding problem is considered,37 as it would notqualitatively change any of the conclusions of this work.Metallic Li and metallic Nb both crystallize at high tempera-tures �i.e., above room temperature� in the body-centered-
cubic structure �space group Im3̄m�.38 Lithium oxide �LO�has, like many oxides of univalent ions the antifluorite ar-
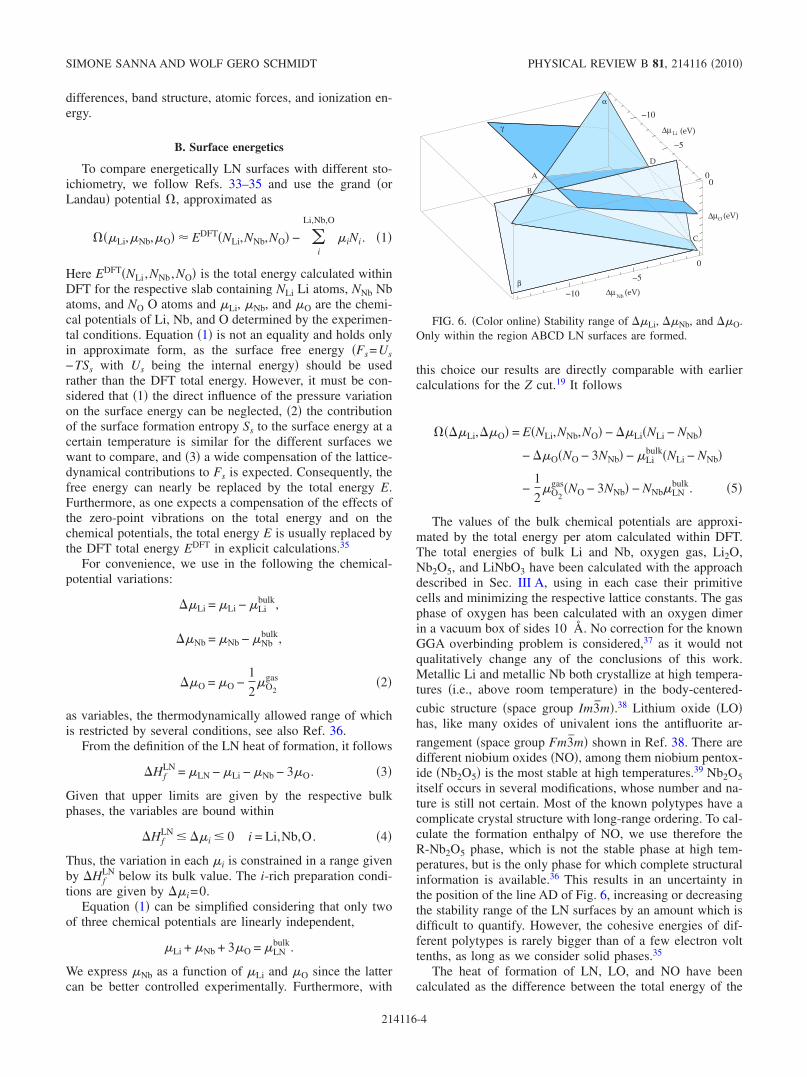
rangement �space group Fm3̄m� shown in Ref. 38. There aredifferent niobium oxides �NO�, among them niobium pentox-ide �Nb2O5� is the most stable at high temperatures.39 Nb2O5itself occurs in several modifications, whose number and na-ture is still not certain. Most of the known polytypes have acomplicate crystal structure with long-range ordering. To cal-culate the formation enthalpy of NO, we use therefore theR-Nb2O5 phase, which is not the stable phase at high tem-peratures, but is the only phase for which complete structuralinformation is available.36 This results in an uncertainty inthe position of the line AD of Fig. 6, increasing or decreasingthe stability range of the LN surfaces by an amount which isdifficult to quantify. However, the cohesive energies of dif-ferent polytypes is rarely bigger than of a few electron volttenths, as long as we consider solid phases.35
The heat of formation of LN, LO, and NO have beencalculated as the difference between the total energy of the
−10 Nb(eV)
∆µ Li (eV)
∆µO (eV)
0
∆µ
α
β
γ
A
B
C
D
00
−5
−10
−5
FIG. 6. �Color online� Stability range of �Li, �Nb, and �O.Only within the region ABCD LN surfaces are formed.
SIMONE SANNA AND WOLF GERO SCHMIDT PHYSICAL REVIEW B 81, 214116 �2010�
214116-4

compounds and the composition-weighted sum of their con-stituents,
HfAB = EAB
bulk − EAbulk − EB
bulk. �6�
The DFT-GGA calculations tend to overestimate the experi-mental value. However, even for the largest deviation fromexperiment �in the case of LN�, the overestimation is onlyabout 3%, in agreement with earlier calculations.36 Our re-sults are compiled in Table I and compared with literaturedata. We observe a general agreement with previous calcula-tions, a part from a noticeable difference in the NO totalenergy, which might be due to different computational pa-rameters. If the surface is in equilibrium with the bulk sub-strate, Li, Nb, and O atoms can be exchanged with the bulk.The equilibrium condition,
HfLN = �Li + �Nb + 3�O �7�
represents a plane in a three-dimensional space �denoted as �in Fig. 6� whose axes represent the chemical-potential varia-tions in Li, Nb, and O. Only within this plane, LN surfacesare thermodynamically stable. However, further constraintshave to be considered. Stability against the formation of LOand NO requires
2�Li + �O HfLO �8�
and
2�Nb + 5�O HfNO. �9�
These conditions are represented by the planes � and � inFig. 6. The regions above the planes � and � representgrowth conditions at which the oxides are formed. Beyondthese values new bulk phases �either Li and Nb oxides or thebulk phases of Li, Nb, and O� will start to precipitate on theLN surfaces. Only within the region ABCD in Fig. 6 LNsurfaces are stable. This region will be indicated in the phasediagrams discussed below.
IV. RESULTS
A. Z Cut
Even if the LN Z cut is the most relevant surfaces forapplications, only few experimental studies of the LN �0001�surface structure are available.15,18,42,43 Besides the 1�1 sur-face periodicity revealed by LEED/RHEED investigations,15
we know from mass-spectrometric investigations that uponannealing in vacuum at different temperatures differentevaporation regimes are observed. In particular, the evapora-tion of LiO from the positive surface is one order of magni-tude larger than from the negative surface and the evapora-tion of Li and O2 gases from the negative surface is almostnegligible.18 This was attributed to a reduction process whichequilibrates the oxygen concentration between the crystaland the environment thereby removing oxygen from the bulkto replace the desorbed species from the surface. Annealingis often done in order to clean the surface from adsorbedambient species and obtain an atomically flat surface as re-quired in many applications.17 The evaporation of differentspecies at different temperature explains why in some experi-ment the LN surface appears to be predominantly oxygenterminated15 while in other, it seems to be terminated with anNb atomic layer.44
We investigate the relative stability of different surfacestructure candidates, represented by stoichiometric and non-stoichiometric surface terminations with different morphol-ogy. The different terminations have been chosen followingthe approach described in Ref. 19. We consider -Nb-Ox-Liyas positive termination and -Lij-Oi as negative surface termi-nation, whereby x=1,2 ,3 ,4, y=0,1 ,2, i=0,1 ,2 ,3, and j=0,1. All the possible combinations in different starting ge-ometries of each termination have been investigated, result-ing in the simulation of more than 80 different slabs. In thisway all the possible bulk cuts as well as nonstoichiometricsurfaces are modeled.
Evaluating the formation energy of the candidate termina-tions �given in the grand potential by Eq. �5�� at each pointP��O,�Li�, we are able to draw the phase diagrams of thepositive and negative LN �0001� surfaces shown in Fig. 7.The differently polarized surfaces differ clearly in their sto-ichiometry, showing that the intrinsic polarization plays animportant role in the surface stabilization. In general, theterminations of the positive surface contain more oxygenthan those of the negative surface under the same conditions.Within the thermodynamically allowed range �indicated inthe plot�, the stable termination for the positive surface is-Nb-O3-Li2 while for the negative surface, the O-Li termina-tion is favored under most condition. Under O-rich condi-tions, the surface can become O2 or O3 terminated. This is infairly good agreement with Ref. 19. All the occurring termi-nations are nonstoichiometric, i.e., LN polar surfaces varytheir stoichiometry to reduce the surface energy. Ion scatter-ing spectroscopy �ISS� measurements have shown recentlythat both the positive and the negatively poled surfaces arepredominantly oxygen terminated.15 Considering that ISS islargely insensitive to Li because of its low atomic numberand mass, our results confirm the experimental observations.
The relaxed atomic structure of the preferred terminationsfor the positive and negative surface is shown in Fig. 8.
TABLE I. Total energy per formula unit and heat of formationof relevant compounds �in eV�. Besides the calculated values �a�,the measured values �Exp.� and the results of earlier calculations�Ref. 36� �b� are reported for comparison.
System Theory �a� Theory �b� Exp.
LiNbO3 −39.814 −39.552
Li2O −14.436 −14.461
Nb2O5 −62.434 −60.319
Li −1.893 −1.895
Nb −10.064 −10.049
O2 −4.411 −4.392
Hf�LiNbO3� −14.624 −14.433 −14.149a
Hf�Li2O� −6.239 −6.280 −6.230b
Hf�Nb2O5� −20.251 −18.262 −19.775b
aReference 40.bReference 41.
LITHIUM NIOBATE X-CUT, Y-CUT, AND Z-CUT… PHYSICAL REVIEW B 81, 214116 �2010�
214116-5
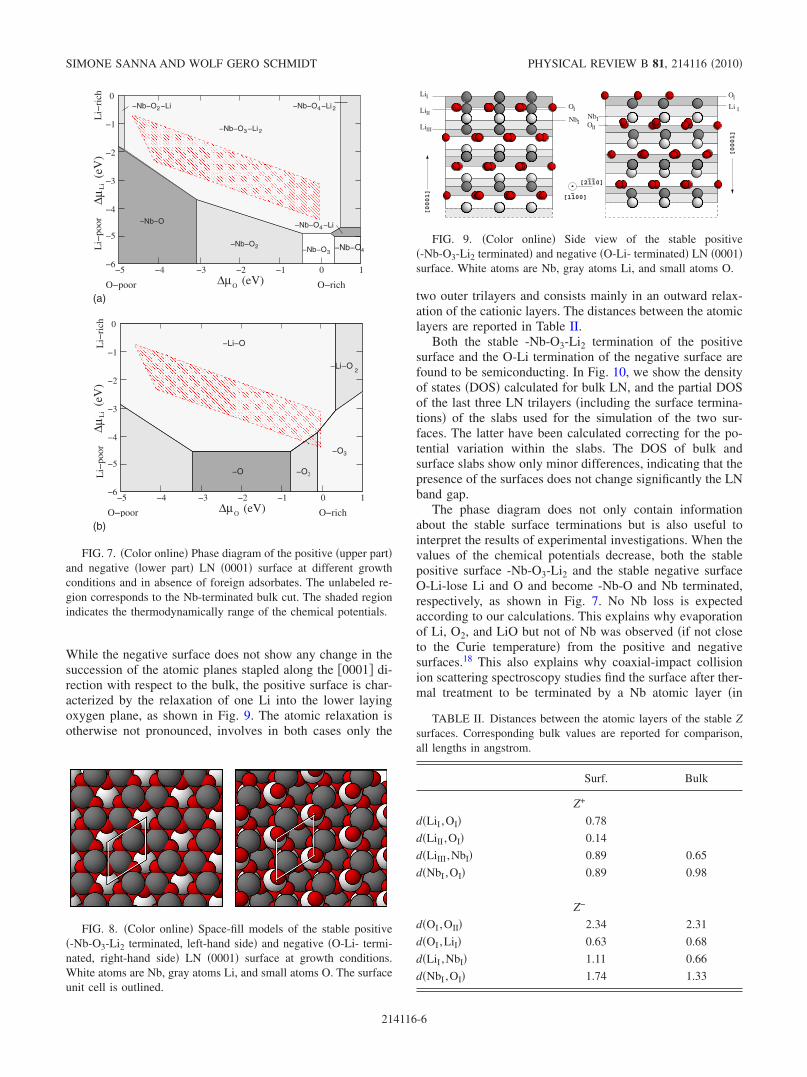
While the negative surface does not show any change in thesuccession of the atomic planes stapled along the �0001� di-rection with respect to the bulk, the positive surface is char-acterized by the relaxation of one Li into the lower layingoxygen plane, as shown in Fig. 9. The atomic relaxation isotherwise not pronounced, involves in both cases only the
two outer trilayers and consists mainly in an outward relax-ation of the cationic layers. The distances between the atomiclayers are reported in Table II.
Both the stable -Nb-O3-Li2 termination of the positivesurface and the O-Li termination of the negative surface arefound to be semiconducting. In Fig. 10, we show the densityof states �DOS� calculated for bulk LN, and the partial DOSof the last three LN trilayers �including the surface termina-tions� of the slabs used for the simulation of the two sur-faces. The latter have been calculated correcting for the po-tential variation within the slabs. The DOS of bulk andsurface slabs show only minor differences, indicating that thepresence of the surfaces does not change significantly the LNband gap.
The phase diagram does not only contain informationabout the stable surface terminations but is also useful tointerpret the results of experimental investigations. When thevalues of the chemical potentials decrease, both the stablepositive surface -Nb-O3-Li2 and the stable negative surfaceO-Li-lose Li and O and become -Nb-O and Nb terminated,respectively, as shown in Fig. 7. No Nb loss is expectedaccording to our calculations. This explains why evaporationof Li, O2, and LiO but not of Nb was observed �if not closeto the Curie temperature� from the positive and negativesurfaces.18 This also explains why coaxial-impact collisionion scattering spectroscopy studies find the surface after ther-mal treatment to be terminated by a Nb atomic layer �in
3
Li−
poor
O (eV)
∆µL
i(e
V)
24
2
−2
−3
−6
−5
−4
O−richO−poor
Li−
rich
∆µ
� � � � � � � � � � � � � � � � � � � � � � � � � � � � � � �
� � � � � � � � � � � � � � � � � � � � � � � � � � � � � � �
� � � � � � � � � � � � � � � � � � � � � � � � � � � � � � �
� � � � � � � � � � � � � � � � � � � � � � � � � � � � � � �
� � � � � � � � � � � � � � � � � � � � � � � � � � � � � � �
� � � � � � � � � � � � � � � � � � � � � � � � � � � � � � �
� � � � � � � � � � � � � � � � � � � � � � � � � � � � � � �
� � � � � � � � � � � � � � � � � � � � � � � � � � � � � � �
� � � � � � � � � � � � � � � � � � � � � � � � � � � � � � �
� � � � � � � � � � � � � � � � � � � � � � � � � � � � � � �
� � � � � � � � � � � � � � � � � � � � � � � � � � � � � � �
� � � � � � � � � � � � � � � � � � � � � � � � � � � � � � �
� � � � � � � � � � � � � � � � � � � � � � � � � � � � � � �
� � � � � � � � � � � � � � � � � � � � � � � � � � � � � � �
� � � � � � � � � � � � � � � � � � � � � � � � � � � � � � �
� � � � � � � � � � � � � � � � � � � � � � � � � � � � � � �
� � � � � � � � � � � � � � � � � � � � � � � � � � � � � � �
� � � � � � � � � � � � � � � � � � � � � � � � � � � � � � �
� � � � � � � � � � � � � � � � � � � � � � � � � � � � � � �
� � � � � � � � � � � � � � � � � � � � � � � � � � � � � � �
� � � � � � � � � � � � � � � � � � � � � � � � � � � � � � �
� � � � � � � � � � � � � � � � � � � � � � � � � � � � � � �
� � � � � � � � � � � � � � � � � � � � � � � � � � � � � � �
−5 −4 −3 −2 −1 1
−Nb−O
−Nb−O −Li
−Nb−O
2
432
4
0
−Nb−O −Li
−Nb−O −Li
−Nb−O −Li
−Nb−O
−Nb−O
−1
0
� � � � � � � � � � � � � � � � � � � � � � � � � � � � � � �
� � � � � � � � � � � � � � � � � � � � � � � � � � � � � � �
� � � � � � � � � � � � � � � � � � � � � � � � � � � � � � �
� � � � � � � � � � � � � � � � � � � � � � � � � � � � � � �
� � � � � � � � � � � � � � � � � � � � � � � � � � � � � � �
� � � � � � � � � � � � � � � � � � � � � � � � � � � � � � �
� � � � � � � � � � � � � � � � � � � � � � � � � � � � � � �
� � � � � � � � � � � � � � � � � � � � � � � � � � � � � � �
� � � � � � � � � � � � � � � � � � � � � � � � � � � � � � �
� � � � � � � � � � � � � � � � � � � � � � � � � � � � � � �
� � � � � � � � � � � � � � � � � � � � � � � � � � � � � � �
� � � � � � � � � � � � � � � � � � � � � � � � � � � � � � �
� � � � � � � � � � � � � � � � � � � � � � � � � � � � � � �
� � � � � � � � � � � � � � � � � � � � � � � � � � � � � � �
� � � � � � � � � � � � � � � � � � � � � � � � � � � � � � �
� � � � � � � � � � � � � � � � � � � � � � � � � � � � � � �
� � � � � � � � � � � � � � � � � � � � � � � � � � � � � � �
� � � � � � � � � � � � � � � � � � � � � � � � � � � � � � �
� � � � � � � � � � � � � � � � � � � � � � � � � � � � � � �
� � � � � � � � � � � � � � � � � � � � � � � � � � � � � � �
� � � � � � � � � � � � � � � � � � � � � � � � � � � � � � �
� � � � � � � � � � � � � � � � � � � � � � � � � � � � � � �
� � � � � � � � � � � � � � � � � � � � � � � � � � � � � � �
Li−
poor
O (eV)
∆µL
i(e
V)
O−poor O−rich
Li−
rich
∆µ−5 −4 −3 −2 −1
−Li−O
2
3
2−O
−Li−O
−O
−O
0
−2
−3
−6
−5
−4
1
−1
0
(b)
(a)
FIG. 7. �Color online� Phase diagram of the positive �upper part�and negative �lower part� LN �0001� surface at different growthconditions and in absence of foreign adsorbates. The unlabeled re-gion corresponds to the Nb-terminated bulk cut. The shaded regionindicates the thermodynamically range of the chemical potentials.
FIG. 8. �Color online� Space-fill models of the stable positive�-Nb-O3-Li2 terminated, left-hand side� and negative �O-Li- termi-nated, right-hand side� LN �0001� surface at growth conditions.White atoms are Nb, gray atoms Li, and small atoms O. The surfaceunit cell is outlined.
OI
LiIII
LiIINbI
OI I
[0001]
[0001] −
[1100]
LiI
Li
[2110]−−
II
INbO
FIG. 9. �Color online� Side view of the stable positive�-Nb-O3-Li2 terminated� and negative �O-Li- terminated� LN �0001�surface. White atoms are Nb, gray atoms Li, and small atoms O.
TABLE II. Distances between the atomic layers of the stable Zsurfaces. Corresponding bulk values are reported for comparison,all lengths in angstrom.
Surf. Bulk
Z+
d�LiI ,OI� 0.78
d�LiII ,OI� 0.14
d�LiIII ,NbI� 0.89 0.65
d�NbI ,OI� 0.89 0.98
Z−
d�OI,OII� 2.34 2.31
d�OI,LiI� 0.63 0.68
d�LiI ,NbI� 1.11 0.66
d�NbI ,OI� 1.74 1.33
SIMONE SANNA AND WOLF GERO SCHMIDT PHYSICAL REVIEW B 81, 214116 �2010�
214116-6
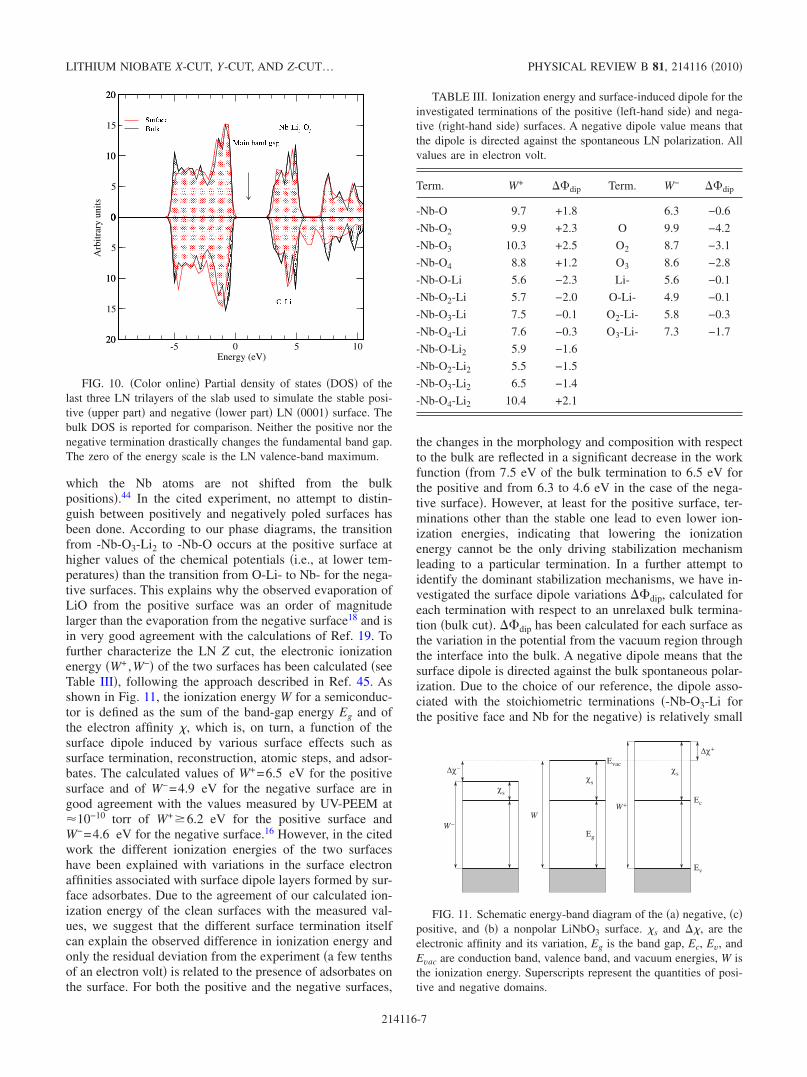
which the Nb atoms are not shifted from the bulkpositions�.44 In the cited experiment, no attempt to distin-guish between positively and negatively poled surfaces hasbeen done. According to our phase diagrams, the transitionfrom -Nb-O3-Li2 to -Nb-O occurs at the positive surface athigher values of the chemical potentials �i.e., at lower tem-peratures� than the transition from O-Li- to Nb- for the nega-tive surfaces. This explains why the observed evaporation ofLiO from the positive surface was an order of magnitudelarger than the evaporation from the negative surface18 and isin very good agreement with the calculations of Ref. 19. Tofurther characterize the LN Z cut, the electronic ionizationenergy �W+ ,W−� of the two surfaces has been calculated �seeTable III�, following the approach described in Ref. 45. Asshown in Fig. 11, the ionization energy W for a semiconduc-tor is defined as the sum of the band-gap energy Eg and ofthe electron affinity , which is, on turn, a function of thesurface dipole induced by various surface effects such assurface termination, reconstruction, atomic steps, and adsor-bates. The calculated values of W+=6.5 eV for the positivesurface and of W−=4.9 eV for the negative surface are ingood agreement with the values measured by UV-PEEM at�10−10 torr of W+�6.2 eV for the positive surface andW−=4.6 eV for the negative surface.16 However, in the citedwork the different ionization energies of the two surfaceshave been explained with variations in the surface electronaffinities associated with surface dipole layers formed by sur-face adsorbates. Due to the agreement of our calculated ion-ization energy of the clean surfaces with the measured val-ues, we suggest that the different surface termination itselfcan explain the observed difference in ionization energy andonly the residual deviation from the experiment �a few tenthsof an electron volt� is related to the presence of adsorbates onthe surface. For both the positive and the negative surfaces,
the changes in the morphology and composition with respectto the bulk are reflected in a significant decrease in the workfunction �from 7.5 eV of the bulk termination to 6.5 eV forthe positive and from 6.3 to 4.6 eV in the case of the nega-tive surface�. However, at least for the positive surface, ter-minations other than the stable one lead to even lower ion-ization energies, indicating that lowering the ionizationenergy cannot be the only driving stabilization mechanismleading to a particular termination. In a further attempt toidentify the dominant stabilization mechanisms, we have in-vestigated the surface dipole variations �dip, calculated foreach termination with respect to an unrelaxed bulk termina-tion �bulk cut�. �dip has been calculated for each surface asthe variation in the potential from the vacuum region throughthe interface into the bulk. A negative dipole means that thesurface dipole is directed against the bulk spontaneous polar-ization. Due to the choice of our reference, the dipole asso-ciated with the stoichiometric terminations �-Nb-O3-Li forthe positive face and Nb for the negative� is relatively small
FIG. 10. �Color online� Partial density of states �DOS� of thelast three LN trilayers of the slab used to simulate the stable posi-tive �upper part� and negative �lower part� LN �0001� surface. Thebulk DOS is reported for comparison. Neither the positive nor thenegative termination drastically changes the fundamental band gap.The zero of the energy scale is the LN valence-band maximum.
TABLE III. Ionization energy and surface-induced dipole for theinvestigated terminations of the positive �left-hand side� and nega-tive �right-hand side� surfaces. A negative dipole value means thatthe dipole is directed against the spontaneous LN polarization. Allvalues are in electron volt.
Term. W+ �dip Term. W− �dip
-Nb-O 9.7 +1.8 6.3 −0.6
-Nb-O2 9.9 +2.3 O 9.9 −4.2
-Nb-O3 10.3 +2.5 O2 8.7 −3.1
-Nb-O4 8.8 +1.2 O3 8.6 −2.8
-Nb-O-Li 5.6 −2.3 Li- 5.6 −0.1
-Nb-O2-Li 5.7 −2.0 O-Li- 4.9 −0.1
-Nb-O3-Li 7.5 −0.1 O2-Li- 5.8 −0.3
-Nb-O4-Li 7.6 −0.3 O3-Li- 7.3 −1.7
-Nb-O-Li2 5.9 −1.6
-Nb-O2-Li2 5.5 −1.5
-Nb-O3-Li2 6.5 −1.4
-Nb-O4-Li2 10.4 +2.1
Eg
W−W
Ev
Ec
χs
W+
∆χ+
∆χ−Evac
χsχs
FIG. 11. Schematic energy-band diagram of the �a� negative, �c�positive, and �b� a nonpolar LiNbO3 surface. s and , are theelectronic affinity and its variation, Eg is the band gap, Ec, Ev, andEvac are conduction band, valence band, and vacuum energies, W isthe ionization energy. Superscripts represent the quantities of posi-tive and negative domains.
LITHIUM NIOBATE X-CUT, Y-CUT, AND Z-CUT… PHYSICAL REVIEW B 81, 214116 �2010�
214116-7

and is due only to the relaxation of the geometry. As onewould expect, the stable terminations �-Nb-O3-Li2 for thepositive face and O-Li- for the negative� introduce a surfacedipole directed against the spontaneous polarization, thus re-ducing the total polarization. In this way, the surface chargeis reduced and the surface stabilized. However, again otherterminations would be even more effective in reducing thepolarization surface charge by introducing a surface dipoleagainst the spontaneous polarization so that we have to con-clude that the preferred surface is not determined by only onedominant relaxation mechanism but rather by the interplay ofmany of them. Levchenko and Rappe explain the stability ofthe preferred positive and negative terminations by passiva-tion of the surface charges by ions.19
B. X cut
Along the x direction, LN can be thought of as a succes-sion of Li6Nb6-O9-O9 trilayers. In contrast to the z direction,the x direction is neither polar nor piezoelectric. As the crys-tal x axis is perpendicular to a crystal mirror plane, anycharge displacement due to a compression along the x axis ismirrored on the other side of the plane and does not givesrise to piezoelectric effects. While reconstructions on the LNZ cut have been excluded by RHEED/LEED,15 we are notaware of corresponding information for the X cut and Y cut.Still, our computational investigations are restricted to 1�1 surface unit cells. To model the stoichiometric and non-
stoichiometric terminations perpendicular to the �21̄1̄0� di-rection, we consider as surface layer -Li6Nb6-O3i, with i=1, . . . ,6 and -Li3x and -Nb3y, with x=0, . . . ,4, y=0, . . . ,4,as reported in Table IV. Each stoichiometry is then investi-gated within different starting geometries. We want to re-mark that our choice of candidate surface terminations doesnot include all the possible surface stoichiometries but is
rather a sampling which allows to scan different configura-tions. Nevertheless, we think that the main conclusions ofour simulation, such as the chemical trends and the surfacemorphology, will not be affected by other possible stableterminations entering the phase diagram. The resulting phasediagram is shown in Fig. 12. The -Li12 termination is thedominant one and is formed under most growth conditions.However, other stable terminations such as -Li6Nb6-O9 and�for very O-rich conditions� -Li9 can be formed. The stablesurface terminations are shown in Fig. 13. The -Li12 termi-nation is characterized by the relaxation of an -O3 layerabove the -Li12 layer and otherwise a minor ionic relaxation�see Fig. 13 and Table V�. The dominance of the -Li12 struc-ture confirms that the stability of nonstoichiometric termina-tions is a general phenomenon of transition-metal-oxidesurfaces.46 Just like in the case of other corundum structuredoxides �M2O3�, which have a structure that closely resembles
TABLE IV. Ionization energy and surface-induced dipole for theinvestigated terminations of the LN X cut �left-hand side� and Y cut�right-hand side�. All values are in electron volt.
Term WX �dip Term WY �dip
-Li3 7.5 −0.5 -Li 6.6 0.7
-Li6 6.5 −0.7 -LiNb 5.8 0.0
-Li9 6.4 −0.7 -LiNb2 6.0 0.1
-Li12 6.6 −0.5 -Li2 5.7 −0.1
-Li6Nb6 6.3 −0.9 -Li2Nb 5.8 0.0
-Nb3 7.5 0.4 -Li2Nb2 6.2 0.4
-Nb6 6.7 −0.6 -Nb 6.4 0.6
-Nb9 6.9 −0.4 -Nb2 6.1 0.3
-Nb12 7.5 0.3 -O1 7.5 1.6
-O3 6.2 −1.2 -O2 7.4 1.5
-O6 6.2 −1.0 -O3 7.8 1.9
-O9 7.7 0.5 -O4 7.7 2.0
-O12 8.5 1.4 -O5 6.8 1.0
-O15 8.6 1.5 -O6 6.8 1.0
-O18 8.2 0.9 -Li2Nb2O6 7.9 2.0
−Li Nb − O6 6
−Li Nb − O6 6
−Li9
−Li3
−Li Nb − O6 6
−2
O (eV)
∆µL
i(e
V)
−Nb
−6
−5
−4
−Nb
−Li
12
12
O−poor O−rich
Li−
poor
Li−
rich
−5 −4 −3∆µ
−1 1
0
−2
−3
9
18
6
6
−1
0
� � � � � � � � � � � � � � � � � � � � � � � � � � � � � � �
� � � � � � � � � � � � � � � � � � � � � � � � � � � � � � �
� � � � � � � � � � � � � � � � � � � � � � � � � � � � � � �
� � � � � � � � � � � � � � � � � � � � � � � � � � � � � � �
� � � � � � � � � � � � � � � � � � � � � � � � � � � � � � �
� � � � � � � � � � � � � � � � � � � � � � � � � � � � � � �
� � � � � � � � � � � � � � � � � � � � � � � � � � � � � � �
� � � � � � � � � � � � � � � � � � � � � � � � � � � � � � �
� � � � � � � � � � � � � � � � � � � � � � � � � � � � � � �
� � � � � � � � � � � � � � � � � � � � � � � � � � � � � � �
� � � � � � � � � � � � � � � � � � � � � � � � � � � � � � �
� � � � � � � � � � � � � � � � � � � � � � � � � � � � � � �
� � � � � � � � � � � � � � � � � � � � � � � � � � � � � � �
� � � � � � � � � � � � � � � � � � � � � � � � � � � � � � �
� � � � � � � � � � � � � � � � � � � � � � � � � � � � � � �
� � � � � � � � � � � � � � � � � � � � � � � � � � � � � � �
� � � � � � � � � � � � � � � � � � � � � � � � � � � � � � �
� � � � � � � � � � � � � � � � � � � � � � � � � � � � � � �
� � � � � � � � � � � � � � � � � � � � � � � � � � � � � � �
� � � � � � � � � � � � � � � � � � � � � � � � � � � � � � �
� � � � � � � � � � � � � � � � � � � � � � � � � � � � � � �
� � � � � � � � � � � � � � � � � � � � � � � � � � � � � � �
� � � � � � � � � � � � � � � � � � � � � � � � � � � � � � �
� � � � � � � � � � � � � � � � � � � � � � � � � � � � � � �
FIG. 12. �Color online� Phase diagram of the LN X cut at dif-ferent growth conditions and in absence of foreign adsorbates. Theshaded region indicates the thermodynamically range of the chemi-cal potentials.
I
(a)
(b)
OII
O
OIII
OI
BLKI
OIII
OII
BLKII
ILi
BLK
−[0001] [1100]
FIG. 13. �Color online� Side view of the dominant �a� -Li12 and�b� -Li6Nb6-O9 terminations of the LN X face. White atoms are Nb,gray atoms Li, and small atoms O.
SIMONE SANNA AND WOLF GERO SCHMIDT PHYSICAL REVIEW B 81, 214116 �2010�
214116-8

LN with both cationic sites occupied by the same atom type,the metallic termination is the most stable one, as long as noH is present in the environment in contact with the surface.46
It is known that for the cited oxides, the stable terminationsis the one which minimizes the surface work function andthe surface dipole moment. For the LN X cut, there is not onesingle termination with both the smallest work function andsurface dipole. However, -Li12 is among the terminationswith the lowest electronic ionization energy �6.6 eV� and hasone of the smallest surface dipoles �−0.5 eV�, as can be seenin Table IV. Positive dipole values in the table indicate thatthe dipole points along the x direction.
C. Y cut
The LN Y cut has attracted some interest not only becauseof its technological importance but also because it shows apuzzling surface charge, which is not expected for a nonpolarmaterial cut.25 Along the y axis, LN can be interpreted as asequence of Li2Nb2O6 layers, as shown in Fig. 5. The y
direction ��11̄00� or equivalent� is parallel to a crystal mirrorplane: Any charge movements due to ionic displacement�compression� is not compensated for and gives rise to pi-ezoelectricity. The y axis is therefore nonpolar but piezoelec-tric. The terminations considered to model the Y cut are -Ox,with x=1, . . .6 and -Lii-Nbj, with i , j=0,1 ,2 and all possiblecombinations, as reported in Table IV. For each of thesecombinations, different starting geometries have been mod-eled. In this way, we consider stoichiometric and nonsto-ichiometric terminations. As in the case of the X cut not allthe possible terminations are investigated. The dominant ter-
mination in the phase diagram of the Y cut is the bulk termi-nation -Li2Nb2O6, however in case of strongly Li-rich orO-rich growth conditions the surface can become Li termi-nated or O terminated �see Fig. 14�. Assuming the bulk ter-mination to be the dominant one, it seems, at first sight,difficult to explain the observed surface charge. However, thebulk termination �represented in Fig. 15� cannot be simplyconsidered as a truncated bulk. Indeed, it is characterized byan outward relaxation of two oxygen atoms above the cationlayer, which in turn results in the biggest surface dipole �2.0eV� of all the investigated terminations �see Tables IV andV�. As before, positive dipole values in the table indicate thatthe dipole points in the positive y direction, negative valuesthat the dipole points in the negative y direction. The pro-nounced relaxation of the surface atoms with the formationof a strong surface dipole �the LN Y cut is piezoelectric� mayexplain the surface charge observed in these nominally non-polar cuts.25
V. SUMMARY
The surfaces of ferroelectric LiNbO3 usually known as Xcut, Y cut, and Z cut have been calculated using density-functional theory. For the Z cut, we find a strong influence of
TABLE V. Distances between the atomic layers of the stable LNX and Y surfaces. Corresponding bulk values are reported for com-parison, all lengths in angstrom.
Surf. Bulk
X�-Li12�d�OI,OII� 1.06
d�OI,OIII� 1.91
d�LiI ,OI� 0.57
d�BLK,OIII� 0.85 0.86
X�-Li6Nb6-O9�d�OI,BLKI� 0.79 0.86
d�OI,BLKII� 3.45 3.44
d�BLKI,BLKII� 2.65 2.58
d�OII,OIII� 1.04 0.86
Y
d�OI,NbI� 0.66
d�OI,OII� 1.26
d�OI,OIII� 2.03
d�OI,OIV� 2.69
d�OI,BLKI� 1.55 1.49
2
−O4
−O6
−O5
� � � � � � � � � � � � � � � � � � � � � � � � � � � � � � �
� � � � � � � � � � � � � � � � � � � � � � � � � � � � � � �
� � � � � � � � � � � � � � � � � � � � � � � � � � � � � � �
� � � � � � � � � � � � � � � � � � � � � � � � � � � � � � �
� � � � � � � � � � � � � � � � � � � � � � � � � � � � � � �
� � � � � � � � � � � � � � � � � � � � � � � � � � � � � � �
� � � � � � � � � � � � � � � � � � � � � � � � � � � � � � �
� � � � � � � � � � � � � � � � � � � � � � � � � � � � � � �
� � � � � � � � � � � � � � � � � � � � � � � � � � � � � � �
� � � � � � � � � � � � � � � � � � � � � � � � � � � � � � �
� � � � � � � � � � � � � � � � � � � � � � � � � � � � � � �
� � � � � � � � � � � � � � � � � � � � � � � � � � � � � � �
� � � � � � � � � � � � � � � � � � � � � � � � � � � � � � �
� � � � � � � � � � � � � � � � � � � � � � � � � � � � � � �
� � � � � � � � � � � � � � � � � � � � � � � � � � � � � � �
� � � � � � � � � � � � � � � � � � � � � � � � � � � � � � �
� � � � � � � � � � � � � � � � � � � � � � � � � � � � � � �
� � � � � � � � � � � � � � � � � � � � � � � � � � � � � � �
� � � � � � � � � � � � � � � � � � � � � � � � � � � � � � �
� � � � � � � � � � � � � � � � � � � � � � � � � � � � � � �
� � � � � � � � � � � � � � � � � � � � � � � � � � � � � � �
� � � � � � � � � � � � � � � � � � � � � � � � � � � � � � �
� � � � � � � � � � � � � � � � � � � � � � � � � � � � � � �
� � � � � � � � � � � � � � � � � � � � � � � � � � � � � � �
−1
O (eV)
∆µL
i(e
V)
−Nb2
−Li
−Li
−O
O−poor O−rich
Li−
poor
Li−
rich
−5 −4 −3 −2∆µ
1
0
−2
−3
−6
−5
−4
−Li Nb O62 2
−1
0
FIG. 14. �Color online� Phase diagram of the LN Y cut at dif-ferent growth conditions and in absence of foreign adsorbates. Theunlabeled region represents the stoichiometric termination, i.e., thebulk cut plus a whole Li2Nb2O6 layer. The shaded region indicatesthe thermodynamically allowed range of the chemical potentials.
O
IOIIOIII
BLKI
OIV
INb
[0001]
[2110]−−
FIG. 15. �Color online� Side view of the stable �-Li2-Nb2-O6
terminated� LN Y face at growth conditions. White atoms are Nb,gray atoms Li, and small atoms O.
LITHIUM NIOBATE X-CUT, Y-CUT, AND Z-CUT… PHYSICAL REVIEW B 81, 214116 �2010�
214116-9

the spontaneous polarization of the material on the surfacestructure. The positive z face is found to be -Nb-O3-Li2 ter-minated for all thermodynamically allowed growth condi-tions and is characterized by an ionization energy of 6.5 eV.The negative z face is O-Li- terminated �under stronglyO-rich conditions it becomes O2 or O3 terminated� and ischaracterized by an ionization energy of 4.9 eV. While one ofthe topmost Li atoms of the positive surface sinks into thelower-lying O layer, no change in the atomic layer orderingoccurs at the negative surfaces. The atomic relaxation of bothfaces is rather moderate and involves only the uppermostatoms. The formation of the z faces does not alter the insu-lating nature of LN. The nonpolar LN x face is dominated bythe -Li12 termination, confirming the generally observedtrend for a metal termination of corundum structured metaloxide surfaces. The stable termination is characterized by anionization energy of 6.6 eV. The LN y face is -Li2Nb2O6terminated for almost all growth conditions. Even if this ter-
mination has a stoichiometric composition, it cannot be con-sidered as a truncated bulk. It is in fact characterized by apronounced outward relaxation of the topmost oxygen at-oms. Due to the piezoelectricity of the LN y axis, this has amajor effect in the charge distribution. The piezoelectric ef-fect together with the strong surface dipole introduced by thestable termination explains the surface charge observed onthe Y cut .
ACKNOWLEDGMENTS
We thank Wolfgang Sohler for suggesting this work andmany helpful discussions. The calculations were done usinggrants of computer time from the Paderborn Centerfor Parallel Computing �PC2� and the Höchstleistungs-Rechenzentrum Stuttgart �HLRS�. The DeutscheForschungsgemeinschaft is acknowledged for financialsupport.
*[email protected] Y. Xu, Ferroelectric Materials and Their Applications �Elsevier,
Amsterdam, 1991�.2 Y. S. Kuzminov, Lithium Niobate Crystals �Cambridge Interna-
tional Science, Cambridge, 1999�.3 R. S. Weis and T. K. Gaylord, Appl. Phys. A 37, 191 �1985�.4 T. Volk and M. Wöhlecke, Lithium Niobate: Defects, Photore-
fraction and Ferroelectric Switching �Springer, Berlin, 2008�.5 S. Grilli, P. Ferraro, P. De Natale, B. Tiribilli, and M. Vassalli,
Appl. Phys. Lett. 87, 233106 �2005�.6 Y. Yun and E. I. Altman, J. Am. Chem. Soc. 129, 15684 �2007�.7 W. A. Doolittle, G. Namkoong, A. G. Carver, and A. S. Brown,
Solid-State Electron. 47, 2143 �2003�.8 G. Namkoong, K. Lee, S. M. Madison, W. Henderson, S. E.
Ralph, and W. A. Doolittle, Appl. Phys. Lett. 87, 171107�2005�.
9 K. Lee, G. Namkoong, W. A. Doolittle, M. Losurdo, G. Bruno,and D. H. Jundt, J. Vac. Sci. Technol. B 24, 2093 �2006�.
10 Y. Tsuchiya, A. Kobayashi, J. Ohta, H. Fujioka, and M. Oshima,Phys. Status Solidi A 202, R145 �2005�.
11 Y. Tsuchiya, M. Oshima, A. Kobayashi, J. Ohta, and H. Fujioka,J. Vac. Sci. Technol. A 24, 2021 �2006�.
12 A. Ougazzaden, T. Moudakir, T. Aggerstam, G. Orsal, J. P.Salvestrini, S. Gautier, and A. A. Sirenko, Phys. Status Solidi C5, 1565 �2008�.
13 S. Sanna and W. G. Schmidt, Appl. Surf. Sci. 256, 5740 �2010�.14 D. D. Fong, A. M. Kolpak, J. A. Eastman, S. K. Streiffer, P. H.
Fuoss, G. B. Stephenson, C. Thompson, D. M. Kim, K. J. Choi,C. B. Eom, I. Grinberg, and A. M. Rappe, Phys. Rev. Lett. 96,127601 �2006�.
15 Y. Yun, M. Li, D. Liao, L. Kampschulte, and E. I. Altman, Surf.Sci. 601, 4636 �2007�.
16 W. Yang, B. J. Rodriguez, A. Gruverman, and R. J. Nemanic,Appl. Phys. Lett. 85, 2316 �2004�.
17 G. H. Lee, Opt. Express 10, 556 �2002�.18 A. Ye Lushkin, V. B. Nazarenko, K. N. Pilipchak, V. F.
Shnyukov, and A. G. Naumovets, J. Phys. D 32, 22 �1999�.
19 S. V. Levchenko and A. M. Rappe, Phys. Rev. Lett. 100, 256101�2008�.
20 S. Sanna and W. G. Schmidt, Phys. Status Solidi C 7, 145�2010�.
21 L. Gui, H. Hu, M. Garcia-Granda, and W. Sohler, Opt. Express17, 3923 �2009�.
22 S. Solanki, T.-C. Chong, and X. Xu, J. Cryst. Growth 250, 134�2003�.
23 A. Räuber, Chemistry and Physics of Lithium Niobate, CurrentTopics in Matial Science Vol. 1, edited by E. Kaldis �North-Holland, Amsterdam, 1978�.
24 T. Jungk, A. Hoffmann, and E. Soergel, Appl. Phys. Lett. 89,042901 �2006�.
25 F. Johann, T. Jungk, A. Hoffmann, and E. Soergel �private com-munication�.
26 P. E. Blöchl, Phys. Rev. B 50, 17953 �1994�.27 G. Kresse and J. Furthmüller, Phys. Rev. B 54, 11169 �1996�.28 J. P. Perdew and Y. Wang, Phys. Rev. B 33, 8800 �1986�.29 W. G. Schmidt, M. Albrecht, S. Wippermann, S. Blankenburg,
E. Rauls, F. Fuchs, C. Rödl, J. Furthmüller, and A. Hermann,Phys. Rev. B 77, 035106 �2008�.
30 J. Neugebauer and M. Scheffler, Phys. Rev. B 46, 16067 �1992�.31 L. Bengtsson, Phys. Rev. B 59, 12301 �1999�.32 H. J. Monkhorst and J. D. Pack, Phys. Rev. B 13, 5188 �1976�.33 G.-X. Qian, R. M. Martin, and D. J. Chadi, Phys. Rev. Lett. 60,
1962 �1988�.34 W. G. Schmidt, Appl. Phys. A 65, 581 �1997�.35 F. Bechstedt, Principle of Surface Physics �Springer, Berlin,
2003�.36 H. Xu, D. Lee, J. He, S. B. Sinnott, V. Gopalan, V. Dierolf, and
S. R. Phillpot, Phys. Rev. B 78, 174103 �2008�.37 F. Furche, Phys. Rev. B 64, 195120 �2001�.38 Ralph W. G. Wyckoff, Crystal Structures �Krieger, Malabar,
Florida, 1982�, Vol. 1.39 B. M. Gatehouse and A. D. Wadsley, Acta Crystallogr. 17, 1545
�1964�.40 O. Knacke, O. Kabaschewski, and K. Hesselmann, Thermo-
SIMONE SANNA AND WOLF GERO SCHMIDT PHYSICAL REVIEW B 81, 214116 �2010�
214116-10

chemical Properties of Inorgnic Substances �Springer Verlag,Berlin, 1991�.
41 M. W. Chase, Jr., J. Phys. Chem. Ref. Data 9, 1 �1998�.42 T. Choso, M. Kamada, and K. Tabata, Appl. Surf. Sci. 121-122,
387 �1997�.43 K. Tabata, T. Choso, and Y. Nagasawa, Surf. Sci. 408, 137
�1998�.44 A. Saito, H. Matsumoto, S. Ohnisi, M. Akai-Kasaya, Y. Kuwa-
hara, and M. Aono, Jpn. J. Appl. Phys. 43, 2057 �2004�.45 G. X. Qian, R. M. Martin, and D. J. Chadi, Phys. Rev. B 37,
1303 �1988�.46 K. Reuter and M. Scheffler, Phys. Rev. B 65, 035406 �2001�.
LITHIUM NIOBATE X-CUT, Y-CUT, AND Z-CUT… PHYSICAL REVIEW B 81, 214116 �2010�
214116-11
Related Documents