Literacy Report Card Population-Level Data Presented by: Dr. Ron Schack, Ph.D. The Charter Oak Group, LLC

Literacy Report Card Population-Level Data Presented by: Dr. Ron Schack, Ph.D. The Charter Oak Group, LLC.
Dec 24, 2015
Welcome message from author
This document is posted to help you gain knowledge. Please leave a comment to let me know what you think about it! Share it to your friends and learn new things together.
Transcript

Literacy Report CardPopulation-Level Data
Presented by:Dr. Ron Schack, Ph.D.
The Charter Oak Group, LLC

Poverty
Barriers To Early Success
in School
Low Literacy Levels
Difficulty Graduating From
HS and Succeeding in Post Secondary
Difficulty Finding Adequate
Employment

3Source: American Community Survey
Across the board, a full 20% or more of residents 25 or older in all these cities earn less than 200% of the poverty level. In some cities, like Hartford and New Britain, things are much worse.
Hartford New Britain Manchester East Hartford Connecticut US
Percent At or Above 200% of Poverty 65.1% 54.0% 73.7% 69.5% 77.0% 62.0%
5.0%
15.0%
25.0%
35.0%
45.0%
55.0%
65.0%
75.0%
85.0%
65.1%
54.0%
73.7%69.5%
77.0%
62.0%
Percent At or Above 200% of Poverty

4
Source: CTData.org
While no longer being utilized, the CMTs remain some of the best data we have available on aggregate school performance. There is clearly a huge gap for those on free and reduced lunch and the overall rate in CT; Hartford, New Britain and East Hartford are significantly lower than the overall CT rate.
Hartford New Britain Manchester East Hartford Connecticut
Overall 33.6 23.1 52.8 37.7 59.2
Free and Reduced Lunch 30.9 20.3 36.5 30.5 35.2
5
15
25
35
45
55
65
Percent at or above goal on Connecticut Mastery Test, Reading, 2012

5
Source: CTData.org
One important factor in school performance and graduation is chronic absenteeism. Hartford and New Britain have significantly higher rates of chronic absenteeism than CT as a whole.
Connecticut East Hartford School District
Hartford School Dis-trict
Manchester School District
New Britain School District
Series1 11% 13% 26% 13% 19%
2.50%
7.50%
12.50%
17.50%
22.50%
27.50%
11%13%
26%
13%
19%
Percent Students Chronically Absent, 2014

6
Source: American Community Survey
Another important factor in school performance is the degree of parental engagement, which can be more difficult in single parent families. Hartford and Manchester’s rate of single parent families is considerably higher than in CT overall.
Connecticut East Hartford Hartford Manchester New Britain
Male householder, no wife present, family 0.043 0.052 0.07 0.054 0.063
With own children under 18 years 0.019 0.021 0.034 0.024 0.023
Female householder, no husband present, fam-ily
0.131 0.225 0.314 0.304 0.222
With own children under 18 years 0.074 0.131 0.193 0.198 0.132
2.50%
7.50%
12.50%
17.50%
22.50%
27.50%
32.50%
Percentage of Households with one Parent, 2013

7
Another important factor in school performance is lack of stability of place. Hartford, New Britain, and Manchester have a significantly higher rate of movement than the CT overall rate or the US overall rate.
Source: American Community Survey
Connecticut East Hartford Hartford Manchester New Britain US
Series1 11.40% 11.60% 20.40% 14.10% 16.40% 13.50%
2.50%
7.50%
12.50%
17.50%
22.50%
11.40% 11.60%
20.40%
14.10%
16.40%
13.50%
Moved at least once in the past year, 2014
8
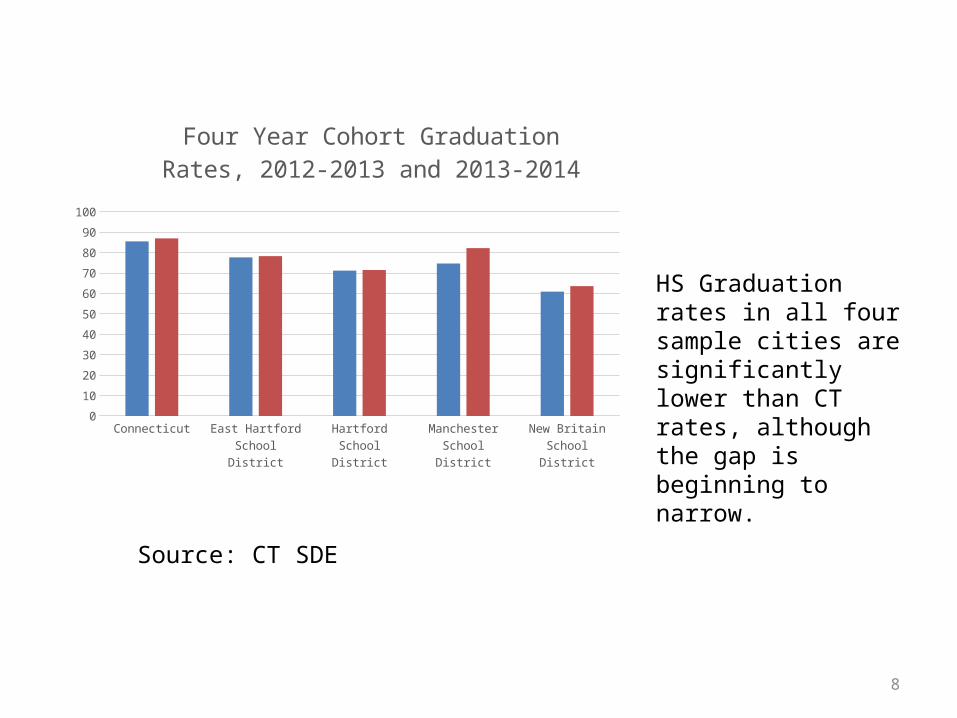
Source: CT SDE
HS Graduation rates in all four sample cities are significantly lower than CT rates, although the gap is beginning to narrow.Connecticut East Hartford
School DistrictHartford School
DistrictManchester
School DistrictNew Britain
School District
2012-2013 85.5 77.7 71.2 74.7 60.9
2013-2014 87 78.3 71.5 82.2 63.6
5
15
25
35
45
55
65
75
85
95
Four Year Cohort Graduation Rates, 2012-2013 and 2013-2014

Hartford 2013 Graduation Rates, Granular
9
Hartford School District All Students 71.2Hartford School District Hispanic 60.3Hartford School District Non-Hispanic 80.0Hartford School District Indian or Alaska Native *Hartford School District Asian 83.3Hartford School District Black 80.7Hartford School District Hawaiian or Pacific Islander *Hartford School District White 85.9Hartford School District Two or More Races 64.8Hartford School District Male 66.5Hartford School District Female 75.5Hartford School District ELL 56.3Hartford School District Non-ELL 73.9Hartford School District Eligible For Free Lunch 66.0Hartford School District Eligible For Reduced Lunch 96.2Hartford School District Not Eligible For Lunch 92.9Hartford School District Special Education 47.3Hartford School District Non-Special Education 76.1
Source: CT SDE
However, when graduates rates in Hartford, for example, for 2013 are examined more closely, challenges clearly remain. There is a substantial difference between male and female graduation rates, and graduation rates for those eligible for free lunch, and those in ELL or Special Education.

2010 2011 2012 2013 2014
Connecticut 9.3 8.8 8.4 7.8 6.7
East Hartford 11.6 11.2 10.6 9.8 8.5
Hartford 16.6 16.2 15.5 14.7 12.7
Manchester 8.8 8.4 8.3 7.4 6.4
New Britain 13.1 12.3 11.6 10.8 9.3
13579
11131517
Unemployment Rates, 2010-2014
While unemployment rates have decreased since the 2008 recession, Hartford, New Britain, and East Hartford are still well above the CT rate.
11
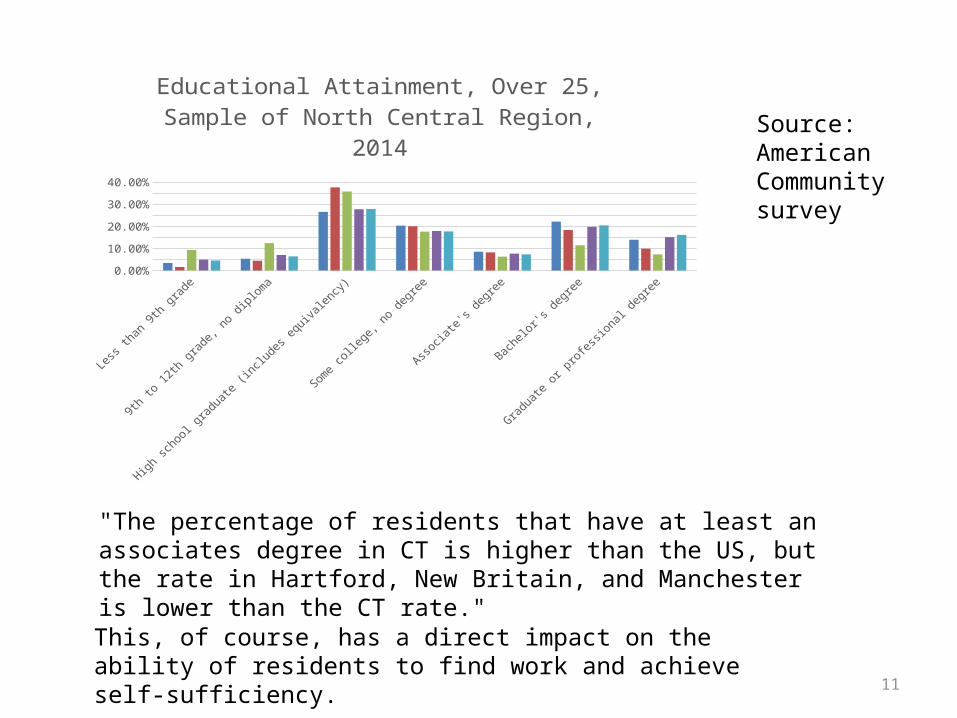
Source: American Community survey
"The percentage of residents that have at least an associates degree in CT is higher than the US, but the rate in Hartford, New Britain, and Manchester is lower than the CT rate."
This, of course, has a direct impact on the ability of residents to find work and achieve self-sufficiency.
Less than 9th grade
9th to 12th grade, no diploma
High school graduate (in-
cludes equiva-lency)
Some college, no degree
Associate's degree
Bachelor's de-gree
Graduate or professional
degree
Manches-ter
0.034 0.053 0.265 0.203 0.085 0.221 0.139
East Hart-ford
0.016 0.044 0.376 0.2 0.082 0.183 0.099
New Britain
0.093 0.124 0.357 0.176 0.063 0.114 0.073
Hartford 0.049 0.07 0.277 0.179 0.076 0.198 0.151
Connecti-cut
0.045 0.064 0.278 0.177 0.073 0.204 0.161
2.50%7.50%
12.50%17.50%22.50%27.50%32.50%37.50%
Educational Attainment, Over 25, Sample of North Central Region, 2014

Program Data: Adult Literacy

2010 2011 2012 2013 2014
Enrollments 30,889 28,199 26,096 25,662 24,751
30,889
28,199 26,096 25,662 24,751
CT Adult Education Enrollments, Statewide, 2010-2014
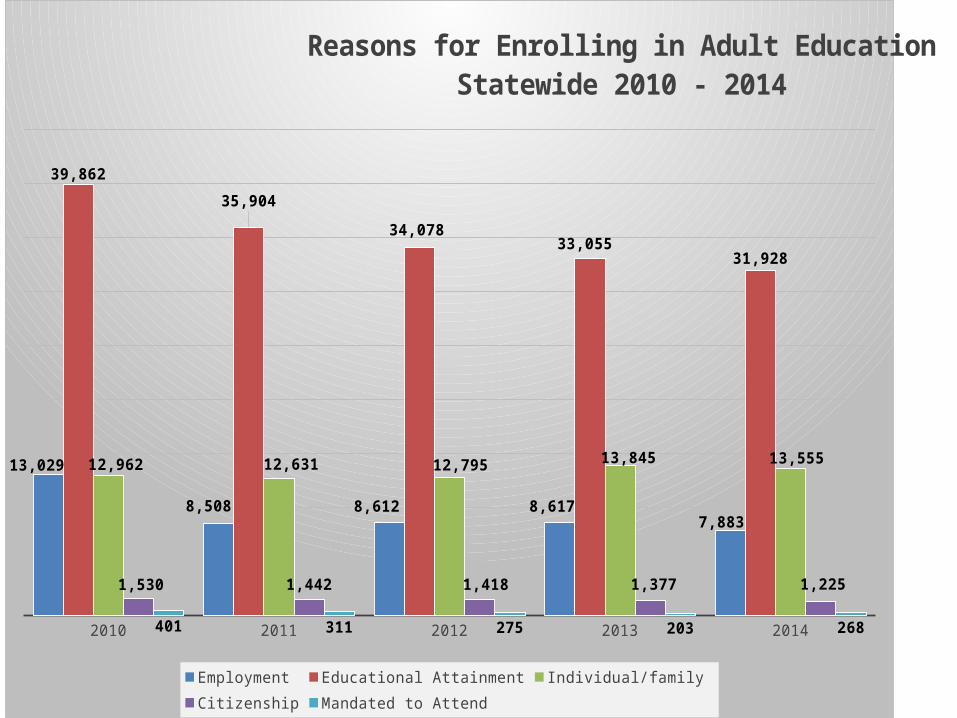
2010 2011 2012 2013 2014
13,029
8,508 8,612 8,617 7,883
39,862
35,904
34,078 33,055
31,928
12,962 12,631 12,795 13,845 13,555
1,530 1,442 1,418 1,377 1,225
401 311 275 203 268
Reasons for Enrolling in Adult EducationStatewide 2010 - 2014
Employment Educational Attainment Individual/family Citizenship Mandated to Attend
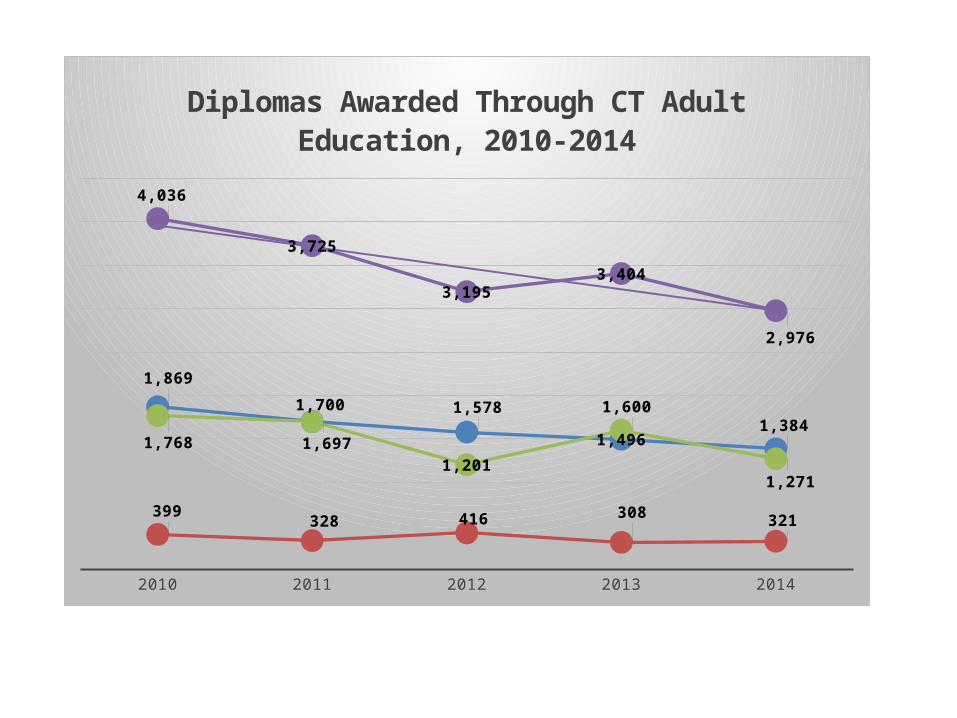
2010 2011 2012 2013 2014
credit diploma 1,869 1,700 1,578 1,496 1,384
external diploma 399 328 416 308 321
GED 1,768 1,697 1,201 1,600 1,271
Total Diplomas 4,036 3,725 3,195 3,404 2,976
1,869 1,700 1,578
1,496 1,384
399 328 416 308 321
1,768 1,697 1,201
1,600
1,271
4,036
3,725
3,195 3,404
2,976
Diplomas Awarded Through CT Adult Education, 2010-2014
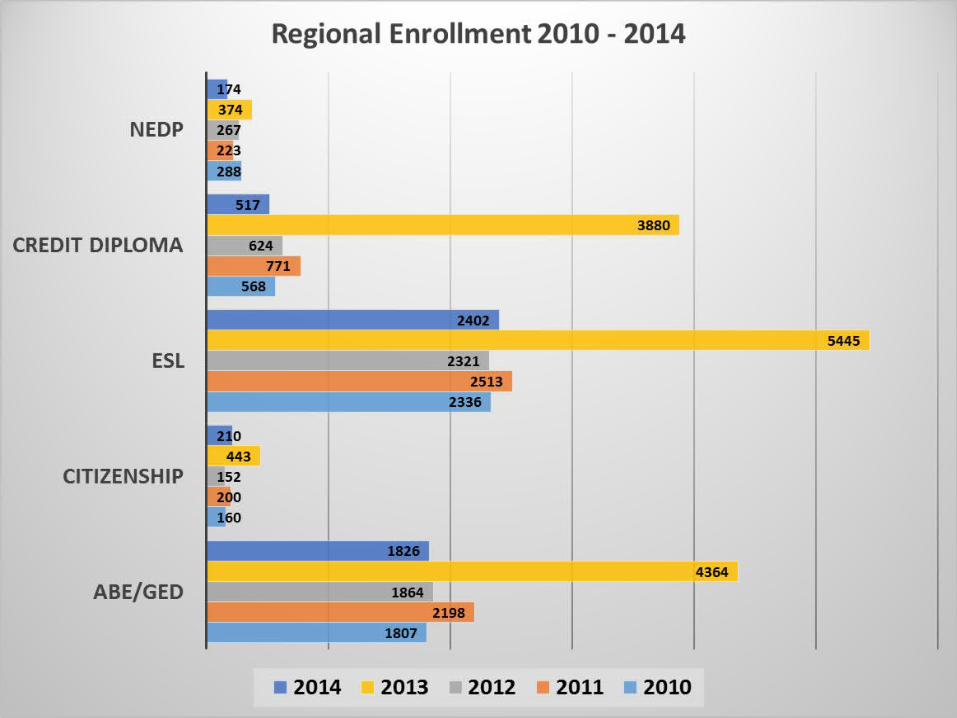
Add slide with regional enrollment 2010 - 2014

Total
Ages 16-24
Ages 25+
0 1000 2000 3000 4000 5000 6000
5032
1555
3477
Enrollment in Adult Education in North Central Region, 2014 By Age

ABE/GED
Citizenship
ESL
Credit Diploma
NEDP
0 500 1000 1500 2000 2500 3000
1826
210
2402
517
174
Adult Education Enrollment by ProgramNorth Central Region, 2014
Total Enrollment in the North Central Region: 5,129 Adults

ABD/GED Beginning
ABE/GED Intermediate
ABD/GED Advanced
ESL Beginning
ESL Intermediate
ESL Advanced
0 200 400 600 800 1000 1200
383
842
187
861
954
387
Educational Function at Entry to Adult Education, North Central Region, 2014
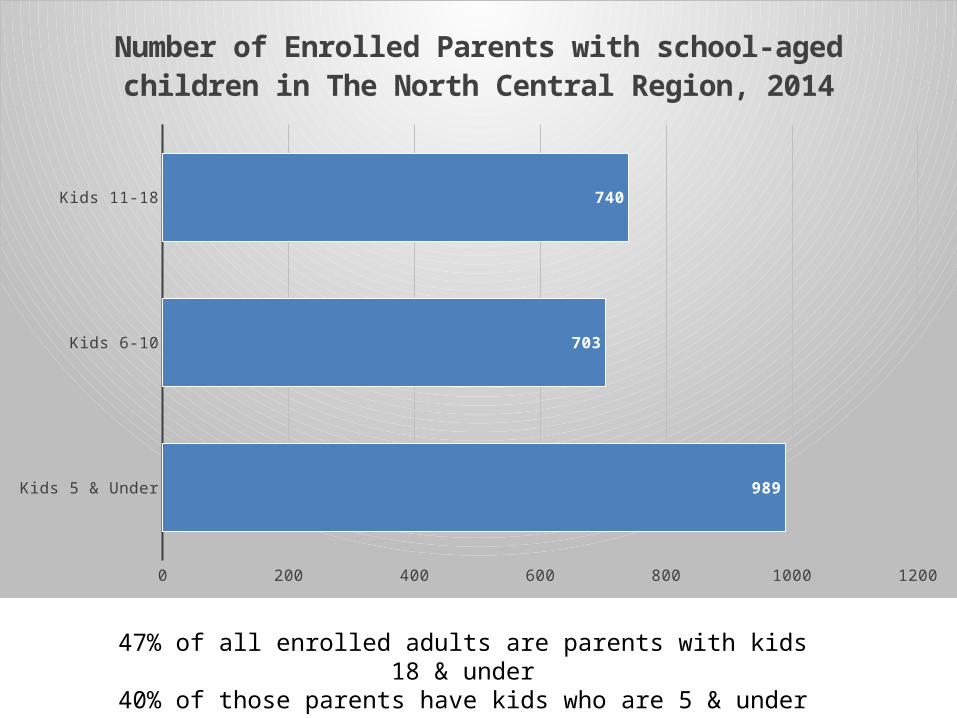
Kids 5 & Under
Kids 6-10
Kids 11-18
0 200 400 600 800 1000 1200
989
703
740
Number of Enrolled Parents with school-aged children in The North Central Region, 2014
47% of all enrolled adults are parents with kids 18 & under40% of those parents have kids who are 5 & under
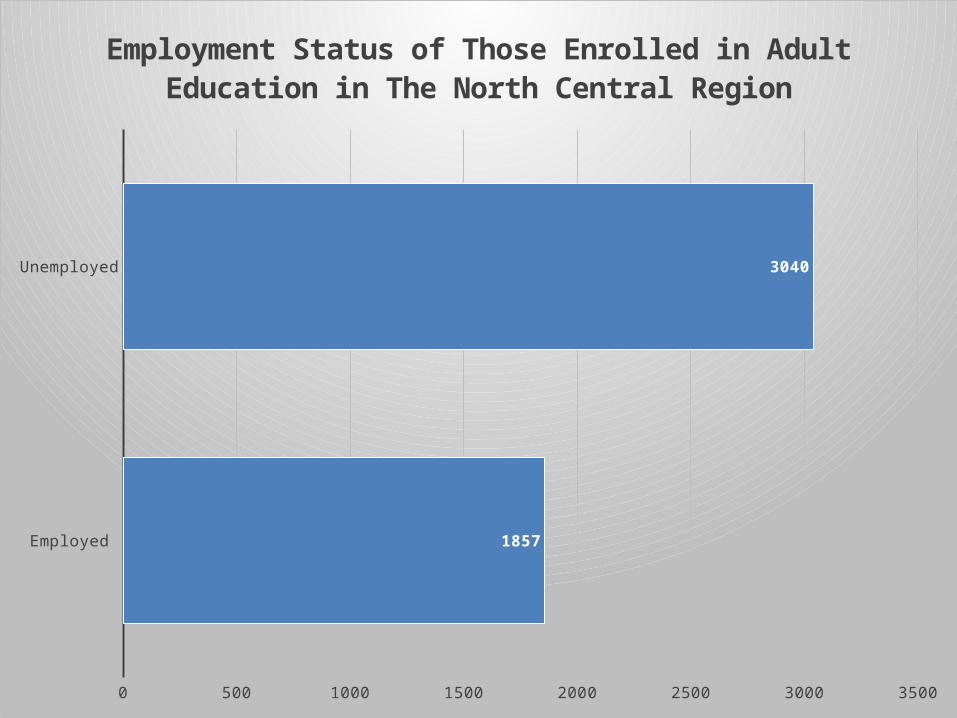
Employed
Unemployed
0 500 1000 1500 2000 2500 3000 3500
1857
3040
Employment Status of Those Enrolled in Adult Education in The North Central Region
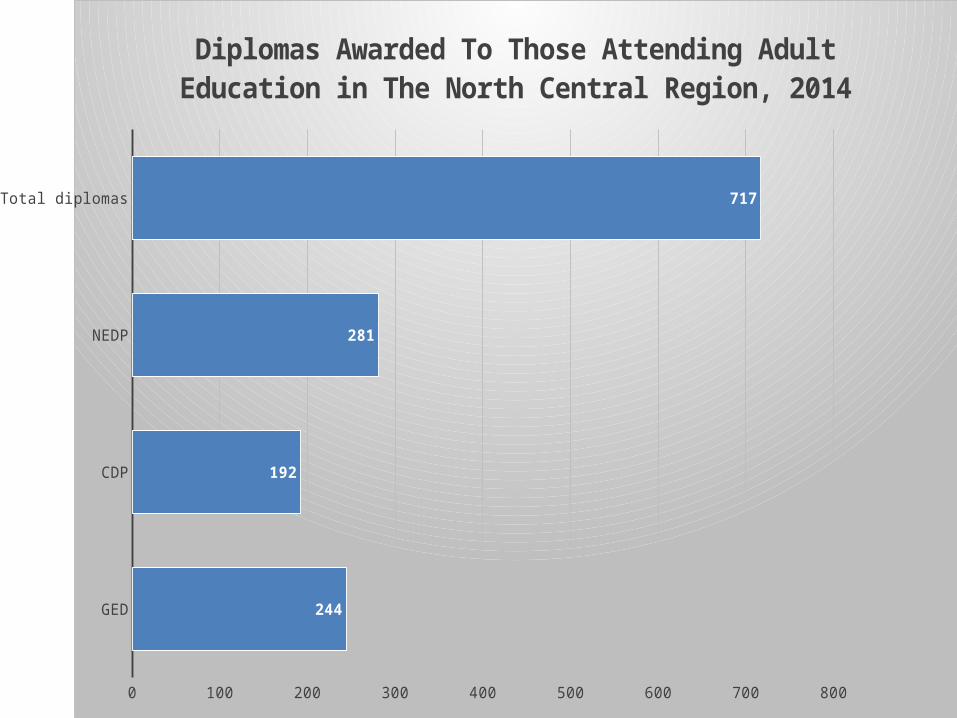
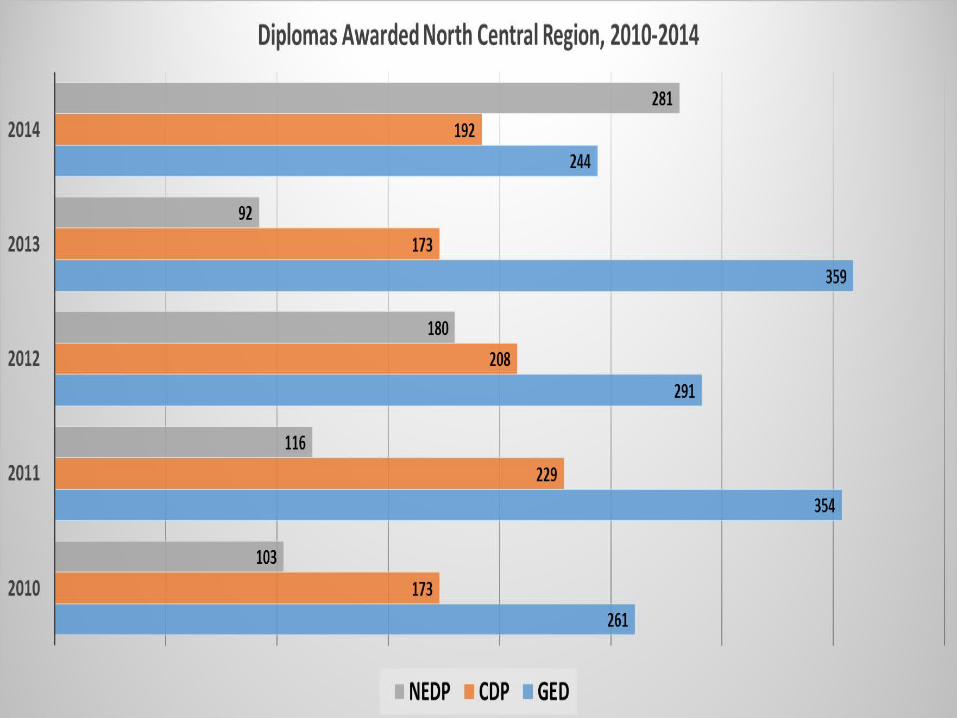
GED
CDP
NEDP
Total diplomas
0 100 200 300 400 500 600 700 800
244
192
281
717
Diplomas Awarded To Those Attending Adult Education in The North Central Region, 2014

Program Data: Community Colleges
Presented by:Sister Corby Coperthwaite, Ph.D.CT State Colleges & Universities
Board of Regents for Higher Education

Connecticut’s Community Colleges:
Proud Partners with Move Up!
Presented by:Sister Corby A. Coperthwaite, Ph.D.
Office of Policy and Research
(860) 723-7707

Credit Enrollment
2009-2010 2010-2011 2011-2012 2012-2013 2013-2014Connecticut Community College Total 79,003 81,564 81,314 82,412 80,023 Capital Workforce Service Area Total 24,457 24,791 24,610 24,620 23,845 Capital Workforce Service AreaPercentage 31.0% 30.4% 30.3% 29.9% 29.8%
79,003 81,564 81,314 82,412 80,023
24,457 24,791 24,610 24,620 23,845
-
10,000
20,000
30,000
40,000
50,000
60,000
70,000
80,000
90,000
2009-2010 2010-2011 2011-2012 2012-2013 2013-2014
CCC Total
CWSA Total

Andover MansfieldAvon MarlboroughBerlin New BritainBloomfield NewingtonBolton PlainvilleBristol PlymouthBurlington Rocky HillCanton SimsburyCromwell SomersEast Granby SouthingtonEast Hartford South WindsorEast Windsor StaffordEllington SuffieldEnfield TollandGlastonbury VernonGranby West HartfordHartford WethersfieldHebron WindsorManchester Windsor Locks
Community College
ALL COMMUNITY
COLLEGE STUDENTS
N N %Asnuntuck 2,519 2,209 87.7%Capital 6,095 5,405 88.7%Gateway 11,792 226 1.9%Housatonic 8,181 32 0.4%Manchester 10,558 8,932 84.6%Middlesex 4,483 681 15.2%Norwalk 9,021 32 0.4%Naugatuck Valley 9,802 553 5.6%Northwestern CT 2,124 327 15.4%Quinebaug Valley 2,563 153 6.0%Three Tivers 6,316 126 2.0%Tunxis 6,569 5,169 78.7%
Total 80,023 23,845 29.8%
2013-2014
CAPITAL WORK FORCE SERVICE
AREA STUDENTS
Capital Workforce Service Area Credit Enrollment

Non-Credit Enrollment
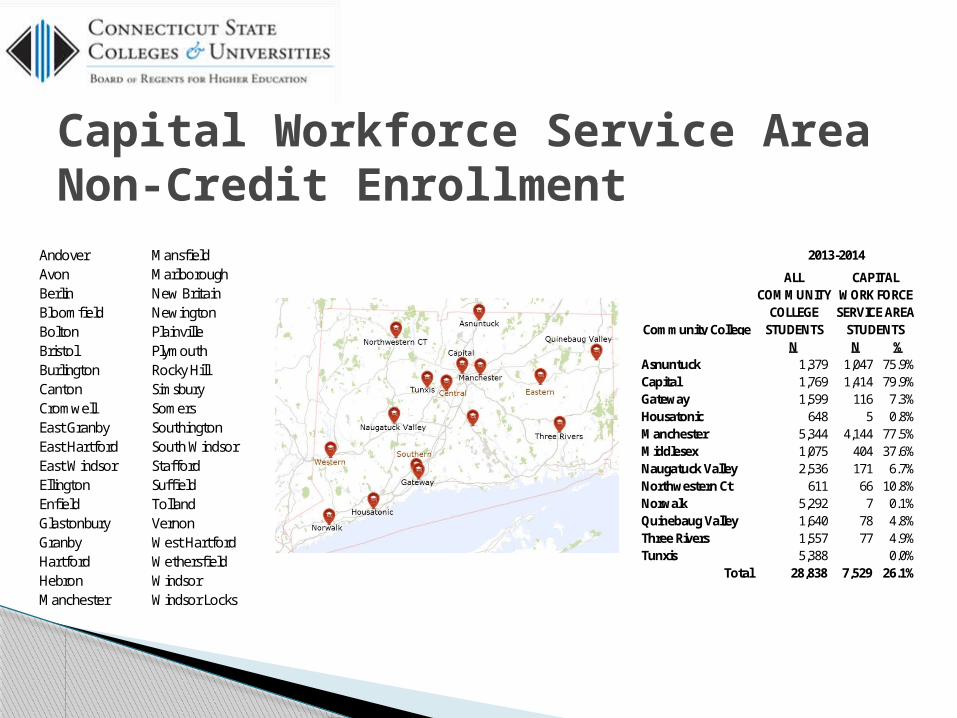
Andover MansfieldAvon MarlboroughBerlin New BritainBloomfield NewingtonBolton PlainvilleBristol PlymouthBurlington Rocky HillCanton SimsburyCromwell SomersEast Granby SouthingtonEast Hartford South WindsorEast Windsor StaffordEllington SuffieldEnfield TollandGlastonbury VernonGranby West HartfordHartford WethersfieldHebron WindsorManchester Windsor Locks
Capital Workforce Service Area Non-Credit Enrollment
Community College
ALL COMMUNITY
COLLEGE STUDENTS
N N %Asnuntuck 1,379 1,047 75.9%Capital 1,769 1,414 79.9%Gateway 1,599 116 7.3%Housatonic 648 5 0.8%Manchester 5,344 4,144 77.5%Middlesex 1,075 404 37.6%Naugatuck Valley 2,536 171 6.7%Northwestern Ct 611 66 10.8%Norwalk 5,292 7 0.1%Quinebaug Valley 1,640 78 4.8%Three Rivers 1,557 77 4.9%Tunxis 5,388 0.0%
Total 28,838 7,529 26.1%
2013-2014
CAPITAL WORK FORCE SERVICE AREA
STUDENTS

MetricsCompletions: Credit Workforce Development Certificates by College and Service AreaEnrollments: Credit Workforce Development Certificates by College and Service AreaGraduation Rates: Credit Workforce Development Certificates by College
Enrollments: Non-Credit Workforce Development Certificates by College and Service AreaCompletions: Non-Credit Workforce Development Certificates by College and Service AreaCompletion Rates: Non-Credit Workforce Development Certificates by College

MetricsEnrollment: Associate Degree Programs by College and Service Area by College and Service AreaCompletions: Associate Degree Programs by College and Service Area by College and Service AreaGraduation Rates: Associate Degrees by College
Enrollment: Remedial Education Courses by College and Service AreaCompletion: Remedial Education Courses C or better by College and Service AreaCompletion Rates: Remedial Education Courses by College and Service Area
Employment: Graduates of Credit Workforce Development Certificate and Associates Degree Programs

Program Data: Workforce Training
Presented by:Jim Boucher
Capital Workforce Partners
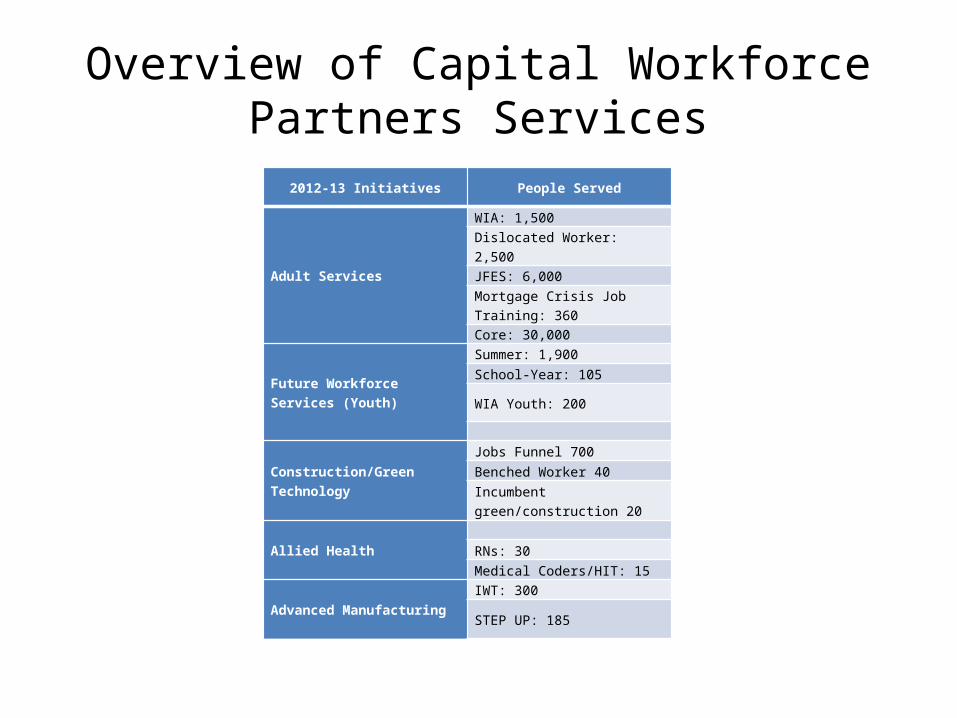
Overview of Capital Workforce Partners Services
2012-13 Initiatives People Served
Adult Services
WIA: 1,500
Dislocated Worker: 2,500
JFES: 6,000
Mortgage Crisis Job Training: 360
Core: 30,000
Future Workforce Services (Youth)
Summer: 1,900School-Year: 105
WIA Youth: 200
Construction/Green Technology
Jobs Funnel 700Benched Worker 40
Incumbent green/construction 20
Allied Health RNs: 30Medical Coders/HIT: 15
Advanced ManufacturingIWT: 300
STEP UP: 185

CT Works System 2012-13
Program Performance Measures Percent
WIA ADULT
Entered Employment 65.90%
Employment Retention 82.20%
Average Earnings $12,498
WIA Dislocated Worker
Entered Employment 75.60%
Employment Retention 87.60%
Average Earnings $ 18,184.00
WIA Youth
Placement in Employment or Education 71%
Attainment of Degree or Certification 90%
Literacy/Numeracy Gains N/A
ADULT TOTAL NUMBERSTotal Number of
Visitors 30,000 (estimate)
Self Service Customers 5778
WIA & Dislocated Adults 2012-2013
Workforce Training

Jobs First Employment Training ProgramJFES At A Squint April 2015
Total Participants 5521Total Employed 24.70%Average Wage 10.09
Salary if worked Full time $20,987Source: JFES at a Squint, State of Connecticut, 2015
CTDOL ANNUAL REPORT 2014PY2011-12
Entered Employment 49%
Retained in Employment 87%Weekly Wages 247
Yearly $12,844
Educational Level
High School Diploma or Less 61.60%
Associates or Some Postsecondary 11.20%
Bachelors and Above 3.30%
Employment Sectors
By 2020 65-70% of Jobs will require Post-Secondary Credentials

Registere
d Nurse
s
Nursing Assi
stants
Home Health Aides
Medica
l Assi
stants
License
d Practica
l and Li
cense
d Vocational N
urses
Physical T
herapists
Physicians a
nd Surgeons, All O
ther
Dental Hygienist
s
Dental Assi
stants
Nurse Practi
tioners0%
10%
20%
30%
40%
50%
60%
70%
80%
90%
100%
$0
$10
$20
$30
$40
$50
$60
$70
$80
$90
$100 405 169 126 115 112 69 59 49 44 40
$39
$29
$95
$20
$47
HealthCare Occupations
Annual Openings Median Hourly Earnings

Machinist
s
Inspecto
rs, Te
sters,
Samplers,
and W
eighers
Team
Assemblers
Computer-C
ontrolle
d Mach
ine Tool O
perators
Supervi
sors
of Pro
duction an
d Operati
ng Worke
rs
Helpers--Pro
duction W
orkers
Aircraft
Stru
cture
, Surfa
ces, R
igging,
and Sy
stems A
ssemblers
Structu
ral M
etal Fa
bricato
rs an
d Fitters
Welders,
Cutters, So
lderers,
and Braz
ers
Assemblers
and Fa
bricato
rs, All O
ther
0%
10%
20%
30%
40%
50%
60%
70%
80%
90%
100%
$0
$5
$10
$15
$20
$25
$30
$35 88 62 52 35 33 27 19 19 17 16
$21
$29
$11
$30
$13
Manufacturing Occupations
Annual Openings Median Hourly Earnings

Constructi
on Labore
rs
Electrici
ans
Carpente
rs
Plumbers, Pipefitters,
and Steamfitters
Supervisors
of Trades a
nd Extracti
on Workers
Operating Engineers and Equipment O
perators
Painters,
Constructi
on and Mainte
nance
Highway Mainte
nance W
orkers
Sheet Metal W
orkers
Drywall and Ceilin
g Tile In
stalle
rs0%
10%
20%
30%
40%
50%
60%
70%
80%
90%
100%
$0
$5
$10
$15
$20
$25
$30
$35 82 56 45 33 28 24 16 16 14 11
$18
$30
$16
$22
Construction Occupations
Annual Openings Median Hourly Earnings

Tools of the Navigator


Related Documents