Literacy for life The 2006 Education for All Global Monitoring Report London, 9 November 2005

Literacy for life The 2006 Education for All Global Monitoring Report London, 9 November 2005.
Dec 22, 2015
Welcome message from author
This document is posted to help you gain knowledge. Please leave a comment to let me know what you think about it! Share it to your friends and learn new things together.
Transcript
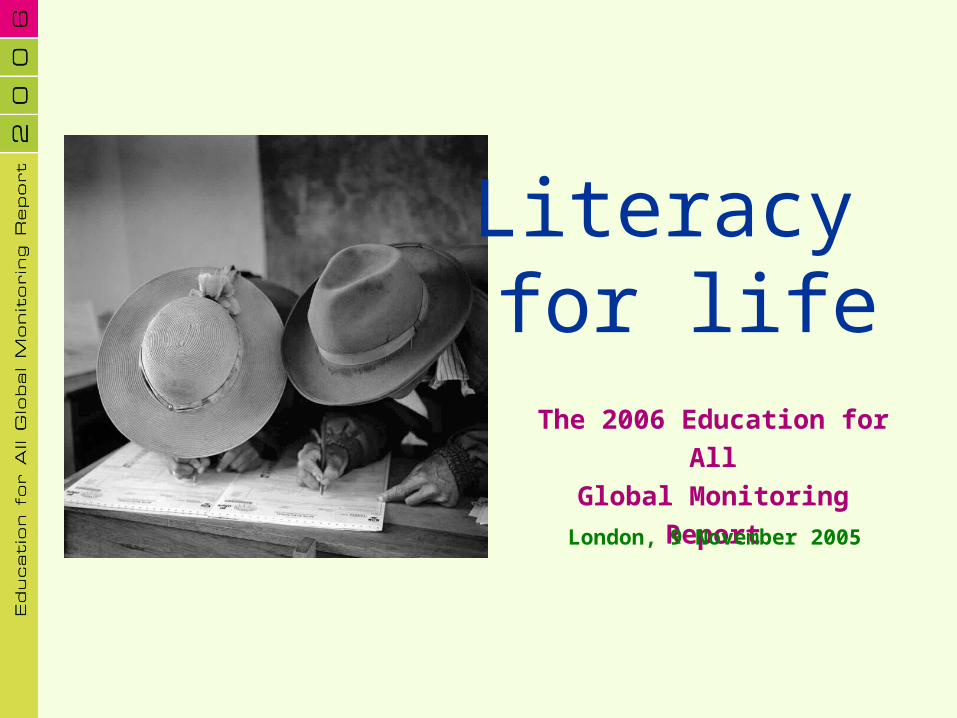
Literacy for life
The 2006 Education for All
Global Monitoring ReportLondon, 9 November 2005
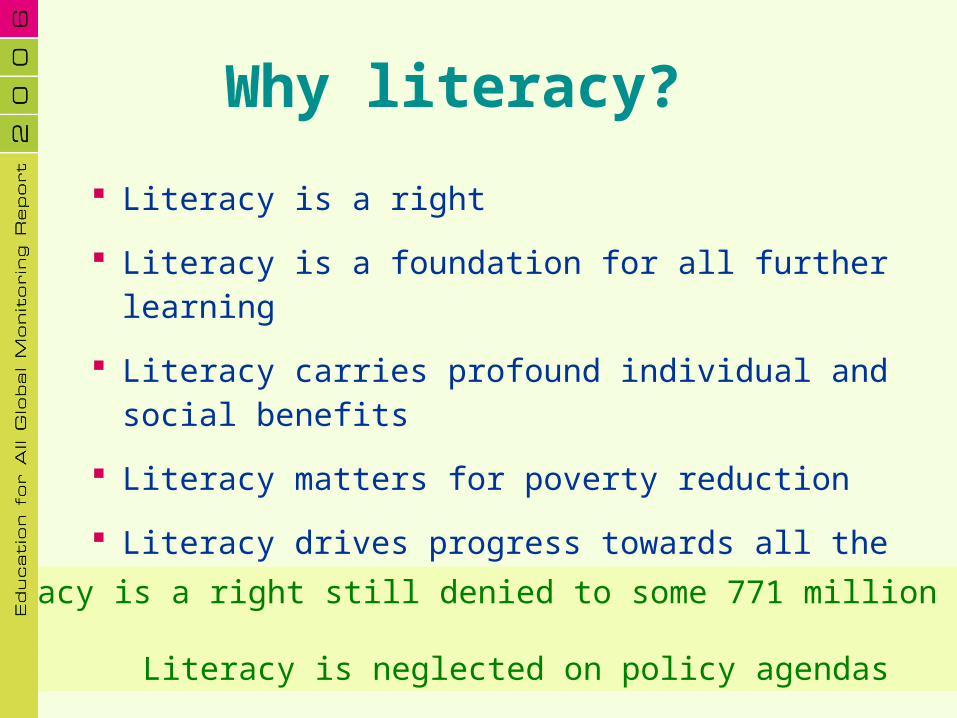
Why literacy?
Literacy is a right
Literacy is a foundation for all further learning
Literacy carries profound individual and social benefits
Literacy matters for poverty reduction
Literacy drives progress towards all the Education for All goals
Literacy is a right still denied to some 771 million adults
Literacy is neglected on policy agendas
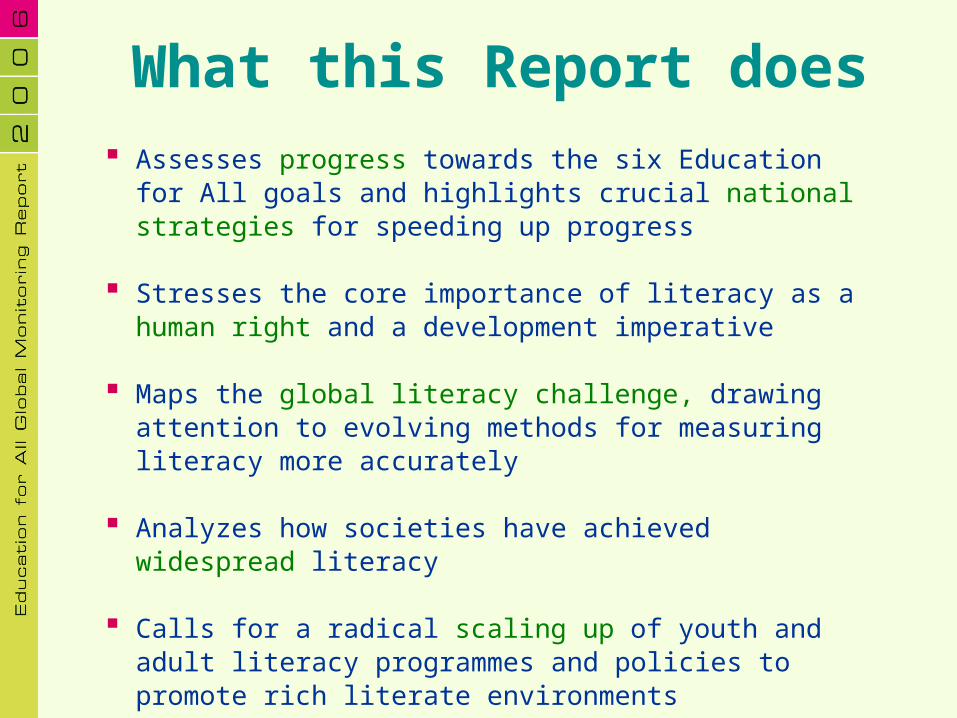
What this Report does Assesses progress towards the six Education for All
goals and highlights crucial national strategies for speeding up progress
Stresses the core importance of literacy as a human right and a development imperative
Maps the global literacy challenge, drawing attention to evolving methods for measuring literacy more accurately
Analyzes how societies have achieved widespread literacy
Calls for a radical scaling up of youth and adult literacy programmes and policies to promote rich literate environments
Reviews international commitments to finance EFA
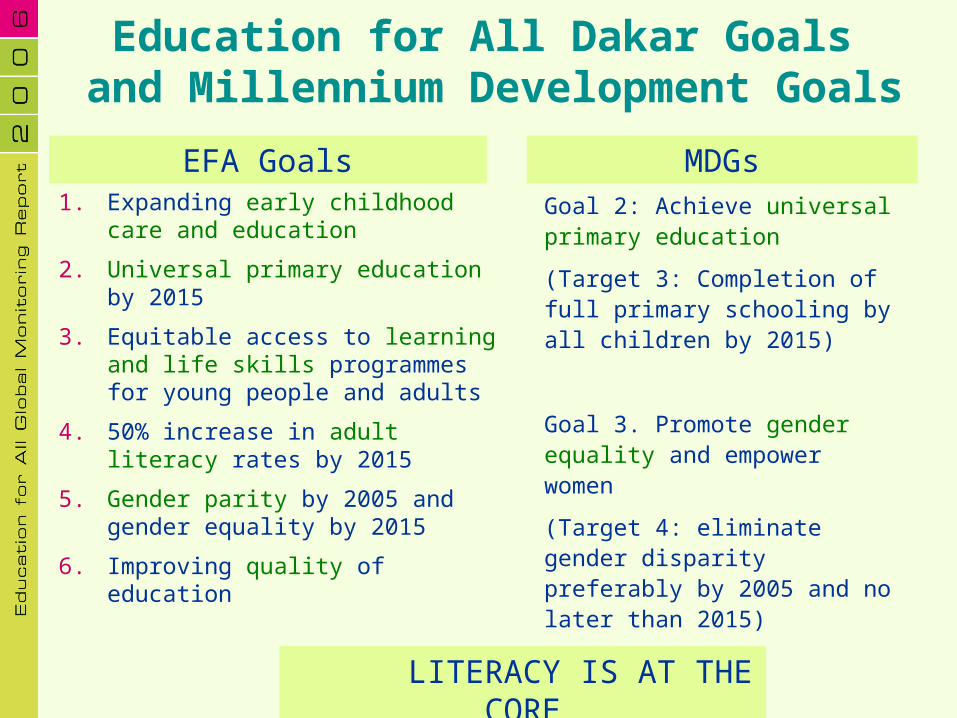
Education for All Dakar Goals and Millennium Development Goals
Goal 2: Achieve universal primary education
(Target 3: Completion of full primary schooling by all children by 2015)
Goal 3. Promote gender equality and empower women
(Target 4: eliminate gender disparity preferably by 2005 and no later than 2015)
1. Expanding early childhood care and education
2. Universal primary education by 2015
3. Equitable access to learning and life skills programmes for young people and adults
4. 50% increase in adult literacy rates by 2015
5. Gender parity by 2005 and gender equality by 2015
6. Improving quality of education
MDGsEFA Goals
LITERACY IS AT THE CORE
28
49
44
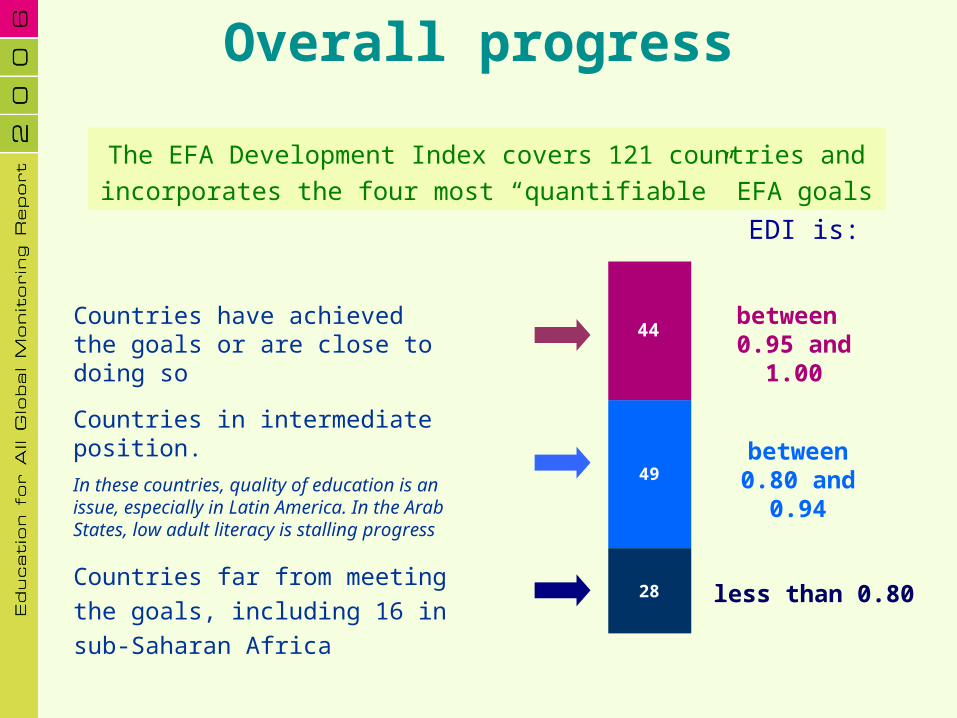
Overall progress
Countries far from meeting the goals, including 16 in sub-Saharan Africa
The EFA Development Index covers 121 countries and incorporates the four most “quantifiable” EFA goals
between 0.95 and
1.00
between0.80 and
0.94
less than 0.80
Countries have achieved the goals or are close to doing so
Countries in intermediate position.
In these countries, quality of education is an issue, especially in Latin America. In the ArabStates, low adult literacy is stalling progress
EDI is:
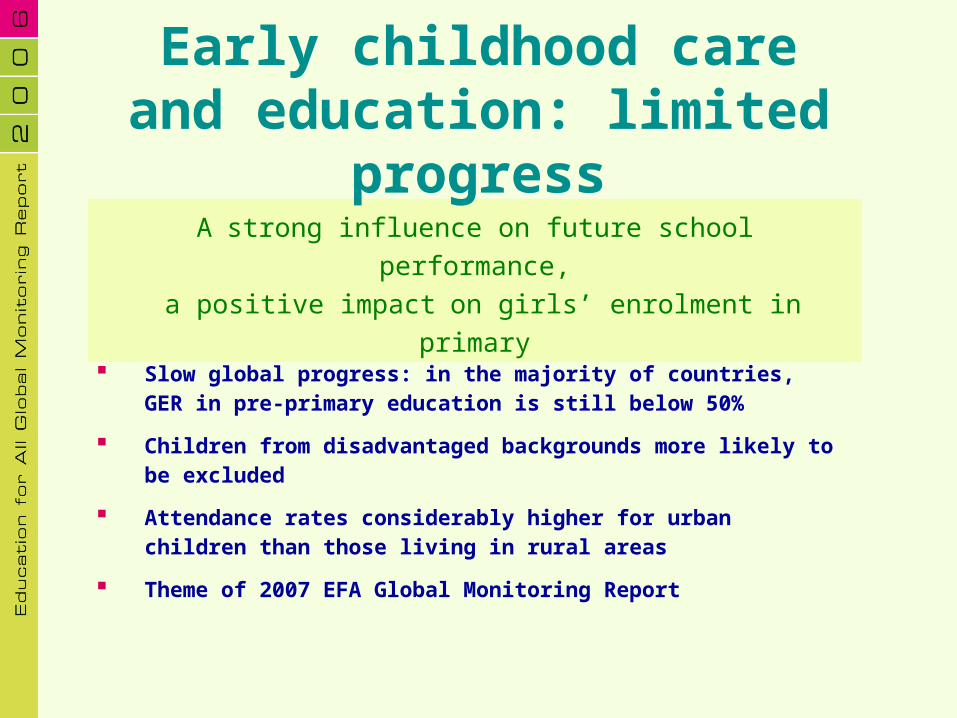
Slow global progress: in the majority of countries, GER in pre-primary education is still below 50%
Children from disadvantaged backgrounds more likely to be excluded
Attendance rates considerably higher for urban children than those living in rural areas
Theme of 2007 EFA Global Monitoring Report
A strong influence on future school performance, a positive impact on girls’ enrolment in primary
Early childhood care and education: limited
progress
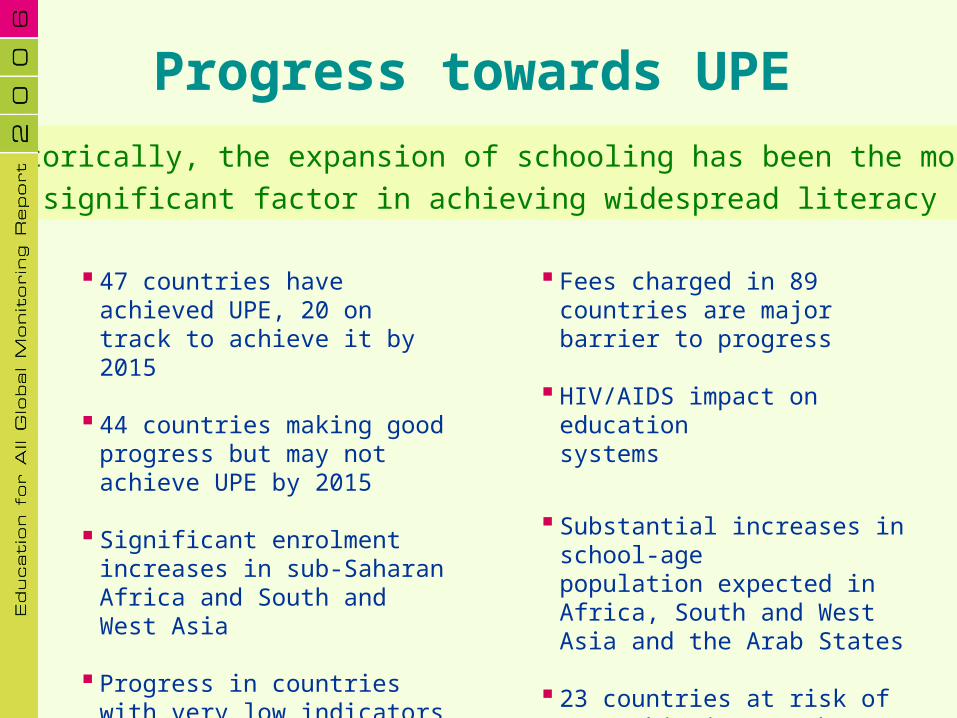
Progress towards UPEHistorically, the expansion of schooling has been the most
significant factor in achieving widespread literacy
47 countries have achieved UPE, 20 on track to achieve it by 2015
44 countries making good progress but may not achieve UPE by 2015
Significant enrolment increases in sub-Saharan Africa and South and West Asia
Progress in countries with very low indicators
Fees charged in 89 countries are major barrier to progress
HIV/AIDS impact on education systems
Substantial increases in school-agepopulation expected in Africa, South and West Asia and the Arab States
23 countries at risk of not achieving UPE by 2015, due to declining net enrolment ratios
-10
0
10
20
30
40
CentralAsia
LatinAmerica
Caribbean
N. America W. Europe
Cent.East.
Europe
ArabStates
EastAsia
Pacific
SouthWestAsia
SubSaharan
Africa
millions
Change in enrolment in primary education, 1998-2002
Out-of-primary school children, 2002
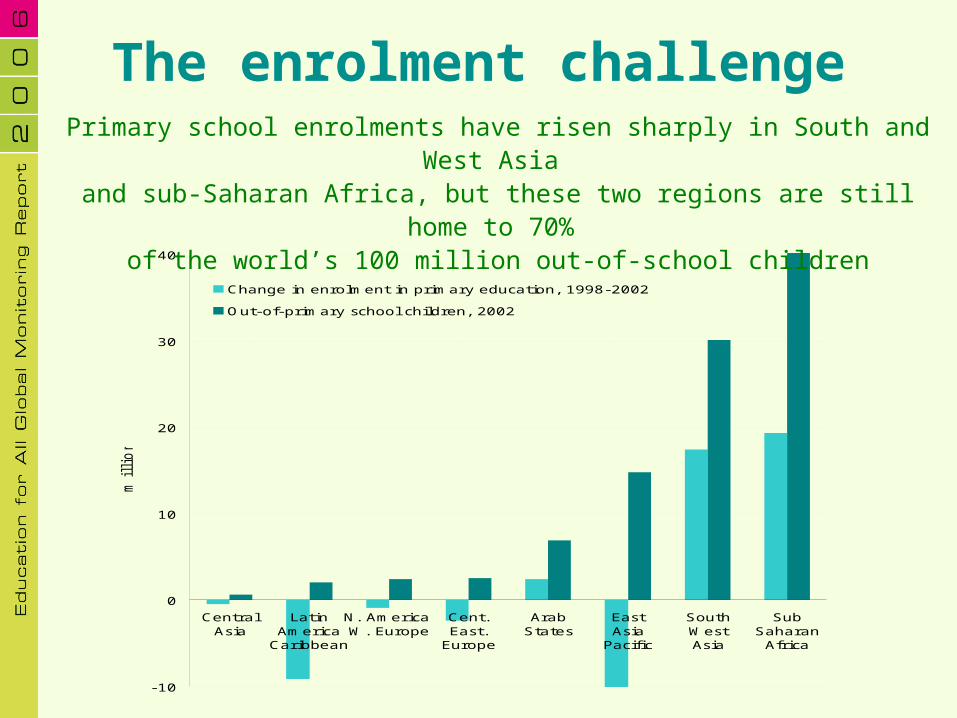
The enrolment challengePrimary school enrolments have risen sharply in South and West
Asia and sub-Saharan Africa, but these two regions are still home to
70% of the world’s 100 million out-of-school children
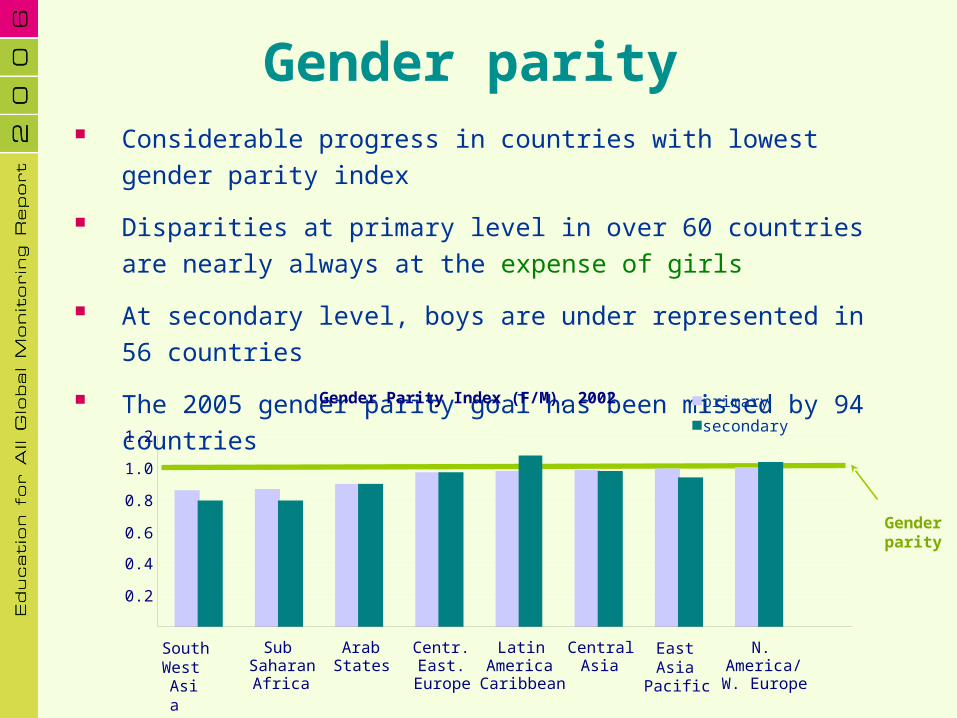
Gender parity Considerable progress in countries with lowest gender
parity index
Disparities at primary level in over 60 countries are nearly always at the expense of girls
At secondary level, boys are under represented in 56 countries
The 2005 gender parity goal has been missed by 94 countries
Gender parity
Gender Parity Index (F/M), 2002
0.2
0.4
0.6
0.8
1.0
1.2
SouthWestAsia
SubSaharanAfrica
ArabStates
Centr.East.
Europe
LatinAmericaCaribbean
CentralAsia
East Asia
Pacific
N.America/W. Europe
primary
secondary

Gender parity: the prospects at both levels
31
9
9
79
106
54100
At risk of not achieving by 2015
Likely to be achieved in 2015
Likely to be achieved in 2005
Achieved in 2002
Primary education
Secondary education
Overall
86
86
49
Quality of learning
0
10
20
30
40
50
60
70
80
90
100
U.
R.
Tanza
nia
(M
ain
land)
Mala
wi
Moza
mbiq
ue
Uganda
U.
R.
Tanza
nia
(Z
anzi
bar)
Zam
bia
Zim
babw
e
Kenya
Leso
tho
Sw
azi
land
Nam
ibia
South
Afr
ica
Mauri
tius
Bots
wana
Seych
elle
s
Perc
enta
ge o
f G
rade 6
pupils
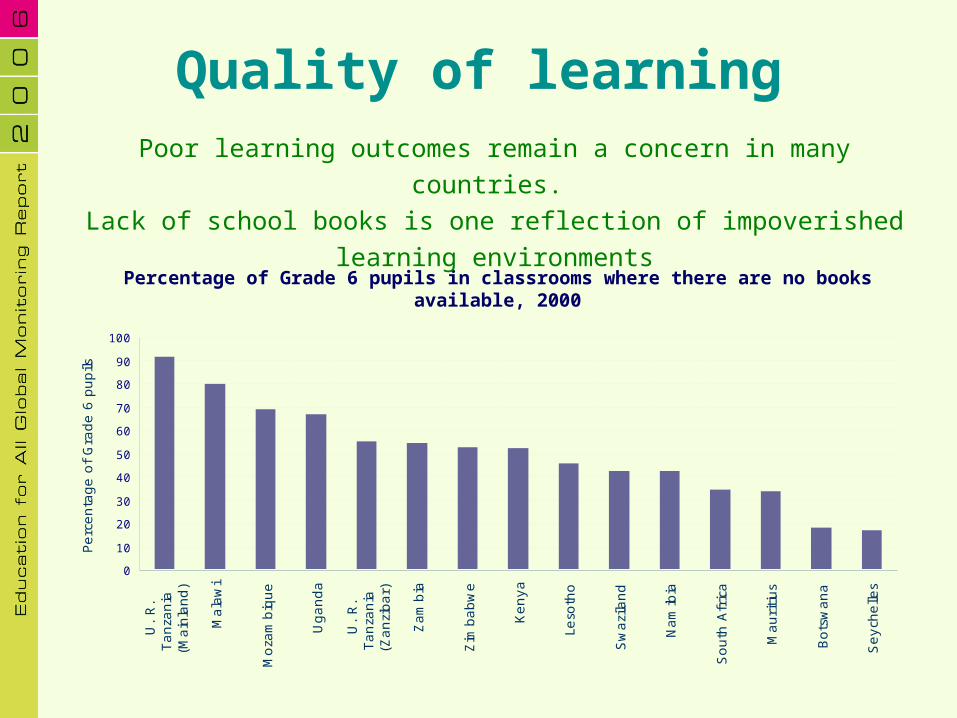
Percentage of Grade 6 pupils in classrooms where there are no books available, 2000
Poor learning outcomes remain a concern in many countries. Lack of school books is one reflection of impoverished learning
environments
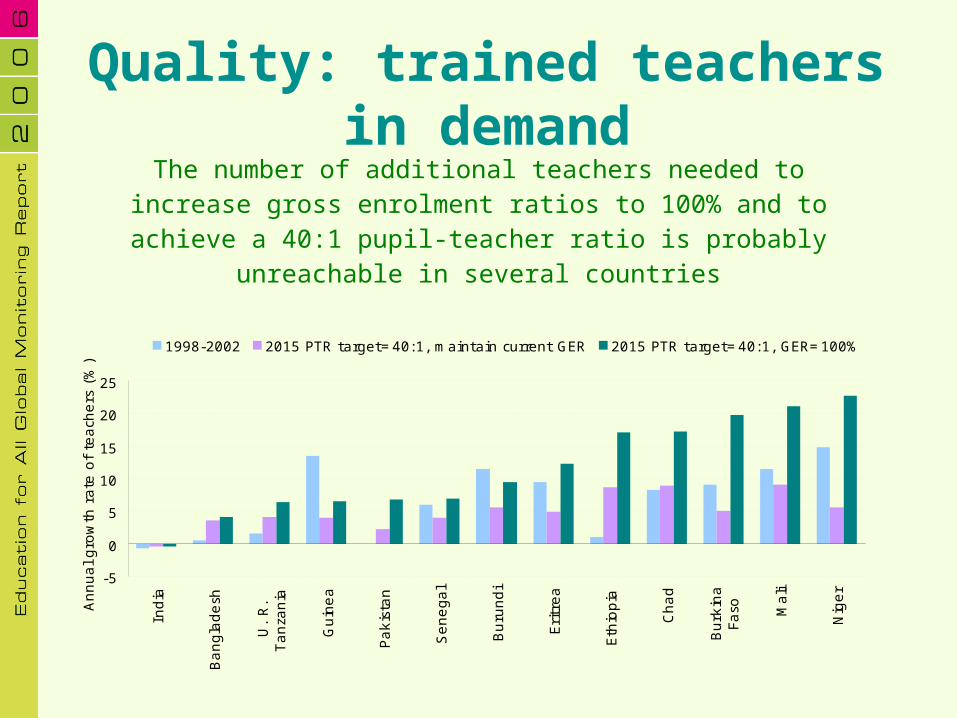
Quality: trained teachers in demand
The number of additional teachers needed to increase gross enrolment ratios to 100% and to achieve a 40:1 pupil-teacher ratio is probably unreachable in several
countries
-5
0
5
10
15
20
25
India
Bangla
desh
U.
R.
Tanza
nia
Guin
ea
Pakis
tan
Senegal
Buru
ndi
Eri
trea
Eth
iopia
Chad
Burk
ina
Faso M
ali
Nig
er
Annual gro
wth
rate
of
teach
ers
(%
)
1998-2002 2015 PTR target=40:1, maintain current GER 2015 PTR target=40:1, GER=100%
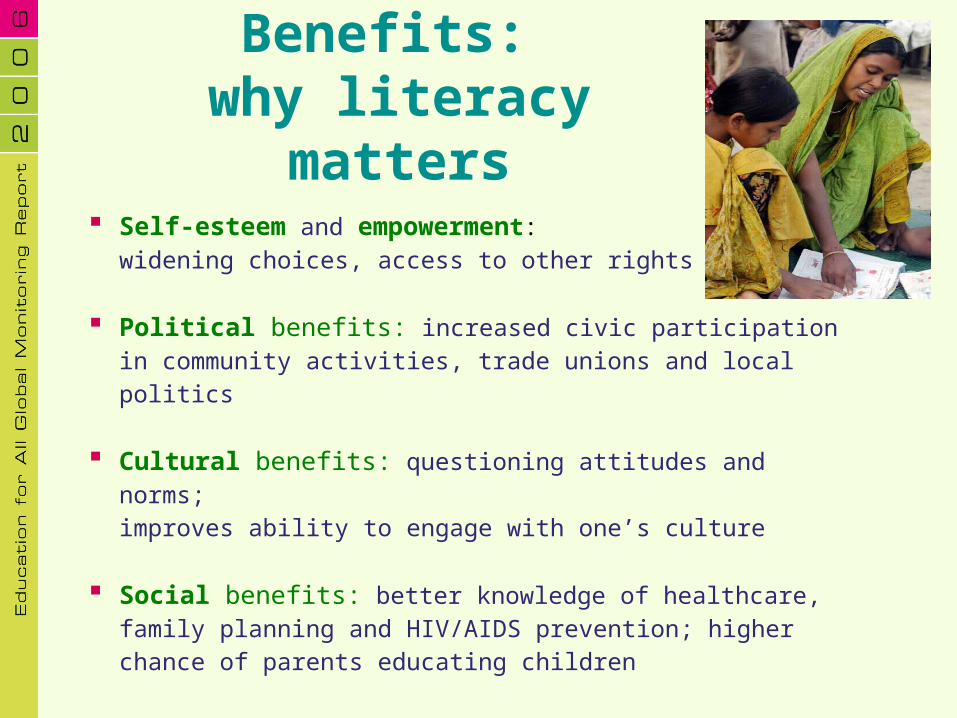
Benefits: why literacy
matters Self-esteem and empowerment:
widening choices, access to other rights
Political benefits: increased civic participation in community activities, trade unions and local politics
Cultural benefits: questioning attitudes and norms; improves ability to engage with one’s culture
Social benefits: better knowledge of healthcare, family planning and HIV/AIDS prevention; higher chance of parents educating children
Economic benefits: Returns on investment in adult literacy programmes are comparable to those in primary level education
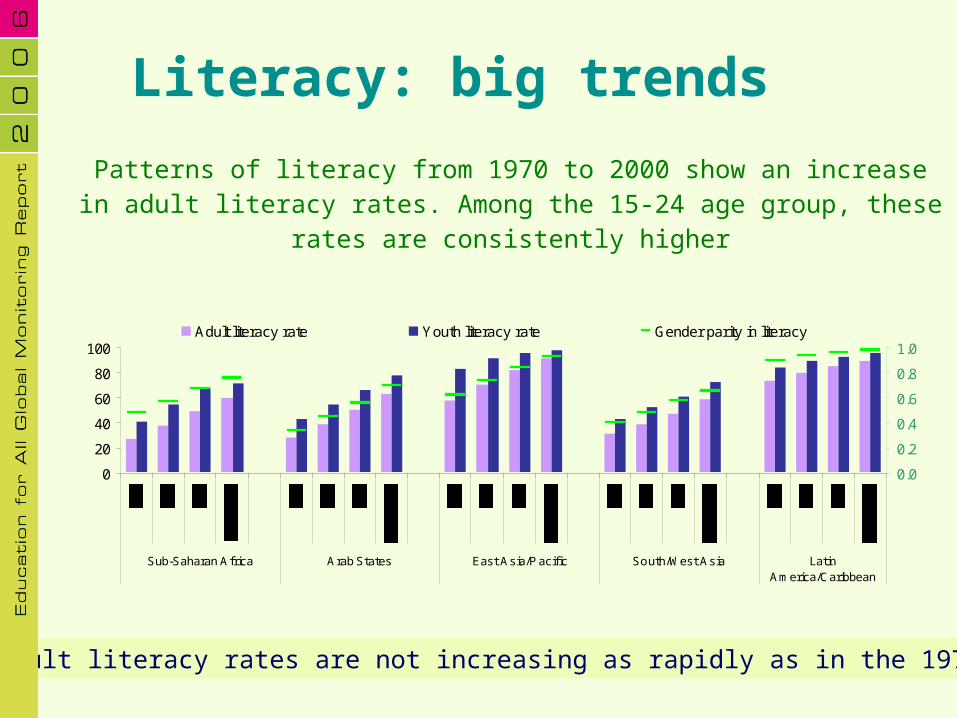
Patterns of literacy from 1970 to 2000 show an increase in adult literacy rates. Among the 15-24 age group, these rates are
consistently higher
Literacy: big trends
Adult literacy rates are not increasing as rapidly as in the 1970s
0
20
40
60
80
100
Sub-Saharan Africa Arab States East Asia/P acific South/West Asia LatinAmerica/Caribbean
0.0
0.2
0.4
0.6
0.8
1.0Adult literacy rate Youth literacy rate Gender parity in literacy
-5.3
-94.3
10.6
6.2
-1.5
-3.0
-5.4
-0.2
-2.5
-1.0
1.0
-1.3
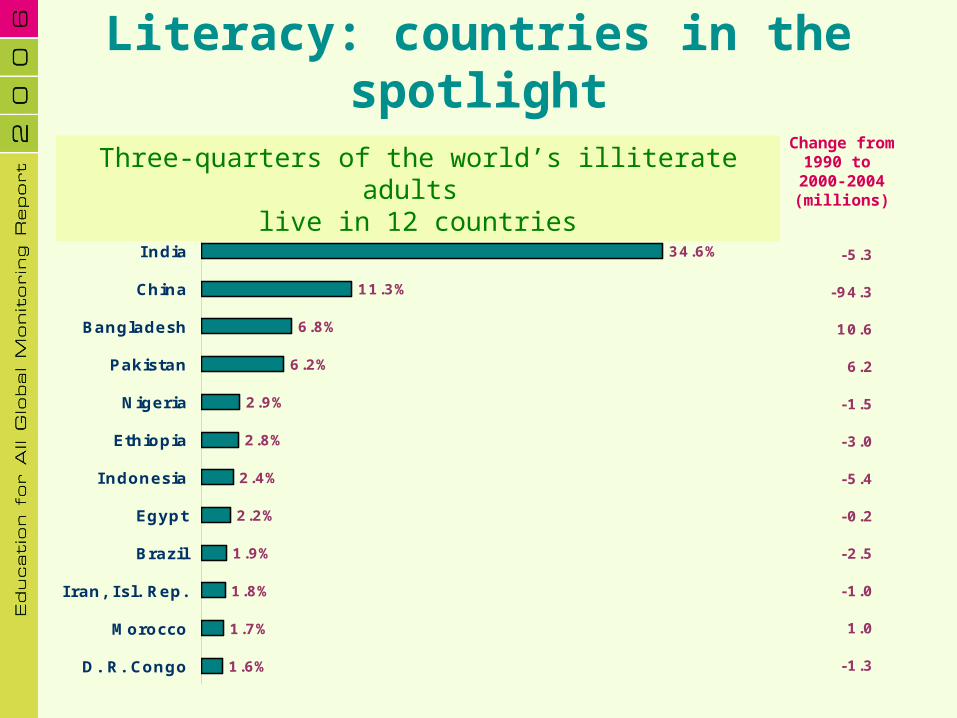
34.6%
11.3%
6.8%
6.2%
2.9%
2.8%
2.4%
2.2%
1.9%
1.8%
1.7%
1.6%
I ndia
China
Bangladesh
Pakistan
Nigeria
Ethiopia
Indonesia
Egypt
Brazil
I ran, I sl. Rep.
Morocco
D. R. Congo
Three-quarters of the world’s illiterate adults live in 12 countries
Change from 1990 to
2000-2004 (millions)
Literacy: countries in the spotlight
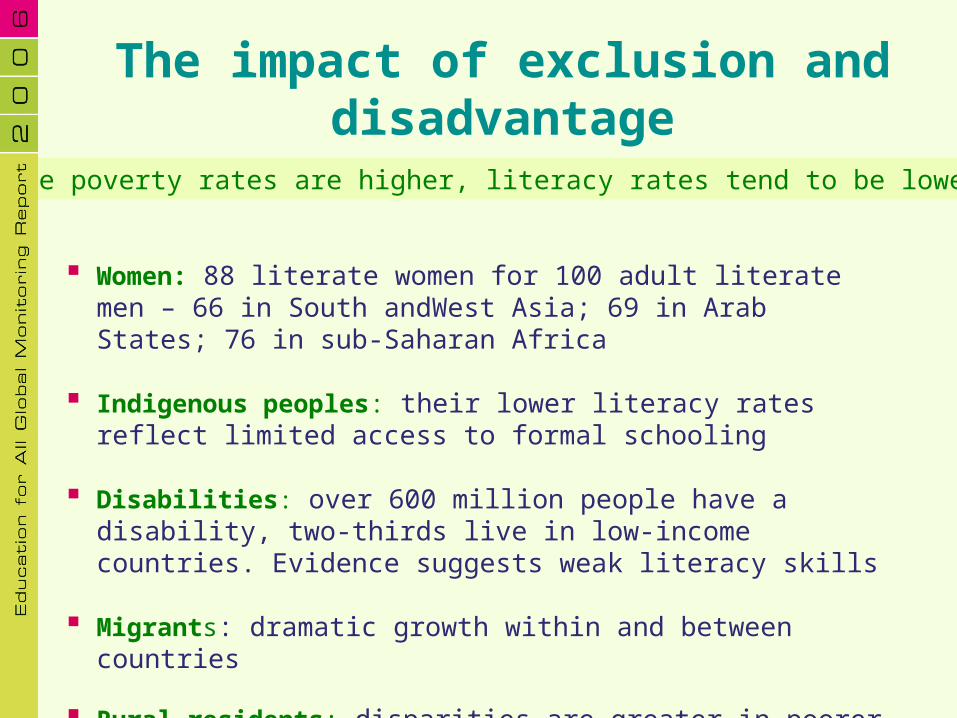
The impact of exclusion and disadvantage
Women: 88 literate women for 100 adult literate men – 66 in South andWest Asia; 69 in Arab States; 76 in sub-Saharan Africa
Indigenous peoples: their lower literacy rates reflect limited access to formal schooling
Disabilities: over 600 million people have a disability, two-thirds live in low-income countries. Evidence suggests weak literacy skills
Migrants: dramatic growth within and between countries
Rural residents: disparities are greater in poorer countries with low overall literacy rates (44% rural vs 72% urban in Pakistan)
Where poverty rates are higher, literacy rates tend to be lower
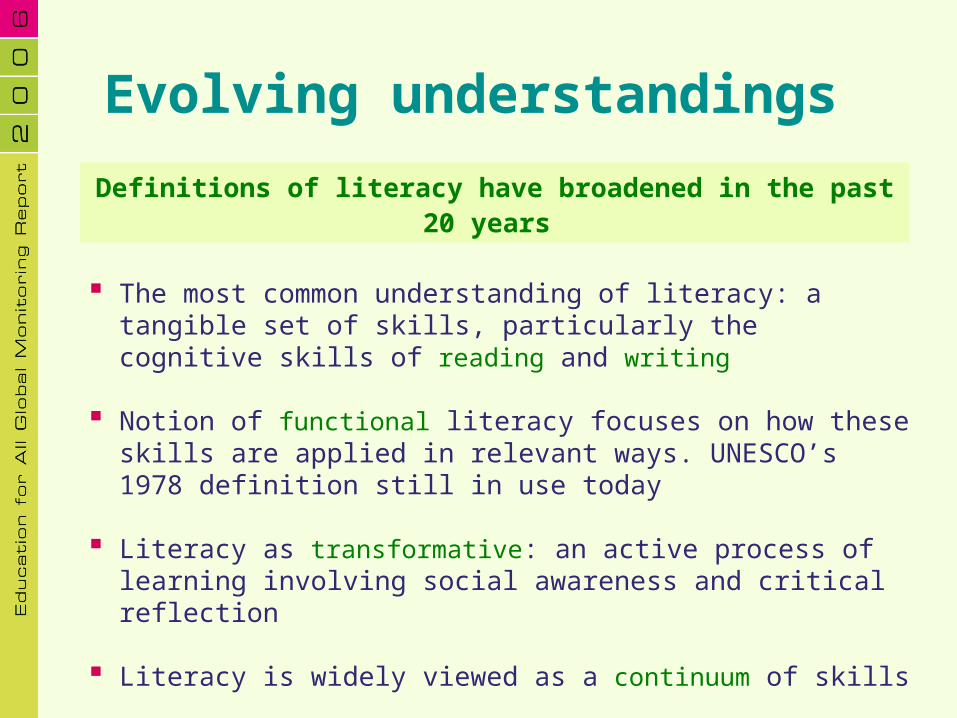
Evolving understandings
The most common understanding of literacy: a tangible set of skills, particularly the cognitive skills of reading and writing
Notion of functional literacy focuses on how these skills are applied in relevant ways. UNESCO’s 1978 definition still in use today
Literacy as transformative: an active process of learning involving social awareness and critical reflection
Literacy is widely viewed as a continuum of skills
Increasing reference is made to the importance of rich literate environments
Definitions of literacy have broadened in the past 20 years
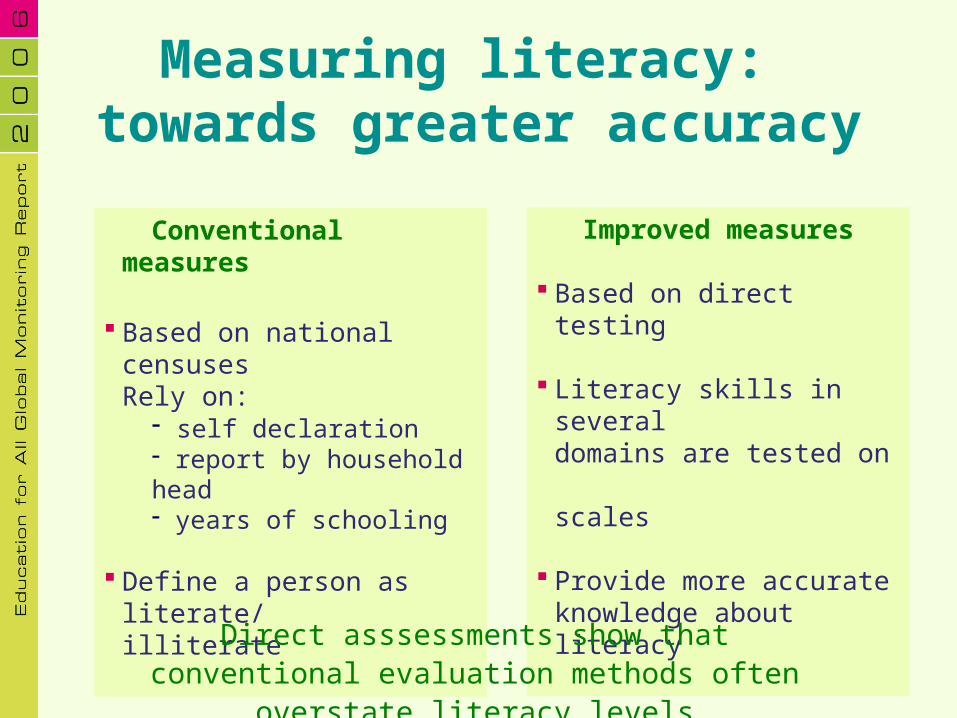
Measuring literacy: towards greater accuracy
Conventional measures
Based on national censusesRely on:
self declaration report by household head years of schooling
Define a person as literate/illiterate
Improved measures
Based on direct testing
Literacy skills in severaldomains are tested on scales
Provide more accurateknowledge about literacy
Direct asssessments show that conventional evaluation methods often overstate literacy
levels
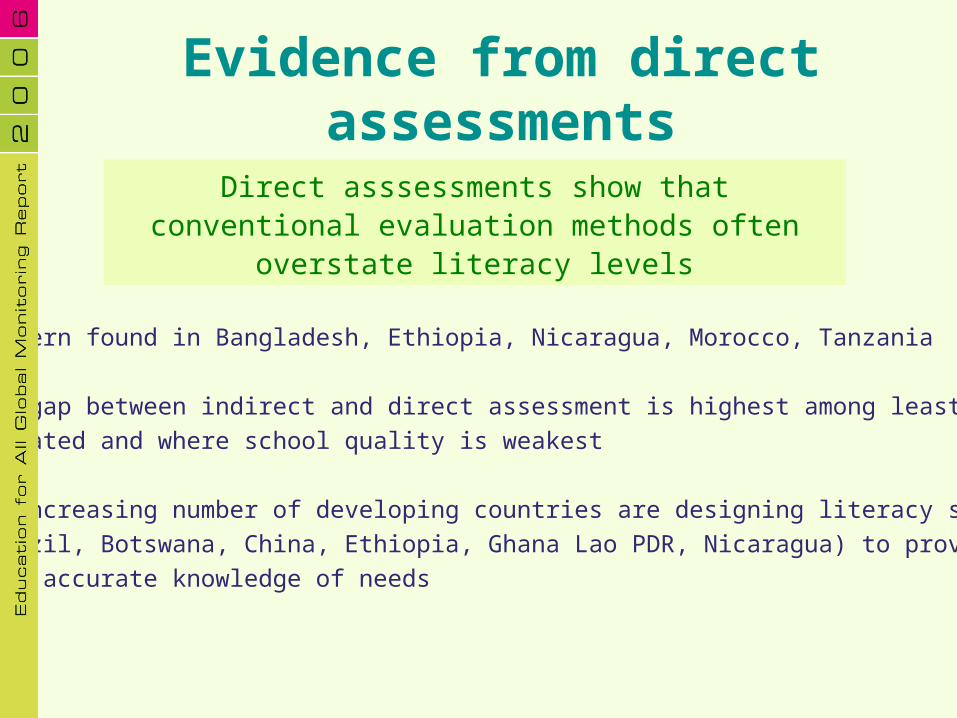
Evidence from direct assessments
Pattern found in Bangladesh, Ethiopia, Nicaragua, Morocco, Tanzania
The gap between indirect and direct assessment is highest among least educated and where school quality is weakest
An increasing number of developing countries are designing literacy surveys (Brazil, Botswana, China, Ethiopia, Ghana Lao PDR, Nicaragua) to provide more accurate knowledge of needs
Direct asssessments show that conventional evaluation methods often overstate literacy
levels
National coordination
Partnerships
Literacy educators
Good curricula
Language policy
Public spending
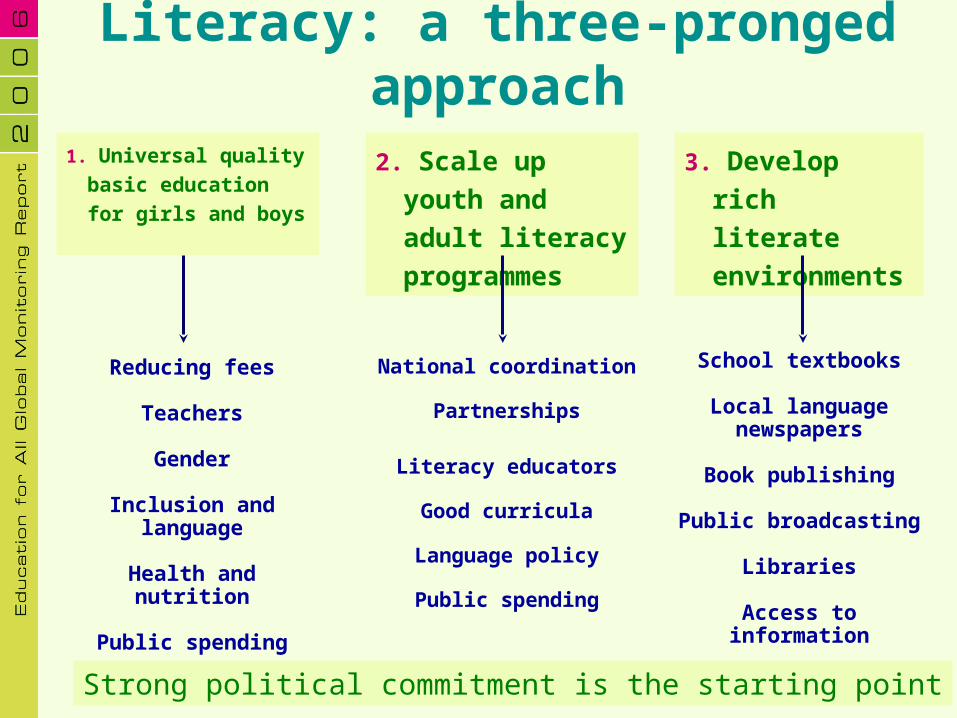
Literacy: a three-pronged approach
1. Universal quality basic education for girls and boys
2. Scale up youth and adult literacy programmes
3. Develop rich literate environments
Reducing fees
Teachers
Gender
Inclusion and language
Health and nutrition
Public spending
School textbooks
Local languagenewspapers
Book publishing
Public broadcasting
Libraries
Access to information
Strong political commitment is the starting point
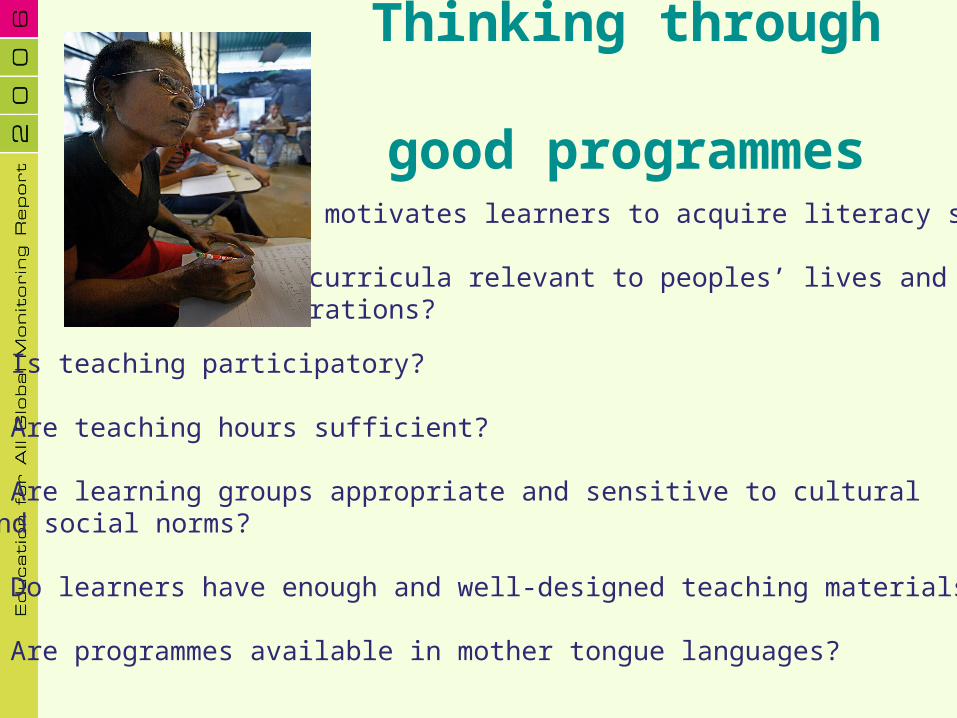
Thinking through
good programmes What motivates learners to acquire literacy skills?
Are curricula relevant to peoples’ lives and aspirations?
Is teaching participatory?
Are teaching hours sufficient?
Are learning groups appropriate and sensitive to culturaland social norms?
Do learners have enough and well-designed teaching materials?
Are programmes available in mother tongue languages?
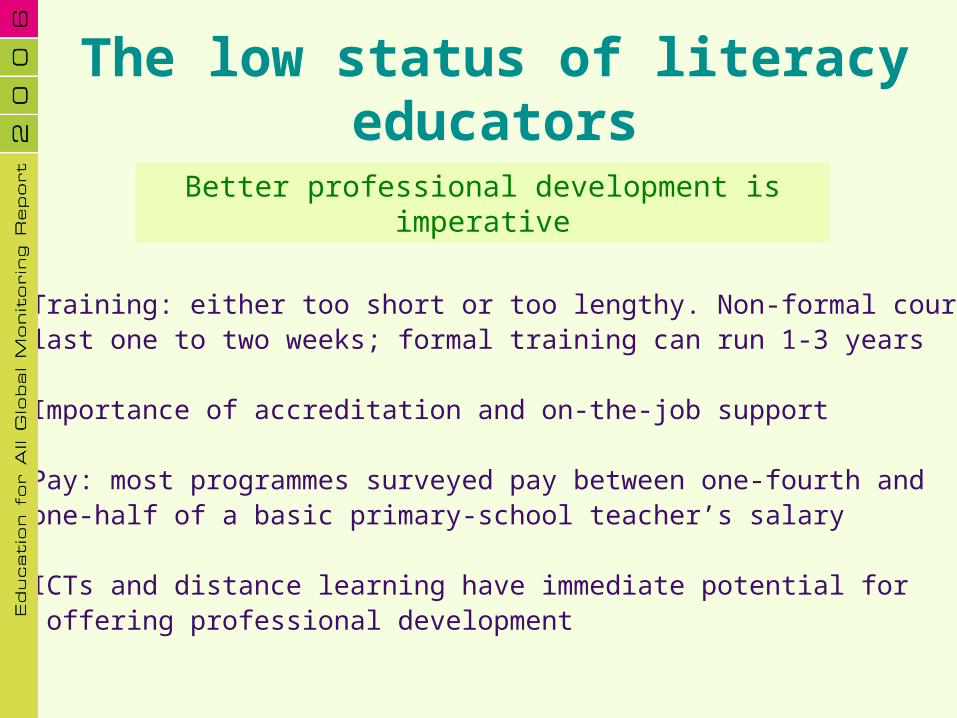
The low status of literacy educators
Better professional development is imperative
Training: either too short or too lengthy. Non-formal courses last one to two weeks; formal training can run 1-3 years
Importance of accreditation and on-the-job support
Pay: most programmes surveyed pay between one-fourth andone-half of a basic primary-school teacher’s salary
ICTs and distance learning have immediate potential for offering professional development
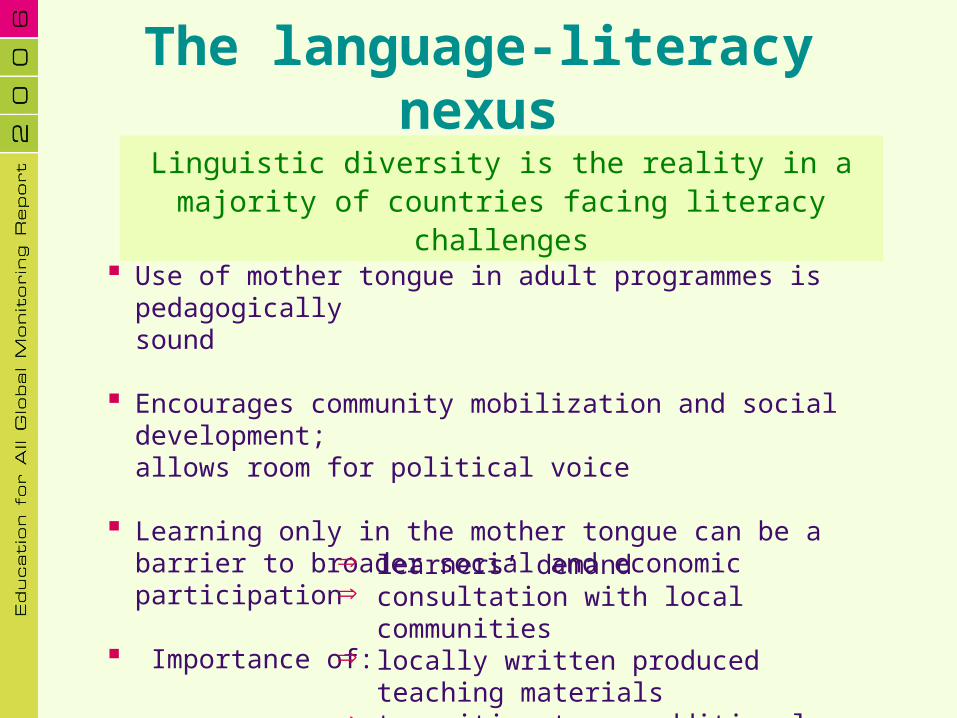
The language-literacy nexus
Linguistic diversity is the reality in a majority of countries facing literacy challenges
Use of mother tongue in adult programmes is pedagogicallysound
Encourages community mobilization and social development; allows room for political voice
Learning only in the mother tongue can be a barrier to broader social and economic participation
Importance of:
learners’ demand consultation with local communities locally written produced teaching
materials transition to an additional language
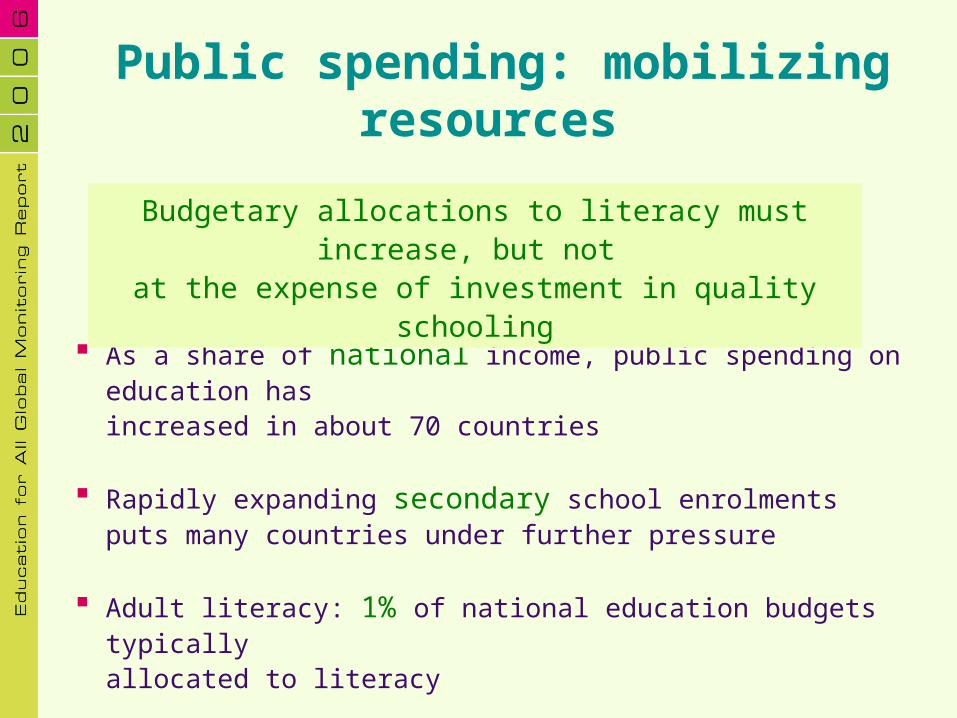
Public spending: mobilizing resources
As a share of national income, public spending on education hasincreased in about 70 countries
Rapidly expanding secondary school enrolments puts many countries under further pressure
Adult literacy: 1% of national education budgets typicallyallocated to literacy
Budgetary allocations to literacy must increase, but not
at the expense of investment in quality schooling
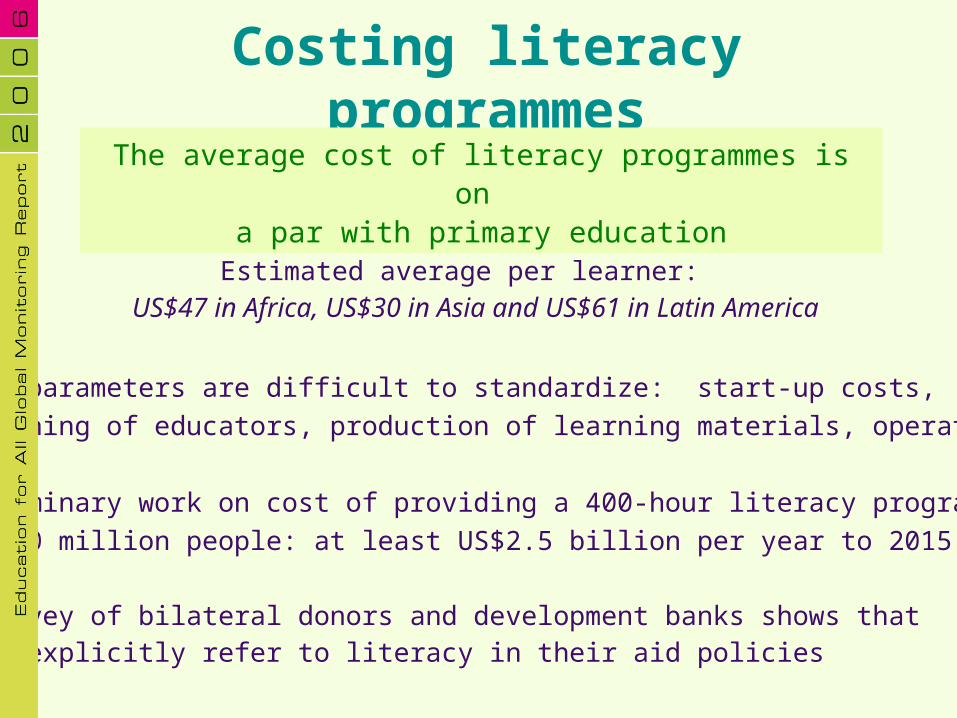
Costing literacy programmes
Estimated average per learner: US$47 in Africa, US$30 in Asia and US$61 in Latin
America
Cost parameters are difficult to standardize: start-up costs, training of educators, production of learning materials, operating costs
Preliminary work on cost of providing a 400-hour literacy programmeto 550 million people: at least US$2.5 billion per year to 2015
A survey of bilateral donors and development banks shows that few explicitly refer to literacy in their aid policies
The average cost of literacy programmes is on a par with primary education
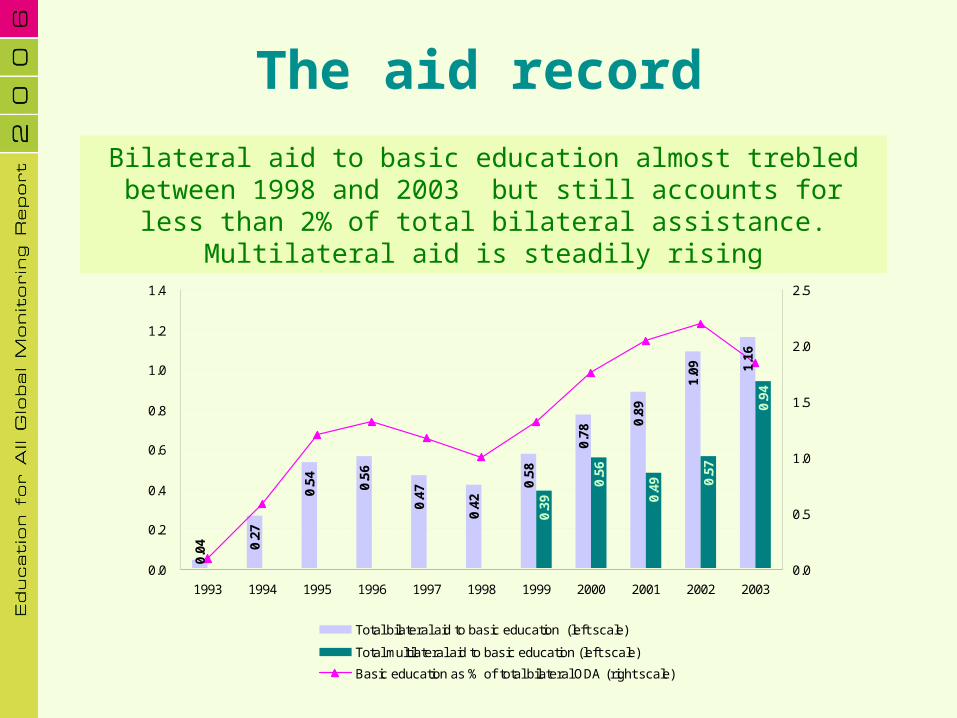
The aid record
Bilateral aid to basic education almost trebled between 1998 and 2003 but still accounts for less than 2% of total
bilateral assistance. Multilateral aid is steadily rising0.
04 0.27
0.54 0.56
0.47
0.58
0.78
0.89
1.09 1.
16
0.42 0.
49 0.57
0.94
0.56
0.39
0.0
0.2
0.4
0.6
0.8
1.0
1.2
1.4
1993 1994 1995 1996 1997 1998 1999 2000 2001 2002 2003
0.0
0.5
1.0
1.5
2.0
2.5
Total bilateral aid to basic education (left scale)
Total multilateral aid to basic education (left scale)
Basic education as % of total bilateral ODA (right scale)
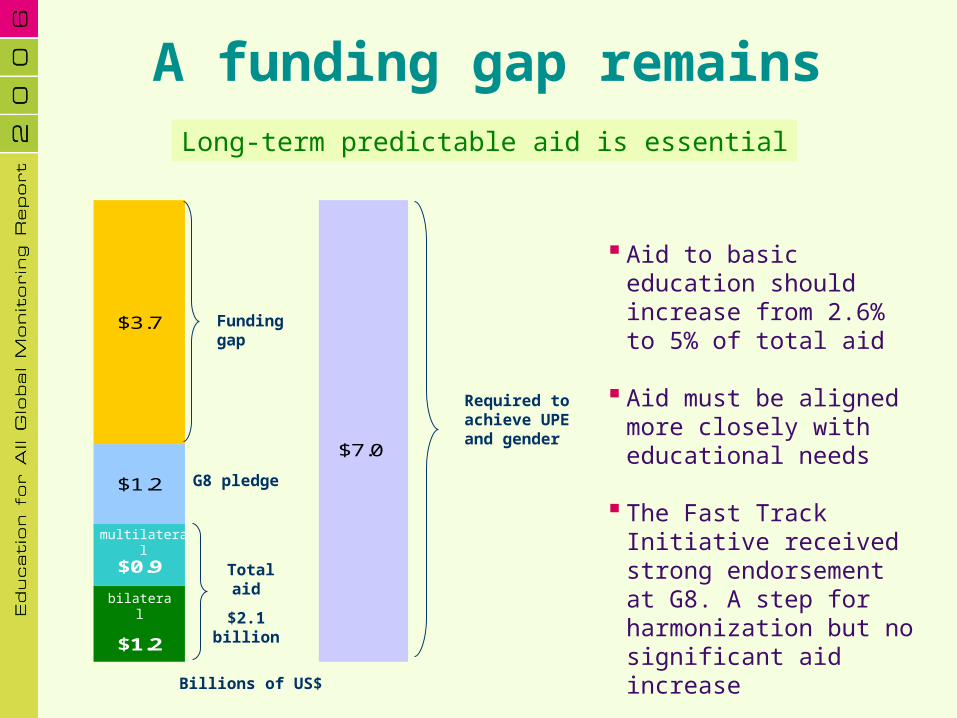
A funding gap remainsLong-term predictable aid is essential
Aid to basic education should increase from 2.6% to 5% of total aid
Aid must be aligned more closely with educational needs
The Fast Track Initiative received strong endorsement at G8. A step for harmonization but no significant aid increase
$0.9
$1.2
$1.2
$7.0
$3.7
Total aid
$2.1 billion
G8 pledge
multilateral
bilateral
Funding gap
Required to achieve UPE and gender
Billions of US$
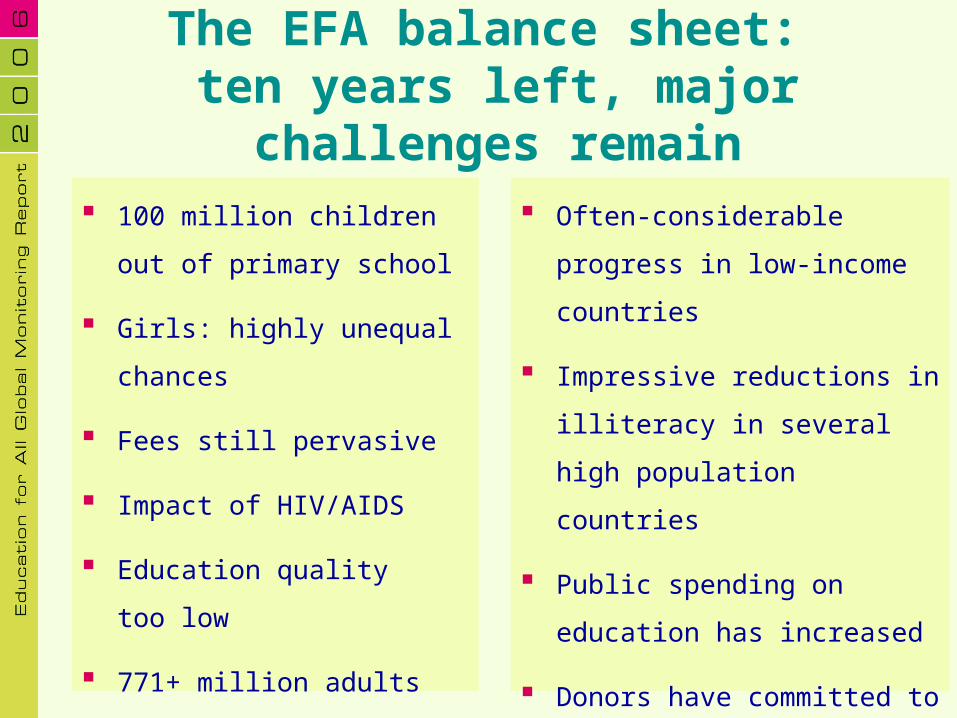
The EFA balance sheet: ten years left, major challenges
remain 100 million children out
of primary school
Girls: highly unequal
chances
Fees still pervasive
Impact of HIV/AIDS
Education quality
too low
771+ million adults
without literacy skills
Often-considerable
progress in low-income
countries
Impressive reductions in
illiteracy in several high
population countries
Public spending on
education has increased
Donors have committed to
increase their aid
Contact Information
EFA Global Monitoring Report Teamc/o UNESCO
7, place de Fontenoy75352 Paris 07
France
Related Documents