Submitted to LVC Listeners’ Sensitivity to the Frequency of Sociolinguistic Variables William Labov, Sharon Ash, Maya Ravindranath, University of Pennsylvania Tracey Weldon, University of South Carolina Maciej Baranowski, University of Manchester Naomi Nagy, University of New Hampshire Introduction Over the past 40 years, studies of linguistic variation have produced a great deal of data on the regular social and stylistic stratification of sociolinguistic variables. 1 Fine- grained differences have been observed and replicated in the production of stable sociolinguistic variables like (ING), (DH), or Spanish (S), with significant differences between four or five social levels and four or five stylistic levels (Labov 1966, Trudgill 1974, Cedergren 1973, Weinberg 1974). Figure 1 is a typical product of such studies: the graphic representation of a cross-tabulation of the social and stylistic stratification of (ING) in NYC. The vertical axis is the frequency of the non-standard apical variant in the 1 This paper was presented at the 2006 Annual Meeting of NWAV in New York City. Support from NSF under Grant ___________ is gratefully acknowledged. We are particularly indebted to Dan Swingley and Virginia Richards for helpful insights on the interpretation of the mathematical form of our results.

Welcome message from author
This document is posted to help you gain knowledge. Please leave a comment to let me know what you think about it! Share it to your friends and learn new things together.
Transcript

Submitted to LVC
Listeners’ Sensitivity to the Frequency
of Sociolinguistic Variables
William Labov, Sharon Ash, Maya Ravindranath, University of Pennsylvania
Tracey Weldon, University of South Carolina
Maciej Baranowski, University of Manchester
Naomi Nagy, University of New Hampshire
Introduction
Over the past 40 years, studies of linguistic variation have produced a great deal
of data on the regular social and stylistic stratification of sociolinguistic variables.1 Fine-
grained differences have been observed and replicated in the production of stable
sociolinguistic variables like (ING), (DH), or Spanish (S), with significant differences
between four or five social levels and four or five stylistic levels (Labov 1966, Trudgill
1974, Cedergren 1973, Weinberg 1974). Figure 1 is a typical product of such studies: the
graphic representation of a cross-tabulation of the social and stylistic stratification of
(ING) in NYC. The vertical axis is the frequency of the non-standard apical variant in the
1 This paper was presented at the 2006 Annual Meeting of NWAV in New York
City. Support from NSF under Grant ___________ is gratefully acknowledged. We are particularly indebted to Dan Swingley and Virginia Richards for helpful insights on the interpretation of the mathematical form of our results.

alternation of /in/ and /ing/ in unstressed syllables, and the horizontal axis orders
contextual style by the relative degree of attention paid to speech.2 The cross-tabulation
suggests that if the data sets were expanded further, even finer degrees of differentiation
could be achieved. The underlying regularity reflects an independent and linear effect of
social status and formality on use of the prestige variant and social status and formality,
as shown by this formula
(1) (ING) = a + b * SEC + c * ATS
where SEC = socio-economic class and ATS = attention paid to speech
A multiple regression analysis of the data using SEC and ATS as independent
variables produces the results of Table 1. Here the residual factor for SEC is Lower
Class, and for ATS, Reading Style. All factors are significant and account for 83% of the
variance. Entering these coefficients into formula (1), we obtain the expected values of
Figure 2. Indications of a floor effect in Figure 1 are confirmed by the fact that the
expected values project below 0. Nevertheless, Figure 2 confirms the expectation of
regular and independent effects of style and social class. Since style is an ordinal rather
than an interval scale, the even spacing along the horizontal axis is a matter of
convention. We can say that each increment in social status is accompanied by an
increment in use of the prestige variable and each increment in attention paid to speech is
accompanied by a similar increase, with all indications that these relationships are
approximately linear.
2 It should be clear from the many discussions of the underlying basis of style
shifting that this is a way of organizing the style shifting that takes place within the interview context, rather than a theory about the over-all organization of style in every-day life (Eckert and Rickford 19??).
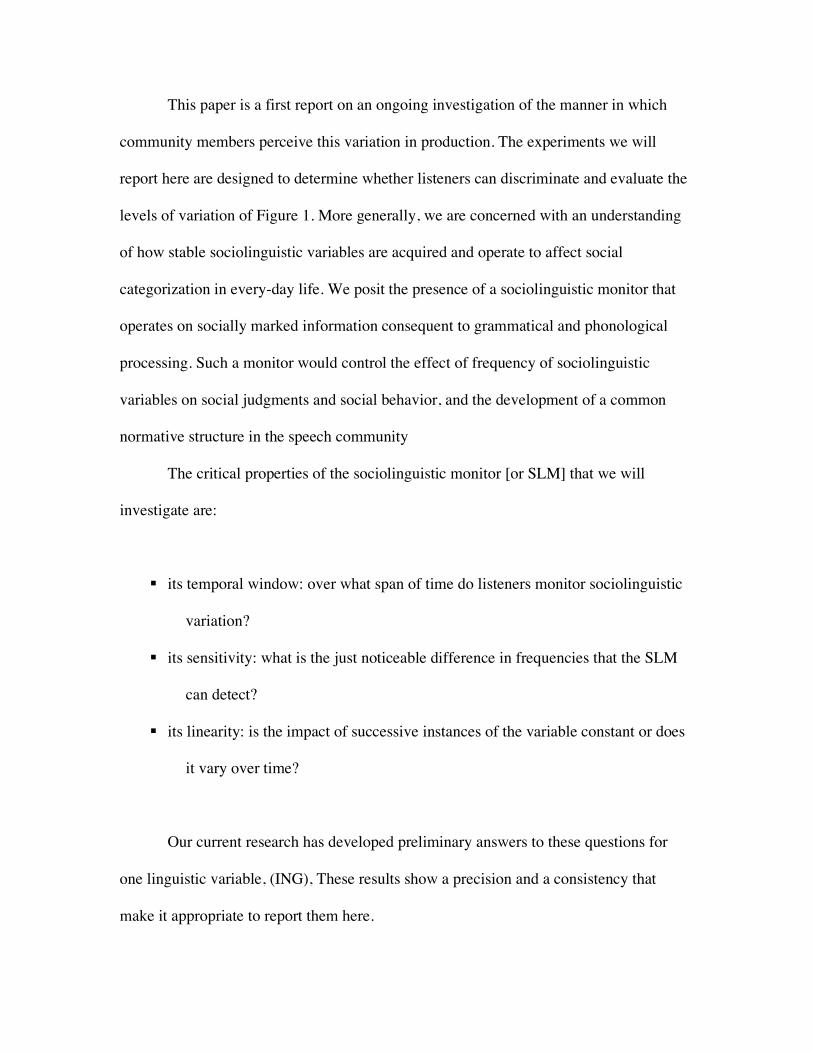
This paper is a first report on an ongoing investigation of the manner in which
community members perceive this variation in production. The experiments we will
report here are designed to determine whether listeners can discriminate and evaluate the
levels of variation of Figure 1. More generally, we are concerned with an understanding
of how stable sociolinguistic variables are acquired and operate to affect social
categorization in every-day life. We posit the presence of a sociolinguistic monitor that
operates on socially marked information consequent to grammatical and phonological
processing. Such a monitor would control the effect of frequency of sociolinguistic
variables on social judgments and social behavior, and the development of a common
normative structure in the speech community
The critical properties of the sociolinguistic monitor [or SLM] that we will
investigate are:
its temporal window: over what span of time do listeners monitor sociolinguistic
variation?
its sensitivity: what is the just noticeable difference in frequencies that the SLM
can detect?
its linearity: is the impact of successive instances of the variable constant or does
it vary over time?
Our current research has developed preliminary answers to these questions for
one linguistic variable, (ING), These results show a precision and a consistency that
make it appropriate to report them here.

The (ING) variable is the alternation of the apical /in/ and velar /ing/ variants in
unstressed syllables. The regular stylistic and social stratification of Figure 1 is found
across most English speech communities (New England: Fischer 1958; Philadelphia:
Cofer 1972; Norwich: Trudgill 1974, Northern Ireland: Douglas-Cowie 1978; Misssouri:
Mock 1979; Great Britain and U.S.: Houston 1985; Australia: Peterson 1965; Ulster:
Kingsmore 1995).
As a sociolinguistic variable, it is a recognized stereotype (“dropping the g”), and
it is overtly and accurately associated with informality.
Newscast Experiment 1: Sensitivity to Frequency The Newscast experiment was designed to test listener’s ability to detect and
judge the range of frequency of /in/ and /ing/ variants from 0 to 100%. The test passage is
a news broadcast (2) containing ten progressive –ing suffixes:
(2) The Newscast passage
•President Bush announced tonight that he was putting all available White House resources into support for the new tax cut bill.
•Democratic leaders of the House and Senate are preparing compromise legislation.
•Republican spokespersons predicted that record numbers of working-class Americans would be receiving tax refund checks before the end of the year.
•Senator Edward Kennedy’s staff announced that the tax cuts are creating a new elite who are excused from paying their fair share of the cost of government.
•At the Office of Management of the Budget, officials are trying to estimate the size of the deficit that will be produced by the new legislation.
•Federal Reserve Board chairman Alan Greenspan stated that he was not confirming that tax cuts would lead to a change in prime interest rates, nor was he denying it.
•The Washington Post is publishing today a list of all members of Congress who will receive tax refunds greater than $1,000 as a result of the proposed tax cuts.

The stimuli were recorded in a sound-proof booth. The speaker was asked to read
the passage first with consistent /ing/ forms for each italicized progressive and then with
consistent /in/. The speaker performed as many takes as necessary to obtain natural-
sounding speech. The stimuli were then constructed by editing the speech signal in Praat.
The best productions of the passage were selected, splicing as needed to produce one best
version of the passage. An alternative version for each sentence or phrase containing one
token of the variable was produced by replacing the token with the best production of its
alternative variant. The phrases and sentences were then concatenated in the order
needed to produce the desired sequence of variants of ING. Thus the stimulus passages
are exactly the same except for the variable of interest, with frequencies of /ing/ ranging
from zero to 100%.
Newscast Experiment 1 was administered to a group of 23 U. of Pennsylvania
undergraduates, with instruction shown as (3)
(3) A young woman from Philadelphia has been studying to be a newscaster,
and has applied for a job with a local radio station. Here are five versions
of a trial newscast that she read to submit with her job application. Would
you please rate each one on the following scale by putting a check in one
box.
Perfectly l Try some other professional line of work /_____ / _____ / ______ / ______ / ______ / ______ / ______ /

Results of the first group experiment are shown in Figure 3, with mean
frequencies of /in/ at 0, 30, 50 , 70 and 100%. The horizontal axis is the percent of /in/,
from 0 to 100%, and the vertical axis the mean ratings on the scale just shown, with
better performance at the bottom and worse performance at the top. This first experiment
was designed to test the effect of sequences of the same variant as opposed to alternating
and the two 50% passages had blocks of five /ing/ first (50a) or five /in/ first (50b). The
small differences between them show a t-test probability of .066.
Logarithmic progression
An inspection of Figure 3 suggests that the distribution by frequency follows a
logarithmic progression. Figure 4 superimposes a logarithmic trend line on Figure 3, with
the two 50% ratings averaged together. The slope is 1.44, and the fit is quite close, with
an r-square of .97, indicating that 97% of the variance from the over-all mean is
explained by the logarithmic function, with only 3% noise. For the trial with zero /in/
forms, the rating of 1.7 is close to “Perfectly professional.” With 30% /in/, the mean
reating jumps to 4.1. However, this fit is heavily weighted by one value, the 0% mean.
Figure 5 shows that if we exclude this point, the other four are a good fit to a linear
relation, r2 = .89.
Newscast Experiment 2 was designed to test the logarithmic relation more closely
by inserting two more points with the same speaker at the lower end of the /in/ scale:
10% and 20% and using a single 50% trial with alternating /in/ and /ing/. The result for
36 undergraduate Penn subjects is shown in Figure 6. The fit is excellent, with an r2 of
.96 and a similar slope of 1.52.

Gender differences
The 36 subjects included 25 females and 11 males. Figure 7 shows that both sub-
groups follow the logarithmic curve closely, with r2 of .94 and .99. The females have a
lower intercept of 1.66, indicating a greater appreciation of the 0% /in/ performance, and
a higher slope of 1.62 as opposed to 1.47 for the males. This fits with other indications
that women show steeper slopes of style shifting and put greater weight on sociolinguistic
variables of this type (Labov 1966, Trudgill 1974).
T-tests show that the differences between any two male and female values are
small, and lack significance. But since they are all in the same direction, we can follow R.
A. Fischer (1925) to obtain the over-all significance of the gender difference by adding
the logs of each p-values. Minus twice this sum chi-square for the over-all relationship,
which is 25, with a probability of .0003.
Testing individual subjects: Newscast Experiment 3
In the group experiments, subjects had available a choice of seven ratings, and
could not register distinctions smaller than these. Newscast Experiment 3 used individual
subjects and a technique of magnitude estimation (Bard et al. 1996) which allows subject
to determine their own scale of similarities and differences. The speaker, SA, was the
same as in Experiments 1 and 2. Figure 8 shows the format for Trial 1 of Newscast
Experiment 4. Subjects initiate each of the newscast trials by clicking on “Play”, and as
they listen, move the slider on a continuous scale to the right or left as they hear the
person reading the sentences with varying frequencies of /in/ and /ing/. The scale on the
right, extending to “Perfectly professional” showed higher values up to 1000. To the left,
the slider descended to a value of 0. A later report will deal with the coordination of

subject movements with the timing of the (ING) variants: here we will be concerned only
with the final slider position, and how the pattern compares to the group experiments
with seven discrete choices.
Figure 9 displays the overall results for 56 individual subjects. The match with the
logarithm relation is equally close, with r2 of .94. Four different orders of the stimuli was
systematically varied across subjects. The most aberrant point at 50% /in/ may be
connected with the fact that this 50% value was heard first in all orders as a point of
reference.
In Figure 10, we see that in Experiment 3, both genders replicate the logarithmic
curve, with the same high r2 values. Both show the relatively higher rating for the 50%
trial. The gender differences in Experiment 3 (Figure 10) are not quite the same as in
Experiment 2. Women again penalize the high frequencies of /in/ more than men do, but
in contrast they award a higher rating for the consistent use of /ing/. The series of non-
significant differences again add up to a significant one (excluding the first value). The
over-all pattern is that of a steeper slope of evaluation for women (-177 vs. -140), which
is characteristic of women’s behavior with the vowel variables of NYC (Labov 1966, Ch.
8)
Evaluation of (ING) in the South
The design of the current research project on the evaluation of sociolinguistic
variation includes several variables with limited regional distribution. The (ING) variable
however is quite general in the English-speaking world. To test the generality of the
logarithmic relationship exhibited by subjects in Philadelphia, we turned two our two
other sites: Columbia, South Carolina and Durham, New Hampshire.

The regional composition of the subject pool for Experiment 2 carried out at Penn
is shown in the first two columns of Table 2. The wide geographic range and the large
number of students with mixed background is characteristic of this university. At the
same time, there are relatively few subjects from New England or the South.
It is well established that the level of /in/ use in the Southern U.S. is higher than
in the North (Houston 1985). The apical variant is freely used by educated Southerners
even in formal situations. One may therefore ask if the same evaluative norms operate in
the South as in the North, and if there are differences, whether the logarithmic
relationship will be modified in Southern contexts. Weldon replicated Newscast
Experiment 2 with students at the University of South Carolina in Columbia, using the
same stimuli and format. The third and fourth columns of Table 2 show the regional
distribution of the USC subjects for Experiment . It is immediately apparent that the
regional concentration is much greater. Three quarters of the group are from the South,
and three quarters of these are from South Carolina.
Figure 11 shows that the USC judges produced a logarithmic relationship with an
r2 of .96, the same correlation as in Philadelphia. The evaluation of the frequency range
of (ING) is therefore governed by the same factors that operate among the Penn subjects.
There however two differences between the two regions. When we superimpose the
ratings of USC subjects on the results for Philadelphia in Figure 12, a significant
difference in the slopes of the curves appears. The Columbia subjects exhibit a lower
slope than Philadelphia, indicating that a reduction in the evaluation of (ING) variants.
The major difference is that greater uses of are downgraded less, indicating that the

pressure to use /ing/ in formal settings is much less than in the North. This matches
observations of the relatively high use of /in/ in formal contexts by Southern speakers.
The Columbia subjects also differ from the Philadelphia subjects in regard to
gender. No differences appear in the reactions of male and female judges in the Columbia
experiment.
Experiment 4: Southern evaluations of Northern vs. Southern speakers
Differences in the evaluation of (ING) is only one of many differences between
Northern and Southern speech patterns.We now raise the question as to how the
evaluation of (ING) interacts with such differences. All of the results presented so far for
Experiment 2 are evaluations of the performance of SA, a conservative speaker of the
Chicago dialect.3 To explore further the general mechanism that produces the logarithmic
progressions of Experiments 1-3, Experiment 4 embedded the alternation of /in/ and /ing/
in a radically different context, speech embodying the characteristic regional features of
the South. For this purpose, Weldon recorded JB, a local white educated speaker raised in
the city of Columbia. Like SA, JB was instructed to read the newscast text in his native
speech pattern, but consistent /ing/ for the progressive participles in one reading, and
consistent /in/ in a second reading. The newscast trials were then prepared by splicing
JB’s /in/ and /ing/ in the various proportions into [Sherry: characterize the carrier speech
pattern as primarily from the /in/ or /ing/ reading].
The most marked dialect features in which JB’s speech differed from that of SA
are as follows:
3 We have no reason to believe that the Chicago articulations of the (ING)
variants differs from that produced by speakers in other regions of the U.S.

a. Monophthongization of /ay/ before voiced segments (variable)
b. Moderate activation of the Southern Shift (Labov, Ash and Boberg 2006) in
centralized and lowered nucleus of /ey/ and fronted and raised /e/, along with
slight inglides for /e/ and /i/.
c. Strongly fronted nucleus of /aw/ and /uw/, with moderate fronting of /ow/ as
compared to back of center nuclei for all /Vw/ vowels for SA.
d. Fronted /√/ as opposed to back forms for SA.
e. The characteristic voice qualifier of the southern Piedmont area.
Weldon carried out the Experiment 4 with a group of 55 USC undergraduates
judges, who evaluated the seven Newscast trials with varying frequency of (ING) spoken
by JB. Figure 13 displays a remarkable coincidence of the results of Experiment 3S and
4S. The figure superimposes the evaluations of the (ING) trials performed by JB and
those performed by the Northern speaker SA. Both results once again show a closefit to
the logarithmic progressions with r2s of .96 and .98. Both show the characteristic shallow
slopes first observed in Experiment 3S, with observe coefficients not far from 1. Thus
Columbia judges differed from the Philadelphia judges in their evaluation of (ING) in a
manner independent of the constant dialect characteristics in the seven trials. It is
therefore evident that the experiments succeeded in isolating the effects on the
sociolinguistic monitor of the variable (ING). The underlying pattern of response to
shifting levels of (ING) is independent of the speaker and their other sociolinguistic
characteristics.

Evaluation of (ING) by University of New Hampshire subjects
The third regional site for the current research is the University of New
Hampshire at Durham. Nagy carried out Experiment 2 at the University of New
Hampshire, tp pbtaom UNH students’ evaluation of variable frequencies of the use of /in/
by SA, the same speaker as in Experiments 1 and 2 in Philadelphia. The results shown in
Figure 14 were a marked deviation from previous experiments. It is immediately obvious
that the responses did not follow the logarithmic progression found in other areas. The
mean ratings of 70% and 100% /in/ are much lower than would be expected—that is
closer to the “Pefectly professional” rating than in Philadelphia or Columbia.
Before concluding that New Hampshire subjects were exceptional in this respect,
Naomi replicated Experiment 2 under the exact same conditions with two other groups of
students. The combined results shown in Figure 15 returned us to the expected
logarithmic progression, with an r2 of .92. At the same time, we recognize that the New
Hampshire subjects exhibit a shallower slope of differentiation (1.07), similar to that
found at Columbia (1.17, 1.04). Unlike Columbia, the UNH students replicated the
characteristic difference between males and females in Figure 16, with females showing a
steeper slope of social marking of /in/, 1.14 for women as against .73 for males.
All three replications of Experiment 2 in New Hampshire indicate that the New
Englanders, like Southerners, are more moderate than the Philadelphia in their use of the
7-point scale to penalize speakers for their use of /in/ in the broadcast trials. The slopes of
the logarithmic progression are in the neighborhood of 1.0, and do not approach the 1.5
region characteristic of the Philadelphia speakers.

Understanding the logarithmic progression.
The logarithmic progresion found in Figures 4, 6, 7, 9, 10, 11, 12, 13, 15, 16
cannot be derived from any of the data on speech production. These uniform results must
depend upon some fundamental property of speech perception, perhaps specific to the
sociolinguistic monitor, perhaps based on more general properties of perception. The
question arises, why a logarithmic progression? One direction of explanation is
suggested by the fact tha the logarithm is the integral of 1/x as in (3), suggesting that the
function 1/x plays a role in generating this relationship.
(4)
In all of the results shown so far, the first occurrence of /in/ in a series has the
greatest effect upon the evaluation of the speaker’s performance, and each successive
occurrence has a proportionately lower effect. If we acknowledge that /in/ is a deviation
from expected performance in the newscast trials, we can say that the negative rating
increases for each deviation by the proportionate increase in the sum of deviations. Given
one deviation, the second represents a 100% increase in the sum, the third a 50%
increase, the 11th a 10% increase. In other words, a given deviation increases the effect by
1 over the current sum of deviations.
If we are asked to predict the effect of any one occurrence of an apical variant in
the Newscast experiment, we begin with the hypothesis that the effect of the ith deviation
on the perception of the distance from the norm is a function of the proportional increase
!
ln(x) =dx
x1
n
"

in the total number of deviations, so that Delta-E, the change in the over-all effect, equals
b/(i-1).
(4)
The inverse function is multiplied by b, a factor that is equivalent to the slope of
the logarithmic or linear curve. As we have seen, this can vary from region to region
without any change in the lawful relationship found generally.
If the impact coefficient is 1, the 4th deviation adds 1/3 to the total effect, the 5th
deviation 1/4, and so on. If we ask, how can we predict the rating given to any one trial in
the (ING) experiment, we sum these calculations in the manner shown in (5), beginning
with another coefficient a. This is the rating given to a trial with no deviations—the best
effort.
(5)
or
(6)
We abbreviate the proportional increase series as S = ½ + 1/3 + ¼. . ..
What then is the relationship between the logarithmic function and the series S? It turns
out that the logarithm progression is a close approximation to the sum of that series. S
does not converge, but increases to infinity. The sum for a given number of terms is
approximated by ln(n) + γ. where g = .5772156649. . . (Euler’s constant). Figure 17
!
"E =b
i #1
!
E = a +b
1+b
2+b
3...= a + b* 1+
1
2+1
3...
"
# $
%
& '
!
E = a + b* S

shows how the logarithmic function modified by Euler’s constant merges with the
cumulative sum E. The E series fits the logarithmic function with an r2 of .9975. The
logarithmic calculation of course fits itself perfectly There is a gap at the beginning but at
20 terms, there is no discernible difference. Table 3 generates the results of Experiment 2
in Philadelphia by the E function with the initial constant a set at 2.00 (that is, the second
box on the seven-point scale) and the impact coefficient b set at 1.25. Chi-square of the
difference between these two series is very small, indicating no significant difference
between them.
Figure 18 plots the calculations of Table 3. The two curves are indistinguishable..
The logarithmic fits obtained in the reports of the experiments are practically identical
with the proportional series calculations of the E function.
Findings on the Sociolinguistic Monitor
The results of the experiments reported here can be summed up under four
characterizations of the sociolinguistic monitor, or SLM:
Within the limited range of our experiments, the temporal window of the SLM is
reasonably wide: it operates continuously across the time frame of the
experiment.
Our subjects show a striking consistency in their evaluation of sociolinguistic
variables, clearly sensitive to differences in frequency as small as 10%.
Response of the SLM to sociolinguistic variants is not symmetrical: it is sensitive
primarily to the number of marked forms rather than the number of unmarked
forms.

The response of the SLM is not linear, but proportional to the increase in the
number of marked forms observed.
We have also examined the sensitivity of the monitor to internal constraints on the
variable, which we will present in reports to come. In our continuing research, we are
expanding the range of variables at the three sites, examining responses to variation in
postvocalic /r/ and the monophthongization of /ay/, and responses of subjects of varying
ethnicity, age and education. Experiments with individual subjects will allow us to
specify the nature and timing of their response to individual deviations over time. The
preliminary results presented here should provide a framework for the further study of the
perception of linguistic variation and the operation of the sociolinguistic monitor.

References
Bard, Ellen, Dan Robertson and Antonella Sorace. 1996. Magnitude estimation of linguistic acceptability. Language 72:1-31.
Cedergren, Henrietta 1973. The interplay of social and linguistic factors in Panama. Cornell University dissertation.
Cofer, Thomas. 1972. Linguistic Variability in a Philadelphia speech community. U. of Pennsylvania dissertation.
Douglas-Cowie, Ellen. 1978. Linguistic code-switching in a Northern Irish village: social interaction and social ambition. In P. Trudgill (ed.), Sociolinguistic Patterns in British English. London: Edwin Arnold. Pp. 37-51.
Fischer, John L. 1958. Social influences on the choice of a linguistic variant. Word 14:47-56.
Fisher, R. A. 1925. Statistical Methods for Research Workers. Edingburgh: Oliver & Boyd.
Houston, Ann. 1985. Continuity and change in English morphology: the variable (ING). Ph. D. dissertation, University of Pennsylvania. Chapter 6: Establishing the continuity between past and present morphology, pp.220-286.
Kingsmore, Rona K. 1995. Ulster Scots Speech. Tuscaloosa: U. of Alabama Press. Labov, William, Sharon Ash and Charles Boberg. 2006 press. Atlas of North American
English: Phonology and Sound Change. Berlin: Mouton/de Gruyter. Labov, William. 1966. The Social Stratification of English in New York City. Washington
D.C.: Center for Applied Linguistics. Mock, Carol . 1979. The social maturation of pronunciation: a family case study. The
Rural Learner, 1:23-37. School of Education and Psychology, Southwest Missouri State University, Springfield, Missouri.
Peterson, Peter G. 1985. -ing & -in: The persistence of history? Paper given at ALS Annual Conference, Brisbane.
Trudgill, Peter. 1974. The Social Differentiation of English in Norwich. Cambridge: Cambridge University Press.
Weinberg, Maria Fontanella de. 1974. Un Aspecto Sociolinguistico del Espanol Bonaerense: la -S en Bahia Blanca. Bahia Blanca: Cuadernos de Linguisticca.

Figure 1. Social and stylistic stratification of (ING) in NYC (Labov 1966).

Figure 2. Expected values for (ING) in NYC produced by equation (1) with data
supplied by Table 1.
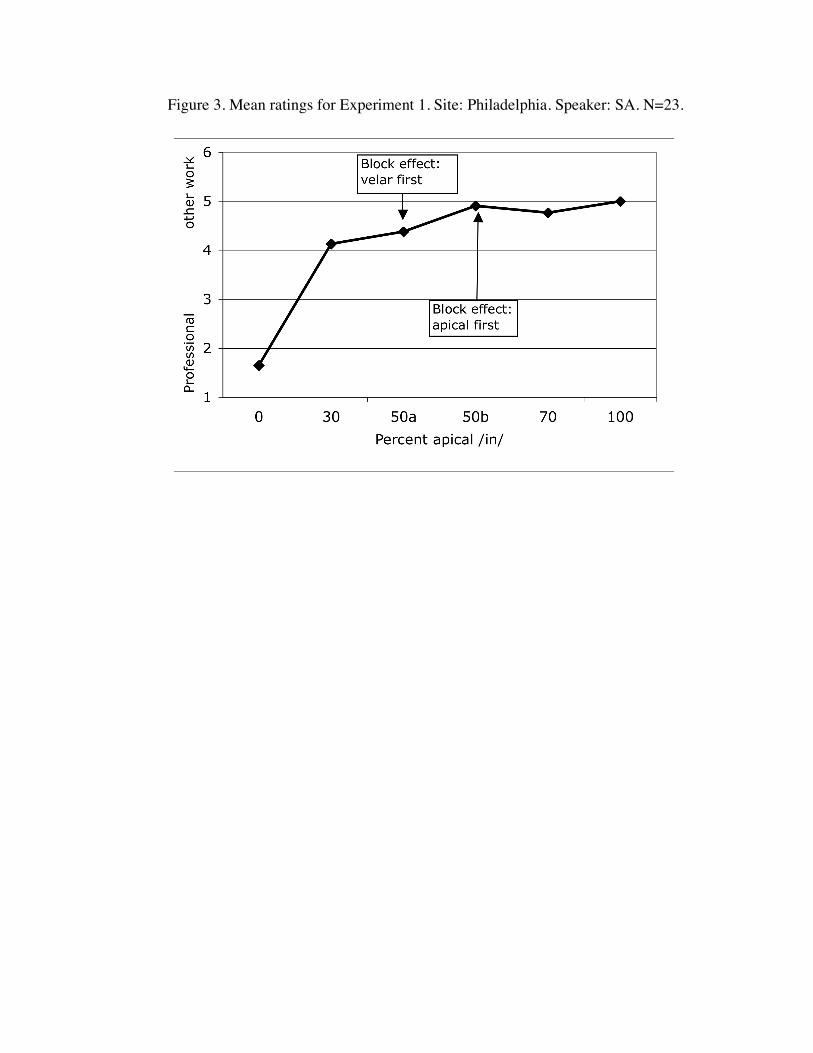
Figure 3. Mean ratings for Experiment 1. Site: Philadelphia. Speaker: SA. N=23.

Figure 4. Fit to logarithmic progression of data of Figure 3.

Figure 5. Approximation of Figure 4 to a linear relation with the zero point excluded.

Figure 6. Mean ratings of Newcast Experiment 2 with logarithmic progression. Site:
Philadelphia. N = 36.
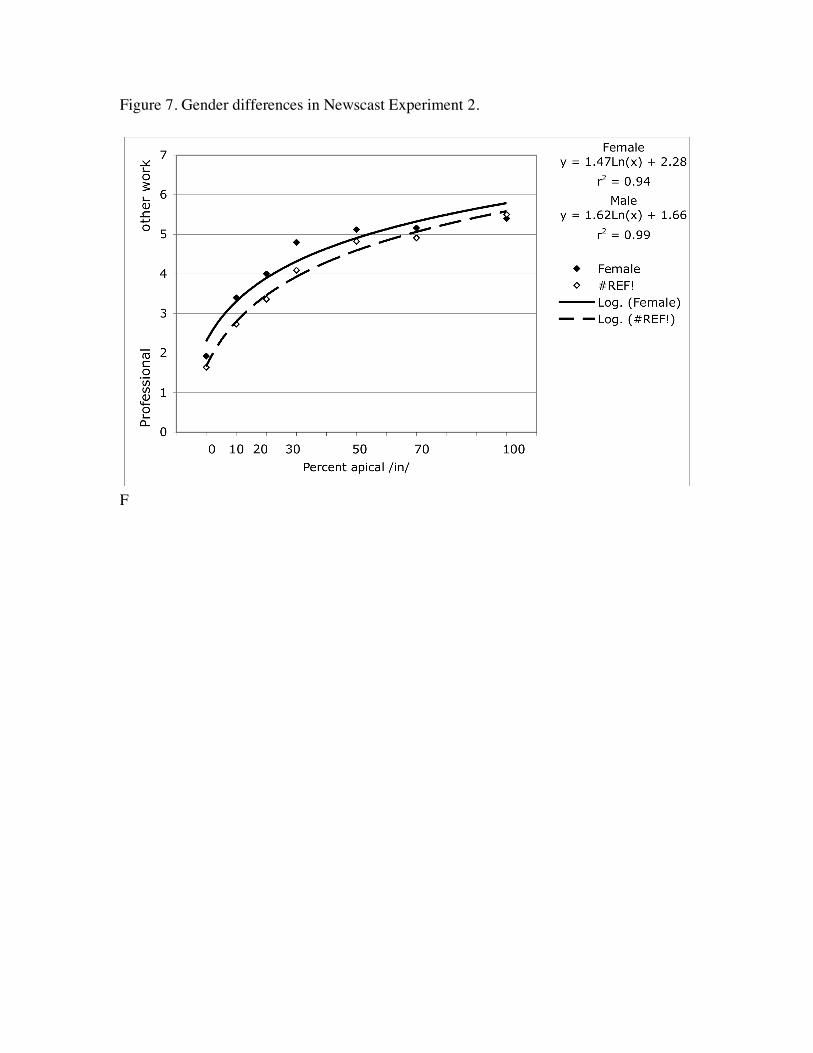
Figure 7. Gender differences in Newscast Experiment 2.
F

Figure 8. Design of individual Newscast Experiment 3 (Trial 1).

Figure 9. Mean ratings of individual subjects for Newscast Experiment 3
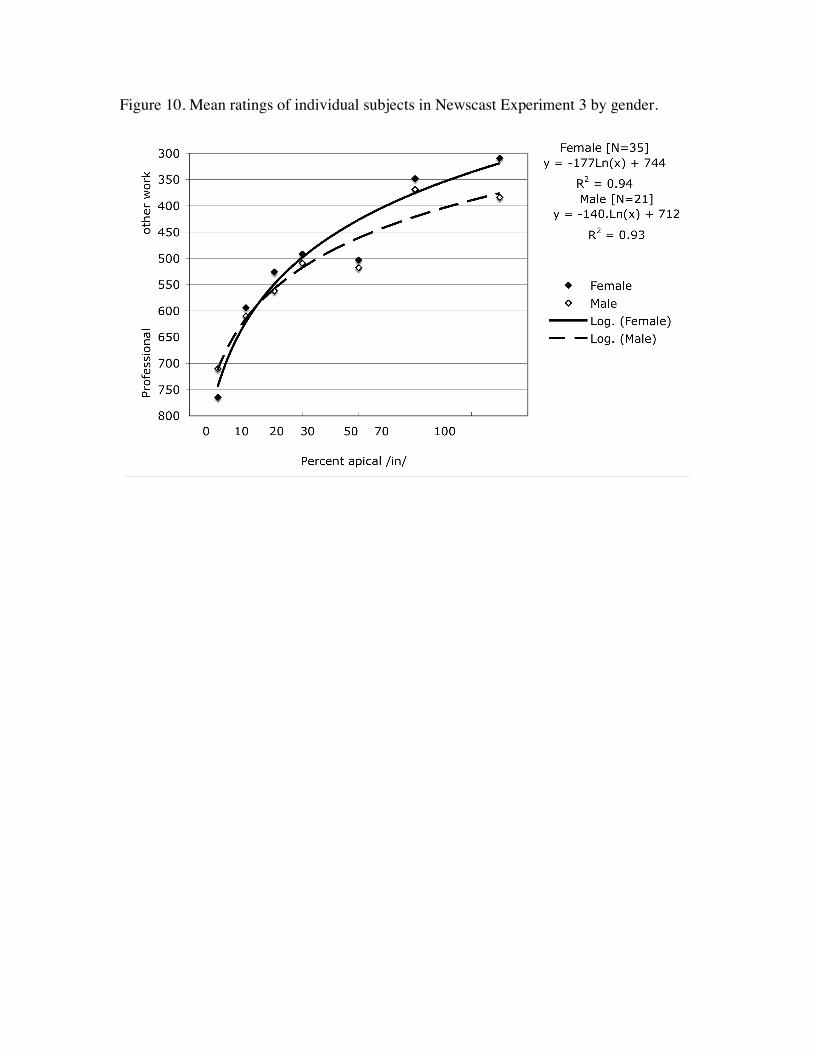
Figure 10. Mean ratings of individual subjects in Newscast Experiment 3 by gender.

Figure 11. Mean ratings for Newscast Experiment 2S at USC [N=56]

Figure 12. Comparison of Experiment 2 (Philadelphia) with Experiment 2S (Columbia)

Figure 13. Mean Columbia ratings of Columbia speaker JB in Experiment 4S compared
to mean Columbia ratings of Northern speaker SA in Experiment 3s
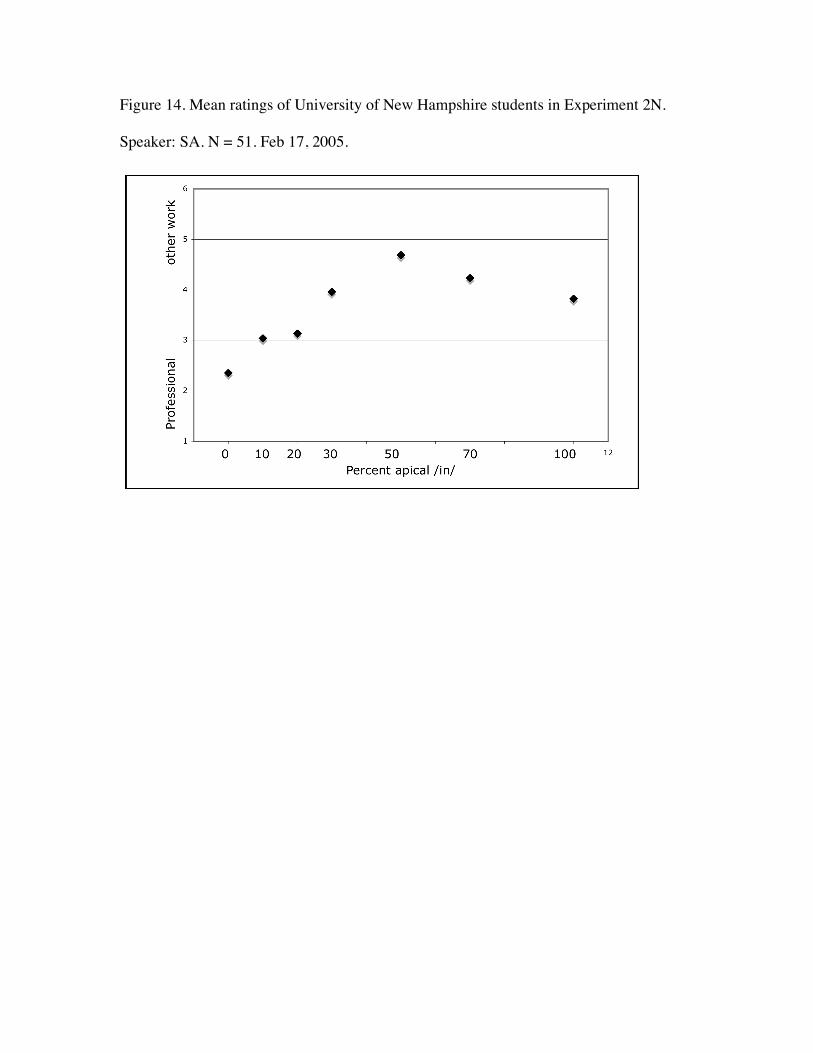
Figure 14. Mean ratings of University of New Hampshire students in Experiment 2N.
Speaker: SA. N = 51. Feb 17, 2005.
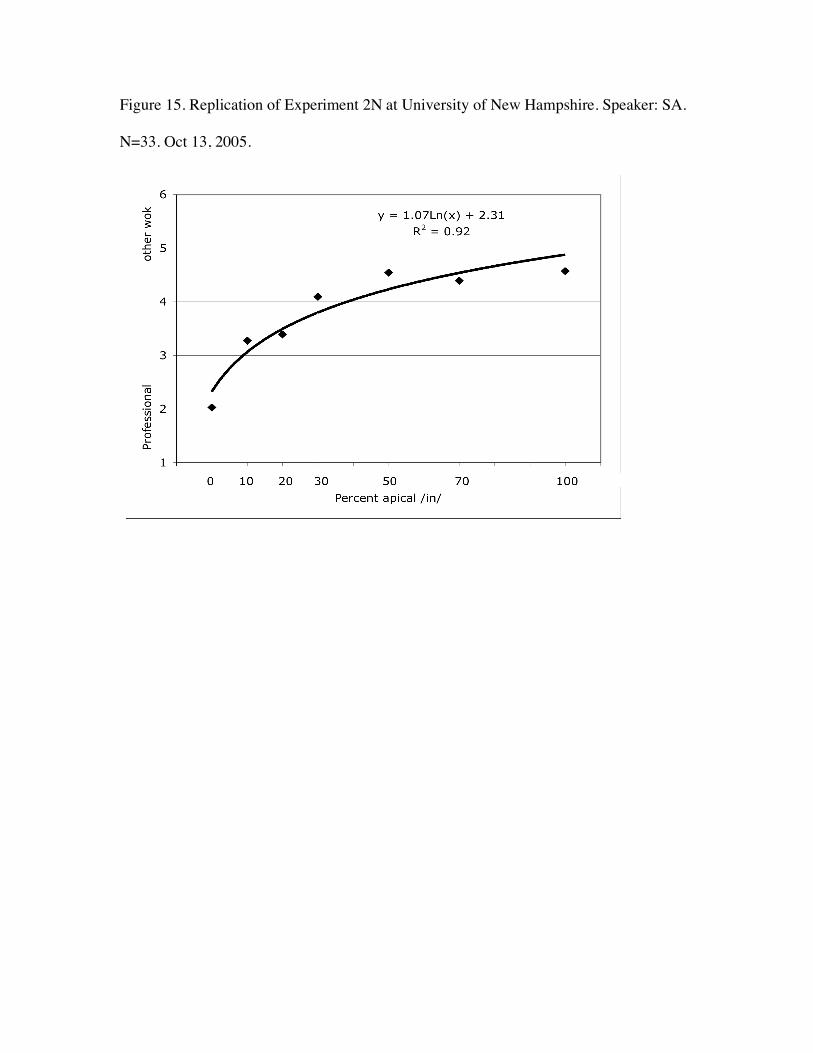
Figure 15. Replication of Experiment 2N at University of New Hampshire. Speaker: SA.
N=33. Oct 13, 2005.

Figure 16. Mean ratings of replicated Experiment 2N at University of New Hampshire by
gender.

Figure 17. Comparison of logarithmic function modified by Euler’s constant g with the
proportional error function E. g= .5772156649..

Figure 18. Comparison of the E function with a = 2.00 and b= 1.25 with the results of
Experiment 2.

Table 1. Multiple regression analysis of data of Figure 1.
Variable Coefficient s.e. of Coeff t-ratio prob Constant 34 6.8 5.01 0.0024 Upper Middle Class -47 7.9 -5.86 0.0011 Lower Middle Class -33 7.9 -4.18 0.0058 Working Class -22 7.9 -2.77 0.0324 Casual speech 33 6.9 4.91 0.0027 Careful speech 20 6.9 2.97 0.0249

Table 2. Regional distribution of subjects for Experiment 2
U. of Penn USC UNH Mid-Atlantic 14 2 0 Philadelphia and suburbs 8 NYC and suburbs 4 Other Mid-Atlantic 2 New England 1 43 New Hampshire 25 Massachusetts 9 Oher New England 9 North 2 3 Midland 1 1 South 6 41 Columbia 8 Charleston 2 Other South Carolina 3 24 Other South 7 West 3 2 Canada 1 1 Mixed 8 9 4 Total 39 55 51

Table 3. Generation of the results of Experiment by the E function with initial
contant = 2 and impact coefficient = 2.00
percent /in/
E
Experiment 2
00
2.00
1.83
10
3.25
3.19
20 3.88 3.81
30
4.29
4.58
40
4.60
50
4.85
5.03
60
5.06
70
5.24
5.08
80
5.40
90
5.54
100
5.66
5.44
Chi-sq = .056, n.s.
Related Documents