A Comparison of Variable Importance Measures for Two Independent Groups Lisa M. Lix, PhD P. Stat. School of Public Health Joint Seminar: Statistics and Collaborative Graduate Program in Biostatistics January 5, 2012

Lisa M. Lix, PhD P. Stat. School of Public Health Joint Seminar: Statistics and Collaborative Graduate Program in Biostatistics January 5, 2012.
Dec 21, 2015
Welcome message from author
This document is posted to help you gain knowledge. Please leave a comment to let me know what you think about it! Share it to your friends and learn new things together.
Transcript

A Comparison of Variable Importance Measures for Two Independent GroupsLisa M. Lix, PhD P. Stat.School of Public Health
Joint Seminar: Statistics and Collaborative Graduate Program in Biostatistics
January 5, 2012

Co-Authors: Tolu Sajobi, Bola Dansu
Funding: ◦ Canadian Institutes of Health Research◦ Centennial Chair Program, University of
Saskatchewan
Acknowledgements

Background
Description of Relative Importance Measures
Numeric Example
Monte Carlo Study: Design and Results
Discussion and Conclusions
Presentation Overview

m ≥ 2 correlated variables for N study participants with n1 participants in group 1 and n2 participants in group 2 (n1 + n2 = N)
In many studies, the variables are assumed to follow a normal distribution, N(μjk, σjk
2), for k = 1 ,…, m and j = 1, 2
We will focus on the case where there are no missing observations
Study Design
Do different measures of relative importance result in the same rankings of a set of correlated variables for distinguishing between two independent groups?
What factors affect the variable ranking performance of relative importance measures?
Research Questions

For exploratory analysis and model development
Organizational research: ◦ the relative contribution of various applicant characteristics
in hire–not hire decisions made by managers Genetics research:
◦ Relative contribution of individual genes to distinguishing between patients with and without chronic health conditions
Quality of life research:◦ Relative importance of quality of life domains for
distinguishing between patients who do and do not receive healthcare treatments
When and Where are Measures of Relative Importance Used?

Back et al. (2008). Journal of Biopharmaceutical Statistics◦ Rankings of variable importance were used to
identify a set of genes to classify life-threatening diseases according to prognosis or type
◦ Variable importance was assessed using a variety of techniques, including non-parametric recursive partitioning techniques
Applications of Relative Importance Measures
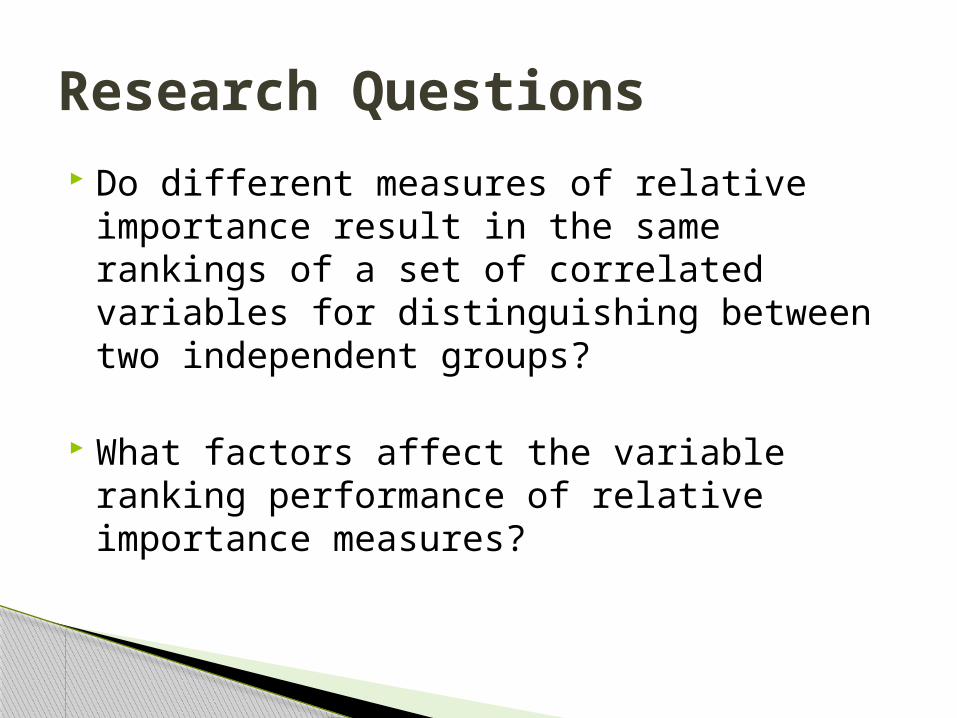
Statistical significance (e.g., t-test)
Practical significance (e.g., effect size)
Descriptive discriminant analysis (DDA): linear combination of variables that maximizes separation of the groups
Stepwise multivariate analysis of variance (MANOVA): F-to-remove statistic measures the decrease in the inter-group Mahalanobis distance caused by removing each of the variables in sequence
Logistic regression analysis (LRA): Contribution of each variable to the total predicted variance in the dichotomous outcome
How can Relative Importance be Measured?

Dominance analysis: Budescu, 1993 ◦ General dominance analysis determines relative importance
based on the average ΔR2 observed by adding a predictor to all possible subsets of the remaining predictors
Relative weights analysis: Johnson, 2000◦ creates a new set of variables that are orthogonal
representations of the original set of variables
How can Relative Importance be Measured?

Denote Xij as the m x 1 vector of observations for the ith study participant in the jth group (i = 1,…, nj; j = 1, 2)
is the m x 1 vector of means for the jth group
Vector of discriminant function coefficients is estimated by
DDA-Based Measures of Relative Importance
jX
)( 21 XXSa 1
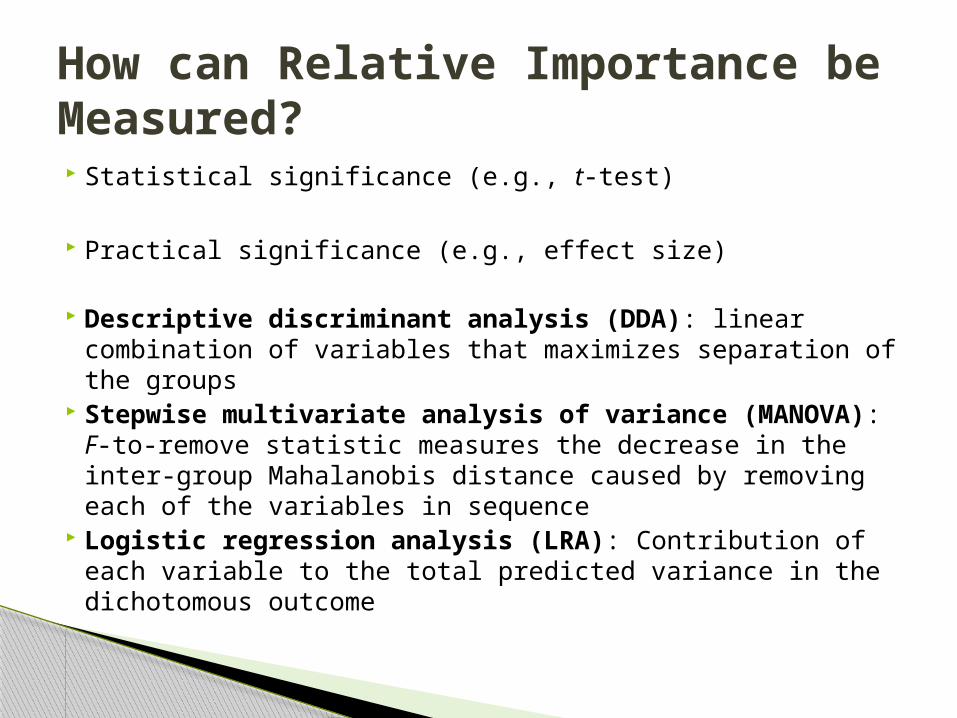
where
and S1 and S2 are the variance-covariance matrices for groups 1 and 2, respectively
DDA-Based Measures of Relative Importance
2
)1()1( 2211
N
nn SSS
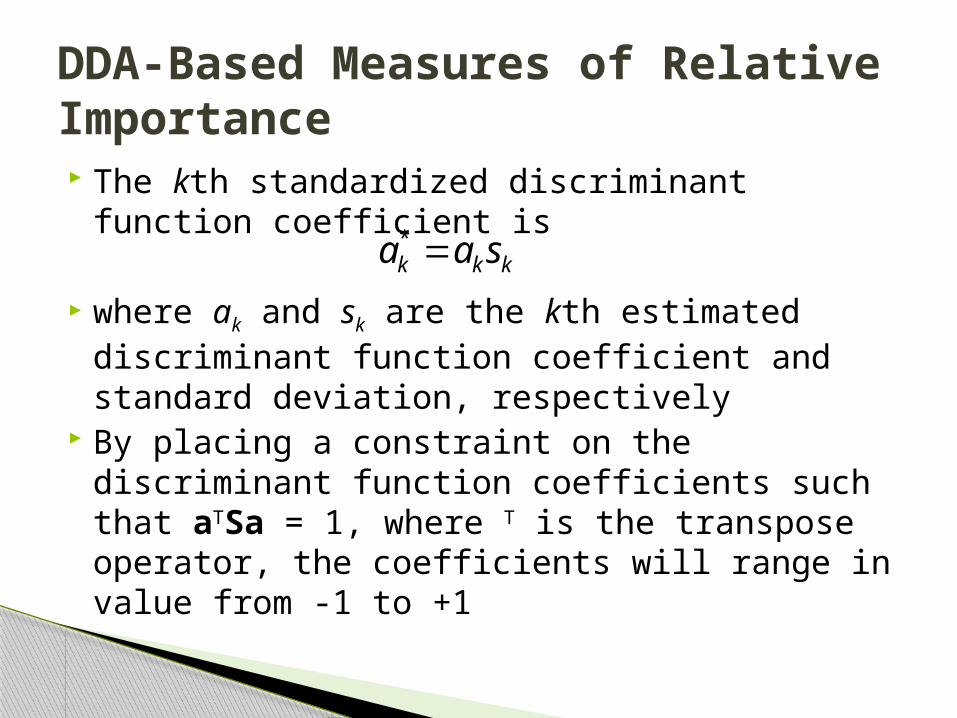
The kth standardized discriminant function coefficient is
where ak and sk are the kth estimated discriminant function coefficient and standard deviation, respectively
By placing a constraint on the discriminant function coefficients such that aTSa = 1, where T is the transpose operator, the coefficients will range in value from -1 to +1
DDA-Based Measures of Relative Importance
kkk saa *
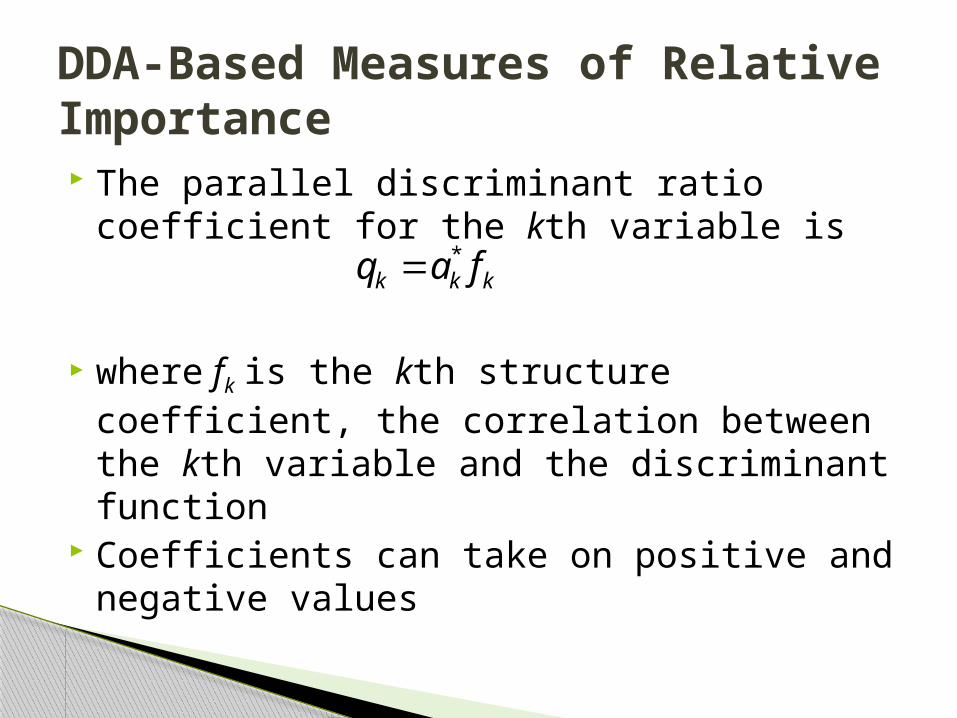
The parallel discriminant ratio coefficient for the kth variable is
where fk is the kth structure coefficient, the correlation between the kth variable and the discriminant function
Coefficients can take on positive and negative values
DDA-Based Measures of Relative Importance
kkk faq *
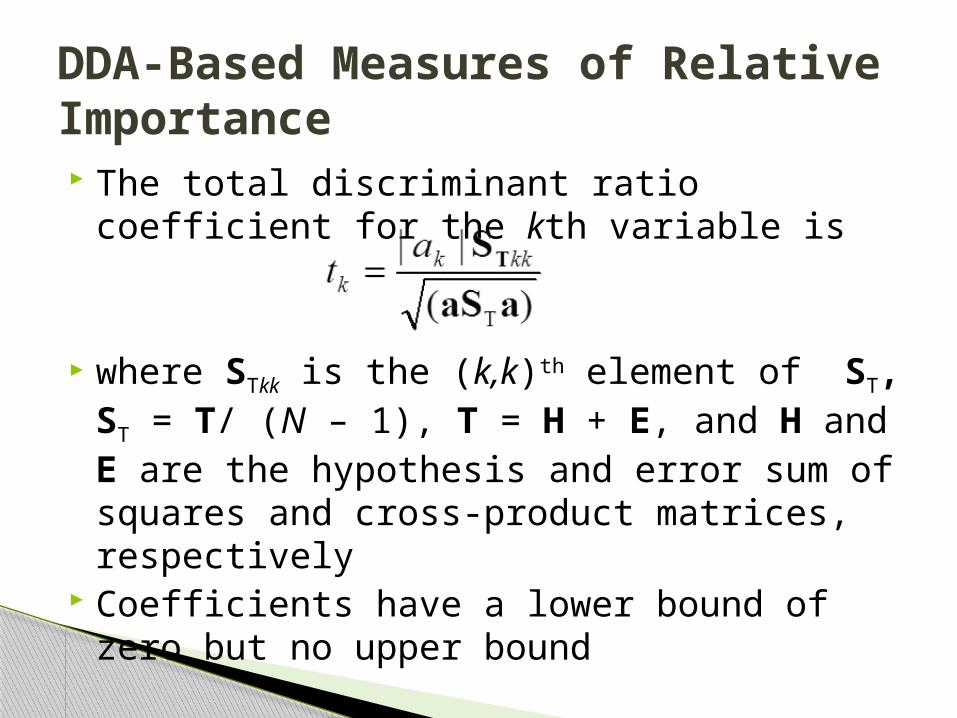
The total discriminant ratio coefficient for the kth variable is
where STkk is the (k,k)th element of ST, ST = T/ (N – 1), T = H + E, and H and E are the hypothesis and error sum of squares and cross-product matrices, respectively
Coefficients have a lower bound of zero but no upper bound
DDA-Based Measures of Relative Importance

For the kth variable, the F-to-remove statistic is
where k2= N – m, k3 = N2/(n1n2), and
is the squared Mahalanobis distance, and is the value of D2 when the kth variable is omitted Statistics take on positive values
Stepwise MANOVA-Based Measures of Relative Importance
)/()( 2)(3
2)(
22)( kkk DkDDkF
)()( 211T
212 XXSXX D
2)(kD

The model is
where Al is the vector of (m + 1) observations for the lth study participant (l = 1 ,…, N) where the first element is equal to one
pl = Pr(yl = 1| Al) is the probability the lth study participant is a member of group 1 conditional on the explanatory variables
β is the (m + 1) vector of coefficients to be estimated, with the first element equal to the model intercept, β0
LRA-Based Measures of Relative Importance
βA ll
l
p
p
1
ln
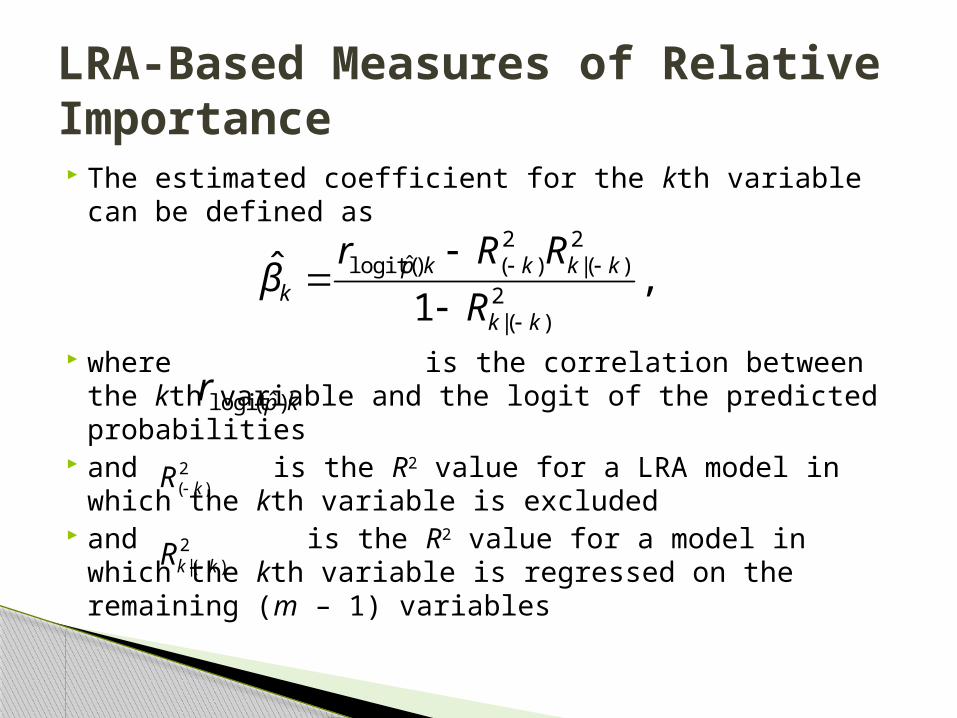
The estimated coefficient for the kth variable can be defined as
where is the correlation between the kth variable and the logit of the predicted probabilities
and is the R2 value for a LRA model in which the kth variable is excluded
and is the R2 value for a model in which the kth variable is regressed on the remaining (m – 1) variables
LRA-Based Measures of Relative Importance
,1
ˆ2
)(|
2)(|
2)()ˆlogit(
kk
kkkkpk R
RRrβ
kpr )ˆ(logit
2)( kR
2)(| kkR
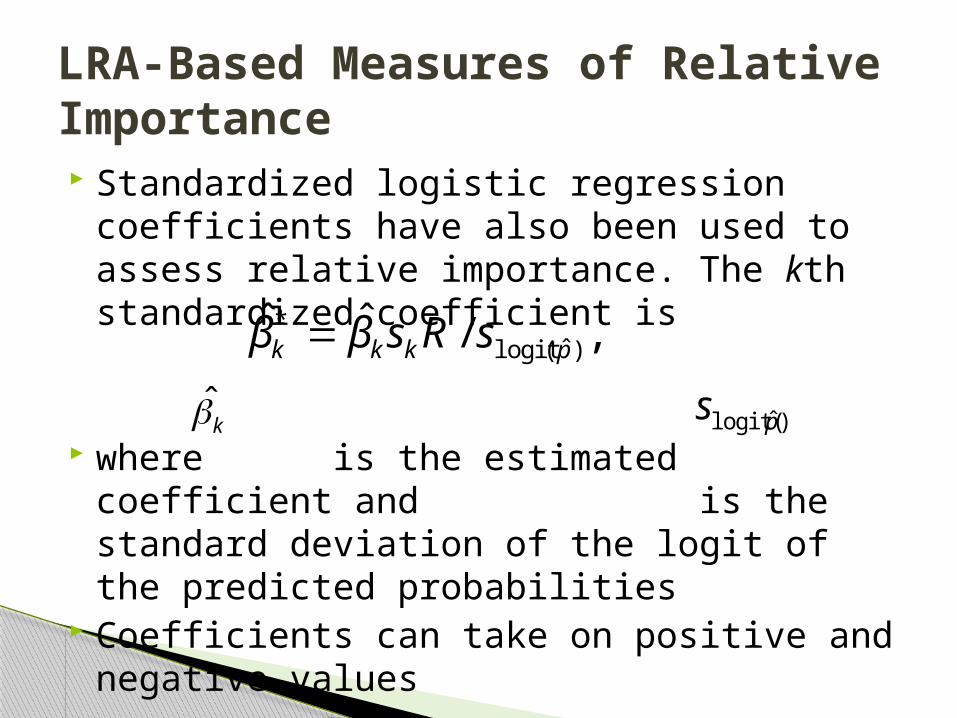
Standardized logistic regression coefficients have also been used to assess relative importance. The kth standardized coefficient is
where is the estimated coefficient and is the standard deviation of the logit of the predicted probabilities
Coefficients can take on positive and negative values
LRA-Based Measures of Relative Importance
,/ˆˆ)ˆ(logit
*pkkk sRsββ
k̂ )ˆlogit( ps
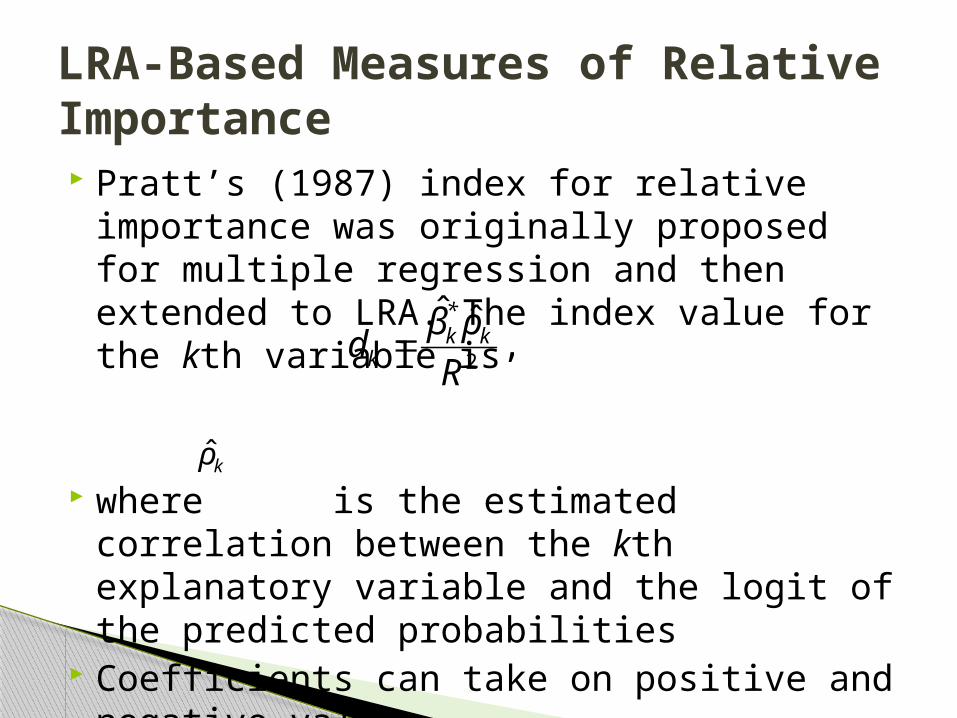
Pratt’s (1987) index for relative importance was originally proposed for multiple regression and then extended to LRA. The index value for the kth variable is
where is the estimated correlation between the kth explanatory variable and the logit of the predicted probabilities
Coefficients can take on positive and negative values
LRA-Based Measures of Relative Importance
,ˆˆ2R
ρβd k
*k
k
kρ̂

Data are from the Manitoba Inflammatory Bowel Disease (IBD) Cohort Study
Started in 2002 and initially enrolled 388 patients who had recently diagnosed with Crohn’s disease or ulcerative colitis
Health-related quality of life (HRQOL) data collected at regular intervals throughout the study◦ SF-36: 8 domains◦ IBD Questionnaire: 4 domains
A central theme of the study is the effect of disease activity on quality of life, stress, well-being, and coping with illness
Numeric Example

Numeric Example: Descriptive Statistics for HRQOL Domains
Active Disease
(n1 = 244)
Inactive
Disease
(n2 = 105)
IBDQ
Bowel Symptoms 4.92 (1.03) 6.08 (0.76)
Emotional Health 4.81 (1.05) 5.85 (0.89)
Social Function 4.09 (1.18) 5.19 (1.05)
Systemic Symptoms 5.62 (1.35) 6.65 (0.64)
SF-36
Bodily Pain 60.78 (24.15) 77.45 (26.11)
Role Physical 63.48 (29.07) 83.65 (24.08)
General Health 43.40 (19.52) 59.18 (17.01)
Mental Health 60.33 (14.11) 66.62 (12.47)
Physical Functioning 77.49 (21.73) 91.11 (14.41)
Role Emotional 76.06 (23.98) 85.82 (20.11)
Social Functioning 63.74 (27.20) 78.85 (27.10)
Vitality 46.13 (16.39) 57.84 (14.49)
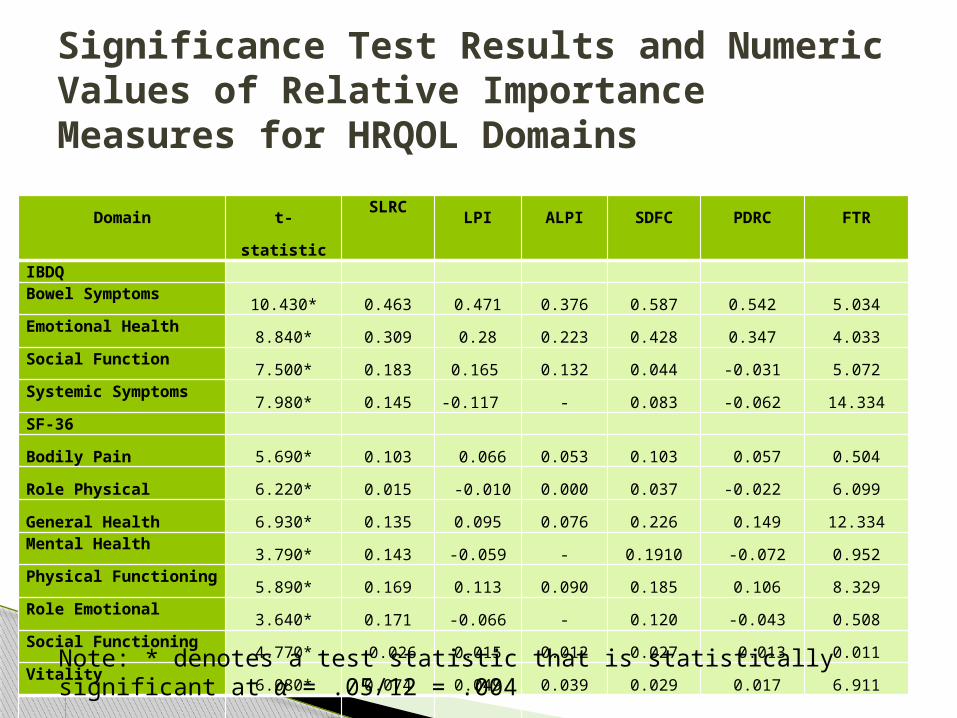
Significance Test Results and Numeric Values of Relative Importance Measures for HRQOL Domains
Domain t-statisticSLRC
LPI ALPI SDFC PDRC FTRIBDQ Bowel Symptoms
10.430* 0.463 0.471 0.376 0.587 0.542 5.034Emotional Health
8.840* 0.309 0.28 0.223 0.428 0.347 4.033Social Function
7.500* 0.183 0.165 0.132 0.044 -0.031 5.072Systemic Symptoms
7.980* 0.145 -0.117 - 0.083 -0.062 14.334SF-36
Bodily Pain 5.690* 0.103 0.066 0.053 0.103 0.057 0.504
Role Physical 6.220* 0.015 -0.010 0.000 0.037 -0.022 6.099
General Health 6.930* 0.135 0.095 0.076 0.226 0.149 12.334Mental Health
3.790* 0.143 -0.059 - 0.1910 -0.072 0.952Physical Functioning
5.890* 0.169 0.113 0.090 0.185 0.106 8.329Role Emotional
3.640* 0.171 -0.066 - 0.120 -0.043 0.508Social Functioning
4.770* 0.026 0.015 0.012 0.027 0.013 0.011Vitality
6.080* 0.074 0.049 0.039 0.029 0.017 6.911
Note: * denotes a test statistic that is statistically significant at α = .05/12 = .004

Rank Order of HRQOL Domains based on Relative Importance Measures
DomainSLRC
ALPI SDFC PDRC FTRIBDQ
Bowel Symptoms 1 1 1 1 7
Emotional Health 2 2 2 2 8
Social Function 3 3 9 9 6Systemic Symptoms 6 - 8 - 1
SF-36
Bodily Pain 9 6 7 5 11
Role Physical 12 9 10 9 5
General Health 8 5 3 3 2
Mental Health 7 - 4 - 9Physical Functioning 5 4 5 4 3
Role Emotional 4 - 6 - 10Social Functioning 11 8 12 7 12
Vitality 10 7 11 6 4
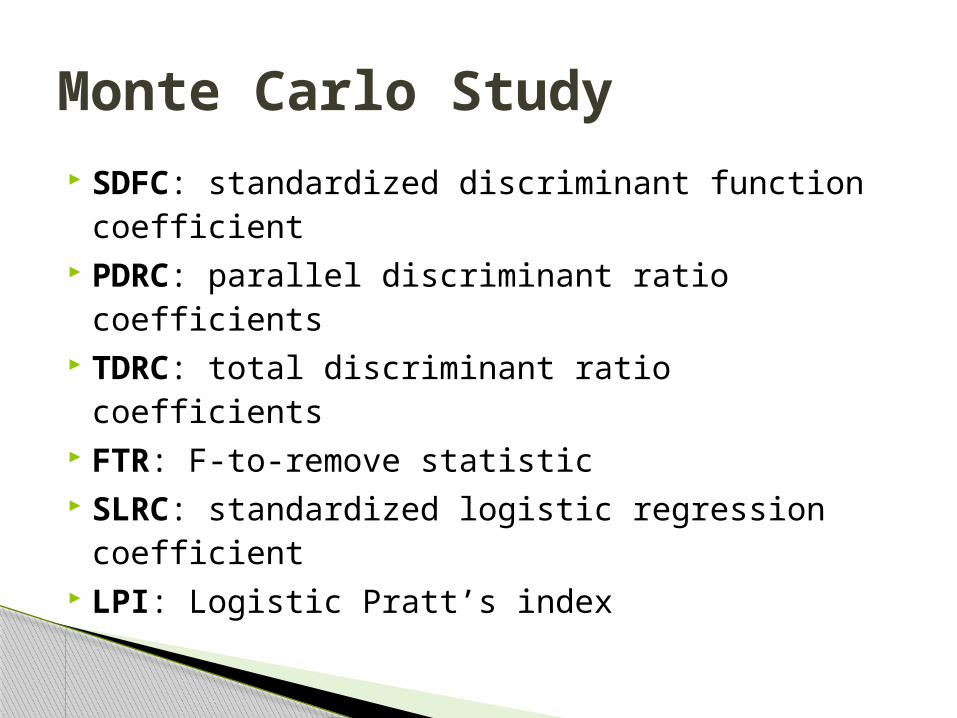
SDFC: standardized discriminant function coefficient PDRC: parallel discriminant ratio coefficients TDRC: total discriminant ratio coefficients FTR: F-to-remove statistic SLRC: standardized logistic regression coefficient LPI: Logistic Pratt’s index
Monte Carlo Study
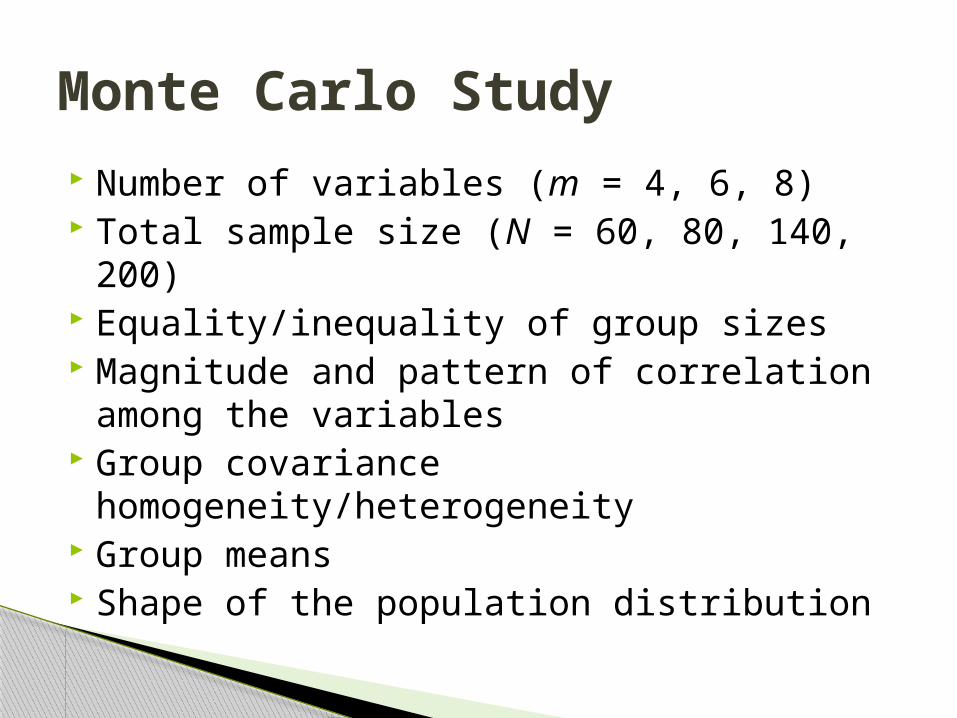
Number of variables (m = 4, 6, 8) Total sample size (N = 60, 80, 140, 200) Equality/inequality of group sizes Magnitude and pattern of correlation among the
variables Group covariance homogeneity/heterogeneity Group means Shape of the population distribution
Monte Carlo Study
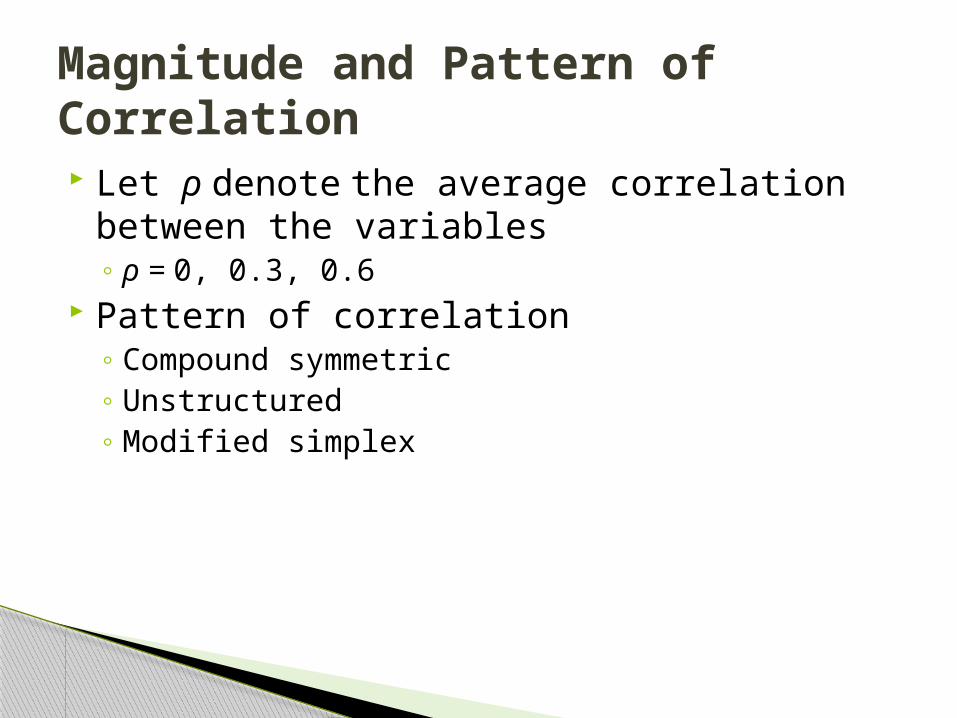
Let ρ denote the average correlation between the variables◦ ρ = 0, 0.3, 0.6
Pattern of correlation◦ Compound symmetric◦ Unstructured◦ Modified simplex
Magnitude and Pattern of Correlation
Mean Pattern μ1 D2
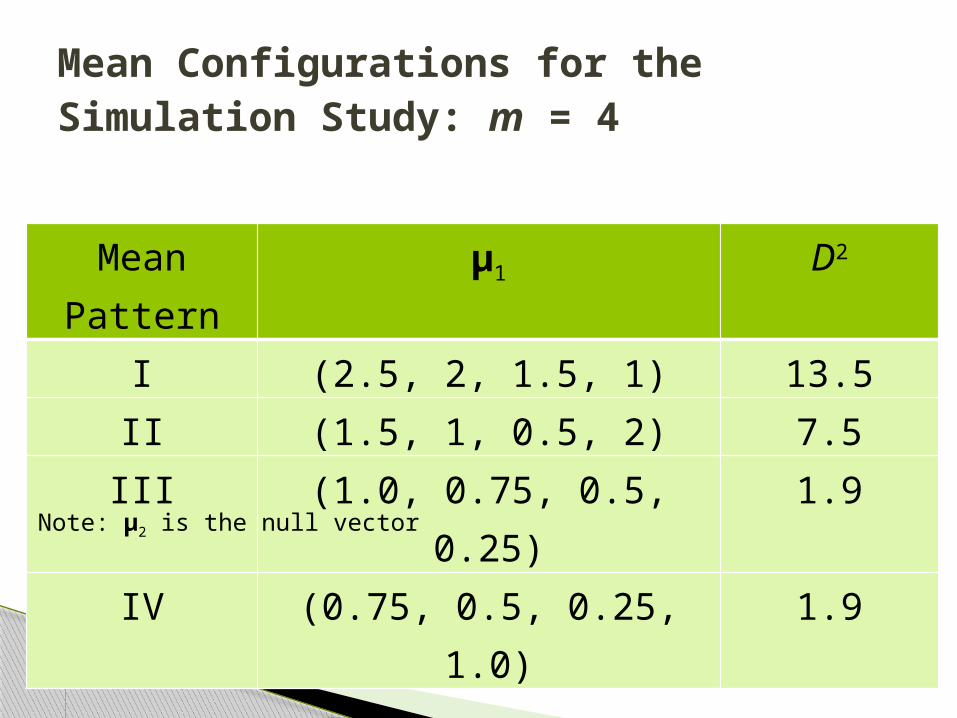
I (2.5, 2, 1.5, 1) 13.5II (1.5, 1, 0.5, 2) 7.5III (1.0, 0.75, 0.5, 0.25) 1.9IV (0.75, 0.5, 0.25, 1.0) 1.9
Mean Configurations for the Simulation Study: m = 4
Note: μ2 is the null vector

Mean Pattern
μ1 D2
I (4.5, 4, 3.5, 3, 2.5, 2, 1.5, 1) 71.0II (2.5, 2, 1.5, 1, 0.5, 3, 3.5, 4) 47.0III (2, 1.75, 1.5, 1.25, 1, 0.75, 0.5, 0.25) 12.8IV (1.25, 1, 0.75, 0.5, 0.25, 1.5, 1.75, 2) 12.8
Mean Configurations for the Simulation Study: m = 8
Note: μ2 is the null vector

Normal◦ γ1 = 0; γ2 = 0
Skewed◦ γ1 =1.8; γ2 =5.9
Heavy-Tailed◦ γ1 = 0 and γ2 = 33
Shape of Population Distribution
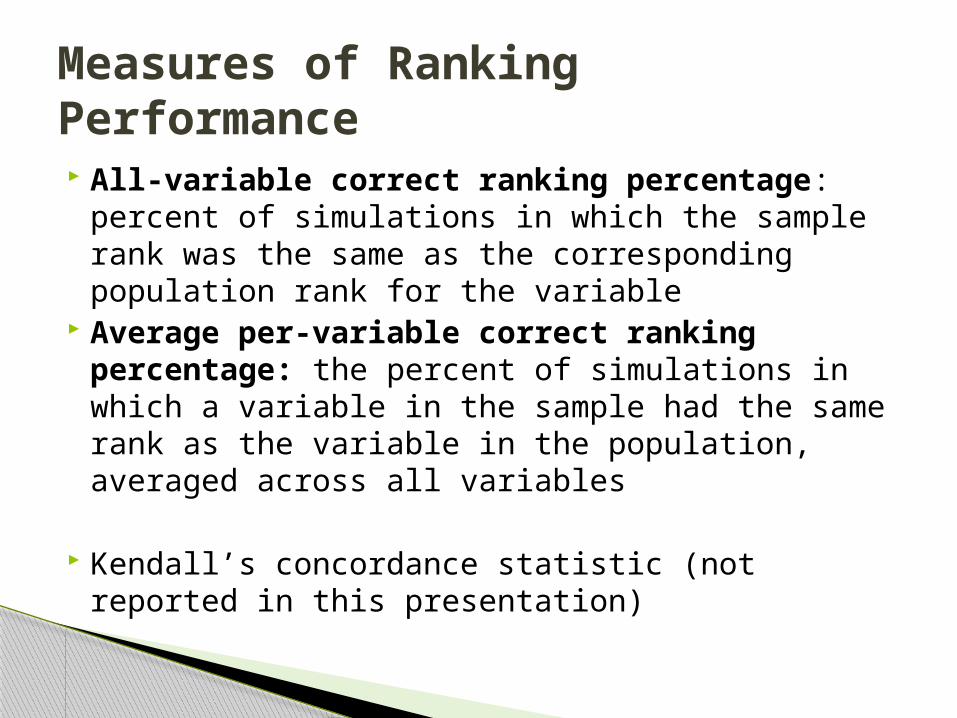
All-variable correct ranking percentage: percent of simulations in which the sample rank was the same as the corresponding population rank for the variable
Average per-variable correct ranking percentage: the percent of simulations in which a variable in the sample had the same rank as the variable in the population, averaged across all variables
Kendall’s concordance statistic (not reported in this presentation)
Measures of Ranking Performance

Mean Pattern
SDFC PDRC TDRC FTR SLRC LPII 49.1 59.8 59.0 38.0 41.7 61.1II 43.7 63.1 56.2 32.1 38.0 64.3 III 34.8 47.0 37.8 26.4 33.2 47.4IV 37.0 54.3 41.1 28.3 34.8 54.7
Average 41.2 56.0 48.5 31.2 36.9 56.9
Average Per-Variable Correct Ranking (%)Equal Group Covariances and Multivariate Normal Distribution
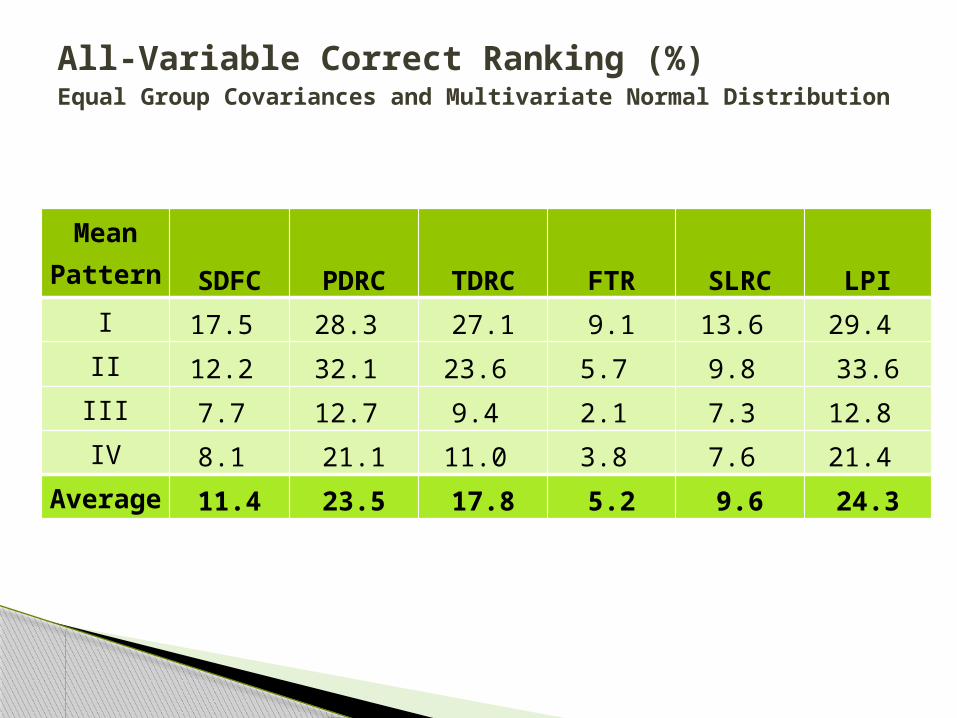
Mean Pattern
SDFC PDRC TDRC FTR SLRC LPII 17.5 28.3 27.1 9.1 13.6 29.4 II 12.2 32.1 23.6 5.7 9.8 33.6III 7.7 12.7 9.4 2.1 7.3 12.8 IV 8.1 21.1 11.0 3.8 7.6 21.4
Average 11.4 23.5 17.8 5.2 9.6 24.3
All-Variable Correct Ranking (%)Equal Group Covariances and Multivariate Normal Distribution

Corr. Scenari
o SDFC PDRC TDRC FTR SLRC LPI1 60.3 63.3 63.2 40.2 55.0 66.32 45.9 63.2 51.0 32.6 42.4 63.63 32.2 65.9 42.5 25.8 25.7 65.44 39.7 52.1 45.1 29.7 36.5 53.15 25.8 34.2 38.6 27.0 24.3 33.96 43.0 57.6 50.5 31.8 37.8 58.5
Average 41.2 56.0 48.5 31.2 36.9 56.9
Average Per-Variable Correct Ranking (%)Equal Group Covariances and Multivariate Normal Distribution
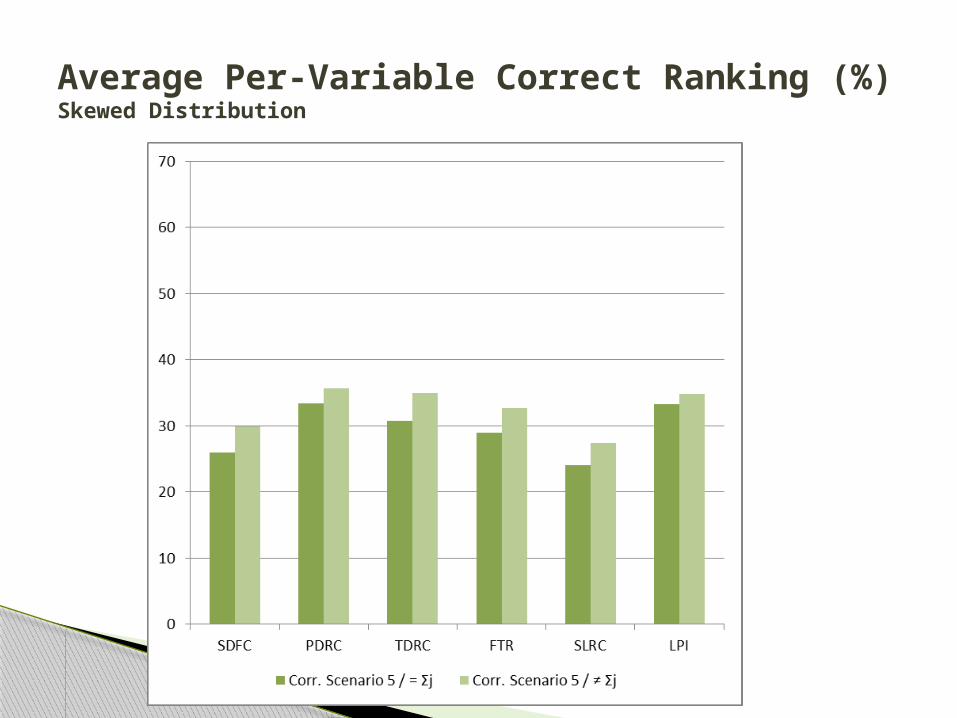
Scenario 1: ρ = 0, where ρ is the average correlation; Scenario 2: compound symmetric matrix with ρ = 0.3; Scenario 3: compound symmetric matrix with ρ = 0.6; Scenario 4: unstructured matrix with ρ = 0.3; Scenario 5: unstructured matrix with ρ = 0.6; Scenario 6: modified simplex matrix with correlations of 0.3 and 0.6 on alternating diagonals.

Average Per-Variable Correct Ranking (%)Unequal Group Covariances and Multivariate Skewed Distribution

Average Per-Variable Correct Ranking (%)Unequal Group Covariances and Multivariate Skewed Distribution
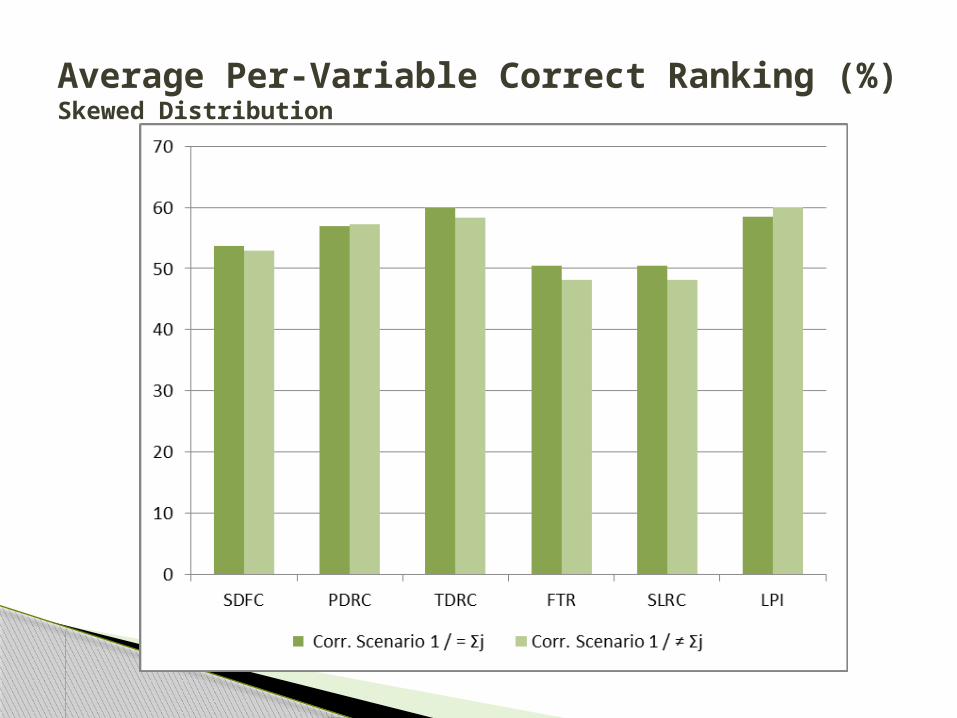
Average Per-Variable Correct Ranking (%)Skewed Distribution
Average Per-Variable Correct Ranking (%)Skewed Distribution

Average Per-Variable Correct Ranking (%)Heavy-Tailed Distribution
The LPI and PDRC measures tended to result in the highest percentages of correct rankings and values of the concordance statistic
The FTR measure tended to result in the lowest percentages of correct rankings and concordance followed by the SLRC measure
Discussion and Conclusions
The LPI and PDRC measures were relatively insensitive to many of the correlation structures
However, they resulted in a substantial drop in correct ranking percentages when the data exhibited an unstructured correlation pattern with a high average correlation (ρ = 0.6)
Differences in correct ranking percentages across the correlation structures were smaller for the TDRC and SLRC measures than for other measures and were smallest for the FTR measure
Discussion and Conclusions

Violations of the assumption of covariance homogeneity had a very small effect on the correct ranking rates
The correct ranking percentages for all measures were consistently lower for heavy-tailed than for skewed distributions
Discussion and Conclusions

The choice of measures of relative importance depends on the perspective the researcher wants to take on the data◦ contribution of a variable to the discriminant function score◦ contribution of a variable to the grouping variable effect◦ contribution of a variable to explaining variation in a
regression model
Discussion and Conclusions

Inference for relative importance measures and ranks
Comparisons with recent developments in relative importance measures that are more computationally intensive (e.g., relative weights)
Extensions to more than two groups
Future Research
Related Documents