Liquidity in U.S. Fixed Income Markets: A Comparison of the Bid-Ask Spread in Corporate, Government and Municipal Bond Markets Sugato Chakravarty 1 Purdue University West Lafayette, IN 47906 Asani Sarkar Federal Reserve Bank of New York New York, NY 10045 Initial version: November 14, 1998 Current version: March 15, 1999 1 Chakravarty's telephone: (765) 494-6427; email: [email protected]. Sarkar's email: [email protected] . We gratefully acknowledge the comments of Mike Fleming, Jean Helwege, Charles Jones, Frank Keane, Frank Packer, Tony Rodrigues and Paul Schultz. We purchased the bond dealer market transactions data from Capital Access International (CAI). We also thank Chung-Chiang Hsiao for excellent research assistance. The views here are those of the authors and do not necessarily reflect the views of the Federal Reserve Bank of New York or the Federal Reserve System. Any remaining errors are the authors’ alone.

Welcome message from author
This document is posted to help you gain knowledge. Please leave a comment to let me know what you think about it! Share it to your friends and learn new things together.
Transcript

Liquidity in U.S. Fixed Income Markets: A Comparison of the Bid-Ask Spreadin Corporate, Government and Municipal Bond Markets
Sugato Chakravarty1
Purdue UniversityWest Lafayette, IN 47906
Asani SarkarFederal Reserve Bank of New York
New York, NY 10045
Initial version: November 14, 1998Current version: March 15, 1999
1Chakravarty's telephone: (765) 494-6427; email: [email protected]. Sarkar's email: [email protected].
We gratefully acknowledge the comments of Mike Fleming, Jean Helwege, Charles Jones, Frank Keane, FrankPacker, Tony Rodrigues and Paul Schultz. We purchased the bond dealer market transactions data from CapitalAccess International (CAI). We also thank Chung-Chiang Hsiao for excellent research assistance. The viewshere are those of the authors and do not necessarily reflect the views of the Federal Reserve Bank of New Yorkor the Federal Reserve System. Any remaining errors are the authors’ alone.

Abstract
We examine the determinants of the realized bid-ask spread in the U.S. corporate, municipal and
government bond markets for the years 1995 to 1997, based on newly available transactions data.
Overall, we find that liquidity is an important determinant of the realized bid-ask spread all three
markets. Specifically, in all markets, the realized bid-ask spread decreases in the trading volume.
Additionally, risk factors are important in the corporate and municipal markets. In these markets,
the bid-ask spread increases in the remaining-time-to-maturity of a bond. The corporate bond
spread also increases in credit risk and the age of a bond. The municipal bond spread increases in
the after-tax bond yield. Controlling for other factors, the municipal bond spread is higher than
the government bond spread by about 9 cents per $100 par value, but the corporate bond spread is
not. Consistent with improved pricing transparency, the bid-ask spread in the corporate and
municipal bond markets is lower in 1997 by about 7 to 11 cents per $100 par value, relative to the
earlier years. Finally, the ten largest corporate bond dealers earn 15 cents per $100 par value
higher than the remaining dealers, after controlling for differences in the characteristics of bonds
traded by each group. We find no such differences for the government and municipal bond
dealers.

1
1. Introduction
The U.S. bond market is the largest market in the world, with a total current value of over $10
trillion-- up approximately 400 per cent since 1980. While the New York Stock Exchange (NYSE) equity
trading amounts to $26 billion per day, trading volume in all bond markets total roughly $350 billion per day
(the Securities and Exchange Commission (SEC) press release 98-81). The vast majority of bond markets
transactions occur in over-the-counter dealer markets.
An important issue for academics and market participants is the liquidity and transparency of dealer
market transactions. Recent finance literature argues that, at least in the equity markets, dealers may not
provide competitive pricing of customer trades, compared to auctions markets. For example, Huang and
Stoll (1996) find that execution costs are about twice as high on the NASDAQ dealer markets, compared to a
matching sample of NYSE stocks. Roell (1992) shows that the execution costs in the London dealer market
are higher than in the continental auctions markets.
The inefficiency of dealer pricing is, perhaps, of even greater concern in bond markets than in equity
markets. This is because of the lack of price transparency in the former markets since there is no centralized
location reporting quotes or trade prices. For inactively traded bonds, different dealers may provide different
quotes for the same bond.2 The SEC has proposed rules to enhance the transparency of the corporate bond
market. One measure would require dealers to report all transactions in U.S. corporate bonds and preferred
stocks to the NASD and to develop systems to receive and redistribute transaction prices on an immediate
basis (SEC press release 98-81).
In the current paper, we estimate the realized bid-ask spreads in the U.S. corporate, municipal and
government bond markets for the years 1995 to 1997, based on newly available transactions data for the
bond dealer markets. As of 1993, these three bond markets were about two-thirds of the dollar value of the
U.S. debt markets (Fabozzi, 1996). We compare the bid-ask spread across the three markets, after controlling
for the risk of trading bonds, the level of their trading activity, the transparency of the market and issuer-
2 See Schultz (1998) for a description of the pricing mechanism in corporate bond markets. In September 1998, theHouse Commerce committee and the Finance and Hazardous Materials subcommittee began holding hearings onwhether investors have adequate information about prices when considering investments in the bond market. The titleof the hearing: “Improving price competition for mutual funds and bonds.”

2
specific characteristics. As the three markets vary with respect to the control factors, a cross-market
comparison is a natural experiment in studying the effects of these factors on market liquidity.
In terms of credit risk, U.S. Treasury securities are backed by the full faith and credit of the U.S. government,
and so are virtually free of credit risk. Corporate bonds may suffer from significant credit risk. For example,
in 1992, high risk or junk corporate bonds (rated below Baa by Moody’s) were about 23% of volume
(Bencivenga, 1995). Municipal bonds have intermediate credit risk due to the financial fragility of some
municipals, and the proliferation of innovative bond issues with uncertain legal bondholder rights.3
In terms of trading activity, U.S. Treasury securities are the second largest sector of the bond market,
after the mortgage market. The total volume of debt and size of any single issue is large, compared to the
other bond market sectors. For example, as of 1993, there was $2.3 trillion of Treasury debt outstanding
from 210 different issues. By comparison, in the corporate and municipal bond markets, there were $1.4
trillion of debt from 10,000 issues and $802 billion of debt from 70,000 separate issuers, respectively
(Fabozzi, 1996). The large issue sizes in the U.S. Treasury markets imply that the secondary market is
highly liquid, with large trading volumes and narrow bid-ask spreads, as shown in Fleming and Sarkar
(1998). Further, the secondary market in U.S. Treasuries is a round-the-clock market, whereas the corporate
and municipal bond markets are not---a further indication of the robust trading activity in U.S. Treasuries.
In terms of market transparency, a recent review of the debt markets by the SEC found that the
government bond market is highly transparent, that price transparency has improved in the municipal bond
market,4 but is still inadequate in the corporate bond market.
Our first set of results relate to the distribution of the realized bid-ask spread, defined as the
difference between the average buy price and the average sell price per bond per day. The spreads are
3 In addition, since the interest payment on most municipal bonds is exempt from federal income tax, and may beexempt from state and local taxes, investors suffer from tax risk. This is the risk that either the Federal income tax willdecrease (lowering the value of tax-exemption) or that a tax-exempt issue may be declared taxable by the InternalRevenue Service.4 In 1998, with SEC approval, the Municipal Securities Rulemaking Board expanded its daily reporting. Now, if amunicipal security trades at least four times on a given day, then the high, low, and average prices and total par valuetraded will appear on the MSRB’s Combined Daily Report at 6:00 a.m. the next day. The Bond Market Associationwill make that information available for free on its web site. For the first time, individual investors will now haveaccess to prices and volume information. The web site will also have valuable information about credit ratings,insurance, calls, and yields.

3
reported on the basis of a $100 par value. We find that the mean spread is the highest in the municipal bond
market at 22 cents, followed by the corporate bond market at about 21 cents and the government bond market
at 11 cents. The spread is generally higher for bonds with lower Moody’s ratings, and lower in 1997 than in
the earlier years for all markets. In the corporate and municipal markets, the spread appears to have
decreased in each successive year of our sample.
Regarding bond characteristics, municipal bonds have the highest time to maturity, and the lowest
trading volume of the three markets. Consistent with market perception that the government bond market is
the most liquid sector, government bonds have the lowest age since issuance, and the highest trading volume
of the three markets. In all markets, the average time to maturity of bonds is intermediate, between 9 and 11
years, while the average age of bonds varies between 2.75 years and 3.5 years.
Next, we study the determinants of the bid-ask spread separately in the corporate, government and
the municipal bond markets. Specifically, using the robust Generalized Method of Moments (GMM)
estimation technique, we find that liquidity is an important determinant of the realized bid-ask spread all
three markets. Specifically, in all markets, the realized bid-ask spread decreases in the trading volume.
Additionally, risk factors are important in the corporate and municipal markets. In these markets, the bid-ask
spread increases in the remaining-time-to-maturity of a bond. The corporate bond spread also increases in
credit risk and the age of a bond. The municipal bond spread increases in the after-tax bond yield.
Additionally, the bid-ask spread is lower in 1997 compared to the previous two years--by 7 cents for
corporate bonds and 10 cents for municipal bonds. However, this is not the case in the government bond
market. The result is consistent with the idea that transparency in the corporate and municipal bond markets
has improved, perhaps as a consequence of increased regulatory scrutiny.
In each bond market, there are unique factors important for determining the bid-ask spread for that
market only. For corporate bonds, the bid-ask spread increases with the age of the bond since issuance.
Also, the estimated bid-ask spread for AAA and AA rated corporate bonds are about 21 cents lower than
corporate junk bonds (i.e., bonds rated Ba or below by Moody’s). For municipal bonds, the bid-ask spread is

4
positively related to the annual yield. Since the yield is a before-tax return, we interpret the result to mean
that the bid-ask spread is negatively related to the extent of tax subsidy implicit in municipal bond yields.
Is the bid-ask spread different for the three markets, after controlling for its significant determinants?
We pool observations from all markets, and estimate a common model. The result shows that the spread in
the municipal bond market is higher by 9 cents compared to government bonds, even after the reduction in
spreads in 1997, but corporate bond spreads are not. A pair-wise comparison of markets confirms this result.
Specifically, the municipal bond spread is higher than the corporate bond spread by 8 cents, but the corporate
bond spread is not different from the government bond spread. This result is robust to alternative
specifications that take into account the unique determinant of spreads in the government sector.
Following Schultz (1998), we examine whether large dealers earn higher bid-ask spreads compared
to smaller dealers. We find that the ten largest dealers earn higher spreads in the corporate and municipal
bond markets, but not in the government bond market. The ten largest dealers generally trade different bonds
than the other dealers in all three markets. Bonds traded by the ten largest dealers in the corporate and
municipal bond markets are significantly riskier (higher duration) and more active (lower bond age)
compared to bonds traded by smaller dealers. After controlling for these differences, the ten largest
corporate bond dealers earn 15 cents more than other dealers, but the municipal bond bid-ask spread is the
same for all dealers. We do not find any differences in the bid-ask spread for the trades of the ten largest
institutions compared to those of the smaller institutions.
In related work, Schultz (1998) studies the corporate bond market and Hong and Warga (1998) study
the corporate and government bond markets using the same data set as ours. Schultz (1998) finds that the
bid-ask spread is lower for larger sized trades and for larger institutions, but that it is not affected by
relationships between dealers and institutions. Hong and Warga (1998) find no apparent biases in exchange
transactions and dealer-market quotes relative to transactions in the dominant dealer market. The authors
conclude that effective spreads (calculated by matching quotes with transactions) for the ABS traded
corporate bonds are found to be similar to effective spreads for dealer market transactions, although dealer
market spreads exhibit substantially higher variability.

5
The plan for the rest of the paper is as follows. In section 2, we discuss our data and methodology.
In section 3, we describe the sample distributions of the bid-ask spread and various bond characteristics. In
section 4, we analyze the determinants of the bid-ask spread in the three markets, and compare the spread
across them. In section 5, we study whether the bid-ask spread is different for the largest dealers and
institutions. Finally, the conclusions are presented in section 6.
2. Data and Methodology
After describing the data in section 2A, we discuss the theoretical determinants of bid-ask
spread in bond markets and our empirical proxies in section 2B.
A. Data Description
Our bond transaction data set is comprised of individual bond transactions by insurance companies.
From 1995, the National Association of Insurance Commissioners (NAIC)---the regulatory body overseeing
the insurance industry---started requiring the insurance companies to report their securities transactions on
the Schedule D filings. Accordingly, the insurance companies must provide information pertaining to the
total cost of transaction, the number of bond contracts purchased or sold and the date of transaction. We
obtain a record of such transactions from Capital Access International (CAI), who, in turn, obtains it from
A.M. Best. CAI then cleans the data by verifying the bonds transacted based on available information.
The basic data set used in the paper comprises of daily bond transaction records of insurance
companies. The data is available from January 1, 1995 to December 31, 1997. Each record comprises of the
transaction date, an eight-digit bond number that identifies the bond, the total dollar value of the transaction,
the number of contracts traded and an indication as to whether the order is a buy or a sell order. The original
sample consists of 453,481 individual transactions by insurance companies in the three market sectors:
Corporate, Government and Municipal.
We purchase, also from CAI, additional information about the bonds in our sample, including the
credit rating of each bond from Moody's and Standard and Poor's (S&P), the credit sector of issuer (e.g.,

6
whether the bond was issued by an industrial company), the issue date, and maturity date. Hong and Warga
(1998) and Schultz (1998) obtain similar information by matching the bond transactions from the CAI data
with the Fixed Income Database compiled at the University of Houston with data from Lehman Brothers.
To clean the data of potential errors, we delete the following types of observations from the original
sample. One, observations on Saturdays and Sundays and those occurring on June 30, 1995, June 30, 1996,
and December 31, 1997 are removed. According to our data vendor, insurance companies may have used
these dates for recording transactions which they failed to report in a timely manner. This filter removes
42,177 observations from the data set. Two, all transactions where the actual transaction date is reported as
an estimate are deleted. This removes 1,652 observations from the sample. Three, we remove observations
on bonds that do not have any ratings information.5 This removes 25,539 observations. Four, we eliminate
observations on bond transactions of non-U.S. issuers. This removes 25,268 observations. Finally, we
eliminate all observations where the transaction price per $1,000 face value bond is outside the range $500 to
$1500.6 We do this to minimize incidences of data entry error that may adversely affect our analysis. The
final filter removes 2,008 observations.
After instituting the above filters, the sample comprises of 152,452 individual transactions in
corporate bonds, 54,518 individual transactions in government bonds and 83,395 individual transactions in
municipal bonds over 1995 - 1997.
B. Discussion of the Empirical Determinants of Bond Market Bid-Ask Spreads
In the contingent claims model of Merton (1973), the value of corporate debt depends on the risk-
free rate, provisions in the bond indenture (such as maturity date, coupon rate, and call provisions) and the
probability of default. Based on research in the equity markets,7 we expect the bid-ask spread to be related to
5 We also eliminate observations on bonds with ratings like MIG-1, MIG-2, P-1, P-2, VMIG-1, or VMIG-2. There areno more than 50 such observations in the original data.
6 The final filter also removes many trades of 500 bonds or less. This may be important because, during the time periodexamined, CAI rounded the total transaction cost to the nearest thousand dollars by always rounding up to the nexthighest one thousand dollars. Prices of smaller sized trades will be most affected by the rounding process. Hong andWarga (1998) delete all observations under 500 contracts, but Schultz (1998) does not, on the ground that the differencebetween the buy price and the sell price (i.e., the realized spread) is independent of rounding errors.7 For example, Amihud and Mendelsohn (1986) show that the bid-ask price is a decreasing and convex function of thebid-ask spread.

7
the bond price and, therefore, to the determinants of debt value as indicated in Merton (1973). We control
for the default risk in two ways: by creating dummy variables based on Moody’s credit ratings; and, for the
corporate sector, by the yield spread, defined as the difference between the bond yield and the 91 day
Treasury Bill rate. The yield spread is the market’s perception of the credit risk of a corporate bond. We do
not control for the coupon rate or the risk-free rate in the regressions because these variables are highly
correlated with our other explanatory variables.
The bid-ask spread is related to the risk of trading a security since it affects dealers' price risk when
adjusting their inventory (Grossman and Miller, 1988). To estimate this effect, we use the term to maturity,
or the remaining life of a bond, as a proxy for the bond price volatility. Since market yields change over the
life of a bond, the price volatility increases with the term to maturity. The maturity term is obtained by
calculating the number of years from a bond's transactions date till the maturity date of a non-callable bond.
Callable bonds are omitted from our sample.8
The risk of trading a bond is also related to its expected liquidity. Greater liquidity makes it easy to
buy and sell bonds at short notice, and reduces the price risk dealers face in making inventory adjustments.
We use trading volume as a proxy for liquidity, and distinguish between the dollar buy volume per-bond-per-
day and the dollar sell volume per-bond-per-day. The practice of many institutions is to hold bonds to
maturity and then reinvest the principal. Hence bond sales may be primarily information driven, causing the
bid-ask spread to increase (Kyle (1985), Easley and O'Hara (1987)), whereas purchases may be primarily
liquidity driven, causing the bid-ask spread to fall. Research on equity trades of institutions also find an
asymmetric effect of purchases and sales on transactions costs (see, for example, Keim and Madhavan (1997)
and Madhavan and Smidt (1993)).
For the corporate bond market, it is often suggested that a younger bond may be traded more
frequently, and has lower spreads resulting from greater liquidity.
8 We also used other measures of bond price volatility, including the Macaulay duration (DURATION), which capturesthe effect of the change in the price of a bond for a small change in its yield, and convexity (CONVEXITY) to capturethe curvature or the convexity of a bond. The three measures, MATURITY, DURATION and CONVEXITY, arehighly correlated, and so cannot be used together. We use MATURITY because it the most reliable. DURATION andCONVEXITY may be subject to measurement errors, since we calculate them on the basis of the annual bond yield.The yield is not in our data, and we estimate it using the semi annual coupon payments and the accrued interest paymentfrom the previous coupon interest date.

8
In the bond markets, each market sector is divided into categories that reflect common economic
characteristics. It is implicitly assumed that each issuer category has a different ability to meet their
contractual obligations. For the corporate bond market, we use the dummy variables INDSER, BANKFIN
and UTILITES to control for bonds issued by the services and industrial sectors, banking and finance
companies, and utilities, respectively. For the municipal bond market, we use the dummy variables HCARE
and UTILITIES to control for health care and utility bonds, respectively.
Finally, changes in the market structure may affect the bid-ask spread. In particular, if the market
has become more transparent over time, the bid-ask spread may increase or decrease, depending upon which
trader group is affected most. Theory generally predicts that uninformed traders prefer greater transparency
since they are less likely to be pooled with informed traders, whereas large liquidity traders and informed
traders like less transparency (Grossman, 1988; Madhavan, 1995; Pagano and Roell, 1996). Dealers also like
less transparency, since it reduces price competition with other dealers (Naik, Neuberger and Viswanathan,
1994). We control for changes in the structure of these markets through the dummy variable 1997, which has
the value one if a transaction occurred in 1997 and is zero otherwise.
3. Bid-Ask Spreads, Volatility and Liquidity: Descriptive Statistics
A. Bid-ask Spreads in the Corporate, Government and Municipal Bond Markets
We calculate the realized bid-ask spreads per-bond-per-day as follows. For every bond with at least one buy
and one sell transaction in a day, we compute the average buying and selling price per bond per day. The
spread per bond per day is the difference between the average selling price per bond from the average buying
price for that bond. We have 10,462 observations on the bid-ask spread per bond per day in the three market
sectors.
The realized spreads are a noisy estimate of transaction costs, since trades take place at different
times during the day. Since our data is not time-stamped within a day, we cannot condition on the
transactions time. Additionally, the fact that we need to have at least one buy and one sell of a bond on a
given day to calculate the spread dictates that our spread estimates are mainly applicable to relatively active

9
bonds.
Table 1A provides the sample distributions of the bid-ask spread for the three market sectors. All
spreads are reported on the basis of a $100 par value. The mean spread is highest for the municipal bond
sector at 22 cents, followed by the corporate bond markets at 21 cents, and least for the government bond
markets at 11 cents. The mean volume-weighted spread on AAA-rated bonds and junk bonds are 21 cents
and 24.33 cents per $100 par value, but the difference is not statistically significant. These numbers are
higher than those in Hong and Warga (1998), who report an average volume-weighted spread of 13.28 cents
per $100 par value for investment grade corporate bonds, and 19.13 cents for high yield bonds. But, they are
lower than the volume-weighted spread of 26.2 cents reported in Schultz (1998).
To check for the robustness of our spread measures, we present, in Table 1B, the corresponding
volume-weighted daily dollar spreads. Specifically, the mean volume-weighted dollar spread in the
corporate sector is 21.5 cents on a $100 par value basis. Similarly, in the municipal sector, the mean volume-
weighted dollar spread is about 22 cents, followed by that in the government sector at about 8 cents. Clearly,
these estimates closely resemble the raw spreads reported in Table 1A and, for brevity, we concentrate the
remainder of our analysis on the dollar raw spreads alone.
Among the credit sectors, utility sector bonds have higher spreads than the sample average, whereas
the industry/services sector s and the banking/financial sectors have lower spreads than the sample average.
Industrial and service sector bonds are about 45 per cent of bonds traded in our sample, with banking
/finance company and utility issues being about 32 and 14 per cent of the sample, respectively. By
comparison, in 1988, industrials and banking/finance companies accounted for about 46% and 37% of new
bond offerings.
In the government bond sector, the median raw and volume-weighted spread per bond per day, on
the basis of a $100 par, are 11.1 cents and 8.17 cents, respectively. By comparison, in Hong and Warga
(1998), the mean volume-weighted spread for Government/Agency securities is 1.84 cents per $100 par
value. Our mean fractional volume-weighted spread is 0.1 per cent. For 1993, Fleming and Sarkar (1998)
compute fractional volume-weighted spreads for all Treasury securities by maturity. Their estimates range

10
from effectively zero per cent for the 13-week bill to 0.02 per cent for the 30-year Treasury bond. For the
10-year note (closest to the average maturity of our sample), the fractional spread (not reported) is 0.02 per
cent.
Finally, for the municipal bond market, the mean raw and volume-weighted spread is 23 cents and
22.93 cents. Among the different credit sectors, spreads are highest for health-care bonds at 23.83 cents and
lower than average for utility bonds at 11.43 cents. Our estimate is consistent with available evidence of
spreads for institutional investor spreads in the municipal bond market. According to Fabozzi (1996), dealer
spreads vary substantially between institutional investors and retail investors. Fabozzi (1996) reports that
spreads for institutional investors rarely exceed 50 cents per $100 par value, while those for retail investors
vary between 25 cents on large blocks of actively traded stocks to $4 per $100 par value for odd-lot sales of
inactive issues.
B. Volatility and Liquidity in the Fixed Income Markets
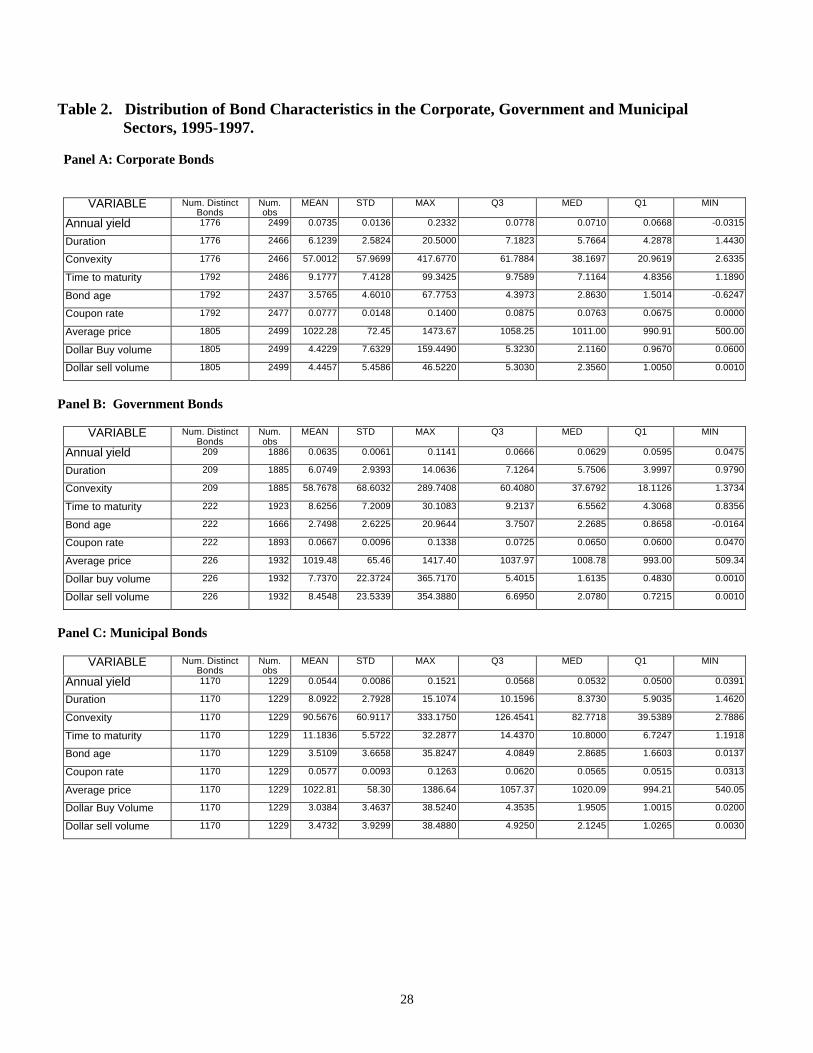
Table 2 provides the sample distributions of variables that may help predict the level of spreads in
the three markets. We find that volatility, as measured by the time-to-maturity, is highest in the municipal
bond sector, and about the same in the other two markets. 9 Trading activity, as measured by the dollar buy
and sell volumes, is least in the municipal bond market, followed by the corporate and government bond
markets, respectively.
The maturity level is intermediate in all three sectors, consistent with the change in business
practices of the insurance companies who place increased emphasis on shorter-term-oriented term life and
other policies instead of more traditional whole-life policies and investments in long-term bonds. In the
Municipal Bond market, the time-to-maturity is 11.29 years, which is at the upper range of the intermediate
maturities. In the corporate bond market, the average time to maturity is 9.18 years, similar to the median
9 The average Macaulay duration of corporate bonds in our sample is a little more than 6 years, less than the averagetime-to-maturity, while the average convexity is about 57 years. In the government sector, the average Macaulayduration is a little more than 6 years, and the convexity is about 59 years, comparable to the corporate bond sample.For municipal bonds, both Macaulay duration, at 8.11 years, and convexity, at almost 92 years, are the highest of thethree sectors.

11
time to maturity of 8.48 years reported in Schultz (1998).10 In the Treasury Bond market, the average time-
to-maturity is 8.63 years, slightly less than the corporate bond sector.
The average dollar value of a transaction is the largest in the government sector, at about $7.7
million for purchases and about $8.5 million for sales. In comparison, Fleming and Sarkar (1998) report the
trade size for the 10-year Treasury bond note as $5.70 million. For the municipal bond market, the average
dollar transaction is about $3.4 million for purchases and $3.9 million for sales. In the corporate bond
market, the mean dollar trade is about $4.40 million, both for sales and purchases, which is larger than the
median trade size of $1.513 million reported in Schultz (1998). The size of insurance company transactions
in our sample appears to be fairly representative of the size of the average dealer market transaction. As
evidence, the average size of a corporate bond trade on the New York Stock Exchange was $20,000 in 1997,
or less than one-half of one per cent of the size of a corporate bond trade in our sample. This is similar to the
trade size of all transactions on the over-the-counter market, relative to the exchange markets.
The mean age of the bonds is lowest in the Government bond market, at 2.75 years, and about 3.5
years in the other two markets.
4. A Comparison the Bid-Ask Spread in the Corporate, Government andMunicipal Bond Markets
A. Determinants of the Bid-Ask Spread for the Corporate, Government and Municipal BondMarkets using the Generalized Method of Moments (GMM) Estimation
In the previous section, we saw that the three sectors differ in the level of trading activity and
measures of risk, and these differences may account for the differences in the spread. For example, the
municipal bond sector has the highest mean spread but also the lowest level of trading volume and the
highest volatility. In section B, we separately examine the set of factors that determine the bid-ask spread in
each market. In section C, we directly compare the bid-ask spread in the three sectors, based on our results
in section B.
10 These numbers compare well with those in the Merrill Lynch Taxable Bond Index, Corporate Master, which reportsthat the average maturity of corporate issues with $10 million or more outstanding has declined continuously from about20 years in 1978 to 13 years and 7 months in 1988.

12
Preliminary diagnostics indicated the presence of significant heteroskedasticity in the error term of
an equation of the form of (1). Since the functional form of heteroskedasticity in the error terms is unknown,
to proceed ahead with an OLS-type estimation with an assumption of the functional form, would in all
likelihood leave us with a mis-specified model with its associated problems. To ensure that our results are
robust to this possibility, we estimate the price change regression by the more robust Generalized Method of
Moments (GMM) technique proposed by Hansen (1982). Note that, unlike the OLS procedure, the GMM
technique demands very weak assumptions on the error term -- only that it have well-defined unconditional
moments, including when the moments are conditionally varying. Hence we use the GMM technique to
estimate the following regression specification:
Spreadt = Intercept + a1 Maturityt + a2 Aget + a3 BVolumet + a4 1997t
+ Additional Dummy variables + errort (1)
where, for a specific bond on day t, the explanatory variables are defined as follows.
Spreadt: the daily bid-ask spread for the bond in dollars.
Maturityt: the time-to-maturity for the bond in years. A higher value is likely to increase volatility and,
therefore, spreads.
Aget: the time in years between the bond transaction date and its issuance date.
BVolumet: the log of the daily dollar value of purchases for the bond. We do not include both purchases and
sales in the same regression, since the two variables are highly correlated. However, in a later specification,
we substitute the log of the daily dollar value of sales for BVolume.
1997t: a dummy variable taking the value one if the bond traded in the year 1997, and 0 otherwise. The
transaction year dummy is included to control for structural changes in the market. As stated in the
introduction, these markets have been under increasing public scrutiny in the past few years and
several regulatory changes have been proposed. It may be that these external events have caused changes in
dealer behavior, as Christie et al (1994) have documented for the NASDAQ market.
Additional dummy variables: for both the corporate and municipal sectors, we control for credit risk with

13
dummy variables for bonds with Moody’s ratings in the categories A1 to A3. For example, the dummy A1 is
one for bonds rated A1 by Moody's, and zero otherwise. Also, we define a Utility Sector dummy with value
one for bonds issued by Utility companies, and zero otherwise.
For the corporate sector alone, we include additional dummy variables for bonds with Moody’s
ratings BAA1 to BAA3. We also define the dummy variable AAA & AA, which is one for bonds, rated
AAA or AA by Moody's, and zero otherwise. We combine these bonds because we only have 48 AAA rated
bonds in the corporate bond sample. The omitted rating category is Junk, those bonds rated Ba or below by
Moody’s.
For the municipal sector alone, we include a dummy variable for bonds with Moody’s rating AA,
and another dummy variable Below A3, which is one for bonds rated below A3 by Moody’s, and zero
otherwise. This category combines bonds rated BAA1 and below since the number of bonds in each of the
combined categories was too small. The omitted rating category is AAA, those bonds rated AAA by
Moody’s.
B. GMM Regression Results for Individual Markets
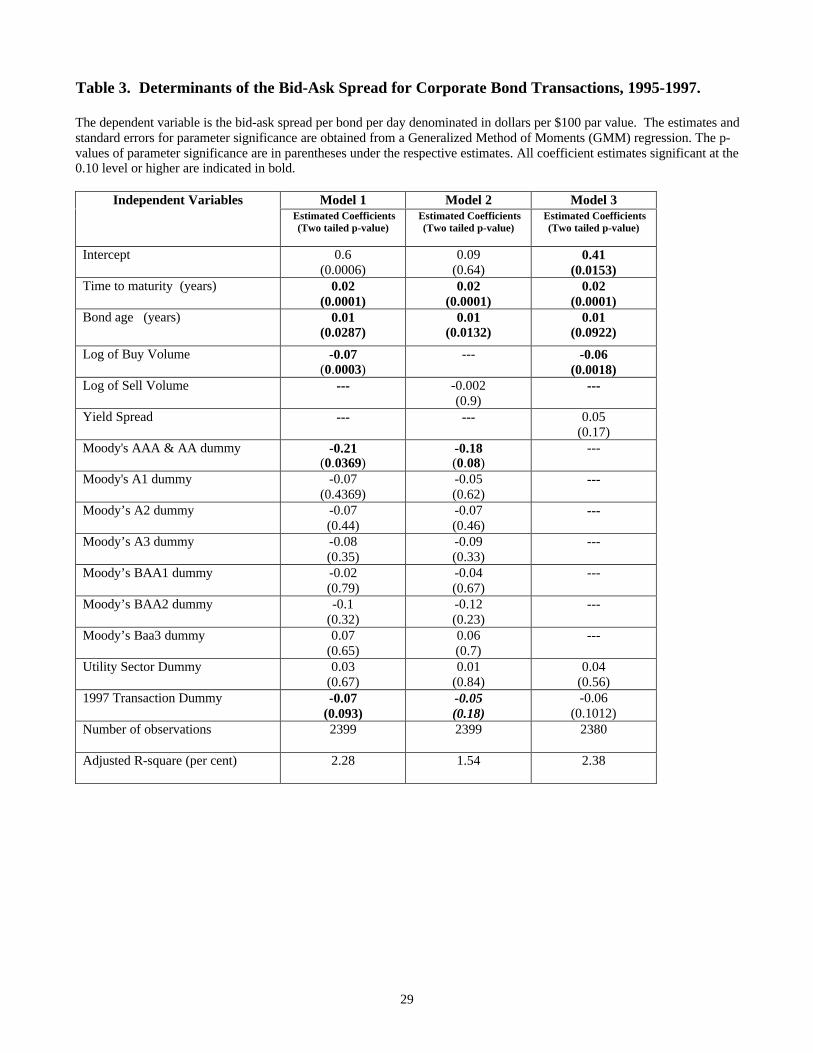
The second column of Table 3, titled Model 1, shows the results of estimating regression (1) for the
corporate bond sector. The adjusted R-square is 2.28 per cent and estimated coefficients of all the non-
dummy explanatory variables are significant. Two of the estimated dummy coefficients are significant as
well. Of the significant estimates, the coefficient on Maturity is positive, indicating that the spread increases
by 2 cents for every one-year increase in the remaining time to maturity of a bond. The coefficient on Age is
also positive, indicating that the spread increases by one cent when the bond ages by one more year. An
additional $1 million purchase decreases the spread by about 7 cents, consistent with the idea that bond
purchases are primarily viewed as liquidity events. Of the credit rating dummies, the coefficient on the
combined AAA/AA dummy is negative, and indicates that the spread on these bonds is 21 cents lower relative
to corporate junk bonds. The remaining credit rating dummies are not significant. Finally, the bid-ask
spread for corporate bonds decreased by 7 cents in 1997, relative to the previous two years. The utility sector
dummy is not significant.

14
The second column of Table 4, titled Model 1, shows the results for estimating regression (1) for the
government bond sector. The adjusted R-square is essentially zero. While the estimated coefficients have
the predicted signs, none are significant. These results indicate that our specification cannot capture the
determinants of the realized bid-ask spread in the government sector.
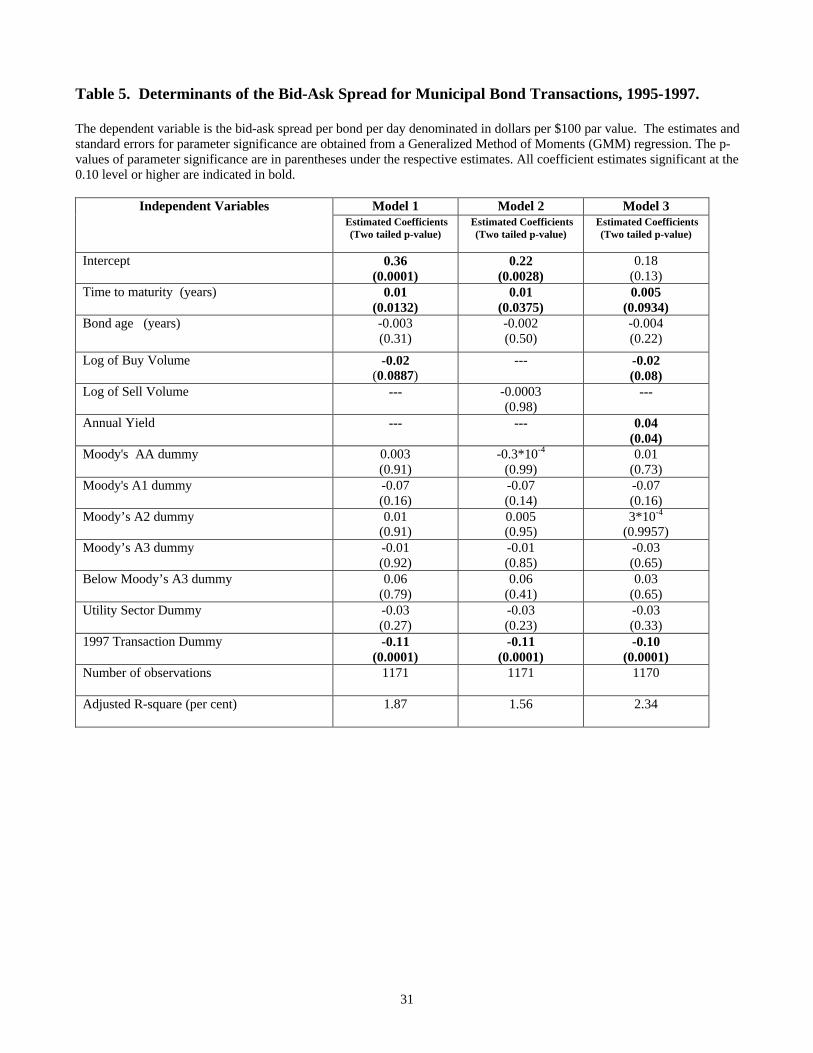
The second column of Table 5, titled Model 1, shows the results for estimating regression (1) for the
municipal bond sector. The adjusted R-square is 1.87 per cent. Similar to the corporate bond market,
estimated coefficients on the volatility and liquidity variables are significant. The bid-ask spread increases
by one cent with every additional year in the Maturity, and the spread decreases by 2 cents for an additional
$1 million purchase. This further confirms our conjecture that bond purchases are viewed as liquidity events.
Similar to the corporate market, the bond spread was lower in 1997 by 11 cents relative to the previous two
years. Unlike the corporate sector, the Age of the bond is not a significant determinant of the bid-ask spread.
Further, none of the credit sector dummies have significant coefficients.
In our second regression specification, we reestimate regression (1) using GMM, but after
substituting SVolume for BVolume, as follows:
Spreadt = Intercept + a1 Maturityt + a2 Aget + a3 Svolumet + a4 1997t
+ Additional Dummy variables + errort (2)
where SVolumet is the log of the daily dollar value of sales of a bond on day t and the additional dummy
variables are the same set described earlier for Model 1.
Our conjecture is that the sale of corporate and municipal bonds may be information driven, leading
dealers to widen the bid-ask spread. This conjecture is not supported by the results for the corporate and
municipal bond sectors, presented in the third column (titled Model 2) of Tables 3 and 5. The coefficient of
SVolume is negative and not significant in both markets, and its effect in these two markets is to lower the
adjusted R-square. However, the sign and significance of the remaining variables are unaffected in both
markets. In the government sector, since there is no private information, we interpret SVolume as a liquidity
variable. The results are in the third column, titled Model 2, of Table 4. Consistent with our interpretation,
the coefficient of SVolume is negative and significant, and its effect is to increase the adjusted R-square to

15
1.04 per cent from zero in Model 1.
For the final regression specification, we use unique explanatory variables that may help determine
the bid-ask spread for a particular sector. Specifically, for the corporate bond market, we replace the credit
rating dummy variables with the Yield Spread, as follows:
Spreadt = Intercept + a1 Maturiyt + a2 Aget + a3 Bvolumet + a41997t + Yield Spreadt
+ Utility sector dummy + errort (3a)
where Yield Spreadt is defined as the difference between the yield on the bond on day t and the three month
Treasury Bill rate on day t. We calculate the corporate yield on the basis of the accrued interest convention
used in the market. The Yield Spread measures the market’s valuation of credit risk, and so we expect the
bid-ask spread to increase with it.
The results are in column four (titled Model 3) of Table 3. As expected, the estimated coefficient of
Yield Spread is positive, but not significant. The adjusted R-square improves slightly relative to Model 1,
but the 1997 transaction dummy is no longer significant. The sign and significance of the remaining
estimates do no change from Models 1 and 2.
For the municipal bond market, we use the additional explanatory variable Annual Yield,
as follows:
Spreadt= Intercept + a1 Maturityt+ a2 Aget + a3 Bvolumet + a4 1997t + Annual Yieldt
+ Credit Ratings dummies + Utility sector dummy + errort (3b)
where Annual Yield is just the yield of the bond on day t. Since the Yield is a before-tax return, we hope to
capture tax subsidies embedded in the municipal bonds with this variable. A lower yield implies a higher tax
subsidy, which makes the bond more attractive, and so we expect the Annual Yield to be positively associated
with the bid-ask spread.
The results are in column four (titled Model 3) of Table 5. As predicted, the estimated coefficient of
Annual Yield is positive and coefficient, indicating that the bid-ask spread decreases by 4 cents for every one
per cent decrease in the yield. Estimates that were significant in Models 1 and 2 remain so. The adjusted R-
square improves, and the intercept is no longer significant, indicating a better fit for Model 3 compared to the

16
other Models.
For the government bond market, we substitute the Time To Maturity variable with the Term
Structure variable, as follows:
Spreadt = Intercept + a1 Term Structuret + a2 Aget + a3 Svolumet + a41997t + errort (3c)
where Term Structuret is defined as the difference between the yield on the government bond on day t and
the three month Treasury Bill rate on day t. The Term Structure measures the market’s valuation of maturity
risk, and so we expect the bid-ask spread to increase with it. The result is reported in column four (titled
Model 3) of Table 4. Although the adjusted R-square increases significantly from 1.04 per cent in Model 2
to 3.86 per cent, the estimated coefficient of Term Structure is not significant, although it has the right sign.
C. A Comparison of the Bid-Ask Spread in the Corporate, Government and Municipal BondMarkets -- A Pooled Regression Approach
In this section, we pool observations across the three market sectors to test whether -- controlling for
volatility, credit risk and liquidity -- bid-ask spreads are different in the three sectors. A potential problem
with pooling is that it assumes a common set of variables explaining variations in the bid-ask spread in all
markets, whereas the results from section B indicate some differences in the set of explanatory variables
across markets. Our approach is to start with a set of explanatory variables that were found to be significant
in all different regression specifications used in the corporate and municipal markets, and later check whether
the results are sensitive to different specifications for the government sector. This leads us to use Model 1 as
our initial specification.
Accordingly, we estimate (1) with the pooled data. The additional explanatory variables are a
dummy for Corporate sector bonds and another dummy for the Municipal sector bonds. The coefficients of
these dummies indicate whether corporate and municipal bonds have higher bid-ask spreads than government
bonds, after controlling for other factors. To avoid collinearity between these dummies and the intercept, we
omit the intercept term. The remaining explanatory variables are the same as before, except for the credit
rating dummies. We define a dummy for every rating category except AAA. Thus, we start with the AA
dummy and end with the Junk dummy, which includes all ratings categories Ba and below.

17
The results are reported in column two (titled Model 1) of Table 6. The bid-ask spread for municipal
sector bonds is higher by 9 cents per $100 par value compared to government bonds, but bid-ask spreads for
corporate and government bonds are not statistically different. In addition, bid-ask spreads were lower for all
sectors by 7 cents in 1997, compared to the previous two years. Estimates of the time to maturity, the age of
the bond, and the BAA3 dummy are also significant, and have the correct signs.
D. Robustness Checks
From the results in section 5B, Model 1 is a poor fit in the government sector, but a good fit for the
Corporate and Municipal bond sectors. So, we repeat the analysis of section 5C, except that we pool
observations from the Corporate and the Municipal markets only. We drop the Corporate sector dummy and
retain the Municipal sector dummy. For consistency, we require that the bid-ask spread in the municipal
sector should be about 9 cents higher than in the corporate sector. Further, the remaining estimates should be
stable in their signs, magnitude and significance.
The results for this exercise are reported in column three (titled Model 2) of Table 6, and they are
consistent with our requirements. The bid-ask spread in the municipal bond sector is significantly higher
than that in the corporate sector by 8 cents, and the remaining estimates are robust with respect to sign,
magnitude and significance.
As a further robustness check, we reestimate (1) for the Corporate and Government bond markets
only, but replacing BVolume with TVolume, the log of the total daily dollar value of transactions. This
substitution is meant to account for the fact that, in the individual market regressions, the estimated
coefficient of BVolume is negative and significant but the estimated coefficient of SVolume is not significant
for the Corporate bond market; while the opposite is true for the Government bond market. For this
specification, we only use the Corporate sector dummy. For consistency, we require that the coefficient on
the Corporate sector dummy should not be different from zero. The results, which are reported in column
four (titled Model 3) of Table 6, show that this is indeed the case.
As a final robustness check, we estimate the bid-ask spread in the corporate and municipal markets
as a seemingly unrelated regression system (SUR). We use the estimates of the SUR regressions as initial

18
values in a system-GMM specification. An advantage of the SUR method is that the bid-ask spread in each
market can be explained by the set of explanatory variables best suited for that market, and yet the common
information in each market is also accounted for by the contemporaneous correlation between the error
terms. Thus, by strategically combining the SUR and GMM techniques, we are able to simultaneously
account for both the heteroskedastic error terms as well as the contemporaneous correlation in the error terms
across the two markets.
To implement the SUR estimation technique, we need to create a new sample based on a single daily
average number for each relevant variable in each market sector.11 This implies that we consider only those
days when there is trading in all relevant markets. In the same spirit, the credit ratings are assigned
numerical values to obtain an average credit rating for different bonds trading on the same day. As the
regression specification, we use Model 1 from Tables 3 and 5. The results (not reported, but available upon
request) are qualitatively similar to those found earlier. Specifically, the bid-ask spread that cannot be
predicted from the SUR/GMM estimation is higher by about 2 cents for the municipal market, relative to the
corporate market.
Thus, the extensive robustness tests performed in this section appear to attest to the stability of our
regression estimates in the three markets
E. The Factors That Determine Spreads In The Three Market Sectors
In summary, what are the relevant factors determining realized bond spreads in the three market
sectors examined in this paper? Liquidity, as measured by Bvolume/ SVolume in all three market sectors and
also by Age in the corporate sector are important determinants of spread. Further, the Maturity risk factor
appears to be an important determinant of spreads in all three market sectors although its impact on the
government sector is relatively indirect compared to the corporate and municipal sectors. Not surprisingly,
credit risk is an important determinant of spreads in the corporate and municipal sectors. Finally, the
municipal sector has an additional tax factor in Yield that significantly determines the spread in this market.
11 Other relevant details of SUR estimation are provided in Greene (1993).

19
5. The Effect of Large Institutions and Dealers on the Bid-Ask Spread
In this section, we examine the effects of large institutions and large dealers on the realized bid-ask
spreads. Keim and Madhavan (1997) document significant differences in equity trading costs across
institutions even after adjusting for differences in trading styles. Cao, Choe and Hathaway (1997) and
Corwin (1998) document significant heterogeneity among NYSE specialist firms. In a similar vein, the bid-
ask spread for large bond dealers and institutions may differ from smaller dealers and institutions.
Table 7 shows the top Institutions within each market sector with a cumulative market share of just
over 50% of the average dollar value of trades over the sample period. Panel A presents the top 20
Institutions in the corporate sector, panel B presents the top 17 Institutions in the government sector and
panel C presents the top 15 Institutions in the municipal market. In all three panels, the top 4-5 institutions
in each market sector account for over 25% of the dollar-value of all trades. The list of large institutions
include some money management firms acting as agents of insurance companies. The CAI transactional
database reports the institution doing the trading regardless of whether the institution is a bond-portfolio
manager or the end user of the bonds.
Table 8 lists the top bond dealers with at least 50% of the market share of the average trading
revenues in each of the three market sectors. The total and average dealer revenues are calculated as the
difference between dealer sales and dealer purchases. It takes fewer dealers than institutions to account for a
50% market share, which suggests that there may be greater concentration among dealers than among
institutions in each of the market sectors.
A. The Bid-Ask Spread for the Ten Largest Dealers and the Others
We calculate the bid-ask spread for the top-10 dealers by dollar value traded and those for the
remaining dealers in each market sector. For bonds with at least one buy and one sell per dealer each day,
we subtract the average sell price of each bond per day per dealer from the average buy price of the same
bond over the same day by the same dealer. The average bid-ask spread per top-10 dealer per bond per day

20
is calculated by averaging the bid-ask spread per dealer per bond per day over all top-10 dealers. The
average bid-ask spread for the non-top-10 dealers is similarly calculated.
Panel A of Table 9 presents the bid-ask spread for the ten largest dealers and the remaining dealers in
each market sector, identified from the lists in Table 8. We use a Wilcoxon non-parametric test of equality
of medians to test whether the bid-ask spread is statistically different between the two dealer groups. In the
Corporate sector (panel A), the mean bid-ask spread is 26 cents for the ten largest dealers and 13 cents for the
other dealers, and the difference is significant at the 0.01 level. In the Municipal sector, the mean bid-ask
spread is 20 cents for the ten largest dealers and 19 cents for the others, a difference also significant at the
0.01 level. Finally, in the Government sector, there is no statistical difference between the bid-ask spread of
the top-10 dealers and the rest.
B. The Bid-Ask Spread for the Ten Largest Institutions and the Others
Panel B of Table 9 presents the bid-ask spread for trades of the top-10 institutions and those of other
institutions, in each market sector. The top-10 institutions in each market sector are identified from Table 7.
The bid-ask spread is not statistically different (at the 0.10 level) for the ten largest institutions and others in
the corporate and government sectors. For example, in the Corporate sector, the mean bid-ask spread is
about 14 cents for the top-10 and 15 cents for the non-top-10 institutions. In the Government sector, the
mean bid-ask spread is 4 cents for with top-10 institutions and 9 cents for the others. In the municipal sector,
the mean bid-ask spread is 25 cents for the top-10 institutions and about 16 cents for the non-top-10
institutions. Although the numbers for the municipal sector are distinct from the other two market sectors, it
should be emphasized that, before drawing any definitive conclusions, a multivariate analysis of the bid-ask
spreads, controlling for its various determinants, needs to be performed. We do this in section 5D.
C. Characteristics of Bonds Traded by the Ten Largest Dealers and Others
From panel A of Table 9, we see that the spreads associated with the top-10 dealer transactions are

21
significantly higher that those associated with the non-top-10 dealers. It is likely that this difference could
arise from a significantly different (and riskier) universe of bonds traded by the top-10 dealers.
To investigate if the top-10 dealer population does indeed trade a different universe of bonds than
does the non-top-10 population, we present in Table 10 a break down of the percentage of common and
distinct bonds transacted by each group of dealers within each market sector. Table 10 shows that, in the
Corporate sector, only about 8% of the bonds are common to both groups, the ten largest dealers and the
others. In the Government and municipal sectors, the per cent of commonly traded bonds are about 30% and
2%, respectively. Thus, the top-10 dealers appear, for the most part, to be dealing in bonds that are distinct
from those traded by the rest of the dealers.
To investigate if the top-10 dealer population trade inherently riskier bonds compared to the non-top-
10 dealers, we present, in Table 11, summary statistics of the specific bond characteristics traded by the two
groups of dealers for each market sector. In the corporate sector (panel A), bonds traded by the top-10
dealers have higher yields, higher duration, higher convexity, longer time to maturity, lower age and
somewhat lower coupon rates. In the government sector, characteristics of bonds traded by the top-10 dealers
and the rest do not appear to be different. In the municipal sector (panel C), the annual duration of the top-10
dealer executed bonds is higher, and the bonds are younger. Thus, the evidence suggests that, in the
corporate and municipal sectors, the top-10 dealers execute bonds that are riskier but more active (younger)
than the non-top-10 dealers. However, the evidence for the municipal bonds is weaker than that for
corporate bonds. While riskier bonds would command higher spreads, younger bonds are more liquid and,
ceteris paribus, would argue for lower spreads. The resultant higher spreads observed for the top-10 dealer
executed bonds would then be the net of the two counteracting forces.
D. Is the Bid-Ask Spread Higher for Large Dealers and Institutions?
In Table 12, we examine whether the ten largest dealers earn higher spreads, after controlling for

22
differences in the characteristics of bonds traded by the dealer groups. We regress the realized bid-ask
spread per bond for each dealer on a dummy variable that equals one if the dealer belongs to the Top 10
group, and is zero otherwise. In addition, we include variables that proxy for the risk and liquidity of the
bonds. The regression specifications are the ones earlier found to provide the best explanation of the bid-ask
spread in each sector (see Tables 3 to 5). To be specific, they correspond to model one for the corporate and
municipal sectors, and model 2 for the government sector.
The results show that the ten largest corporate bond dealers earn 15 cents per $100 par value more
than the other dealers, after controlling for bond characteristics. This result does not change when we also
control for the other bond characteristics reported in Table 11, such as duration, convexity, the coupon rate
and the annual yield. In the other two markets, the differences between the bid-ask spreads of the ten largest
dealers and the rest are not significant.
The results for large institutions (not reported) are consistent with the results in Panel B of Table 9.
After controlling for bond characteristics, the bid-ask spread is not different for the ten largest institutions
compared to the others.
In summary, our multivariate results substantiate the univariate results of section C and attest to the
robustness of our conclusions.
6. Conclusion
In the current paper, we estimate the liquidity of the U.S. corporate, municipal and government bond
markets for the years 1995 to 1997, based on newly available transactions data pertaining to the bond dealer
markets. Since these three markets vary with respect to transparency and risk, a cross-market comparison is
a natural experiment in studying the effects of these factors on market liquidity.
We find that, on a $100 par value basis, the mean spread is the highest in the municipal bond market
at about 22 cents, followed by the corporate bond market at about 21 cents and the government bond market
at about 11 cents. The spread is generally higher for bonds with lower Moody’s ratings, and lower in

23
1997 than in the earlier years for all markets. In the corporate and municipal markets, the spread appears
to have decreased in each successive year.
We examine the determinants of the realized bid-ask spread using the GMM technique and find that
liquidity is an important determinant of the realized bid-ask spread all three markets. Specifically, in all
markets, the realized bid-ask spread decreases in the trading volume. Additionally, risk factors are important
in the corporate and municipal markets. In these markets, the bid-ask spread increases in the remaining-
time-to-maturity of a bond. The corporate bond spread also increases in credit risk and the age of a bond.
The municipal bond spread increases in the after-tax bond yield. Additionally, the bid-ask spread is lower in
1997 compared to the previous two years--by 7 cents for corporate bonds and 10 cents for municipal bonds.
However, this is not the case in the government bond market. The result is consistent with the idea that
transparency in the corporate and municipal bond markets has improved, perhaps as a consequence of
increased regulatory scrutiny. Finally, in a pooled regression framework, we find that the municipal bond
spread is higher than the government bond spread by about 9 cents per $100 par value, but the corporate
bond spread is not.
We also find that the bid-ask spread for the ten largest dealers in our sample is statistically higher
than that of other dealers in the corporate and the municipal bond markets. After controlling for differences
in characteristics of bonds traded by the large dealers and others, we find that the corporate bond dealers earn
15 cents per $100 par value higher than the other dealers but, in the municipal bond market, the bid-ask
spread is not different for the large dealers.
24
References
Aiyagari, S.R., and Gertler, 1991, Asset returns with transactions costs and uninsured individual risk, Journalof Monetary Economics, 27, 311-331.
Amihud, Y., and H. Mendelson, 1986, Asset pricing and the bid-ask spread, Journal of Financial Economics,17, 223-249.
-------------------------------------, 1991, Liquidity, maturity and the yields on U.S. Treasury securities, Journalof Finance, 66, 1411-1425.
Bencivenga, J. C., 1995, The high-yield corporate bond market, in F. J. Fabozzi and T. D. Fabozzi (eds.), TheHandbook of Fixed Income Securities, Irwin Professional Publishing, New York.
Cao, C., Choe, H. and F. Hatheway, 1997, Does the Specialist Matter? Differential ExecutionCosts and Inter-security Subsidization on the NYSE, Journal of Finance, 52, 1615-40.
Chakravarty, S., A. Sarkar, L.Wu, 1998, Estimating the adverse selection and fixed costs of trading inmarkets with multiple informed traders, working paper, Federal Reserve Bank of New York.
Corwin, S. A., 1998, Differences in Trading Behavior Across New York Stock Exchange SpecialistFirms, forthcoming Journal of Finance.
Easley, D., and M.O’Hara, 1987, Price, trade size and information in securities markets, Journal of FinancialEconomics, 19, 69-90.
Fabozzi, F.J., 1996, Bond markets, analysis and strategies, 3rd Edition, Prentice Hall, New Jersey.
Fleming, M. and A. Sarkar, 1998, Liquidity in the U.S. Treasury Spot and Futures markets, working paper,Federal Reserve Bank of New York.
Glosten, L.R., and L.E. Harris, 1988, Estimating the components of the bid/ask spread, Journal of FinancialEconomics, 21, 123-142.
Glosten, L.R., and P. Milgrom, 1985, Bid, ask and transaction prices in a specialist market withheterogeneously informed traders, Journal of Financial Economics, 14, 71-100.
Greene, W.H., 1993, Econometric analysis, Prentice Hall, third edition.
Grossman, S. J. and M. H. Miller, 1988, Liquidity and Market Structure, Journal of Finance, 43, 3, 617-37.
Grossman, S. J., 1988, An Analysis of Implications for Stock and Futures Price Volatility ofProgram Trading and Dynamic Hedging Strategies, Journal of Business, 61, 275-98.
Hansen, L., 1982, Large sample properties of generalized method of moments estimators, Econometricia, 50,1029-1084.
Hickman, W. B., 1960, Statistical measures of Corporate Bond financing since 1900, Princeton UniversityPress, Princeton, NJ.
25
Hong, G., and A. Warga, 1998, An empirical study of bond market transactions, working paper, Universityof Houston.
Kane, A., 1994, Trading cost premiums in capital asset returns: A closed form solution, Journal of Bankingand Finance, 18, 1177-1183.
Keim, D.B., and A. Madhavan, 1997, Transactions costs and investment style: an inter-exchange analysis ofinstitutional equity trades.
Kyle, A.S., 1985, Continuous auctions and insider trading, Econometrica, 53, 1315-1335.
Leland, H., 1994, Corporate debt value, bond covenants, and optimal capital structure, Journal of Finance,69, 1213-1252.
Madhavan, A., and S. Smidt, 1993, An analysis of daily changes in specialist inventories and quotations,Journal of Finance, 48, 1595-1628.
Madhavan, A., 1995, Consolidation, Fragmentation, and the Disclosure of Trading Information, Review ofFinancial Studies, 8, 3, 579-603.
Merton, R.C., 1973, On the pricing of corporate debt: the risk structure of interest rates, Journal of Finance,
Naik, N., A. Neuberger and S. Viswanathan, 1994, Disclosure regulation in competitive dealership markets:An analysis of the London Stock Exchange, London Business School, Institute of Finance and Accounting,Working Paper No. 193.
Pagano, M. and A. Roell, 1996, Transparency and Liquidity: A Comparison of Auction and Dealer Marketswith Informed Trading, Journal of Finance, 51, 2, 579-612.
Roell, Ailsa. 1992, Comparing the Performance of Stock Exchange Trading Systems" in J. Fingleton and D.Schoemaker, (eds) The Internationalization of Capital Markets and the Regulatory Response (Graham andTrotman, London).
Schultz, P., 1998, Corporate bond trading costs and practices: A peek behind the curtain, working paper,University of Notre Dame.
Vayanos, D., 1998, Transactions costs and asset prices: A dynamic equilibrium model, Review of FinancialStudies, 11, 1-58.
Vayanos, D., and J.L. Vila, 1998, Equilibrium interest rate and liquidity premium with transaction costs,forthcoming, Economic Theory.
Yu, D., 1998, Equilibrium liquidity structure, working paper, Board of Governors of the Federal ReserveSystem, Washington, D.C.

26
Table 1A. Distribution of the Raw Bid-Ask Spread (in Dollars) of Corporate, Government and Municipal Bonds, 1995-97.
CORPORATE SECTOR GOVERNMENT SECTOR MUNICIPAL SECTOR
Panel A
Num ofdistinctbonds
Num ofobs
Mean Median Std Dev Num ofdistinctBonds
Num ofobs
Mean Median Std Dev Num ofdistinctbonds
Num ofobs
Mean Median Std Dev
Whole Sample 1779 2499 0.2113 0.0400 1.0003 225 1932 0.1107 0.0452 1.7250 1118 1172 0.2218 0.1003 0.4059
1995 540 625 0.2996 0.1328 1.5059 89 526 0.1296 0.0288 2.2080 307 308 0.3217 0.2161 0.5114
1996 701 1033 0.1882 0.0000 0.8115 72 738 0.1508 0.0418 1.9278 380 391 0.2134 0.1000 0.4152
1997 538 841 0.1739 0.0450 0.6883 64 668 0.0514 0.0503 0.8157 431 473 0.1636 0.0684 0.2938
Panel BFor Moody's AABonds
192 256 0.1071 0.0000 0.8663 384 414 0.2299 0.1269 0.3993
For Moody's ABonds
749 1069 0.2058 0.0000 0.6390 127 133 0.1817 0.1200 0.3976
For Moody's JunkBonds
280 374 0.2314 0.1093 1.5392
Panel CIndustrial/Service 798 1169 0.2051 0.0685 1.0100
Banking/Finance 562 775 0.1728 0.0000 0.6088
Utility 252 330 0.2622 0.1000 1.0100 222 236 0.2127 0.1259 0.2923
Health Care 21 24 0.3923 0.0978 0.6565
Note:
• All spreads across the market sectors are statistically distinct at the 0.01 level (from Wilcoxon non-parametric tests).
• Spreads in panel B are not statistically different from one another at the 0.10 level (from Wilcoxon non-parametrictests).

27
Table 1B. Distribution of the Volume-weighted Raw Bid-Ask Spread (in Dollars) of Corporate, Governmentand Municipal Bonds, 1995-97.
CORPORATE SECTOR GOVERNMENT SECTOR MUNICIPAL SECTOR
Panel A
Num ofdistinctbonds
Num ofobs
Mean Median Std Dev Num ofdistinctBonds
Num ofobs
Mean Median Std Dev Num ofdistinctbonds
Num ofobs
Mean Median Std Dev
Whole Sample 1779 2499 0.2150 0.0400 0.9967 225 1932 0.0813 0.0389 1.7953 1118 1172 0.2209 0.1000 0.4031
1995 540 625 0.2997 0.1328 1.4877 89 526 0.0844 0.0220 2.2346 307 308 0.3191 0.2149 0.5033
1996 701 1033 0.1986 0.0000 0.8211 72 738 0.1241 0.0381 2.0732 380 391 0.2137 0.1000 0.4161
1997 538 841 0.1724 0.0461 0.6889 64 668 0.0315 0.0484 0.8041 431 473 0.1629 0.0684 0.2925
Panel BFor Moody's AABonds
192 256 0.1249 0.0000 0.8083 384 414 0.2291 0.1283 0.3984
For Moody's ABonds
749 1069 0.2065 0.0000 0.6508 127 133 0.1813 0.1200 0.3972
For Moody's JunkBonds
280 374 0.2433 0.1154 1.5452
Panel CIndustrial/Service 798 1169 0.2078 0.0800 1.0089
Banking/Finance 562 775 0.1769 0.0000 0.5894
Utility 252 330 0.2663 0.1000 1.0159 21 24 0.3904 0.0982 0.6455
Health Care 222 236 0.2110 0.1228 0.2928
Note:
• All spreads across the market sectors are statistically distinct at the 0.01 level (from Wilcoxon non-parametric tests).
• Spreads in panel B are not statistically different from one another at the 0.10 level (from Wilcoxon non-parametrictests).
28
Table 2. Distribution of Bond Characteristics in the Corporate, Government and MunicipalSectors, 1995-1997.
Panel A: Corporate Bonds
VARIABLE Num. DistinctBonds
Num.obs
MEAN STD MAX Q3 MED Q1 MIN
Annual yield 1776 2499 0.0735 0.0136 0.2332 0.0778 0.0710 0.0668 -0.0315
Duration 1776 2466 6.1239 2.5824 20.5000 7.1823 5.7664 4.2878 1.4430
Convexity 1776 2466 57.0012 57.9699 417.6770 61.7884 38.1697 20.9619 2.6335
Time to maturity 1792 2486 9.1777 7.4128 99.3425 9.7589 7.1164 4.8356 1.1890
Bond age 1792 2437 3.5765 4.6010 67.7753 4.3973 2.8630 1.5014 -0.6247
Coupon rate 1792 2477 0.0777 0.0148 0.1400 0.0875 0.0763 0.0675 0.0000
Average price 1805 2499 1022.28 72.45 1473.67 1058.25 1011.00 990.91 500.00
Dollar Buy volume 1805 2499 4.4229 7.6329 159.4490 5.3230 2.1160 0.9670 0.0600
Dollar sell volume 1805 2499 4.4457 5.4586 46.5220 5.3030 2.3560 1.0050 0.0010
Panel B: Government Bonds
VARIABLE Num. DistinctBonds
Num.obs
MEAN STD MAX Q3 MED Q1 MIN
Annual yield 209 1886 0.0635 0.0061 0.1141 0.0666 0.0629 0.0595 0.0475
Duration 209 1885 6.0749 2.9393 14.0636 7.1264 5.7506 3.9997 0.9790
Convexity 209 1885 58.7678 68.6032 289.7408 60.4080 37.6792 18.1126 1.3734
Time to maturity 222 1923 8.6256 7.2009 30.1083 9.2137 6.5562 4.3068 0.8356
Bond age 222 1666 2.7498 2.6225 20.9644 3.7507 2.2685 0.8658 -0.0164
Coupon rate 222 1893 0.0667 0.0096 0.1338 0.0725 0.0650 0.0600 0.0470
Average price 226 1932 1019.48 65.46 1417.40 1037.97 1008.78 993.00 509.34
Dollar buy volume 226 1932 7.7370 22.3724 365.7170 5.4015 1.6135 0.4830 0.0010
Dollar sell volume 226 1932 8.4548 23.5339 354.3880 6.6950 2.0780 0.7215 0.0010
Panel C: Municipal Bonds
VARIABLE Num. DistinctBonds
Num.obs
MEAN STD MAX Q3 MED Q1 MIN
Annual yield 1170 1229 0.0544 0.0086 0.1521 0.0568 0.0532 0.0500 0.0391
Duration 1170 1229 8.0922 2.7928 15.1074 10.1596 8.3730 5.9035 1.4620
Convexity 1170 1229 90.5676 60.9117 333.1750 126.4541 82.7718 39.5389 2.7886
Time to maturity 1170 1229 11.1836 5.5722 32.2877 14.4370 10.8000 6.7247 1.1918
Bond age 1170 1229 3.5109 3.6658 35.8247 4.0849 2.8685 1.6603 0.0137
Coupon rate 1170 1229 0.0577 0.0093 0.1263 0.0620 0.0565 0.0515 0.0313
Average price 1170 1229 1022.81 58.30 1386.64 1057.37 1020.09 994.21 540.05
Dollar Buy Volume 1170 1229 3.0384 3.4637 38.5240 4.3535 1.9505 1.0015 0.0200
Dollar sell volume 1170 1229 3.4732 3.9299 38.4880 4.9250 2.1245 1.0265 0.0030
29
Table 3. Determinants of the Bid-Ask Spread for Corporate Bond Transactions, 1995-1997.
The dependent variable is the bid-ask spread per bond per day denominated in dollars per $100 par value. The estimates andstandard errors for parameter significance are obtained from a Generalized Method of Moments (GMM) regression. The p-values of parameter significance are in parentheses under the respective estimates. All coefficient estimates significant at the0.10 level or higher are indicated in bold.
Model 1 Model 2 Model 3Independent Variables Estimated Coefficients
(Two tailed p-value) Estimated Coefficients
(Two tailed p-value) Estimated Coefficients
(Two tailed p-value)
Intercept 0.6(0.0006)
0.09(0.64)
0.41(0.0153)
Time to maturity (years) 0.02(0.0001)
0.02(0.0001)
0.02(0.0001)
Bond age (years) 0.01(0.0287)
0.01(0.0132)
0.01(0.0922)
Log of Buy Volume -0.07(0.0003)
--- -0.06(0.0018)
Log of Sell Volume --- -0.002(0.9)
---
Yield Spread --- --- 0.05(0.17)
Moody's AAA & AA dummy -0.21(0.0369)
-0.18(0.08)
---
Moody's A1 dummy -0.07(0.4369)
-0.05(0.62)
---
Moody’s A2 dummy -0.07(0.44)
-0.07(0.46)
---
Moody’s A3 dummy -0.08(0.35)
-0.09(0.33)
---
Moody’s BAA1 dummy -0.02(0.79)
-0.04(0.67)
---
Moody’s BAA2 dummy -0.1(0.32)
-0.12(0.23)
---
Moody’s Baa3 dummy 0.07(0.65)
0.06(0.7)
---
Utility Sector Dummy 0.03(0.67)
0.01(0.84)
0.04(0.56)
1997 Transaction Dummy -0.07(0.093)
-0.05(0.18)
-0.06(0.1012)
Number of observations 2399 2399 2380
Adjusted R-square (per cent) 2.28 1.54 2.38

30
Table 4. Determinants of the Bid-Ask Spread for Government Bond Transactions, 1995-1997.
The dependent variable is the bid-ask spread per bond per day denominated in dollars per $100 par value. The estimates andstandard errors for parameter significance are obtained from a Generalized Method of Moments (GMM) regression. The p-values of parameter significance are in parentheses under the respective estimates. All coefficient estimates significant at the0.10 level or higher are indicated in bold.
Model 1 Model 2 Model 3Independent Variables Estimated Coefficients
(Two tailed p-value) Estimated Coefficients
(Two tailed p-value) Estimated Coefficients
(Two tailed p-value)
Intercept 0.14(0.54)
0.91(0.0031)
0.42(0.18)
Time to maturity (years) 0.01(0.52)
0.01(0.37)
---
Bond age (years) 0.01(0.65)
-0.002(0.95)
-0.03(0.41)
Log of Buy Volume -0.01(0.62)
--- ---
Log of Sell Volume --- -0.11(0.0125)
-0.11(0.009)
Term Structure --- --- 0.63(0.15)
1997 Transaction Dummy -0.10(0.18)
-0.10(0.17)
-0.15(0.12)
Number of observations 1666 1666 1642
Adjusted R-square (per cent) -0.04 1.04 3.86
31
Table 5. Determinants of the Bid-Ask Spread for Municipal Bond Transactions, 1995-1997.
The dependent variable is the bid-ask spread per bond per day denominated in dollars per $100 par value. The estimates andstandard errors for parameter significance are obtained from a Generalized Method of Moments (GMM) regression. The p-values of parameter significance are in parentheses under the respective estimates. All coefficient estimates significant at the0.10 level or higher are indicated in bold.
Model 1 Model 2 Model 3Independent Variables Estimated Coefficients
(Two tailed p-value) Estimated Coefficients
(Two tailed p-value) Estimated Coefficients
(Two tailed p-value)
Intercept 0.36(0.0001)
0.22(0.0028)
0.18(0.13)
Time to maturity (years) 0.01(0.0132)
0.01(0.0375)
0.005(0.0934)
Bond age (years) -0.003(0.31)
-0.002(0.50)
-0.004(0.22)
Log of Buy Volume -0.02(0.0887)
--- -0.02(0.08)
Log of Sell Volume --- -0.0003(0.98)
---
Annual Yield --- --- 0.04(0.04)
Moody's AA dummy 0.003(0.91)
-0.3*10-4
(0.99)0.01
(0.73)Moody's A1 dummy -0.07
(0.16)-0.07(0.14)
-0.07(0.16)
Moody’s A2 dummy 0.01(0.91)
0.005(0.95)
3*10-4
(0.9957)Moody’s A3 dummy -0.01
(0.92)-0.01(0.85)
-0.03(0.65)
Below Moody’s A3 dummy 0.06(0.79)
0.06(0.41)
0.03(0.65)
Utility Sector Dummy -0.03(0.27)
-0.03(0.23)
-0.03(0.33)
1997 Transaction Dummy -0.11(0.0001)
-0.11(0.0001)
-0.10(0.0001)
Number of observations 1171 1171 1170
Adjusted R-square (per cent) 1.87 1.56 2.34

32
Table 6. Comparison of the Bid-Ask Spread for Corporate, Government and Municipal BondTransactions, 1995-1997.
The dependent variable is the spread per bond per day denominated in dollars per $100 par value. Model 1 includestransactions from Corporate, Government and Municipal bond markets. Model 2 includes transactions from the Corporateand Municipal Markets only. Model 3 includes transactions from the Corporate and Government Markets only. Theestimates and standard errors for estimating parameter significance are obtained from a Generalized Method of Moments(GMM) regression. The p-values of parameter significance are in parentheses under the respective estimates. All coefficientestimates significant at the 0.10 level or higher are indicated in bold.
Model 1 Model 2 Model 3Independent Variables
Corporate,Government
and MunicipalMarkets
Corporate andMunicipalMarkets
Corporate andGovernment
Markets
Time to maturity (years) 0.01(0.0019)
0.02(0.0001)
0.02(0.0001)
Bond age (years) 0.01(0.0179)
0.01(0.0004)
0.01(0.0237)
Log of Buy Volume -0.003(0.52)
-0.01(0.15)
---
Log of Total Volume --- --- -0.02(0.25)
Municipal Sector dummy 0.09(0.1)
0.08(0.0306)
---
Corporate Sector dummy 0.06(0.35)
--- 0.21(0.35)
Moody's AA dummy -0.03(0.25)
-0.01(0.67)
-0.11(0.42)
Moody's A1 dummy 0.03(0.57)
0.07(0.12)
0.04(0.75)
Moody’s A2 dummy 0.02(0.63)
0.07(0.13)
0.03(0.84)
Moody’s A3 dummy 0.02(0.77)
0.09(0.09)
0.01(0.97)
Moody’s BAA1 dummy 0.06(0.21)
0.14(0.0046)
0.06(0.65)
Moody’s BAA2 dummy -0.01(0.9)
0.07(0.34)
-0.02(0.86)
Moody’s Baa3 dummy 0.25(0.0479)
0.5(0.0001)
0.15(0.41)
Moody’s Below Baa3 (Junk) dummy 0.1(0.3)
0.15(0.11)
0.09(0.55)
Utility Sector Dummy -0.01(0.78)
-0.05(0.21)
0.02(0.77)
1997 Transaction Dummy -0.07(0.0106)
-0.08(0.0019)
-0.06(0.16)
Number of observations 5273 3570 2399
Adjusted R-square 0.0052 0.0083 0.0158
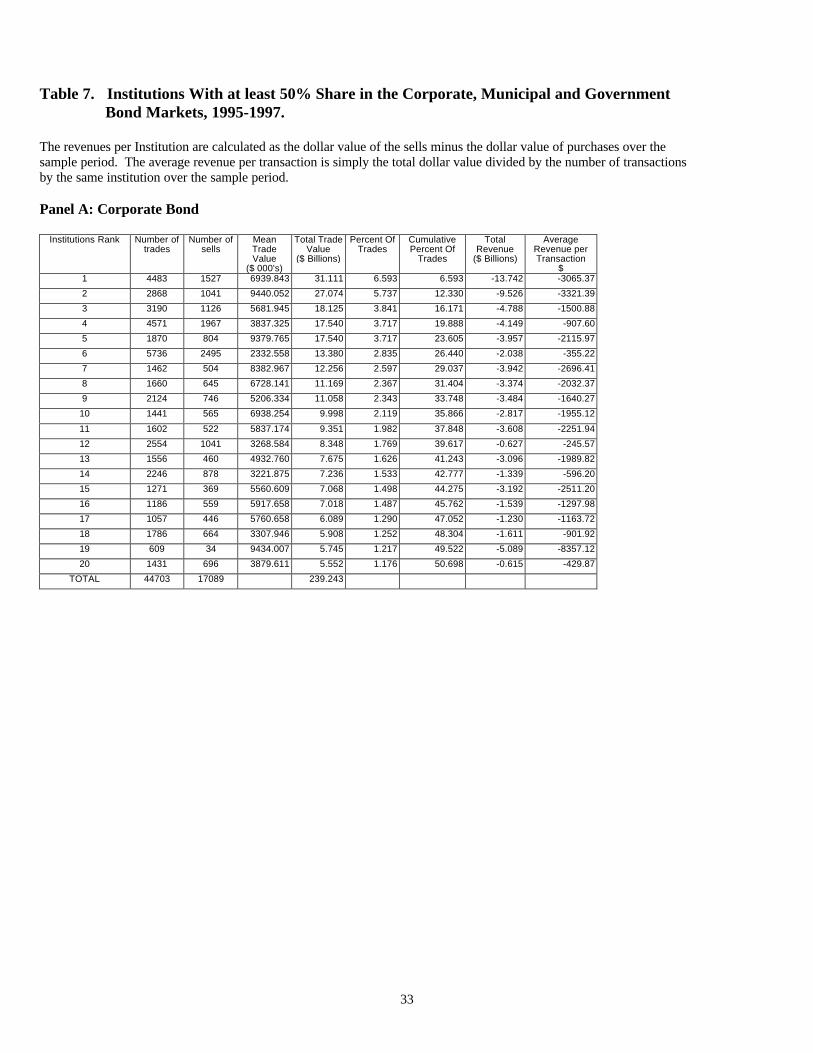
33
Table 7. Institutions With at least 50% Share in the Corporate, Municipal and GovernmentBond Markets, 1995-1997.
The revenues per Institution are calculated as the dollar value of the sells minus the dollar value of purchases over thesample period. The average revenue per transaction is simply the total dollar value divided by the number of transactionsby the same institution over the sample period.
Panel A: Corporate Bond
Institutions Rank Number oftrades
Number ofsells
MeanTradeValue
($ 000's)
Total TradeValue
($ Billions)
Percent OfTrades
CumulativePercent Of
Trades
TotalRevenue
($ Billions)
AverageRevenue perTransaction
$1 4483 1527 6939.843 31.111 6.593 6.593 -13.742 -3065.37
2 2868 1041 9440.052 27.074 5.737 12.330 -9.526 -3321.39
3 3190 1126 5681.945 18.125 3.841 16.171 -4.788 -1500.88
4 4571 1967 3837.325 17.540 3.717 19.888 -4.149 -907.60
5 1870 804 9379.765 17.540 3.717 23.605 -3.957 -2115.97
6 5736 2495 2332.558 13.380 2.835 26.440 -2.038 -355.22
7 1462 504 8382.967 12.256 2.597 29.037 -3.942 -2696.41
8 1660 645 6728.141 11.169 2.367 31.404 -3.374 -2032.37
9 2124 746 5206.334 11.058 2.343 33.748 -3.484 -1640.27
10 1441 565 6938.254 9.998 2.119 35.866 -2.817 -1955.12
11 1602 522 5837.174 9.351 1.982 37.848 -3.608 -2251.94
12 2554 1041 3268.584 8.348 1.769 39.617 -0.627 -245.57
13 1556 460 4932.760 7.675 1.626 41.243 -3.096 -1989.82
14 2246 878 3221.875 7.236 1.533 42.777 -1.339 -596.20
15 1271 369 5560.609 7.068 1.498 44.275 -3.192 -2511.20
16 1186 559 5917.658 7.018 1.487 45.762 -1.539 -1297.98
17 1057 446 5760.658 6.089 1.290 47.052 -1.230 -1163.72
18 1786 664 3307.946 5.908 1.252 48.304 -1.611 -901.92
19 609 34 9434.007 5.745 1.217 49.522 -5.089 -8357.12
20 1431 696 3879.611 5.552 1.176 50.698 -0.615 -429.87
TOTAL 44703 17089 239.243
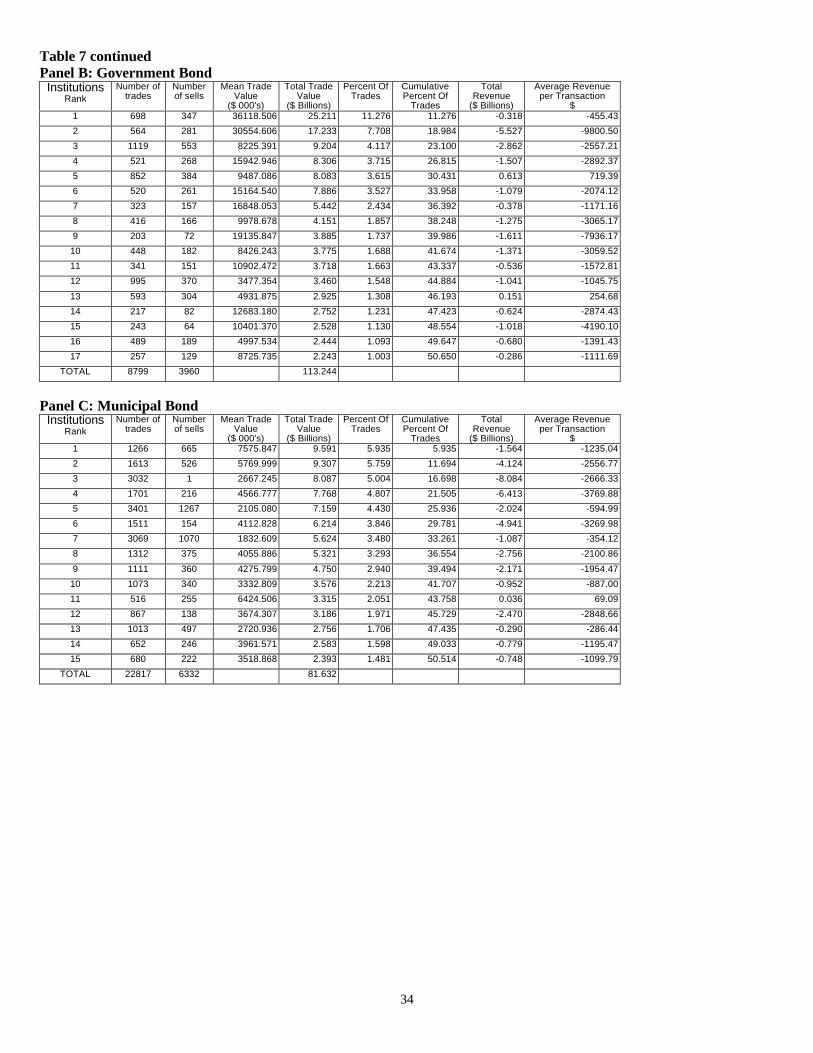
34
Table 7 continuedPanel B: Government Bond
InstitutionsRank
Number oftrades
Numberof sells
Mean TradeValue
($ 000's)
Total TradeValue
($ Billions)
Percent OfTrades
CumulativePercent Of
Trades
TotalRevenue
($ Billions)
Average Revenueper Transaction
$1 698 347 36118.506 25.211 11.276 11.276 -0.318 -455.43
2 564 281 30554.606 17.233 7.708 18.984 -5.527 -9800.50
3 1119 553 8225.391 9.204 4.117 23.100 -2.862 -2557.21
4 521 268 15942.946 8.306 3.715 26.815 -1.507 -2892.37
5 852 384 9487.086 8.083 3.615 30.431 0.613 719.39
6 520 261 15164.540 7.886 3.527 33.958 -1.079 -2074.12
7 323 157 16848.053 5.442 2.434 36.392 -0.378 -1171.16
8 416 166 9978.678 4.151 1.857 38.248 -1.275 -3065.17
9 203 72 19135.847 3.885 1.737 39.986 -1.611 -7936.17
10 448 182 8426.243 3.775 1.688 41.674 -1.371 -3059.52
11 341 151 10902.472 3.718 1.663 43.337 -0.536 -1572.81
12 995 370 3477.354 3.460 1.548 44.884 -1.041 -1045.75
13 593 304 4931.875 2.925 1.308 46.193 0.151 254.68
14 217 82 12683.180 2.752 1.231 47.423 -0.624 -2874.43
15 243 64 10401.370 2.528 1.130 48.554 -1.018 -4190.10
16 489 189 4997.534 2.444 1.093 49.647 -0.680 -1391.43
17 257 129 8725.735 2.243 1.003 50.650 -0.286 -1111.69
TOTAL 8799 3960 113.244
Panel C: Municipal BondInstitutions
RankNumber of
tradesNumberof sells
Mean TradeValue
($ 000's)
Total TradeValue
($ Billions)
Percent OfTrades
CumulativePercent Of
Trades
TotalRevenue
($ Billions)
Average Revenueper Transaction
$1 1266 665 7575.847 9.591 5.935 5.935 -1.564 -1235.04
2 1613 526 5769.999 9.307 5.759 11.694 -4.124 -2556.77
3 3032 1 2667.245 8.087 5.004 16.698 -8.084 -2666.33
4 1701 216 4566.777 7.768 4.807 21.505 -6.413 -3769.88
5 3401 1267 2105.080 7.159 4.430 25.936 -2.024 -594.99
6 1511 154 4112.828 6.214 3.846 29.781 -4.941 -3269.98
7 3069 1070 1832.609 5.624 3.480 33.261 -1.087 -354.12
8 1312 375 4055.886 5.321 3.293 36.554 -2.756 -2100.86
9 1111 360 4275.799 4.750 2.940 39.494 -2.171 -1954.47
10 1073 340 3332.809 3.576 2.213 41.707 -0.952 -887.00
11 516 255 6424.506 3.315 2.051 43.758 0.036 69.09
12 867 138 3674.307 3.186 1.971 45.729 -2.470 -2848.66
13 1013 497 2720.936 2.756 1.706 47.435 -0.290 -286.44
14 652 246 3961.571 2.583 1.598 49.033 -0.779 -1195.47
15 680 222 3518.868 2.393 1.481 50.514 -0.748 -1099.79
TOTAL 22817 6332 81.632
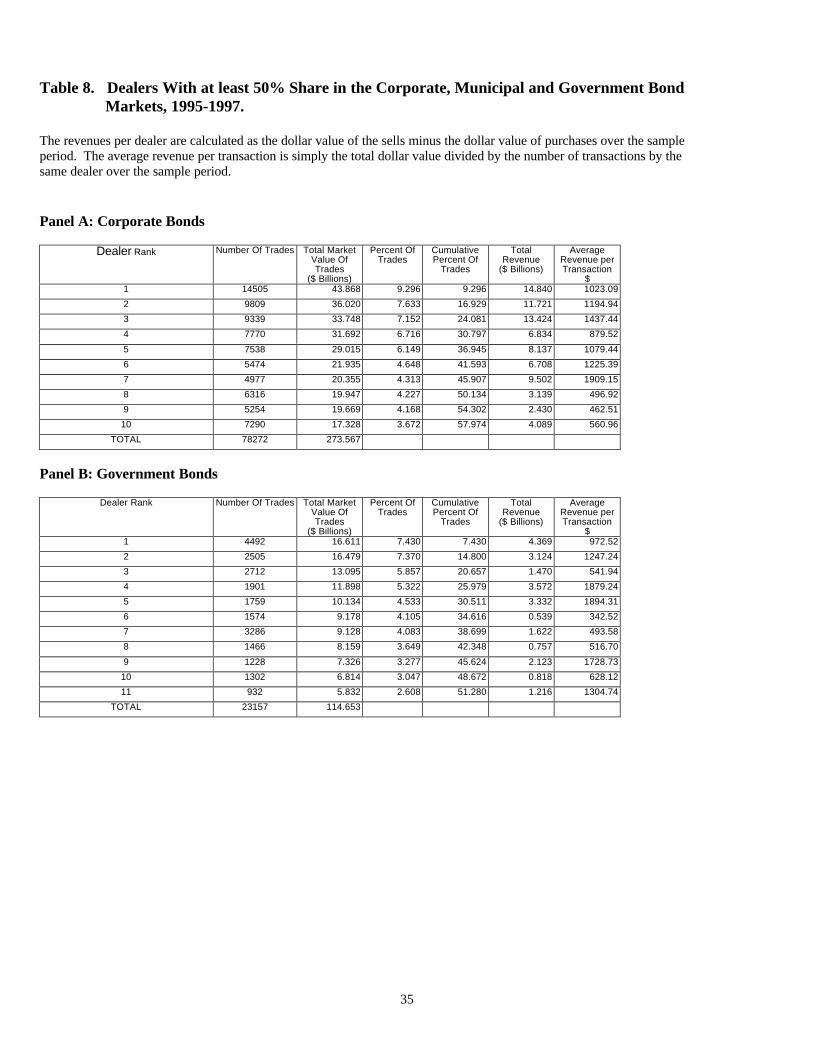
35
Table 8. Dealers With at least 50% Share in the Corporate, Municipal and Government BondMarkets, 1995-1997.
The revenues per dealer are calculated as the dollar value of the sells minus the dollar value of purchases over the sampleperiod. The average revenue per transaction is simply the total dollar value divided by the number of transactions by thesame dealer over the sample period.
Panel A: Corporate Bonds
Dealer Rank Number Of Trades Total MarketValue OfTrades
($ Billions)
Percent OfTrades
CumulativePercent Of
Trades
TotalRevenue
($ Billions)
AverageRevenue perTransaction
$1 14505 43.868 9.296 9.296 14.840 1023.09
2 9809 36.020 7.633 16.929 11.721 1194.94
3 9339 33.748 7.152 24.081 13.424 1437.44
4 7770 31.692 6.716 30.797 6.834 879.52
5 7538 29.015 6.149 36.945 8.137 1079.44
6 5474 21.935 4.648 41.593 6.708 1225.39
7 4977 20.355 4.313 45.907 9.502 1909.15
8 6316 19.947 4.227 50.134 3.139 496.92
9 5254 19.669 4.168 54.302 2.430 462.51
10 7290 17.328 3.672 57.974 4.089 560.96
TOTAL 78272 273.567
Panel B: Government Bonds
Dealer Rank Number Of Trades Total MarketValue OfTrades
($ Billions)
Percent OfTrades
CumulativePercent Of
Trades
TotalRevenue
($ Billions)
AverageRevenue perTransaction
$1 4492 16.611 7.430 7.430 4.369 972.52
2 2505 16.479 7.370 14.800 3.124 1247.24
3 2712 13.095 5.857 20.657 1.470 541.94
4 1901 11.898 5.322 25.979 3.572 1879.24
5 1759 10.134 4.533 30.511 3.332 1894.31
6 1574 9.178 4.105 34.616 0.539 342.52
7 3286 9.128 4.083 38.699 1.622 493.58
8 1466 8.159 3.649 42.348 0.757 516.70
9 1228 7.326 3.277 45.624 2.123 1728.73
10 1302 6.814 3.047 48.672 0.818 628.12
11 932 5.832 2.608 51.280 1.216 1304.74
TOTAL 23157 114.653
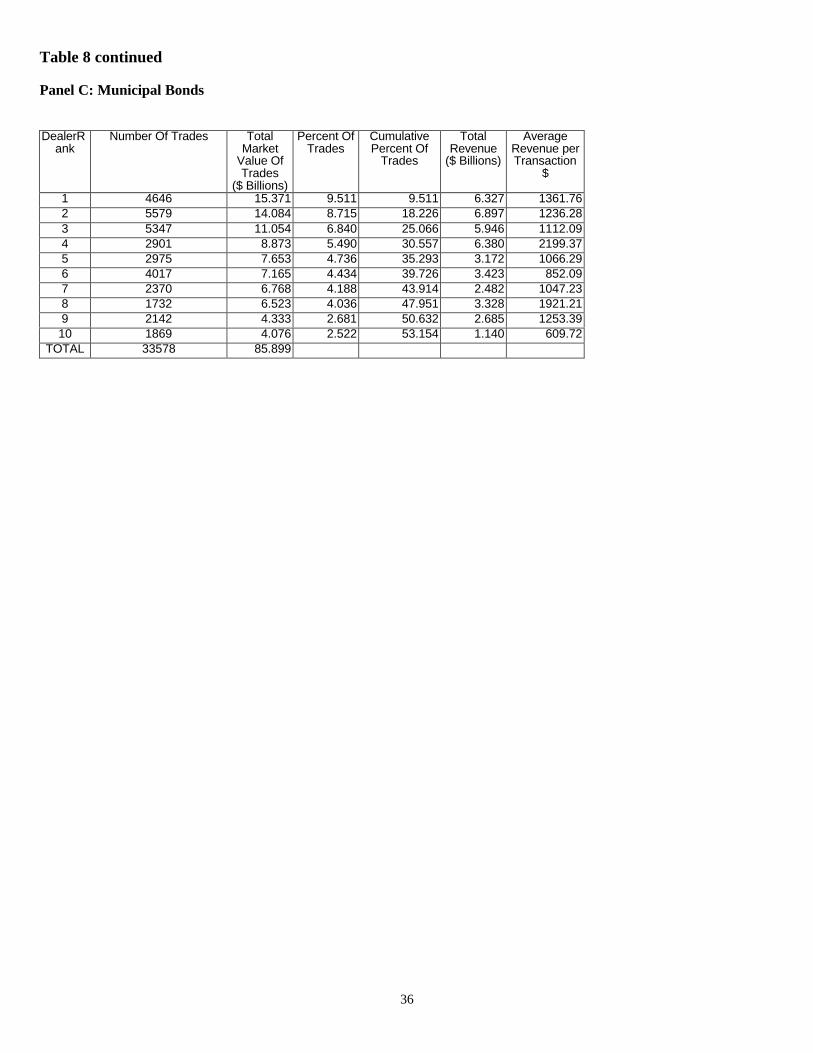
36
Table 8 continued
Panel C: Municipal Bonds
DealerRank
Number Of Trades TotalMarket
Value OfTrades
($ Billions)
Percent OfTrades
CumulativePercent Of
Trades
TotalRevenue
($ Billions)
AverageRevenue perTransaction
$
1 4646 15.371 9.511 9.511 6.327 1361.762 5579 14.084 8.715 18.226 6.897 1236.283 5347 11.054 6.840 25.066 5.946 1112.094 2901 8.873 5.490 30.557 6.380 2199.375 2975 7.653 4.736 35.293 3.172 1066.296 4017 7.165 4.434 39.726 3.423 852.097 2370 6.768 4.188 43.914 2.482 1047.238 1732 6.523 4.036 47.951 3.328 1921.219 2142 4.333 2.681 50.632 2.685 1253.3910 1869 4.076 2.522 53.154 1.140 609.72
TOTAL 33578 85.899

37
Table 9. The Bid-Ask Spread for the 10 Largest Dealers and Institutions and Others in the Corporate,Municipal and Government Bond Markets, 1995-1997.
We calculate the bid-ask spread per dealer (institution) per bond per day by subtracting the average sell price for each bond per day per dealer(institution) from the average buy price for the same bond over the same day by the same dealer (institution). We require at least one buy and onesell per bond per dealer (institution) within a day. The average spread per top-10 dealer (institution) per day is calculated by averaging the bid-askspread per dealer (institution) per bond per day over the top-10 dealers (institutions). The average bid-ask for the non-top-10 dealers (institutions)is similarly calculated.
Panel A: The Bid-Ask Spread for the 10 Largest Dealers and Other Dealers
TOP 10 DEALERS OTHERSN MEAN STD MEDIAN N MEAN STD MEDIAN
Corporate 750 0.2571 1.1928 0.1489 1113 0.1330* 0.8284 0.0000
Government 560 0.0436 0.8117 0.0333 468 0.0887 1.5052 0.0127
Municipal 368 0.2043 0.3822 0.1203 637 0.1942* 0.4031 0.0803
Pooled acrossall Sectors
1678 0.1742 0.9466 0.1041 2218 0.1412* 0.9325 0.0000
Panel B: The Bid-Ask Spread For the 10 Largest Institutions and Other Dealers.
TOP 10 INSTITUTES OTHERSN MEAN STD MEDIAN N MEAN STD MEDIAN
Corporate 419 0.1374 0.8123 0.0000 1339 0.1477 1.1551 0.0000
Government 209 0.0374 1.3360 0.0217 907 0.0870 1.3391 0.0250
Municipal 144 0.2547 0.6159 0.1855 694 0.1576* 0.3506 0.0545
Pooled acrossall Sectors
772 0.1322 0.9565 0.0500 2940 0.1313 1.0909 0.0000
Note:
*: statistically distinct at the 0.01 level using a Wilcoxon sign rank test of equality of the medians**: statistically distinct at the 0.05 level using a Wilcoxon sign rank test of equality of the medians***: statistically distinct at the 0.10 level using a Wilcoxon sign rank test of equality of the medians
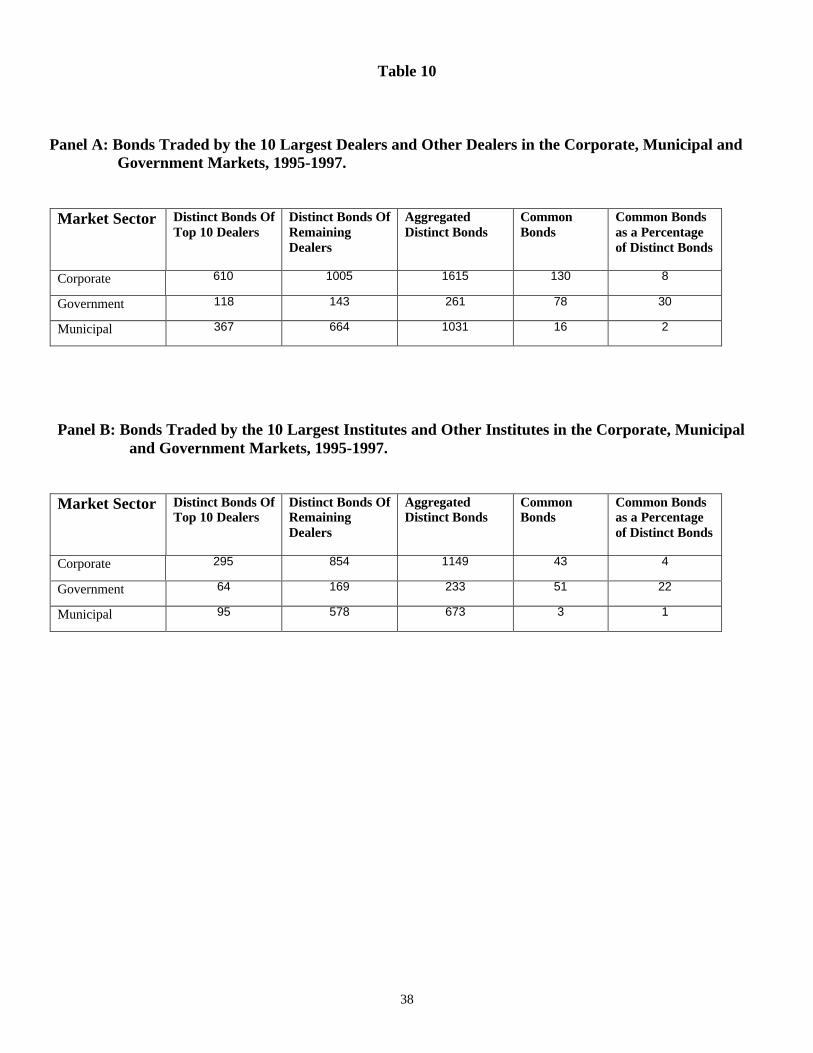
38
Table 10
Panel A: Bonds Traded by the 10 Largest Dealers and Other Dealers in the Corporate, Municipal andGovernment Markets, 1995-1997.
Market Sector Distinct Bonds OfTop 10 Dealers
Distinct Bonds OfRemainingDealers
AggregatedDistinct Bonds
CommonBonds
Common Bondsas a Percentageof Distinct Bonds
Corporate 610 1005 1615 130 8
Government 118 143 261 78 30
Municipal 367 664 1031 16 2
Panel B: Bonds Traded by the 10 Largest Institutes and Other Institutes in the Corporate, Municipaland Government Markets, 1995-1997.
Market Sector Distinct Bonds OfTop 10 Dealers
Distinct Bonds OfRemainingDealers
AggregatedDistinct Bonds
CommonBonds
Common Bondsas a Percentageof Distinct Bonds
Corporate 295 854 1149 43 4
Government 64 169 233 51 22
Municipal 95 578 673 3 1

39
Table 11. Characteristics of Bonds Traded by the 10 Largest Dealers and Other Dealers in theCorporate, Municipal and Government Markets, 1995-97.
Panel A: Corporate Sector
Top-10 Dealers Remaining DealersDistinctive bond characteristics Distinctive Bond Characteristics
Median(Std. Deviation)
Median(Std. Deviation)
Annual Yield 0.0719 0.0705**(0.0150) (0.0123)
Annual Duration 6.2160 5.3719*(2.8787) (2.5701)
Annual Convexity 45.1072 33.1960*68.6274 56.6898
Time to maturity (years) 8.0507 6.5425*(8.7492) (7.0210)
Bond age (years) 2.3671 3.2973*(2.9533) (5.6562)
Coupon rate 0.0750 0.0770**0.0156 0.0140
Percentage of Moody'sInvestment grade bonds
85 89
Percentage of Moody's junk bonds 15 11
Panel B: Government Sector
Top-10 Dealers Remaining DealersDistinctive Bond Characteristics Distinctive Bond Characteristics
Median(Std. Deviation)
Median(Std. Deviation)
Annual Yield 0.0646 0.0667(0.0066) (0.0075)
Annual Duration 4.5430 4.3592(2.9334) (3.4947)
Annual Convexity 23.3232 21.4583(61.5752) (74.7867)
Time to maturity (years) 5.6630 4.9699(6.6915) (8.1410)
Bond age (years) 5.3822 3.6096**(4.6822) (5.5297)
Coupon rate 0.0688 0.0690**(0.0166) (0.0118)

40
Table 11 continued
Panel C: Municipal
Top-10 Dealers Remaining DealersDistinctive Bond Characteristics Distinctive Bond Characteristics
Median(Std. Deviation)
Median(Std. Deviation)
Annual Yield 0.0534 0.0530(0.0090) (0.0089)
Annual Duration 8.5660 8.2420***(2.8565) (2.8969)
Annual Convexity 85.6467 79.9138(65.3419) (61.7796)
Time to maturity (years) 10.8781 10.5781(5.8288) (5.8330)
Bond age (years) 2.6342 3.1260*(2.9045) (4.3597)
Coupon rate 0.0563 0.0570(0.0096) (0.0096)
Percentage of Moody'sInvestment grade bonds
96 99
Percentage of Moody's junk bonds 4 1
Note:
The pairwise tests correspond to the "top 10" sample and the "Remaining Dealers" sample in each case.
*: statistically distinct at the 0.01 level using a Wilcoxon sign rank test of equality of the medians**: statistically distinct at the 0.05 level using a Wilcoxon sign rank test of equality of the medians***: statistically distinct at the 0.10 level using a Wilcoxon sign rank test of equality of the medians

41
Table 12. Is the Bid-Ask Spread Different for the 10 Largest Dealers and Institutions?The Corporate, Municipal and Government Bond Markets, 1995-1997.
The dependent variable is the bid-ask spread per dealer per bond per day denominated in dollars per $100 par value. Theestimates and standard errors for parameter significance are obtained from a Generalized Method of Moments (GMM)regression. The p-values of parameter significance are in parentheses under the respective estimates. All coefficient estimatessignificant at the 0.10 level or higher are indicated in bold.
Model 1 Model 2 Model 3Independent Variables Corporate Bond
Market Government Bond
Market Municipal Bond
Market
Intercept 0.55(0.0888)
1.3(0.0088)
0.38(0.0241)
Time to maturity (years) 0.02(0.0001)
-0.01(0.476)
0.01(0.0464)
Bond age (years) 0.013(0.0332)
-0.01(0.7217)
-0.00(0.7988)
Log of Buy Volume -0.05(0.0250)
--- -0.01(0.3660)
Log of Sell Volume --- -0.08(0.025)
---
Top 10 Dealer dummy 0.15(0.0017)
-0.01(0.8996)
0.01(0.6718)
Moody's AAA and AA dummy -0.09(0.4263)
--- ---
Moody's AA dummy --- --- 0.01(0.7253)
Moody's A1 dummy 0.02(0.8779)
--- -0.07(0.1556)
Moody’s A2 dummy 0.04(0.6771)
--- 0.04(0.6440)
Moody’s A3 dummy 0.09(0.4059)
--- 0.04(0.5726)
Moody’s BAA1 dummy 0.10(0.3125)
--- ---
Moody’s BAA2 dummy 0.02(0.8711)
--- ---
Moody’s Baa3 dummy 0.22(0.2405)
--- ---
Below Moody’s A3 dummy --- --- 0.01(0.8841)
Utility Sector Dummy 0.07(0.3707)
--- -0.02(0.5746)
1997 Transaction Dummy -0.07(0.0659)
-0.02(0.7744)
-0.11(0.0001)
Number of observations 1799 863 1005
Adjusted R-square (per cent) 2.38 0.93 1.72
Related Documents