Electronic copy available at: http://ssrn.com/abstract=1603705 1 Liquidity Commonality in Commodities Ben R. Marshall* Massey University [email protected] Nhut H. Nguyen University of Auckland [email protected] Nuttawat Visaltanachoti Massey University [email protected] Abstract We examine liquidity commonality in commodity futures markets. Using data from 16 agricultural, energy, industrial metal, precious metal, and livestock commodities, we show there is a strong systematic liquidity factor in commodities. Liquidity commonality was present in 1997 - 2003 when commodity prices were relatively stable and during the recent boom. There is some support for both “supply-side” and “demand-side” explanations for this commonality. We also find some evidence that changes in stock market liquidity positively influence changes in individual commodity liquidity. JEL Classification: G11, G12, G13 Keywords: Commodity, Liquidity, Commonality First Version: 8 April 2010 This Version: 27 July 2011 Acknowledgments: We thank conference participants at the 23rd Australasian Finance and Banking Conference, our discussant Phuong T. Pham, seminar participants at Auckland University, Massey University, and Waikato University and especially Andrea Bennett, Henk Berkman, Charles Corrado, Fei Wu, and Qian Sun for valuable comments. Corresponding Author: School of Economics and Finance, Massey University, Private Bag 11- 222, Palmerston North, New Zealand. Tel: +64 6 350 5799 Ext 5402, Fax: +64 6 350 5651.

Welcome message from author
This document is posted to help you gain knowledge. Please leave a comment to let me know what you think about it! Share it to your friends and learn new things together.
Transcript
Electronic copy available at: http://ssrn.com/abstract=1603705
1
Liquidity Commonality in Commodities
Ben R. Marshall* Massey University
Nhut H. Nguyen University of Auckland
Nuttawat Visaltanachoti Massey University
Abstract We examine liquidity commonality in commodity futures markets. Using data from 16 agricultural, energy, industrial metal, precious metal, and livestock commodities, we show there is a strong systematic liquidity factor in commodities. Liquidity commonality was present in 1997 - 2003 when commodity prices were relatively stable and during the recent boom. There is some support for both “supply-side” and “demand-side” explanations for this commonality. We also find some evidence that changes in stock market liquidity positively influence changes in individual commodity liquidity.
JEL Classification: G11, G12, G13 Keywords: Commodity, Liquidity, Commonality
First Version: 8 April 2010 This Version: 27 July 2011
Acknowledgments: We thank conference participants at the 23rd Australasian Finance and Banking Conference, our discussant Phuong T. Pham, seminar participants at Auckland University, Massey University, and Waikato University and especially Andrea Bennett, Henk Berkman, Charles Corrado, Fei Wu, and Qian Sun for valuable comments.
Corresponding Author: School of Economics and Finance, Massey University, Private Bag 11-222, Palmerston North, New Zealand. Tel: +64 6 350 5799 Ext 5402, Fax: +64 6 350 5651.
Electronic copy available at: http://ssrn.com/abstract=1603705
2
1. Introduction
The liquidity of individual stocks is influenced by market-wide liquidity. This relation,
known as liquidity commonality, has also been documented in bond and foreign exchange
markets. We investigate whether liquidity commonality exists in commodity markets and
whether there is a link between commodity and stock market liquidity. Commodities have long
been used as hedging tools for commodity producers and consumers, and have more recently
become a popular asset class with investors. The dual hedging and speculative aspects of
commodity futures are unique features so liquidity commonality findings from other asset classes
may not necessarily apply in commodities.
Chordia, Roll and Subrahmanyam (2000) suggest both inventory risks and asymmetric
information affect commonality in liquidity. Commodity hedgers may have private information
in a few commodities but it is unlikely they will have this for all commodities so their trading
activities are unlikely to cause liquidity commonality. Hedgers are over twice as active as
investment funds in commodity markets in the period we study1 and their actions have an
important influence on commodity returns (e.g., de Roon, Nijman, and Veld, 2000; Acharya,
Lochstoer and Ramadorai, 2010). On the other hand, speculative demand for commodities,
which may lead to liquidity commonality has increased in recent times. Dunsby, Eckstein,
Gaspar, and Mulholland (2008) estimate that commodity index linked investment increased over
20-fold between 1997 and 2007, while Barclays Capital suggest commodity investment was in
excess of $US250 billion by the end of 2009 (see Jensen, 2010).2 Tang and Xiong (2010) find
1 This is based on cross-sectional time-series average of the share of hedger and fund open interest to total open interest over the 1997 – 2009 period according to US Commodity Futures Trading Commission (CFTC) data. 2 See Figure 21.1 in Dunsby, Eckstein, Gaspar, and Mulholland (2008).
Electronic copy available at: http://ssrn.com/abstract=1603705
3
the growth in commodity index investment over the last decade has resulted in an increase in the
return correlation of commodities in the major indices.
Part of the increase in popularity of commodities as an asset class is no doubt due to the
diversification benefits they bring to stock and bond portfolios (e.g., Gorton and Rouwenhorst,
2006). Bernanke (2008) suggests commodity price movements also have important policy
implications. He stresses that a greater understanding of the factors that drive commodity price
changes is required. A lack of understanding of, or disregard for, the liquidity of commodity
markets certainly contributed to the demise of the high-profile Amaranth hedge fund, which lost
$6.6 billion (e.g., Till, 2008).3 However, despite the popularity and diversification benefits of
commodity investment, relatively little is known about commodity liquidity as compared to
stocks and bonds. An exception is the recent work of Marshall, Nguyen, and Visaltanachoti
(2011) who document commodity transaction costs and show how effective various liquidity
proxies are at measuring the actual cost of trading commodities. These authors find that the
Amihud (2002) proxy is the best performer and that Amivest (e.g., Amihud, Mendelson, and
Lauterback, 1997) and Effective Tick (e.g., Holden, 2009) measures also work well.4
Chordia, Roll, and Subrahmanyam (2000), Hasbrouck and Seppi (2001), and Korajczyk
and Sadka (2008) all find that liquidity commonality exists in the US equity market. More
recently, Brockman, Chung, and Perignon (2009) show there is a systematic liquidity factor in
international stocks and there is evidence of a global liquidity factor, and Karolyi, Lee, and van
Dijk (2011) show liquidity commonality is stronger in countries with high market volatility and
3 Chincarini (2007) states, “Amaranth was close to the entire market in certain futures contracts. A simple analysis .... showed that the most excessive positions generated the greatest losses in September, indicating a liquidity penalty against Amaranth” (p. 102). 4 Other recent commodity papers include Chan, Treepongkaruna, Brooks, and Gray (2011) who document linkages between commodity and other asset classes in different regimes, Pukthuanthong and Roll (2011) who study the relation between the gold and various currencies, and Hong and Yogo (2010, p. 1) show growth in commodity open interest predicts “high commodity returns and low bond returns.”
4
more international investors. There has been less work on liquidity commonality in other asset
classes. Chordia, Sarkar, and Subrahmanyam (2005) document evidence of commonality in the
bond markets and find this is related to contemporaneous liquidity commonalities in the stock
market, while Mancini, Ranaldo, and Wrampelmeyer (2009) show there is a systematic liquidity
factor in the foreign exchange market, which is linked to equity market liquidity.
We find there is in fact a strong systematic liquidity factor in commodity markets.
Liquidity changes in commodities have a highly statistically significant positive relation with
changes in market-wide liquidity. This relation existed during the 1997 – 2003 sub-period when
commodity prices were relatively flat and has strengthened during the more recent commodity
boom. We use high-frequency commodity futures data from the Thomson Reuters Tick History
(TRTH) database5 to calculate intraday proportional quoted and effective spreads. The TRTH
database contains pit and electronic trading data for all the major commodities. Thomson Reuters
Datastream daily data are used to calculate the Amihud liquidity measure. We include 16
commodities. These span the five major commodity families. The commodities are: Brent crude
oil, gasoil, natural gas, RBOB gas, heating oil, West Texas crude oil (energy), corn, red wheat,
soybeans, wheat (agricultural), feeder cattle, lean hogs, live cattle (livestock), gold, silver
(precious metals), and copper (industrial metal).
Two explanations have been put forward to explain liquidity commonality in stock
markets. Hameed, Kang, and Viswanathan (2010) show it is caused by liquidity providers
withdrawing liquidity in large market declines. This “supply-side” explanation is consistent with
the theoretical work of Brunnermeier and Pedersen (2008) which links asset liquidity and
5 We access these data via the Securities Industry Research Centre of Asia-Pacific (SIRCA) http://www.sirca.org.au/
5
traders’ funding liquidity.6 A “demand-side” explanation has been advanced by Kamara, Lou,
and Sadka (2008) who show that higher levels of institutional ownership lead to stronger
commonality due to coordinated buying and selling. Of course, these explanations are not
mutually exclusive. Both could play a role in liquidity commonality. We find there is evidence to
support both supply- and demand-side theories in commodities. Increases in fund ownership of
commodities result in an increase in liquidity commonality when the Amihud measure of
liquidity is used. There is also evidence of stronger liquidity commonality during large market
declines when the proportional quoted spread measure is adopted. However, these results carry a
couple of caveats. They are not consistent across all liquidity measures and we do not have data
on liquidity providers to verify the supply-side result.
We also find weak evidence that changes in stock market liquidity affect individual
commodity liquidity. An increase in stock market liquidity coincides with an increase in
commodity liquidity. There is evidence of this linkage based on changes in aggregate stock
market liquidity and changes in the liquidity of stocks in commodity-related industries. A
liquidity linkage between these two asset classes is consistent with the work of Chordia, Sarkar,
and Subrahmanyam (2005) who find that there is a link between stock and bond market liquidity
due to a connection in the money flows across these asset classes.
The rest of this paper is organized as follows: Section 2 contains a description of the data.
Methodology is discussed in Section 3. We present our results in Section 4, while Section 5
concludes the paper.
6 This explanation is also supported by the findings of Coughenour and Saad (2004). They show stock liquidity covaries with the liquidity of other stocks with the same NYSE specialist.
6
2. Data
We source the high-frequency commodity futures data from the Thomson Reuters Tick
History (TRTH) database, which we access via Securities Industry Research Centre of Asia-
Pacific (SIRCA). Fong, Holden, and Trzcinka (2011) use equity data from TRTH. These authors
note (p. 16) subscribers taking advantage of TRTH’s “millisecond-time-stamped tick data”7,
which are sourced directly from exchanges via the Reuters Integrated Data network, include
“central banks, investment banks, hedge funds, brokerages, and regulators”. More background on
TRTH is available one the Thomson Reuters website.8
We focus on commodities that are part of the S&P Goldman Sachs Commodity Index
(S&P GSCI) as these are the commodities that are determined to be the most important to the
global economy. 9 The TRTH database has history dating back to 1 January 1996. Some
commodities have data available from this date, data for others commences during 1996, while
data are not available for some commodities until more recent times. We chose a start point of 1
January 1997 so as to include as many commodities as possible and achieve a time-series of data
that is as long as possible. The end point is 31 August 2009. We include 16 commodities which
span the five major commodity families (energy, livestock, agricultural, precious metals, and
industrial metals). Many commodities trade on multiple exchanges so we source data from the
major exchange (based on S&P GSCI information and Dunsby, Eckstein, Gaspar, and
Mulholland (2008)). West Texas crude oil, RBOB gas, and heating oil data are from the New
York Mercantile Exchange (NYMEX), Brent crude oil and gasoil data comes from the
Intercontinental Exchange (ICE), the red wheat data are from the Kansas Board of Trade (KBT),
7 Recently, TRTH replaces a millisecond-time-stamp tick data with microsecond-time-stamp tick data. 8http://thomsonreuters.com/products_services/financial/financial_products/quantitave_research_trading/tick_history 9 http://www.standardandpoors.com/indices/sp-gsci/en/us/?indexId=spgscirg--usd----sp------
7
the wheat, corn, and soybeans data are from the Chicago Board of Trade (CBOT), live cattle,
feeder cattle, and lean hogs data are from the Chicago Mercantile Exchange (CME), copper, gold
and silver data are from COMEX.10
Following de Ville de Goyet, Dhaene, and Sercu (2008), we use data for individual
contracts to construct continuous series of the most actively traded contracts. A contract that
expires in a given month m is replaced with the next nearest-to-maturity contract on the last day
of the previous month m-1. We use futures rather than spot data because futures data are more
liquid, more prominent in the media, and more widely available.
We construct the Amihud liquidity measure using daily data from Thomson Reuters
Datastream (TRD). We obtain data for the identical contracts we used in the high-frequency data
analysis and form continuous series in an identical manner. Marshall, Nguyen, and
Visaltanachoti (2011) demonstrate the Amihud liquidity measure is a good proxy for the true
cost of transacting. The Amihud measure requires daily dollar value traded so we also use daily
data for the number of contracts. We convert this to a dollar volume variable by multiplying the
number of contracts traded by the contract size and then multiplying this by the settlement price
in USD. 11
Part of our analysis involves determining whether changes in stock market liquidity
influence individual commodity liquidity. We calculate systematic stock liquidity in accordance
with Kamara, Lou, and Sadka (2008). This involves using common stocks listed on the NYSE or
AMEX that are in the CRSP database. Risk-free rate data are obtained from Kenneth French’s
website for use in the regression analysis. We also investigate whether fund ownership of
10 The CME group now consists of CME, CBOT, COMEX, and NYMEX but they have retained their individual identities. http://www.cmegroup.com/company/history/timeline-of-achievements.html. Copper is also actively traded on the London Metals Exchange (LME) but we cannot source data for this contract back to 1997. 11 Thomson Reuters Datastream does not have daily data dating back to our start point of 1 January 1997 for four commodities so we do not calculate the Amihud measure for these.
8
commodities drives the liquidity commonality. We source the open interest data from the US
Commodity Futures Trading Commission.12 All our analysis is based on the time-period 9.30am
to 4.00 pm Eastern Standard Time. This permits us to consider the link, if any, between stock
and commodity liquidity.
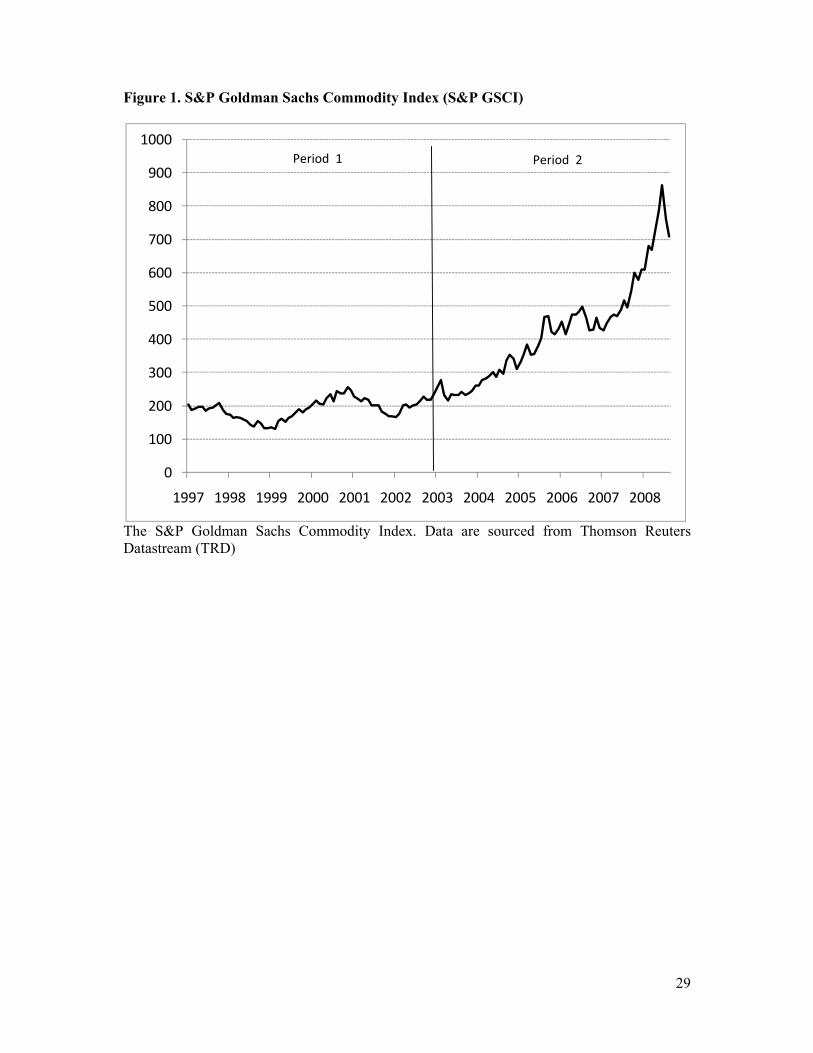
We plot the S&P Goldman Sachs Commodity Index (S&P GSCI) in Figure 1.
Commodity prices did not change much between 1997 and 2003. The GSCI increased just 27%.
Commodities then boomed, increasing some 172% between 2004 and 2009. We divide the data
into two sub-periods to show that our results are not specific to the recent “boom” sub-period.
[Insert Figure 1 Here]
3. Methodology
In this section we present and discuss the liquidity measures. We then explain the
approaches we use to measure liquidity commonality, the link, if any, with changes in stock
market liquidity, and document the techniques we apply to check for demand- and supply-side
liquidity commonality explanations.
3.1. Liquidity Measures
We use three different liquidity measures. The first two, which are based on Chordia,
Roll, and Subrahmanyam (2000) and Korajczyk and Sadka (2008), use intraday data.
Proportional effective spread is calculated as follows: 12 http://www.cftc.gov/MarketReports/CommitmentsofTraders/
9
Proportional Effective Spread = 2 ·| ln P - ln P | (1)
where Pt and PM are the trade price and the mid-point of the prevailing bid and ask quotes at the
time of the trade. Proportional quoted spread is calculated as follows:
Proportional Quoted Spread = (PA – PB) / PM (2)
where PA and PB are the ask price and bid price respectively and PM is the mid-point of these two
prices. Daily average proportional effective spread and proportional quoted spread are calculated
for each commodity.
We use a high-frequency data cleaning technique inspired by Brownlees and Gallo
(2006) to ensure data errors are not influencing our results. This involves estimating the α-
trimmed sample mean and standard deviation for the proportional effective spread and
proportional quoted spread liquidity measures. We use an α of 5%, which means the top and
bottom 2.5% of observations are ignored when calculating the trimmed mean and standard
deviation.13 The next step involves removing observations that are outside the trimmed mean +/-
three standard deviations.
The third liquidity proxy is the Amihud measure, which is given in equation 3. Kamara,
Lou, and Sadka (2008) and Korajczyk and Sadka (2008) use the Amihud liquidity measure in
their stock market liquidity commonality studies. Marshall, Nguyen, and Visaltanachoti (2011)
highlight that many low-frequency liquidity proxies do a poor job of capturing commodity
liquidity. However, they show that the Amihud measure performs well in commodities.
13 Brownlees and Gallo (2006) note that dirty data require a higher α. They set α at 10%, but we follow Mancini, Ranaldo, and Wrampelmeyer (2009) and use an α of 5%.
10
Amihud =|rt|
Volumet (3)
where rt is the return on day t and Volumet is dollar volume on day t.
3.2. Liquidity Commonality Measurement
We use two distinct approaches to determine if there is a systematic liquidity factor in
commodity markets. The first is based on Chordia, Roll, and Subrahmanyam (2000) and the
second follows Korajczyk and Sadka (2008). The Chordia, Roll, and Subrahmanyam (2000)
method uses market model time-series regressions of daily percentage changes in a liquidity
measure for a commodity regressed on the daily percentage change in the liquidity measure for
the market, as expressed in equation 4.
DLi,t= αi+ β1iDLM,t+ β2iDLM,t-1+ β3iDLM,t+1+ Controls+ εi,t (4)
where DLi,t represents the percentage change in liquidity measure L from day t-1 to day t for
commodity i, DLM,t is the concurrent change in commodity market liquidity L, and DLM,t-1 and
DLM,t+1 are the lag and lead changes in commodity market liquidity for L respectively. We
exclude the commodity that is the dependant variable from the measure of market liquidity.
Following Chordia, Roll, and Subrahmanyam (2000), the control variables include the individual
commodity squared return, and the contemporaneous, lead and lag market returns. We use the
GSCI as a proxy for the commodity market return. Changes in concurrent, lead and lag market
liquidity are measured as the cross-sectional average over all commodities (excluding the
11
commodity in question). We apply this method separately for the three different liquidity
measures.
The Korajczyk and Sadka (2008) approach to determining liquidity commonality is based
on principle component analysis. We calculate the cross-sectional average of the first liquidity
measure on a daily basis. We then compute the time-series mean and standard deviation of this
series. The next step involves standardizing each of the time-series observations by scaling the
difference between the observation and the time-series mean by the time-series standard
deviation. We then obtain the first three principle components across commodities and use these
as the liquidity commonality factors. This process is repeated for the proportional effective
spread, the proportional quoted spread, and the Amihud liquidity measure.
3.3. Commodity Market Liquidity Links with Stock Market Liquidity
We investigate the link between changes in commodity liquidity and stock market
liquidity. Stock market liquidity is measured as the value-weighted average of the Amihud
measures for all NYSE and AMEX stocks. We then include the systematic stock market liquidity
factor as an additional variable in equation 4 to determine if changes in systematic stock market
liquidity influence changes in individual commodity liquidity. We then repeat this analysis for
the sub-set of stocks that are in commodity-related industries
12
3.4. Supply-Side and Demand-Side Explanations
Hameed, Wang, and Viswanathan (2010) show liquidity commonality in stocks is caused
by liquidity providers withdrawing market liquidity following market declines. This is consistent
with the theoretical model of Brunnermeier and Pedersen (2009) which proposes a link between
asset liquidity and traders’ funding liquidity. We investigate whether this supply-side effect is
responsible for liquidity commonality in commodities. Following Hameed, Wang, and
Viswanathan (2010) we run the regression:
DLi,t= αi+ βLIQ,iDLM,t+ βLIQ,DOWN,iDLM,t DDOWN,M,t + βi,k
4
k=1
RM,t-k
+ βDOWNi,k
4
k=1RM,t-kDDOWN,M,t-k + γi,k
4
k=1Ri,t-k (5)
+ γDOWNi,k
4
k=1
Ri,t-kDDOWN,i,t-k + γiVOLAi,t
+ εi,t
Daily changes in individual commodity liquidity (DLi,t) are regressed on the change in
average commodity liquidity (DLM,t), lagged market returns (RM,t‐k), and commodity returns
(Ri,t‐k) . DDOWN,M,t is a dummy variable that equals one if RM,t‐k is more than 1.5 standard
deviations below its conditional mean. VOLAi,t is volatility.
Kamara, Lou, and Sadka (2008) show liquidity commonality is influenced by the level of
institutional ownership. Those participating in the commodity futures market can be broadly
13
termed “hedgers”, “funds”, and “small speculators” (e.g., Sanders, Boris, and Manfredo, 2004).14
We measure the proportion of a commodity owned by funds as fund open interest divided by the
total open interest on a weekly basis. We then follow the method of Kamara, Lou, and Sadka
(2008) and estimate the liquidity beta for each commodity on a weekly basis (in a similar fashion
to equation 4) and then conduct the following regression, where FOI is fund open interest:
βi,t= + FOIi,t-1+ εi,t (6)
4. Results
In section 4 we present the core liquidity commonality results and by sub-period. We
then present results relating the link (if any) between changes in stock market liquidity and
commodity liquidity. These are generated for the aggregate stock market and just those stocks
that are closely related to commodities. The final section contains results for supply-side and
demand-side commonality explanations.
4.1. Overall Liquidity Commonality
We present market-wide results based on the market model approach of Chordia, Roll,
and Subrahmanyam (2000) and the principle component method of Korajczyk and Sadka (2008)
14 We assume hedger positions consist of commercial long and short positions, fund positions consist of non-commercial long, short, and spreading positions, and small speculator positions consist of non-reported long and short positions.

14
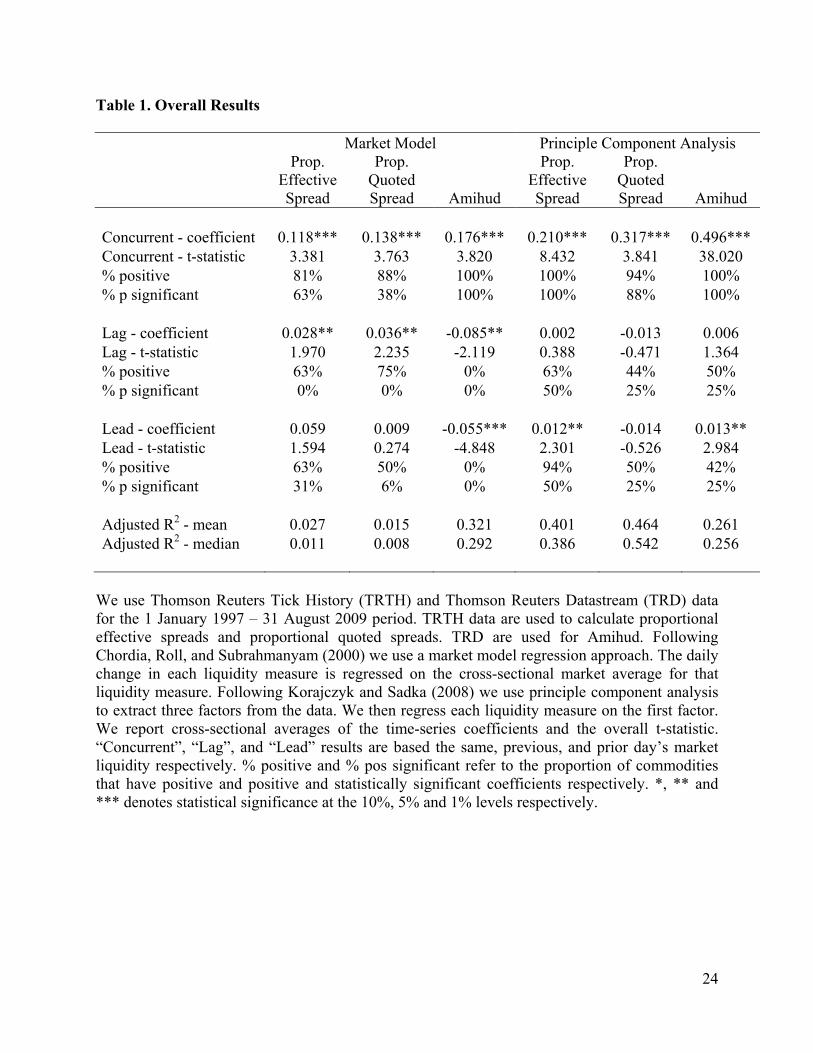
in Table 1.15 The results generated using both methods indicate there is strong evidence of
liquidity commonality in the commodity market. Based on the market model results, a 1%
change in commodity market liquidity induces a contemporaneous average percentage change in
individual commodity liquidity ranging from 0.12 to 0.18, depending on the liquidity proxy. All
three market model t-statistics are statistically significant at the 1% level.16 The commodity
market average concurrent coefficient results are less than those reported for the US stock market
by Chordia, Roll, and Subrahmanyam (2000). Their average concurrent coefficient ranges from
0.28 to 1.37. However, they are of a similar size to those for European equity markets as reported
by Brockman, Chung, and Perignon (2009). These authors show the majority of European
markets have coefficients in the 0.10 – 0.25 range.17
The pattern of commonality is relatively consistent across individual commodities.
Changes in the liquidity of 81% of the commodities have a positive statistically significant
relation with changes in systematic liquidity based on the proportional effective, and this
increases to 88% and 100% respectively when quoted spread and Amihud measures are used.
The commonality effect appears to be more pervasive in commodities than in stocks despite the
prevalence of hedgers in the commodity market. Chordia, Roll, and Subrahmanyam (2000)
report the proportion of stocks with a positive, statistically significant relation ranges from 14%
to 35% for U.S. stocks, depending on the liquidity proxy used.
[Insert Table 1 Here]
15 Following Chordia, Roll, and Subrahmanyam (2000), we do not report the coefficients and t-statistics of the control variables. 16 As Chordia, Roll, and Subrahmanyam (2000) report in their footnote 8, the ratio of the true standard error to the typical standard error is [1+2(N-1)ρ]1/2, where N is the number of repressors. Like, Chordia, Roll, and Subrahmanyam (2000) we find that ρ is negative for some liquidity proxies which means the adjustment reduces the size of the standard error and increases the t-statistic. 17 See their Table 2.
15
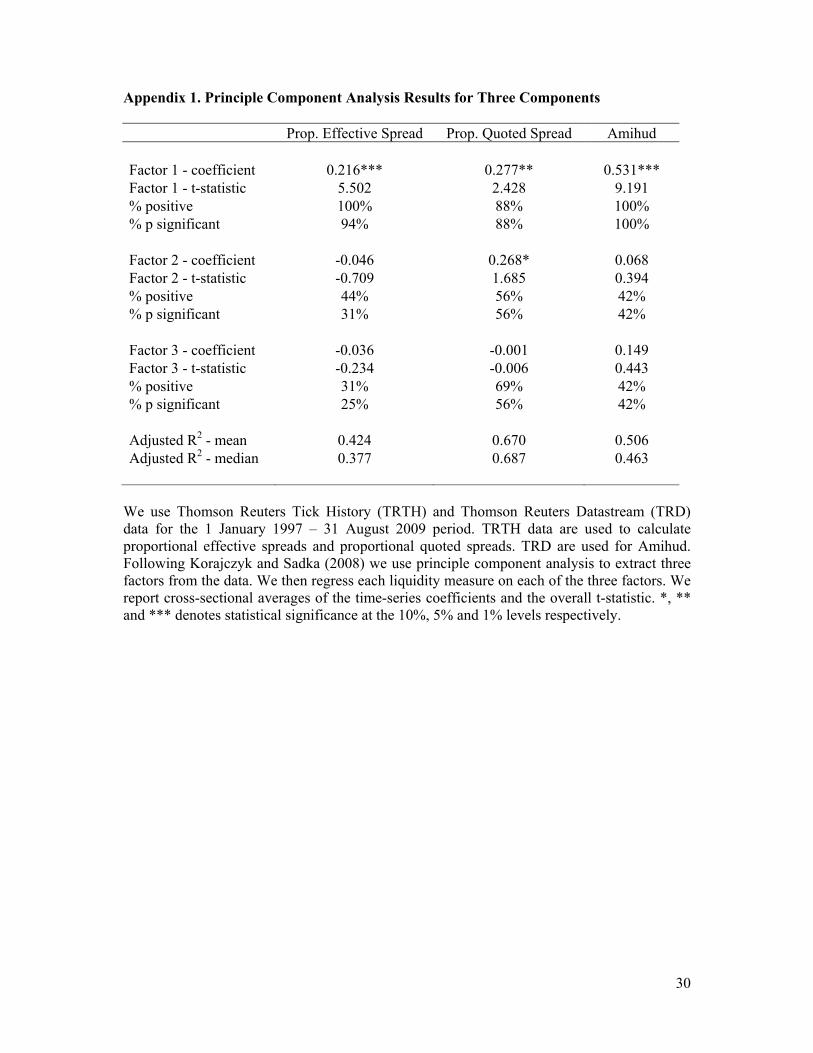
The principle component results are very similar to their market model equivalents. The
results we present relate to regressions which include the first factor only, as this is the one that
is most likely to capture systematic liquidity. However, results based on all three factors are
qualitatively identical as Appendix 1 shows. There is a strong positive relation between the first
factor derived from all three liquidity measures. The average concurrent coefficient ranges from
0.21 to 0.50 and this relation is highly statistically significant. The consistency of the liquidity
commonality results across individual commodities also remains high when the principle
component method is used. Some 94% of the individual commodities have a positive statistically
significant relation with systematic liquidity based on the proportional quoted spread measure
and this increases to 100% when either the proportional effective spread or Amihud measures are
used.
4.2. Commonality in Sub-Periods
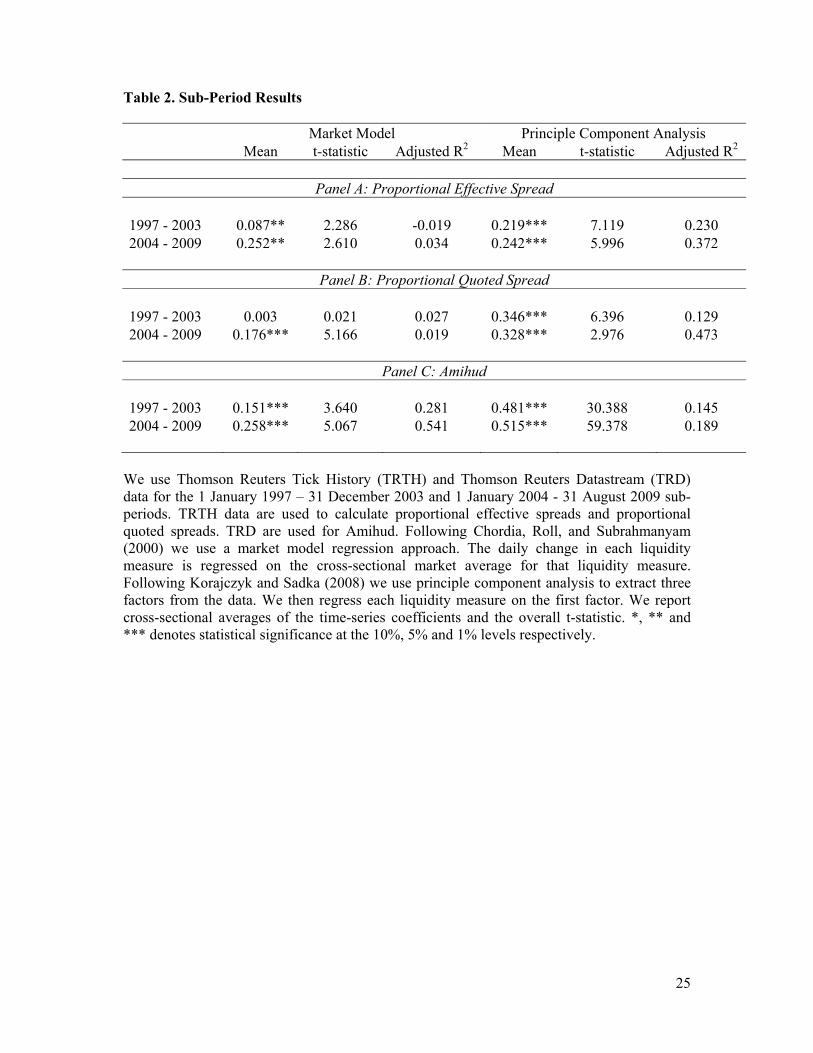
We now turn our attention to the question of whether commodity liquidity commonality
is unique to the recent period of surging commodity prices. As Figure 1 shows, commodity
prices increased just 27% between 1997 and 2003 and then surged 172% between 2004 and
2009. We calculate results by year and then present time-series averages for sub-period 1 (1997 –
2003) and sub-period 2 (2004 – 2009) in Table 3. These results allow us to form two
conclusions. Firstly, liquidity commonality was present in the early sub-period when commodity
prices and investment flows into commodities were relatively flat and in the more recent sub-
period. Secondly, there is evidence that the strength of the liquidity commonality increased
between sub-periods. Five of the six adjusted R2 are higher in sub-period 2 than sub-period 1 and
some of these increases are dramatic. For instance, the principle component analysis proportional
16
quoted spread adjusted R2 increases from 12.9% to 47.3%. Five of the six slope coefficients are
also larger in sub-period 2. Some increases are quite pronounced, such as those of proportional
quoted and effective spread with the market model. However, other increases, such as those
relating to principle component analysis (proportional effective spread and Amihud) are smaller.
Increasing commonality in the second sub-period could be due to demand- or supply-side
factors. Tang and Xiong (2010) note there has been a strong increase in commodity index
investing in the last decade and this has led to an increase in the return correlations of the major
commodities which are part of these indices. This financialization of commodities is a demand-
side explanation for the stronger commonality. The most recent sub-period also includes the
global financial crises, which saw sharp declines in the price of many commodities. This would
explain the stronger commonality from a supply-side perspective.
[Insert Table 2 Here]
4.3. Stock Market Liquidity and Commodity Liquidity
The next issue we investigate is the influence, if any, that changes in stock market
systematic liquidity have on individual commodity liquidity. Chordia, Sarkar, and
Subrahmanyam (2005) find there is a link between stock market liquidity and bond market
liquidity due a relation between money flows across these asset classes. If investors view
commodities as a complementary risk asset to stocks then one would expect a positive relation
driven by investors exiting individual commodities and the equity market in times of heightened
risk aversion. Alternatively, if investors view commodities as an alternative asset class to stocks
then a decline in stock market liquidity might correspond with an increase in commodity
17
liquidity as investors sell stocks and buy commodities. Of course, it is possible that there is no
clear relation between stock and commodity liquidity due to the above effects being true for
some investors and not others and therefore cancelling each other out in aggregate. To ensure
consistency in liquidity measurement we use the Amihud measure to represent both commodity
and stock market liquidity. This liquidity proxy is popular in the equity literature (e.g., Kamara,
Lou, and Sadka (2008)) and has been shown by Goyenko, Holden, and Trzcinka (2009) to
correlate well with high-frequency stock liquidity benchmarks. We follow Kamara, Lou, and
Sadka (2008) and use the value-weighted average of individual NYSE and AMEX common
stock Amihud measures. More recently, Marshall, Nguyen, and Visaltanachoti (2011) show the
Amihud proxy is the best low-frequency measure of the actual cost of transacting in
commodities.
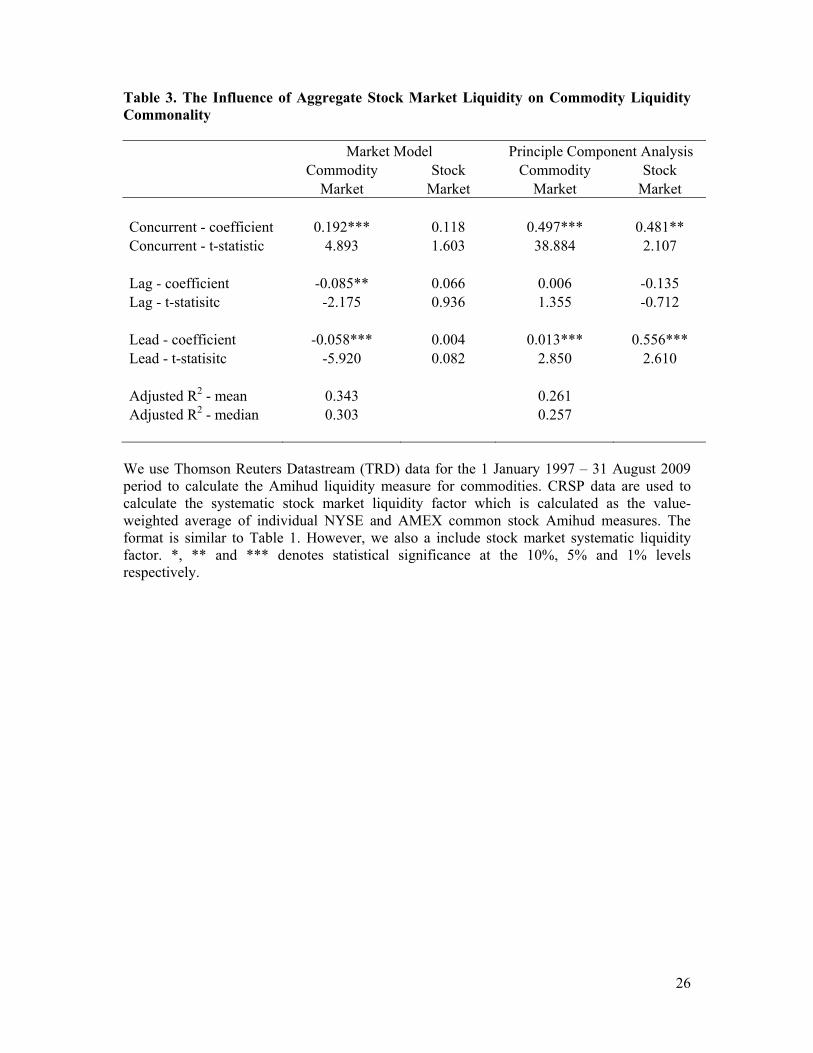
The market model results are generated by including changes in contemporaneous, lead,
and lag systematic stock liquidity as explanatory variables in the individual commodity liquidity
market-model regressions (equation 4). We produce the principle component results by
extracting the systematic stock liquidity factor using principle component analysis and including
this in our analysis. Changes in stock market liquidity have a positive relation with changes in
individual commodity liquidity when both the market model and principle component
approaches are used. However, the relation is only statistically significant when principle
component analysis is used. We conclude there is some evidence of a link between changes in
stock market and commodity liquidity. This is consistent with investors viewing commodities as
complementary assets to stocks and purchasing (selling) both in times of lower (higher) risk
aversion.
18
[Insert Table 3 Here]
We next investigate the relation between changes in the liquidity of commodities and the
subset of stocks that are most closely related to commodities. We match commodities to stocks
based on four-digit SIC codes as per Gorton and Rouwenhorst (2006) and calculate the value-
weighted average of Amihud measures for common stocks in the same SIC code. The related
industry stock liquidity for each commodity is the simple average of the SIC-based Amihud
measures. The Table 4 results suggest that changes in related-industry stock liquidity are related
to changes in commodity liquidity. However, this relation appears weaker than the link between
changes in individual commodity liquidity and changes in aggregate stock liquidity does. The
concurrent coefficient for the related stock industries is less than half that for the aggregate stock
market in both the market model and principle component analysis settings. The coefficient
related-stock industry coefficient is (not) statistically significant when the market model
(principle component) approach is used.
[Insert Table 4 Here]
4.5. Supply-Side and Demand-Side Commonality Results
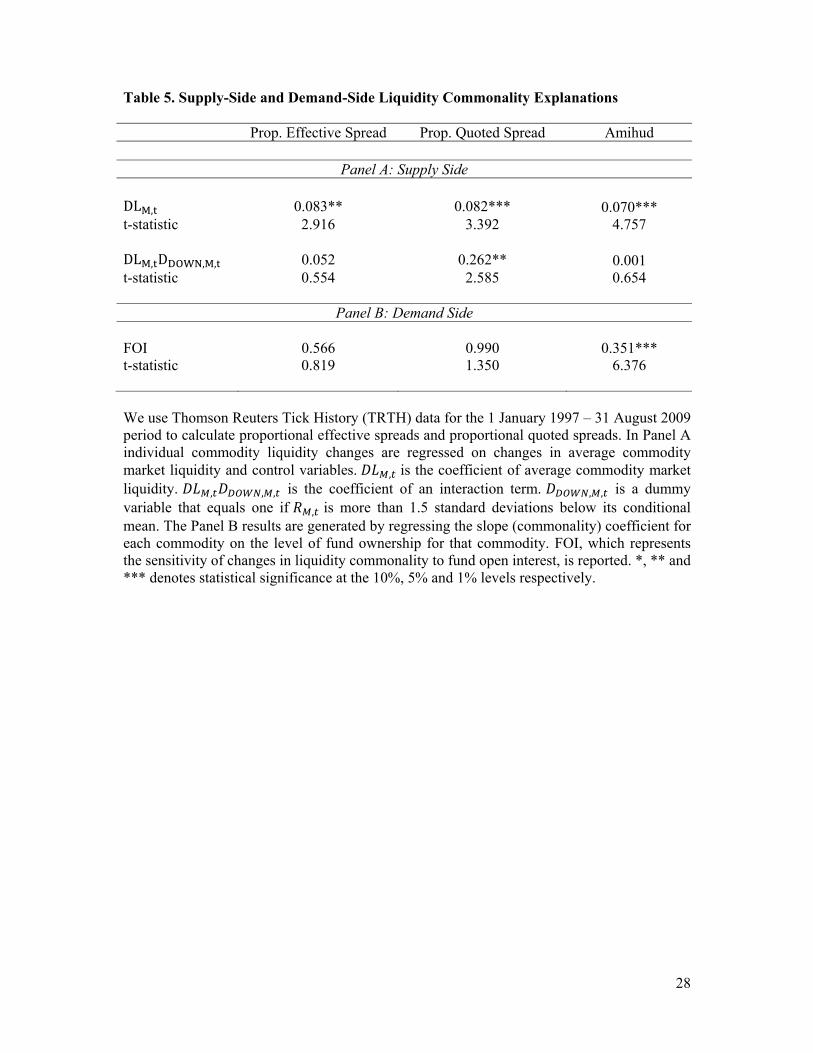
Hameed, Wang, and Viswanathan (2010) show that liquidity commonality in equity
markets is caused by liquidity providers withdrawing liquidity following large market declines.
We follow the approach of Hameed, Wang, and Viswanathan (2010) and investigate this in
Table 5 Panel A. Changes in individual commodity liquidity are regressed on changes in average
commodity market liquidity ( , and on an interaction term , , , ) that equals
19
average commodity market liquidity when the commodity market return is more than 1.5
standard deviations below its conditional mean and zero otherwise. Control variables (see
equation 5) are also included but we do not report these. The results provide some evidence that
liquidity commonality is stronger following market declines. , , , is positive and
statistically significant when proportional quoted spread is used to measure liquidity. This lends
support to the Hameed, Wang, and Viswanathan (2010) supply-side explanation.
Liquidity commonality may also be caused by demand-side factors. Kamara, Lou, and
Sadka (2008) find liquidity commonality driven by the level of institutional ownership. We
calculate commodity futures market “fund” open interest and then calculate the proportion of
each commodity that is owned by funds each week as fund open interest divided by the total
open interest. We then calculate the beta for each commodity and then regress this beta on the
fund ownership proxy. The Table 5 Panel B results indicate the relationship between changes in
the fund ownership proxy and liquidity commonality is positive for each liquidity measure. The
coefficient is strongly statistically significant when the Amihud measure is used. In summary, we
conclude there is weak evidence to support both the supply-side and demand-side commonality
explanations.
[Insert Table 5 Here]
5. Conclusions
Commodities have increased in popularity with investors in the last decade. However,
there has been relatively little attention given to commodities in the academic literature, as

20
compared to that given to stocks and bonds. We address this deficit by considering whether there
is liquidity commonality in commodity markets. Previous authors have shown there is a
systematic stock market liquidity factor that influences the liquidity of individual stocks. It has
also been shown that there is a systematic liquidity factor in bond markets and foreign exchange
markets. However, it is not clear whether these findings are transferable to commodities as many
commodity market participants are hedgers who trade for risk management purposes.
We consider liquidity commonality in 16 major commodities which span the five major
commodity families of energy, industrial metals, precious metals, agriculture, and livestock.
There is strong evidence of liquidity commonality in all 16 commodities. This existed when
commodity prices were relatively flat and in the more recent period of the commodity boom.
There is some evidence that liquidity commonality in commodities is driven by supply-side
factors, which would imply liquidity providers withdraw liquidity at the same time in different
commodities and this is especially pronounced following large price declines. There is also
evidence of demand-side factors affecting commodity liquidity commonality. The commonality
is stronger when fund ownership is higher.
We also find evidence of a positive relation between changes in stock market liquidity
and individual commodity liquidity. This result is consistent with the notion that investors
viewing commodities as complementary assets to stocks. This results in them purchasing
(selling) both in times of lower (higher) risk aversion.
21
References
Acharya, Viral, Lochstoer, Lars, and Tarun Ramadorai (2010). Does hedging affect commodity prices? The role of producer default risk. SSRN Working Paper: http://ssrn.com/abstract=1105546 Amihud, Yakov. (2002). Illiquidity and stock returns: Cross-section and time-series effects, Journal of Financial Markets, 5, 31-56. Amihud, Yakov, Haim Mendelson, and Beni Lauterbach (1997). Market microstructure and securities values: Evidence from the Tel Aviv Stock Exchange, Journal of Financial Economics, 45(3), 365–390. Bernanke, Ben. (2008). Outstanding Issues in the Analysis of Inflation. Speech at the Federal Reserve Bank of Boston’s 53rd Annual Economic Conference, Chatham, Massachusetts June 9, 2008 Brockman, Paul., Chung, Dennis., and Christophe Perignon. (2009). Commonality in liquidity: A global perspective. Journal of Financial and Quantitative Analysis, 44(4), 851-882. Brownlees, Christian T. and Giampiero M. Gallo (2006). Financial econometric analysis at ultra-high frequency: Data handling concerns. Computational Statistics and Data Analysis, 51, 2232-2245. Brunnermeier, Markus., and Lasse Pedersen. (2009). Market liquidity and funding liquidity. Review of Financial Studies, 22, 2201–2238. Chan, Kam Fong., Treepongkaruna, Sirimon., Brooks, Robert., and Stephen Gray. (2011). Asset market linkages: Evidence from financial, commodity and real estate assets. Journal of Banking and Finance, 1415-1426. Chincarini, Ludwig (2007). The Amaranth debacle: A failure of risk measures or a failure of risk management? Journal of Alternative Investments, Winter, 91–104. Chordia, Tarun, Roll, Richard., and Avanidhar Subrahmanyam. (2000). Commonality in liquidity. Journal of Financial Economics, 56, 3-28. Chordia, Tarun, Roll, Richard., and Avanidhar Subrahmanyam. (2005). Evidence on the speed of convergence to market efficiency. Journal of Financial Economics, 76, 271-292. Chordia, Tarun, Sarkar, Asani., and Avanidhar Subrahmanyam. (2005). An empirical analysis of stock and bond market liquidity. Review of Financial Studies, 18(1), 85-129. Coughenour, Jay., and Mohsen Saad. (2004). Common market makers and commonality in liquidity. Journal of Financial Economics, 73, 37–69.
22
de Roon, Frans, Nijman, Theo., and Chris Veld. (2000). Hedging pressure effects in futures markets. Journal of Finance, 55(3), 1437-1456. de Ville de Goyet, Cedric., Dhaene, Geert., and Piet Sercu (2008). Testing the martingale hypothesis for futures prices: Implications for hedgers. Journal of Futures Markets, 28(11), 1040–1065. Dunsby, Adam., Eckstein, John., Gaspar, Jess., and Sarah Mulholland. (2008). Commodity investing: Maximizing returns through fundamental analysis. John Wiley and Sons Inc. New York. Fong, Kingsley., Holden, Craig., and Charles Trzcinka. (2011). What are the best liquidity proxies for global research? SSRN Working Paper: http://ssrn.com/abstract=1558447 Gorton, Gary., and K. Geert Rouwenhorst. (2006). Facts and fantasies about commodity futures. Financial Analysts Journal. 62(2), 47-68. Goyenko, Ruslan, Craig Holden, and Charles Trzcinka. (2009). Do liquidity measures measure liquidity? Journal of Financial Economics, 92, 153-181. Hameed, Allaudeen., Kang, Wenjin, and S. Viswanathan. (2010). Stock market declines and liquidity. Journal of Finance, 65(1), 257-293. Hasbrouck, Joel., and Duane Seppi. (2001). Common factors in prices, order flows, and liquidity. Journal of Financial Economics, 383-411. Holden, Craig (2009). New low-frequency spread measures. Journal of Financial Markets, 12, 778–813. Hong, Harrison., and Motohiro Yogo. (2010). Commodity market interest and asset return predictability. SSRN Working Paper. http://ssrn.com/abstract=1364674 Jensen, Niels. (2010). The commodities con. The Absolute Return Letter, May, 1-9. Kamara, Avraham., Lou, Xiaoxia, and Ronnie Sadka. (2008). The divergence of liquidity commonality in the cross-section of stocks. Journal of Financial Economics, 89, 444-466. Karolyi, G. Andrew., Lee, Kuan-Hui, and Mathijs van Dijk. (2011). Understanding commonality in liquidity around the world. Journal of Financial Economics – forthcoming. Korajczyk, Robert., and Ronnie Sadka. (2008). Pricing the commonality across alternative measures of liquidity. Journal of Financial Economics, 87, 45-72. Mancini, Loriano, Ranaldo, Angelo, and Jan. Wrampelmeyer. (2009). Liquidity in the foreign exchange market: Measurement, commonality and risk premiums. SSRN Working Paper: http://ssrn.com/abstract=1447869

23
Marshall, Ben., Nguyen, Nhut., and Nuttawat Visaltanachoti. (2011). Commodity liquidity measurement and transaction costs. Review of Financial Studies – Forthcoming. Pukthuanthong, Kuntara and Richard Roll. (2011). Gold and the Dollar (and the Euro, Pound, and Yen). Journal of Banking and Finance, 35, 2070-2083. Sanders, Dwight, Boris, Keith., and Mark Manfredo. (2004). Hedgers, funds, and small speculators in the energy futures markets: an analysis of the CFTC’s Commitments of Traders reports. Energy Economics, 26, 425-445. Tang, Ke and Wei Xiong. (2010). Index investment and financialization of commodities. NBER Working Paper No. 16385 http://www.nber.org/papers/w16385. Till, Hilary (2008). Amaranth lessons thus far. Journal of Alternative Investments, Spring, 82–98.
24
Table 1. Overall Results
Market Model Principle Component Analysis Prop.
Effective Spread
Prop. Quoted Spread Amihud
Prop. Effective Spread
Prop. Quoted Spread Amihud
Concurrent - coefficient 0.118*** 0.138*** 0.176*** 0.210*** 0.317*** 0.496*** Concurrent - t-statistic 3.381 3.763 3.820 8.432 3.841 38.020 % positive 81% 88% 100% 100% 94% 100% % p significant 63% 38% 100% 100% 88% 100%
Lag - coefficient 0.028** 0.036** -0.085** 0.002 -0.013 0.006 Lag - t-statistic 1.970 2.235 -2.119 0.388 -0.471 1.364 % positive 63% 75% 0% 63% 44% 50% % p significant 0% 0% 0% 50% 25% 25%
Lead - coefficient 0.059 0.009 -0.055*** 0.012** -0.014 0.013** Lead - t-statistic 1.594 0.274 -4.848 2.301 -0.526 2.984 % positive 63% 50% 0% 94% 50% 42% % p significant 31% 6% 0% 50% 25% 25%
Adjusted R2 - mean 0.027 0.015 0.321 0.401 0.464 0.261 Adjusted R2 - median 0.011 0.008 0.292 0.386 0.542 0.256
We use Thomson Reuters Tick History (TRTH) and Thomson Reuters Datastream (TRD) data for the 1 January 1997 – 31 August 2009 period. TRTH data are used to calculate proportional effective spreads and proportional quoted spreads. TRD are used for Amihud. Following Chordia, Roll, and Subrahmanyam (2000) we use a market model regression approach. The daily change in each liquidity measure is regressed on the cross-sectional market average for that liquidity measure. Following Korajczyk and Sadka (2008) we use principle component analysis to extract three factors from the data. We then regress each liquidity measure on the first factor. We report cross-sectional averages of the time-series coefficients and the overall t-statistic. “Concurrent”, “Lag”, and “Lead” results are based the same, previous, and prior day’s market liquidity respectively. % positive and % pos significant refer to the proportion of commodities that have positive and positive and statistically significant coefficients respectively. *, ** and *** denotes statistical significance at the 10%, 5% and 1% levels respectively.
25
Table 2. Sub-Period Results
Market Model Principle Component Analysis Mean t-statistic Adjusted R2 Mean t-statistic Adjusted R2
Panel A: Proportional Effective Spread
1997 - 2003 0.087** 2.286 -0.019 0.219*** 7.119 0.230 2004 - 2009 0.252** 2.610 0.034 0.242*** 5.996 0.372
Panel B: Proportional Quoted Spread
1997 - 2003 0.003 0.021 0.027 0.346*** 6.396 0.129 2004 - 2009 0.176*** 5.166 0.019 0.328*** 2.976 0.473
Panel C: Amihud
1997 - 2003 0.151*** 3.640 0.281 0.481*** 30.388 0.145 2004 - 2009 0.258*** 5.067 0.541 0.515*** 59.378 0.189
We use Thomson Reuters Tick History (TRTH) and Thomson Reuters Datastream (TRD) data for the 1 January 1997 – 31 December 2003 and 1 January 2004 - 31 August 2009 sub-periods. TRTH data are used to calculate proportional effective spreads and proportional quoted spreads. TRD are used for Amihud. Following Chordia, Roll, and Subrahmanyam (2000) we use a market model regression approach. The daily change in each liquidity measure is regressed on the cross-sectional market average for that liquidity measure. Following Korajczyk and Sadka (2008) we use principle component analysis to extract three factors from the data. We then regress each liquidity measure on the first factor. We report cross-sectional averages of the time-series coefficients and the overall t-statistic. *, ** and *** denotes statistical significance at the 10%, 5% and 1% levels respectively.
26
Table 3. The Influence of Aggregate Stock Market Liquidity on Commodity Liquidity Commonality
Market Model Principle Component Analysis Commodity Stock Commodity Stock
Market Market Market Market
Concurrent - coefficient 0.192*** 0.118 0.497*** 0.481** Concurrent - t-statistic 4.893 1.603 38.884 2.107
Lag - coefficient -0.085** 0.066 0.006 -0.135 Lag - t-statisitc -2.175 0.936 1.355 -0.712
Lead - coefficient -0.058*** 0.004 0.013*** 0.556*** Lead - t-statisitc -5.920 0.082 2.850 2.610
Adjusted R2 - mean 0.343 0.261 Adjusted R2 - median 0.303 0.257
We use Thomson Reuters Datastream (TRD) data for the 1 January 1997 – 31 August 2009 period to calculate the Amihud liquidity measure for commodities. CRSP data are used to calculate the systematic stock market liquidity factor which is calculated as the value-weighted average of individual NYSE and AMEX common stock Amihud measures. The format is similar to Table 1. However, we also a include stock market systematic liquidity factor. *, ** and *** denotes statistical significance at the 10%, 5% and 1% levels respectively.

27
Table 4. The Influence of Commodity-Related Stock Market Liquidity on Commodity Liquidity Commonality
Market Model Principle Component Analysis Commodity Stock Commodity Stock
Market Industry Market Industry
Concurrent - coefficient 0.199*** 0.055** 0.516*** 0.151 Concurrent - t-statistic 5.156 2.000 29.613 1.479
Lag - coefficient -0.124*** 0.028 0.030*** 0.906*** Lag - t-statisitc -3.078 1.455 5.857 6.036
Lead - coefficient -0.051*** 0.032 0.056*** 0.134** Lead - t-statisitc -4.081 1.564 9.707 1.912
Adjusted R2 - mean 0.404 0.250 Adjusted R2 - median 0.371 0.232
We use Thomson Reuters Datastream (TRD) data for the 1 January 1997 – 31 August 2009 period to calculate the Amihud liquidity measure for commodities. CRSP data are used to calculate the systematic stock market liquidity factor for stocks in commodity industries. The format is similar to Table 1. However, we also a include stock market systematic liquidity factor. *, ** and *** denotes statistical significance at the 10%, 5% and 1% levels respectively.
28
Table 5. Supply-Side and Demand-Side Liquidity Commonality Explanations Prop. Effective Spread Prop. Quoted Spread Amihud
Panel A: Supply Side
DLM, 0.083** 0.082*** 0.070*** t-statistic 2.916 3.392 4.757 DLM, DDOWN,M, 0.052 0.262** 0.001 t-statistic 0.554 2.585 0.654
Panel B: Demand Side
FOI 0.566 0.990 0.351*** t-statistic 0.819 1.350 6.376
We use Thomson Reuters Tick History (TRTH) data for the 1 January 1997 – 31 August 2009 period to calculate proportional effective spreads and proportional quoted spreads. In Panel A individual commodity liquidity changes are regressed on changes in average commodity market liquidity and control variables. , is the coefficient of average commodity market liquidity. , , , is the coefficient of an interaction term. , , is a dummy variable that equals one if , is more than 1.5 standard deviations below its conditional mean. The Panel B results are generated by regressing the slope (commonality) coefficient for each commodity on the level of fund ownership for that commodity. FOI, which represents the sensitivity of changes in liquidity commonality to fund open interest, is reported. *, ** and *** denotes statistical significance at the 10%, 5% and 1% levels respectively.
29
Figure 1. S&P Goldman Sachs Commodity Index (S&P GSCI)
The S&P Goldman Sachs Commodity Index. Data are sourced from Thomson Reuters Datastream (TRD)
0
100
200
300
400
500
600
700
800
900
1000
1997 1998 1999 2000 2001 2002 2003 2004 2005 2006 2007 2008
Period 1 Period 2
30
Appendix 1. Principle Component Analysis Results for Three Components
Prop. Effective Spread Prop. Quoted Spread Amihud
Factor 1 - coefficient 0.216*** 0.277** 0.531*** Factor 1 - t-statistic 5.502 2.428 9.191 % positive 100% 88% 100% % p significant 94% 88% 100%
Factor 2 - coefficient -0.046 0.268* 0.068 Factor 2 - t-statistic -0.709 1.685 0.394 % positive 44% 56% 42% % p significant 31% 56% 42%
Factor 3 - coefficient -0.036 -0.001 0.149 Factor 3 - t-statistic -0.234 -0.006 0.443 % positive 31% 69% 42% % p significant 25% 56% 42%
Adjusted R2 - mean 0.424 0.670 0.506 Adjusted R2 - median 0.377 0.687 0.463
We use Thomson Reuters Tick History (TRTH) and Thomson Reuters Datastream (TRD) data for the 1 January 1997 – 31 August 2009 period. TRTH data are used to calculate proportional effective spreads and proportional quoted spreads. TRD are used for Amihud. Following Korajczyk and Sadka (2008) we use principle component analysis to extract three factors from the data. We then regress each liquidity measure on each of the three factors. We report cross-sectional averages of the time-series coefficients and the overall t-statistic. *, ** and *** denotes statistical significance at the 10%, 5% and 1% levels respectively.
Related Documents


